Microsoft Surface Laptop Go Review: Een te duur netbook
Net zoals de Surface Go-tablet de kleinere, gegimpte versie is van de gewone Surface Pro-tablet, is de Surface Laptop Go de kleinere, gegimpte versie van de gewone Surface Laptop 3. De prijzen beginnen bij slechts $550 USD voor configuraties met 65 GB opslag en 4 GB RAM, maar dit kan snel oplopen tot $900 USD als u de opslag en RAM wilt verdubbelen. Alle SKU's komen op dit moment met de Core i5-1035G1 en dezelfde 3:2 1536 x 1024 resolutie touchscreen.
De Surface Laptop Go is een klasse apart vanwege de unieke combinatie van een 3:2 vormfactor en een 12,4-inch display. Toch zijn vergelijkingen met de duurdere bekende 13-inch subnotebooks zoals de Huawei MateBook X Pro, Dell XPS 13, MacBook Pro 13, Asus ZenBook S UX393 of de eigen Surface Laptop 3 13 van Microsoft onvermijdelijk.
Meer Microsoft-beoordelingen:
Evaluatie | Datum | Model | Gewicht | Hoogte | Formaat | Resolutie | Beste prijs |
|---|---|---|---|---|---|---|---|
| 84.6 % v7 (old) | 10-2020 | Microsoft Surface Laptop Go Core i5 i5-1035G1, UHD Graphics G1 (Ice Lake 32 EU) | 1.1 kg | 15.69 mm | 12.40" | 1536x1024 | |
| 85.1 % v7 (old) | 10-2020 | Asus Zenbook S UX393JA i7-1065G7, Iris Plus Graphics G7 (Ice Lake 64 EU) | 1.4 kg | 15.7 mm | 13.90" | 3300x2200 | |
| 88.7 % v7 (old) | 09-2020 | HP EliteBook 830 G7 i7-10810U, UHD Graphics 620 | 1.3 kg | 18.1 mm | 13.30" | 1920x1080 | |
| 84 % v7 (old) | 02-2020 | Microsoft Surface Laptop 3 13 Core i5-1035G7 i5-1035G7, Iris Plus Graphics G7 (Ice Lake 64 EU) | 1.3 kg | 14.5 mm | 13.50" | 2256x1504 | |
| 87.4 % v7 (old) | 06-2020 | Huawei MateBook X Pro 2020 i7 i7-10510U, GeForce MX250 | 1.3 kg | 14.6 mm | 13.90" | 3000x2000 | |
| 92.1 % v7 (old) | 06-2020 | Apple MacBook Pro 13 2020 2GHz i5 10th-Gen i5-1038NG7, Iris Plus Graphics G7 (Ice Lake 64 EU) | 1.4 kg | 15.6 mm | 13.30" | 2560x1600 |
Zaak
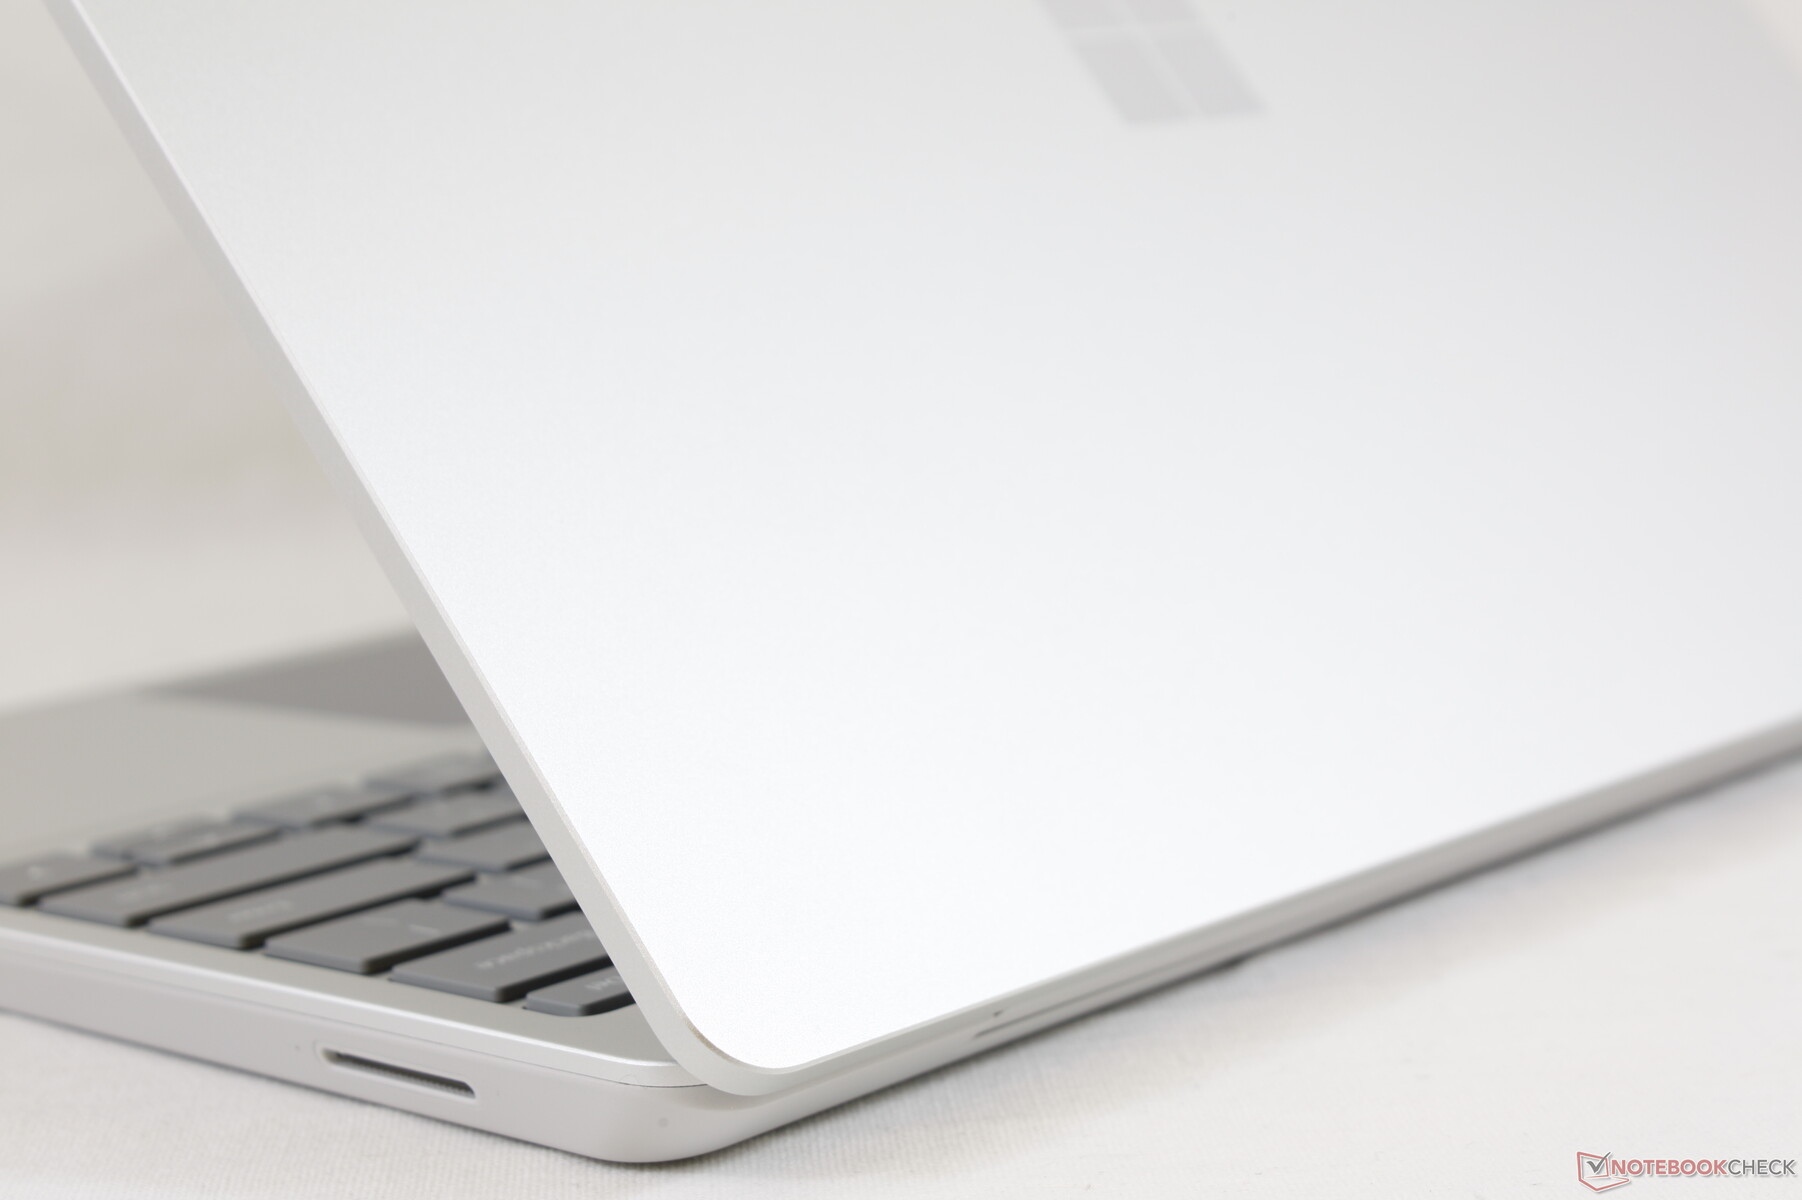
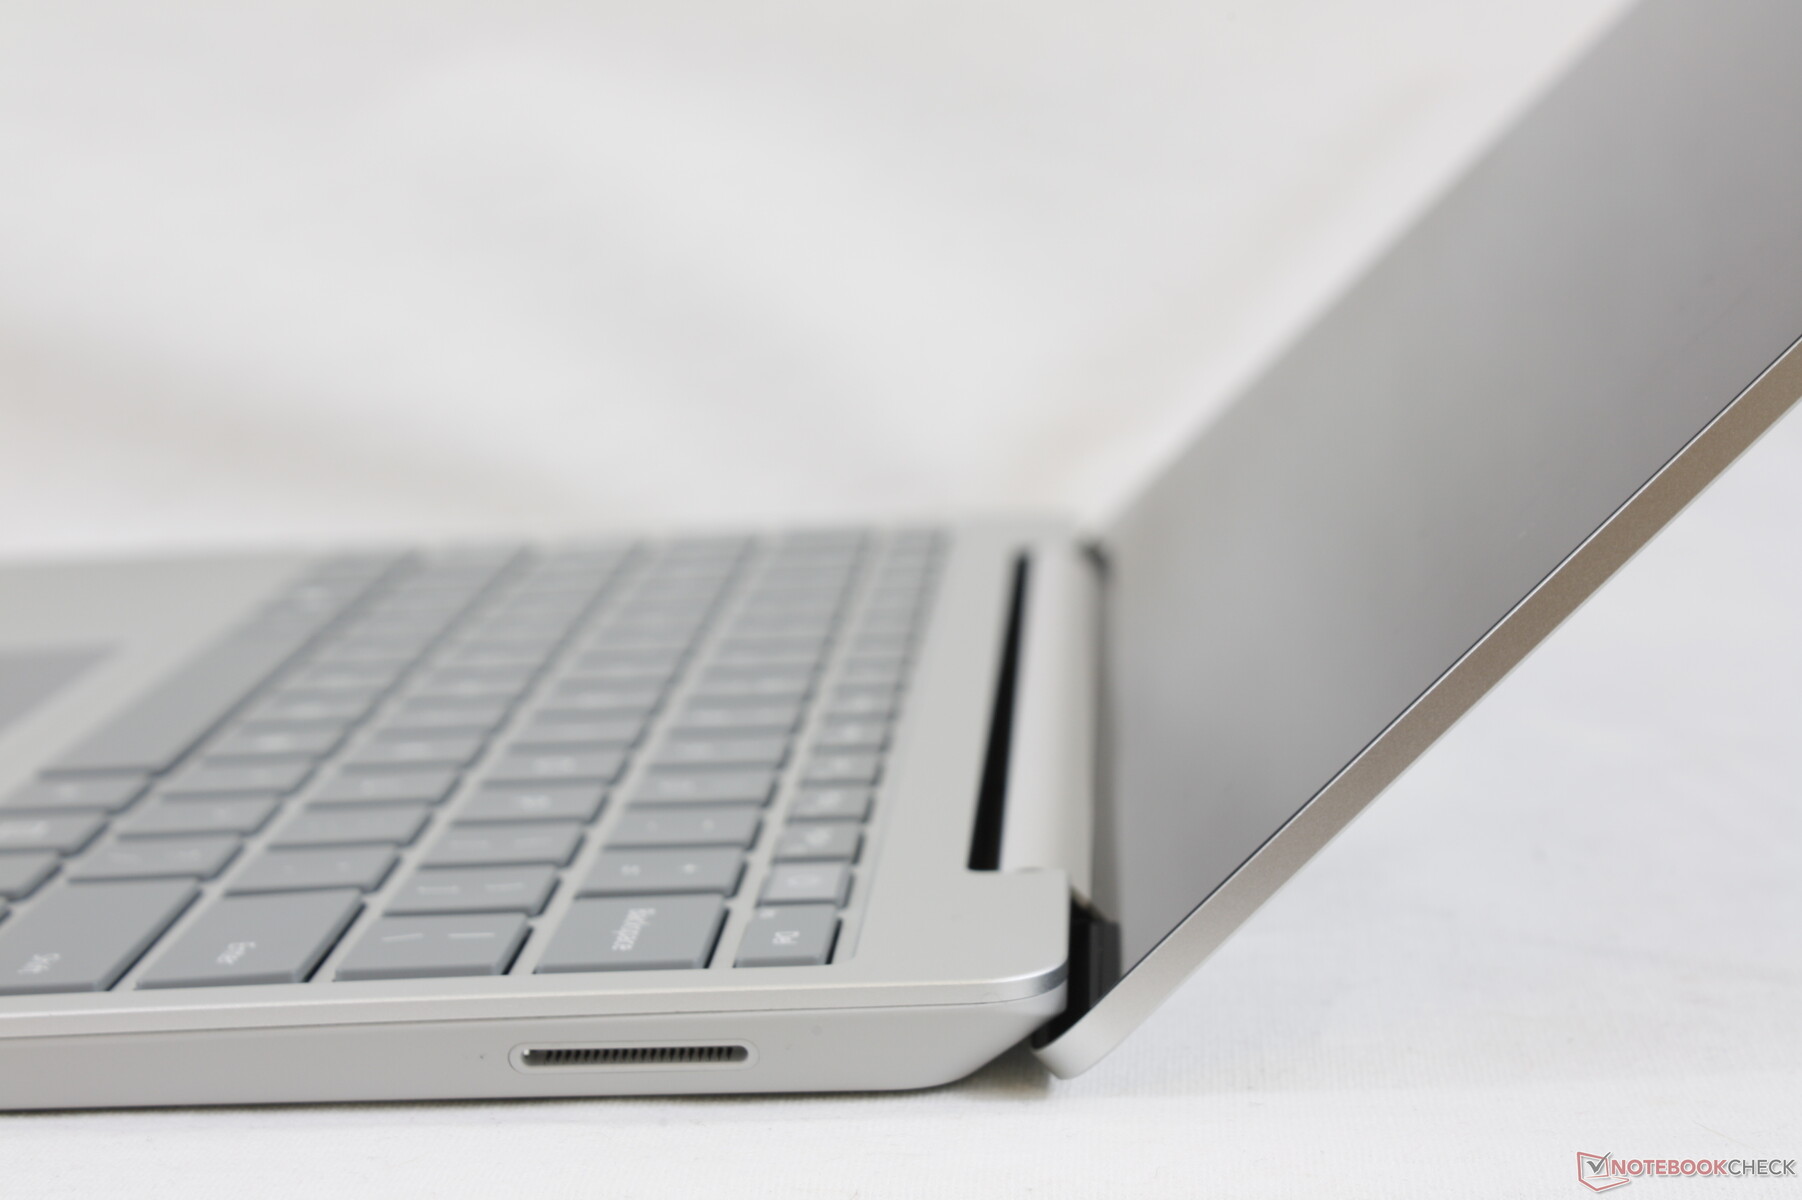
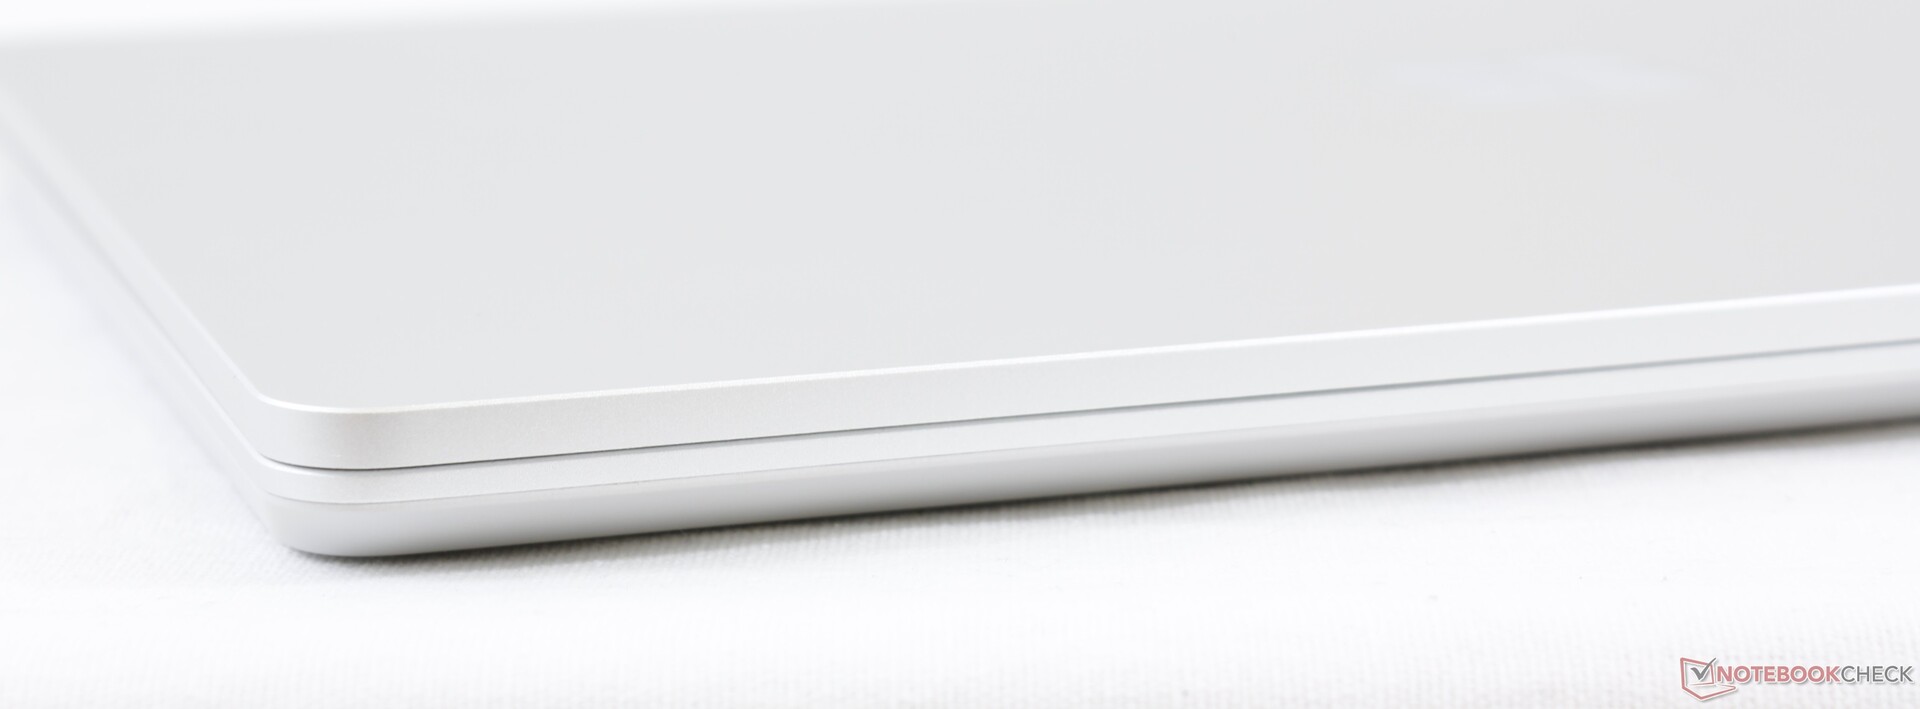
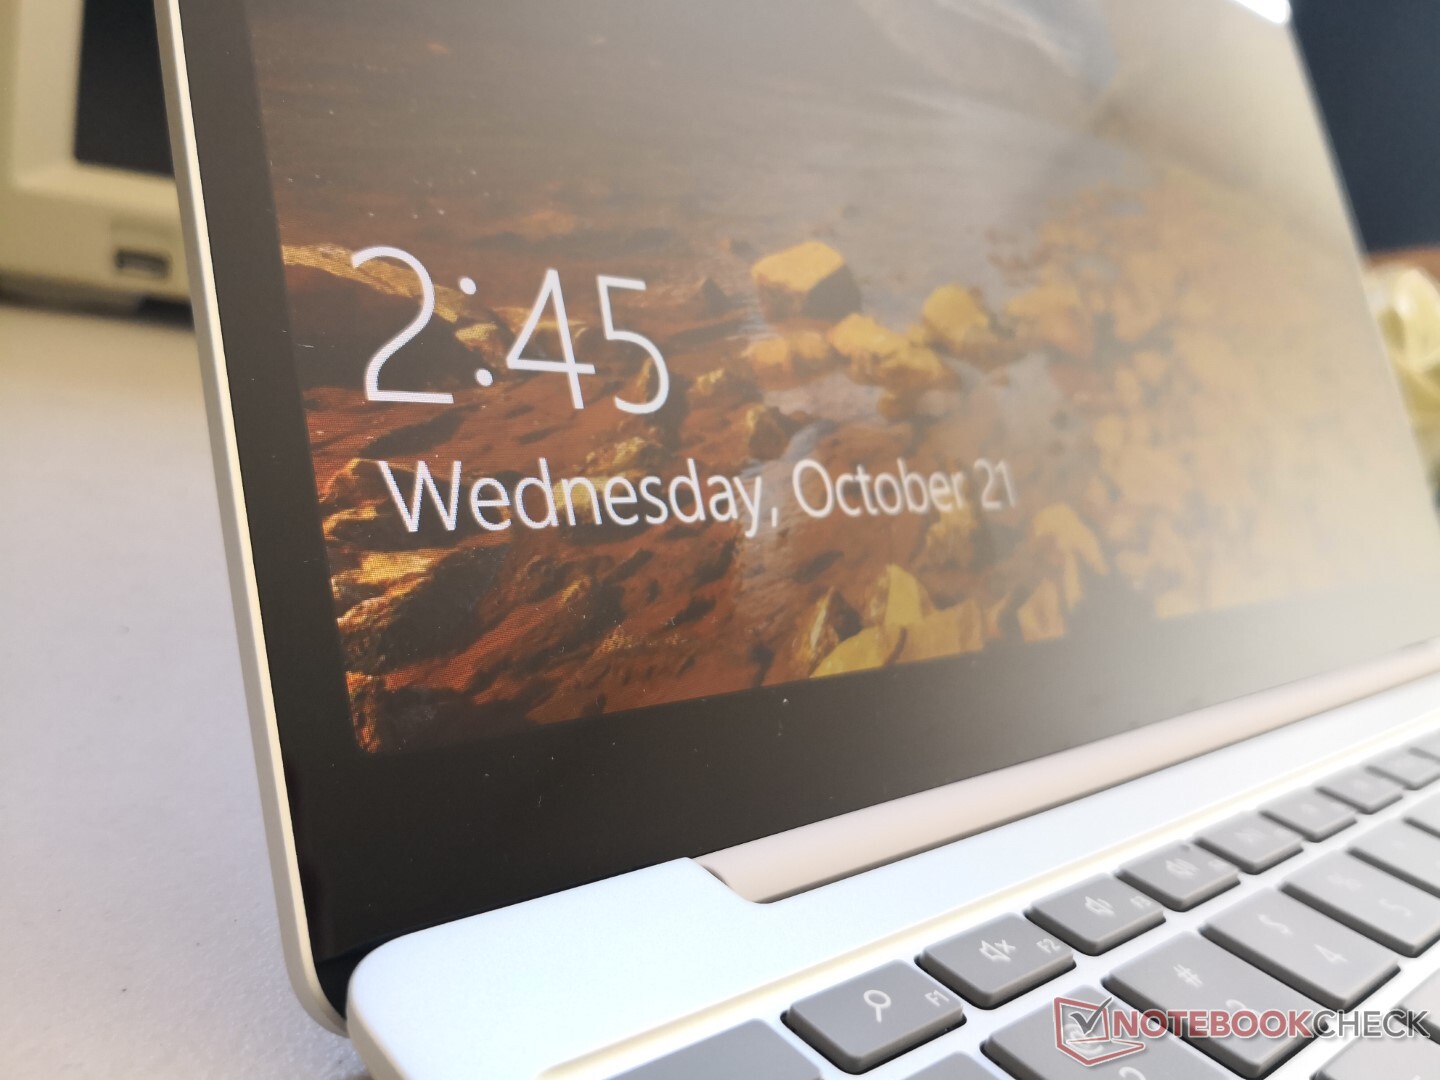
Microsoft's Surface Laptop ontwerp vertaalt zich goed naar de nieuwe 12,4-inch vormfactor. Het metalen chassis voelt hier net zo goed aan als bij de 13,5-inch en 15-inch modellen zonder tastbare compromissen. Dit betekent helaas ook dat hij dezelfde nadelen heeft, waaronder een gemiddeld scharnier en een moeilijk te onderhouden bodemplaat.
Een groot verschil tussen het 12,4-inch model en zijn grotere versies is de licht rubberen basis. De structuur is daardoor iets anders, maar niet zwakker of sterker qua buiging of kromtrekken. Dit is waarschijnlijk de meest luxueuze en hoogwaardige laptop die u kunt krijgen voor minder dan 600 dollar.
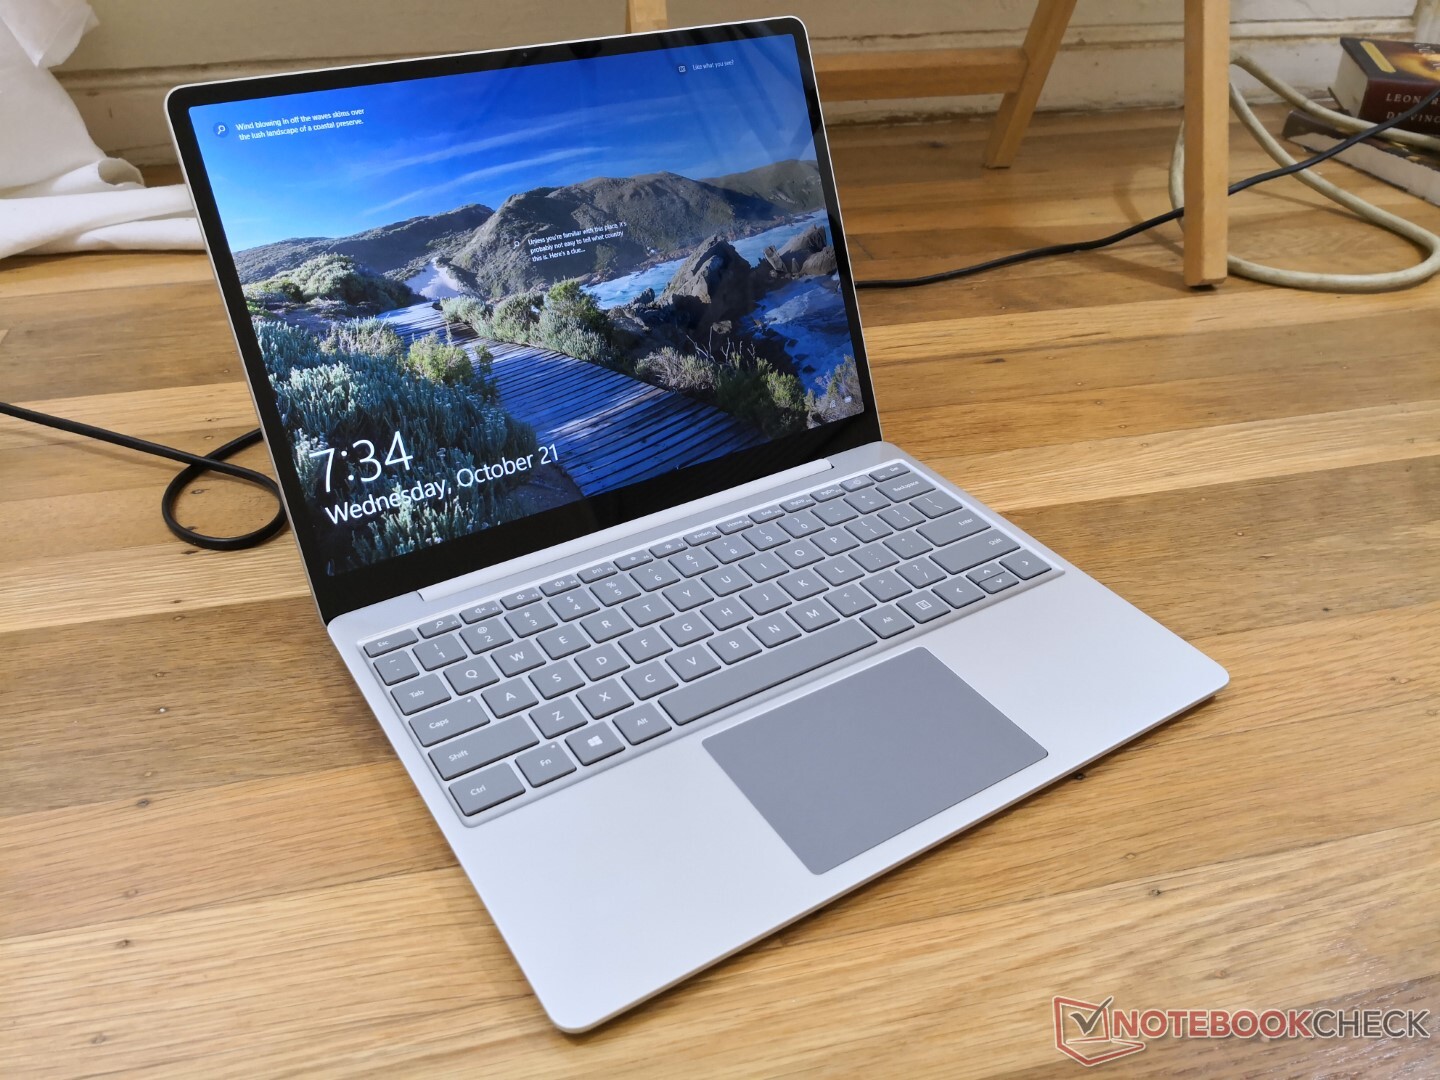
Grootte en gewicht zijn de meest opvallende voordelen van de Surface Laptop Go. We denken dat de serie in de toekomst nog kleiner zou kunnen worden, omdat de randen nog steeds iets dikker zijn dan de meeste andere subnotebooks, waaronder de XPS 13 of Spectre 13.
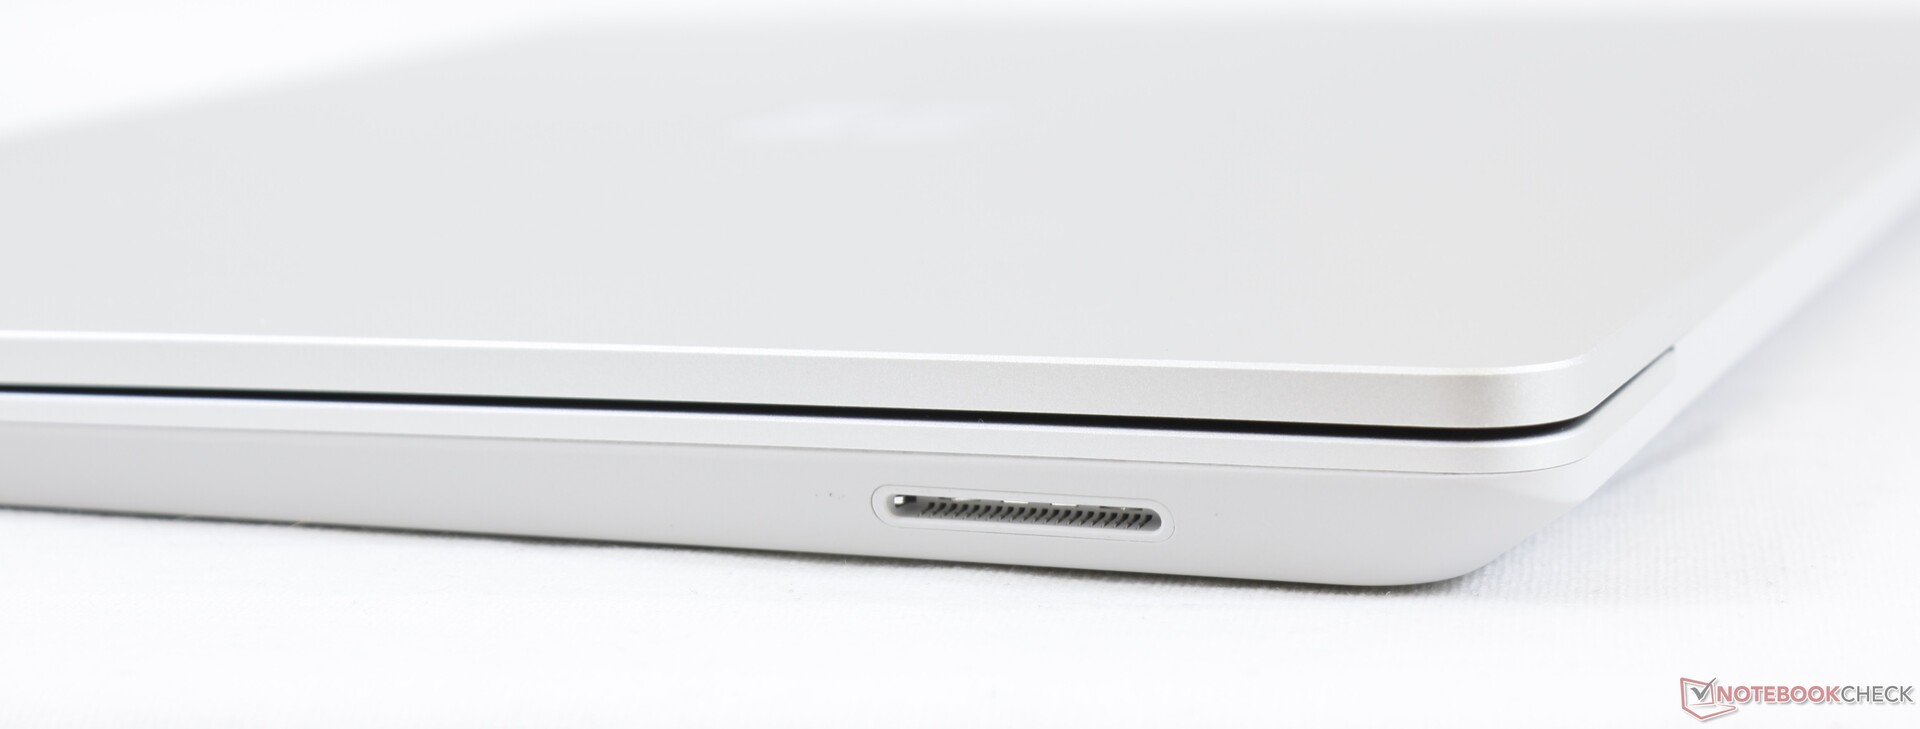
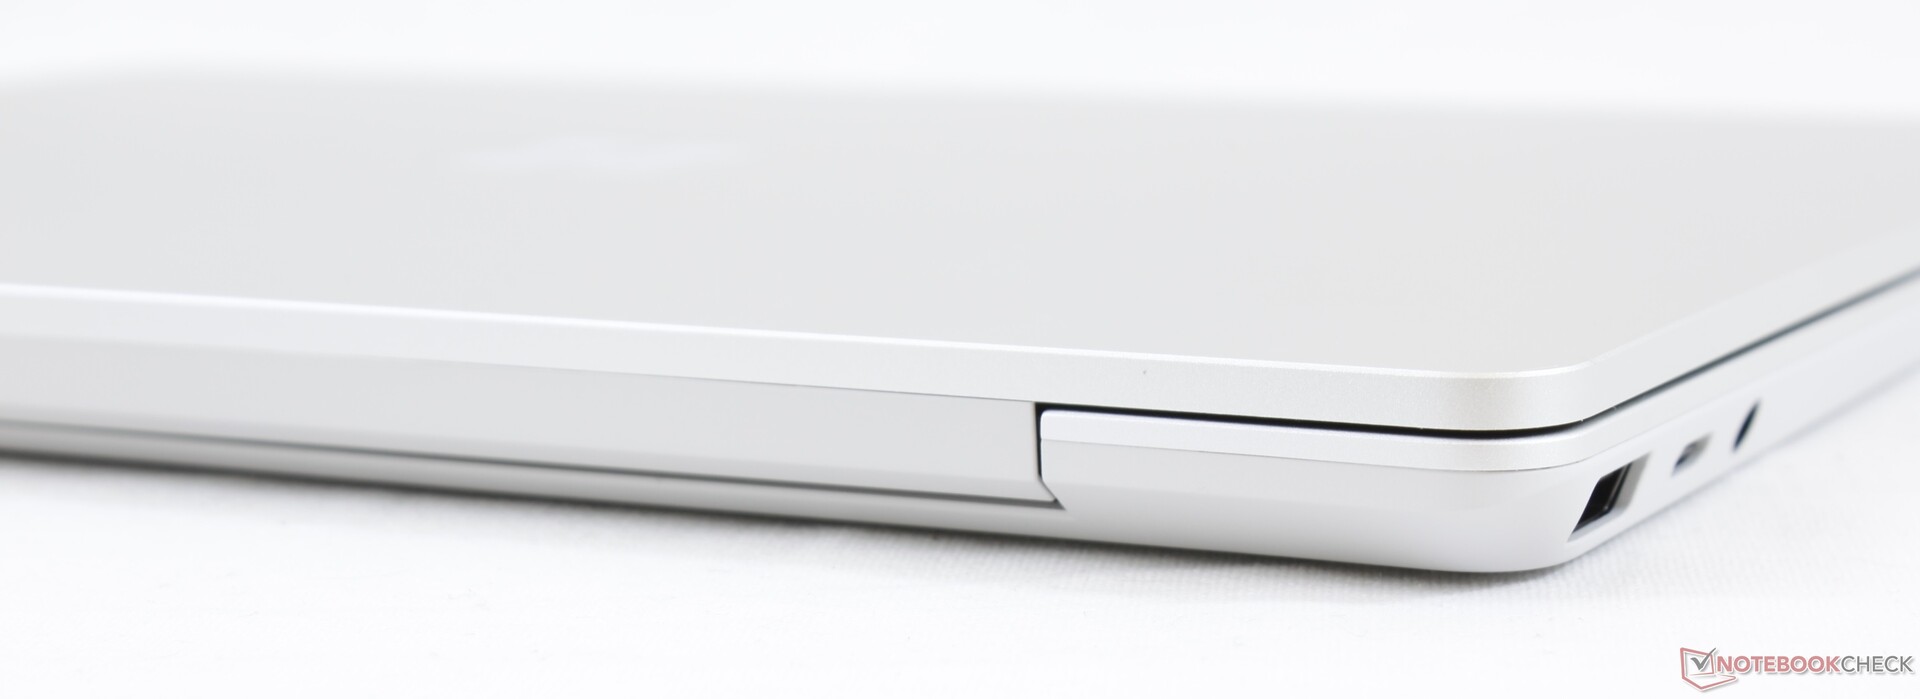
Connectiviteit
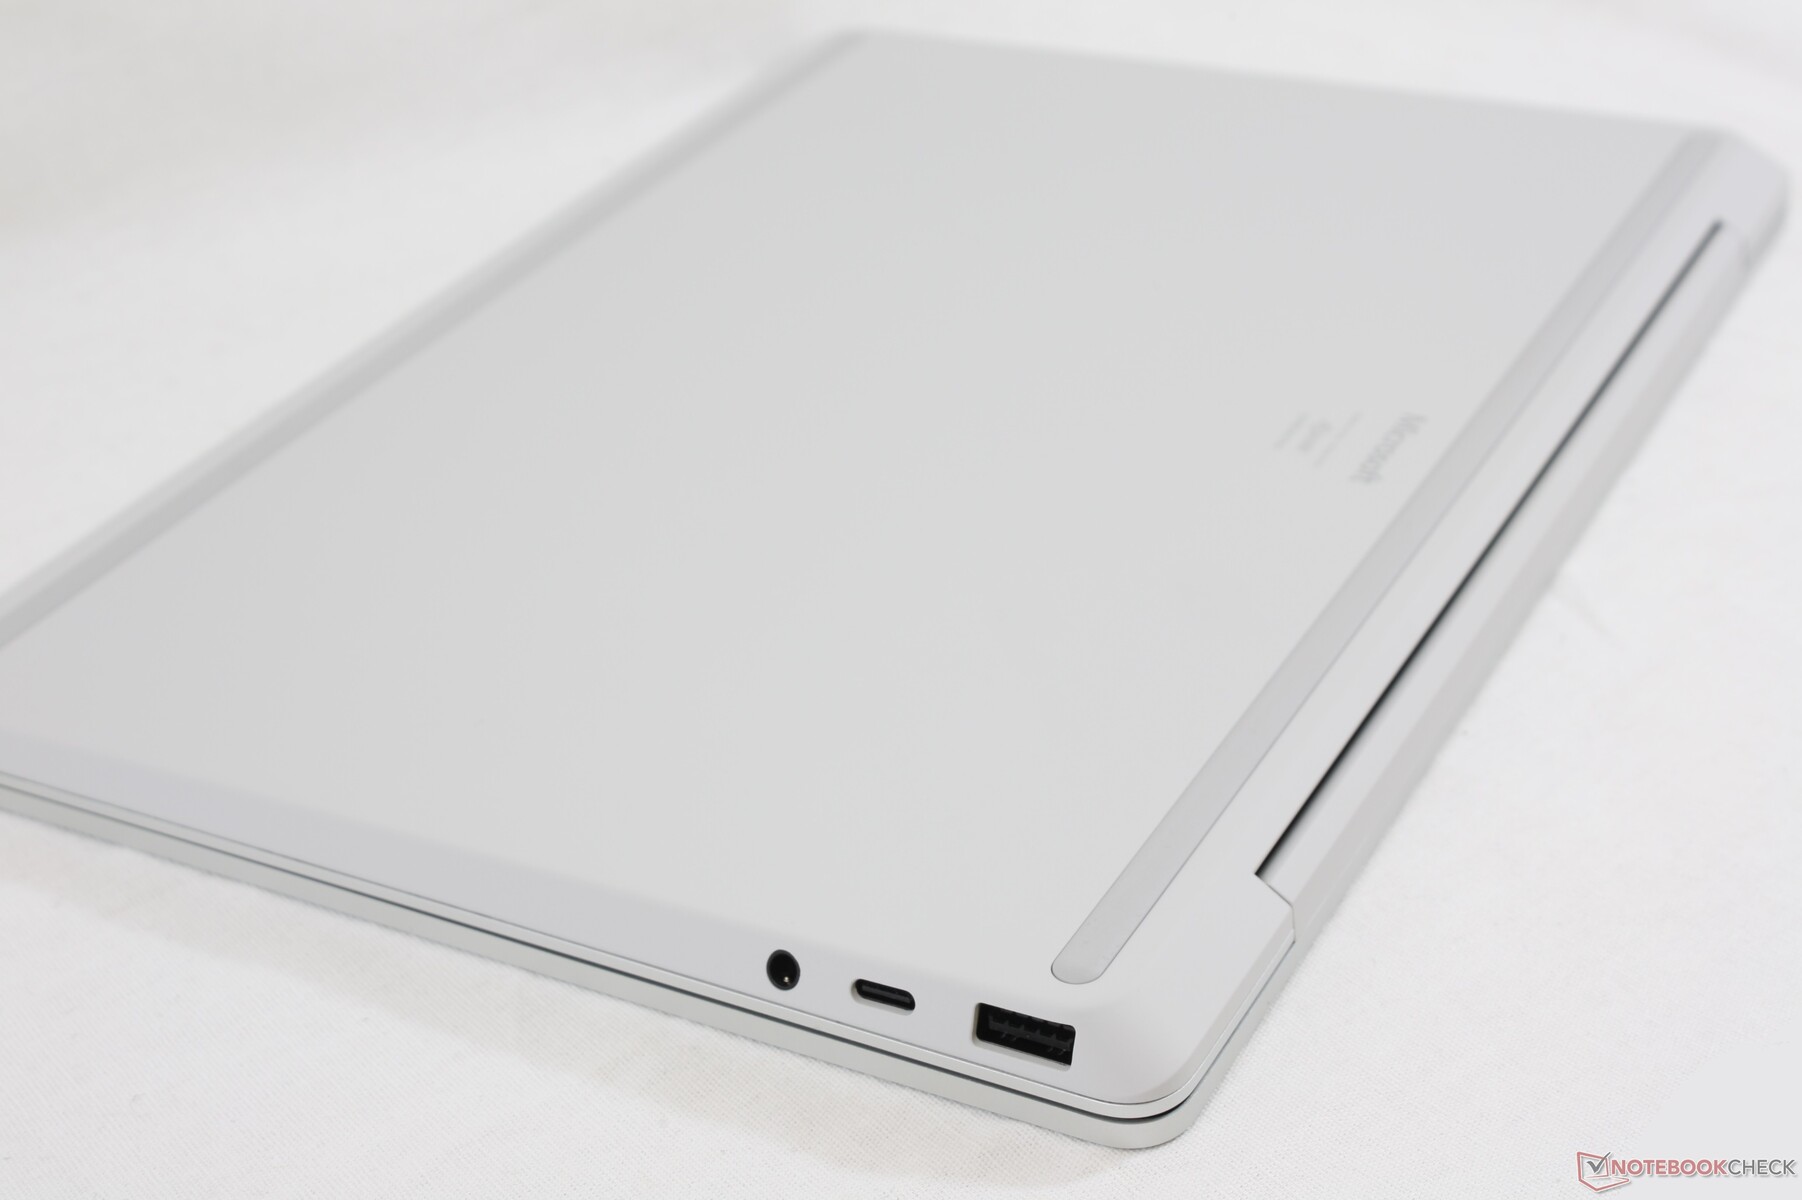
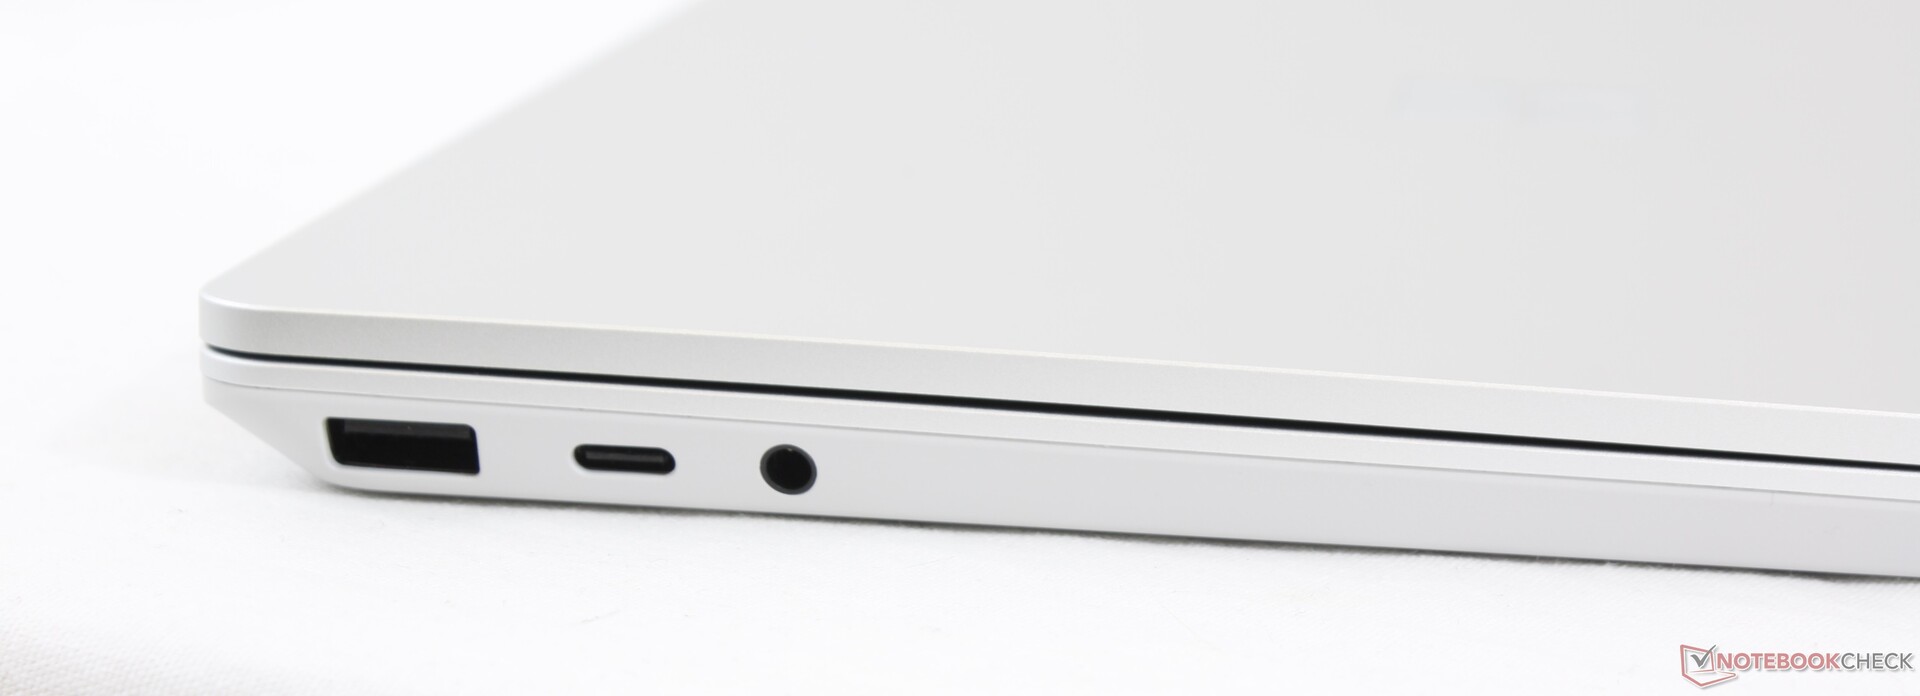
De poortmogelijkheden zijn weer minimaal. Gelukkig wordt DisplayPort-over-USB-C ondersteund om het gebrek aan HDMI te compenseren.
Communicatie
De Intel AX201 wordt standaard geleverd voor Wi-Fi 6 en Bluetooth 5.1 connecitiviteit. Onze unit zou soms willekeurig de verbinding met onze Netgear RAX200-router verbreken, maar een herstart van het systeem bleek het probleem te hebben opgelost.
Webcam

, i5-1035G1, SK hynix BC501 HFM256GDGTNG")
, i5-1035G1, SK hynix BC501 HFM256GDGTNG")
Onderhoud
Vervelend is dat de schroeven waarmee het bodempaneel wordt vastgezet, onder de gelijmde rubbervoetjes zitten. Als je zoiets simpels als een opslagupgrade wilt doen, loop je een groter risico om het systeem te beschadigen of de retouren te vernietigen dan bij makkelijker te onderhouden subnotebooks als de XPS 13 of ZenBook S.
Accessoires en garantie
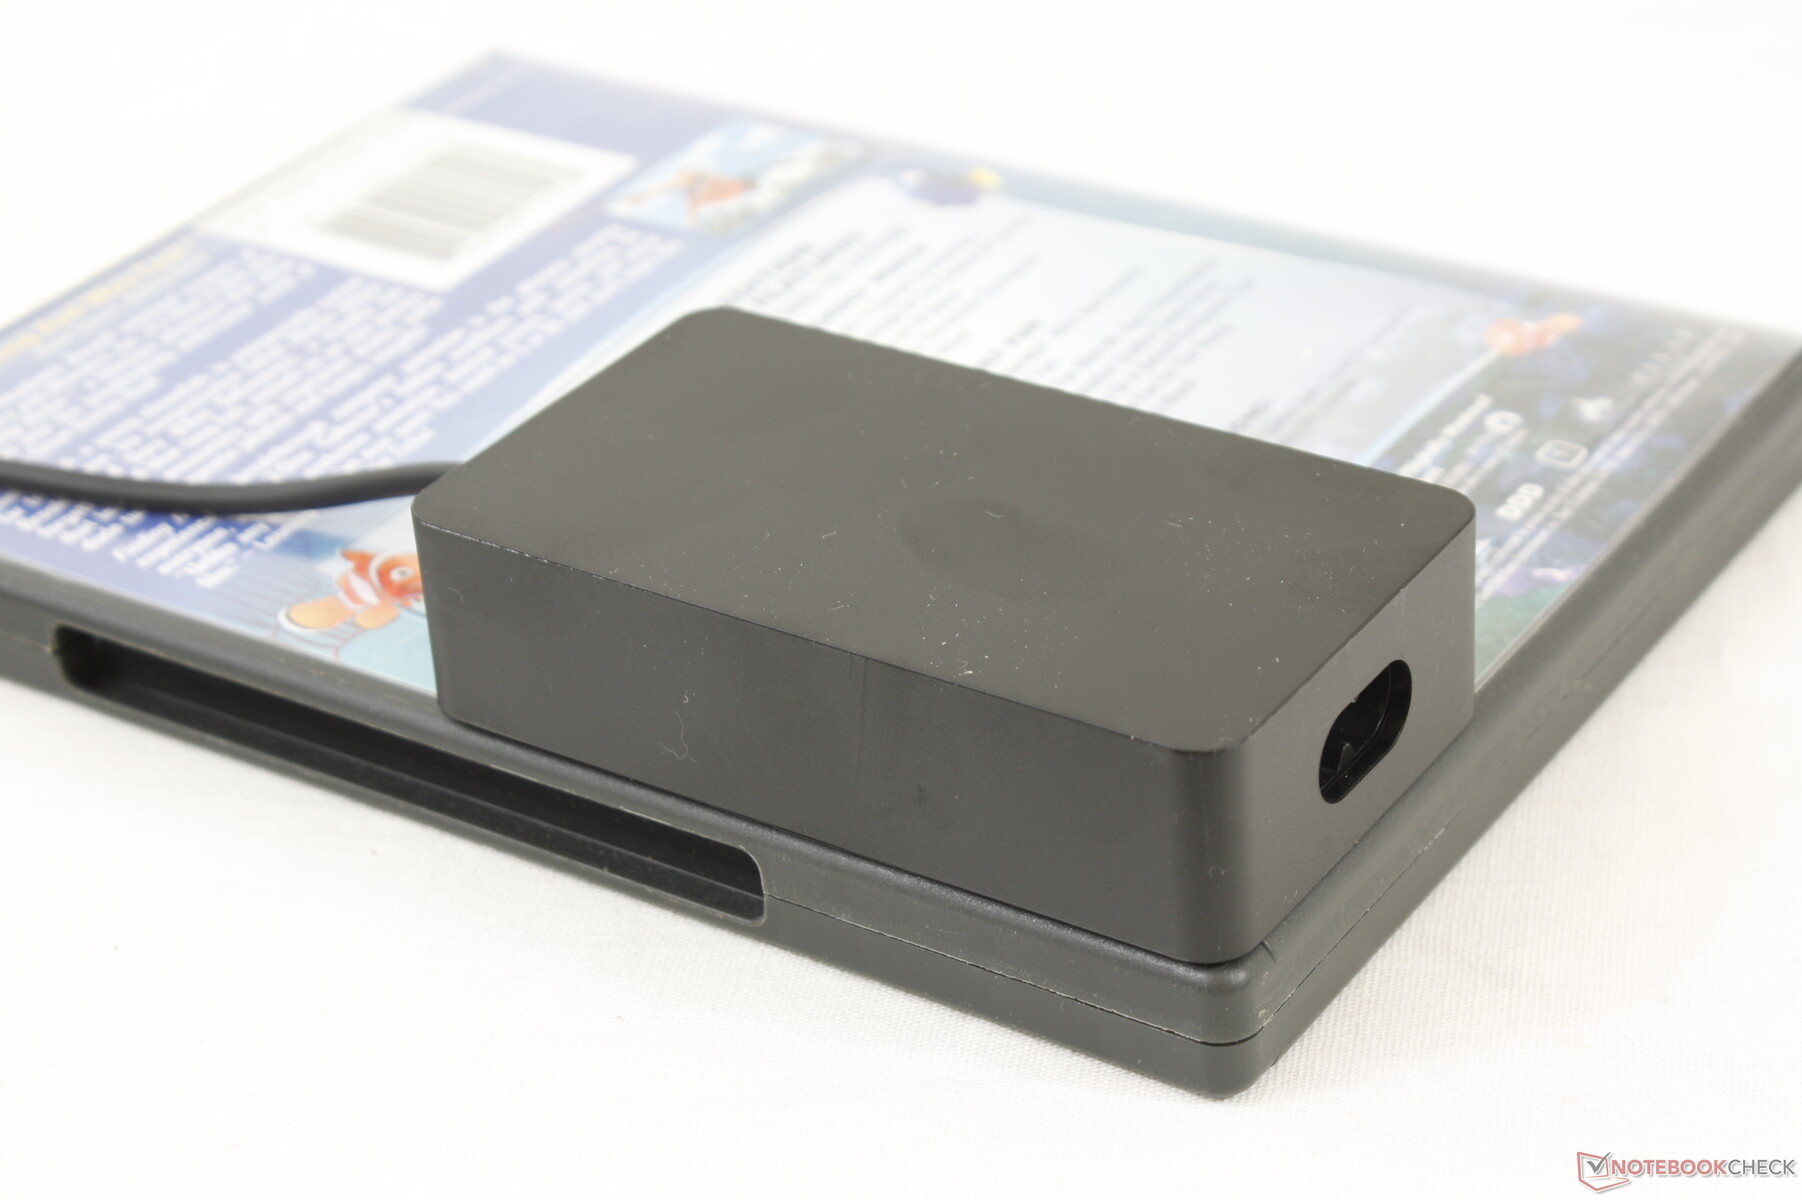
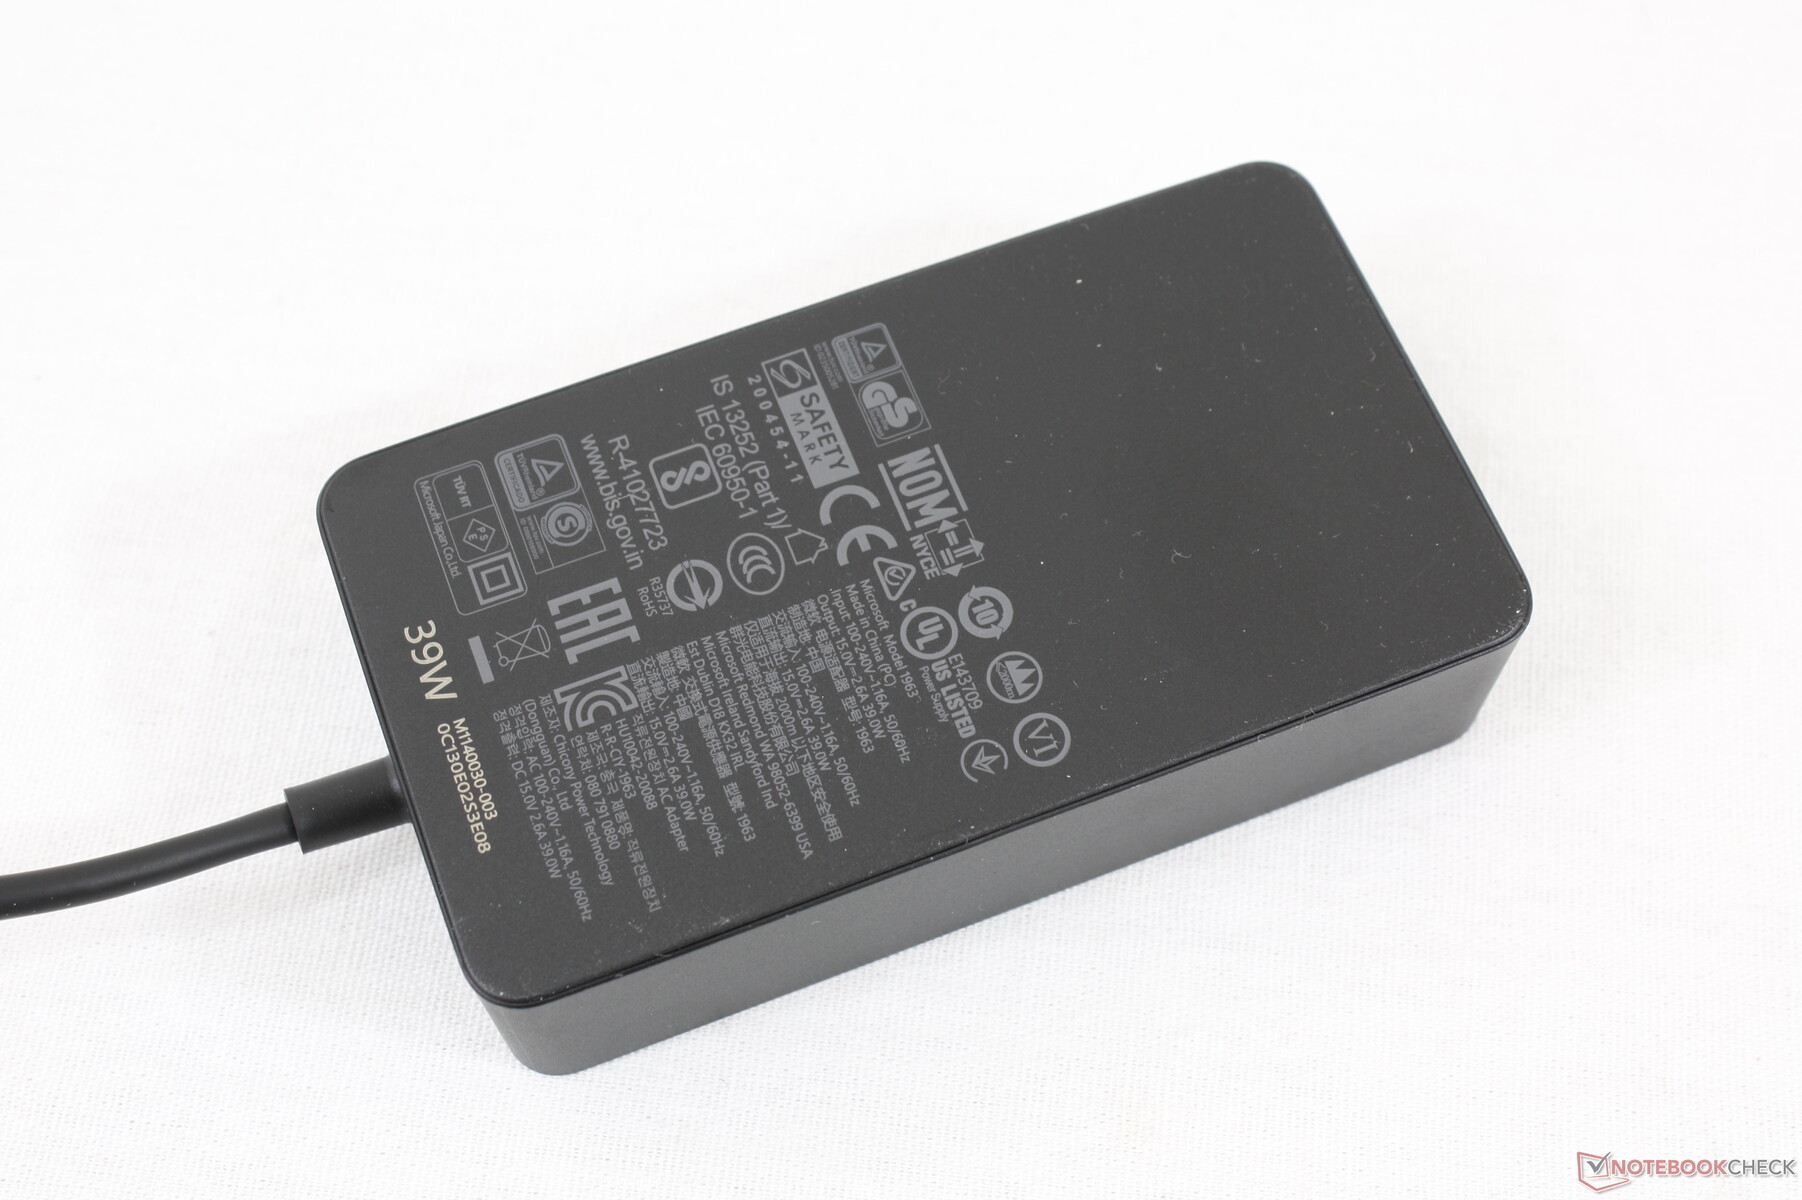
Er zitten geen extra's in de doos, behalve de Surface Connect AC-adapter en het papierwerk. De gebruikelijke éénjarige beperkte garantie is van toepassing.
Invoerapparaten
Toetsenbord
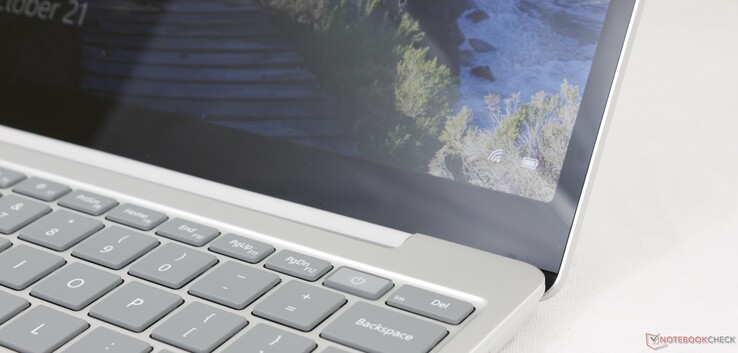
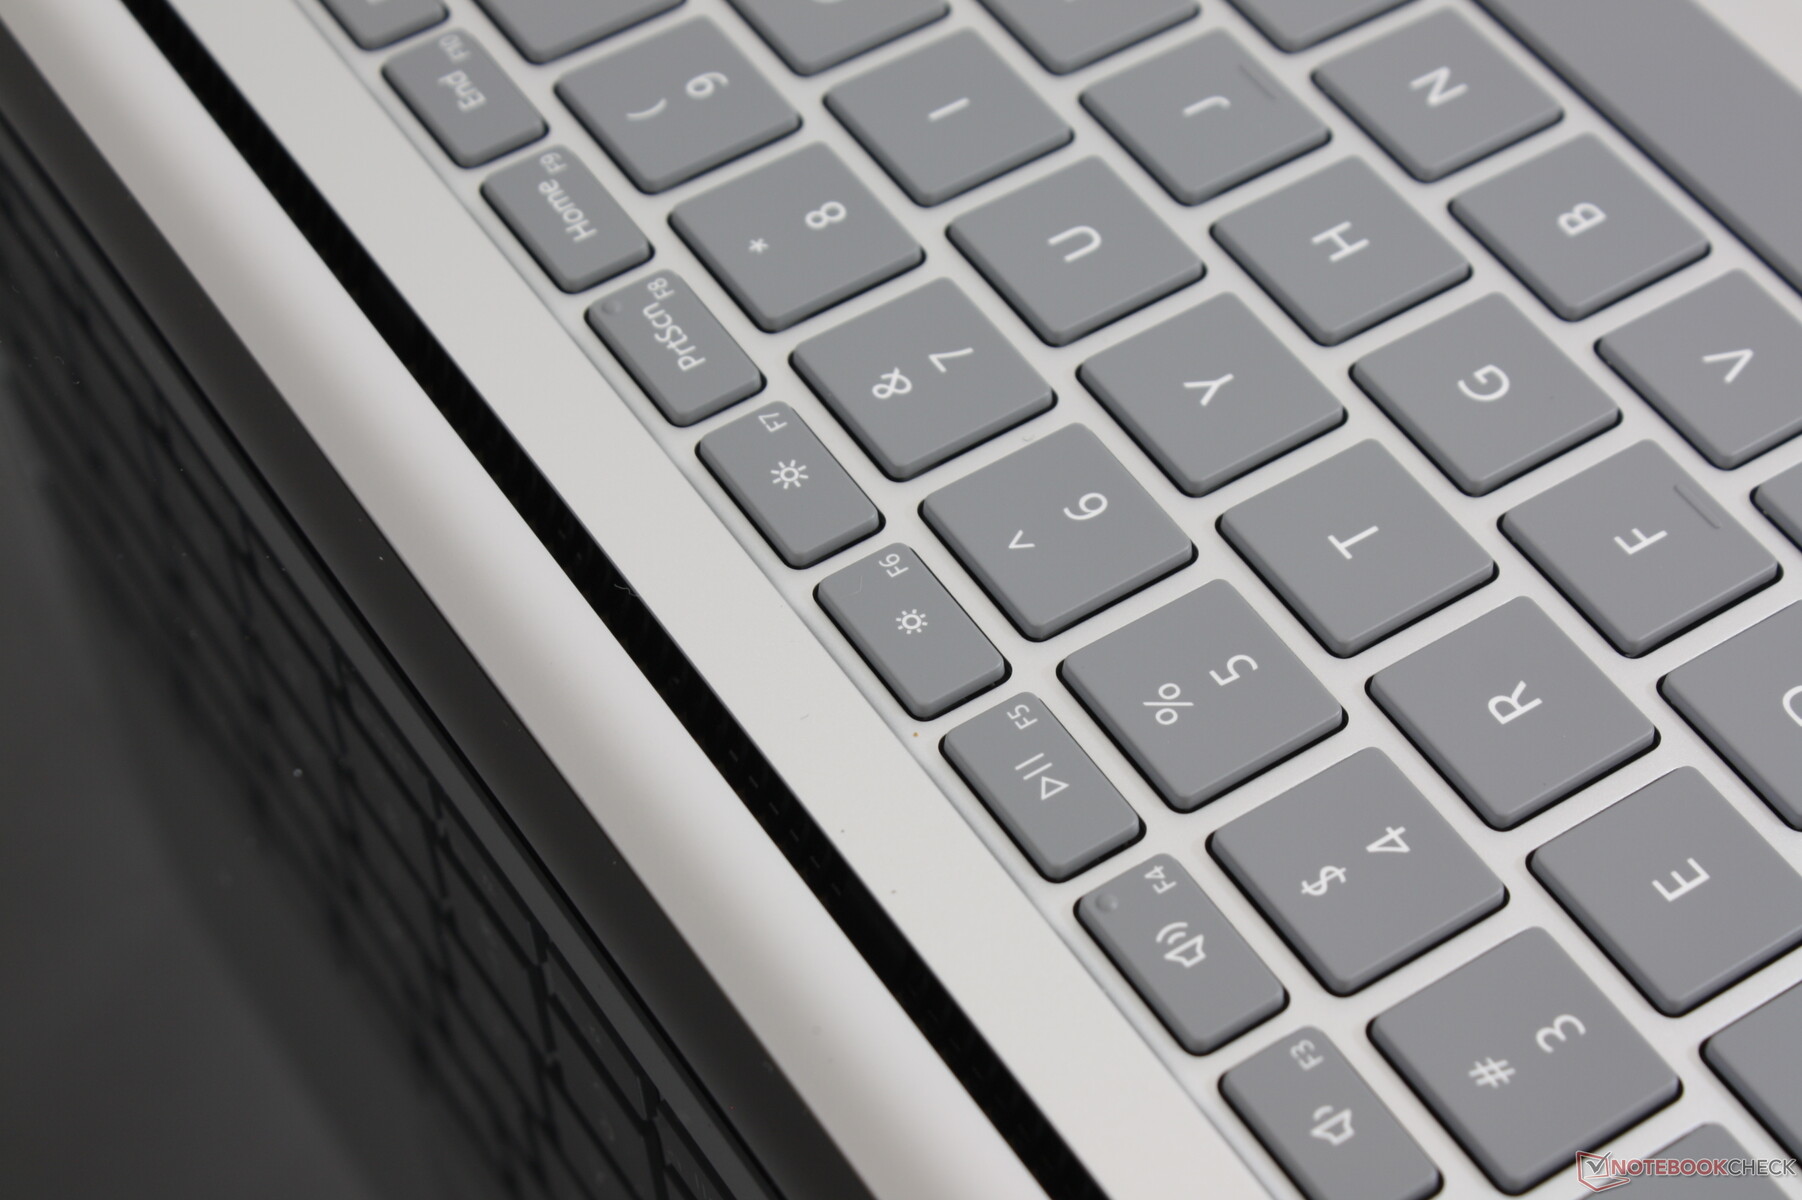
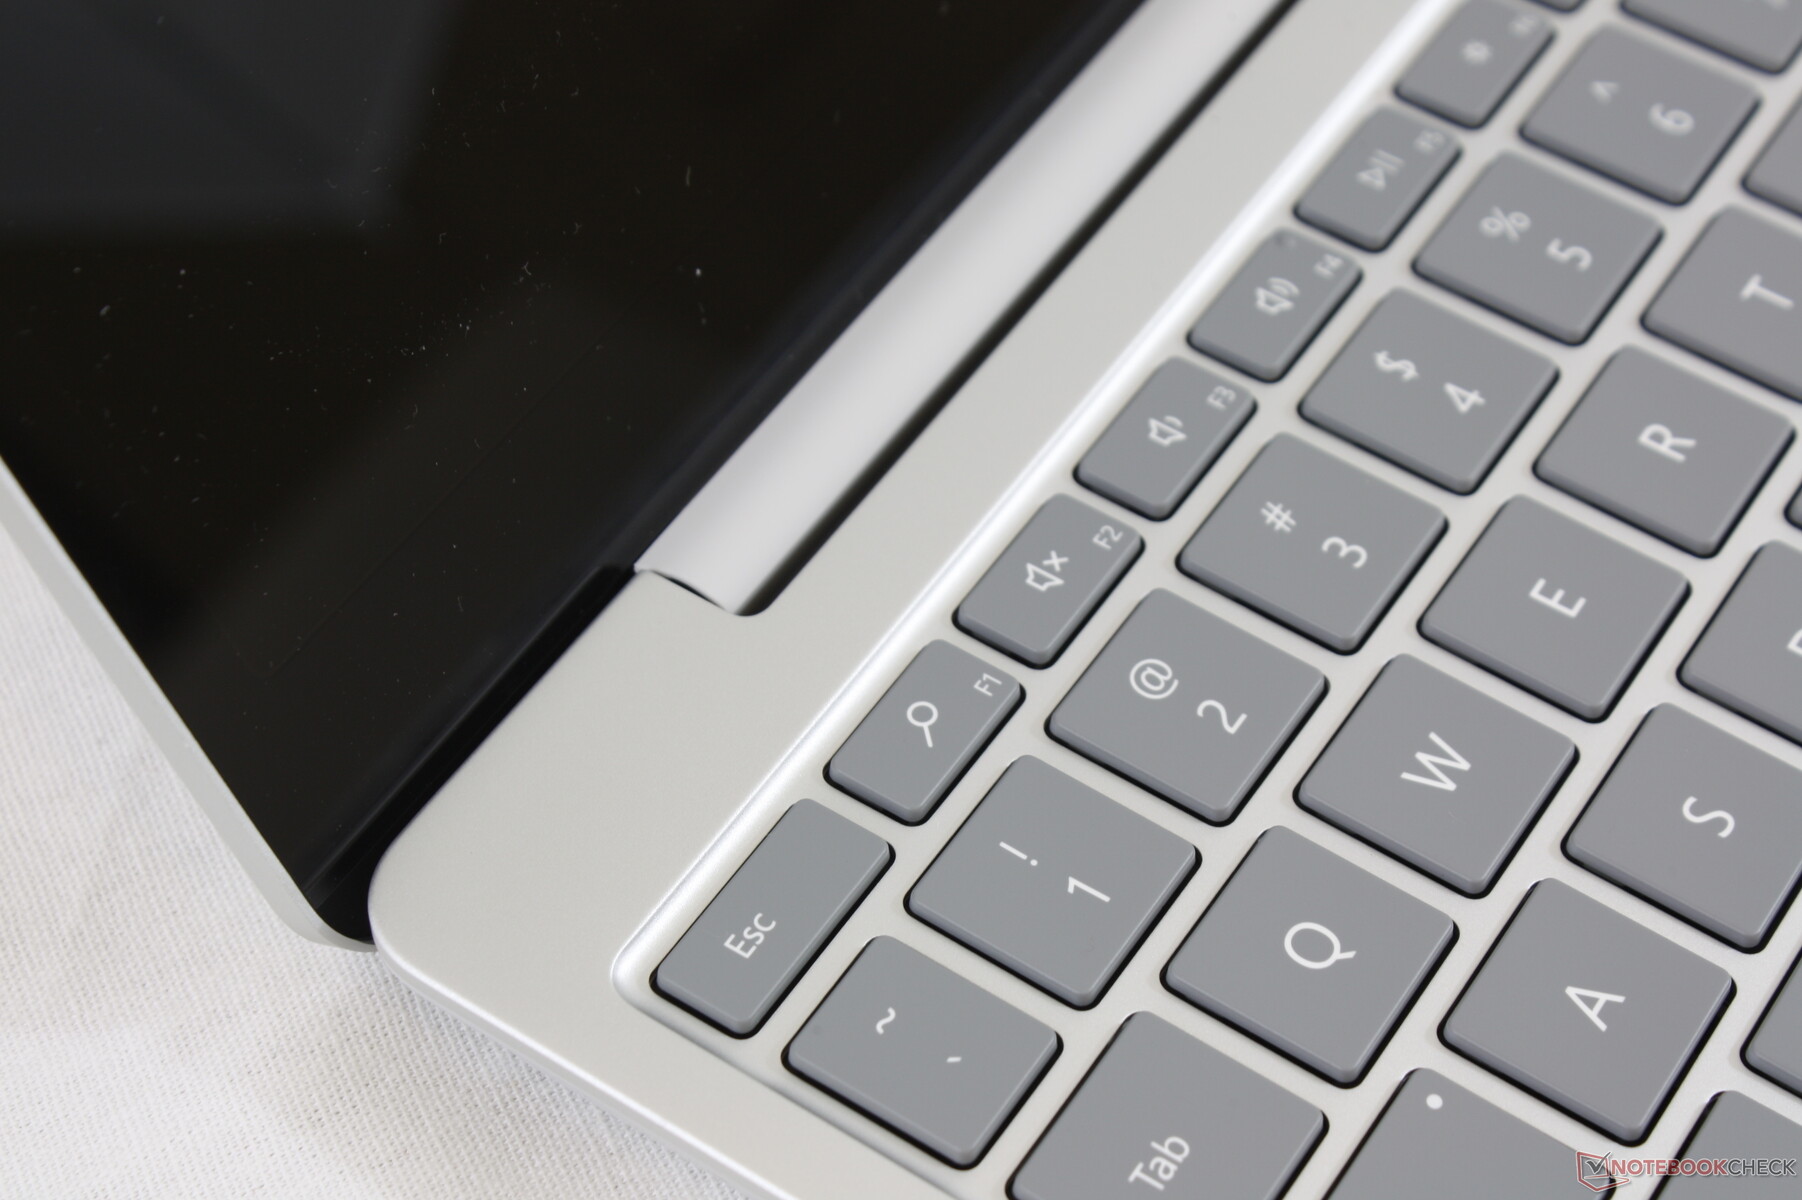
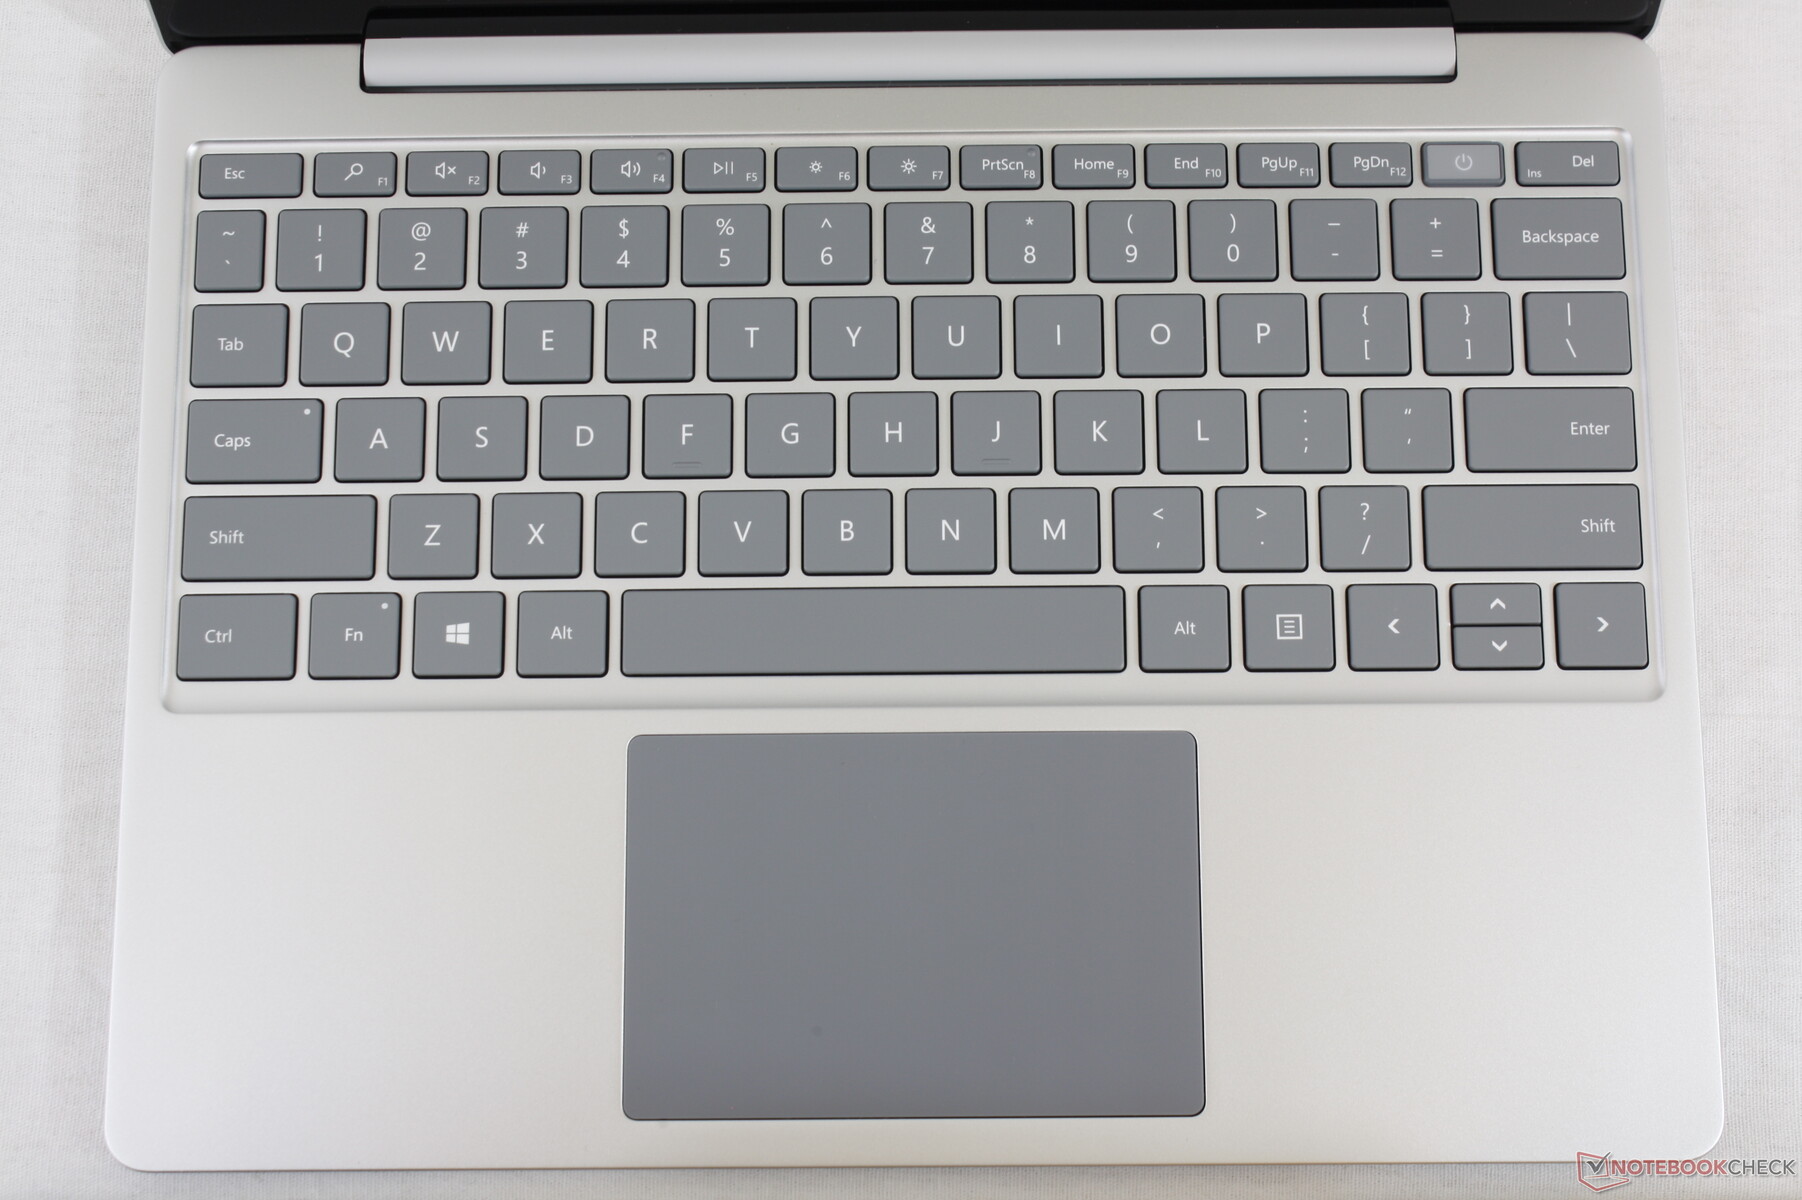
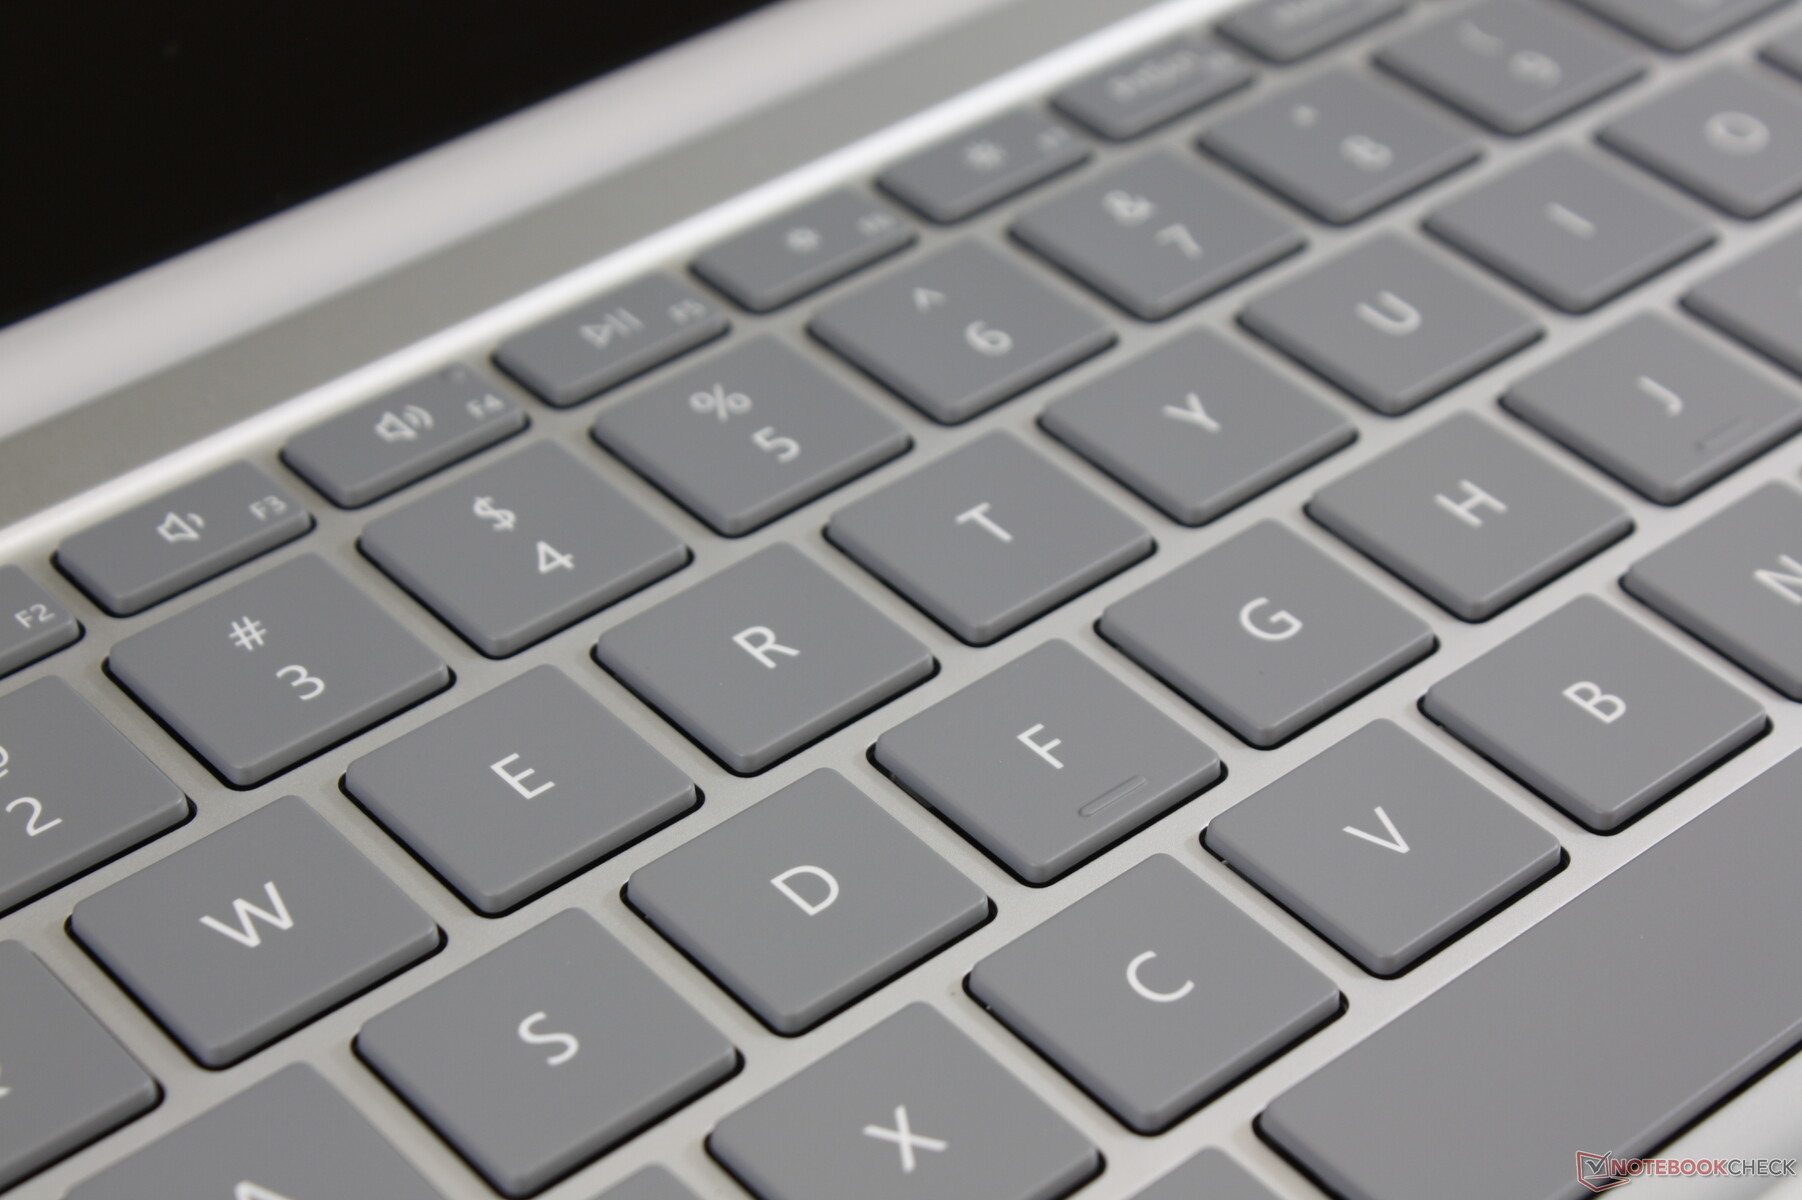
De belangrijkste feedback voelt hetzelfde aan als op de Surface Laptop 3 15, ook al zijn sommige toetsen langs de zijkanten nu korter om rekening te houden met de kleinere vormfactor. Het systeem integreert een aan/uit-knop-vingerafdruklezer, maar dan wel ten koste van een achtergrondverlichting van het toetsenbord. De F1-toets bijvoorbeeld is nu een zoekknop, terwijl diezelfde toets de achtergrondverlichting van de Surface Laptop 3-serie zou hebben geactiveerd.
Touchpad
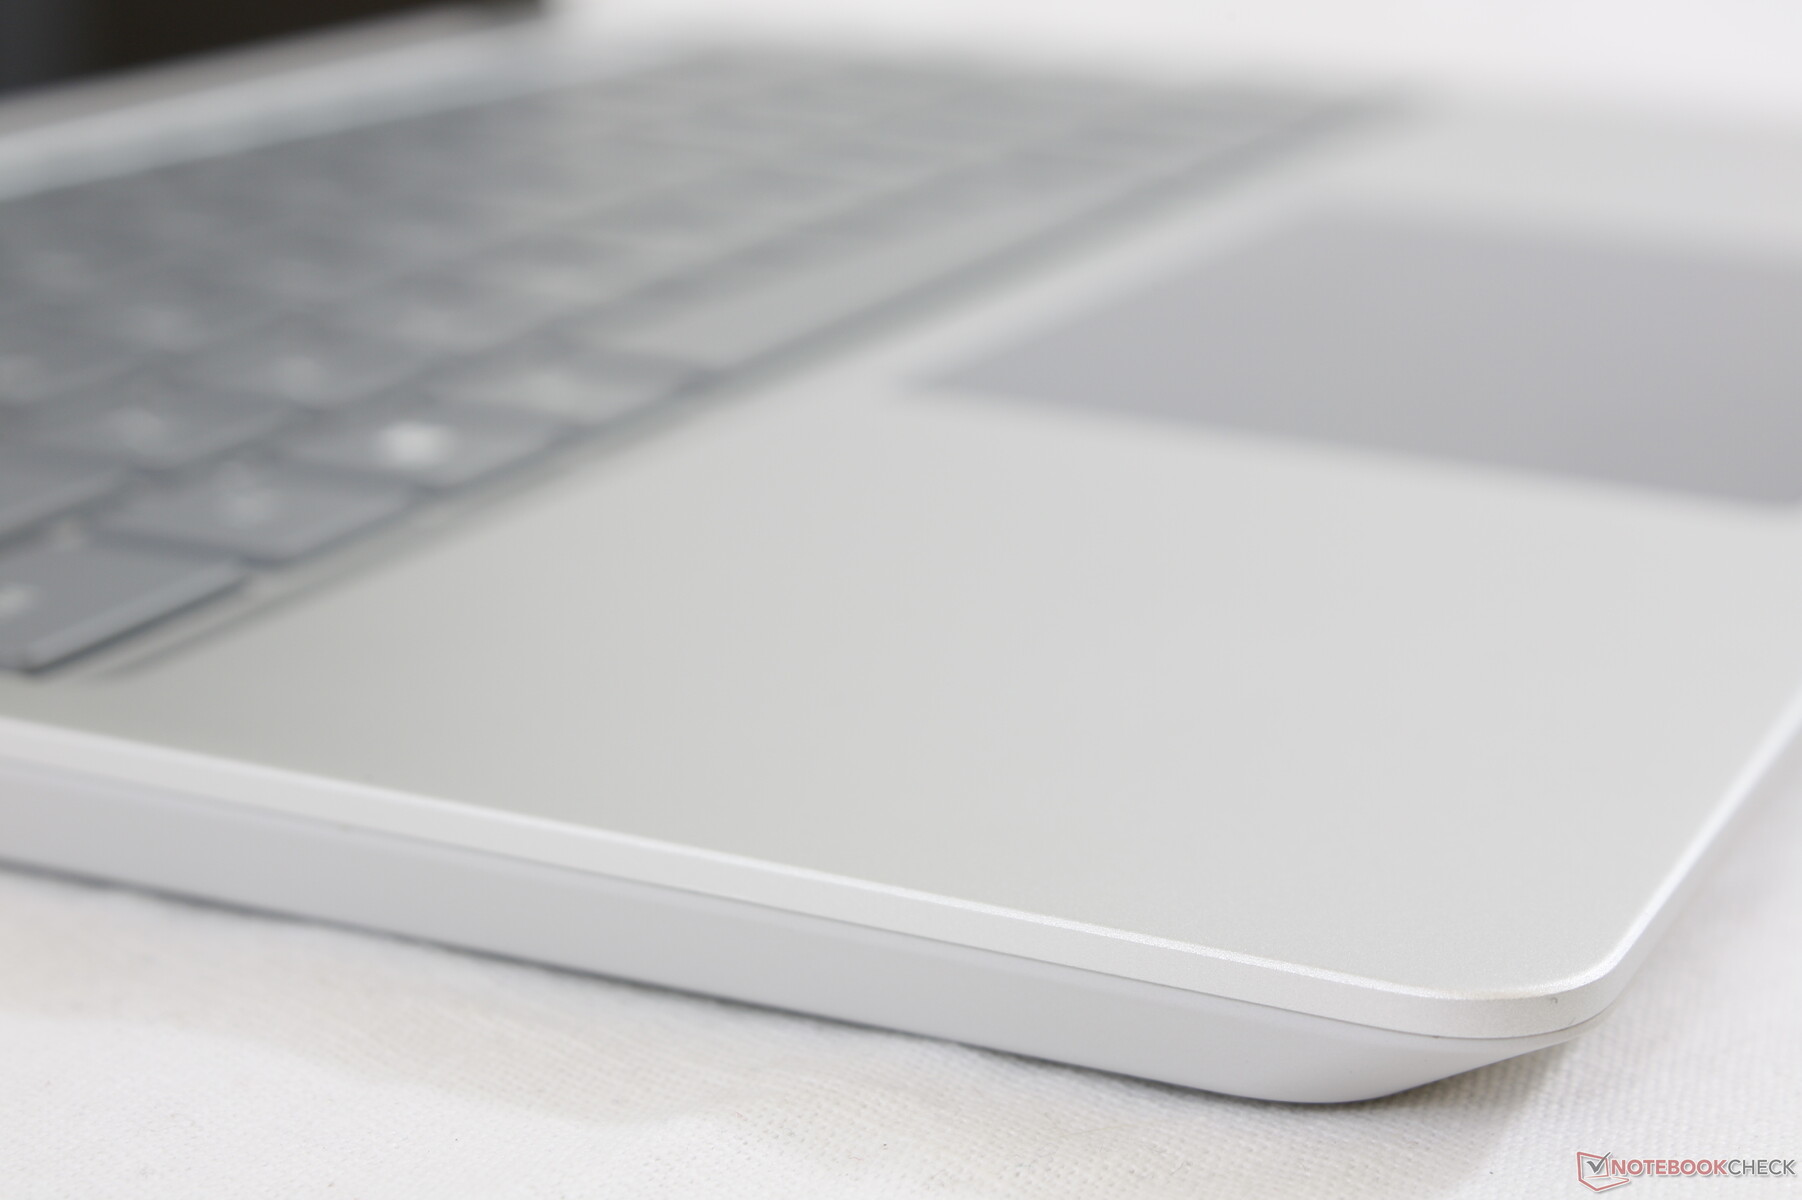
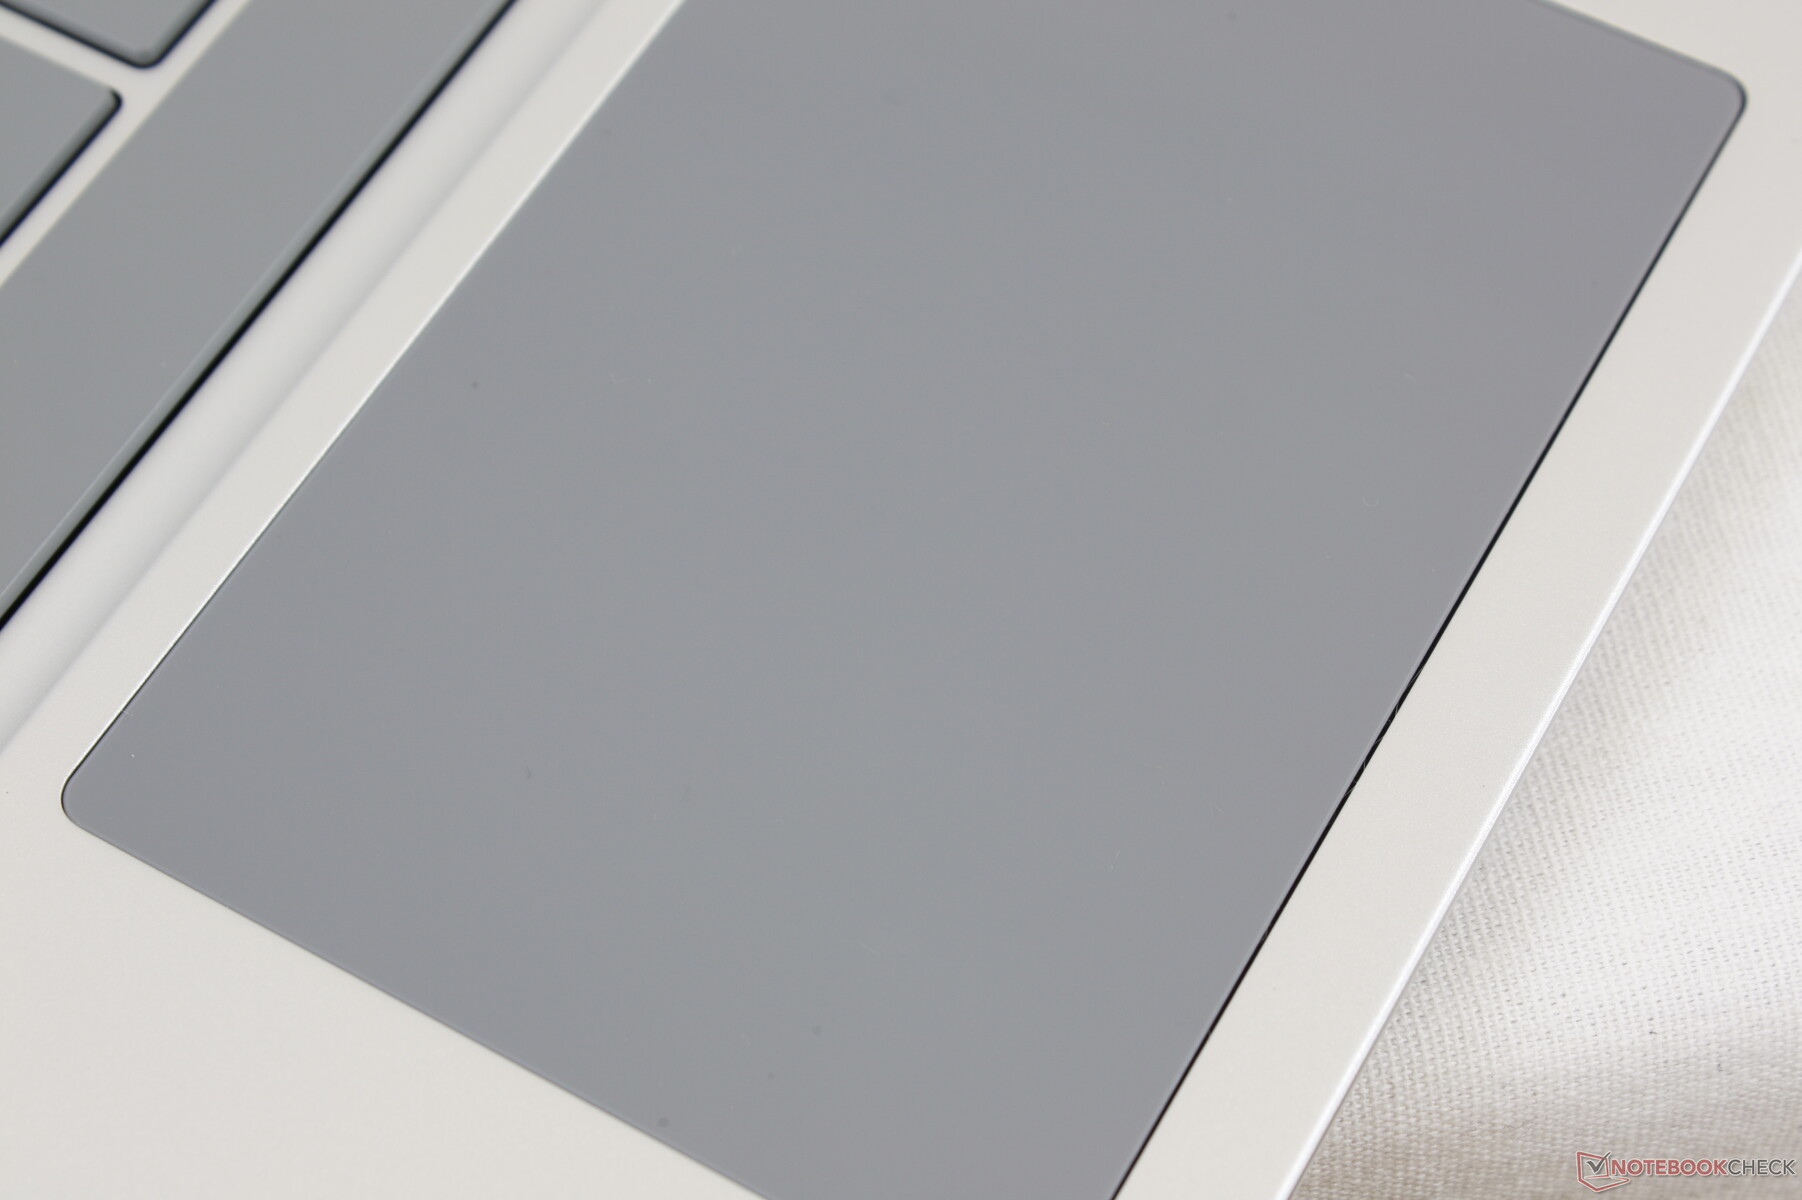
Het clickpad oppervlak is kleiner dan het clickpad op de Surface Laptop 3 15 (10 x 6,7 cm vs. 11,5 x 7,6 cm). Glijden is echter gladder op de Surface Laptop Go met minder kleverigheid. De geïntegreerde muistoetsen zijn ondiep in beweging met voldoende terugkoppeling en relatief rustig gekletter. We vinden de feedback iets steviger en bevredigender dan de clickpad op de XPS 13.

Toon
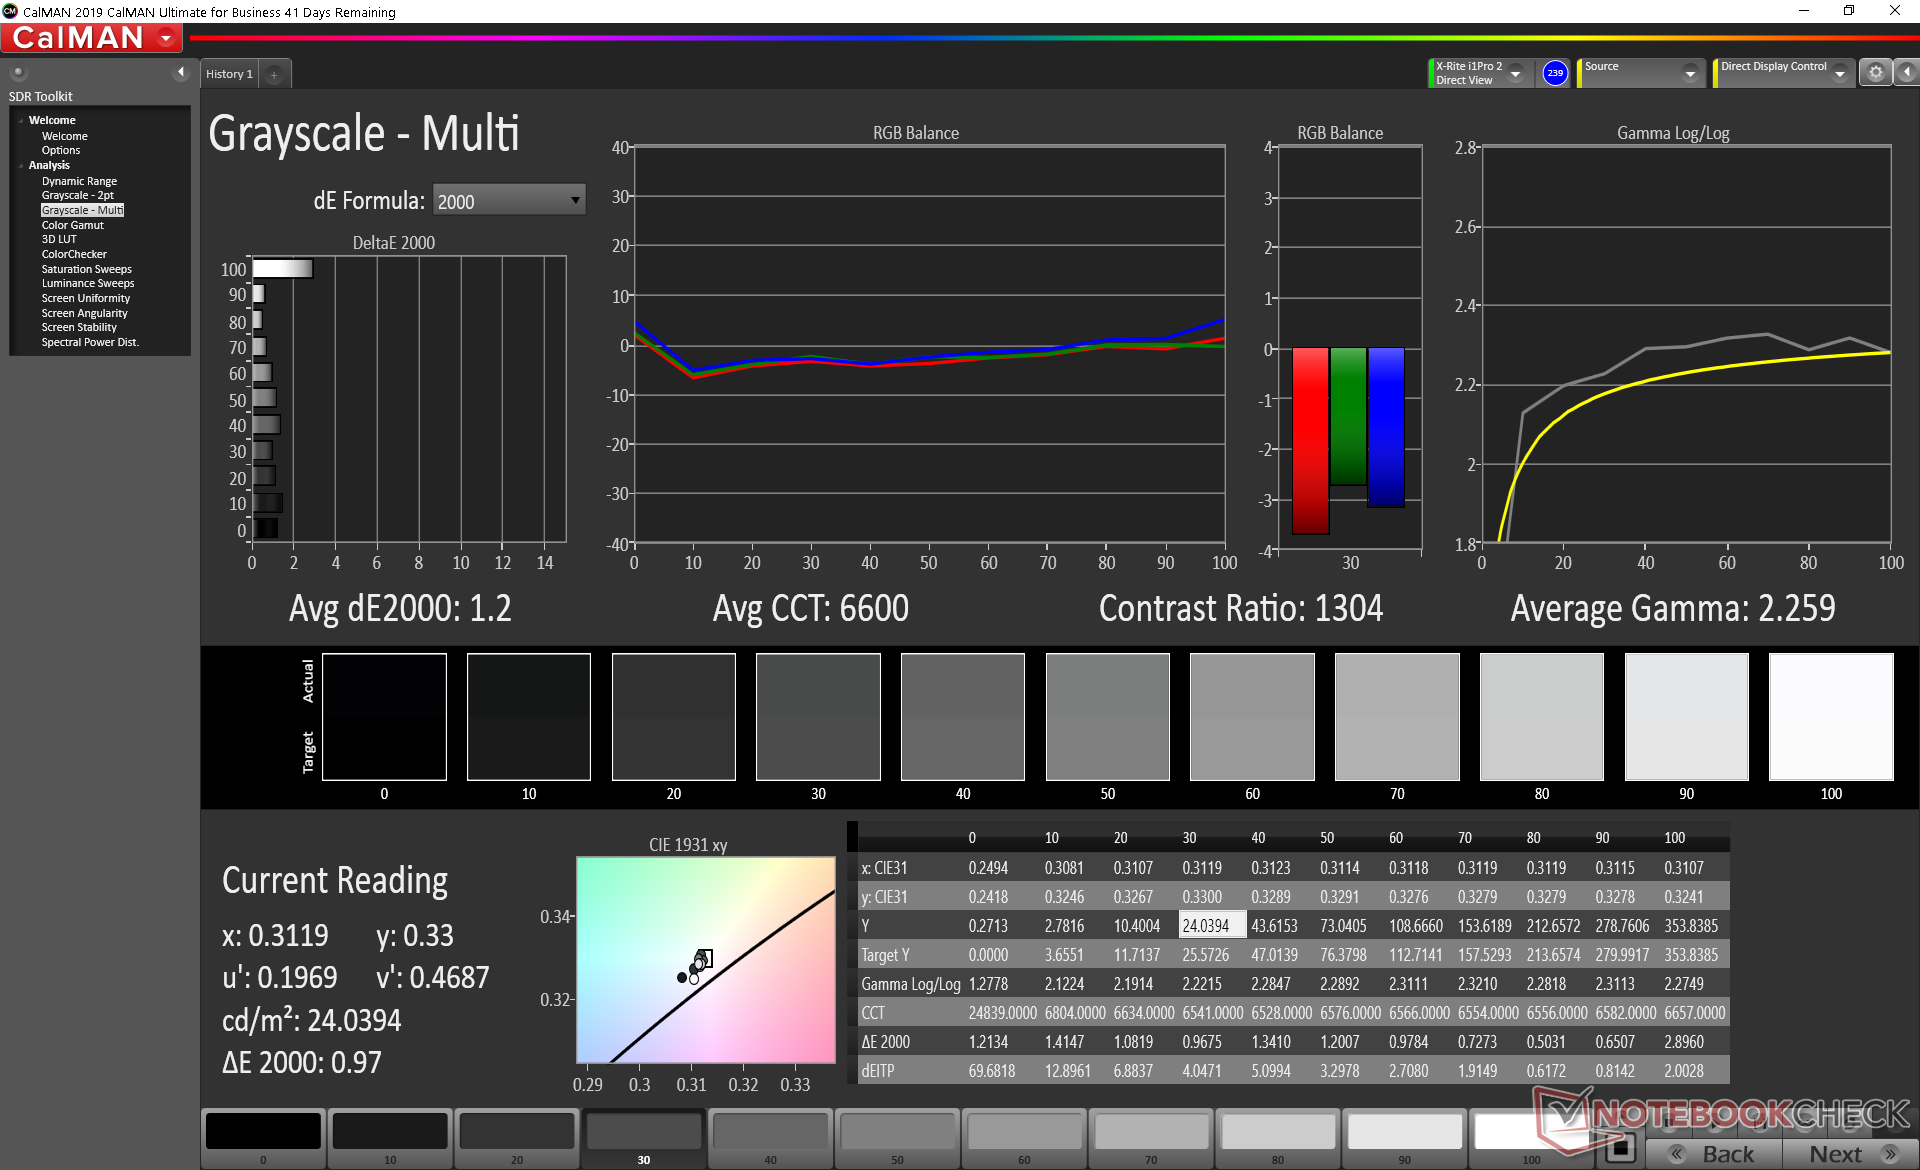
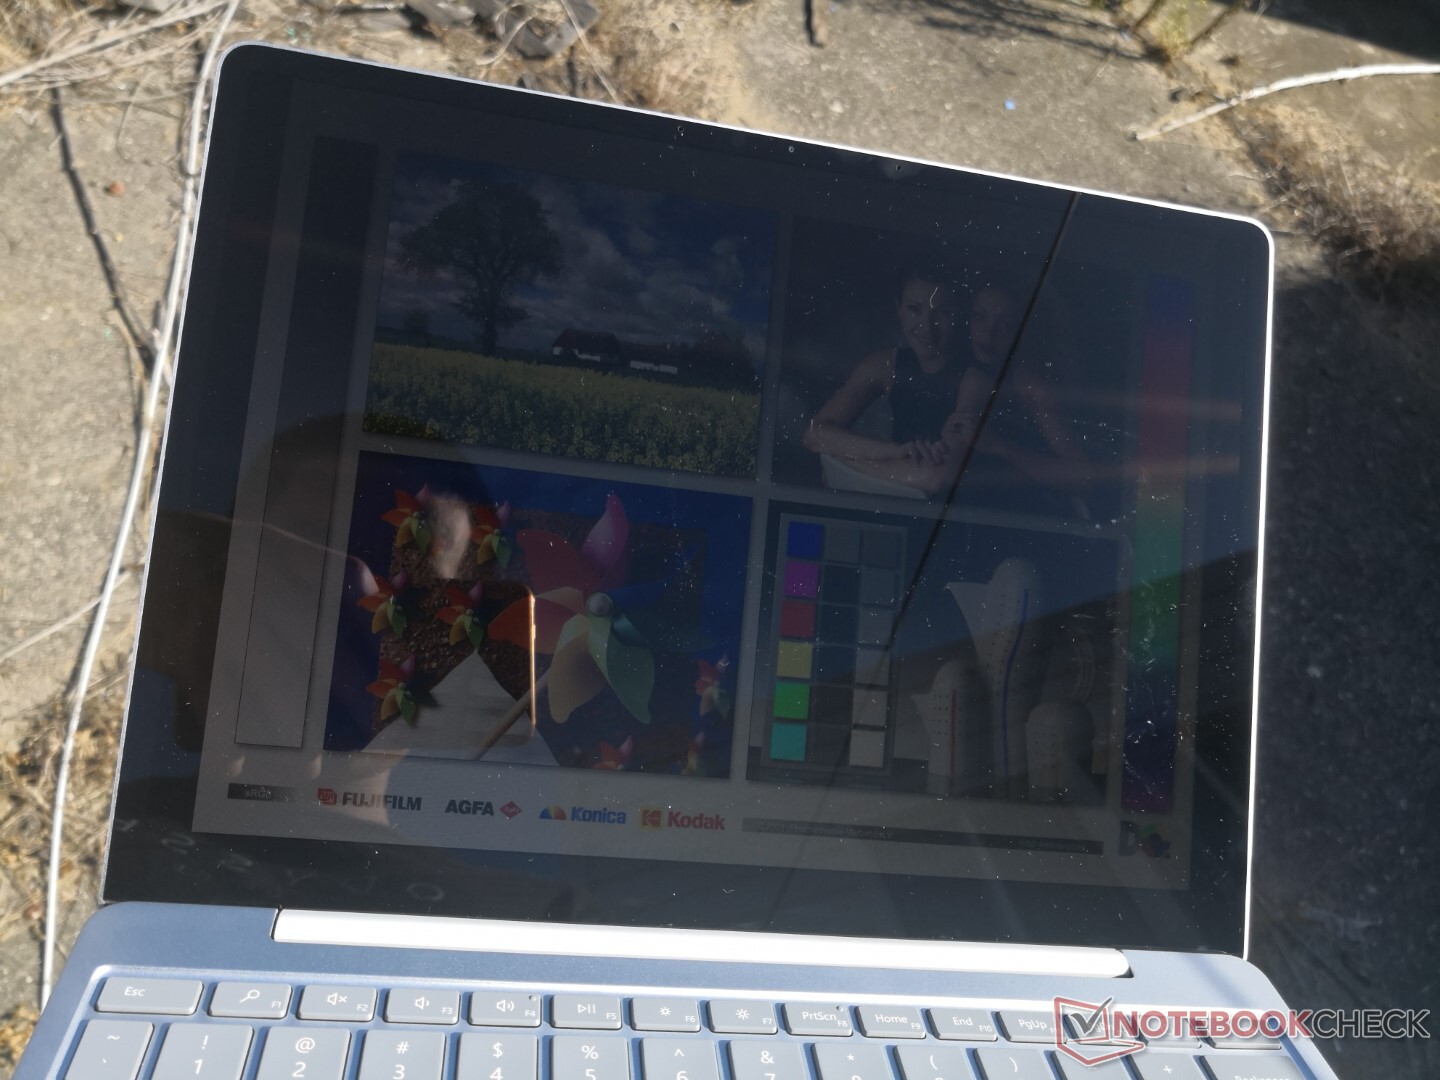
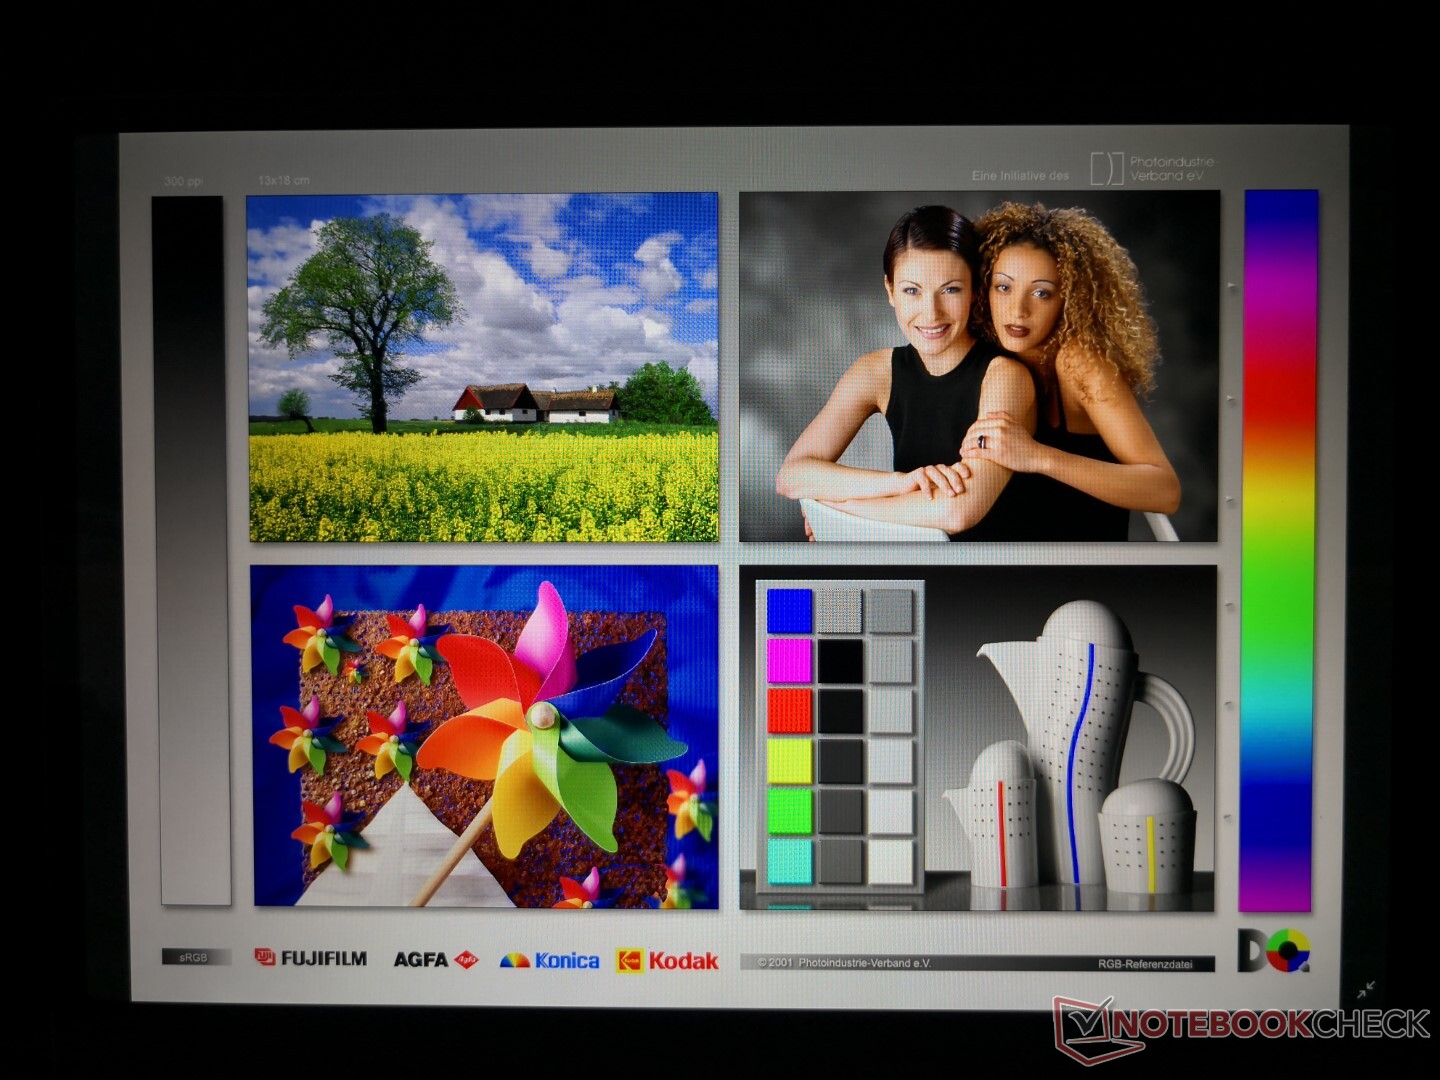
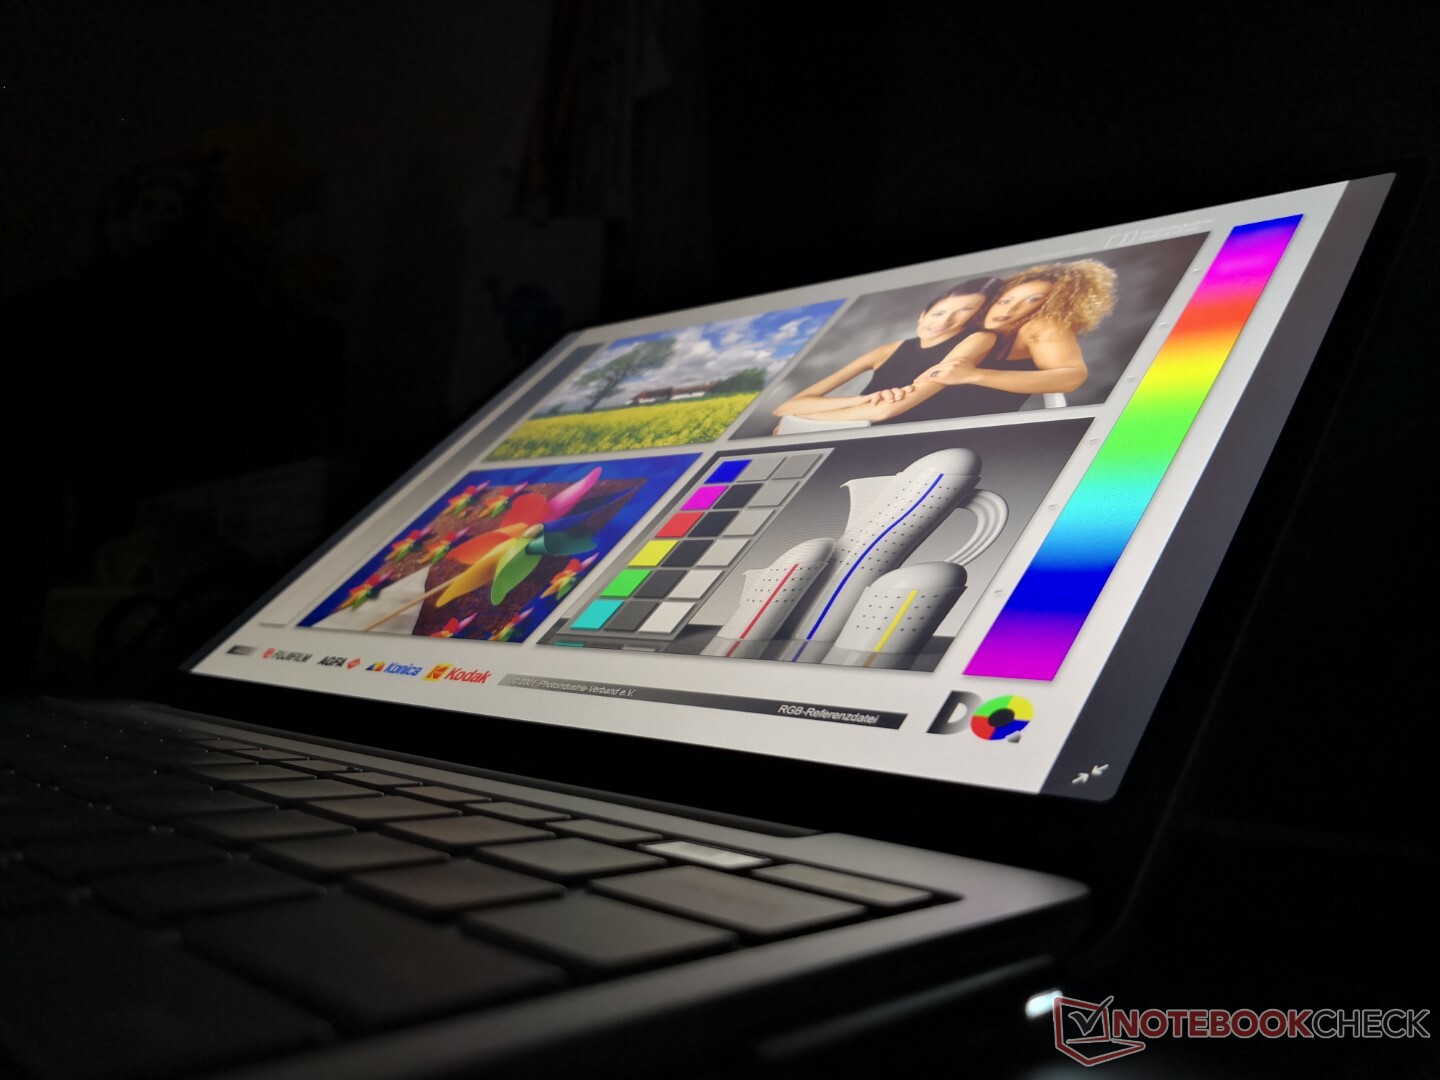
LG Philips is verantwoordelijk voor het display op de Surface Laptop Go, terwijl de displays op de grotere 13,5-inch en 15-inch Surface laptop 3 modellen allemaal van Sharp zijn. Contrast, kleuren en helderheid zijn gelukkig niet zo verschillend van de toch al uitstekende panelen op de grotere modellen. Een aspect dat beter is op de Surface Laptop Go is echter de reactietijd voor minder opvallende spoken.


| |||||||||||||||||||||||||
Helderheidsverdeling: 95 %
Helderheid in Batterij-modus: 354.3 cd/m²
Contrast: 1222:1 (Zwart: 0.29 cd/m²)
ΔE ColorChecker Calman: 1.41 | ∀{0.5-29.43 Ø4.71}
calibrated: 1.44
ΔE Greyscale Calman: 1.2 | ∀{0.09-98 Ø4.96}
94.4% sRGB (Argyll 1.6.3 3D)
60.2% AdobeRGB 1998 (Argyll 1.6.3 3D)
65.7% AdobeRGB 1998 (Argyll 3D)
94.6% sRGB (Argyll 3D)
64.4% Display P3 (Argyll 3D)
Gamma: 2.26
CCT: 6600 K
| Microsoft Surface Laptop Go Core i5 LG Philips LP125WX112403, IPS, 12.4", 1536x1024 | Asus Zenbook S UX393JA AU Optronics B139KAN01.0, IPS, 13.9", 3300x2200 | HP EliteBook 830 G7 Chi Mei CMN13A9, IPS, 13.3", 1920x1080 | Microsoft Surface Laptop 3 13 Core i5-1035G7 Sharp LQ135P1JX51, IPS, 13.5", 2256x1504 | Huawei MateBook X Pro 2020 i7 JDI LPM139M422A, LTPS, 13.9", 3000x2000 | Apple MacBook Pro 13 2020 2GHz i5 10th-Gen APPA03D, IPS, 13.3", 2560x1600 | |
|---|---|---|---|---|---|---|
| Display | 30% | 3% | 3% | 4% | 30% | |
| Display P3 Coverage (%) | 64.4 | 97.7 52% | 65.7 2% | 65.7 2% | 66.6 3% | 98.8 53% |
| sRGB Coverage (%) | 94.6 | 99.8 5% | 97.4 3% | 98.6 4% | 99.4 5% | 99.9 6% |
| AdobeRGB 1998 Coverage (%) | 65.7 | 87.9 34% | 67.4 3% | 67.8 3% | 68.6 4% | 86.4 32% |
| Response Times | -48% | -22% | -56% | -24% | -22% | |
| Response Time Grey 50% / Grey 80% * (ms) | 34.8 ? | 56.4 ? -62% | 46.8 ? -34% | 59.2 ? -70% | 49.6 ? -43% | 46 ? -32% |
| Response Time Black / White * (ms) | 29.2 ? | 38.8 ? -33% | 32 ? -10% | 41.6 ? -42% | 30.8 ? -5% | 32.4 ? -11% |
| PWM Frequency (Hz) | 21930 ? | 26600 ? | 21740 ? | 29070 ? | 113600 ? | |
| Screen | -42% | -26% | 9% | 12% | 7% | |
| Brightness middle (cd/m²) | 354.3 | 444.1 25% | 454.5 28% | 403.4 14% | 557 57% | 512 45% |
| Brightness (cd/m²) | 353 | 423 20% | 435 23% | 397 12% | 532 51% | 491 39% |
| Brightness Distribution (%) | 95 | 89 -6% | 91 -4% | 89 -6% | 87 -8% | 91 -4% |
| Black Level * (cd/m²) | 0.29 | 0.37 -28% | 0.27 7% | 0.34 -17% | 0.33 -14% | 0.32 -10% |
| Contrast (:1) | 1222 | 1200 -2% | 1683 38% | 1186 -3% | 1688 38% | 1600 31% |
| Colorchecker dE 2000 * | 1.41 | 2.94 -109% | 3.12 -121% | 0.94 33% | 1.4 1% | 1.7 -21% |
| Colorchecker dE 2000 max. * | 2.96 | 7.37 -149% | 4.85 -64% | 2.92 1% | 2.5 16% | 3.4 -15% |
| Colorchecker dE 2000 calibrated * | 1.44 | 3.05 -112% | 1.97 -37% | 0.99 31% | 0.7 51% | 1 31% |
| Greyscale dE 2000 * | 1.2 | 2.9 -142% | 3.1 -158% | 0.9 25% | 2 -67% | 1.9 -58% |
| Gamma | 2.26 97% | 2.1 105% | 2.01 109% | 2.13 103% | 2.14 103% | 2.19 100% |
| CCT | 6600 98% | 6766 96% | 6902 94% | 6620 98% | 6689 97% | 6817 95% |
| Color Space (Percent of AdobeRGB 1998) (%) | 60.2 | 78.2 30% | 61.5 2% | 62.3 3% | 62.5 4% | 77.4 29% |
| Color Space (Percent of sRGB) (%) | 94.4 | 99.8 6% | 97 3% | 98.7 5% | 99.5 5% | 99.9 6% |
| Totaal Gemiddelde (Programma / Instellingen) | -20% /
-29% | -15% /
-20% | -15% /
-0% | -3% /
6% | 5% /
8% |
* ... kleiner is beter
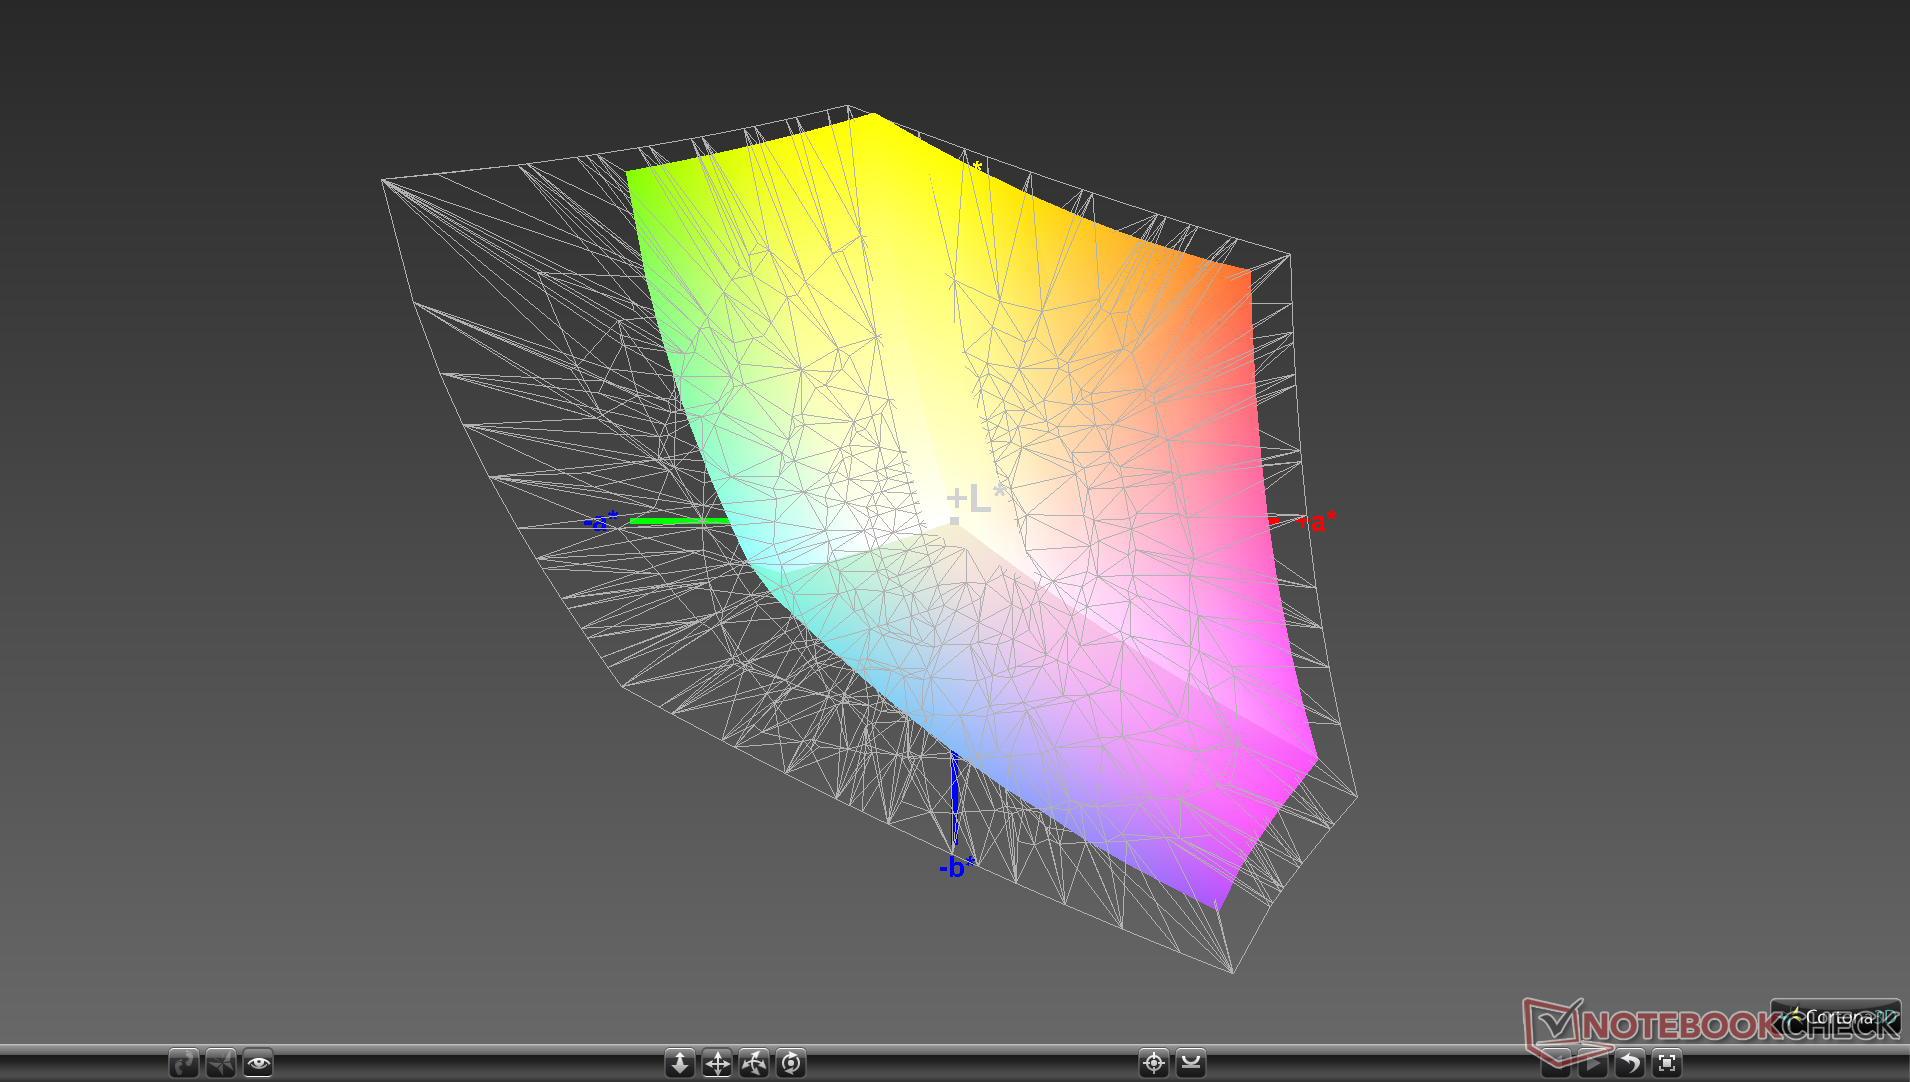
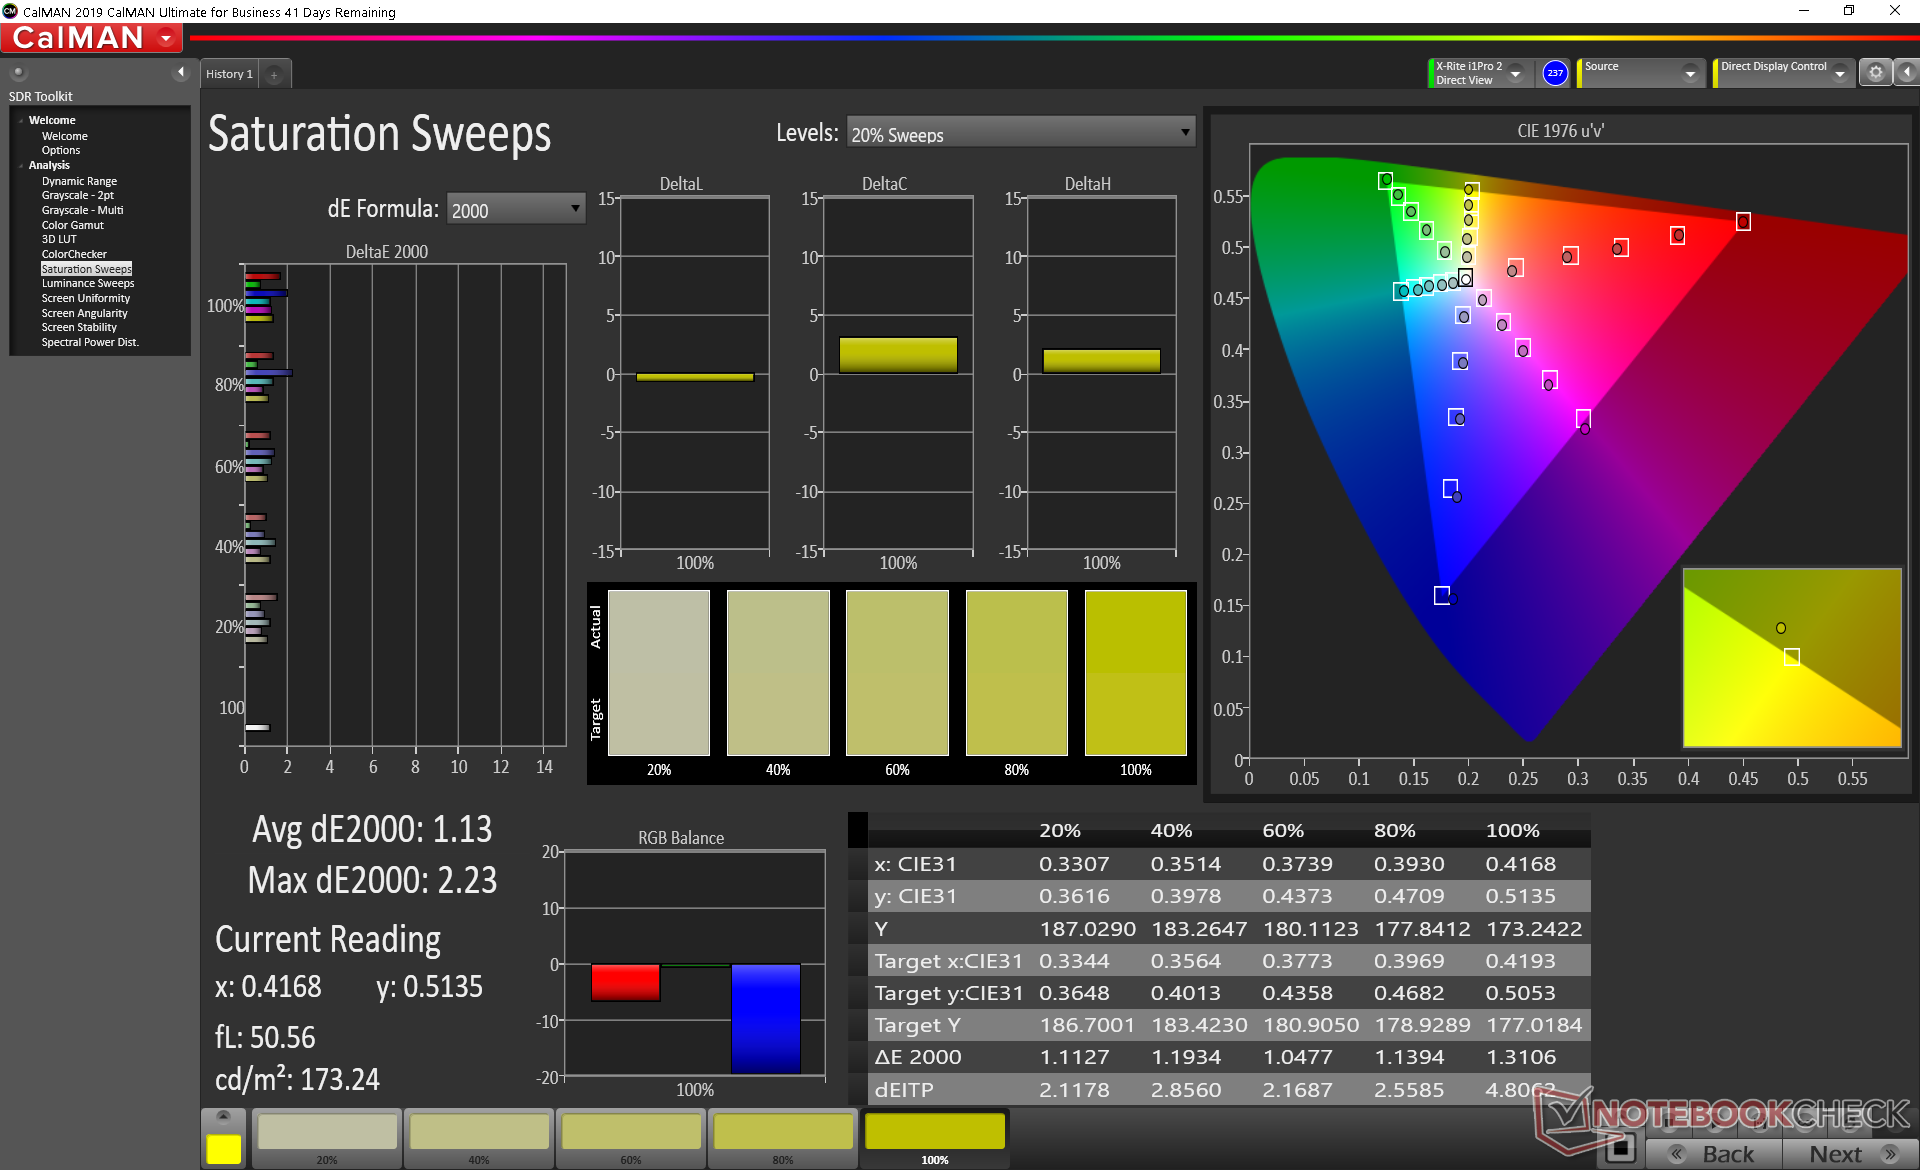
De kleurruimte beslaat 60 procent van AdobeRGB en bijna alle sRGB om voldoende te zijn voor amateur-graphics of videobewerking. De prijsbepalende alternatieven zoals de MacBook Pro 13 of Asus ZenBook S zijn in staat om diepere en nauwkeurigere kleuren te bieden.
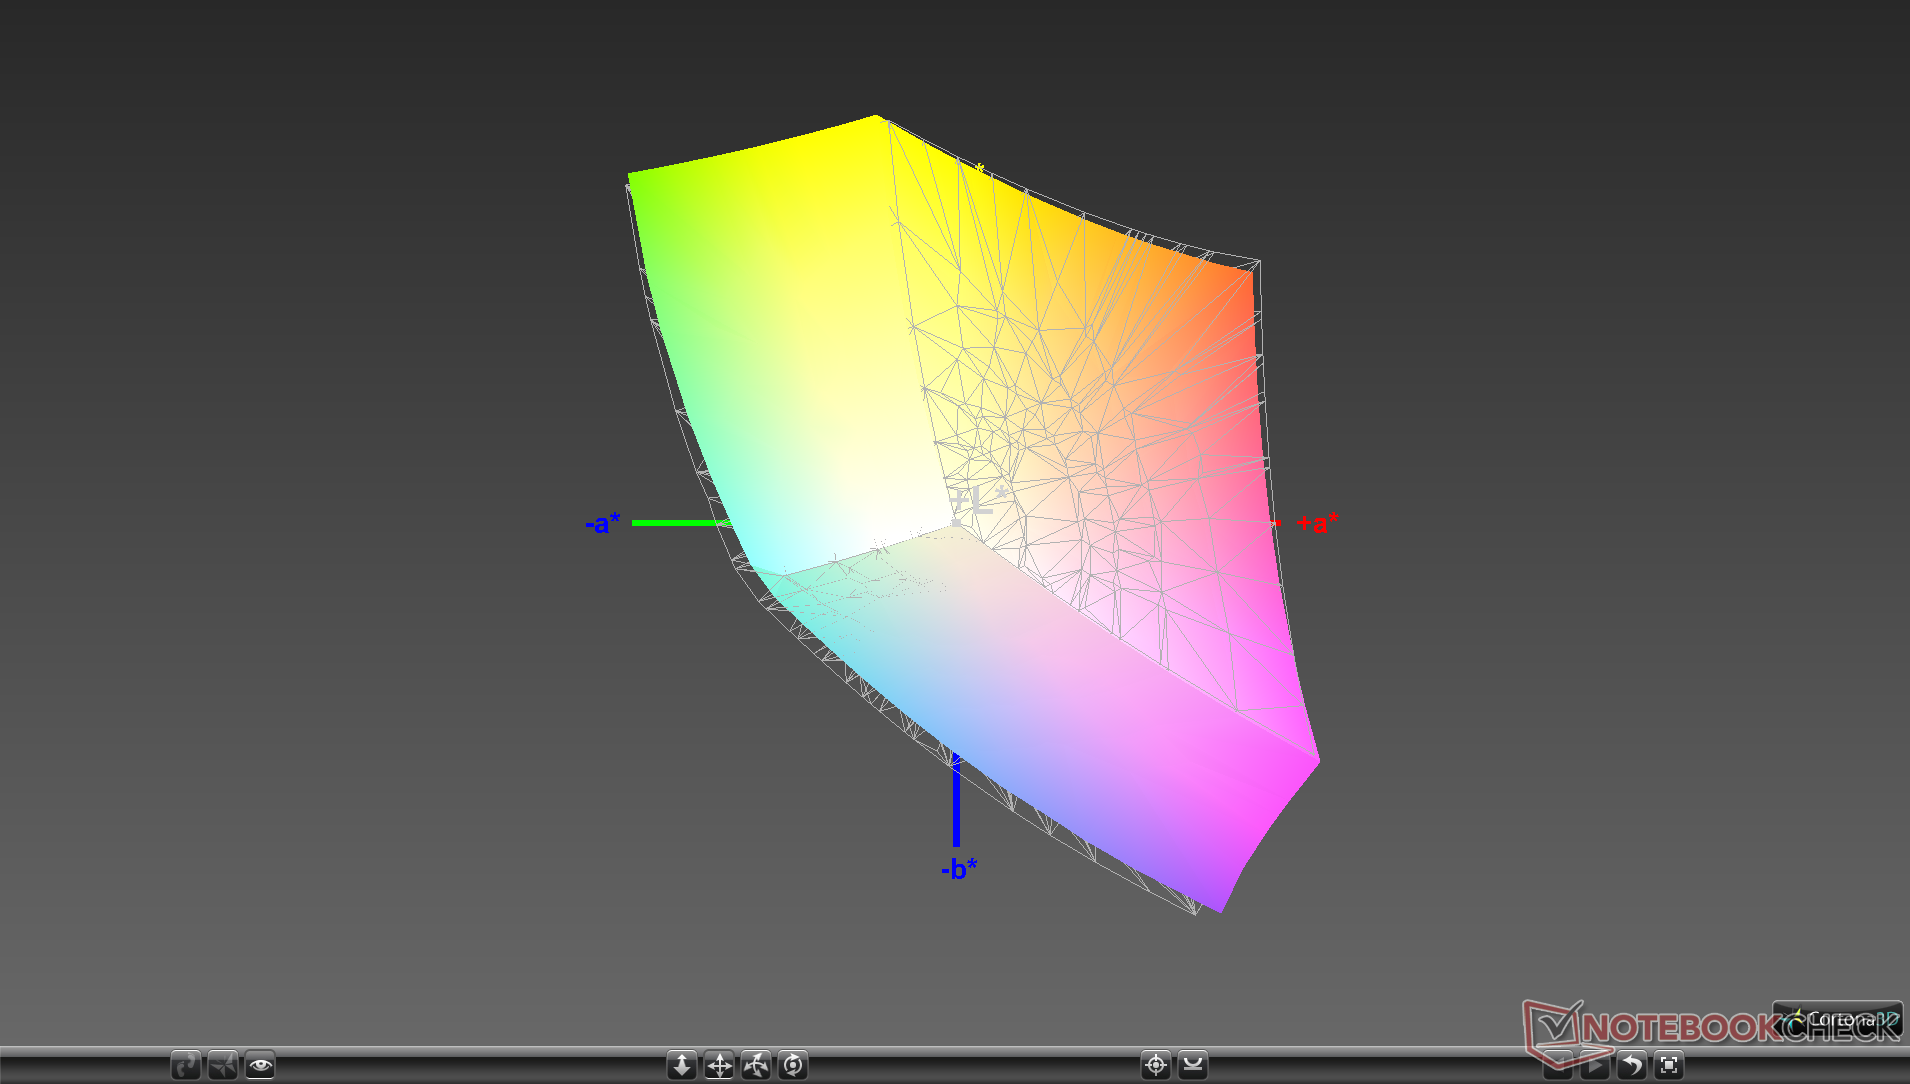
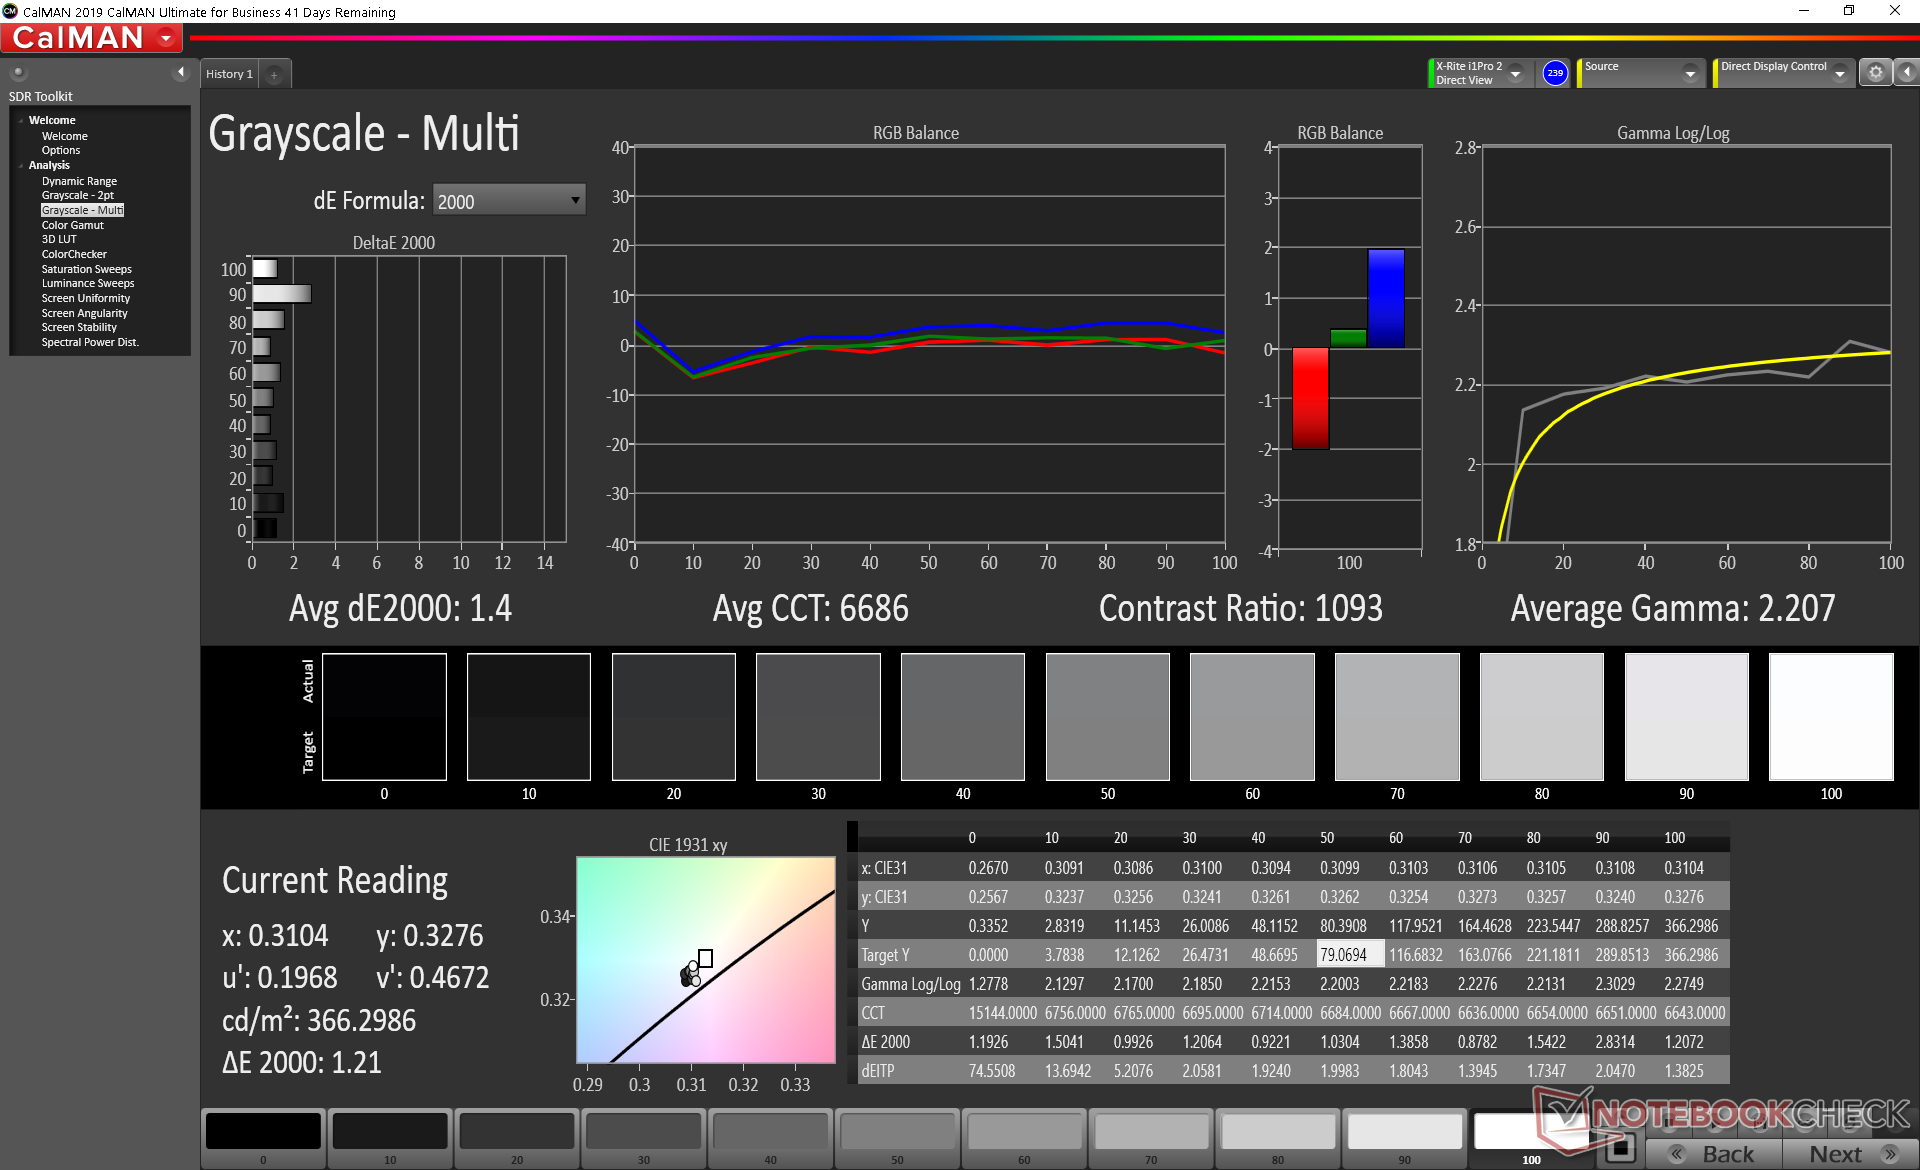
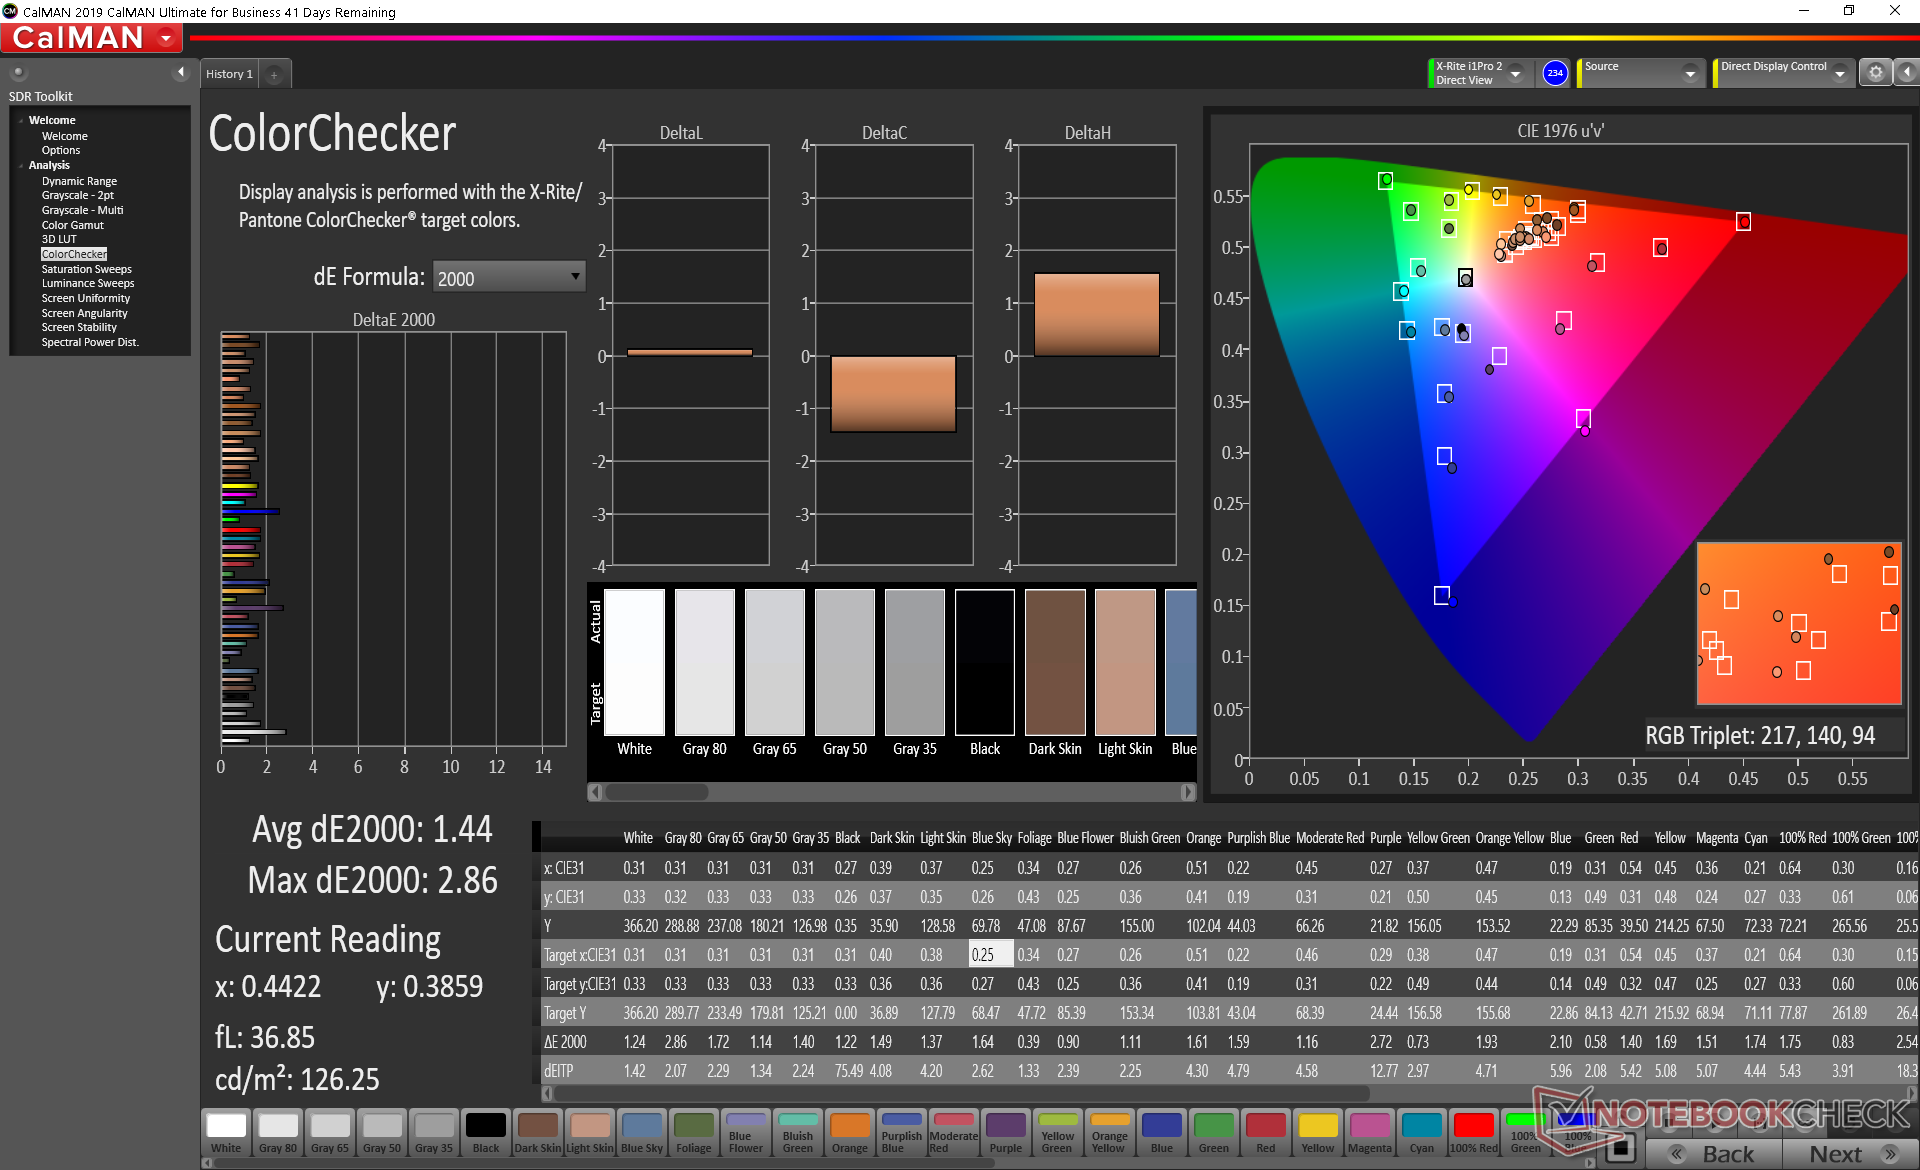
Het paneel is zeer goed gekalibreerd uit de doos met gemiddelde grijswaarden en kleuren DeltaE-waarden van respectievelijk slechts 1,2 en 1,41. Er is geen behoefte aan een eindgebruikerskalibratie.


Responstijd Scherm
| ↔ Responstijd Zwart naar Wit | ||
|---|---|---|
| 29.2 ms ... stijging ↗ en daling ↘ gecombineerd | ↗ 17.2 ms stijging | 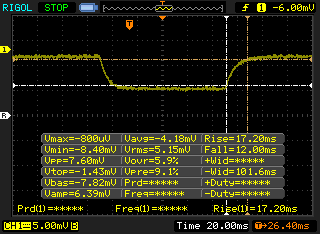 |
| ↘ 12 ms daling | ||
| Het scherm vertoonde relatief trage responstijden in onze tests en is misschien te traag voor games. Ter vergelijking: alle testtoestellen variëren van 0.1 (minimum) tot 240 (maximum) ms. » 78 % van alle toestellen zijn beter. Dit betekent dat de gemeten responstijd slechter is dan het gemiddelde (19.8 ms) van alle geteste toestellen. | ||
| ↔ Responstijd 50% Grijs naar 80% Grijs | ||
| 34.8 ms ... stijging ↗ en daling ↘ gecombineerd | ↗ 19.6 ms stijging | 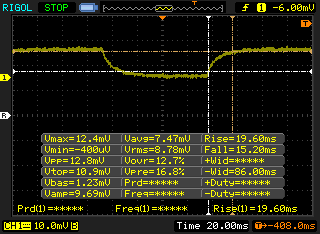 |
| ↘ 15.2 ms daling | ||
| Het scherm vertoonde trage responstijden in onze tests en is misschien te traag voor games. Ter vergelijking: alle testtoestellen variëren van 0.165 (minimum) tot 636 (maximum) ms. » 49 % van alle toestellen zijn beter. Dit betekent dat de gemeten responstijd slechter is dan het gemiddelde (30.9 ms) van alle geteste toestellen. | ||
Screen Flickering / PWM (Pulse-Width Modulation)
| Screen flickering / PWM waargenomen | 21930 Hz | ≤ 51 % helderheid instelling | 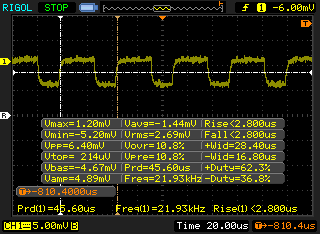 |
De achtergrondverlichting van het scherm flikkert op 21930 Hz (in het slechtste geval, bijvoorbeeld bij gebruik van PWM) aan een helderheid van 51 % en lager. Boven deze helderheid zou er geen flickering / PWM mogen optreden. De frequentie van 21930 Hz is redelijk hoog en de meeste mensen die gevoelig zijn aan flickering zouden dit dus niet mogen waarnemen of geïrriteerde ogen krijgen. Ter vergelijking: 52 % van alle geteste toestellen maakten geen gebruik van PWM om de schermhelderheid te verlagen. Als het wel werd gebruikt, werd een gemiddelde van 7741 (minimum: 5 - maximum: 343500) Hz waargenomen. | |||
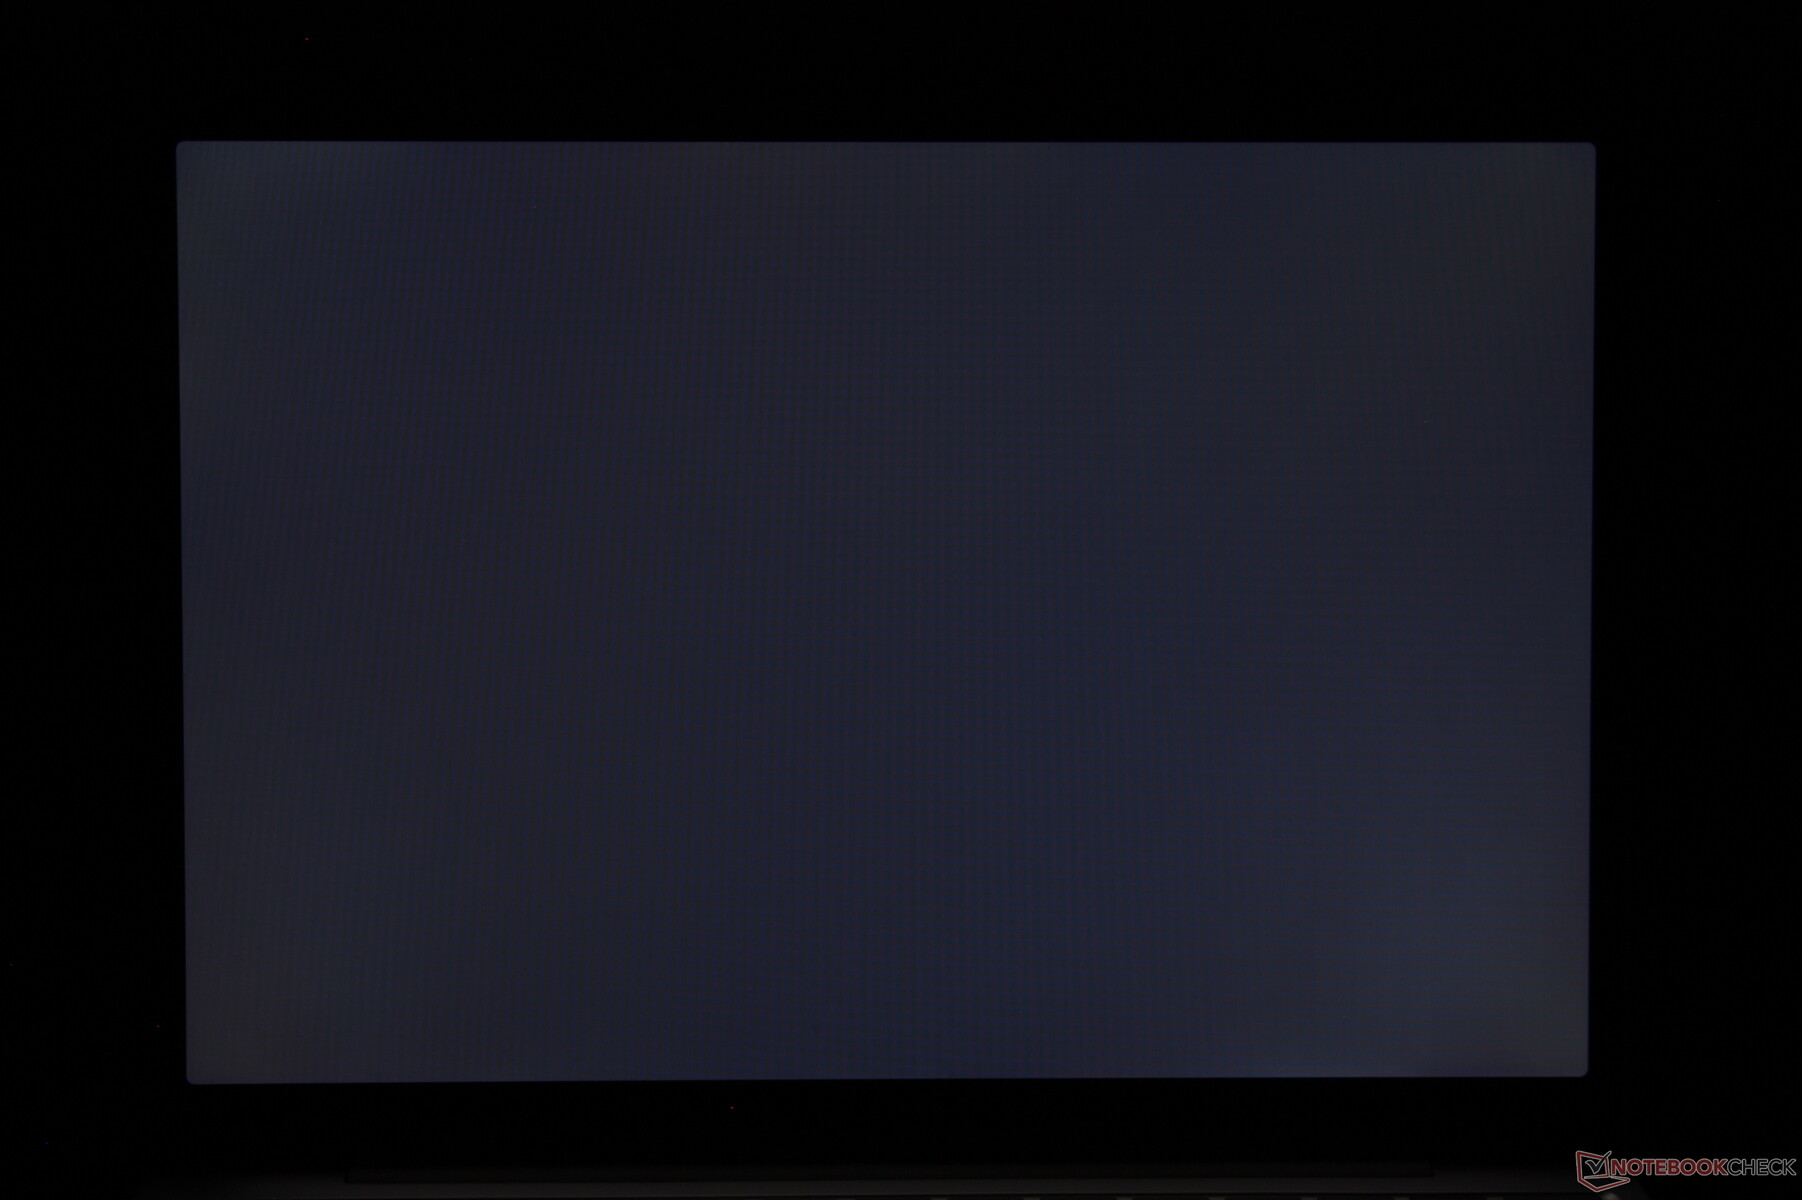
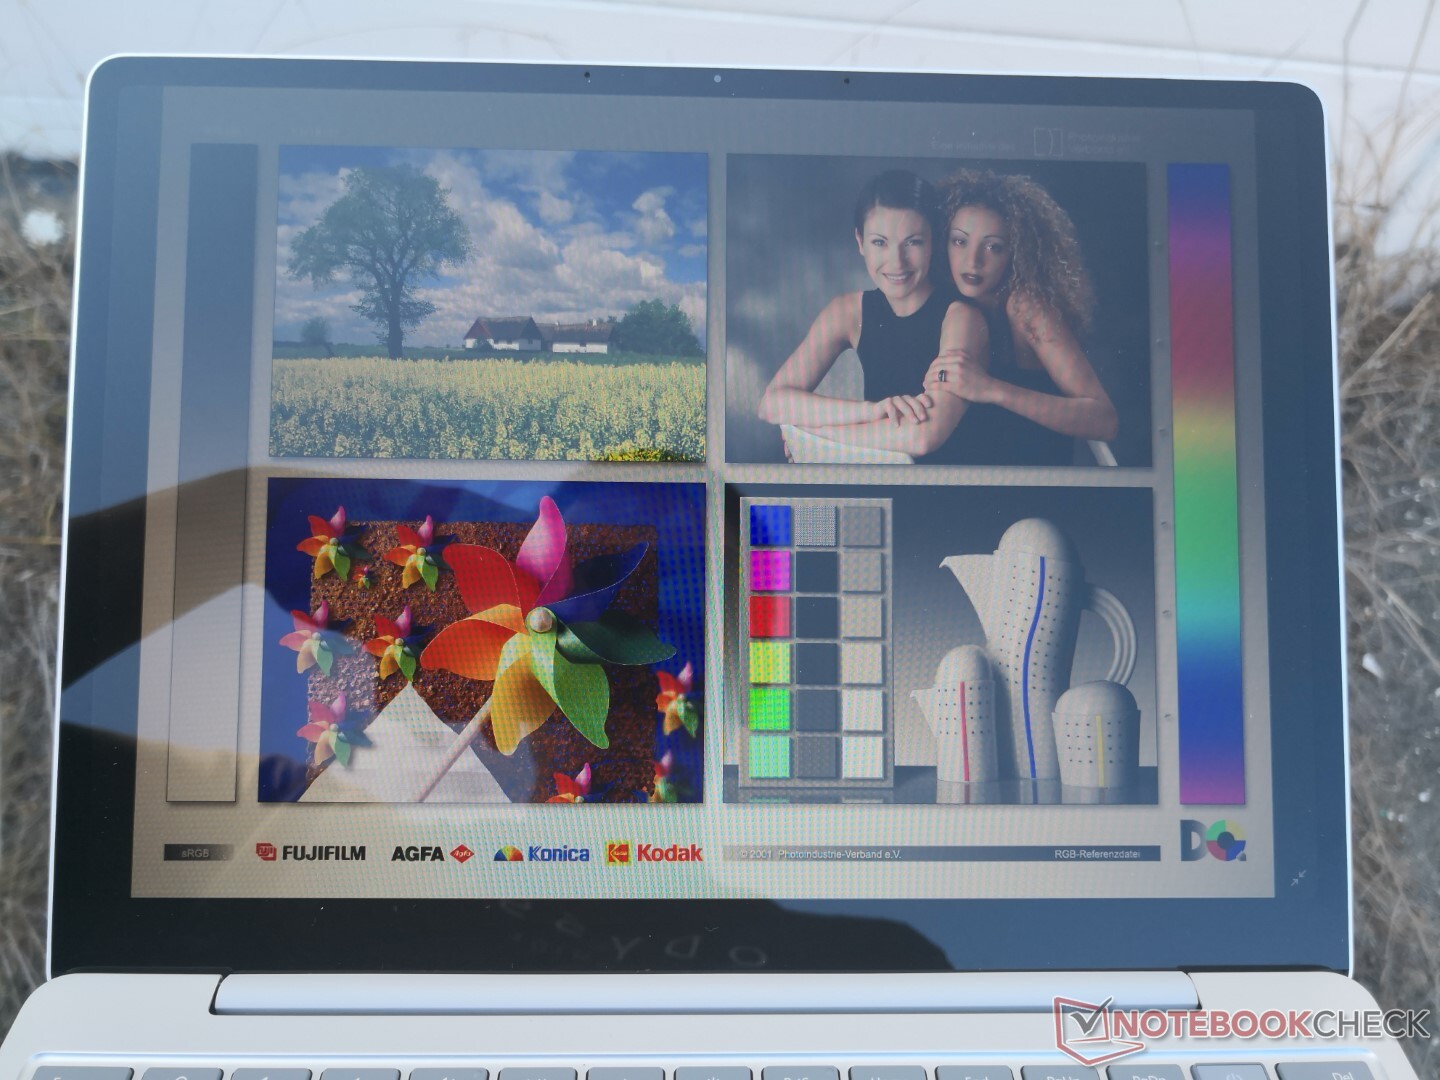
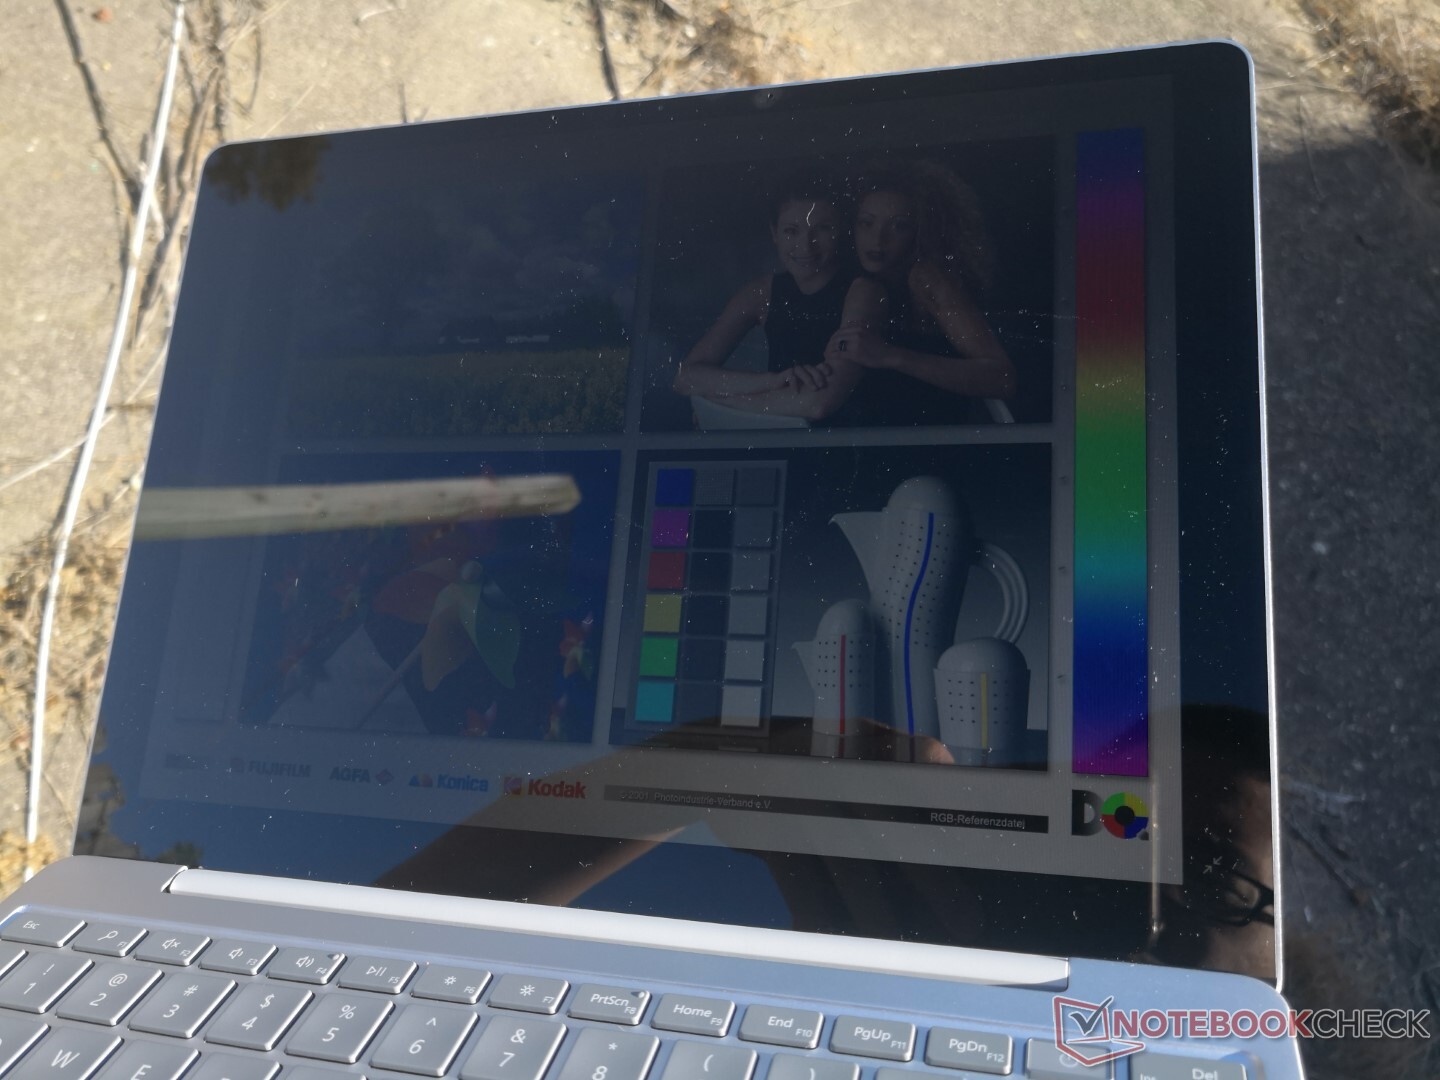
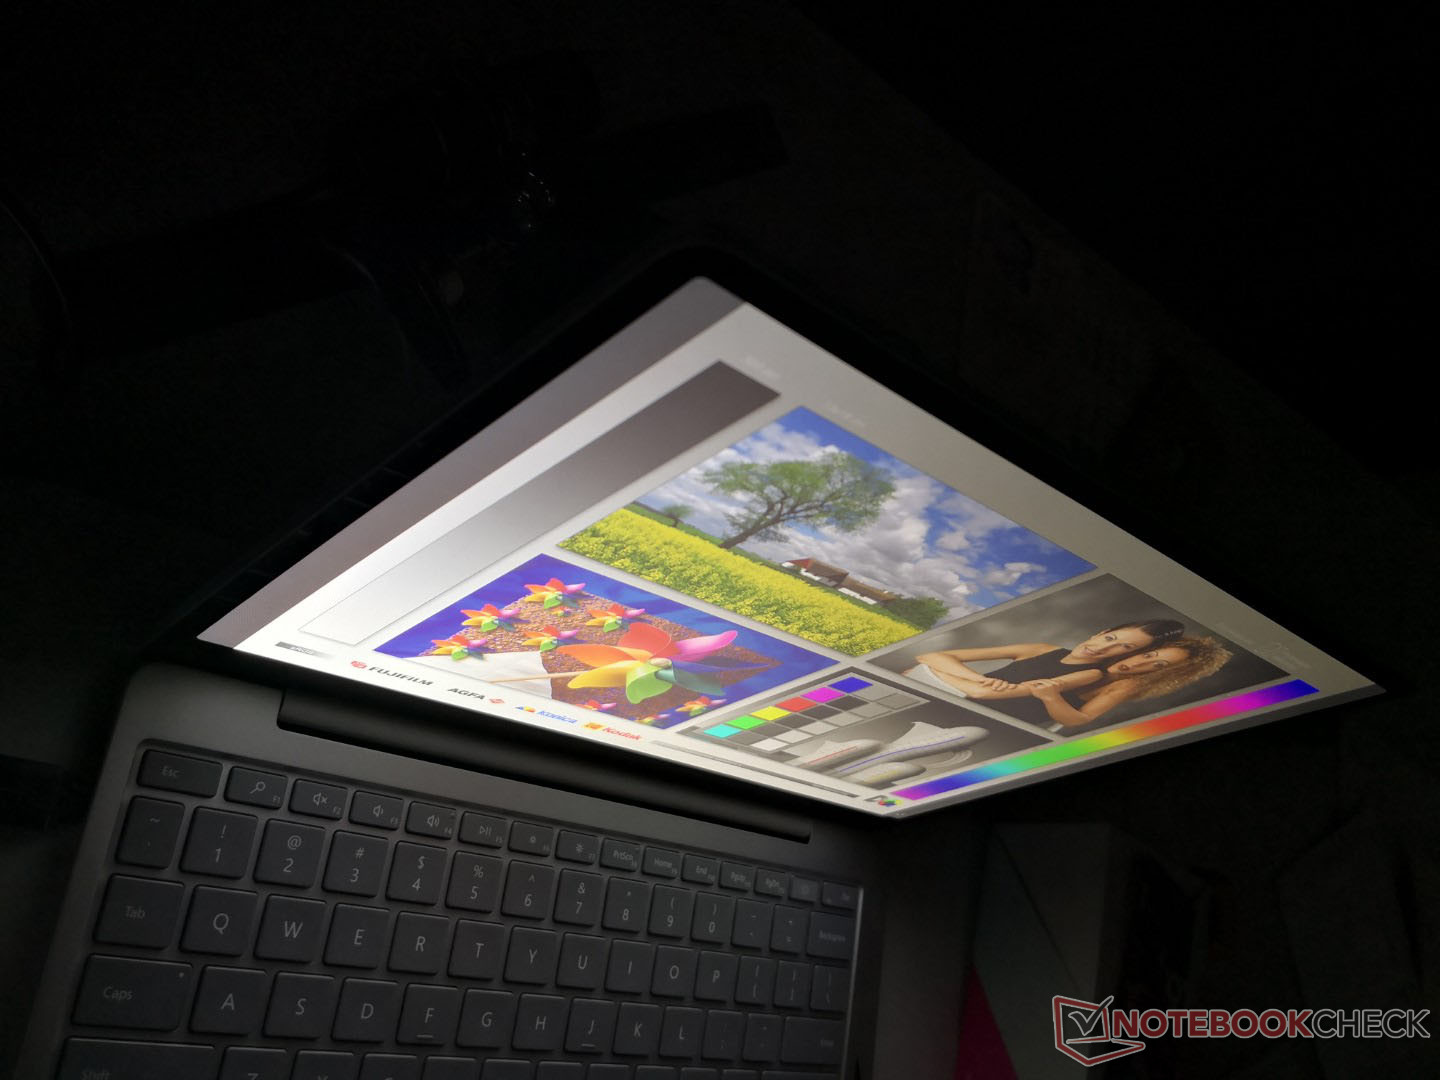
Het display is niet alleen dimmer dan de 13,5-inch Surface Laptop 3, maar ook dimmer dan de meeste andere mid-range tot high-end subnotebooks, waaronder de ZenBook S, MacBook Pro 13, XPS 13 en de MateBook X Pro. Schittering is altijd aanwezig, zelfs als je in de schaduw werkt.
Prestaties
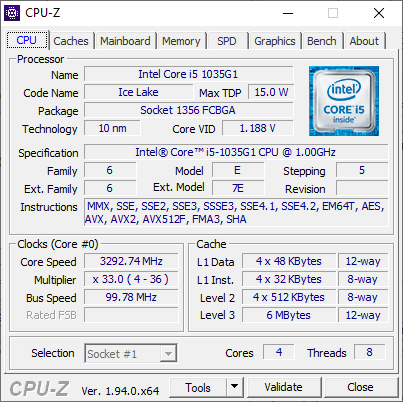
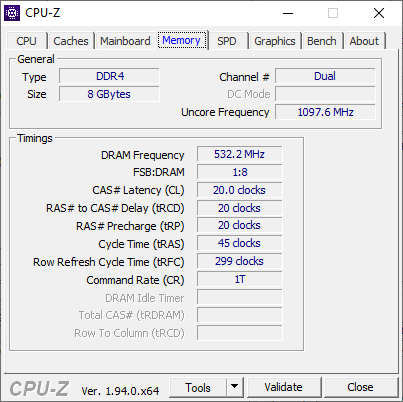
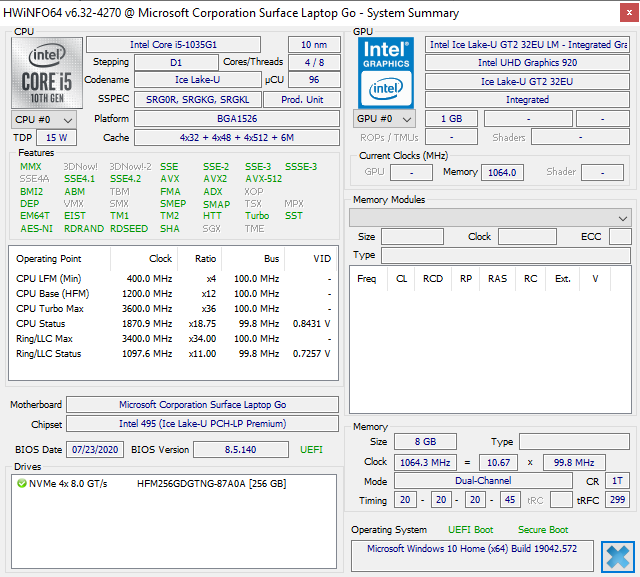
In tegenstelling tot de meeste andere laptops zijn Surface Laptop Go SKU's gescheiden door RAM en opslag, terwijl de Core i5 CPU, UHD Graphics G1 GPU en beeldschermresolutie vast blijven. De meest betaalbare configuratie wordt geleverd met slechts 4 GB RAM en 64 GB aan opslagruimte, die lezen als de specificaties van een budgettablet. RAM is vast op alle SKU's en daarom raden wij aan om minimaal 8 GB RAM te overwegen
Verwerker
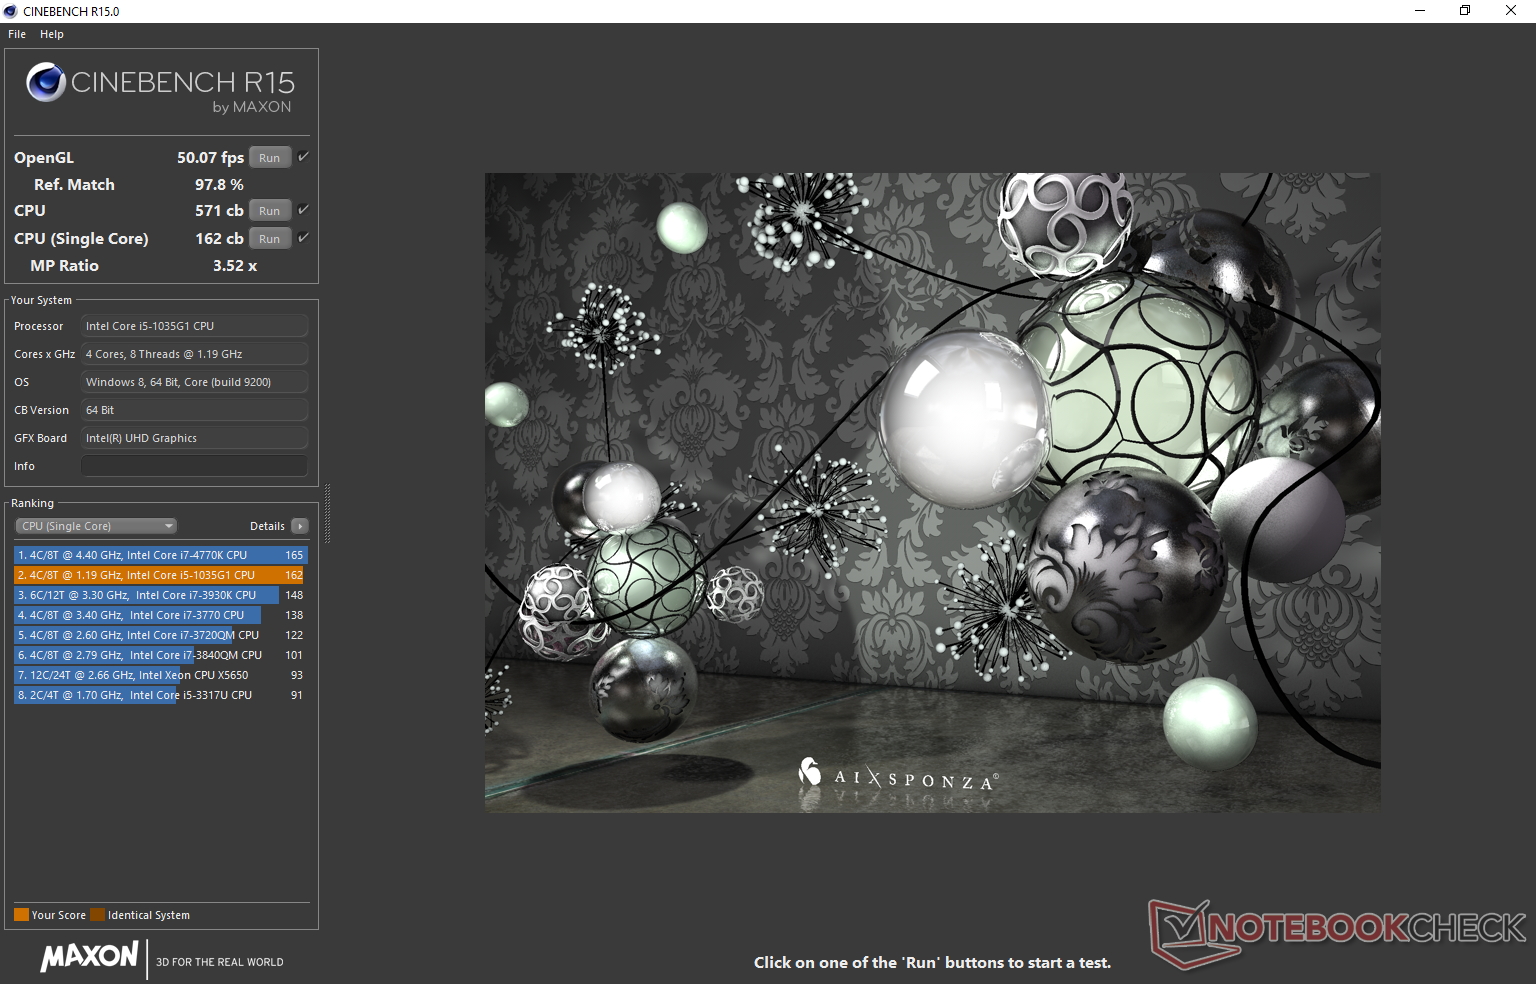
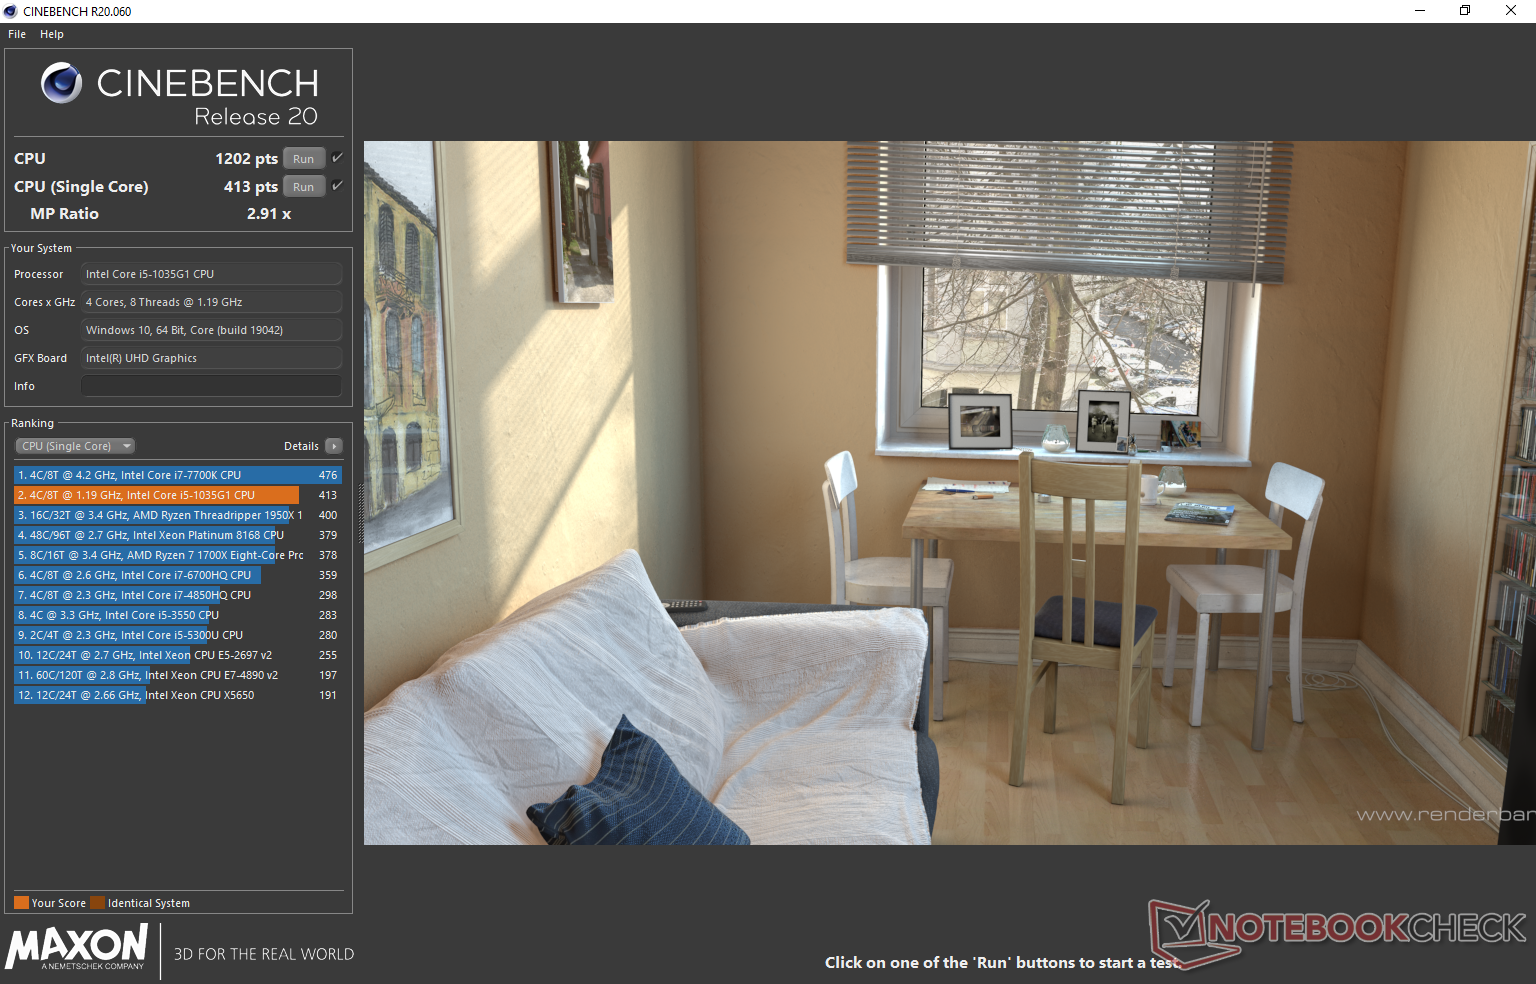
De multi-draadsprestaties zijn ongeveer 15 procent langzamer dan de gemiddelde laptop in onze database die is uitgerust met dezelfde Core i5-1035G1 CPU. De ondermaatse Turbo Boost is hier de schuld van, zoals blijkt uit onze CineBench R15 xT-lus testresultaten hieronder waar de initiële score van 527 punten zou dalen met bijna 11 procent door de tweede lus. Zelfs de goedkopere AMD Ryzen 3 4300U is in staat om de Core i5-1035G1 in onze geteste benchmarks te overtreffen of te evenaren. Over het algemeen zijn de prestaties nog steeds vrij goed ten opzichte van de Core i7 CPU's zoals de Core i7-10510U of oudere Core i7-8565U.
Cinebench R15: CPU Multi 64Bit | CPU Single 64Bit
Blender: v2.79 BMW27 CPU
7-Zip 18.03: 7z b 4 -mmt1 | 7z b 4
Geekbench 5.5: Single-Core | Multi-Core
HWBOT x265 Benchmark v2.2: 4k Preset
LibreOffice : 20 Documents To PDF
R Benchmark 2.5: Overall mean
Cinebench R15: CPU Multi 64Bit | CPU Single 64Bit
Blender: v2.79 BMW27 CPU
7-Zip 18.03: 7z b 4 -mmt1 | 7z b 4
Geekbench 5.5: Single-Core | Multi-Core
HWBOT x265 Benchmark v2.2: 4k Preset
LibreOffice : 20 Documents To PDF
R Benchmark 2.5: Overall mean
* ... kleiner is beter
Prestaties van het systeem
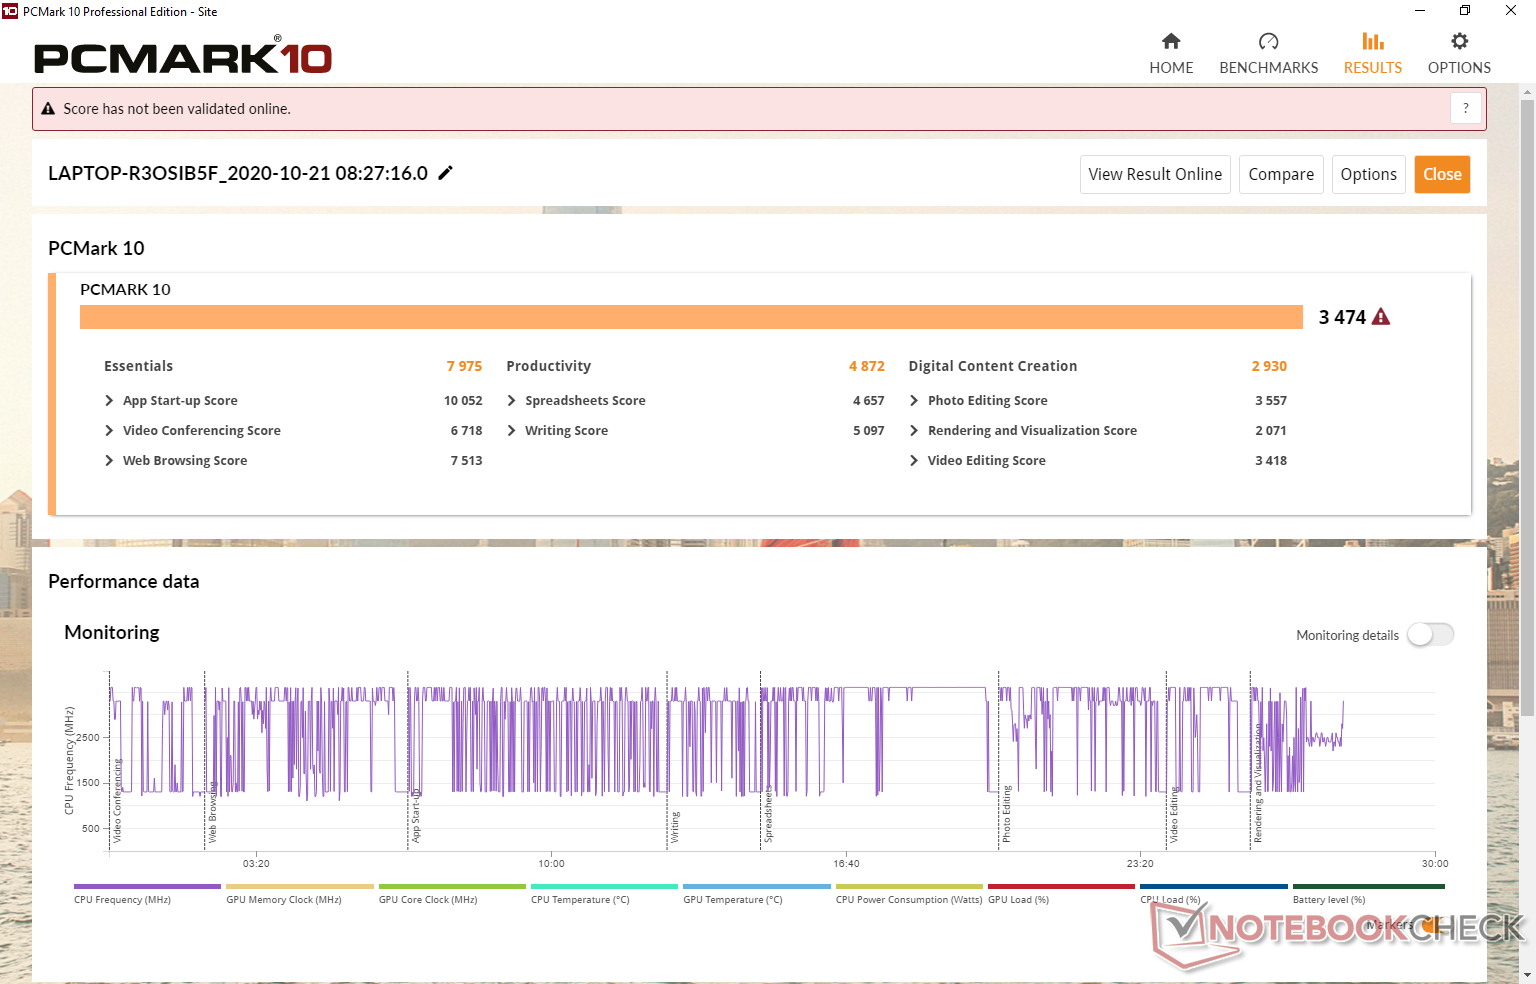
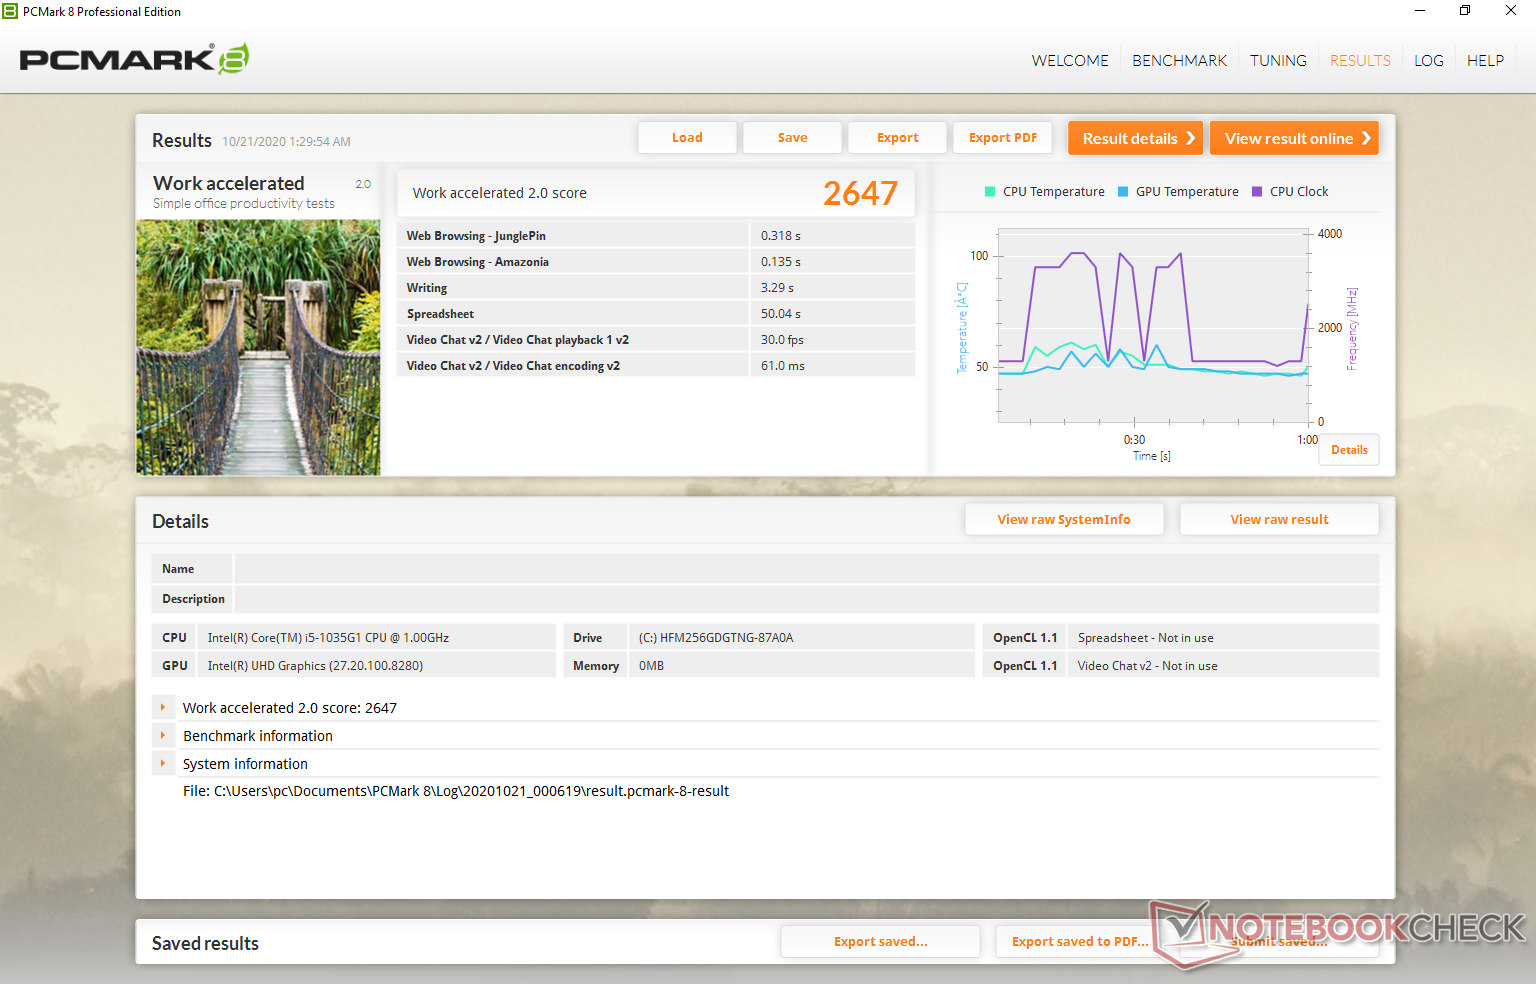
De resultaten van PCMark zijn consistent langzamer dan de gemiddelde laptop in onze database die is uitgerust met dezelfde Core i5-1035G1 CPU. We vermoeden dat zowel de langzamer dan gemiddelde CPU als de trage NVMe SSD belangrijke factoren zijn die bijdragen aan de lage PCMark-aantallen.
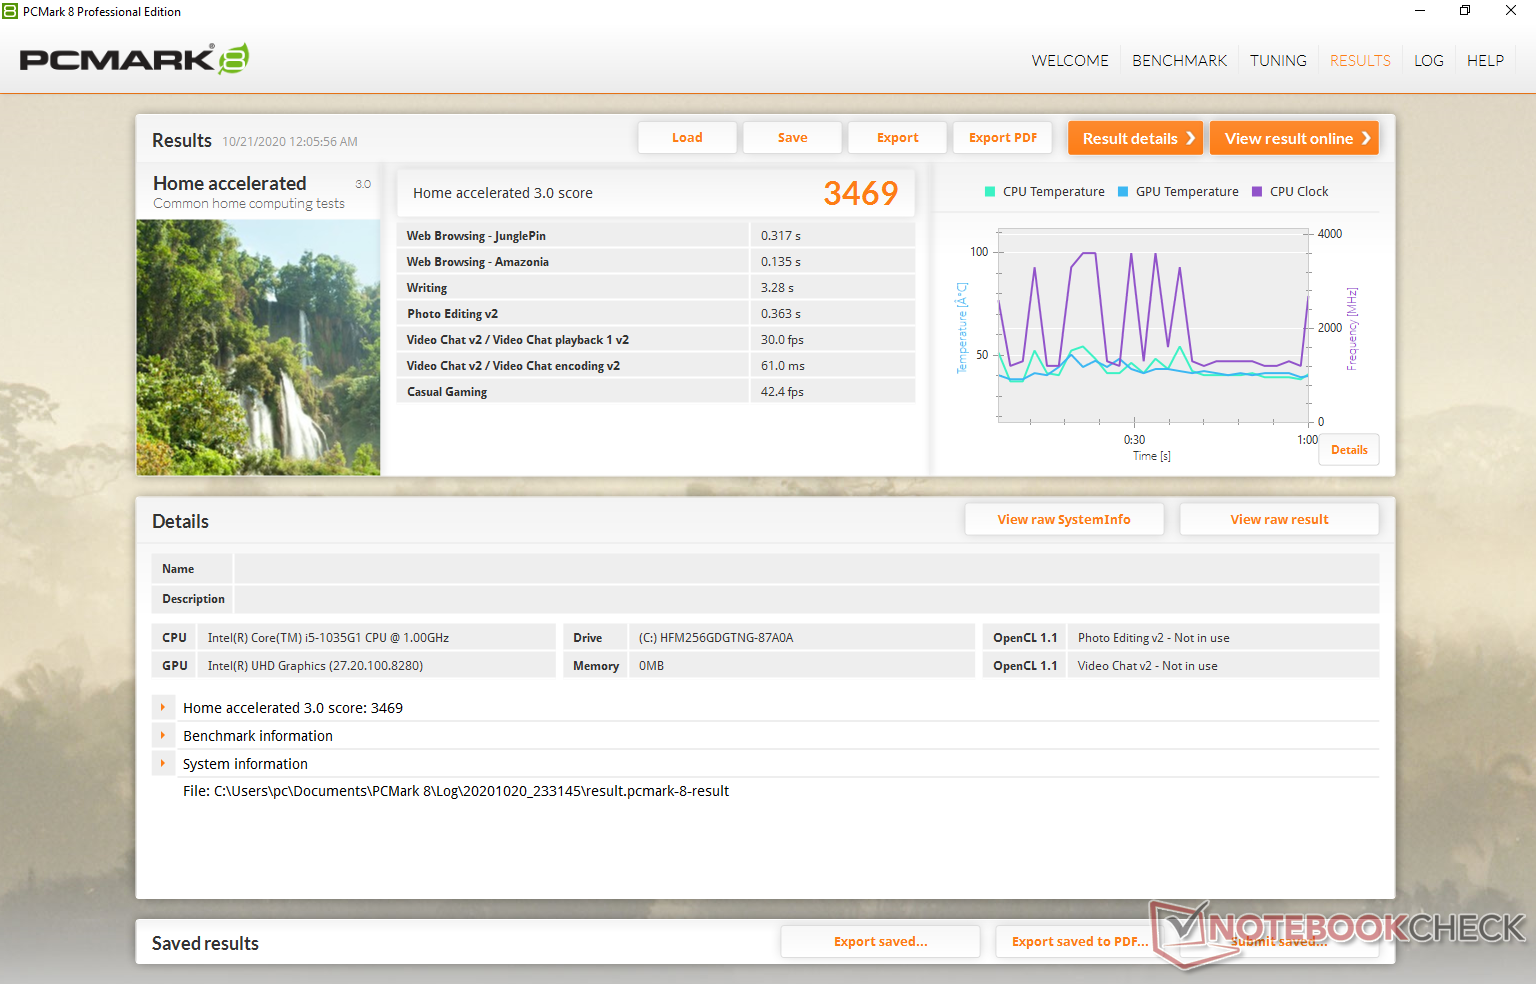
| PCMark 8 Home Score Accelerated v2 | 3469 punten | |
| PCMark 8 Work Score Accelerated v2 | 2647 punten | |
| PCMark 10 Score | 3474 punten | |
Help | ||
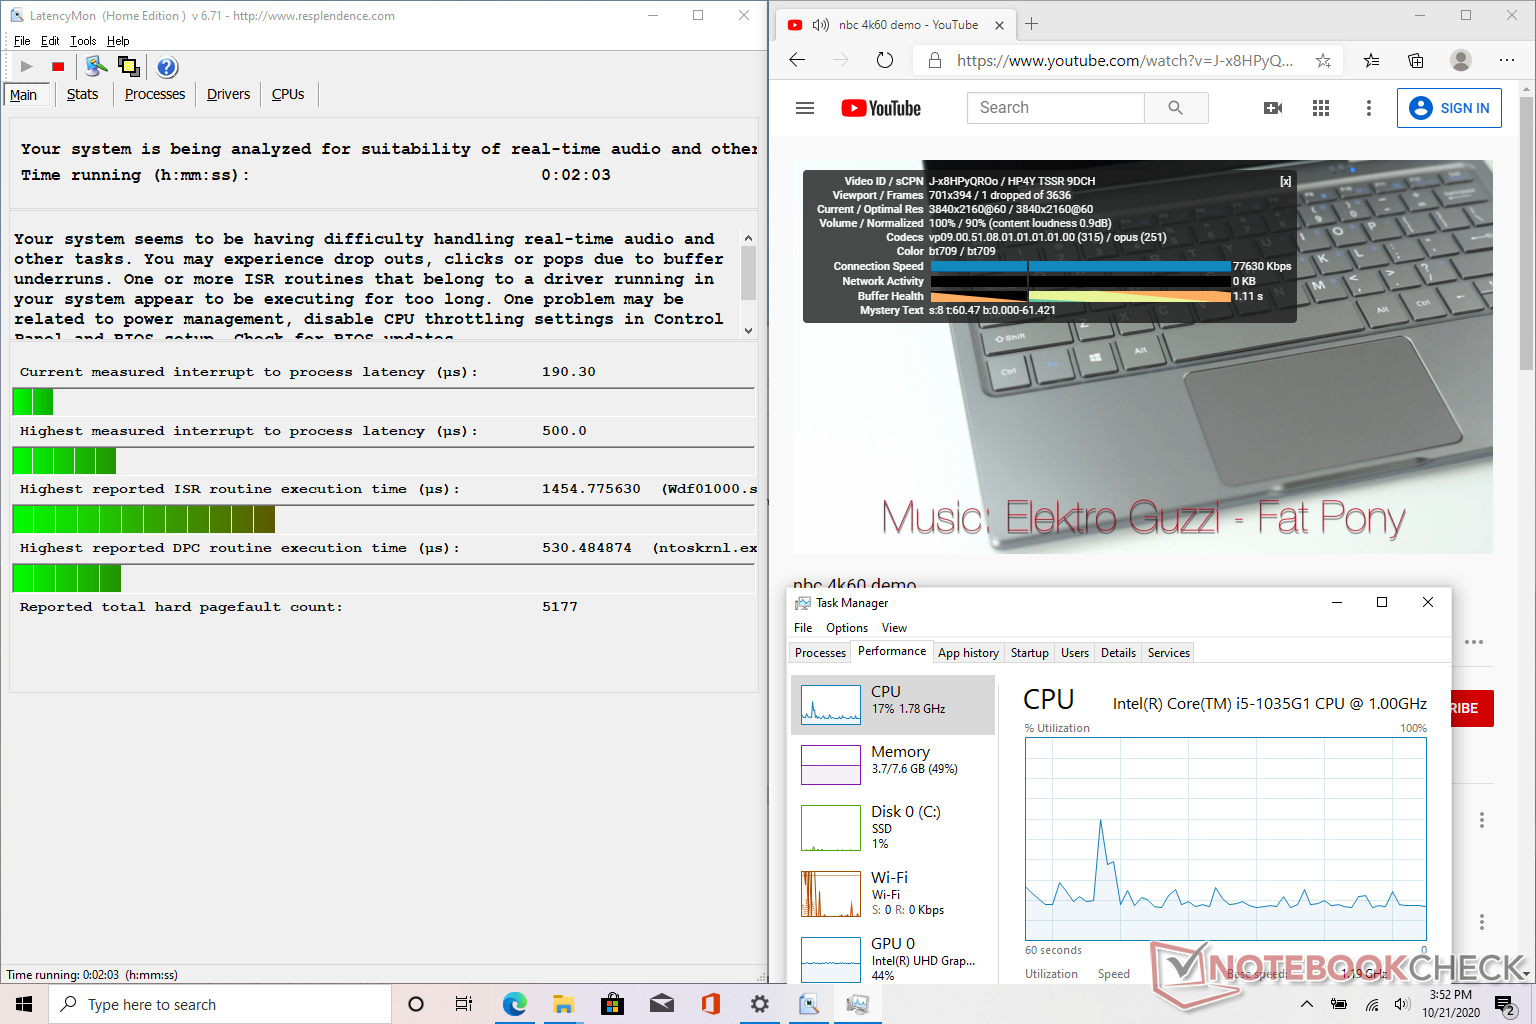
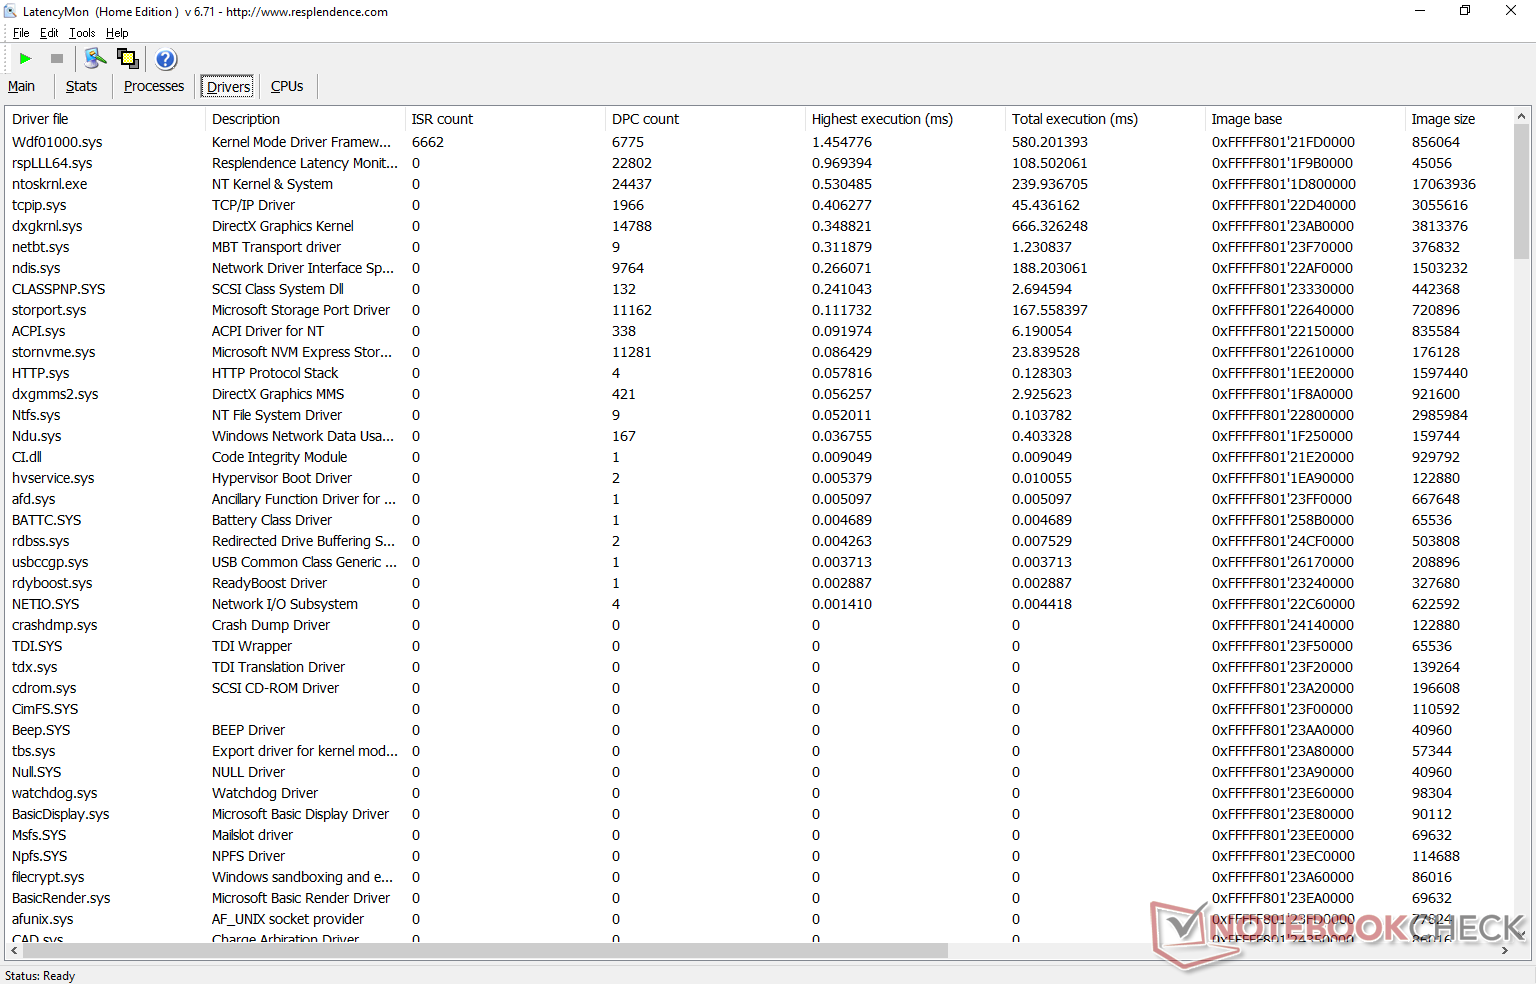
DPC vertraging
LatencyMon laat kleine DPC latentieproblemen zien bij het openen van meerdere tabbladen op onze homepage. 4KUHD video afspelen op 60 FPS is anders soepel op YouTube met slechts een gedropte frame tijdens onze minute-long test.
| DPC Latencies / LatencyMon - interrupt to process latency (max), Web, Youtube, Prime95 | |
| Asus Zenbook S UX393JA | |
| HP EliteBook 830 G7 | |
| Microsoft Surface Laptop Go Core i5 | |
* ... kleiner is beter
Opslagapparaten
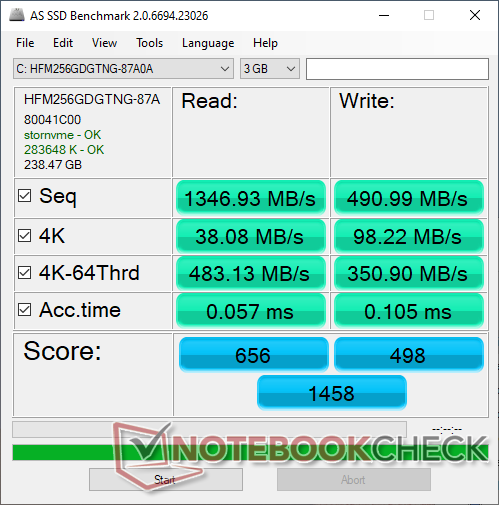
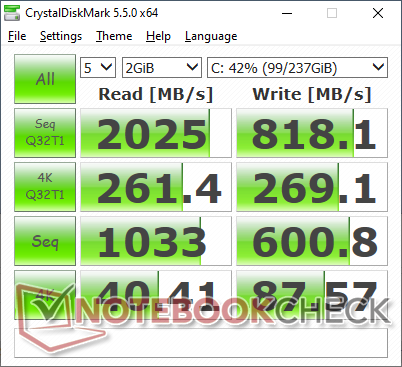
De Surface Laptop Go maakt gebruik van dezelfde SK Hynix 256 GB NVMe SSD als op de 13,5 inch Surface Laptop 3 is aangetroffen. Terwijl de sequentiële leessnelheden fatsoenlijk zijn, zijn de schrijfsnelheden voor zijn categorie traag met slechts ongeveer 500 MB/s. Dit zal gelukkig geen knelpunt zijn gezien de Core i5 CPU en de zwakke geïntegreerde GPU. Zie onze tabel met SSD's en HDD's voor meer benchmarkvergelijkingen
Merk op dat SKU's met 64 GB aan opslagruimte SSD's hebben gesoldeerd. Gebruikers zullen dus moeten upgraden naar ten minste de 128 GB SKU's voor verwijderbare M.2 SSD's.
| Microsoft Surface Laptop Go Core i5 SK hynix BC501 HFM256GDGTNG | Asus Zenbook S UX393JA Intel SSD 660p 1TB SSDPEKNW010T8 | Microsoft Surface Laptop 3 13 Core i5-1035G7 SK hynix BC501 HFM256GDGTNG | Huawei MateBook X Pro 2020 i7 Samsung PM981a MZVLB1T0HBLR | Apple MacBook Pro 13 2020 2GHz i5 10th-Gen Apple SSD SM0512F | |
|---|---|---|---|---|---|
| AS SSD | 73% | 4% | 182% | -15% | |
| Seq Read (MB/s) | 1347 | 1405 4% | 1387 3% | 2737 103% | 1300 -3% |
| Seq Write (MB/s) | 491 | 1062 116% | 504 3% | 2530 415% | 1518 209% |
| 4K Read (MB/s) | 38.08 | 50.8 33% | 42.35 11% | 54 42% | 14.09 -63% |
| 4K Write (MB/s) | 98.2 | 124.9 27% | 120 22% | 152.5 55% | 24.25 -75% |
| 4K-64 Read (MB/s) | 483.1 | 590 22% | 497.4 3% | 2011 316% | 725 50% |
| 4K-64 Write (MB/s) | 350.9 | 840 139% | 354.9 1% | 1260 259% | 169.6 -52% |
| Access Time Read * (ms) | 0.057 | 0.041 28% | 0.055 4% | 0.066 -16% | 0.172 -202% |
| Access Time Write * (ms) | 0.105 | 0.118 -12% | 0.093 11% | 0.024 77% | 0.155 -48% |
| Score Read (Points) | 656 | 781 19% | 678 3% | 2339 257% | 869 32% |
| Score Write (Points) | 498 | 1071 115% | 525 5% | 1666 235% | 346 -31% |
| Score Total (Points) | 1458 | 2251 54% | 1520 4% | 5191 256% | 1667 14% |
| Copy ISO MB/s (MB/s) | 765 | 1459 91% | 764 0% | ||
| Copy Program MB/s (MB/s) | 299.6 | 600 100% | 256.1 -15% | ||
| Copy Game MB/s (MB/s) | 371.5 | 1411 280% | 368.4 -1% | ||
| CrystalDiskMark 5.2 / 6 | 53% | 14% | 113% | 29% | |
| Write 4K (MB/s) | 87.6 | 129.5 48% | 112.3 28% | 165.6 89% | 28.16 -68% |
| Read 4K (MB/s) | 40.41 | 54 34% | 42.13 4% | 50.2 24% | 17.5 -57% |
| Write Seq (MB/s) | 601 | 1265 110% | 630 5% | 1905 217% | 1195 99% |
| Read Seq (MB/s) | 1033 | 1410 36% | 1023 -1% | 1669 62% | 1470 42% |
| Write 4K Q32T1 (MB/s) | 269.1 | 420.3 56% | 336.6 25% | 474.6 76% | 205 -24% |
| Read 4K Q32T1 (MB/s) | 261.4 | 357.7 37% | 399.6 53% | 508 94% | 692 165% |
| Write Seq Q32T1 (MB/s) | 818 | 1799 120% | 821 0% | 3007 268% | 1475 80% |
| Read Seq Q32T1 (MB/s) | 2025 | 1616 -20% | 2030 0% | 3556 76% | 1920 -5% |
| Totaal Gemiddelde (Programma / Instellingen) | 63% /
65% | 9% /
8% | 148% /
153% | 7% /
3% |
* ... kleiner is beter

Disk Throttling: DiskSpd Read Loop, Queue Depth 8
GPU-prestaties
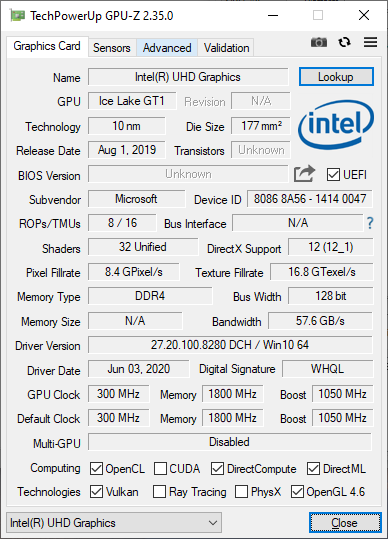
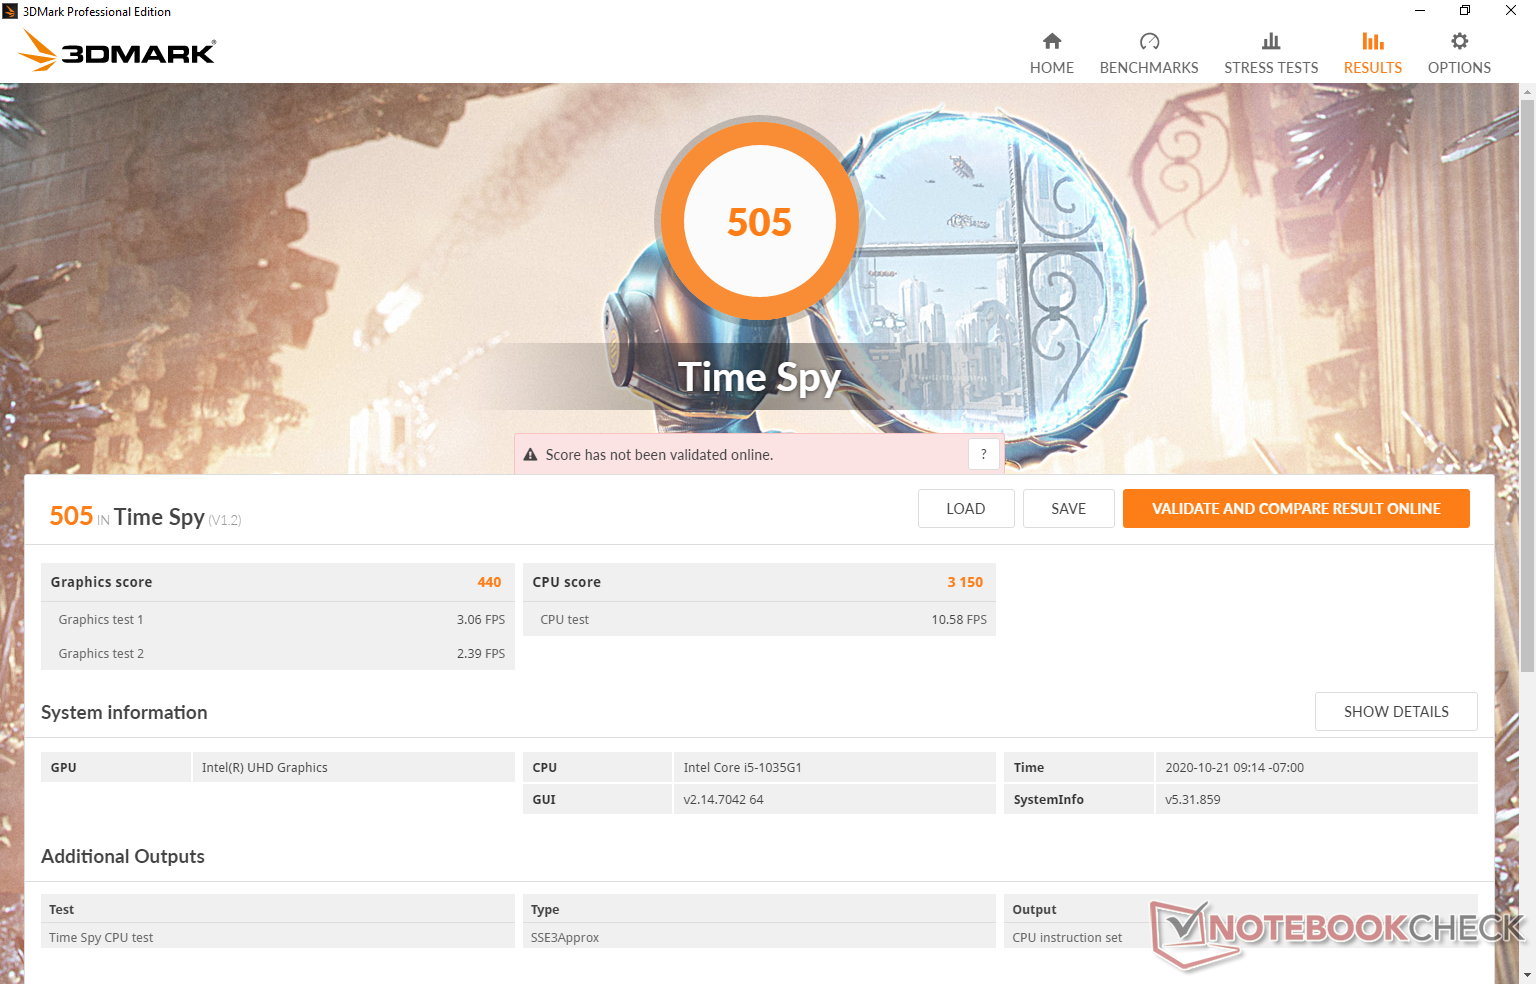
De grafische prestaties zijn teleurstellend. 3DMark rangschikt de UHD Graphics G1 als zijnde in wezen hetzelfde als de jarenlange UHD Graphics 620. Als u het meeste van Ice Lake wilt, gaat u een laptop met de Core i5-1035G7 of Core i7-1065G7 willen overwegen, zoals de Surface Laptop 3 15, waar de grafische prestaties 80 tot 90 procent sneller kunnen zijn. De Surface Laptop gaat maximaal uit op alleen de Core i5-1035G1.
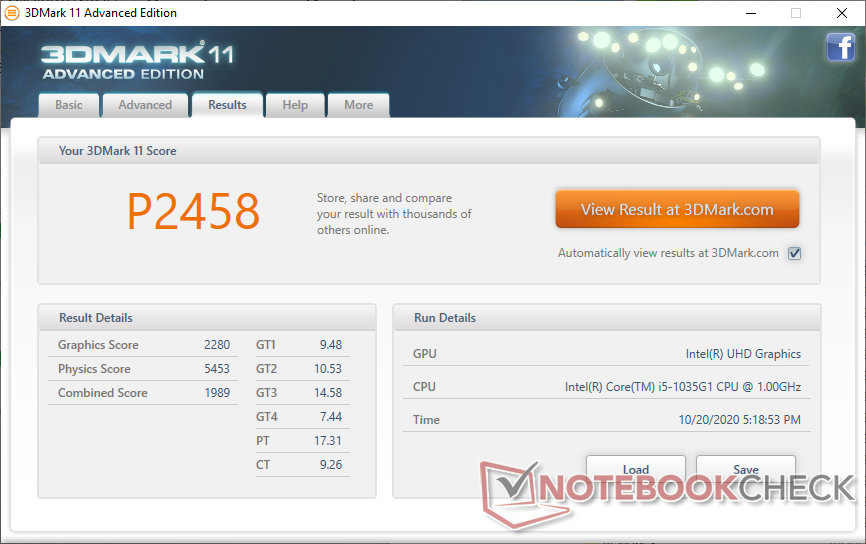
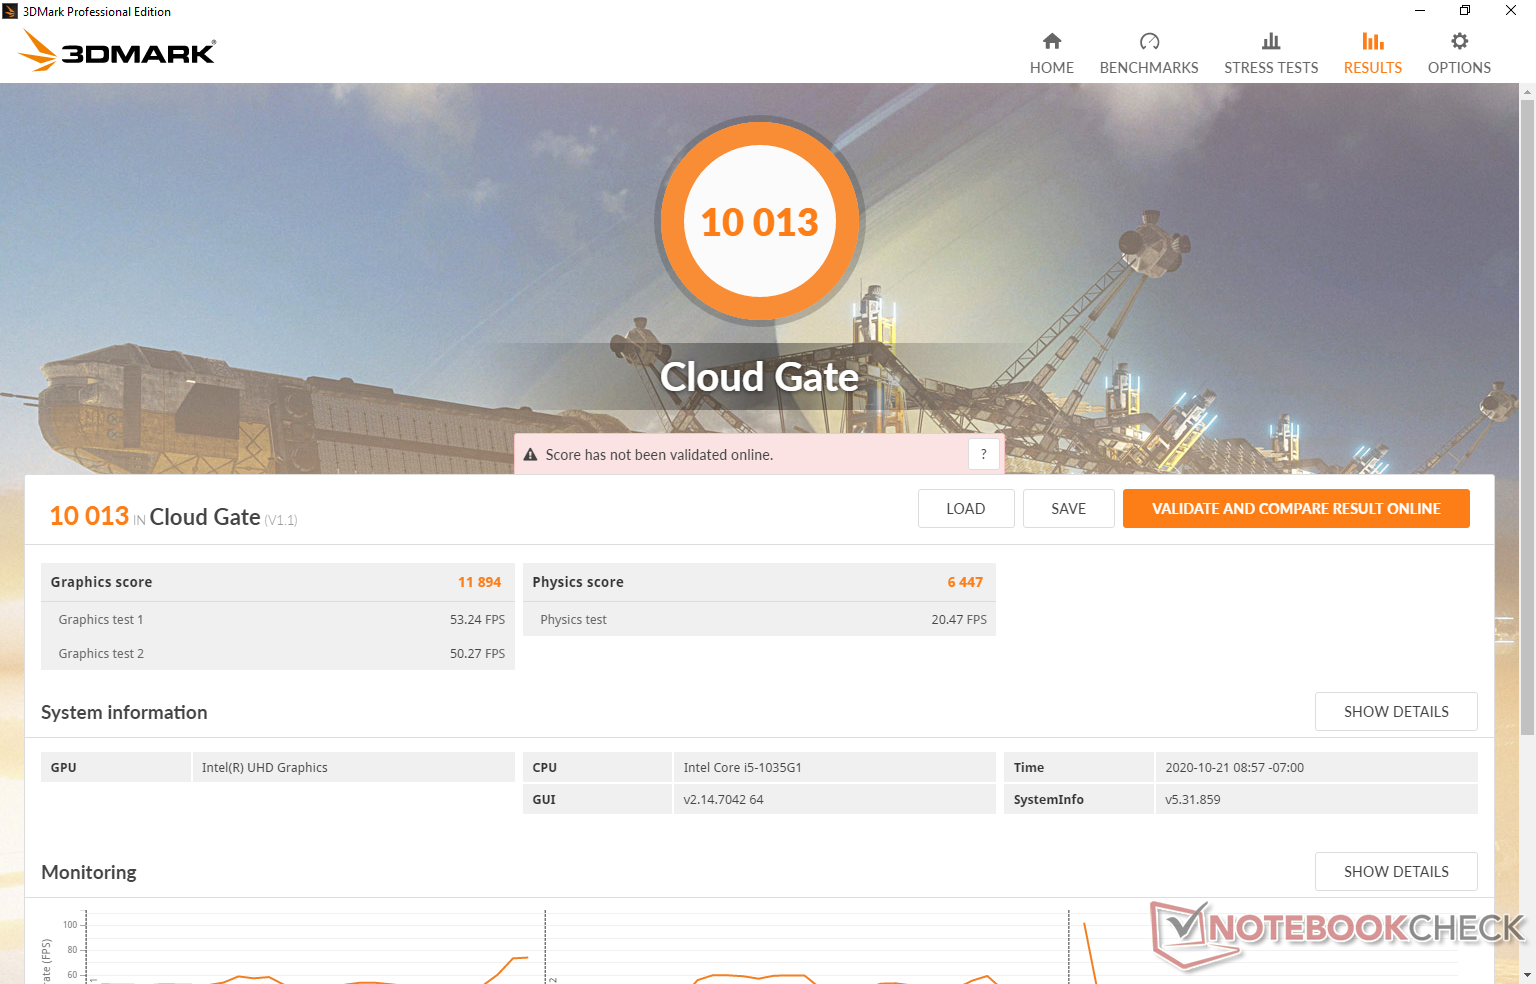
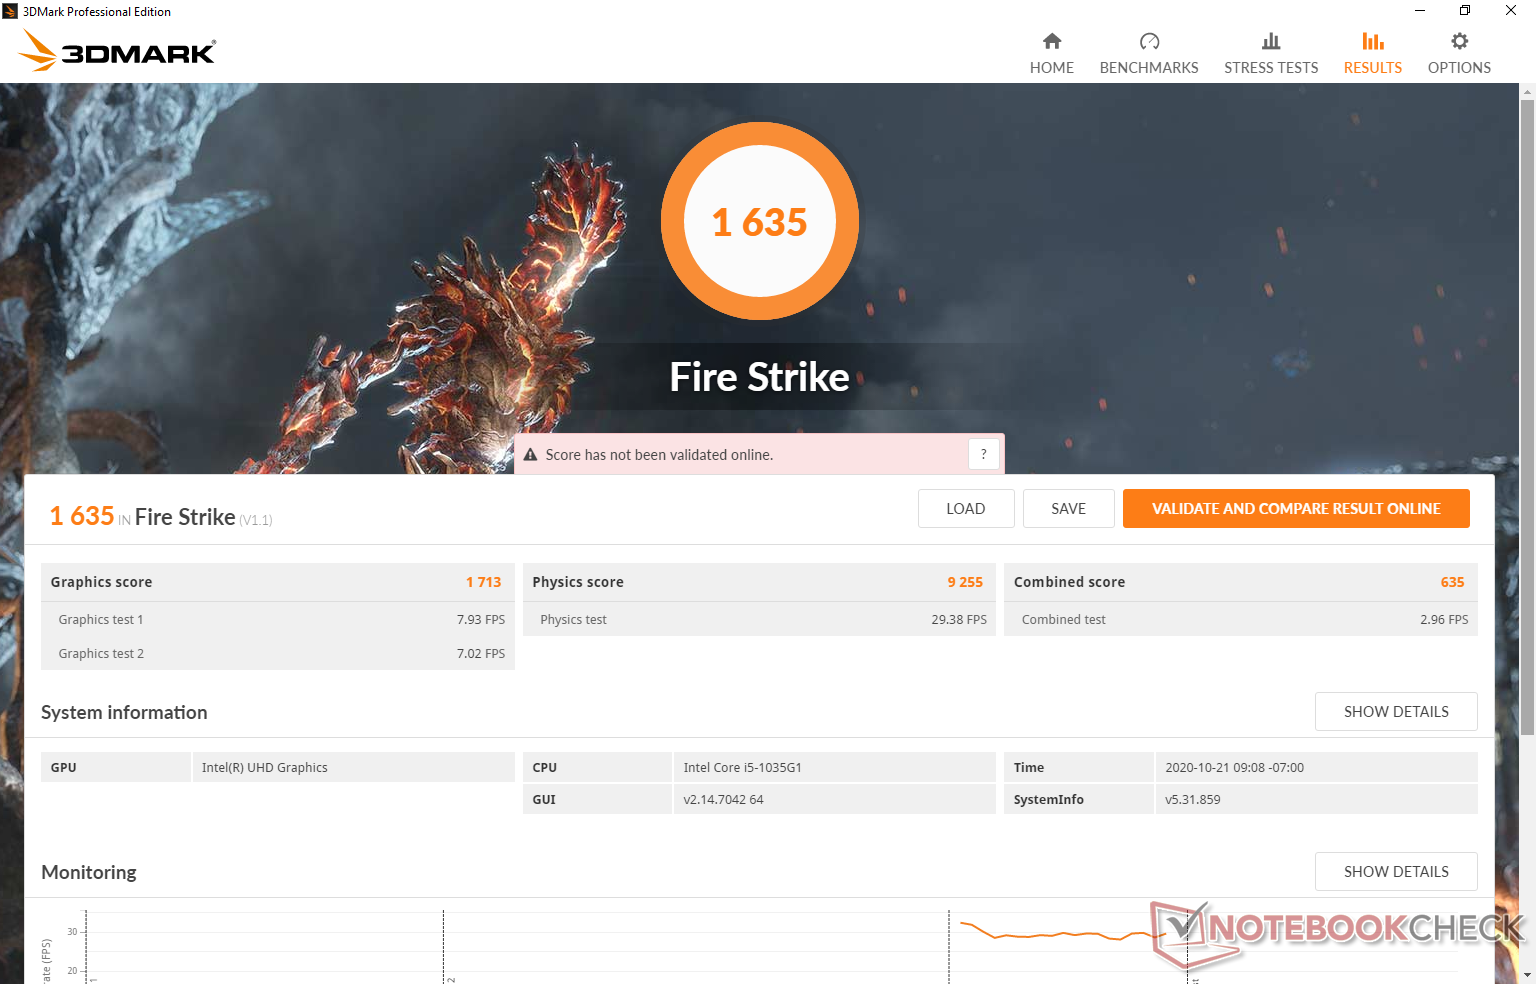
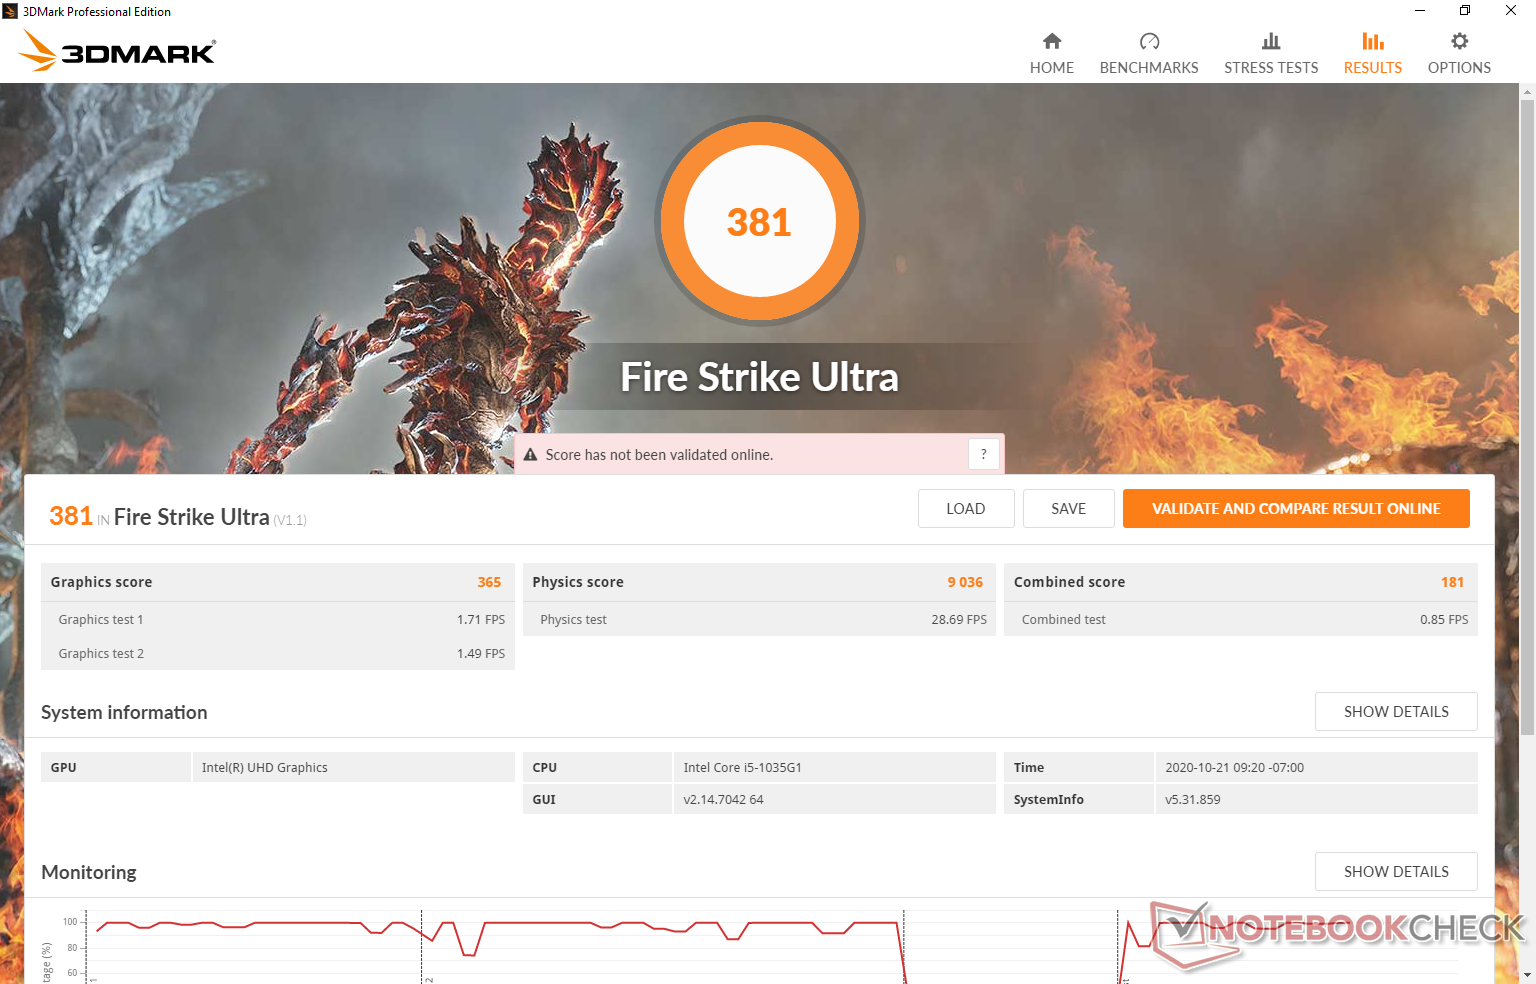
| 3DMark 11 Performance | 2458 punten | |
| 3DMark Cloud Gate Standard Score | 10013 punten | |
| 3DMark Fire Strike Score | 1635 punten | |
| 3DMark Time Spy Score | 505 punten | |
Help | ||
| lage | gem. | hoge | ultra | |
|---|---|---|---|---|
| Dota 2 Reborn (2015) | 78.1 | 40.1 | 23.5 | 21.4 |
| Final Fantasy XV Benchmark (2018) | 15.1 | 7.49 | 5.21 | |
| X-Plane 11.11 (2018) | 17.3 | 10.4 | 10.8 |
Emissions
Systeemgeluid
De interne ventilator is stil voor de meeste typische werklasten zoals surfen op het web of e-mailen. In feite is het systeem in staat om stil te blijven tijdens de eerste 90-seconden benchmark scene van 3DMark 06. Desalniettemin zal het uitvoeren van intensieve taken waarbij het CPU-gebruik constant hoog is, ervoor zorgen dat het geluid van de ventilator tot 44 dB(A) iets luider is dan we zouden willen.
| Microsoft Surface Laptop Go Core i5 UHD Graphics G1 (Ice Lake 32 EU), i5-1035G1, SK hynix BC501 HFM256GDGTNG | Asus Zenbook S UX393JA Iris Plus Graphics G7 (Ice Lake 64 EU), i7-1065G7, Intel SSD 660p 1TB SSDPEKNW010T8 | Microsoft Surface Laptop 3 13 Core i5-1035G7 Iris Plus Graphics G7 (Ice Lake 64 EU), i5-1035G7, SK hynix BC501 HFM256GDGTNG | Huawei MateBook X Pro 2020 i7 GeForce MX250, i7-10510U, Samsung PM981a MZVLB1T0HBLR | Apple MacBook Pro 13 2020 2GHz i5 10th-Gen Iris Plus Graphics G7 (Ice Lake 64 EU), i5-1038NG7, Apple SSD SM0512F | |
|---|---|---|---|---|---|
| Noise | -3% | 0% | -7% | -6% | |
| uit / omgeving * (dB) | 26.4 | 26.9 -2% | 28.5 -8% | 29.6 -12% | 29.6 -12% |
| Idle Minimum * (dB) | 26.4 | 26.9 -2% | 28.5 -8% | 29.6 -12% | 29.6 -12% |
| Idle Average * (dB) | 26.4 | 29 -10% | 28.5 -8% | 29.6 -12% | 29.6 -12% |
| Idle Maximum * (dB) | 26.4 | 31.1 -18% | 28.5 -8% | 30.3 -15% | 29.6 -12% |
| Load Average * (dB) | 36.9 | 37.7 -2% | 28.5 23% | 38 -3% | 34.4 7% |
| Load Maximum * (dB) | 44.2 | 38.1 14% | 40.4 9% | 38 14% | 42.1 5% |
| Witcher 3 ultra * (dB) | 40.2 | 40.4 | 38 | 36.1 |
* ... kleiner is beter
Geluidsniveau
| Onbelast |
| 26.4 / 26.4 / 26.4 dB (A) |
| Belasting |
| 36.9 / 44.2 dB (A) |
 | ||
30 dB stil 40 dB(A) hoorbaar 50 dB(A) luid |
||
min: | ||
Temperatuur
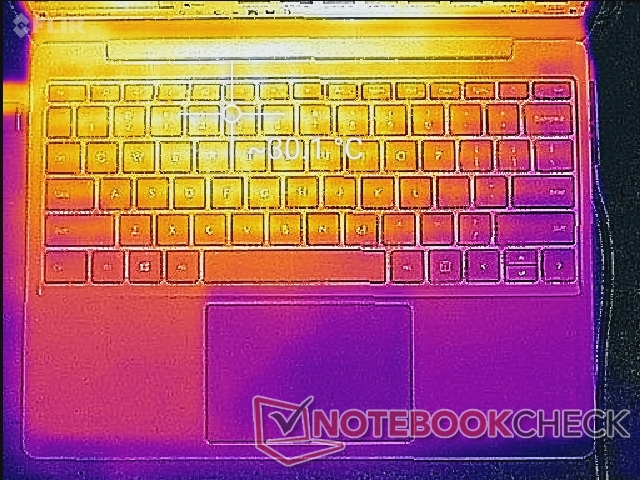
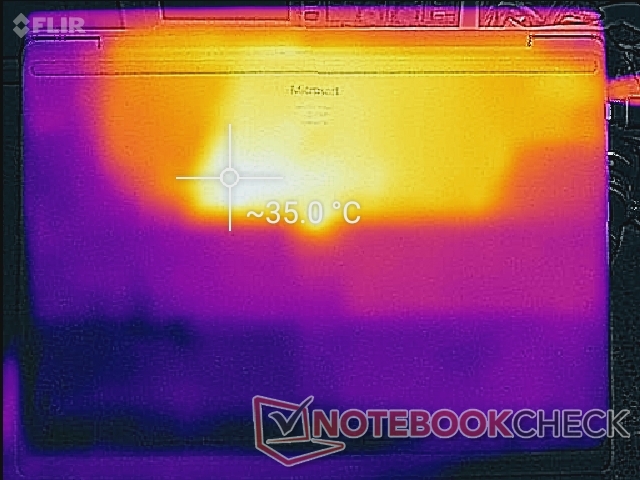
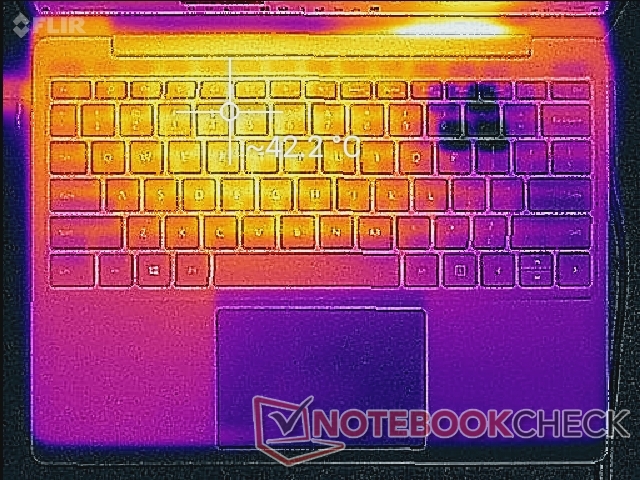
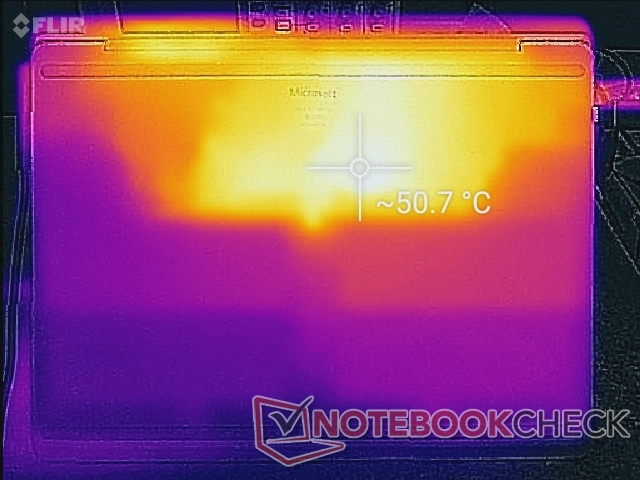
De temperatuurontwikkeling is vergelijkbaar met die van de 13,5-inch Surface Laptop 3 in die zin dat de hotspots zich over het algemeen in dezelfde gebieden bevinden. Het bodemoppervlak kan echter warmer zijn op de Surface Laptop Go bij meer dan 50 C in vergelijking met 45 W op het 13,5-inch model bij vergelijkbare stressvolle omstandigheden. Extra ventilatieroosters op het bodempaneel zouden waarschijnlijk de oppervlaktetemperatuur hebben verbeterd, maar Microsoft heeft waarschijnlijk aangedrongen op een "schoon" minimalistisch ontwerp zonder opengewerkte roosters.
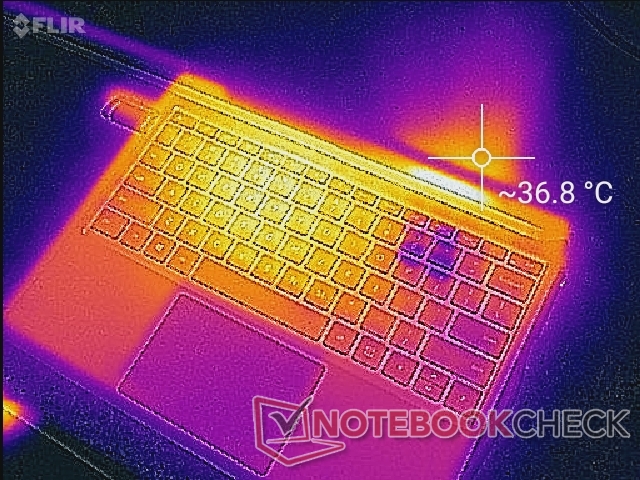
(±) De maximumtemperatuur aan de bovenzijde bedraagt 42 °C / 108 F, vergeleken met het gemiddelde van 35.9 °C / 97 F, variërend van 21.4 tot 59 °C voor de klasse Subnotebook.
(-) De bodem warmt op tot een maximum van 51 °C / 124 F, vergeleken met een gemiddelde van 39.2 °C / 103 F
(+) Bij onbelast gebruik bedraagt de gemiddelde temperatuur voor de bovenzijde 27.3 °C / 81 F, vergeleken met het apparaatgemiddelde van 30.8 °C / 87 F.
(+) De handpalmsteunen en het touchpad bereiken maximaal de huidtemperatuur (32 °C / 89.6 F) en zijn dus niet heet.
(-) De gemiddelde temperatuur van de handpalmsteun van soortgelijke toestellen bedroeg 28.2 °C / 82.8 F (-3.8 °C / -6.8 F).
Stresstest
Bij het uitvoeren van Prime95 zou de CPU ongeveer 50 seconden lang het 2,0 tot 2,4 GHz bereik opvoeren tot een kerntemperatuur van 87 C. De interne ventilator bereikt zijn maximum zodra de kerntemperatuur 85 C bereikt
Het werken op batterijvermogen heeft geen invloed op de prestaties. Een 3DMark 11-test op batterijen zou een score van respectievelijk 7156 en 2411 punten opleveren, vergeleken met 5453 en 2280 punten op het lichtnet.
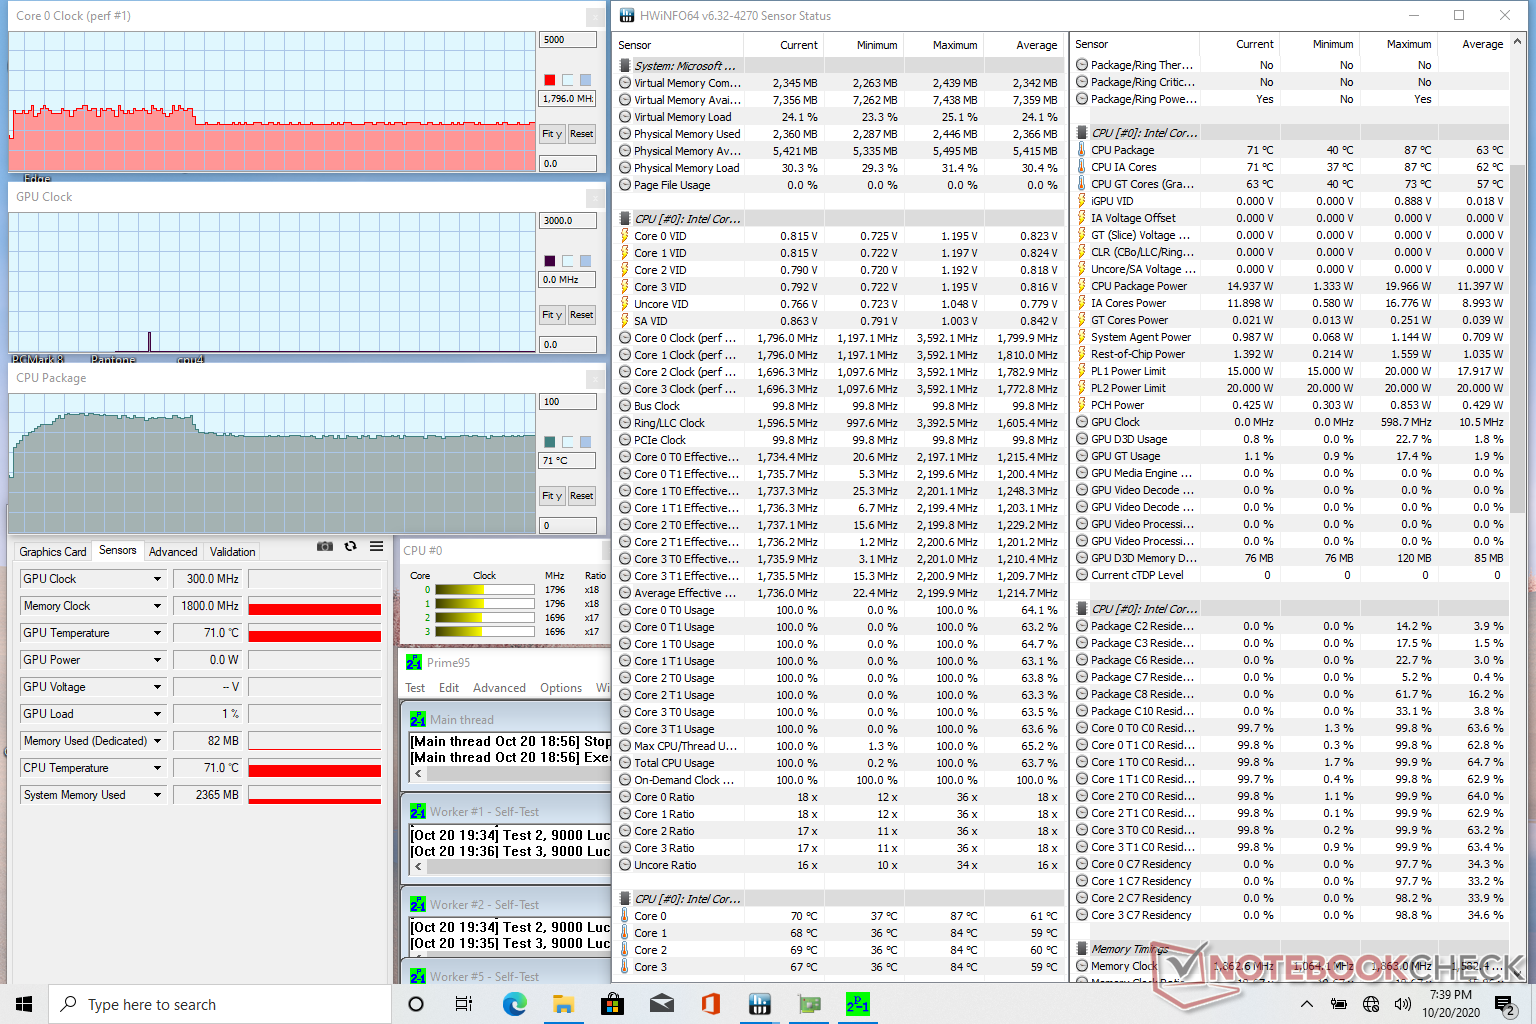
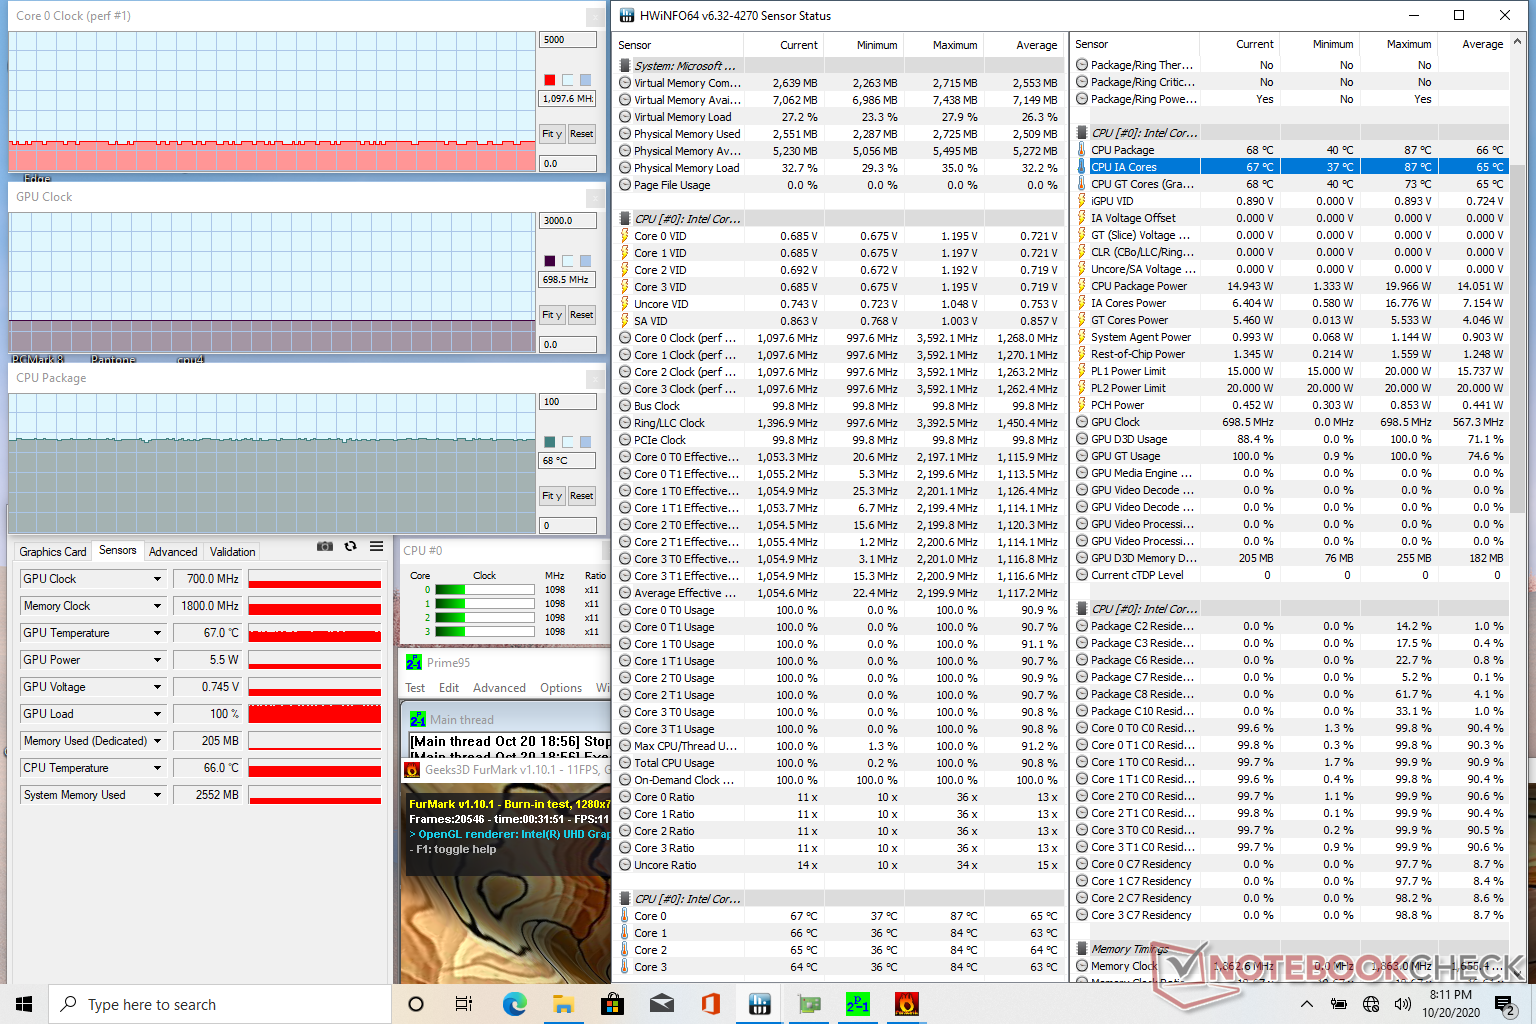
| CPUKlok (GHz) | GPUKlok (MHz) | GemiddeldeCPU-temperatuur (°C) | |
| System Idle | -- | --41 | |
| Prime95 Stress1.7 - 1.8 | --71 | ||
| Prime95 + FurMark Stress | 0.9 - 1.1 | 700 | 68 |
Luidsprekers

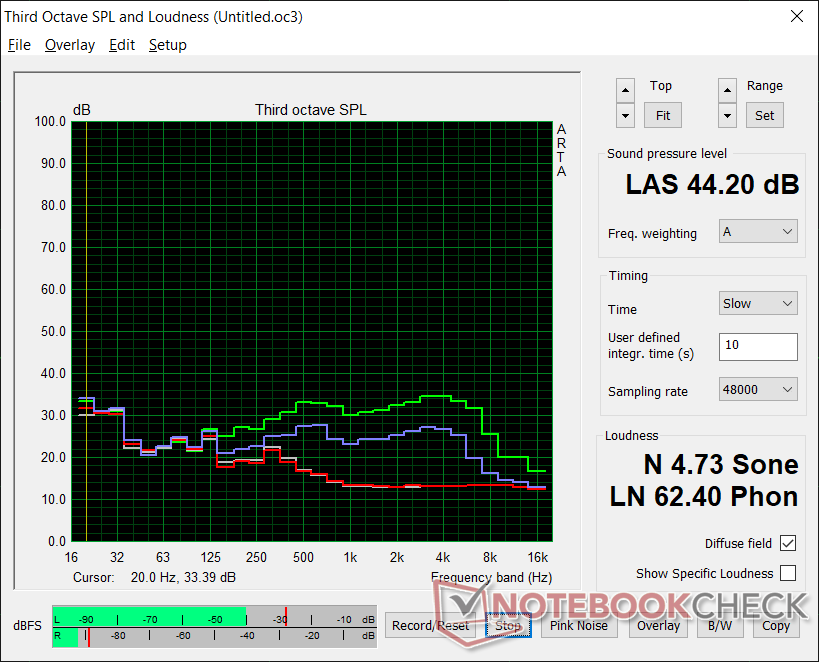
Microsoft Surface Laptop Go Core i5 audioanalyse
(±) | luidspreker luidheid is gemiddeld maar goed (81.5 dB)
Bas 100 - 315 Hz
(±) | verminderde zeebaars - gemiddeld 14.6% lager dan de mediaan
(±) | lineariteit van de lage tonen is gemiddeld (8.1% delta ten opzichte van de vorige frequentie)
Midden 400 - 2000 Hz
(+) | evenwichtige middens - slechts 4.4% verwijderd van de mediaan
(+) | de middentonen zijn lineair (4.1% delta ten opzichte van de vorige frequentie)
Hoog 2 - 16 kHz
(+) | evenwichtige hoogtepunten - slechts 2.8% verwijderd van de mediaan
(+) | de hoge tonen zijn lineair (6.7% delta naar de vorige frequentie)
Algemeen 100 - 16.000 Hz
(+) | het totale geluid is lineair (13.6% verschil met de mediaan)
Vergeleken met dezelfde klasse
» 24% van alle geteste apparaten in deze klasse waren beter, 6% vergelijkbaar, 71% slechter
» De beste had een delta van 5%, het gemiddelde was 18%, de slechtste was 53%
Vergeleken met alle geteste toestellen
» 15% van alle geteste apparaten waren beter, 4% gelijk, 81% slechter
» De beste had een delta van 4%, het gemiddelde was 23%, de slechtste was 134%
Apple MacBook 12 (Early 2016) 1.1 GHz audioanalyse
(+) | luidsprekers kunnen relatief luid spelen (83.6 dB)
Bas 100 - 315 Hz
(±) | verminderde zeebaars - gemiddeld 11.3% lager dan de mediaan
(±) | lineariteit van de lage tonen is gemiddeld (14.2% delta ten opzichte van de vorige frequentie)
Midden 400 - 2000 Hz
(+) | evenwichtige middens - slechts 2.4% verwijderd van de mediaan
(+) | de middentonen zijn lineair (5.5% delta ten opzichte van de vorige frequentie)
Hoog 2 - 16 kHz
(+) | evenwichtige hoogtepunten - slechts 2% verwijderd van de mediaan
(+) | de hoge tonen zijn lineair (4.5% delta naar de vorige frequentie)
Algemeen 100 - 16.000 Hz
(+) | het totale geluid is lineair (10.2% verschil met de mediaan)
Vergeleken met dezelfde klasse
» 7% van alle geteste apparaten in deze klasse waren beter, 2% vergelijkbaar, 90% slechter
» De beste had een delta van 5%, het gemiddelde was 18%, de slechtste was 53%
Vergeleken met alle geteste toestellen
» 5% van alle geteste apparaten waren beter, 1% gelijk, 94% slechter
» De beste had een delta van 4%, het gemiddelde was 23%, de slechtste was 134%
Energy Management
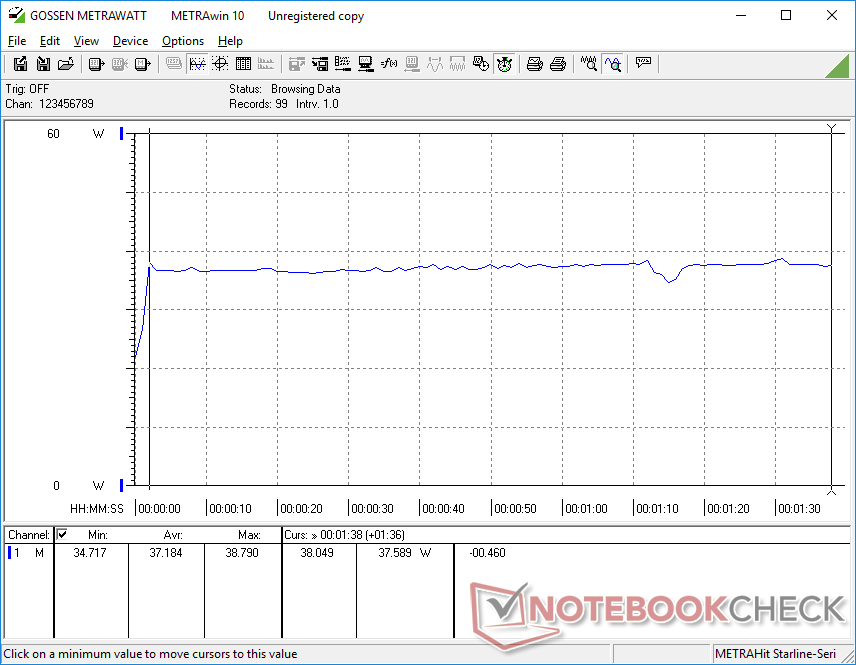
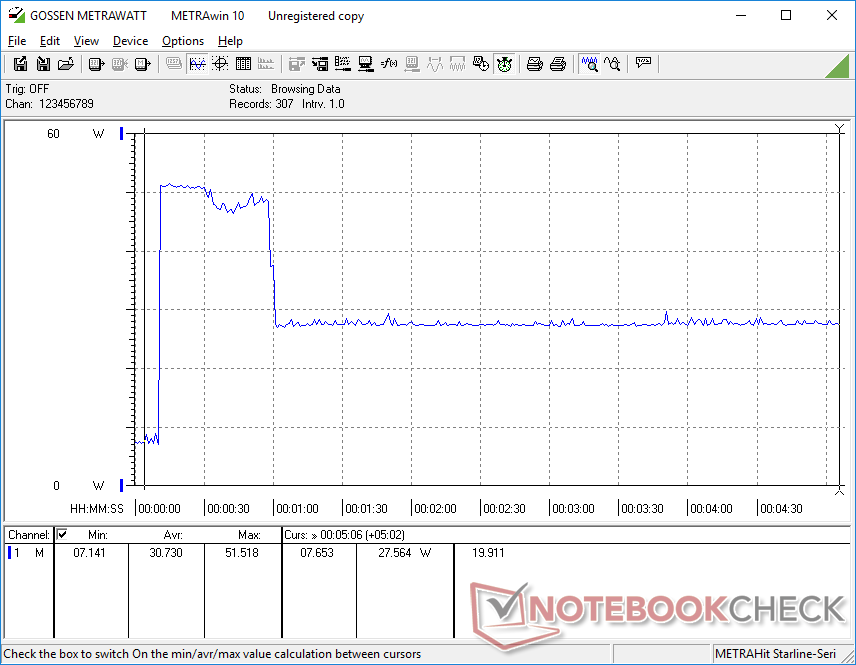
Stroomverbruik
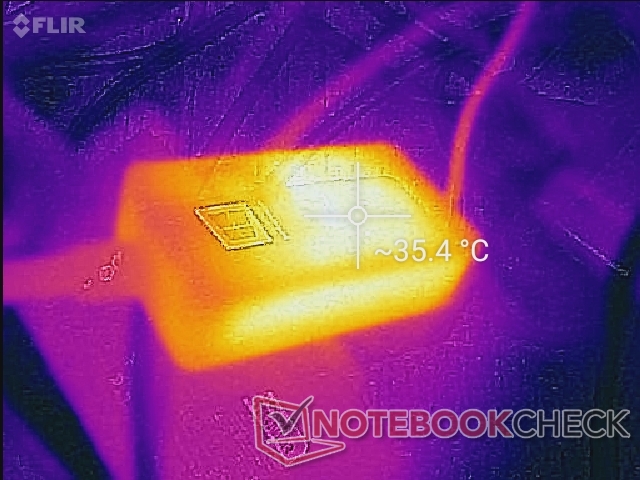
Het verbruik is iets lager dan de 13,5-inch Surface Laptop 3 bij belasting en ongeveer hetzelfde als de ZenbookS UX393JA, hoewel deze laatste wordt geleverd met de Core i7-1065G7 die bijna twee keer krachtiger is in termen van graphics. Performance-per-Watt is daarom niet zo goed als we hadden gehoopt. We kunnen een tijdelijk maximaal verbruik van 51,6 W meten van de kleine (~8,5 x 9 x 2,2 cm) 39 W AC-adapter. Merk op dat de Surface Laptop Go compatibel is met de 65 W AC-adapters die worden geleverd met de grotere 15-inch Surface Laptop 3.
| Uit / Standby | |
| Inactief | |
| Belasting |
|
Key:
min: | |
| Microsoft Surface Laptop Go Core i5 i5-1035G1, UHD Graphics G1 (Ice Lake 32 EU), SK hynix BC501 HFM256GDGTNG, IPS, 1536x1024, 12.4" | Asus Zenbook S UX393JA i7-1065G7, Iris Plus Graphics G7 (Ice Lake 64 EU), Intel SSD 660p 1TB SSDPEKNW010T8, IPS, 3300x2200, 13.9" | HP EliteBook 830 G7 i7-10810U, UHD Graphics 620, Samsung SSD PM981a MZVLB512HBJQ, IPS, 1920x1080, 13.3" | Microsoft Surface Laptop 3 13 Core i5-1035G7 i5-1035G7, Iris Plus Graphics G7 (Ice Lake 64 EU), SK hynix BC501 HFM256GDGTNG, IPS, 2256x1504, 13.5" | Huawei MateBook X Pro 2020 i7 i7-10510U, GeForce MX250, Samsung PM981a MZVLB1T0HBLR, LTPS, 3000x2000, 13.9" | Apple MacBook Pro 13 2020 2GHz i5 10th-Gen i5-1038NG7, Iris Plus Graphics G7 (Ice Lake 64 EU), Apple SSD SM0512F, IPS, 2560x1600, 13.3" | |
|---|---|---|---|---|---|---|
| Power Consumption | -16% | 2% | -20% | -39% | -31% | |
| Idle Minimum * (Watt) | 2.8 | 4.1 -46% | 3.6 -29% | 4.4 -57% | 4.3 -54% | 3.8 -36% |
| Idle Average * (Watt) | 6.8 | 7.5 -10% | 4.7 31% | 7.5 -10% | 8.5 -25% | 8.6 -26% |
| Idle Maximum * (Watt) | 8 | 8.5 -6% | 5.1 36% | 7.8 2% | 12 -50% | 10.3 -29% |
| Load Average * (Watt) | 37.2 | 36.8 1% | 33.3 10% | 41.9 -13% | 54.8 -47% | 52.1 -40% |
| Load Maximum * (Watt) | 51.6 | 61.6 -19% | 70 -36% | 63.9 -24% | 61.5 -19% | 65.2 -26% |
| Witcher 3 ultra * (Watt) | 39.2 | 40.8 | 47.1 | 48.2 |
* ... kleiner is beter
Levensduur van de batterij
De capaciteit van de batterij is kleiner dan de 13,5-inch Surface Laptop 3 (39 Wh vs. 45 Wh). Desalniettemin zijn de runtimes bijna hetzelfde bij ongeveer 8 uur real-world WLAN gebruik.
Het opladen van lege naar volle capaciteit gaat met de bijgeleverde AC-adapter relatief snel met iets meer dan een uur. Het opladen via USB-C wordt ondersteund.
| Microsoft Surface Laptop Go Core i5 i5-1035G1, UHD Graphics G1 (Ice Lake 32 EU), 39 Wh | Asus Zenbook S UX393JA i7-1065G7, Iris Plus Graphics G7 (Ice Lake 64 EU), 67 Wh | HP EliteBook 830 G7 i7-10810U, UHD Graphics 620, 53 Wh | Microsoft Surface Laptop 3 13 Core i5-1035G7 i5-1035G7, Iris Plus Graphics G7 (Ice Lake 64 EU), 45 Wh | Huawei MateBook X Pro 2020 i7 i7-10510U, GeForce MX250, 57.4 Wh | Apple MacBook Pro 13 2020 2GHz i5 10th-Gen i5-1038NG7, Iris Plus Graphics G7 (Ice Lake 64 EU), 58 Wh | |
|---|---|---|---|---|---|---|
| Batterijduur | 16% | 43% | -1% | 25% | 51% | |
| Reader / Idle (h) | 35 | 38.4 10% | 34.6 -1% | 34.4 -2% | ||
| WiFi v1.3 (h) | 8 | 8.3 4% | 11.5 44% | 8.3 4% | 10.4 30% | 12.1 51% |
| Load (h) | 2 | 2.7 35% | 3.7 85% | 1.9 -5% | 2.4 20% |
Pro
Contra
Uitspraak
De Surface Laptop Go is een onevenwichtige machine. Aan de ene kant is het een van de beste laptops van $550 USD die je kunt vinden omdat de 10e generatie Core i5 CPU, het 3:2 touchscreen en het metalen ontwerp beter zijn dan wat dan ook in deze prijsklasse. Aan de andere kant, de gesoldeerde 4 GB RAM, 64 GB SSD, moeilijke bedienbaarheid, trage graphics, en het gebrek aan poort opties zijn abysmal door de huidige normen. Microsoft laadt een arm en een been voor SKU's in het hogere segment alleen maar om een fatsoenlijke 8 GB RAM te hebben. De barebones kenmerken en lachwekkende specificaties lezen als een goedkoop Acer netbook van een half decennium geleden.
Als je het niet erg vindt om vast te zitten aan slechts 4 GB RAM, dan zien we de aantrekkingskracht van de lower-end SKU's omdat je dan nog steeds een geweldig display en chassis zou krijgen. Anders is het de moeite waard om te kijken naar andere Ultrabooks zoals de XPS 13, Spectre 13, ZenBook 13, of de Lenovo IdeaPad Slim 7 die allemaal sub $ 1000 SKU's hebben, vergelijkbaar met een volledig uitgeruste Surface Laptop Go, maar met meer nuttige functies en langere benen
Microsoft Surface Laptop Go Core i5
- 24-10-2020 v7 (old)
Allen Ngo
Price comparison

