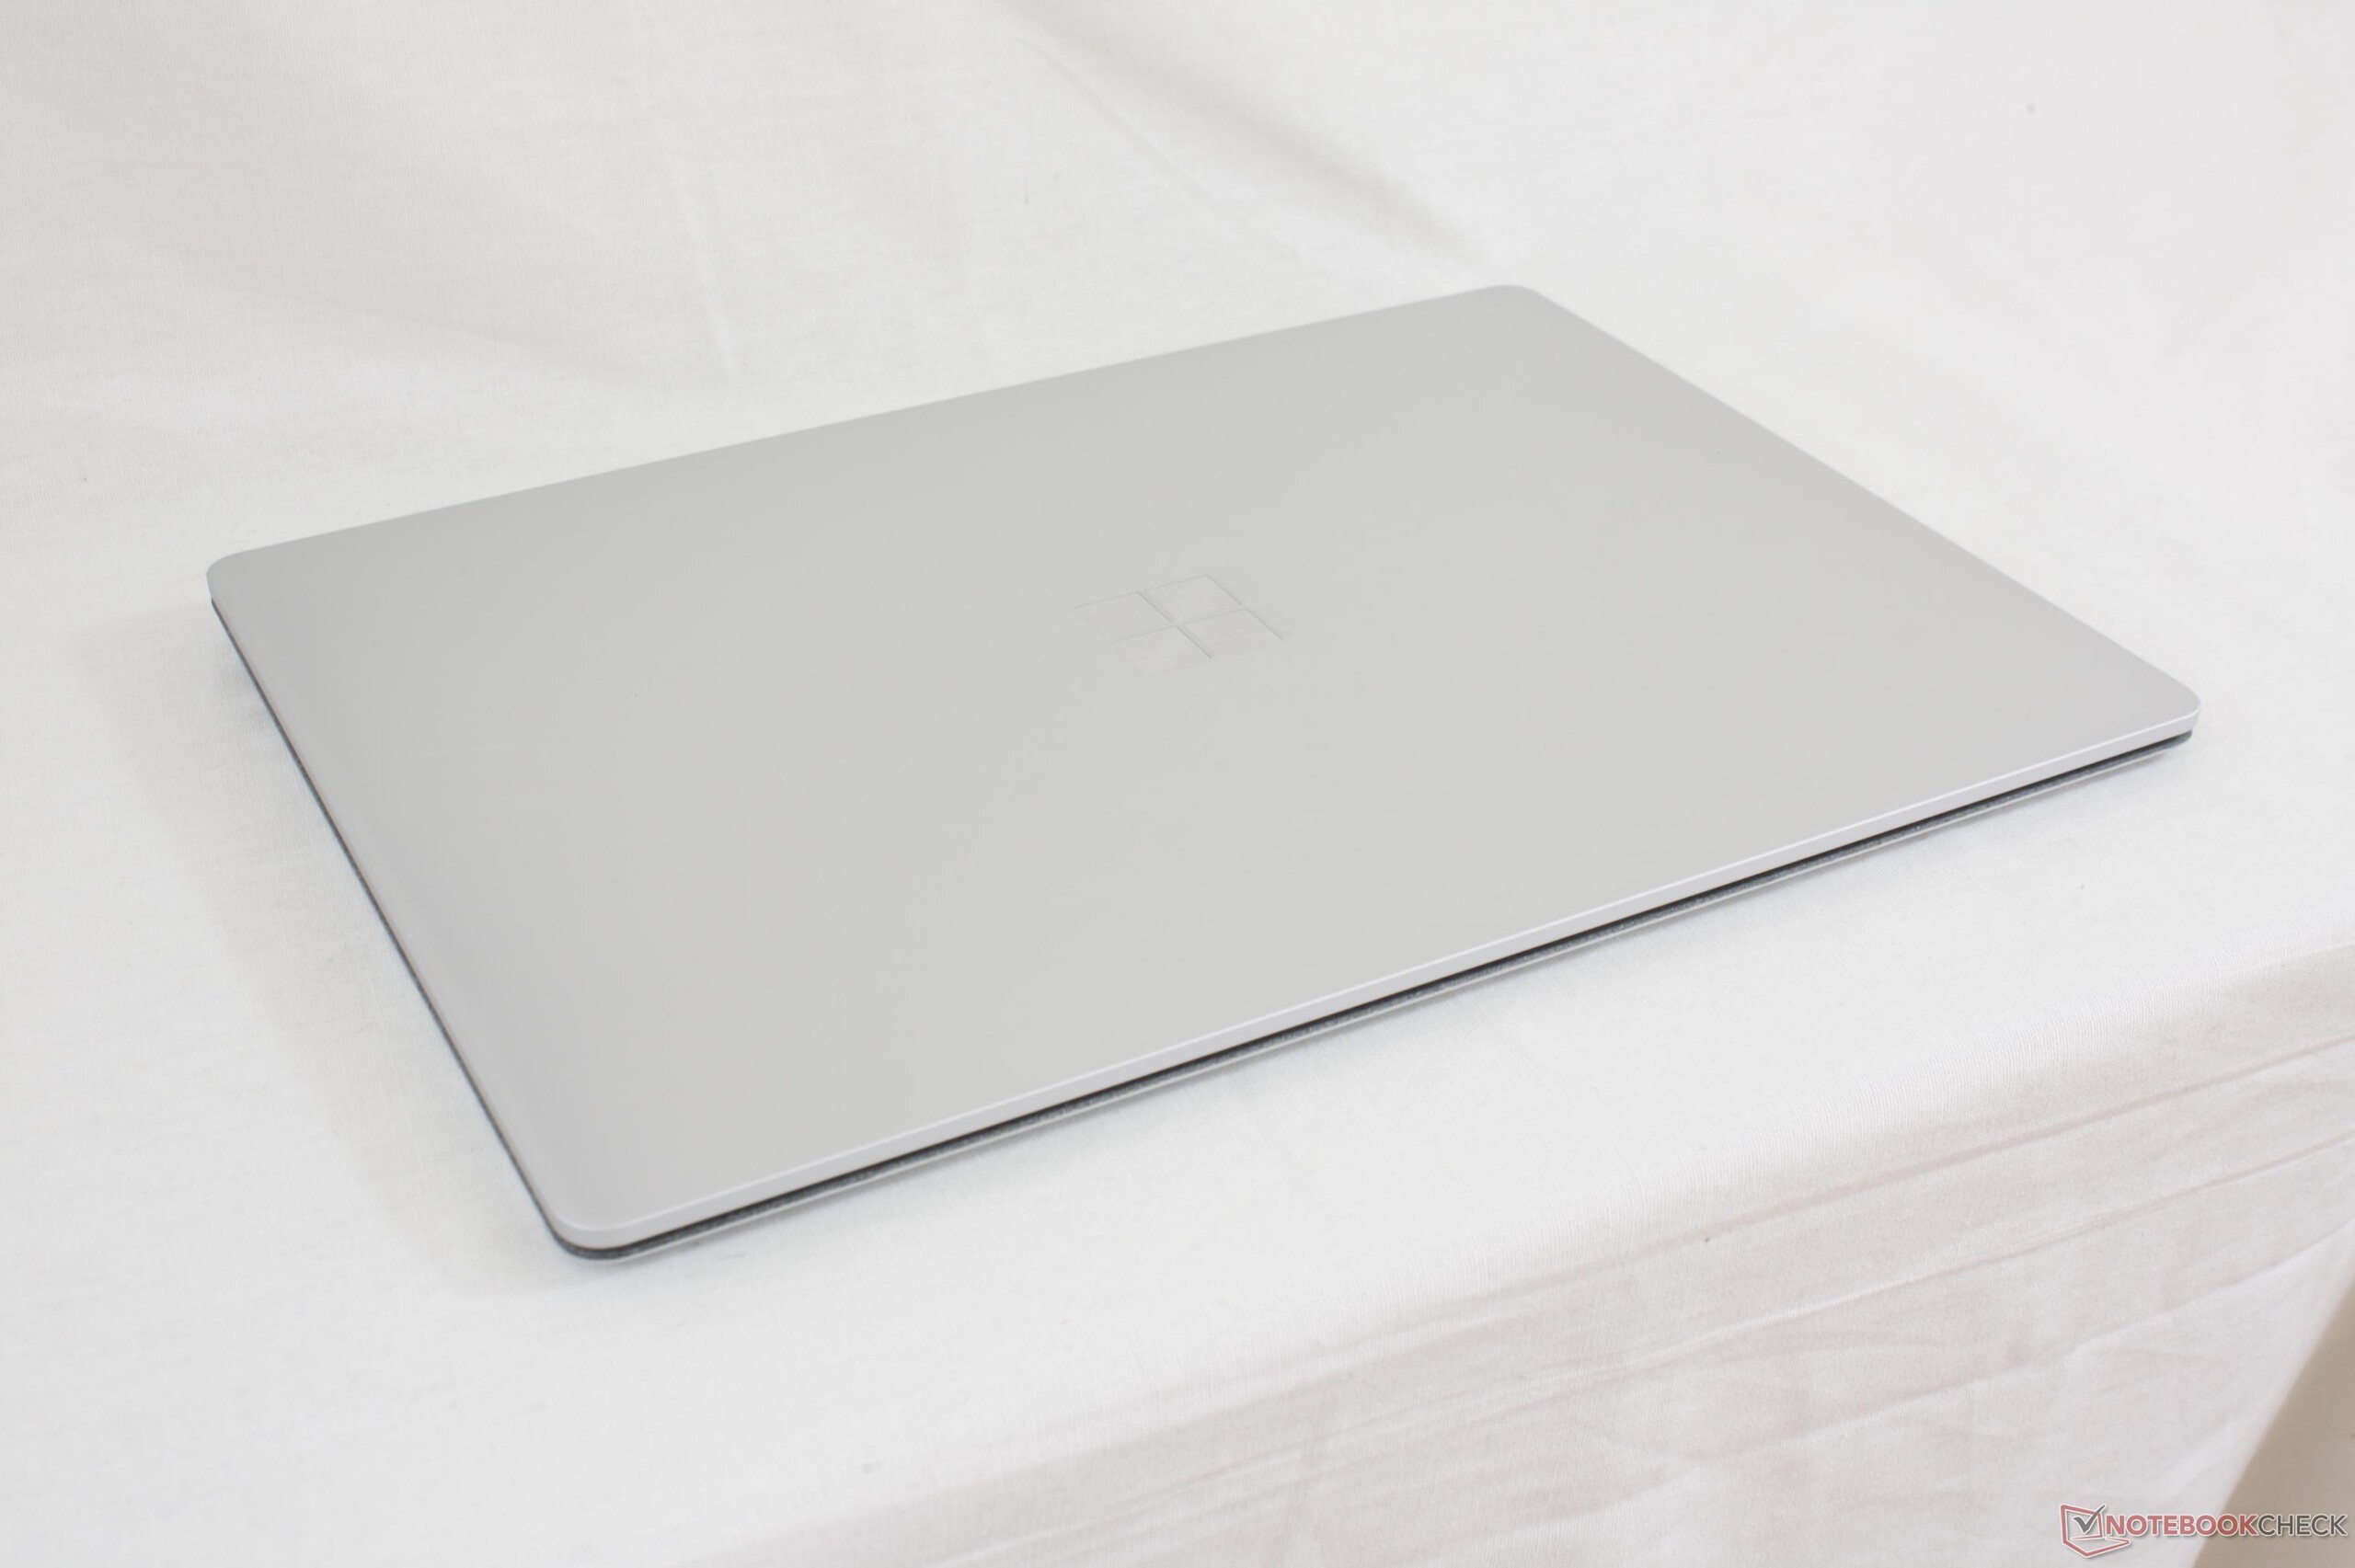
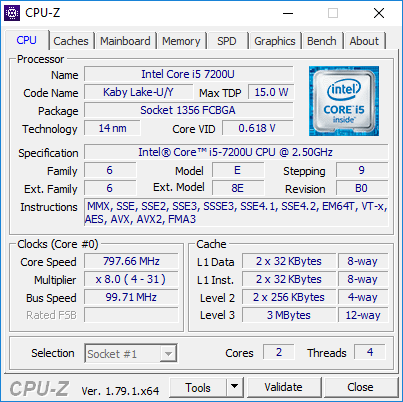
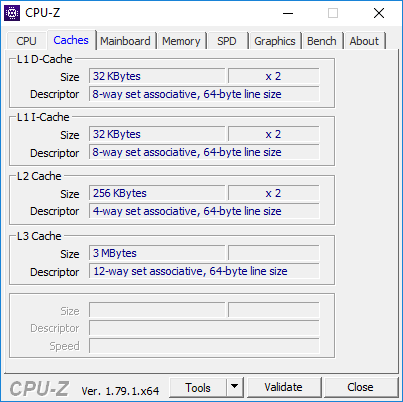
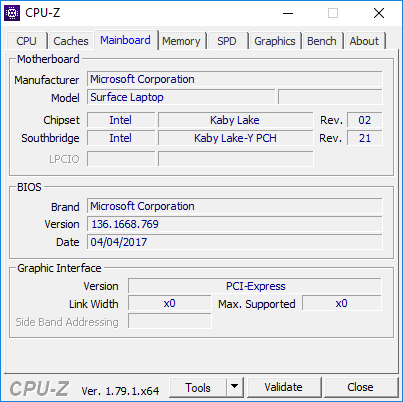
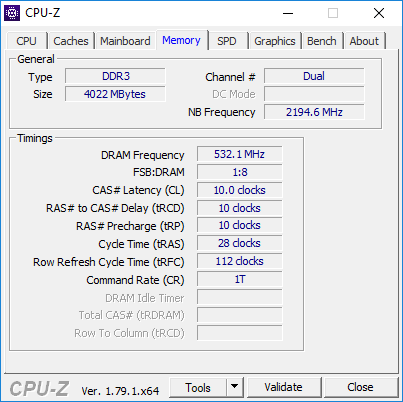
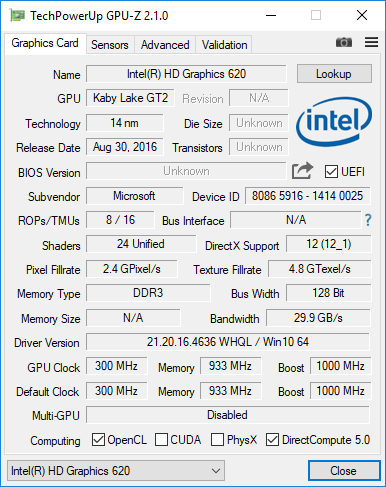
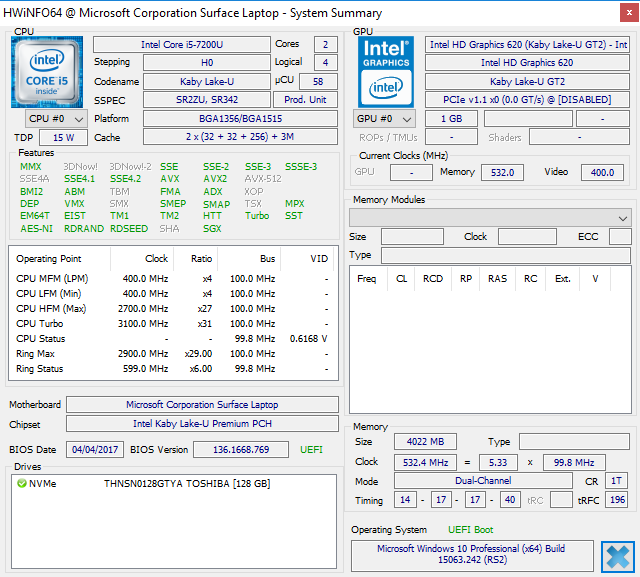
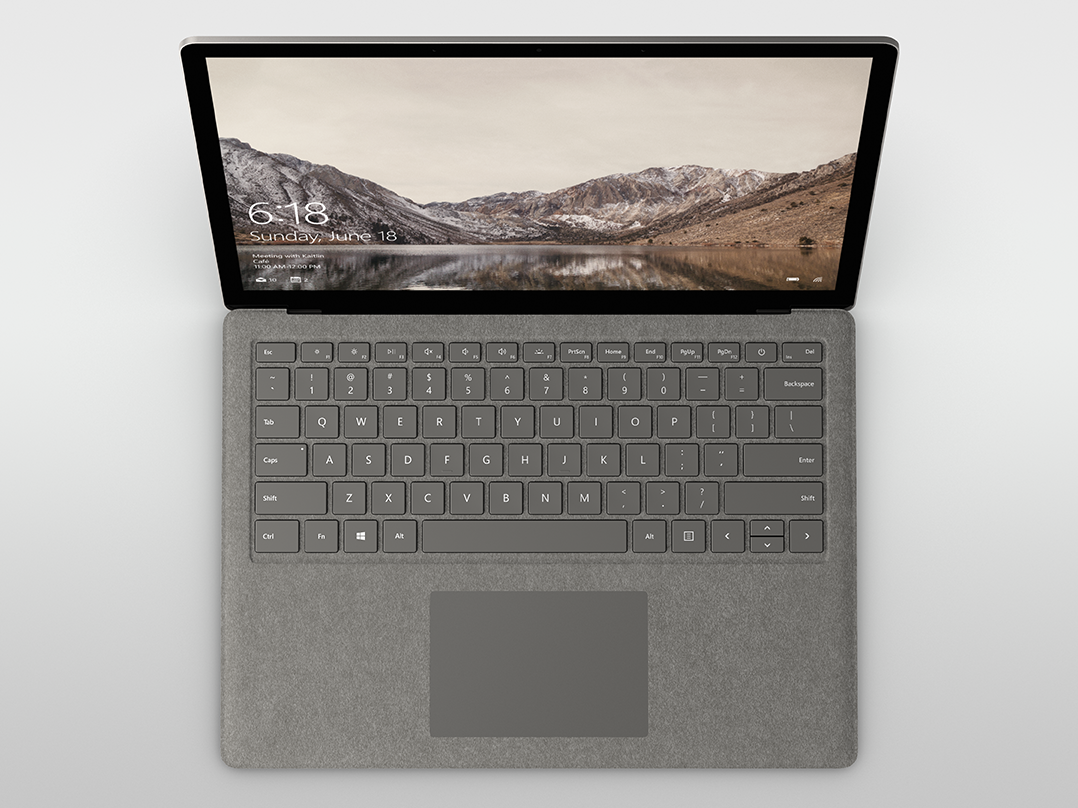
Kort testrapport Microsoft Surface Laptop (i5-7200U)
| Networking | |
| iperf3 transmit AX12 | |
| Microsoft Surface Book with Performance Base | |
| Dell XPS 13 9360 FHD i5 | |
| Microsoft Surface Laptop i5 | |
| iperf3 receive AX12 | |
| Microsoft Surface Laptop i5 | |
| Dell XPS 13 9360 FHD i5 | |
| Microsoft Surface Book with Performance Base | |
| |||||||||||||||||||||||||
Helderheidsverdeling: 90 %
Helderheid in Batterij-modus: 384.1 cd/m²
Contrast: 1067:1 (Zwart: 0.36 cd/m²)
ΔE ColorChecker Calman: 1.8 | ∀{0.5-29.43 Ø4.71}
ΔE Greyscale Calman: 1.2 | ∀{0.09-98 Ø4.96}
94.2% sRGB (Argyll 1.6.3 3D)
63.7% AdobeRGB 1998 (Argyll 1.6.3 3D)
69.5% AdobeRGB 1998 (Argyll 3D)
94.3% sRGB (Argyll 3D)
67.8% Display P3 (Argyll 3D)
Gamma: 2.21
CCT: 6708 K
| Microsoft Surface Laptop i5 ID: MEI96A2, Name: Panasonic VVX14T092N00, IPS, 13.5", 2256x1504 | Microsoft Surface Book with Performance Base Panasonic MEI96A2, IPS, 13.5", 3000x2000 | Microsoft Surface Pro 4, Core i5, 128GB Samsung 123YL01-001 ID: SDC3853, IPS, 12.3", 2736x1824 | Apple MacBook Pro 13 2016 (2.9 GHz) APPA033, , 13.3", 2560x1600 | Dell XPS 13 9360 FHD i5 Sharp SHP1449 LQ133M1, IPS, 13.3", 1920x1080 | |
|---|---|---|---|---|---|
| Display | -1% | -2% | 26% | -26% | |
| Display P3 Coverage (%) | 67.8 | 66.4 -2% | 65 -4% | 99.2 46% | 48.94 -28% |
| sRGB Coverage (%) | 94.3 | 95.4 1% | 96.5 2% | 99.9 6% | 73.3 -22% |
| AdobeRGB 1998 Coverage (%) | 69.5 | 67.6 -3% | 67 -4% | 87.6 26% | 50.5 -27% |
| Response Times | -10% | 13% | -18% | 23% | |
| Response Time Grey 50% / Grey 80% * (ms) | 50.8 ? | 61 ? -20% | 46 ? 9% | 47.2 ? 7% | 32.8 ? 35% |
| Response Time Black / White * (ms) | 37.2 ? | 37 ? 1% | 31.2 ? 16% | 53 ? -42% | 33.2 ? 11% |
| PWM Frequency (Hz) | 50 ? | ||||
| Screen | -8% | -32% | 6% | -84% | |
| Brightness middle (cd/m²) | 384.2 | 459 19% | 413 7% | 569 48% | 351.2 -9% |
| Brightness (cd/m²) | 378 | 423 12% | 396 5% | 542 43% | 325 -14% |
| Brightness Distribution (%) | 90 | 86 -4% | 87 -3% | 90 0% | 89 -1% |
| Black Level * (cd/m²) | 0.36 | 0.37 -3% | 0.36 -0% | 0.56 -56% | 0.195 46% |
| Contrast (:1) | 1067 | 1241 16% | 1147 7% | 1016 -5% | 1801 69% |
| Colorchecker dE 2000 * | 1.8 | 2.28 -27% | 3.09 -72% | 1.4 22% | 7.4 -311% |
| Colorchecker dE 2000 max. * | 4.2 | 3.61 14% | 2.9 31% | 9.08 -116% | |
| Greyscale dE 2000 * | 1.2 | 2.48 -107% | 3.92 -227% | 1.8 -50% | 6.71 -459% |
| Gamma | 2.21 100% | 2.5 88% | 2.3 96% | 2.16 102% | 2.74 80% |
| CCT | 6708 97% | 8602 76% | 7333 89% | 6877 95% | 7222 90% |
| Color Space (Percent of AdobeRGB 1998) (%) | 63.7 | 62 -3% | 61 -4% | 78.4 23% | 50.48 -21% |
| Color Space (Percent of sRGB) (%) | 94.2 | 96 2% | 97 3% | 99.3 5% | 73.31 -22% |
| Totaal Gemiddelde (Programma / Instellingen) | -6% /
-7% | -7% /
-19% | 5% /
7% | -29% /
-58% |
* ... kleiner is beter
Responstijd Scherm
| ↔ Responstijd Zwart naar Wit | ||
|---|---|---|
| 37.2 ms ... stijging ↗ en daling ↘ gecombineerd | ↗ 20 ms stijging | 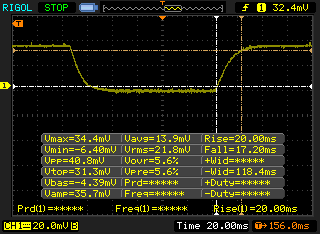 |
| ↘ 17.2 ms daling | ||
| Het scherm vertoonde trage responstijden in onze tests en is misschien te traag voor games. Ter vergelijking: alle testtoestellen variëren van 0.1 (minimum) tot 240 (maximum) ms. » 95 % van alle toestellen zijn beter. Dit betekent dat de gemeten responstijd slechter is dan het gemiddelde (19.8 ms) van alle geteste toestellen. | ||
| ↔ Responstijd 50% Grijs naar 80% Grijs | ||
| 50.8 ms ... stijging ↗ en daling ↘ gecombineerd | ↗ 25.6 ms stijging | 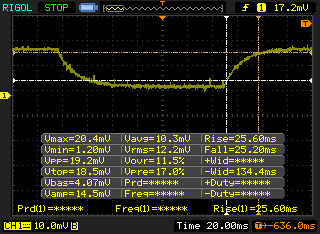 |
| ↘ 25.2 ms daling | ||
| Het scherm vertoonde trage responstijden in onze tests en is misschien te traag voor games. Ter vergelijking: alle testtoestellen variëren van 0.165 (minimum) tot 636 (maximum) ms. » 87 % van alle toestellen zijn beter. Dit betekent dat de gemeten responstijd slechter is dan het gemiddelde (31 ms) van alle geteste toestellen. | ||
Screen Flickering / PWM (Pulse-Width Modulation)
| Screen flickering / PWM niet waargenomen | 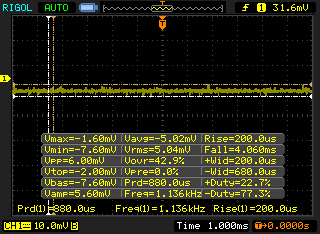 | ||
Ter vergelijking: 52 % van alle geteste toestellen maakten geen gebruik van PWM om de schermhelderheid te verlagen. Als het wel werd gebruikt, werd een gemiddelde van 7754 (minimum: 5 - maximum: 343500) Hz waargenomen. | |||
| wPrime 2.10 - 1024m | |
| Microsoft Surface Pro 4, Core m3 | |
| Lenovo Thinkpad 13-20J1001BUS | |
| Apple MacBook Pro 13 2016 | |
| Dell Latitude 5280 | |
| Microsoft Surface Laptop i5 | |
| Samsung Notebook 9 NP900X5N-X01US | |
* ... kleiner is beter
| PCMark 8 | |
| Home Score Accelerated v2 | |
| Apple MacBook Pro 13 2016 | |
| Microsoft Surface Laptop i5 | |
| Microsoft Surface Book with Performance Base | |
| Work Score Accelerated v2 | |
| Microsoft Surface Laptop i5 | |
| Microsoft Surface Book with Performance Base | |
| Apple MacBook Pro 13 2016 | |
| Creative Score Accelerated v2 | |
| Apple MacBook Pro 13 2016 | |
| Microsoft Surface Book with Performance Base | |
| Microsoft Surface Laptop i5 | |
| PCMark 8 Home Score Accelerated v2 | 3071 punten | |
| PCMark 8 Creative Score Accelerated v2 | 3962 punten | |
| PCMark 8 Work Score Accelerated v2 | 4106 punten | |
Help | ||
| Microsoft Surface Laptop i5 Toshiba THNSN0128GTYA | Microsoft Surface Book with Performance Base Toshiba NVMe THNSN5256GPU7 | Microsoft Surface Pro 4, Core i5, 128GB Samsung MZFLV128 NVMe | Apple MacBook Pro 13 2016 (2.9 GHz) Apple SSD AP0256 | Dell XPS 13 9360 FHD i5 Toshiba NVMe THNSN5256GPUK | |
|---|---|---|---|---|---|
| CrystalDiskMark 3.0 | 328% | 115% | 527% | 294% | |
| Read Seq (MB/s) | 425.6 | 1017 139% | 666 56% | 1662 291% | 1233 190% |
| Write Seq (MB/s) | 128.2 | 861 572% | 154.2 20% | 1336 942% | 733 472% |
| Read 512 (MB/s) | 278.5 | 687 147% | 266.3 -4% | 1183 325% | 1036 272% |
| Write 512 (MB/s) | 126.7 | 698 451% | 154.2 22% | 1481 1069% | 439.9 247% |
| Read 4k (MB/s) | 22.15 | 40.91 85% | 28.51 29% | 16.1 -27% | 29.31 32% |
| Write 4k (MB/s) | 40.45 | 108.6 168% | 101.5 151% | 23.5 -42% | 116.9 189% |
| Read 4k QD32 (MB/s) | 77.8 | 326.9 320% | 368.3 373% | 657 744% | 479.2 516% |
| Write 4k QD32 (MB/s) | 41.18 | 347.1 743% | 153.6 273% | 419 917% | 218.3 430% |

| 3DMark 11 Performance | 1586 punten | |
| 3DMark Ice Storm Standard Score | 48984 punten | |
| 3DMark Cloud Gate Standard Score | 5454 punten | |
| 3DMark Fire Strike Score | 743 punten | |
Help | ||
| lage | gem. | hoge | ultra | |
|---|---|---|---|---|
| BioShock Infinite (2013) | 45.8 | 27.4 | 22.7 | 7 |
| Rise of the Tomb Raider (2016) | 18.5 |
Geluidsniveau
| Onbelast |
| 28.2 / 28.2 / 29 dB (A) |
| Belasting |
| 30.3 / 39.3 dB (A) |
 | ||
30 dB stil 40 dB(A) hoorbaar 50 dB(A) luid |
||
min: | ||
| Microsoft Surface Laptop i5 HD Graphics 620, i5-7200U, Toshiba THNSN0128GTYA | Microsoft Surface Book with Performance Base GeForce GTX 965M, 6600U, Toshiba NVMe THNSN5256GPU7 | Microsoft Surface Pro 4, Core i5, 128GB HD Graphics 520, 6300U, Samsung MZFLV128 NVMe | Apple MacBook Pro 13 2016 (2.9 GHz) Iris Graphics 550, 6267U, Apple SSD AP0256 | Dell XPS 13 9360 FHD i5 HD Graphics 620, i5-7200U, Toshiba NVMe THNSN5256GPUK | |
|---|---|---|---|---|---|
| Noise | -8% | -14% | -4% | 2% | |
| uit / omgeving * (dB) | 28.2 | 29.4 -4% | 30.2 -7% | ||
| Idle Minimum * (dB) | 28.2 | 29.4 -4% | 31.5 -12% | 30.2 -7% | 28.9 -2% |
| Idle Average * (dB) | 28.2 | 29.4 -4% | 31.5 -12% | 30.2 -7% | 28.9 -2% |
| Idle Maximum * (dB) | 29 | 29.7 -2% | 31.5 -9% | 30.2 -4% | 28.9 -0% |
| Load Average * (dB) | 30.3 | 39 -29% | 40.5 -34% | 33 -9% | 30.9 -2% |
| Load Maximum * (dB) | 39.3 | 40.2 -2% | 40.7 -4% | 36.2 8% | 33.5 15% |
| Witcher 3 ultra * (dB) | 39.5 |
* ... kleiner is beter
(+) De maximumtemperatuur aan de bovenzijde bedraagt 36.4 °C / 98 F, vergeleken met het gemiddelde van 35.9 °C / 97 F, variërend van 21.4 tot 59 °C voor de klasse Subnotebook.
(-) De bodem warmt op tot een maximum van 45.2 °C / 113 F, vergeleken met een gemiddelde van 39.2 °C / 103 F
(+) Bij onbelast gebruik bedraagt de gemiddelde temperatuur voor de bovenzijde 26.7 °C / 80 F, vergeleken met het apparaatgemiddelde van 30.8 °C / 87 F.
(+) De palmsteunen en het touchpad zijn met een maximum van ###max## °C / 79.5 F koeler dan de huidtemperatuur en voelen daarom koel aan.
(±) De gemiddelde temperatuur van de handpalmsteun van soortgelijke toestellen bedroeg 28.2 °C / 82.8 F (+1.8 °C / 3.3 F).
Microsoft Surface Laptop i5 audioanalyse
(-) | niet erg luide luidsprekers (64.6 dB)
Bas 100 - 315 Hz
(±) | verminderde zeebaars - gemiddeld 7.1% lager dan de mediaan
(±) | lineariteit van de lage tonen is gemiddeld (11.8% delta ten opzichte van de vorige frequentie)
Midden 400 - 2000 Hz
(+) | evenwichtige middens - slechts 4.1% verwijderd van de mediaan
(+) | de middentonen zijn lineair (5.6% delta ten opzichte van de vorige frequentie)
Hoog 2 - 16 kHz
(+) | evenwichtige hoogtepunten - slechts 1.2% verwijderd van de mediaan
(+) | de hoge tonen zijn lineair (4.7% delta naar de vorige frequentie)
Algemeen 100 - 16.000 Hz
(±) | lineariteit van het totale geluid is gemiddeld (15.6% verschil met de mediaan)
Vergeleken met dezelfde klasse
» 36% van alle geteste apparaten in deze klasse waren beter, 5% vergelijkbaar, 58% slechter
» De beste had een delta van 5%, het gemiddelde was 18%, de slechtste was 53%
Vergeleken met alle geteste toestellen
» 23% van alle geteste apparaten waren beter, 5% gelijk, 72% slechter
» De beste had een delta van 4%, het gemiddelde was 23%, de slechtste was 134%
Apple MacBook 12 (Early 2016) 1.1 GHz audioanalyse
(+) | luidsprekers kunnen relatief luid spelen (83.6 dB)
Bas 100 - 315 Hz
(±) | verminderde zeebaars - gemiddeld 11.3% lager dan de mediaan
(±) | lineariteit van de lage tonen is gemiddeld (14.2% delta ten opzichte van de vorige frequentie)
Midden 400 - 2000 Hz
(+) | evenwichtige middens - slechts 2.4% verwijderd van de mediaan
(+) | de middentonen zijn lineair (5.5% delta ten opzichte van de vorige frequentie)
Hoog 2 - 16 kHz
(+) | evenwichtige hoogtepunten - slechts 2% verwijderd van de mediaan
(+) | de hoge tonen zijn lineair (4.5% delta naar de vorige frequentie)
Algemeen 100 - 16.000 Hz
(+) | het totale geluid is lineair (10.2% verschil met de mediaan)
Vergeleken met dezelfde klasse
» 7% van alle geteste apparaten in deze klasse waren beter, 2% vergelijkbaar, 90% slechter
» De beste had een delta van 5%, het gemiddelde was 18%, de slechtste was 53%
Vergeleken met alle geteste toestellen
» 5% van alle geteste apparaten waren beter, 1% gelijk, 94% slechter
» De beste had een delta van 4%, het gemiddelde was 23%, de slechtste was 134%
| Uit / Standby | |
| Inactief | |
| Belasting |
|
Key:
min: | |
| Microsoft Surface Laptop i5 i5-7200U, HD Graphics 620, Toshiba THNSN0128GTYA, IPS, 2256x1504, 13.5" | Microsoft Surface Book with Performance Base 6600U, GeForce GTX 965M, Toshiba NVMe THNSN5256GPU7, IPS, 3000x2000, 13.5" | Microsoft Surface Pro 4, Core i5, 128GB 6300U, HD Graphics 520, Samsung MZFLV128 NVMe, IPS, 2736x1824, 12.3" | Apple MacBook Pro 13 2016 (2.9 GHz) 6267U, Iris Graphics 550, Apple SSD AP0256, , 2560x1600, 13.3" | Dell XPS 13 9360 FHD i5 i5-7200U, HD Graphics 620, Toshiba NVMe THNSN5256GPUK, IPS, 1920x1080, 13.3" | |
|---|---|---|---|---|---|
| Power Consumption | -75% | -12% | -34% | 14% | |
| Idle Minimum * (Watt) | 3.2 | 4.15 -30% | 4.4 -38% | 2.1 34% | 4.1 -28% |
| Idle Average * (Watt) | 6.5 | 8 -23% | 9 -38% | 7.6 -17% | 4.2 35% |
| Idle Maximum * (Watt) | 6.8 | 11.9 -75% | 10.7 -57% | 8.2 -21% | 5.1 25% |
| Load Average * (Watt) | 28.2 | 67 -138% | 19.6 30% | 56.4 -100% | 22.1 22% |
| Load Maximum * (Watt) | 36 | 76 -111% | 19.9 45% | 59.8 -66% | 29.4 18% |
| Witcher 3 ultra * (Watt) | 58 |
* ... kleiner is beter
| Microsoft Surface Laptop i5 i5-7200U, HD Graphics 620, 45 Wh | Microsoft Surface Book with Performance Base 6600U, GeForce GTX 965M, 78 Wh | Microsoft Surface Pro 4, Core i5, 128GB 6300U, HD Graphics 520, 38 Wh | Apple MacBook Pro 13 2016 (2.9 GHz) 6267U, Iris Graphics 550, 49.2 Wh | Dell XPS 13 9360 FHD i5 i5-7200U, HD Graphics 620, 60 Wh | Asus Zenbook UX3410UQ-GV077T i7-7500U, GeForce 940MX, 48 Wh | |
|---|---|---|---|---|---|---|
| Batterijduur | -7% | -24% | -27% | 11% | -15% | |
| Reader / Idle (h) | 22.5 | 25.5 13% | 15 -33% | 21.6 -4% | ||
| WiFi v1.3 (h) | 10 | 9.6 -4% | 7.1 -29% | 9.4 -6% | 11.3 13% | 8.5 -15% |
| Load (h) | 2.1 | 1.5 -29% | 1.9 -10% | 1.1 -48% | 2.6 24% |
Pro
Contra
Dit is de verkorte versie van het originele artikel. Het volledige, Engelse testrapport vind je hier.
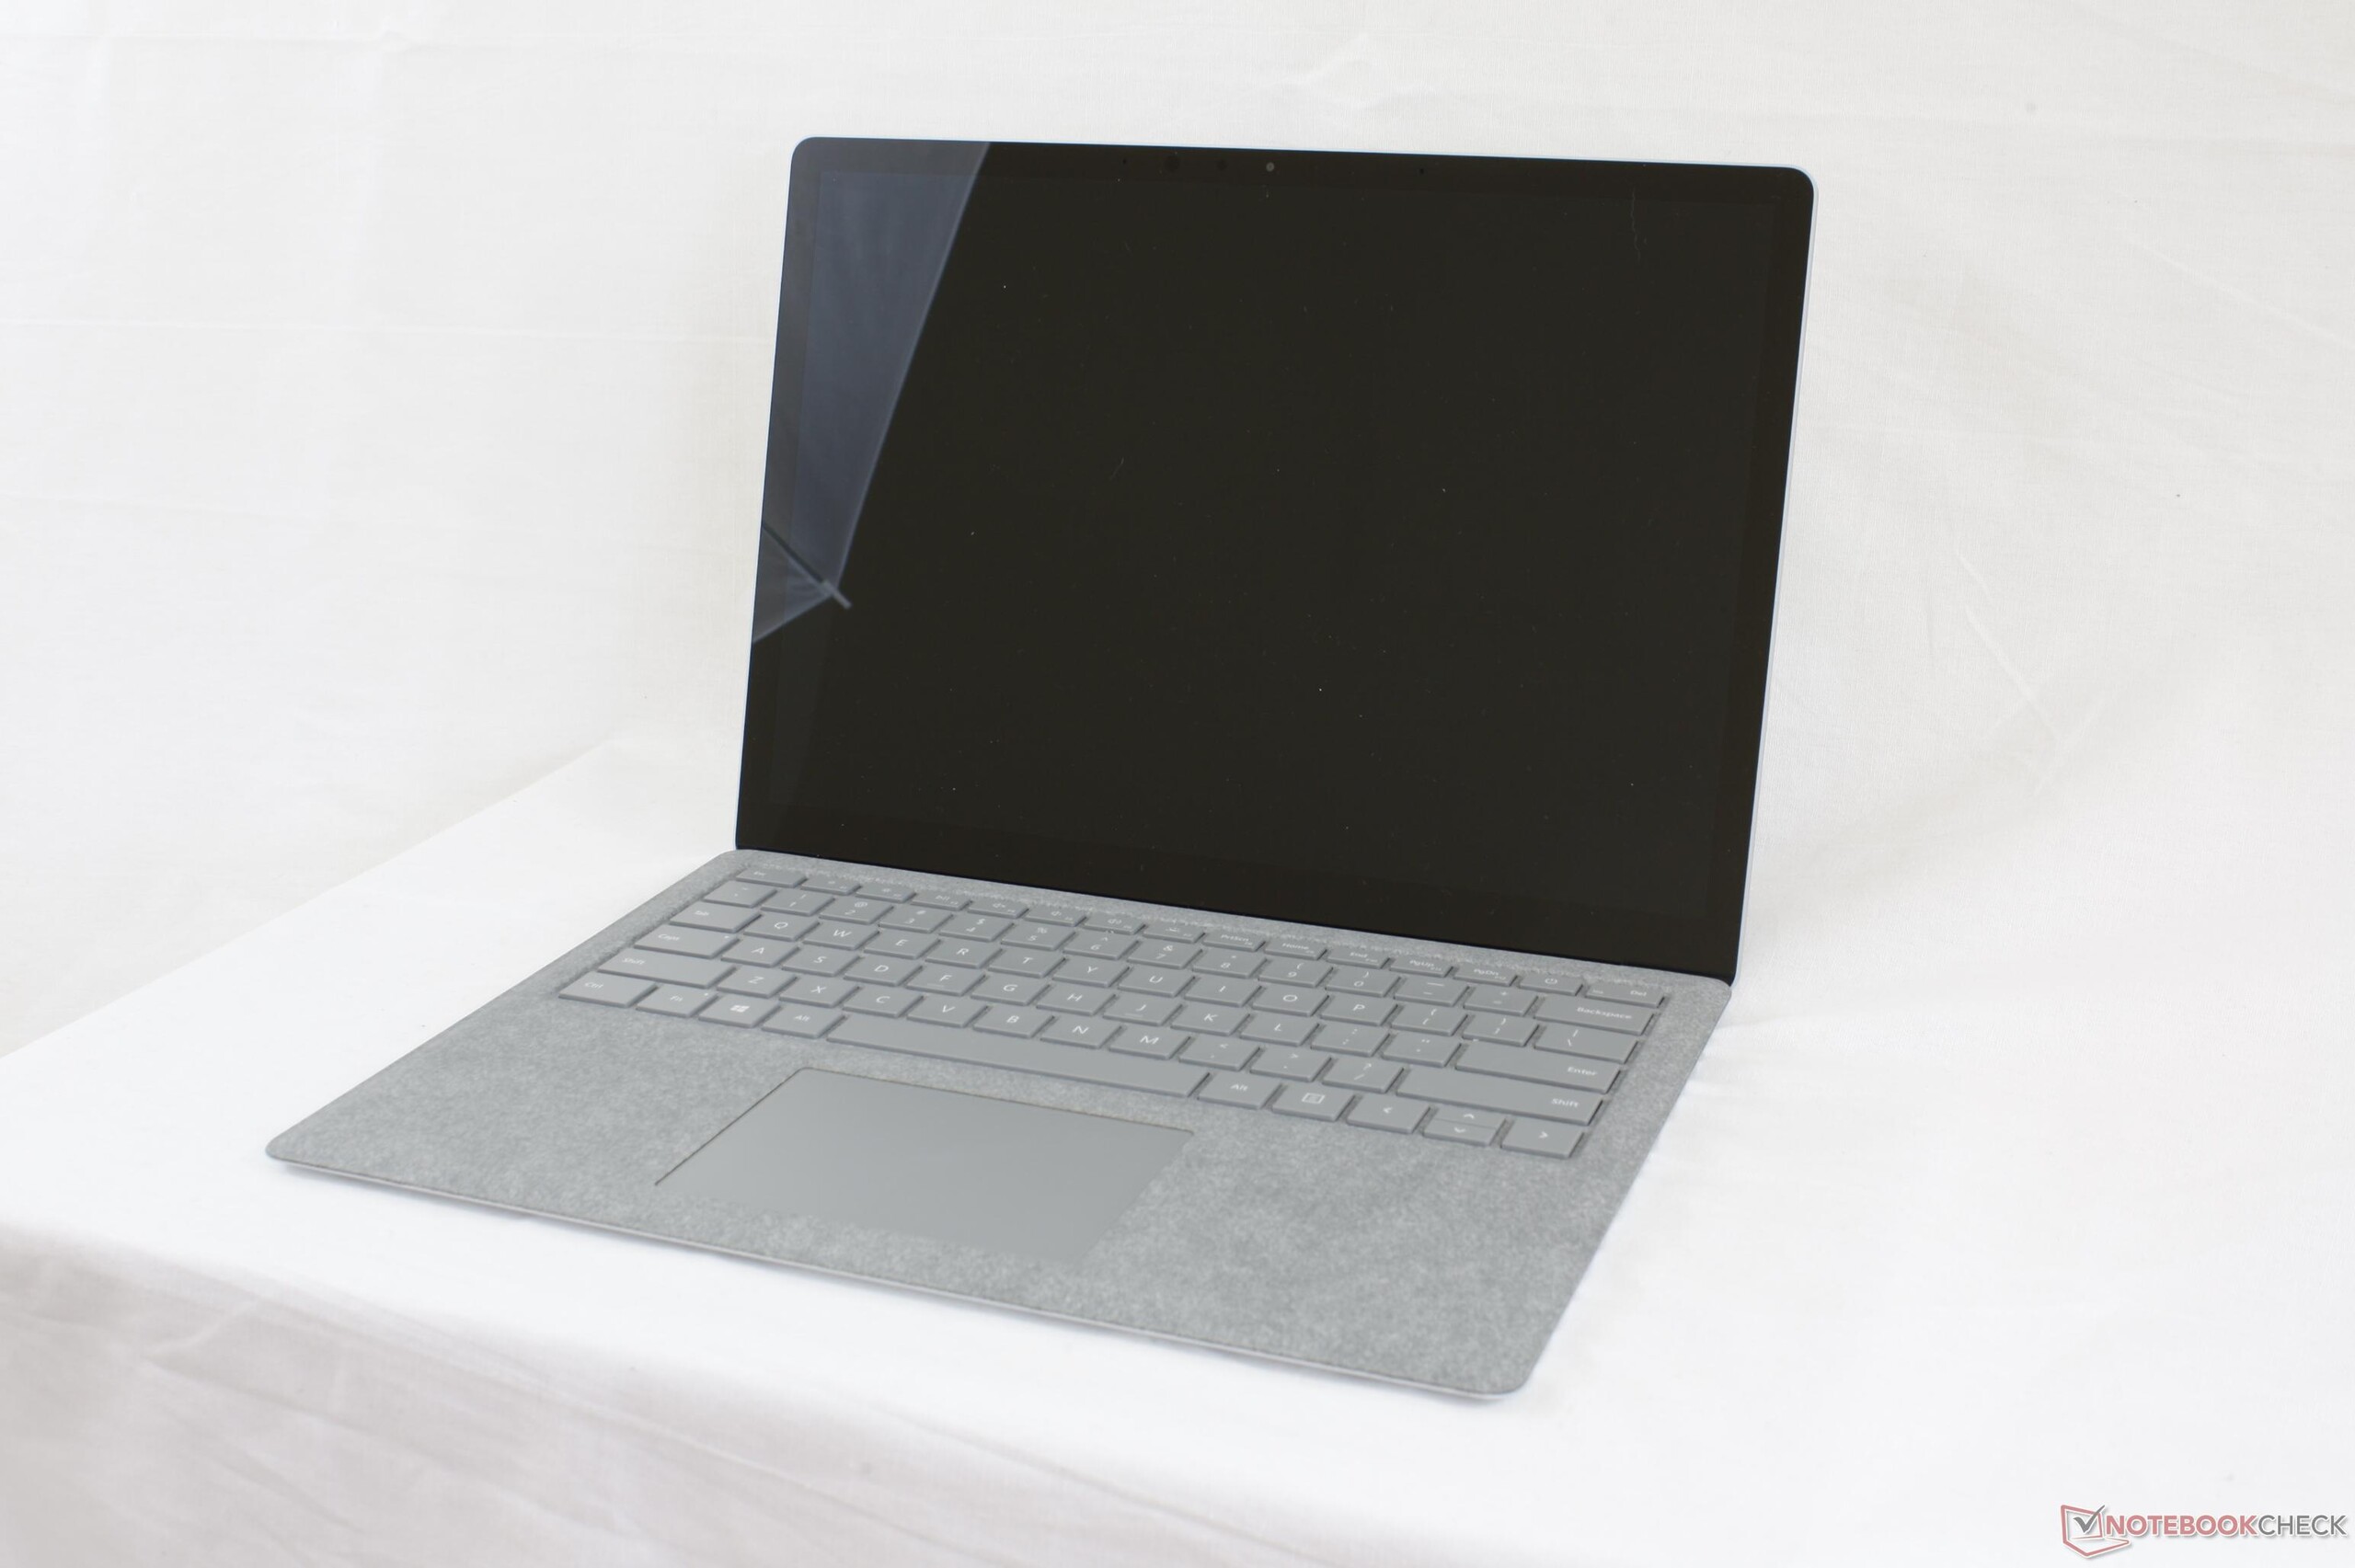
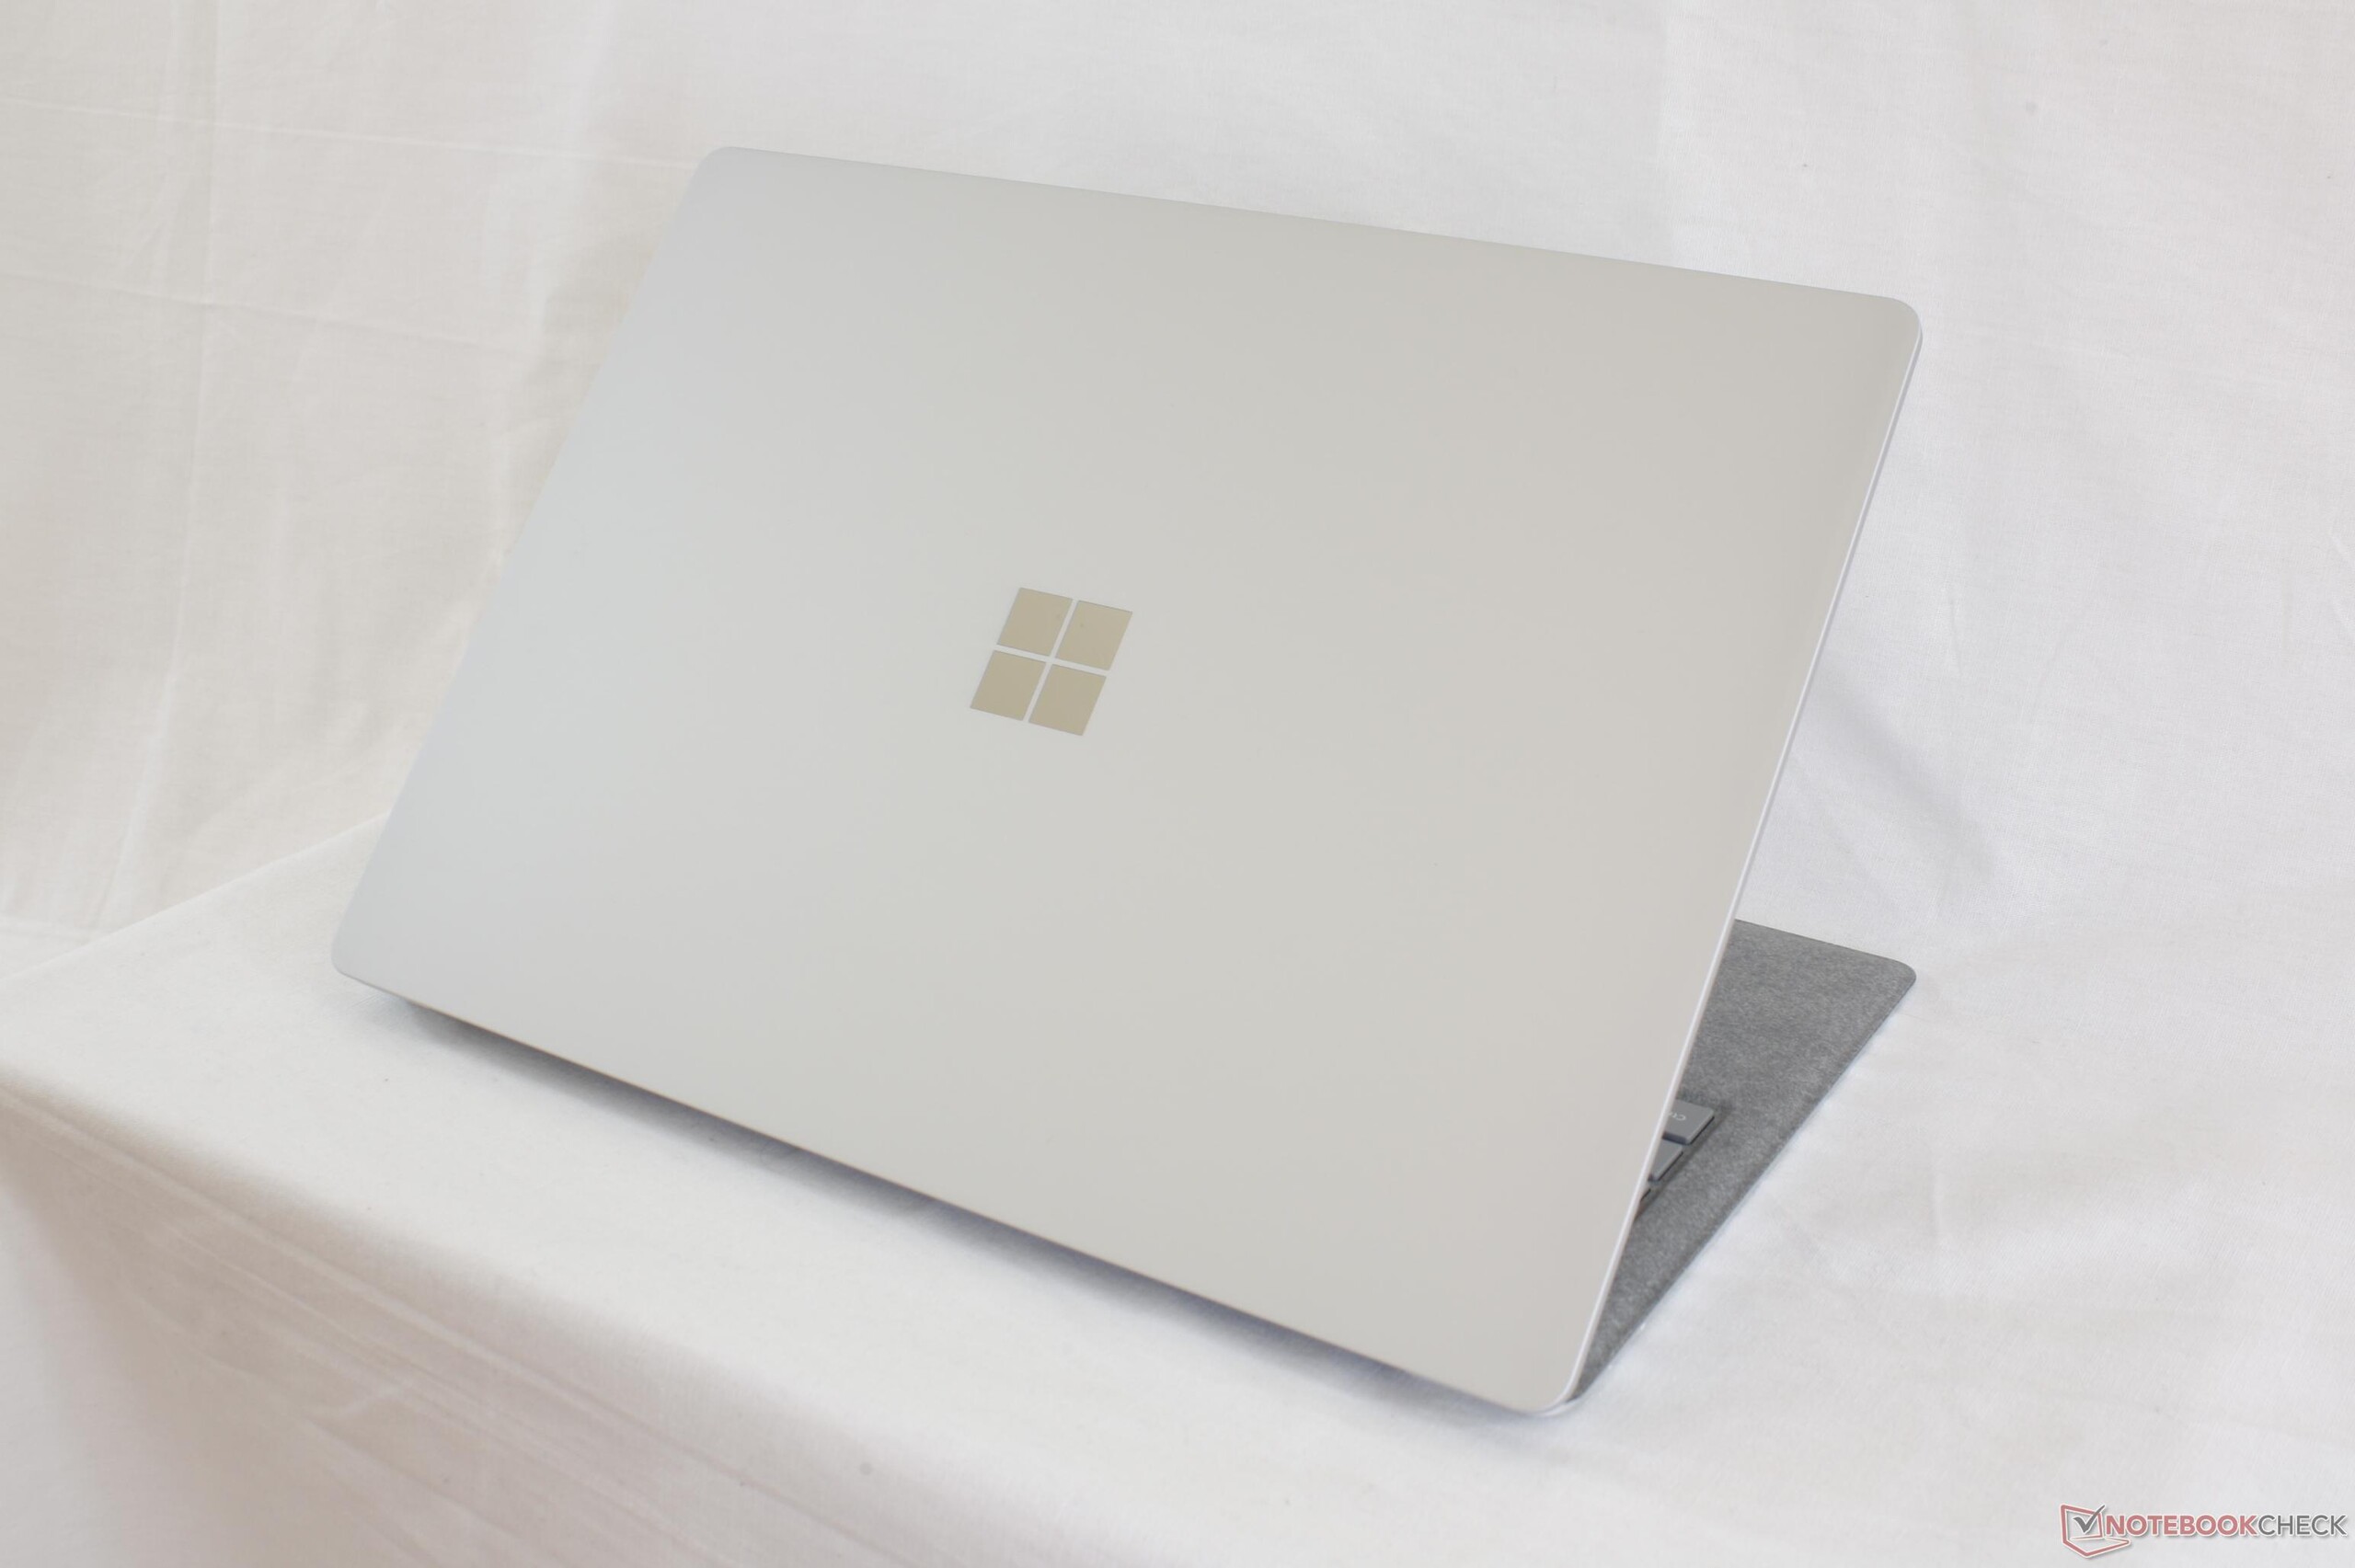
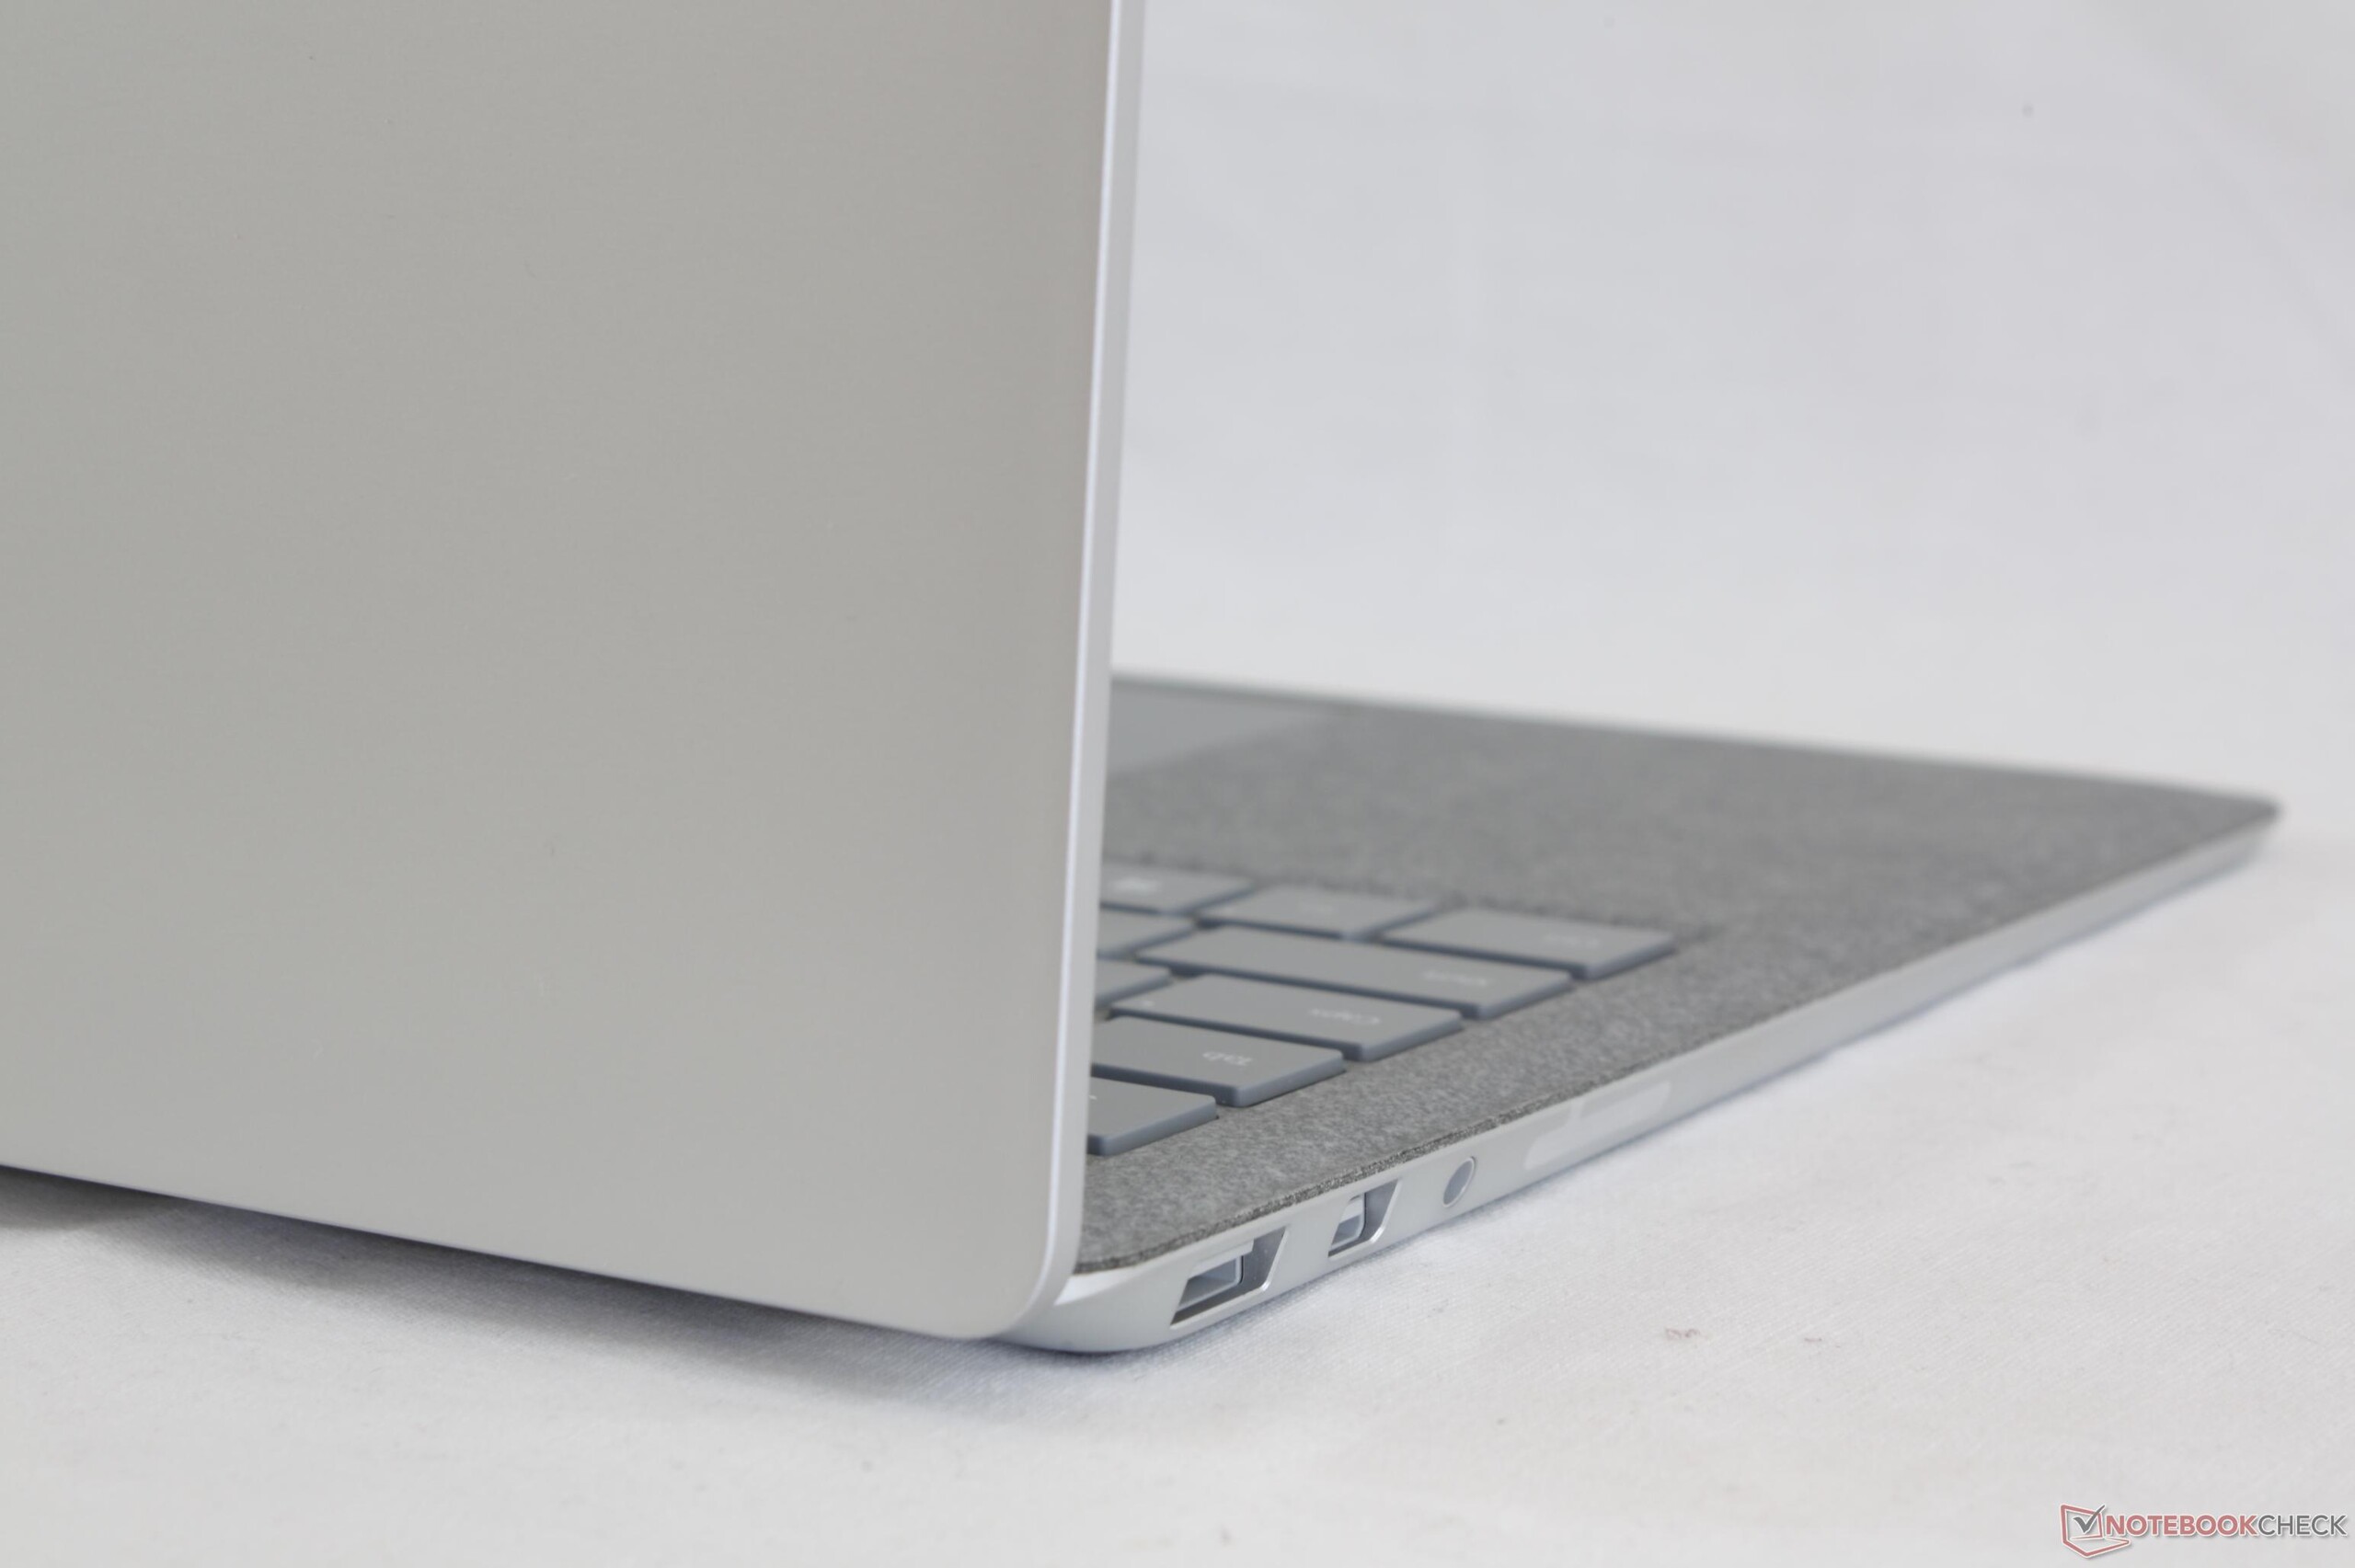
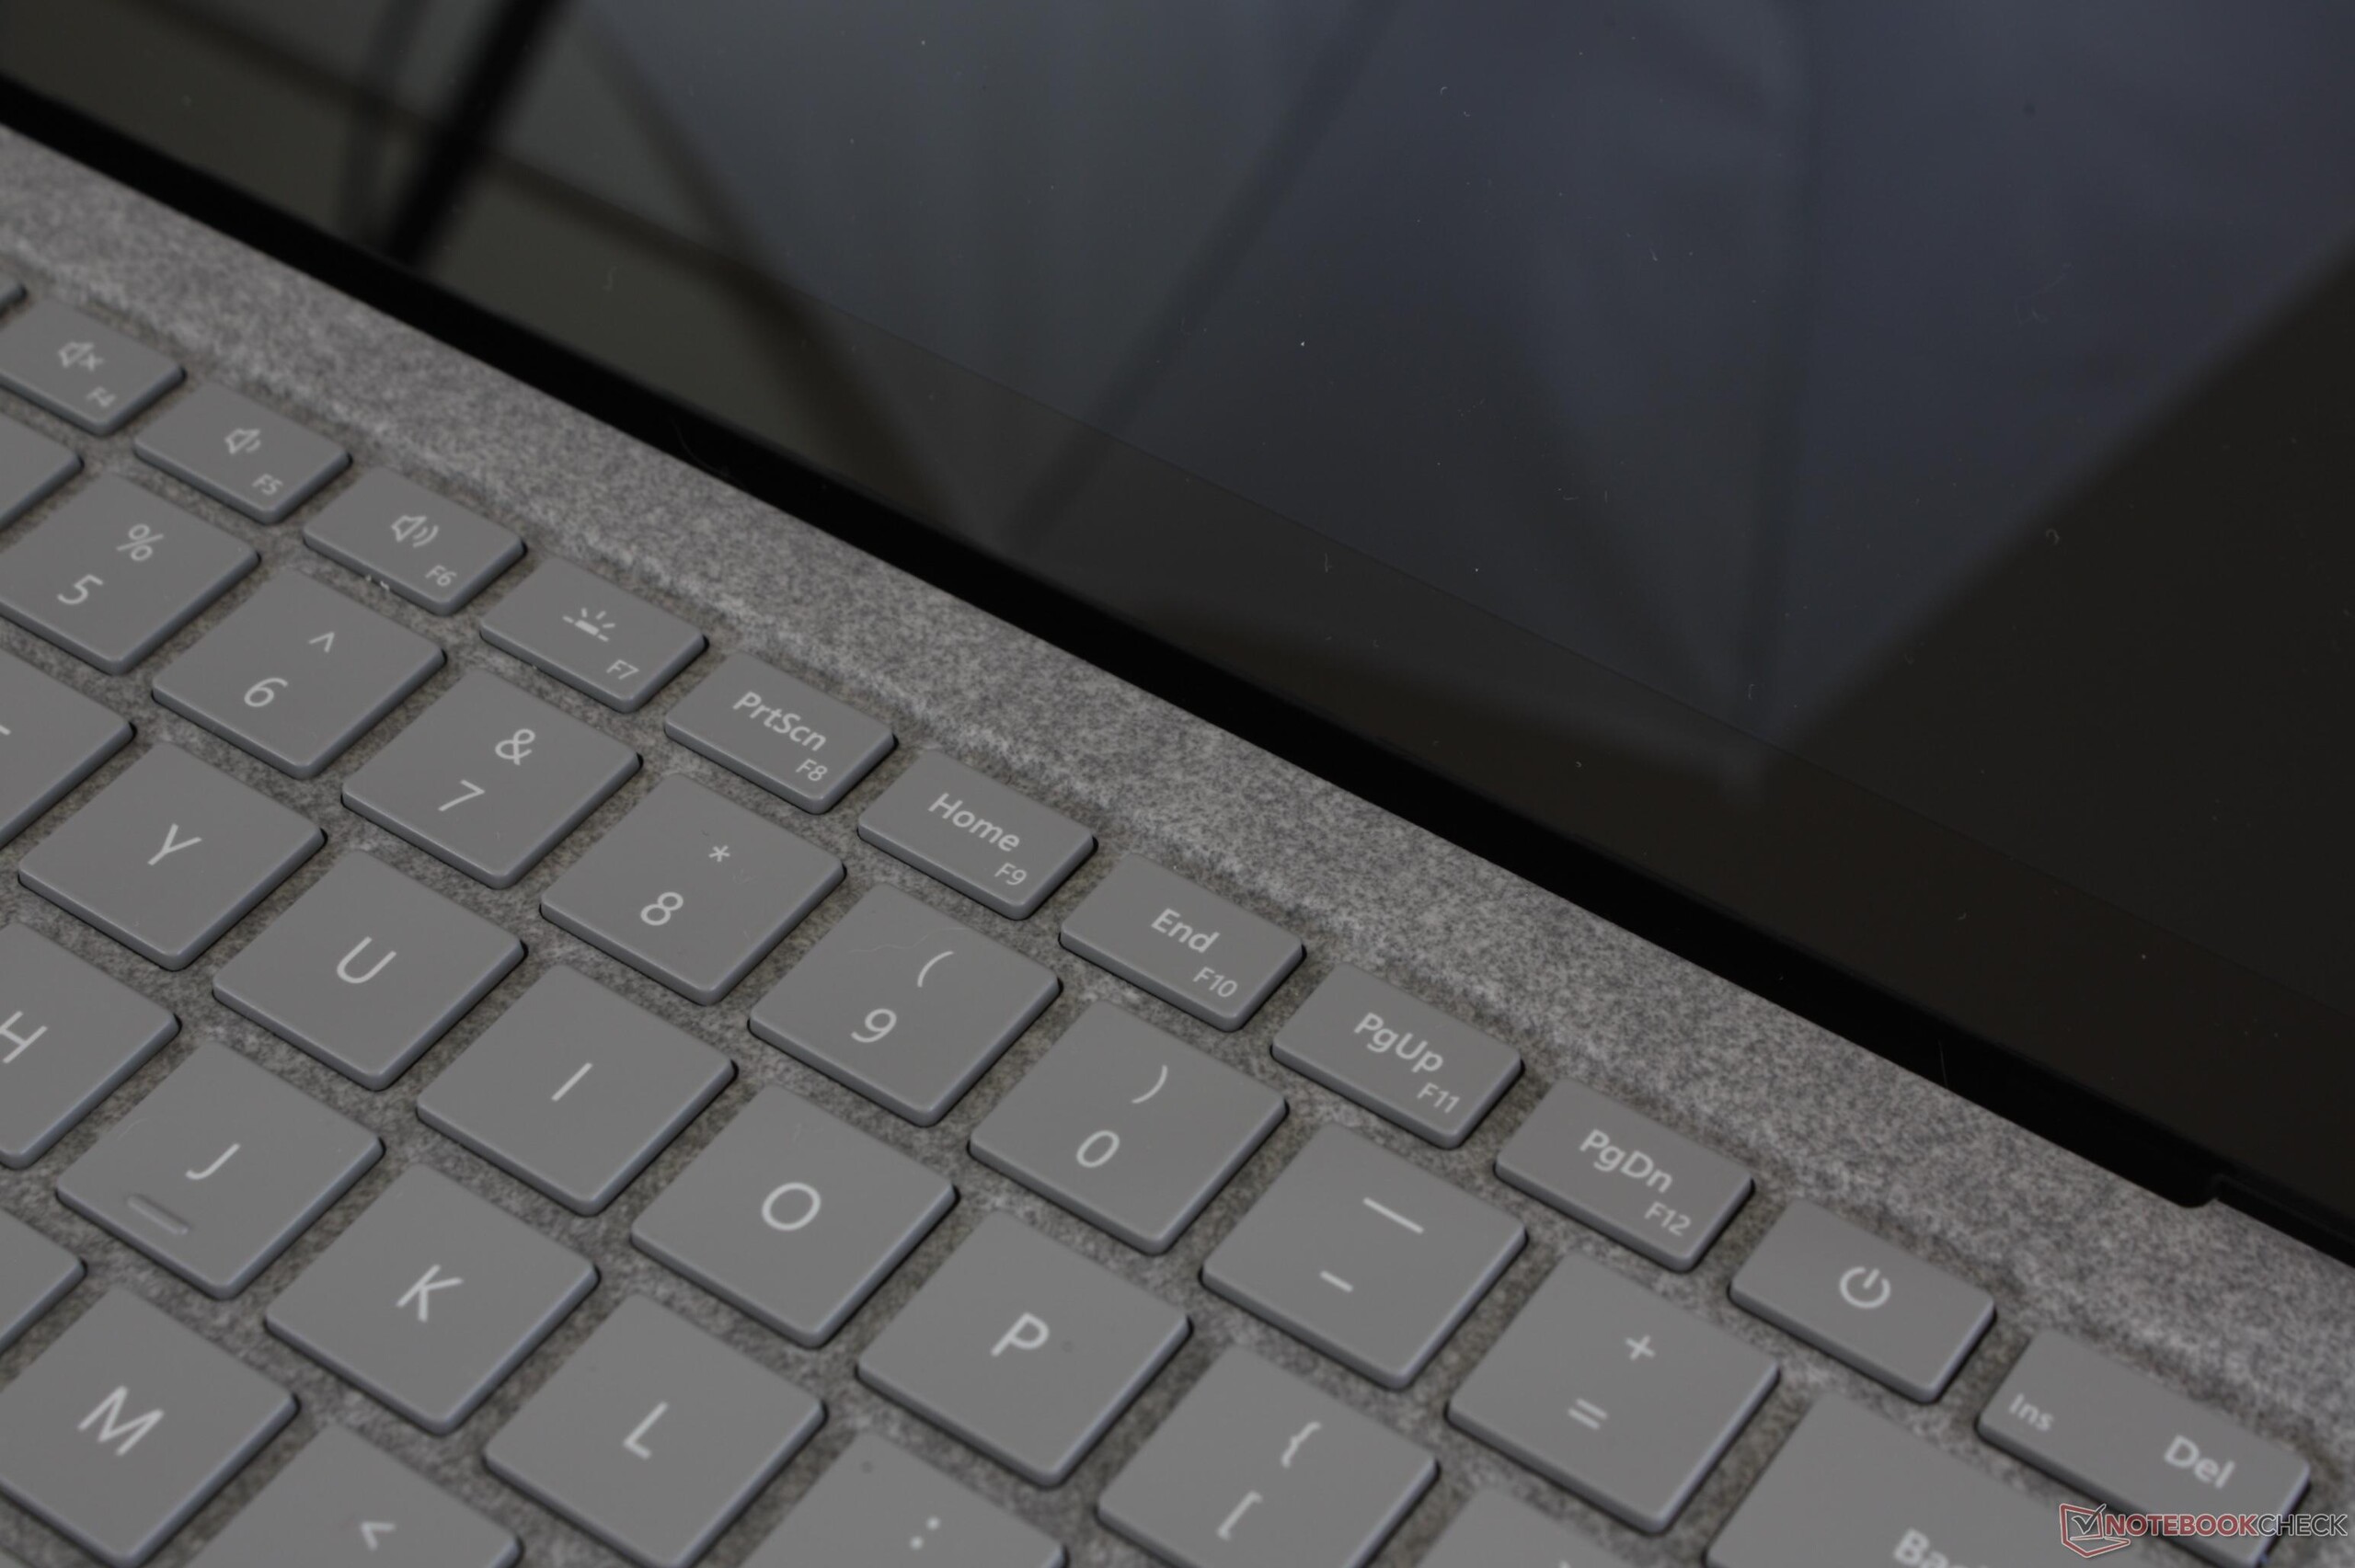
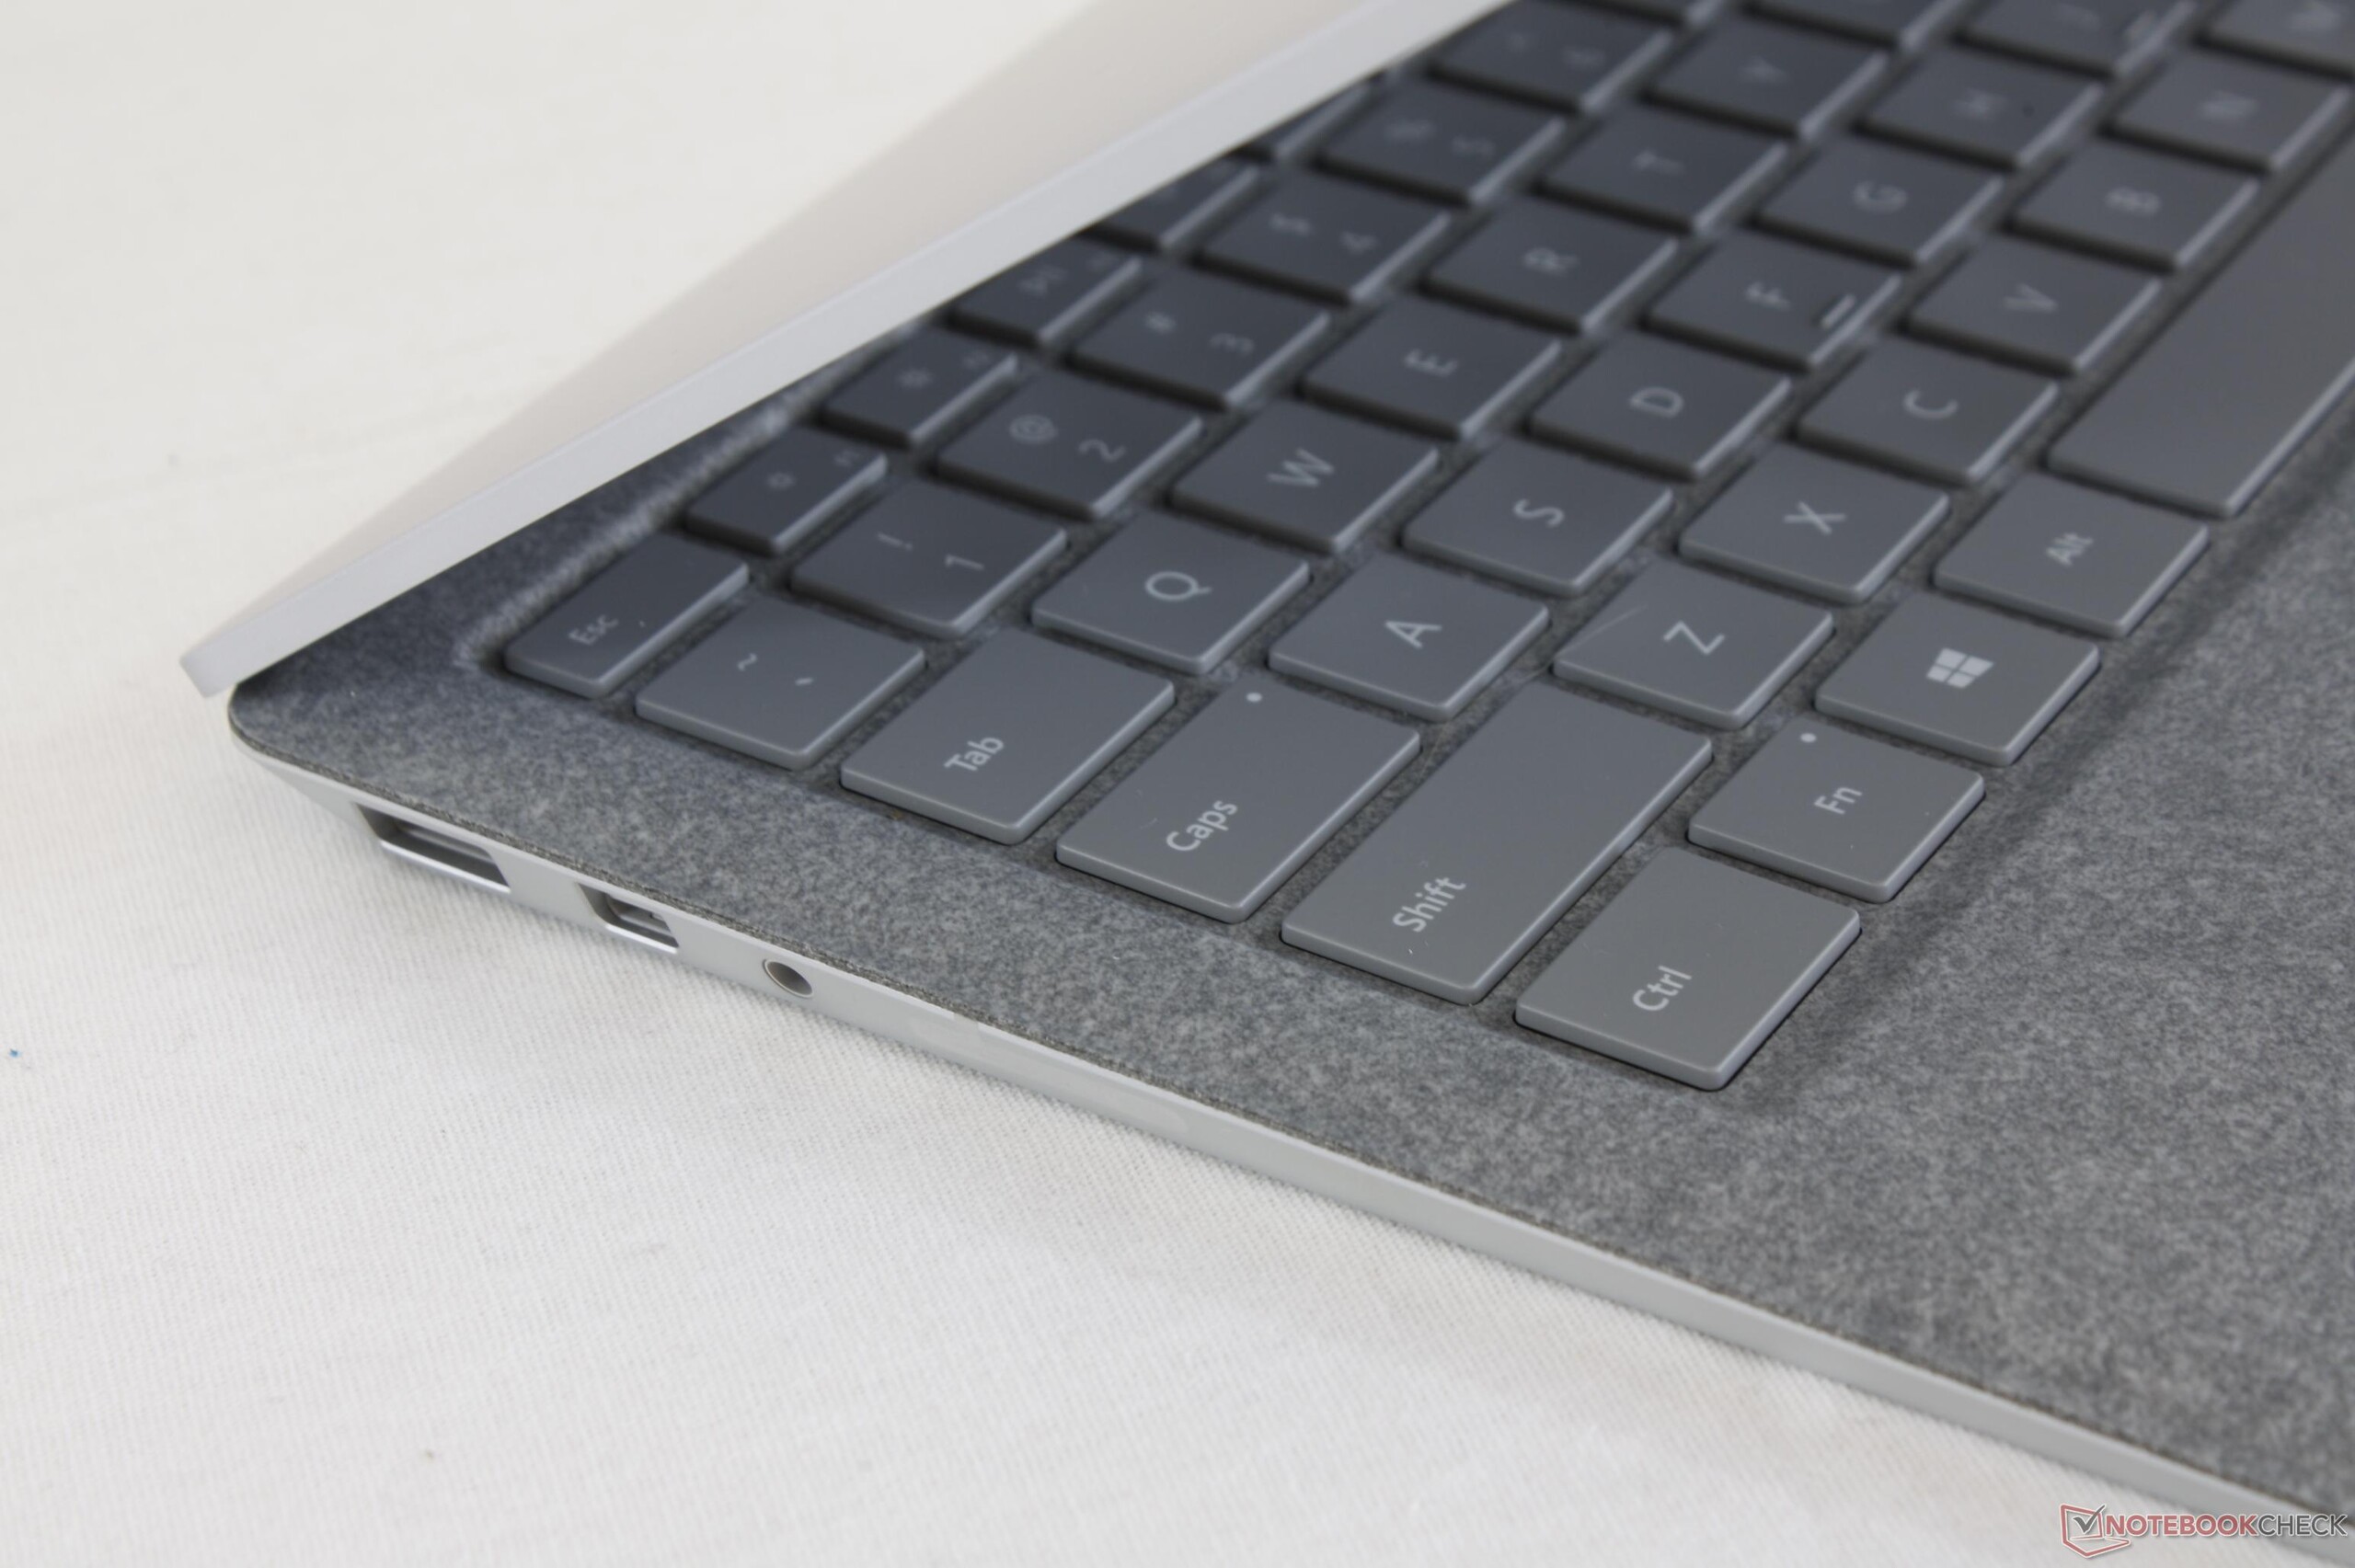
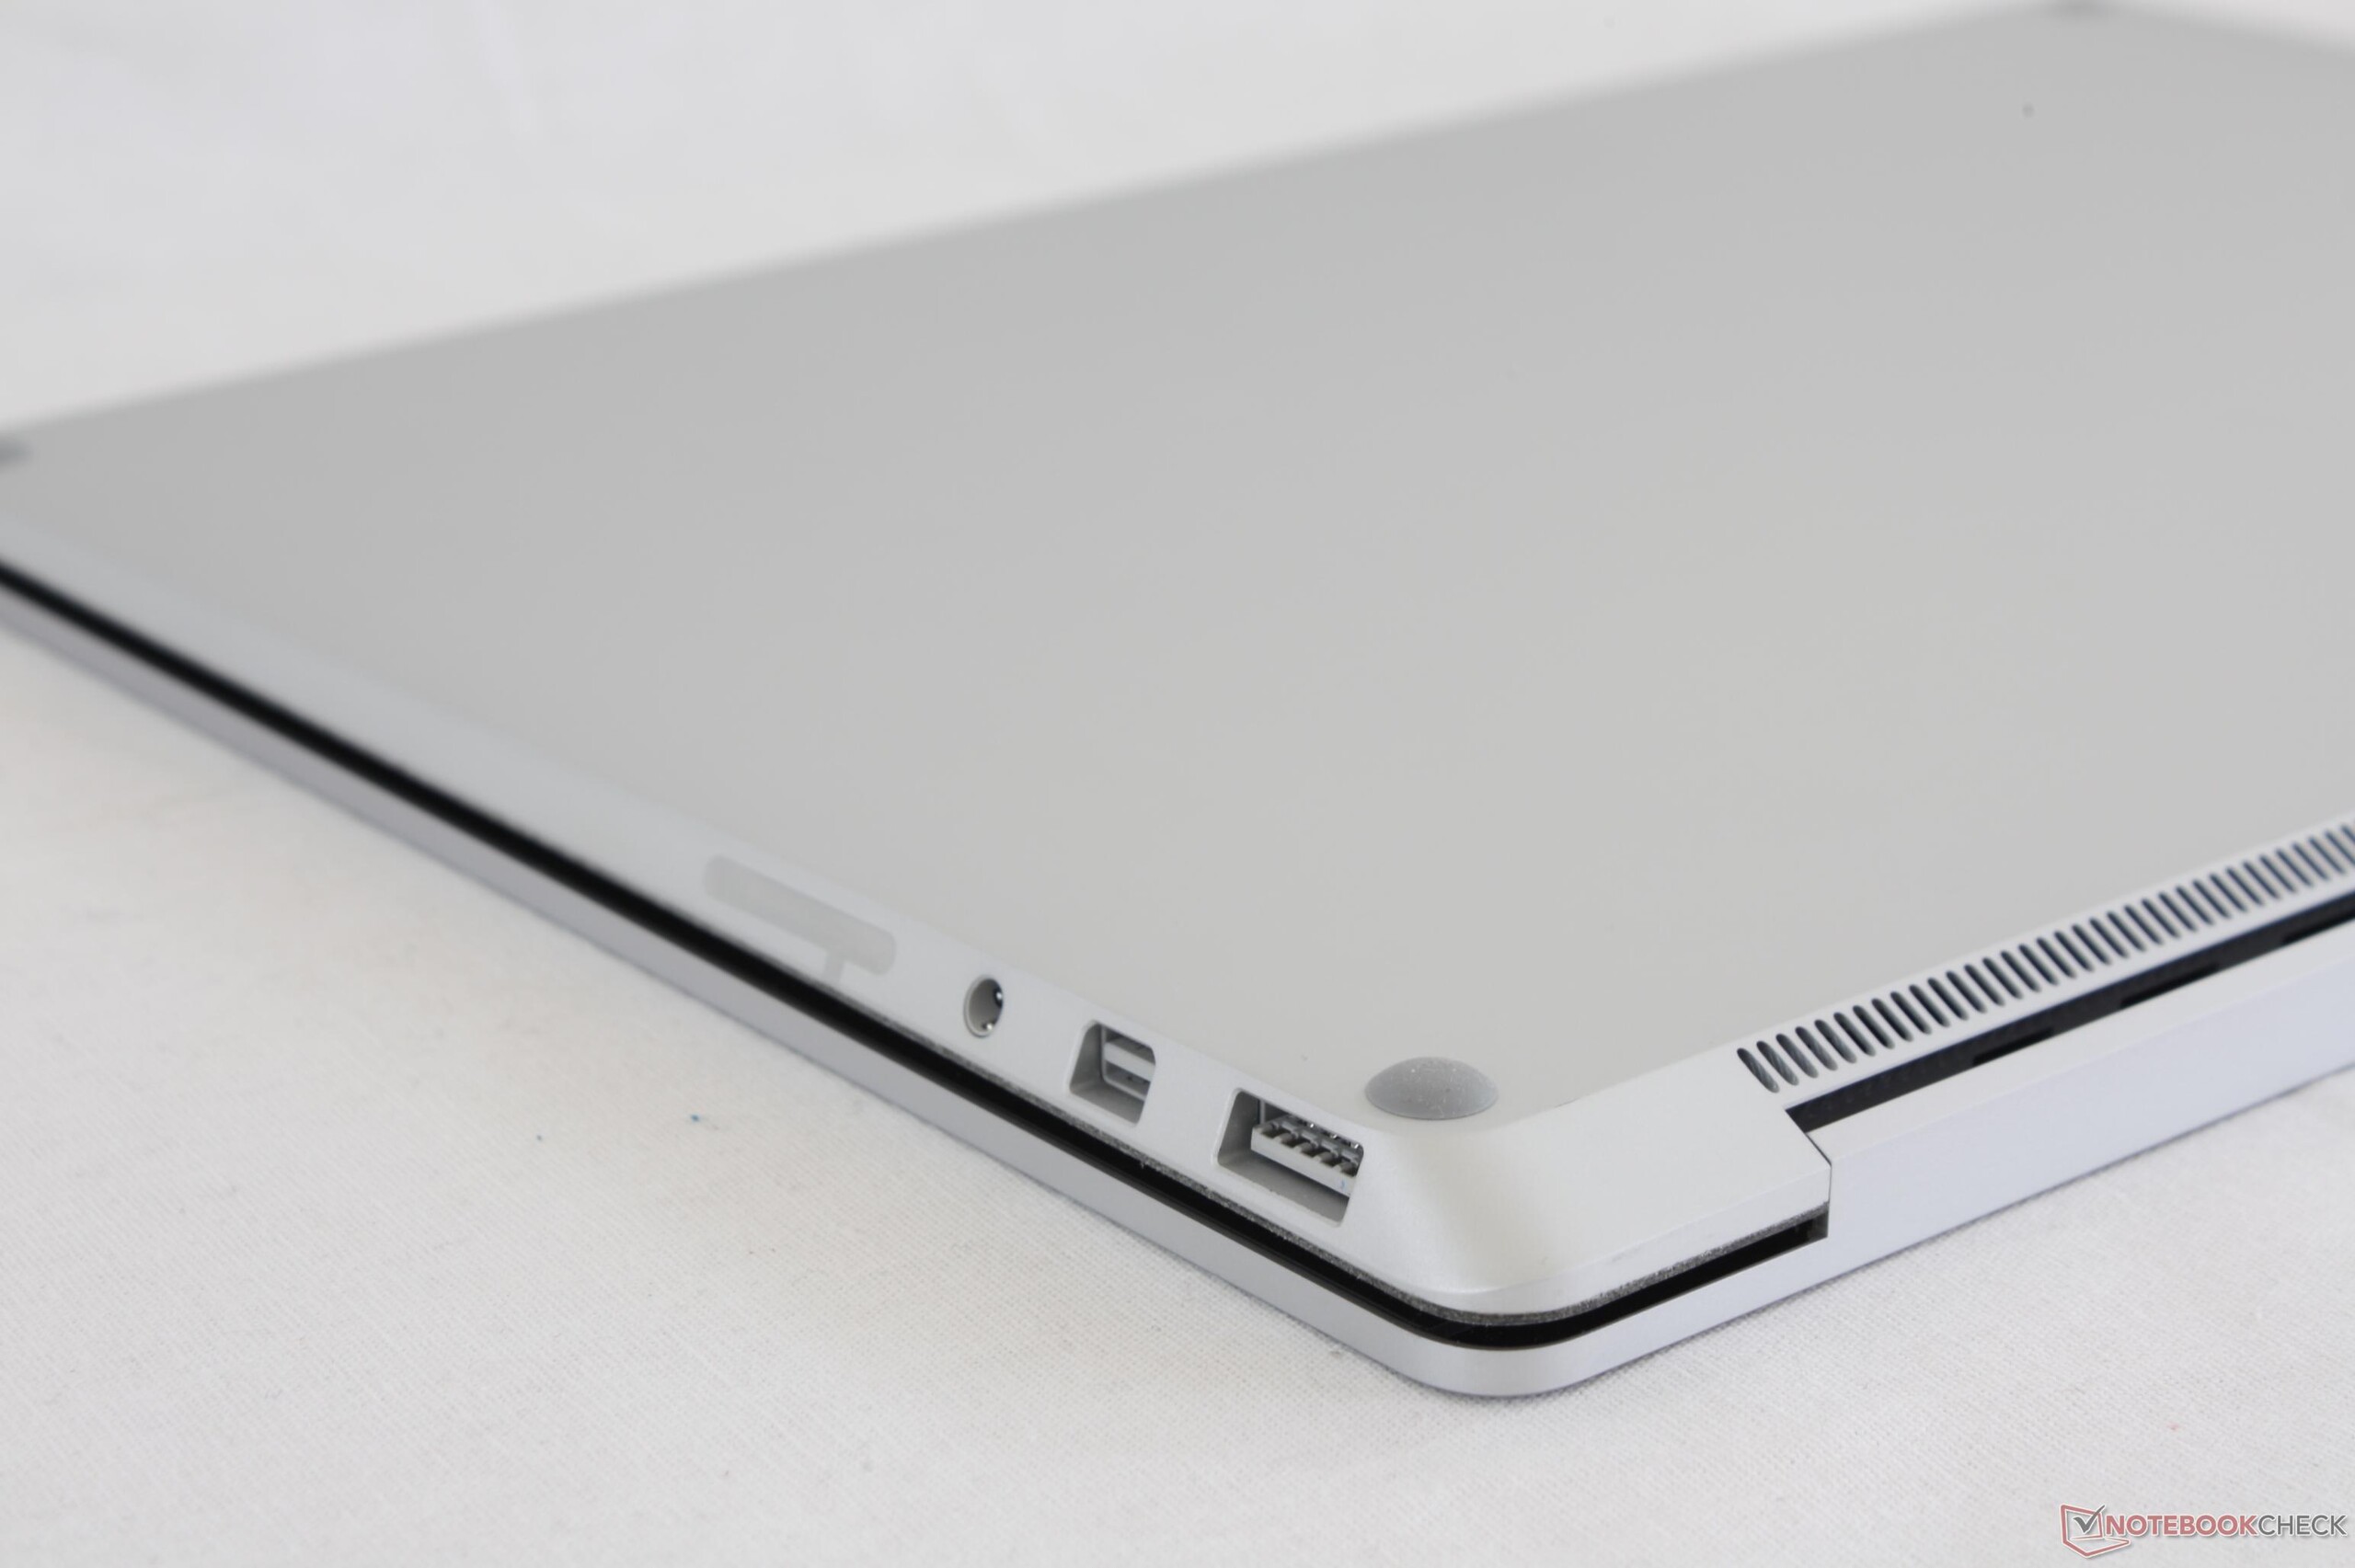
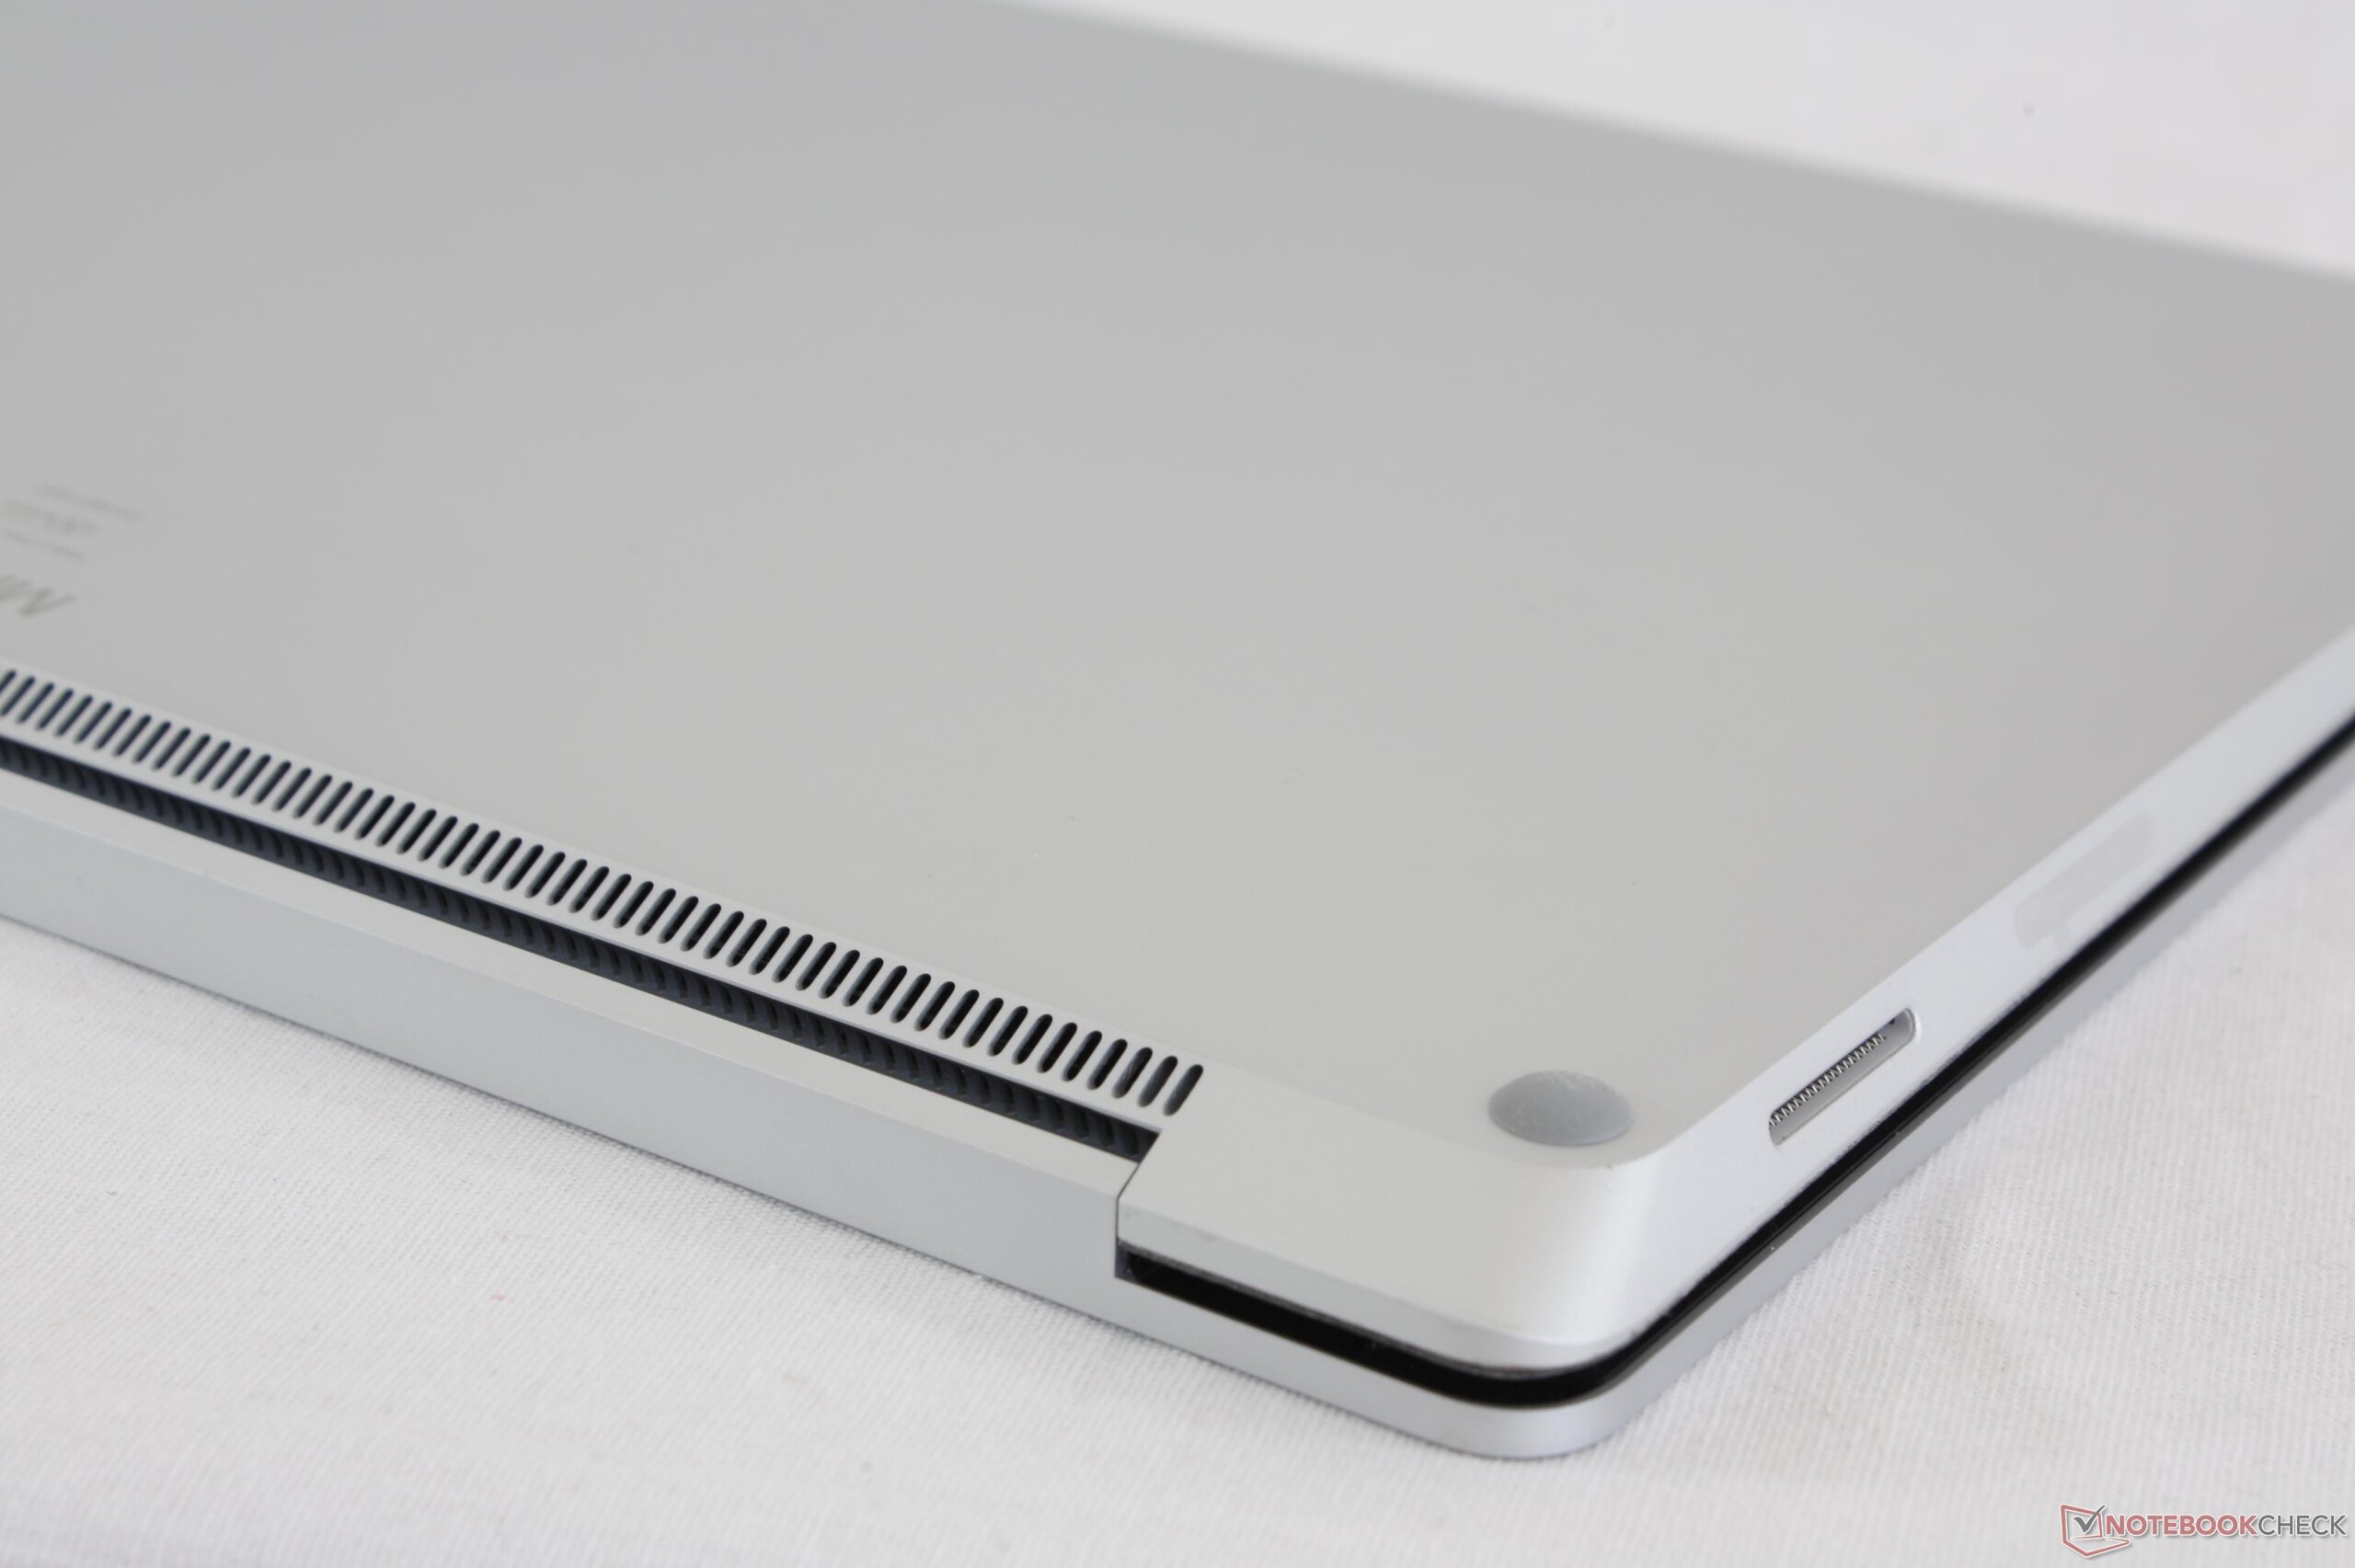
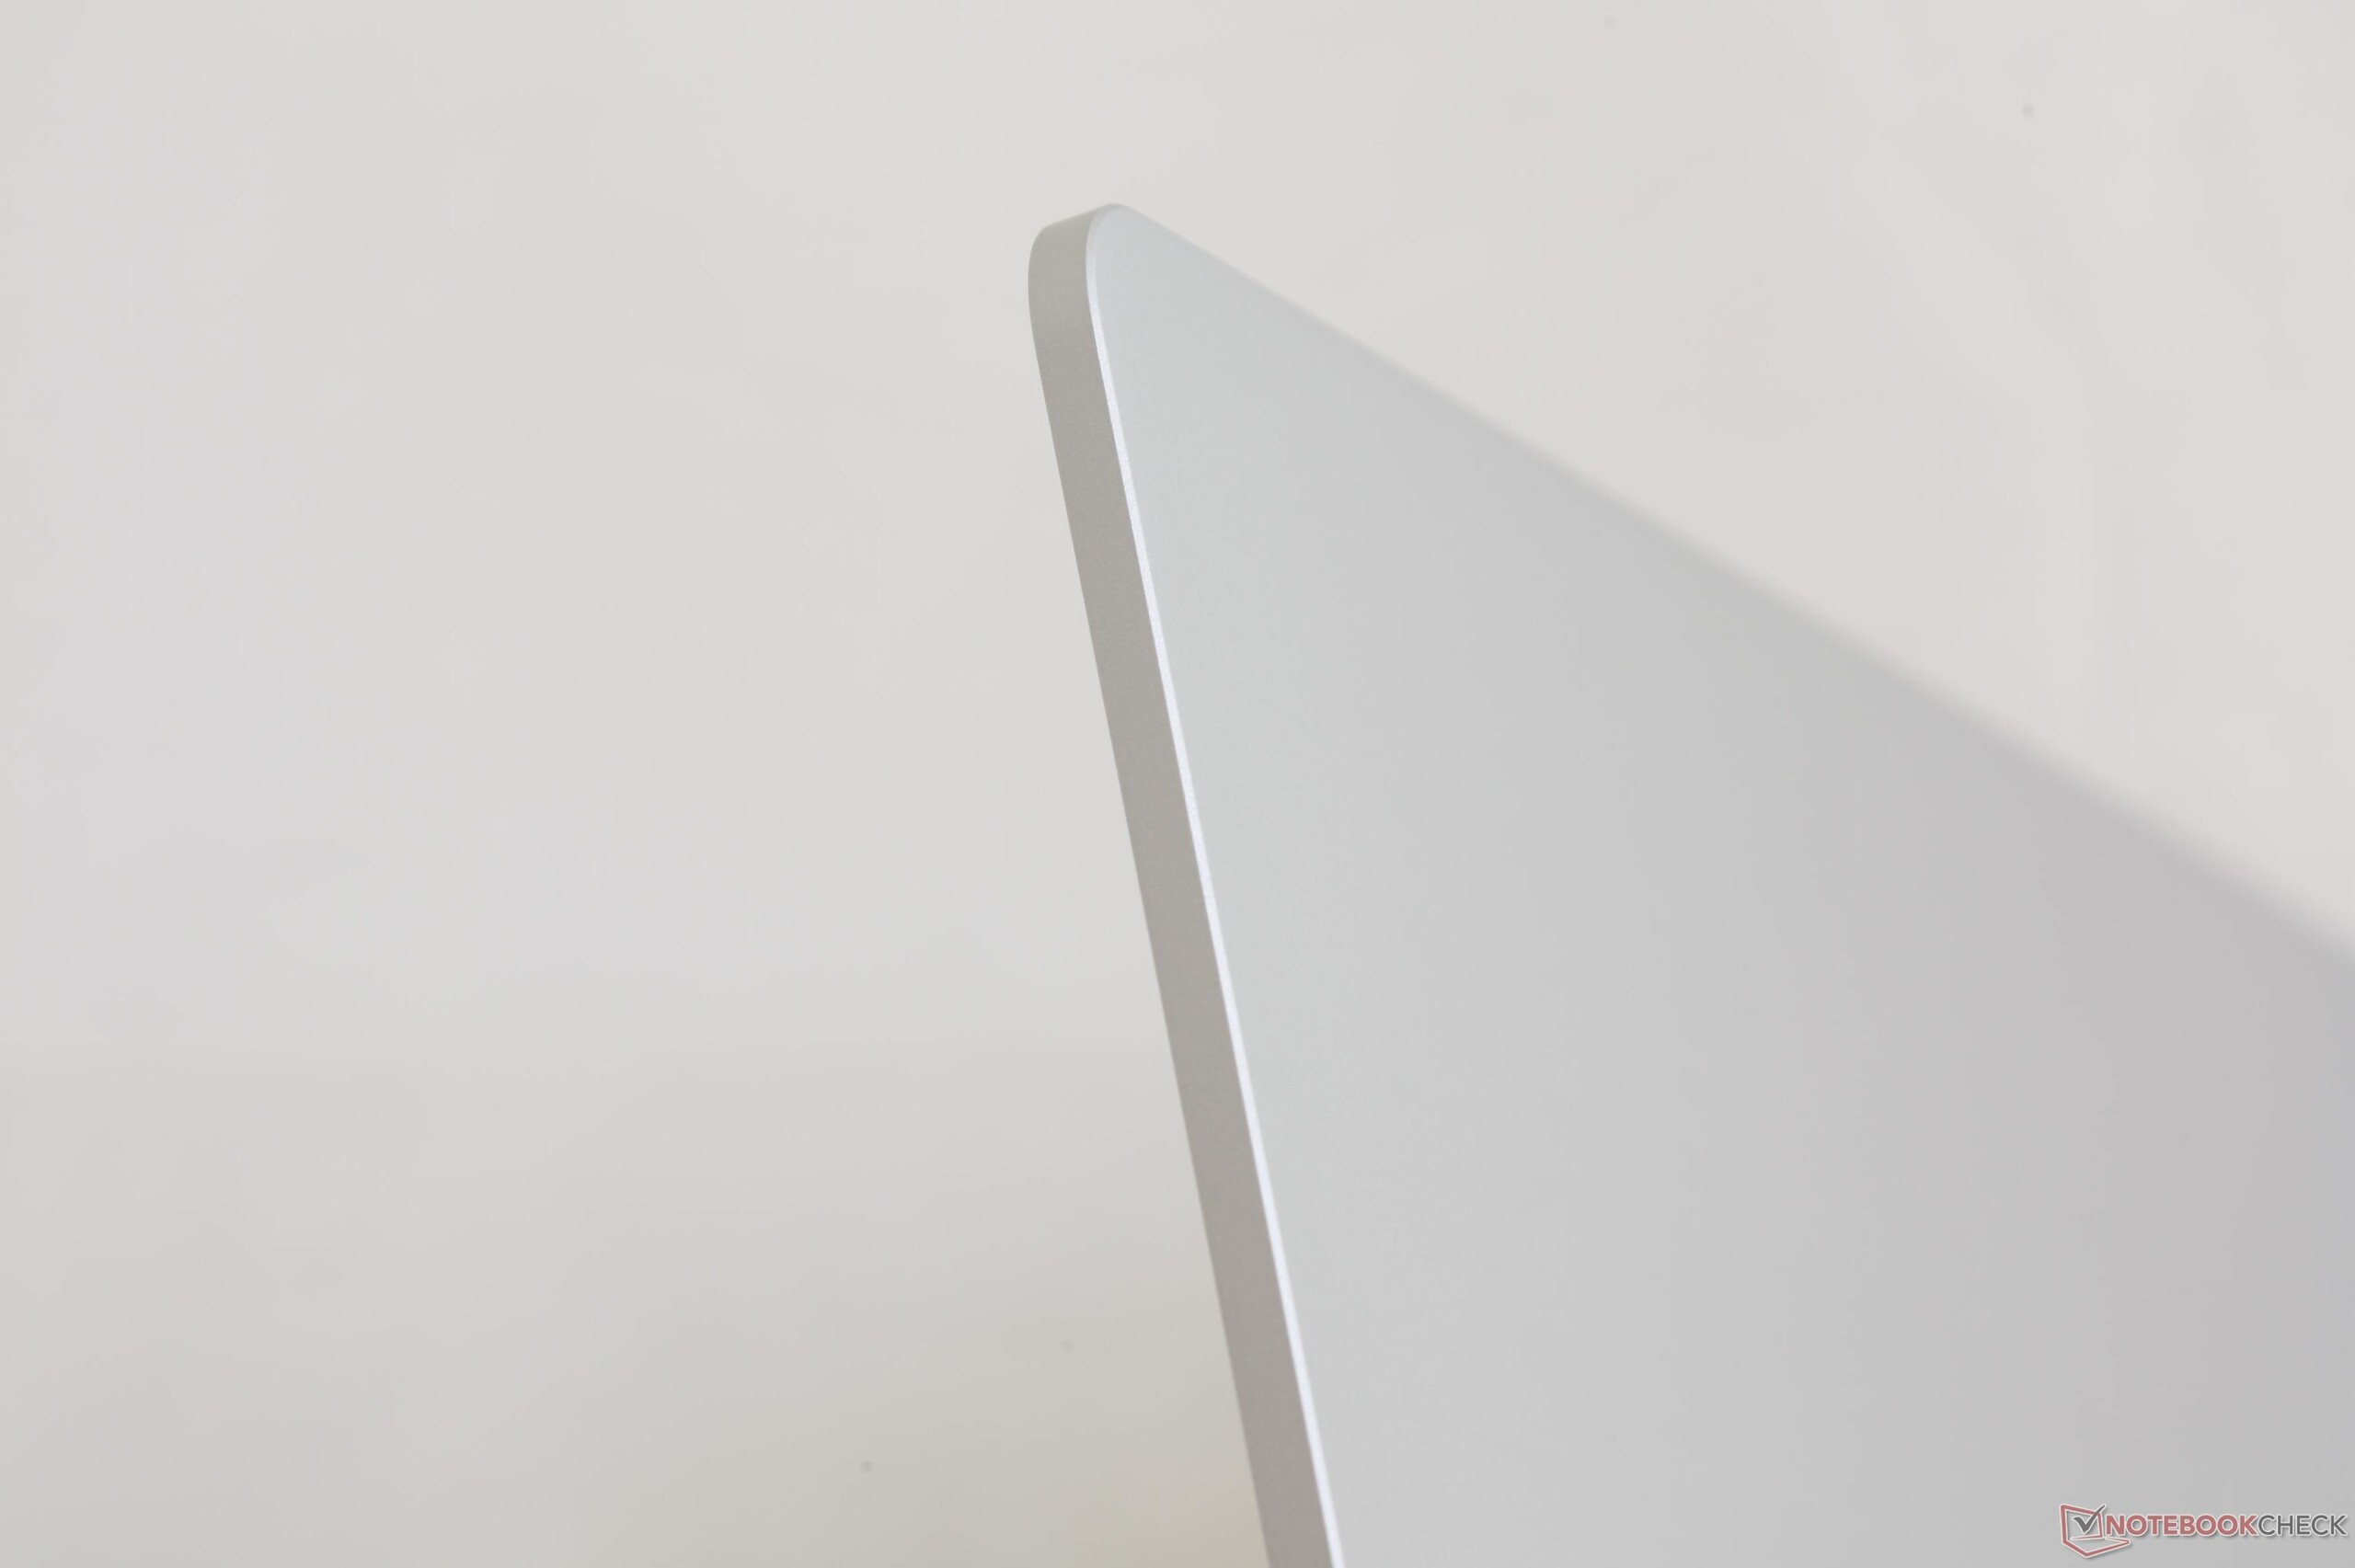
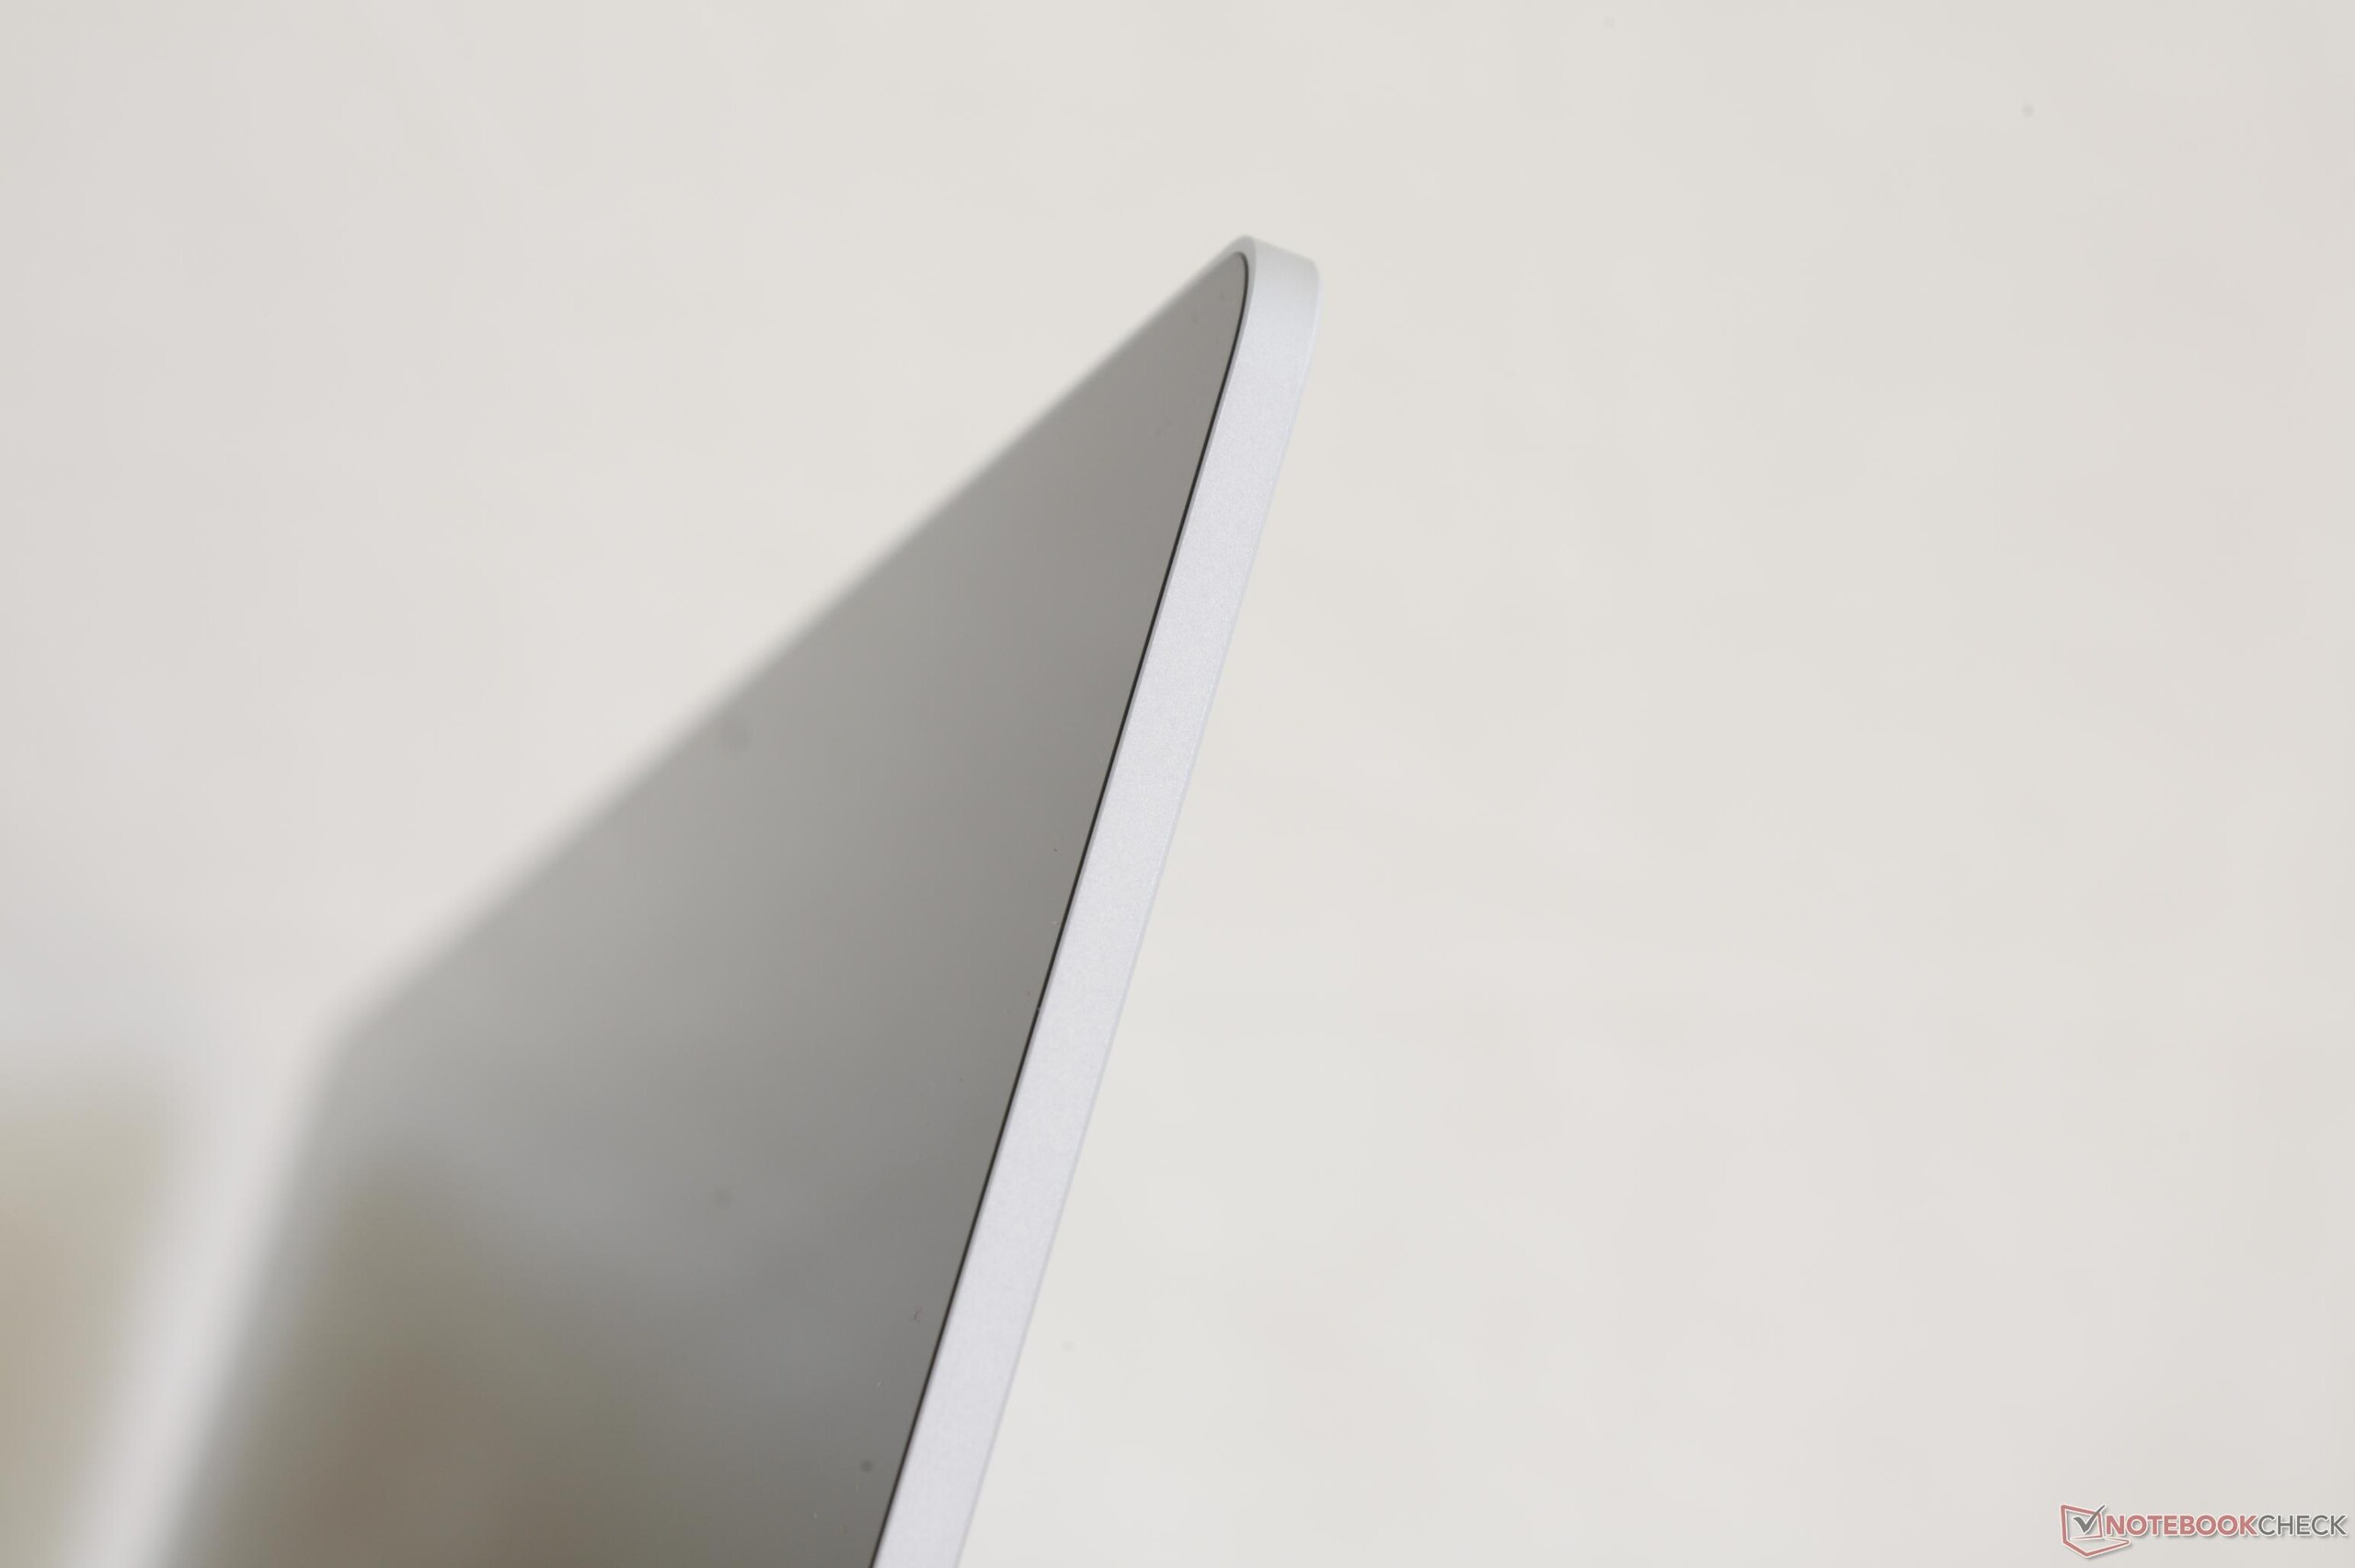
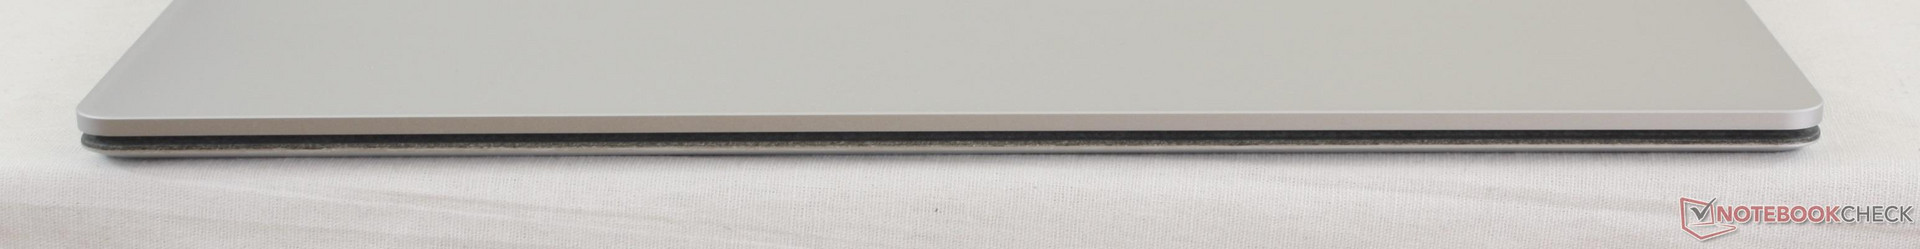
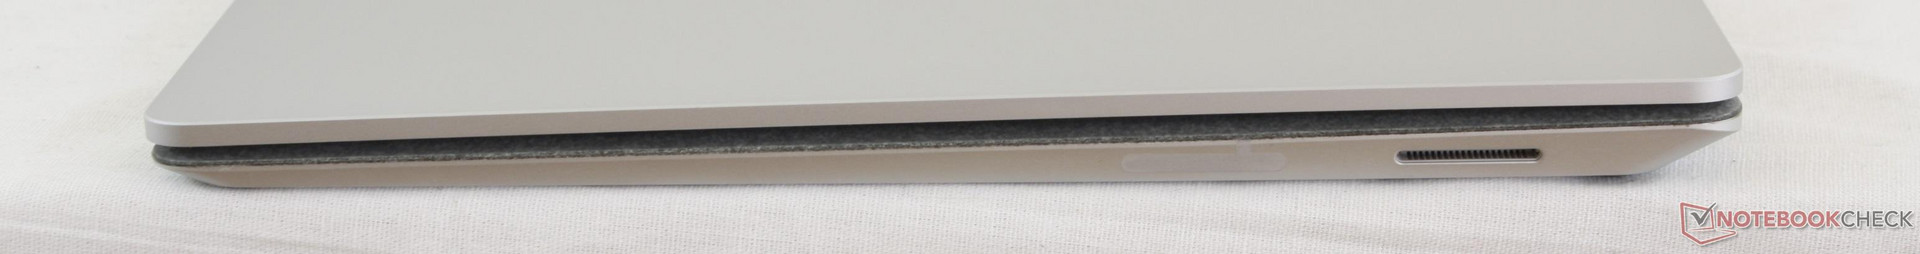
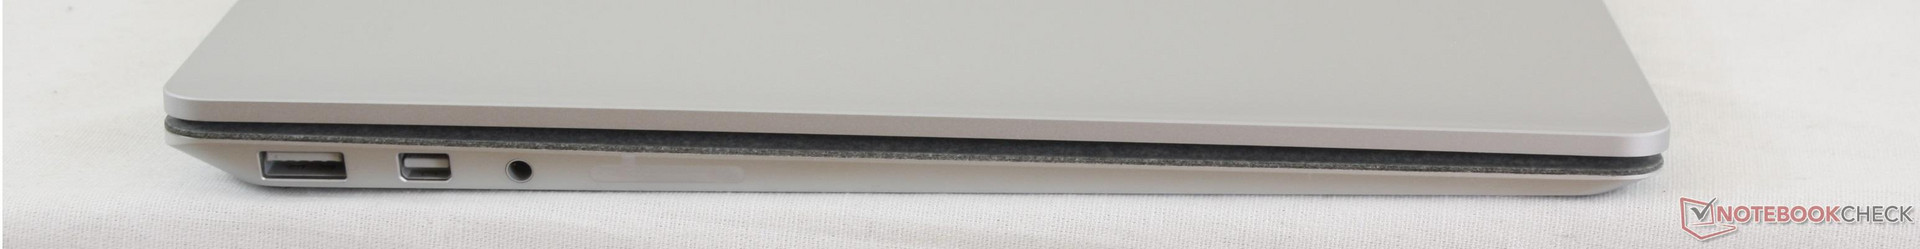
Microsoft adverteert de Surface Laptop als "meer dan een traditionele laptop", maar onze ervaring wijst op het tegenovergestelde. Als eigenschappen zoals USB Type-C, SD-kaartlezers en NVMe belangrijk zijn, dan ben je met de vlaggenschip Ultrabooks van Lenovo, HP en Dell beter af dan met het nieuwste lid van Microsoft's Surface familie. De Alcantara behuizing is zeker anders en geeft een uniek verkooppunt, maar de dit heeft geen praktische voordelen voor eindgebruikers.
De voornaamste reden om een Surface Laptop aan te schaffen is zijn 13.5-inch beeldscherm aangezien de rest van het notebook weinig indrukwekkend is. Als het 3:2 beeldscherm of de Iris Graphics SKU om wat voor reden ook niet belangrijk zijn, dan wordt het notebook al snel veel minder aantrekkelijk dan de overvloed aan 13- en 14-inch alternatieven die beschikbaar zijn. De lange batterijlevensduur, laag systeemgeluid en groot kleurbereik van het Microsoft notebook kunnen ook gevonden worden in concurrenten zoals de XPS 13 9360 QHD of Notebook 9.
Hoe de Core i7 SKU presteert onder belasting is interessant om te onderzoeken in een toekomstig testrapport. Als onze Core i5 configuratie al nauwelijks de Turbo Boost kloksnelheden van 2.7 tot 2.8 GHz aankan, dan vragen we ons af hoe de veeleisender Core i7 SKU zijn maximale Turbo Boost van 4.0 GHz kan halen. We zijn ook bezorgd over het DDR3 RAM dat het volledige prestatie potentieel van de Iris Plus Graphics 640 GPU beperkt, net als de HD Graphics 620 GPU ondermaats presteert in onze Core i5 configuratie.
Microsoft richt zijn marketing pijlen op studenten en vanuit dat opzicht waarderen we dat er niet bespaard is op de bouwkwaliteit. Dat gezegd hebbende, de lange lijst ontbrekende functionaliteiten beperkt de inzetbaarheid van de Surface Laptop ernstig en maakt het moeilijk voor ons om het notebook aan te bevelen voor studenten of doorsnee consumenten.
Te weinig, te laat. De Surface Laptop is een solide gebouwd notebook zonder fratsen en met een prachtig beeldscherm. Helaas biedt het weinig anders en is bij lange na niet zo veelzijdig als de Surface Pro 4 of de meeste Ultrabooks die momenteel te koop zijn.
Microsoft Surface Laptop i5
- 18-06-2017 v6 (old)
Allen Ngo
Price comparison
