Kort testrapport Dell Latitude 5280 (7200U, HD) Laptop

| SD Card Reader | |
| average JPG Copy Test (av. of 3 runs) | |
| Lenovo ThinkPad X270-20HMS00T00 | |
| HP EliteBook 725 G4 | |
| Dell Latitude 5280 | |
| maximum AS SSD Seq Read Test (1GB) | |
| Dell Latitude 5280 | |
| Lenovo ThinkPad X270-20HMS00T00 | |
| HP EliteBook 725 G4 | |
| Networking | |
| iperf3 transmit AX12 | |
| Lenovo ThinkPad X270-20HMS00T00 | |
| Dell Latitude 5289 | |
| Dell Latitude 5280 | |
| iperf3 receive AX12 | |
| Lenovo ThinkPad X270-20HMS00T00 | |
| Dell Latitude 5280 | |
| Dell Latitude 5289 | |
| |||||||||||||||||||||||||
Helderheidsverdeling: 90 %
Helderheid in Batterij-modus: 251.8 cd/m²
Contrast: 336:1 (Zwart: 0.75 cd/m²)
ΔE ColorChecker Calman: 11.3 | ∀{0.5-29.43 Ø4.71}
ΔE Greyscale Calman: 13.2 | ∀{0.09-98 Ø4.96}
59.2% sRGB (Argyll 1.6.3 3D)
37.6% AdobeRGB 1998 (Argyll 1.6.3 3D)
40.67% AdobeRGB 1998 (Argyll 3D)
59.2% sRGB (Argyll 3D)
39.34% Display P3 (Argyll 3D)
Gamma: 2.05
CCT: 14912 K
| Dell Latitude 5280 TN LED, 12.5", 1366x768 | Dell Latitude 5289 BOE NV12N51, IPS LED, 12.5", 1920x1080 | Lenovo ThinkPad X270-20HMS00T00 Innolux N125HCE-GN1, IPS LED, 12.5", 1920x1080 | HP EliteBook 725 G4 AU Optronics, IPS, 12.5", 1920x1080 | Dell Latitude 12 E5270 BOE05F4, TN, 12.5", 1366x768 | |
|---|---|---|---|---|---|
| Display | 9% | 12% | 24% | -1% | |
| Display P3 Coverage (%) | 39.34 | 42.79 9% | 44.6 13% 44.6 13% | 49.16 25% | 39.06 -1% |
| sRGB Coverage (%) | 59.2 | 64.3 9% | 65.9 11% 65.9 11% | 72.3 22% | 58.7 -1% |
| AdobeRGB 1998 Coverage (%) | 40.67 | 44.21 9% | 46.11 13% 46.11 13% | 50.8 25% | 40.36 -1% |
| Response Times | -17% | -14% | -8% | -6% | |
| Response Time Grey 50% / Grey 80% * (ms) | 42 ? | 42 ? -0% | 40.8 ? 3% | 47 ? -12% | 45.2 ? -8% |
| Response Time Black / White * (ms) | 23.2 ? | 31 ? -34% | 30.4 ? -31% | 24 ? -3% | 24 ? -3% |
| PWM Frequency (Hz) | 531 ? | 26040 ? | 1000 ? | ||
| Screen | 55% | 49% | 81% | 9% | |
| Brightness middle (cd/m²) | 251.8 | 336 33% | 283 12% | 329 31% | 161 -36% |
| Brightness (cd/m²) | 246 | 320 30% | 281 14% | 310 26% | 152 -38% |
| Brightness Distribution (%) | 90 | 90 0% | 94 4% | 88 -2% | 90 0% |
| Black Level * (cd/m²) | 0.75 | 0.34 55% | 0.25 67% | 0.19 75% | 0.29 61% |
| Contrast (:1) | 336 | 988 194% | 1132 237% | 1732 415% | 555 65% |
| Colorchecker dE 2000 * | 11.3 | 3.45 69% | 6.1 46% | 2.69 76% | 10.31 9% |
| Colorchecker dE 2000 max. * | 23.1 | 7.95 66% | 15.4 33% | 4.47 81% | 18.58 20% |
| Greyscale dE 2000 * | 13.2 | 1.68 87% | 6 55% | 4.23 68% | 11.3 14% |
| Gamma | 2.05 107% | 2.49 88% | 2.05 107% | 2.21 100% | 2.57 86% |
| CCT | 14912 44% | 6782 96% | 6832 95% | 6011 108% | 13574 48% |
| Color Space (Percent of AdobeRGB 1998) (%) | 37.6 | 41 9% | 42.26 12% | 46 22% | 37.32 -1% |
| Color Space (Percent of sRGB) (%) | 59.2 | 64 8% | 65.43 11% | 72 22% | 58.82 -1% |
| Totaal Gemiddelde (Programma / Instellingen) | 16% /
36% | 16% /
30% | 32% /
58% | 1% /
5% |
* ... kleiner is beter
Responstijd Scherm
| ↔ Responstijd Zwart naar Wit | ||
|---|---|---|
| 23.2 ms ... stijging ↗ en daling ↘ gecombineerd | ↗ 17.2 ms stijging | 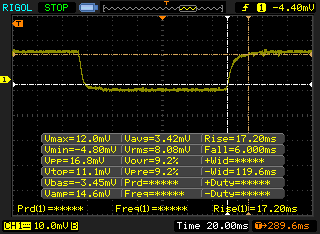 |
| ↘ 6 ms daling | ||
| Het scherm vertoonde prima responstijden in onze tests maar is misschien wat te traag voor competitieve games. Ter vergelijking: alle testtoestellen variëren van 0.1 (minimum) tot 240 (maximum) ms. » 53 % van alle toestellen zijn beter. Dit betekent dat de gemeten responstijd slechter is dan het gemiddelde (19.8 ms) van alle geteste toestellen. | ||
| ↔ Responstijd 50% Grijs naar 80% Grijs | ||
| 42 ms ... stijging ↗ en daling ↘ gecombineerd | ↗ 21.2 ms stijging | 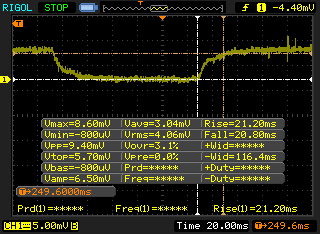 |
| ↘ 20.8 ms daling | ||
| Het scherm vertoonde trage responstijden in onze tests en is misschien te traag voor games. Ter vergelijking: alle testtoestellen variëren van 0.165 (minimum) tot 636 (maximum) ms. » 67 % van alle toestellen zijn beter. Dit betekent dat de gemeten responstijd slechter is dan het gemiddelde (30.9 ms) van alle geteste toestellen. | ||
Screen Flickering / PWM (Pulse-Width Modulation)
| Screen flickering / PWM niet waargenomen | 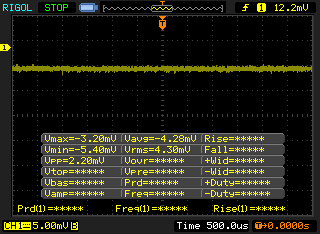 | ||
Ter vergelijking: 52 % van alle geteste toestellen maakten geen gebruik van PWM om de schermhelderheid te verlagen. Als het wel werd gebruikt, werd een gemiddelde van 7748 (minimum: 5 - maximum: 343500) Hz waargenomen. | |||
| wPrime 2.10 - 1024m | |
| Lenovo Thinkpad 13-20J1001BUS | |
| Dell Latitude E7470 N001LE747014EMEA | |
| Dell Latitude 7280 | |
| HP EliteBook 725 G4 | |
| Dell Latitude 5580 | |
| Dell Latitude 5280 | |
| Lenovo ThinkPad T470s-20HF0012US | |
* ... kleiner is beter
| PCMark 8 | |
| Home Score Accelerated v2 | |
| Lenovo ThinkPad X270-20HMS00T00 | |
| Dell Latitude 5289 | |
| Dell Latitude 5280 | |
| Dell Latitude 12 E5270 | |
| HP EliteBook 725 G4 | |
| Work Score Accelerated v2 | |
| Dell Latitude 5289 | |
| Lenovo ThinkPad X270-20HMS00T00 | |
| Dell Latitude 5280 | |
| Dell Latitude 12 E5270 | |
| HP EliteBook 725 G4 | |
| Creative Score Accelerated v2 | |
| Dell Latitude 5280 | |
| Dell Latitude 12 E5270 | |
| HP EliteBook 725 G4 | |
| PCMark 8 Home Score Accelerated v2 | 3409 punten | |
| PCMark 8 Creative Score Accelerated v2 | 3928 punten | |
| PCMark 8 Work Score Accelerated v2 | 4365 punten | |
Help | ||
| Dell Latitude 5280 Toshiba MQ01ACF050 | Dell Latitude 5289 SanDisk X400 256GB, SATA (SD8SB8U-256G) | Lenovo ThinkPad X270-20HMS00T00 Toshiba NVMe THNSF5512GPUK | HP EliteBook 725 G4 Samsung PM961 MZVLW256HEHP | Dell Latitude 12 E5270 Seagate ST500LM021-1KJ15 | |
|---|---|---|---|---|---|
| CrystalDiskMark 3.0 | 9086% | 18752% | 6641% | -1% | |
| Read Seq (MB/s) | 107.5 | 423.7 294% | 1190 1007% | 1963 1726% | 113.8 6% |
| Write Seq (MB/s) | 95.3 | 406.4 326% | 985 934% | 1409 1378% | 108.5 14% |
| Read 512 (MB/s) | 31.13 | 260.8 738% | 858 2656% | 949 2949% | 24.9 -20% |
| Write 512 (MB/s) | 45.49 | 255.6 462% | 528 1061% | 890 1856% | 51.9 14% |
| Read 4k (MB/s) | 0.357 | 22.73 6267% | 35.27 9780% | 29.75 8233% | 0.398 11% |
| Write 4k (MB/s) | 0.827 | 27.92 3276% | 124.5 14954% | 47.35 5626% | 0.654 -21% |
| Read 4k QD32 (MB/s) | 0.737 | 306.2 41447% | 495.3 67105% | 139.7 18855% | 0.798 8% |
| Write 4k QD32 (MB/s) | 0.795 | 158.8 19875% | 418.3 52516% | 100.2 12504% | 0.636 -20% |

| 3DMark 11 | |
| 1280x720 Performance GPU | |
| Intel Skull Canyon NUC6i7KYK | |
| Dell Latitude 7480 | |
| Acer Swift 3 SF314-51-731X | |
| Dell Latitude 5280 | |
| Dell Latitude 5580 | |
| Dell XPS 13 9365-4537 2-in-1 | |
| Lenovo Yoga 900S-12ISK-80ML | |
| 1280x720 Performance Combined | |
| Intel Skull Canyon NUC6i7KYK | |
| Dell Latitude 7480 | |
| Acer Swift 3 SF314-51-731X | |
| Dell XPS 13 9365-4537 2-in-1 | |
| Dell Latitude 5280 | |
| Dell Latitude 5580 | |
| Lenovo Yoga 900S-12ISK-80ML | |
| 3DMark | |
| 1280x720 Cloud Gate Standard Graphics | |
| Intel Skull Canyon NUC6i7KYK | |
| Dell Latitude 7480 | |
| Acer Swift 3 SF314-51-731X | |
| Dell Latitude 5280 | |
| Dell Latitude 5580 | |
| Lenovo Yoga 900S-12ISK-80ML | |
| 1920x1080 Fire Strike Graphics | |
| Intel Skull Canyon NUC6i7KYK | |
| Dell Latitude 7480 | |
| Dell Latitude 5280 | |
| Dell Latitude 5580 | |
| Lenovo Yoga 900S-12ISK-80ML | |
| 1920x1080 Ice Storm Extreme Graphics | |
| Intel Skull Canyon NUC6i7KYK | |
| Dell Latitude 7480 | |
| Dell Latitude 5280 | |
| Dell Latitude 5580 | |
| Lenovo Yoga 900S-12ISK-80ML | |
| 3DMark 11 Performance | 1378 punten | |
| 3DMark Ice Storm Standard Score | 49846 punten | |
| 3DMark Cloud Gate Standard Score | 5281 punten | |
| 3DMark Fire Strike Score | 633 punten | |
Help | ||
| lage | gem. | hoge | ultra | |
|---|---|---|---|---|
| BioShock Infinite (2013) | 29.9 | 20.9 | 18 | |
| Rise of the Tomb Raider (2016) | 14 |
Geluidsniveau
| Onbelast |
| 32.6 / 32.7 / 32.7 dB (A) |
| HDD |
| 33 dB (A) |
| Belasting |
| 33.4 / 37 dB (A) |
 | ||
30 dB stil 40 dB(A) hoorbaar 50 dB(A) luid |
||
min: | ||
| Dell Latitude 5280 HD Graphics 620, i5-7200U, Toshiba MQ01ACF050 | Dell Latitude 5289 HD Graphics 620, i5-7300U, SanDisk X400 256GB, SATA (SD8SB8U-256G) | Lenovo ThinkPad X270-20HMS00T00 HD Graphics 620, i5-7200U, Toshiba NVMe THNSF5512GPUK | HP EliteBook 725 G4 Radeon R7 (Bristol Ridge), PRO A12-9800B, Samsung PM961 MZVLW256HEHP | Dell Latitude 12 E5270 HD Graphics 520, 6300U, Seagate ST500LM021-1KJ15 | |
|---|---|---|---|---|---|
| Noise | 1% | 3% | 4% | -1% | |
| uit / omgeving * (dB) | 27.6 | 30.5 -11% | 29 -5% | 30.4 -10% | 29.2 -6% |
| Idle Minimum * (dB) | 32.6 | 30.5 6% | 29 11% | 30.4 7% | 32.9 -1% |
| Idle Average * (dB) | 32.7 | 30.5 7% | 29 11% | 30.4 7% | 32.9 -1% |
| Idle Maximum * (dB) | 32.7 | 30.5 7% | 30.4 7% | 30.4 7% | 32.9 -1% |
| Load Average * (dB) | 33.4 | 36 -8% | 34.1 -2% | 31.7 5% | 33.7 -1% |
| Load Maximum * (dB) | 37 | 34.6 6% | 37.6 -2% | 34.4 7% | 34.9 6% |
* ... kleiner is beter
(-) De maximumtemperatuur aan de bovenzijde bedraagt 48.4 °C / 119 F, vergeleken met het gemiddelde van 35.9 °C / 97 F, variërend van 21.4 tot 59 °C voor de klasse Subnotebook.
(-) De bodem warmt op tot een maximum van 49.2 °C / 121 F, vergeleken met een gemiddelde van 39.2 °C / 103 F
(+) Bij onbelast gebruik bedraagt de gemiddelde temperatuur voor de bovenzijde 25 °C / 77 F, vergeleken met het apparaatgemiddelde van 30.8 °C / 87 F.
(+) De palmsteunen en het touchpad zijn met een maximum van ###max## °C / 83.1 F koeler dan de huidtemperatuur en voelen daarom koel aan.
(±) De gemiddelde temperatuur van de handpalmsteun van soortgelijke toestellen bedroeg 28.2 °C / 82.8 F (-0.2 °C / -0.3 F).
Dell Latitude 5280 audioanalyse
(±) | luidspreker luidheid is gemiddeld maar goed (81.1 dB)
Bas 100 - 315 Hz
(-) | bijna geen lage tonen - gemiddeld 20.2% lager dan de mediaan
(±) | lineariteit van de lage tonen is gemiddeld (12.4% delta ten opzichte van de vorige frequentie)
Midden 400 - 2000 Hz
(+) | evenwichtige middens - slechts 4% verwijderd van de mediaan
(±) | lineariteit van de middentonen is gemiddeld (9.5% delta ten opzichte van de vorige frequentie)
Hoog 2 - 16 kHz
(±) | higher highs - on average 5.8% higher than median
(±) | lineariteit van de hoogtepunten is gemiddeld (9.8% delta ten opzichte van de vorige frequentie)
Algemeen 100 - 16.000 Hz
(±) | lineariteit van het totale geluid is gemiddeld (25.4% verschil met de mediaan)
Vergeleken met dezelfde klasse
» 85% van alle geteste apparaten in deze klasse waren beter, 3% vergelijkbaar, 11% slechter
» De beste had een delta van 5%, het gemiddelde was 18%, de slechtste was 53%
Vergeleken met alle geteste toestellen
» 78% van alle geteste apparaten waren beter, 5% gelijk, 17% slechter
» De beste had een delta van 4%, het gemiddelde was 23%, de slechtste was 134%
Apple MacBook 12 (Early 2016) 1.1 GHz audioanalyse
(+) | luidsprekers kunnen relatief luid spelen (83.6 dB)
Bas 100 - 315 Hz
(±) | verminderde zeebaars - gemiddeld 11.3% lager dan de mediaan
(±) | lineariteit van de lage tonen is gemiddeld (14.2% delta ten opzichte van de vorige frequentie)
Midden 400 - 2000 Hz
(+) | evenwichtige middens - slechts 2.4% verwijderd van de mediaan
(+) | de middentonen zijn lineair (5.5% delta ten opzichte van de vorige frequentie)
Hoog 2 - 16 kHz
(+) | evenwichtige hoogtepunten - slechts 2% verwijderd van de mediaan
(+) | de hoge tonen zijn lineair (4.5% delta naar de vorige frequentie)
Algemeen 100 - 16.000 Hz
(+) | het totale geluid is lineair (10.2% verschil met de mediaan)
Vergeleken met dezelfde klasse
» 7% van alle geteste apparaten in deze klasse waren beter, 2% vergelijkbaar, 90% slechter
» De beste had een delta van 5%, het gemiddelde was 18%, de slechtste was 53%
Vergeleken met alle geteste toestellen
» 5% van alle geteste apparaten waren beter, 1% gelijk, 94% slechter
» De beste had een delta van 4%, het gemiddelde was 23%, de slechtste was 134%
| Uit / Standby | |
| Inactief | |
| Belasting |
|
Key:
min: | |
| Dell Latitude 5280 i5-7200U, HD Graphics 620, Toshiba MQ01ACF050, TN LED, 1366x768, 12.5" | Dell Latitude 5289 i5-7300U, HD Graphics 620, SanDisk X400 256GB, SATA (SD8SB8U-256G), IPS LED, 1920x1080, 12.5" | Lenovo ThinkPad X270-20HMS00T00 i5-7200U, HD Graphics 620, Toshiba NVMe THNSF5512GPUK, IPS LED, 1920x1080, 12.5" | HP EliteBook 725 G4 PRO A12-9800B, Radeon R7 (Bristol Ridge), Samsung PM961 MZVLW256HEHP, IPS, 1920x1080, 12.5" | Dell Latitude 12 E5270 6300U, HD Graphics 520, Seagate ST500LM021-1KJ15, TN, 1366x768, 12.5" | |
|---|---|---|---|---|---|
| Power Consumption | 12% | -1% | 0% | 2% | |
| Idle Minimum * (Watt) | 5.7 | 2.7 53% | 3.5 39% | 4.5 21% | 3.9 32% |
| Idle Average * (Watt) | 6.9 | 5.1 26% | 5.8 16% | 6.3 9% | 6 13% |
| Idle Maximum * (Watt) | 7.1 | 7.6 -7% | 7.6 -7% | 8.3 -17% | 6.6 7% |
| Load Average * (Watt) | 28.3 | 33 -17% | 33.2 -17% | 27.6 2% | 28.9 -2% |
| Load Maximum * (Watt) | 30.2 | 29 4% | 40.4 -34% | 34.5 -14% | 41.7 -38% |
* ... kleiner is beter
| Dell Latitude 5280 i5-7200U, HD Graphics 620, 51 Wh | Dell Latitude 5289 i5-7300U, HD Graphics 620, 60 Wh | Lenovo ThinkPad X270-20HMS00T00 i5-7200U, HD Graphics 620, 46 Wh | HP EliteBook 725 G4 PRO A12-9800B, Radeon R7 (Bristol Ridge), 49 Wh | Dell Latitude 12 E5270 6300U, HD Graphics 520, 47 Wh | |
|---|---|---|---|---|---|
| Batterijduur | 36% | -22% | -22% | -18% | |
| Reader / Idle (h) | 18.5 | 28.8 56% | 17.1 -8% | 11.7 -37% | 12.9 -30% |
| WiFi v1.3 (h) | 7.8 | 11.8 51% | 5.4 -31% | 6.3 -19% | 6.6 -15% |
| Load (h) | 2.3 | 2.3 0% | 1.7 -26% | 2.1 -9% | 2.1 -9% |
Pro
Contra
Dit is de verkorte versie van het originele artikel. Het volledige, Engelse testrapport vind je hier.
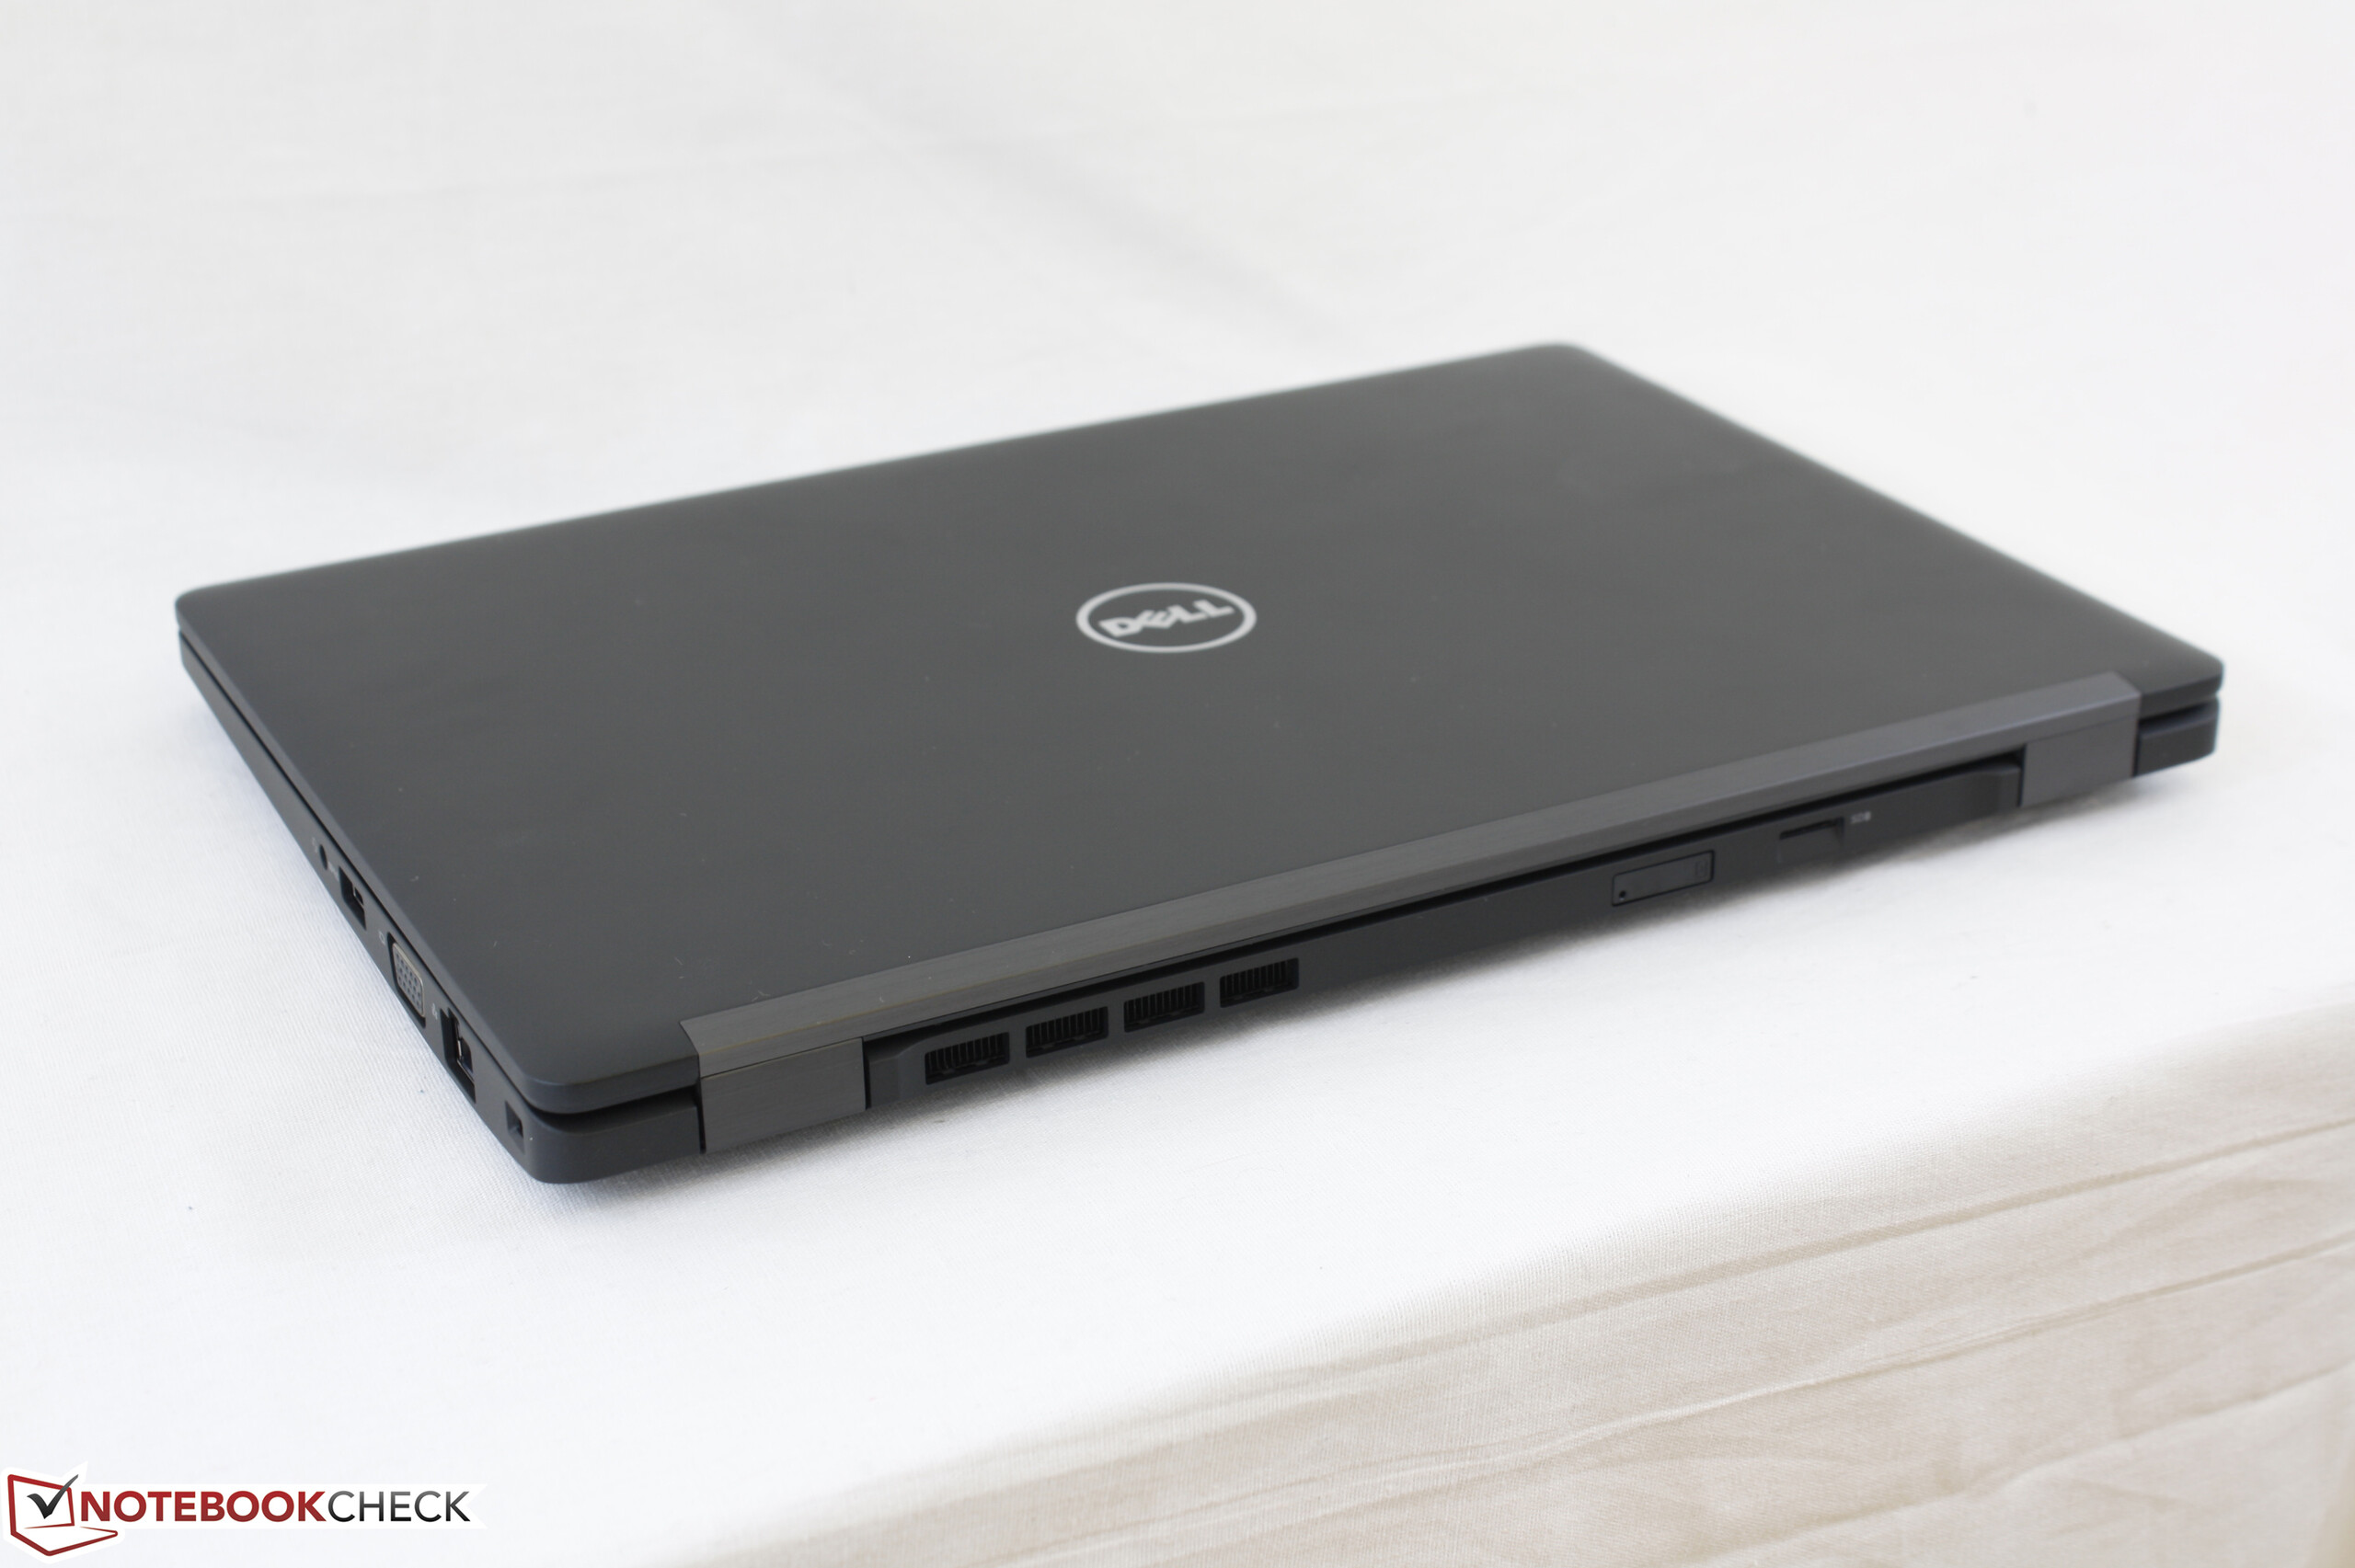
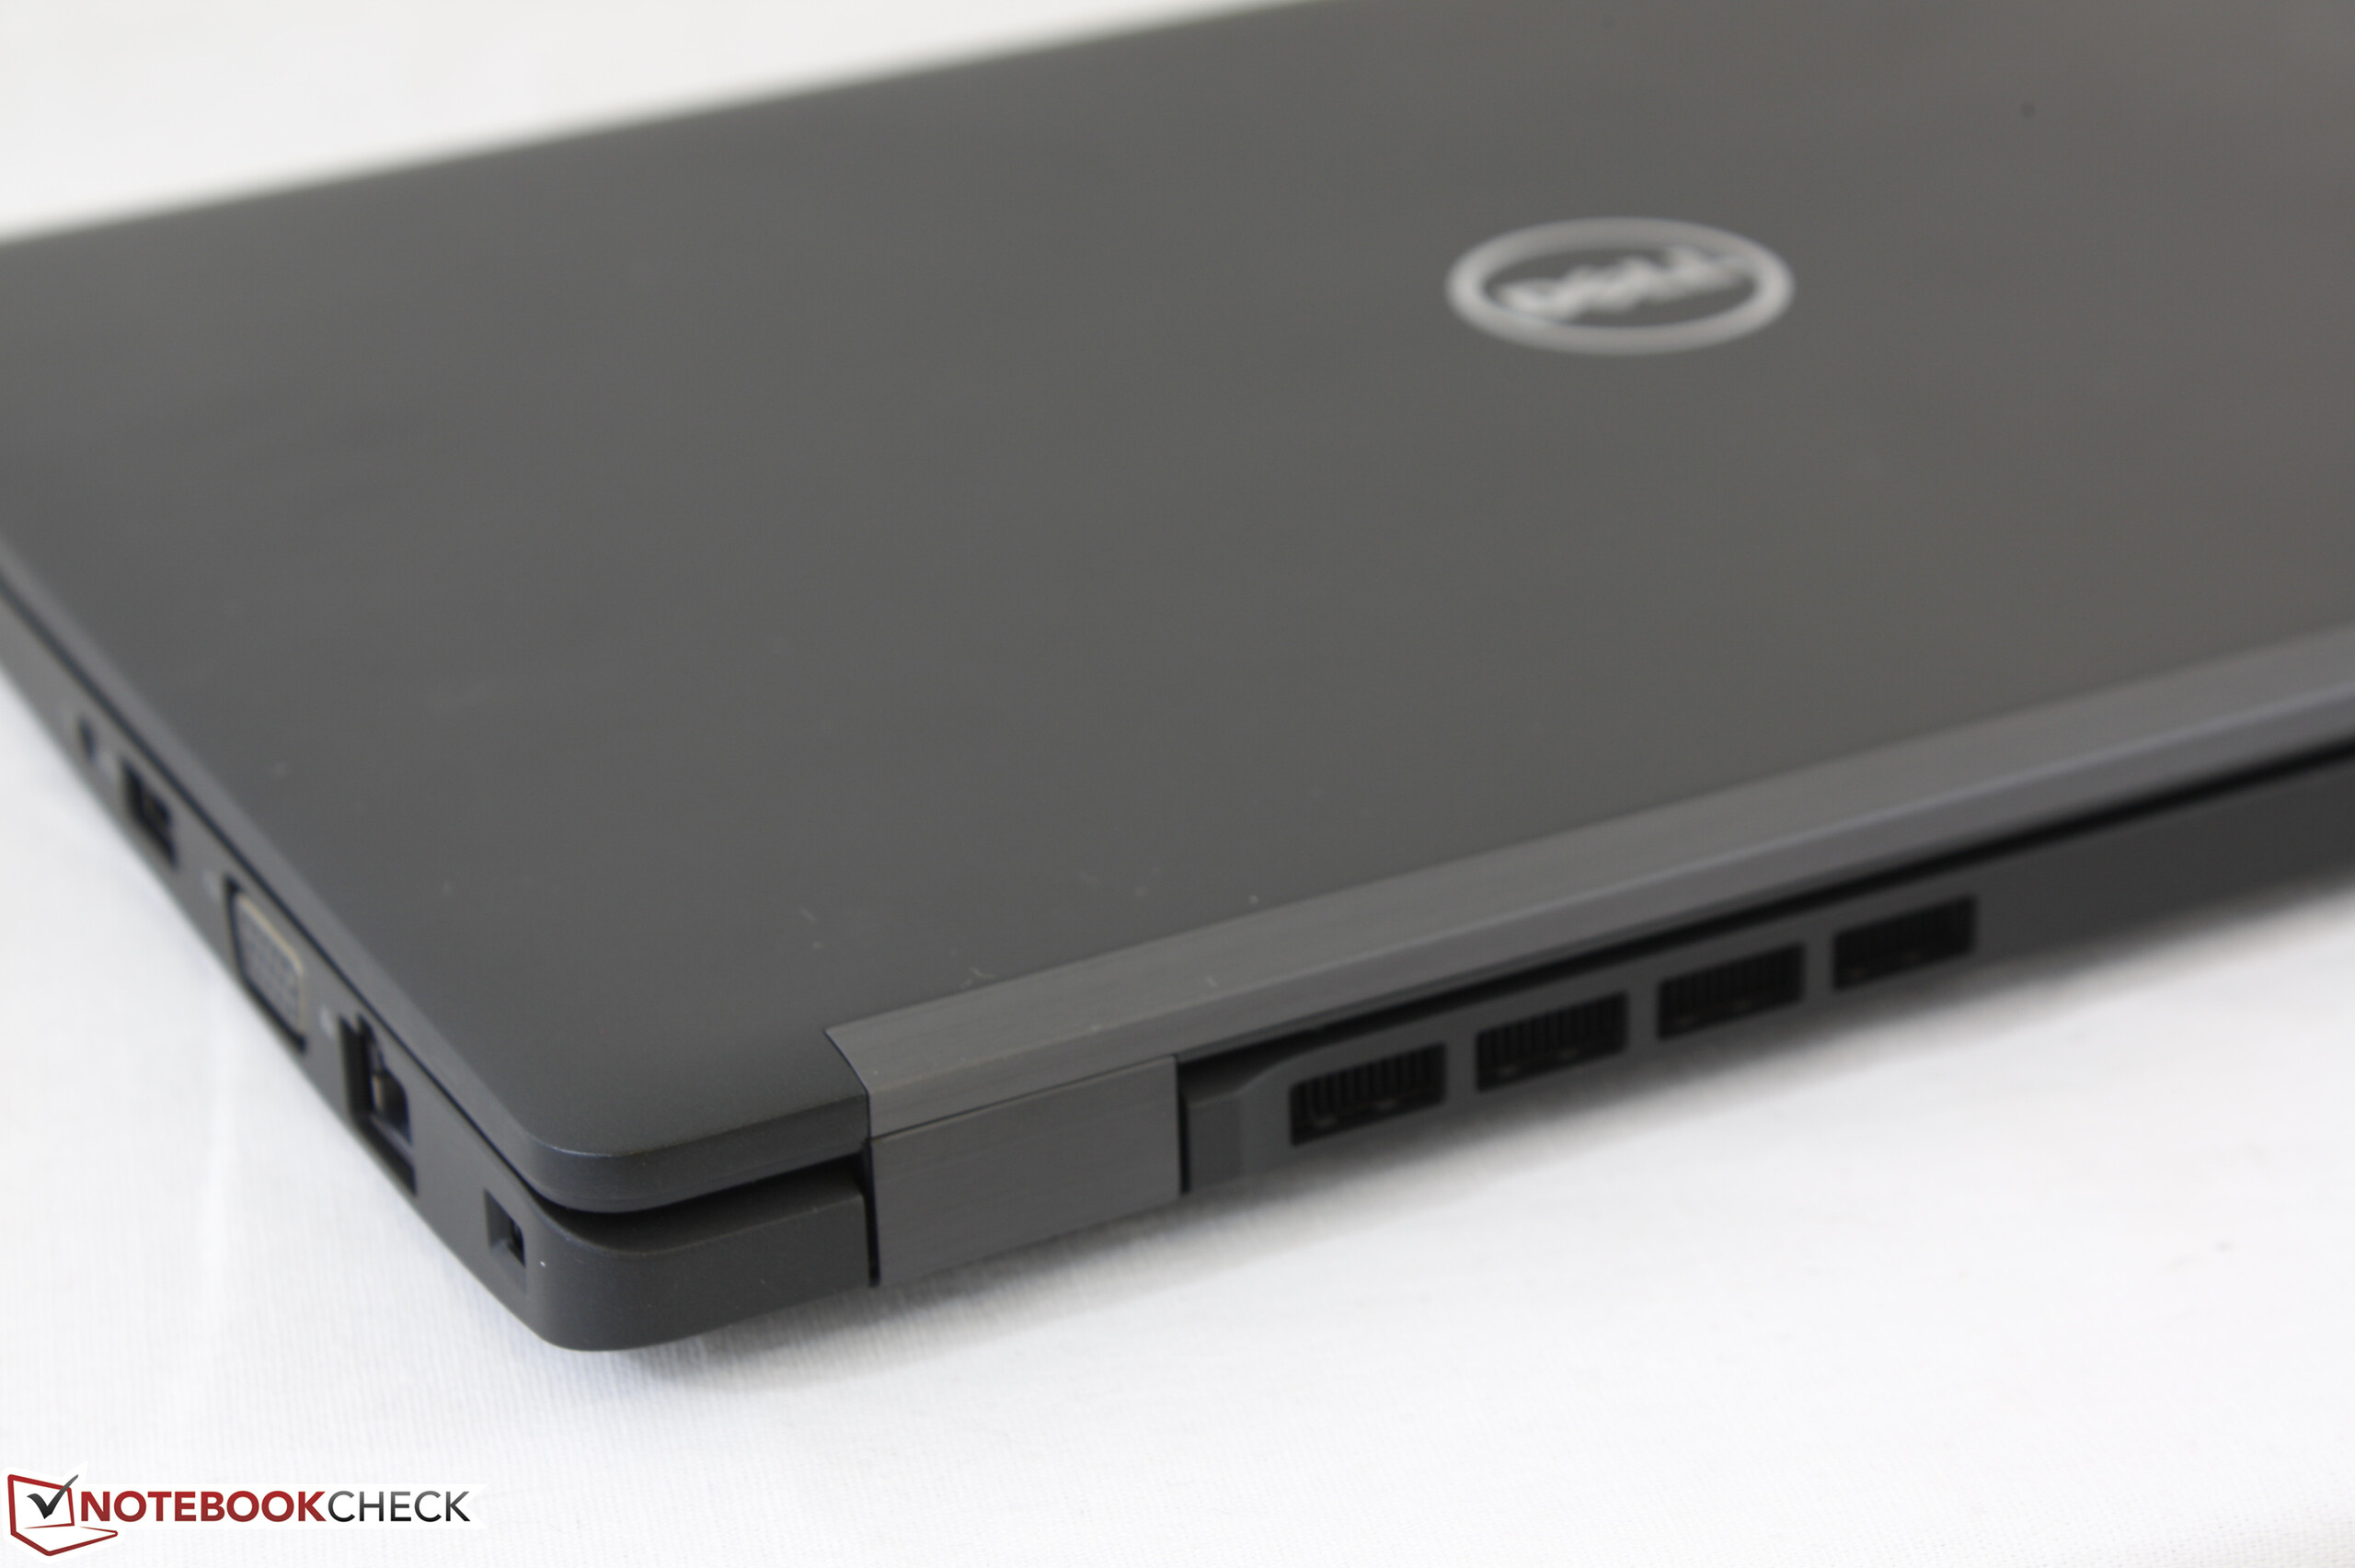
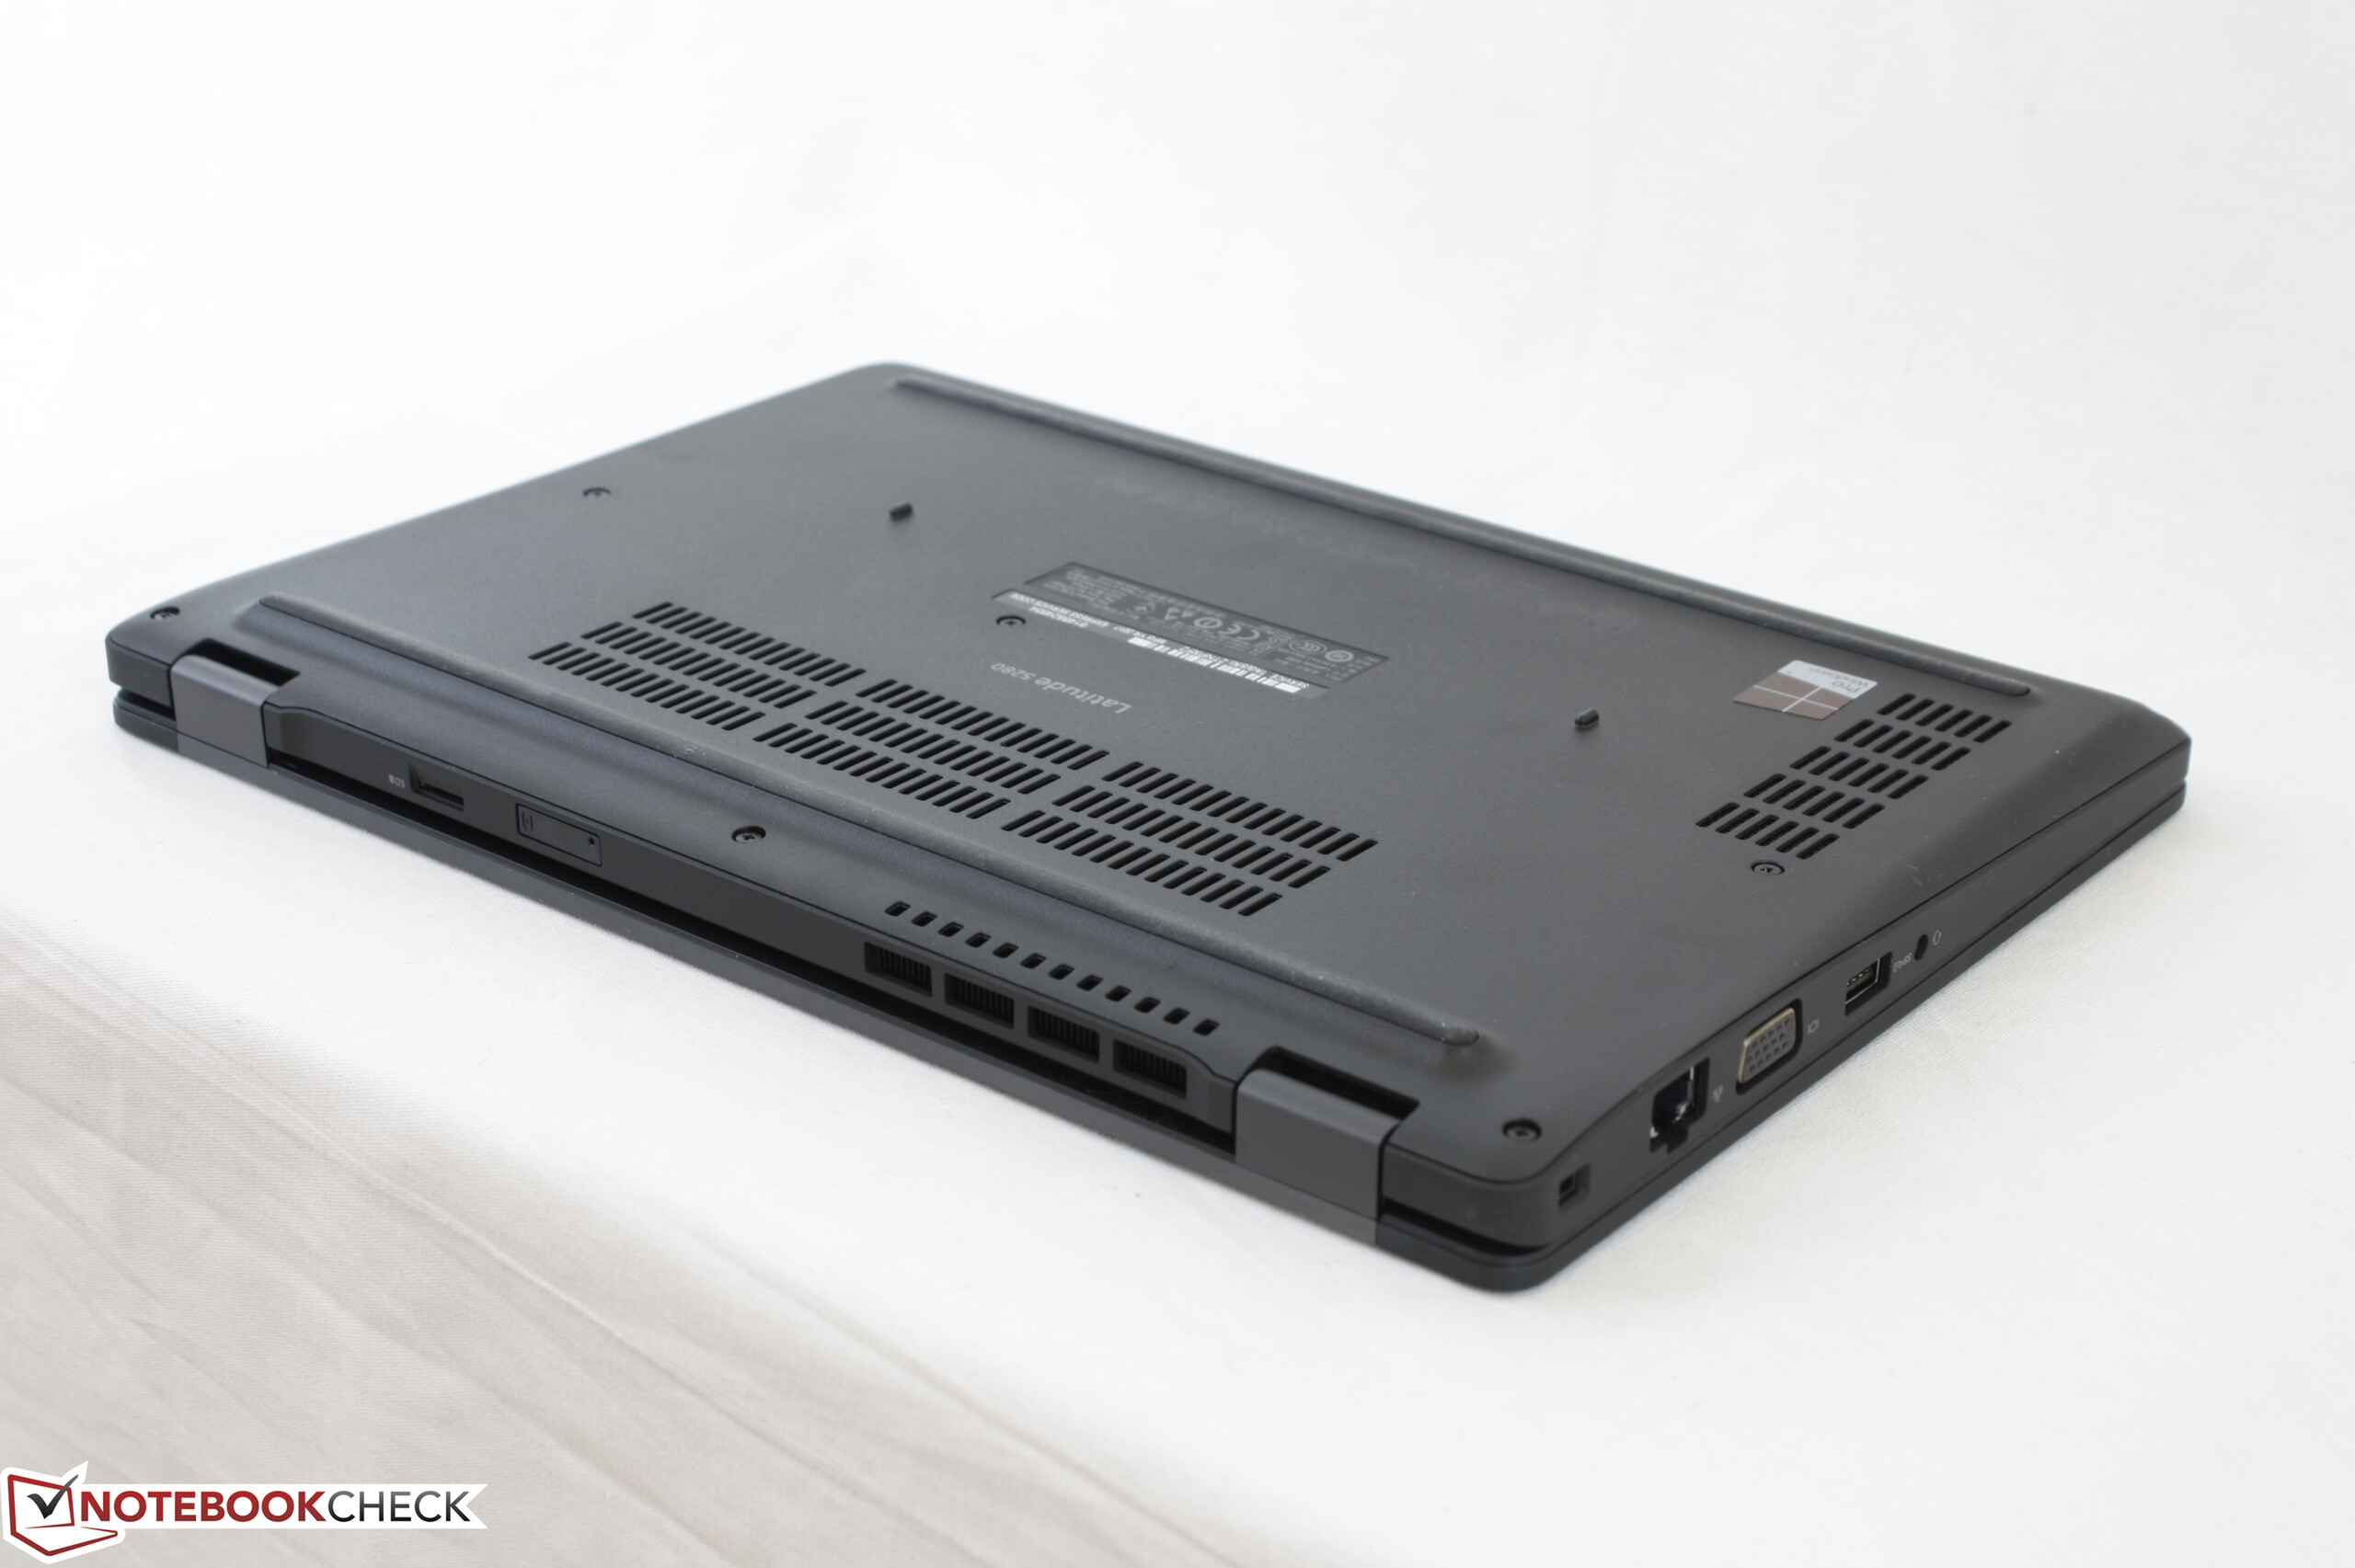
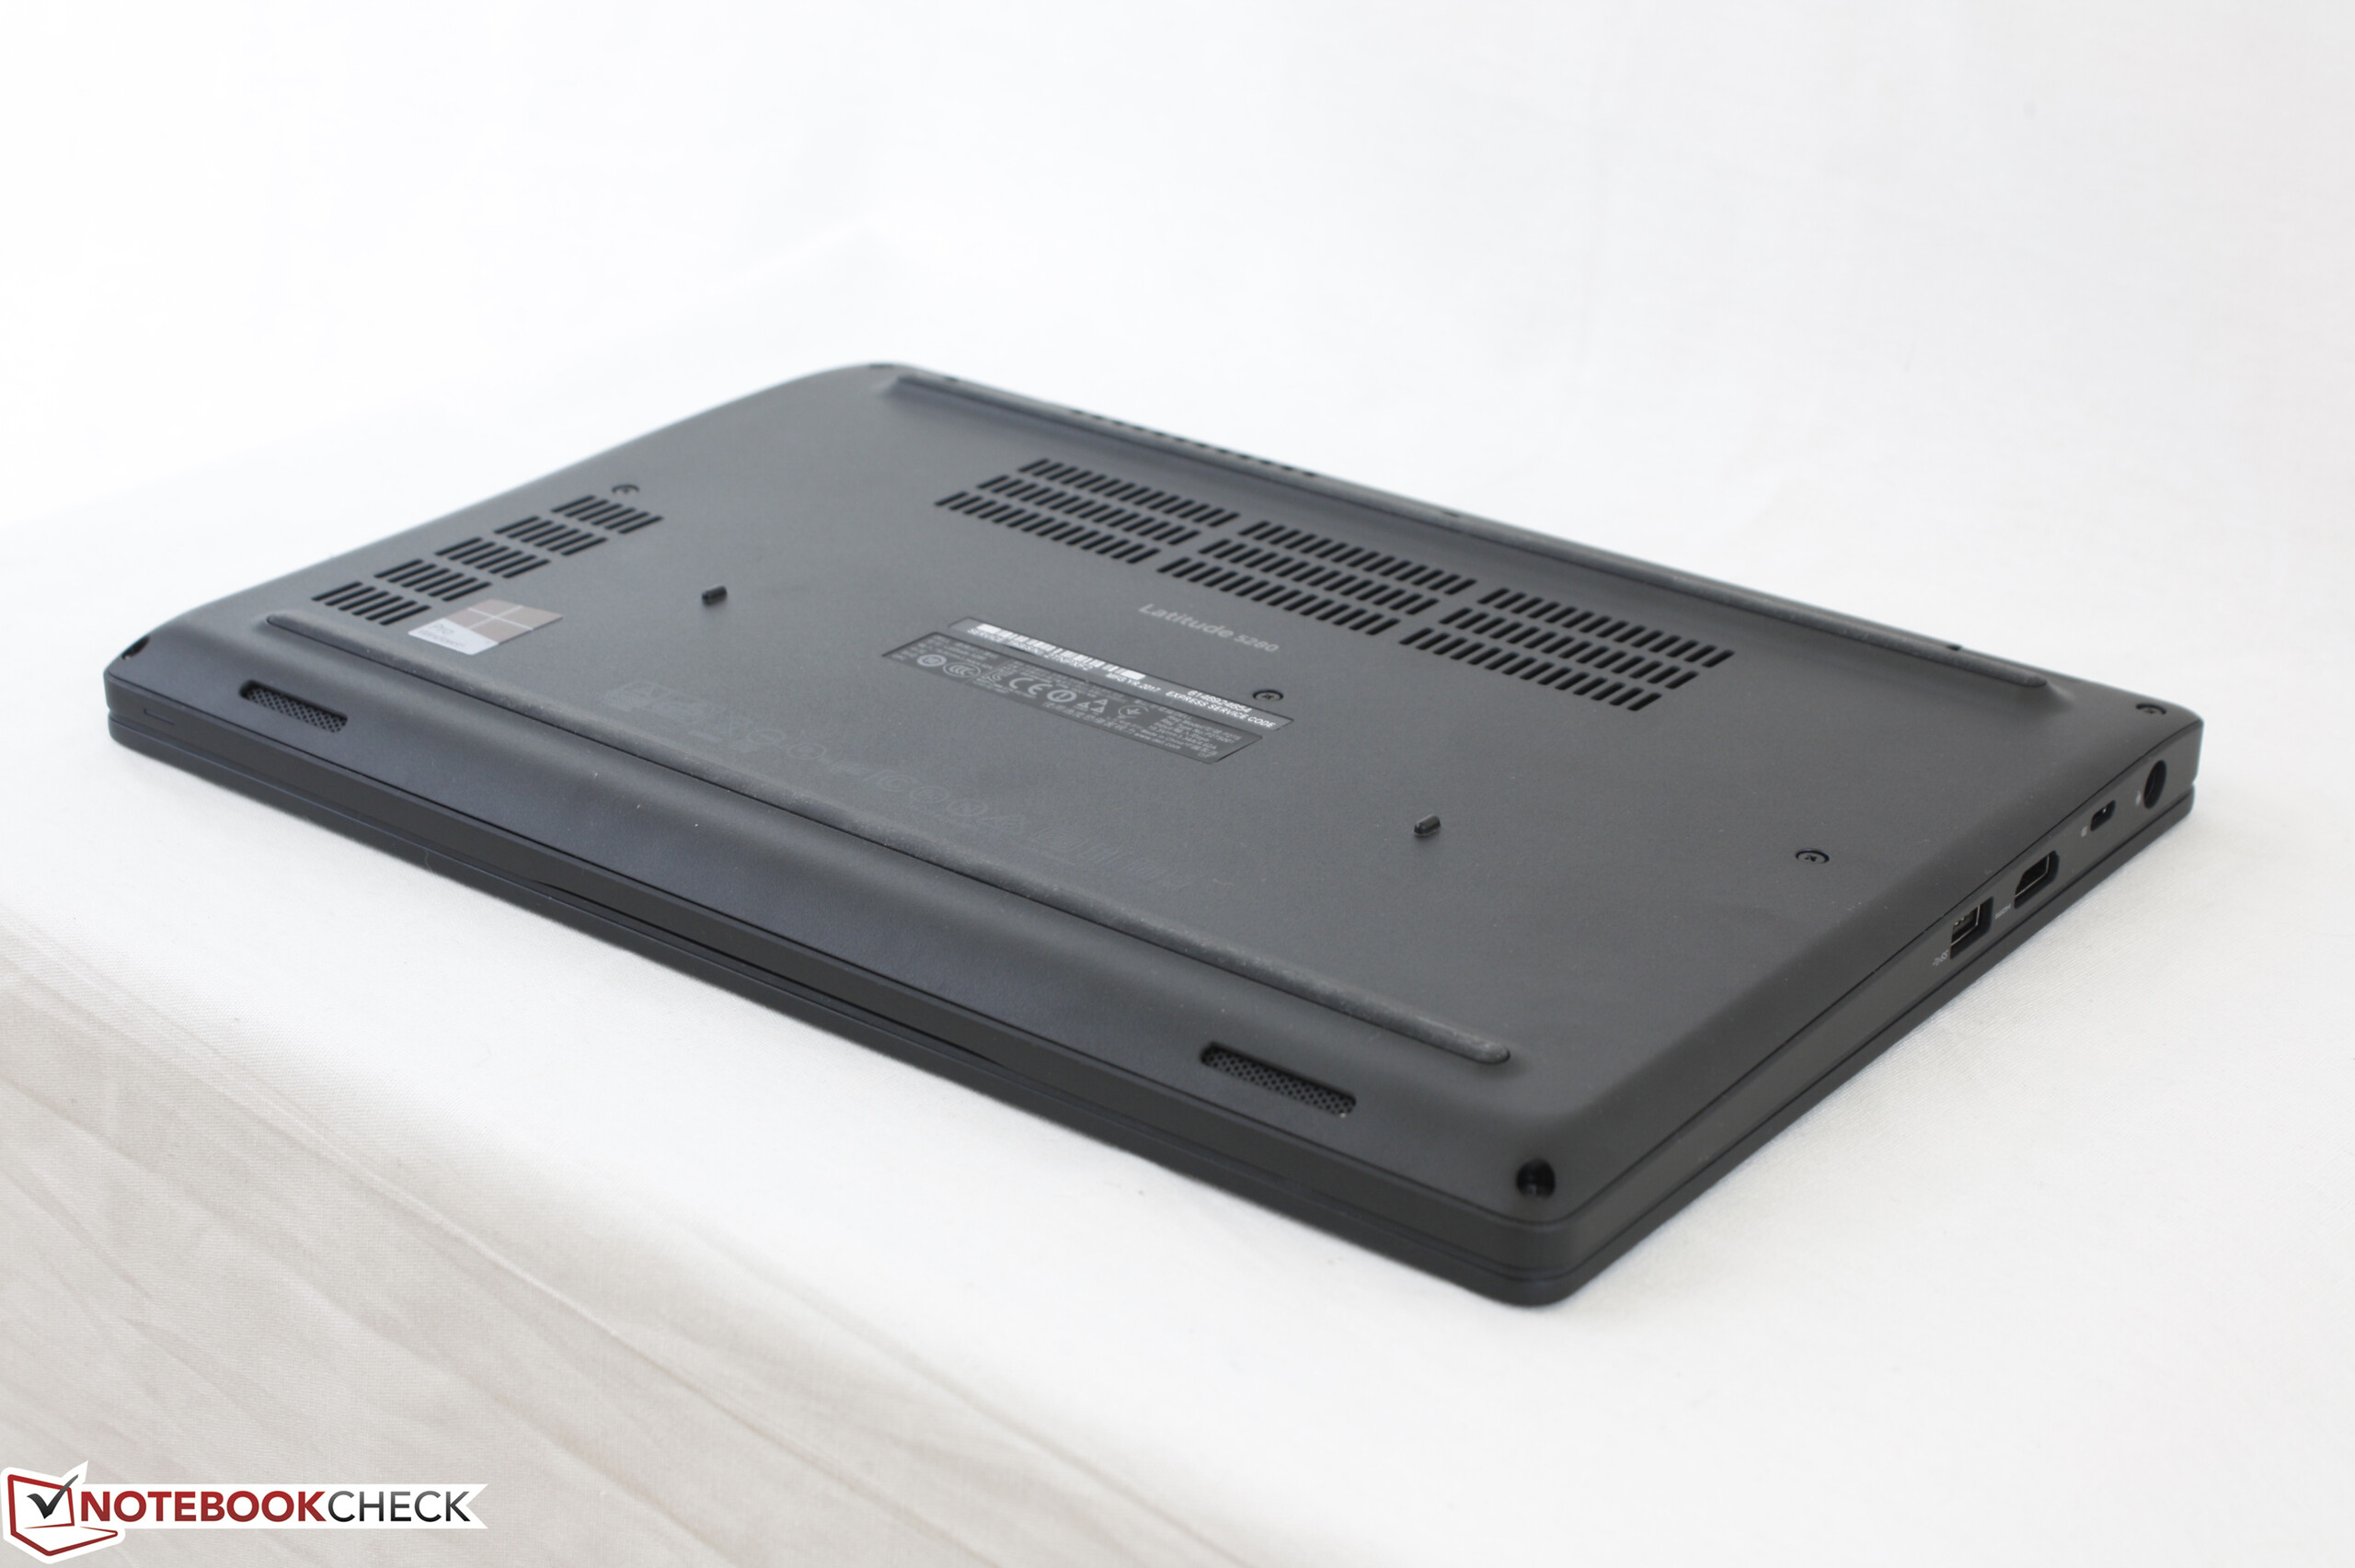
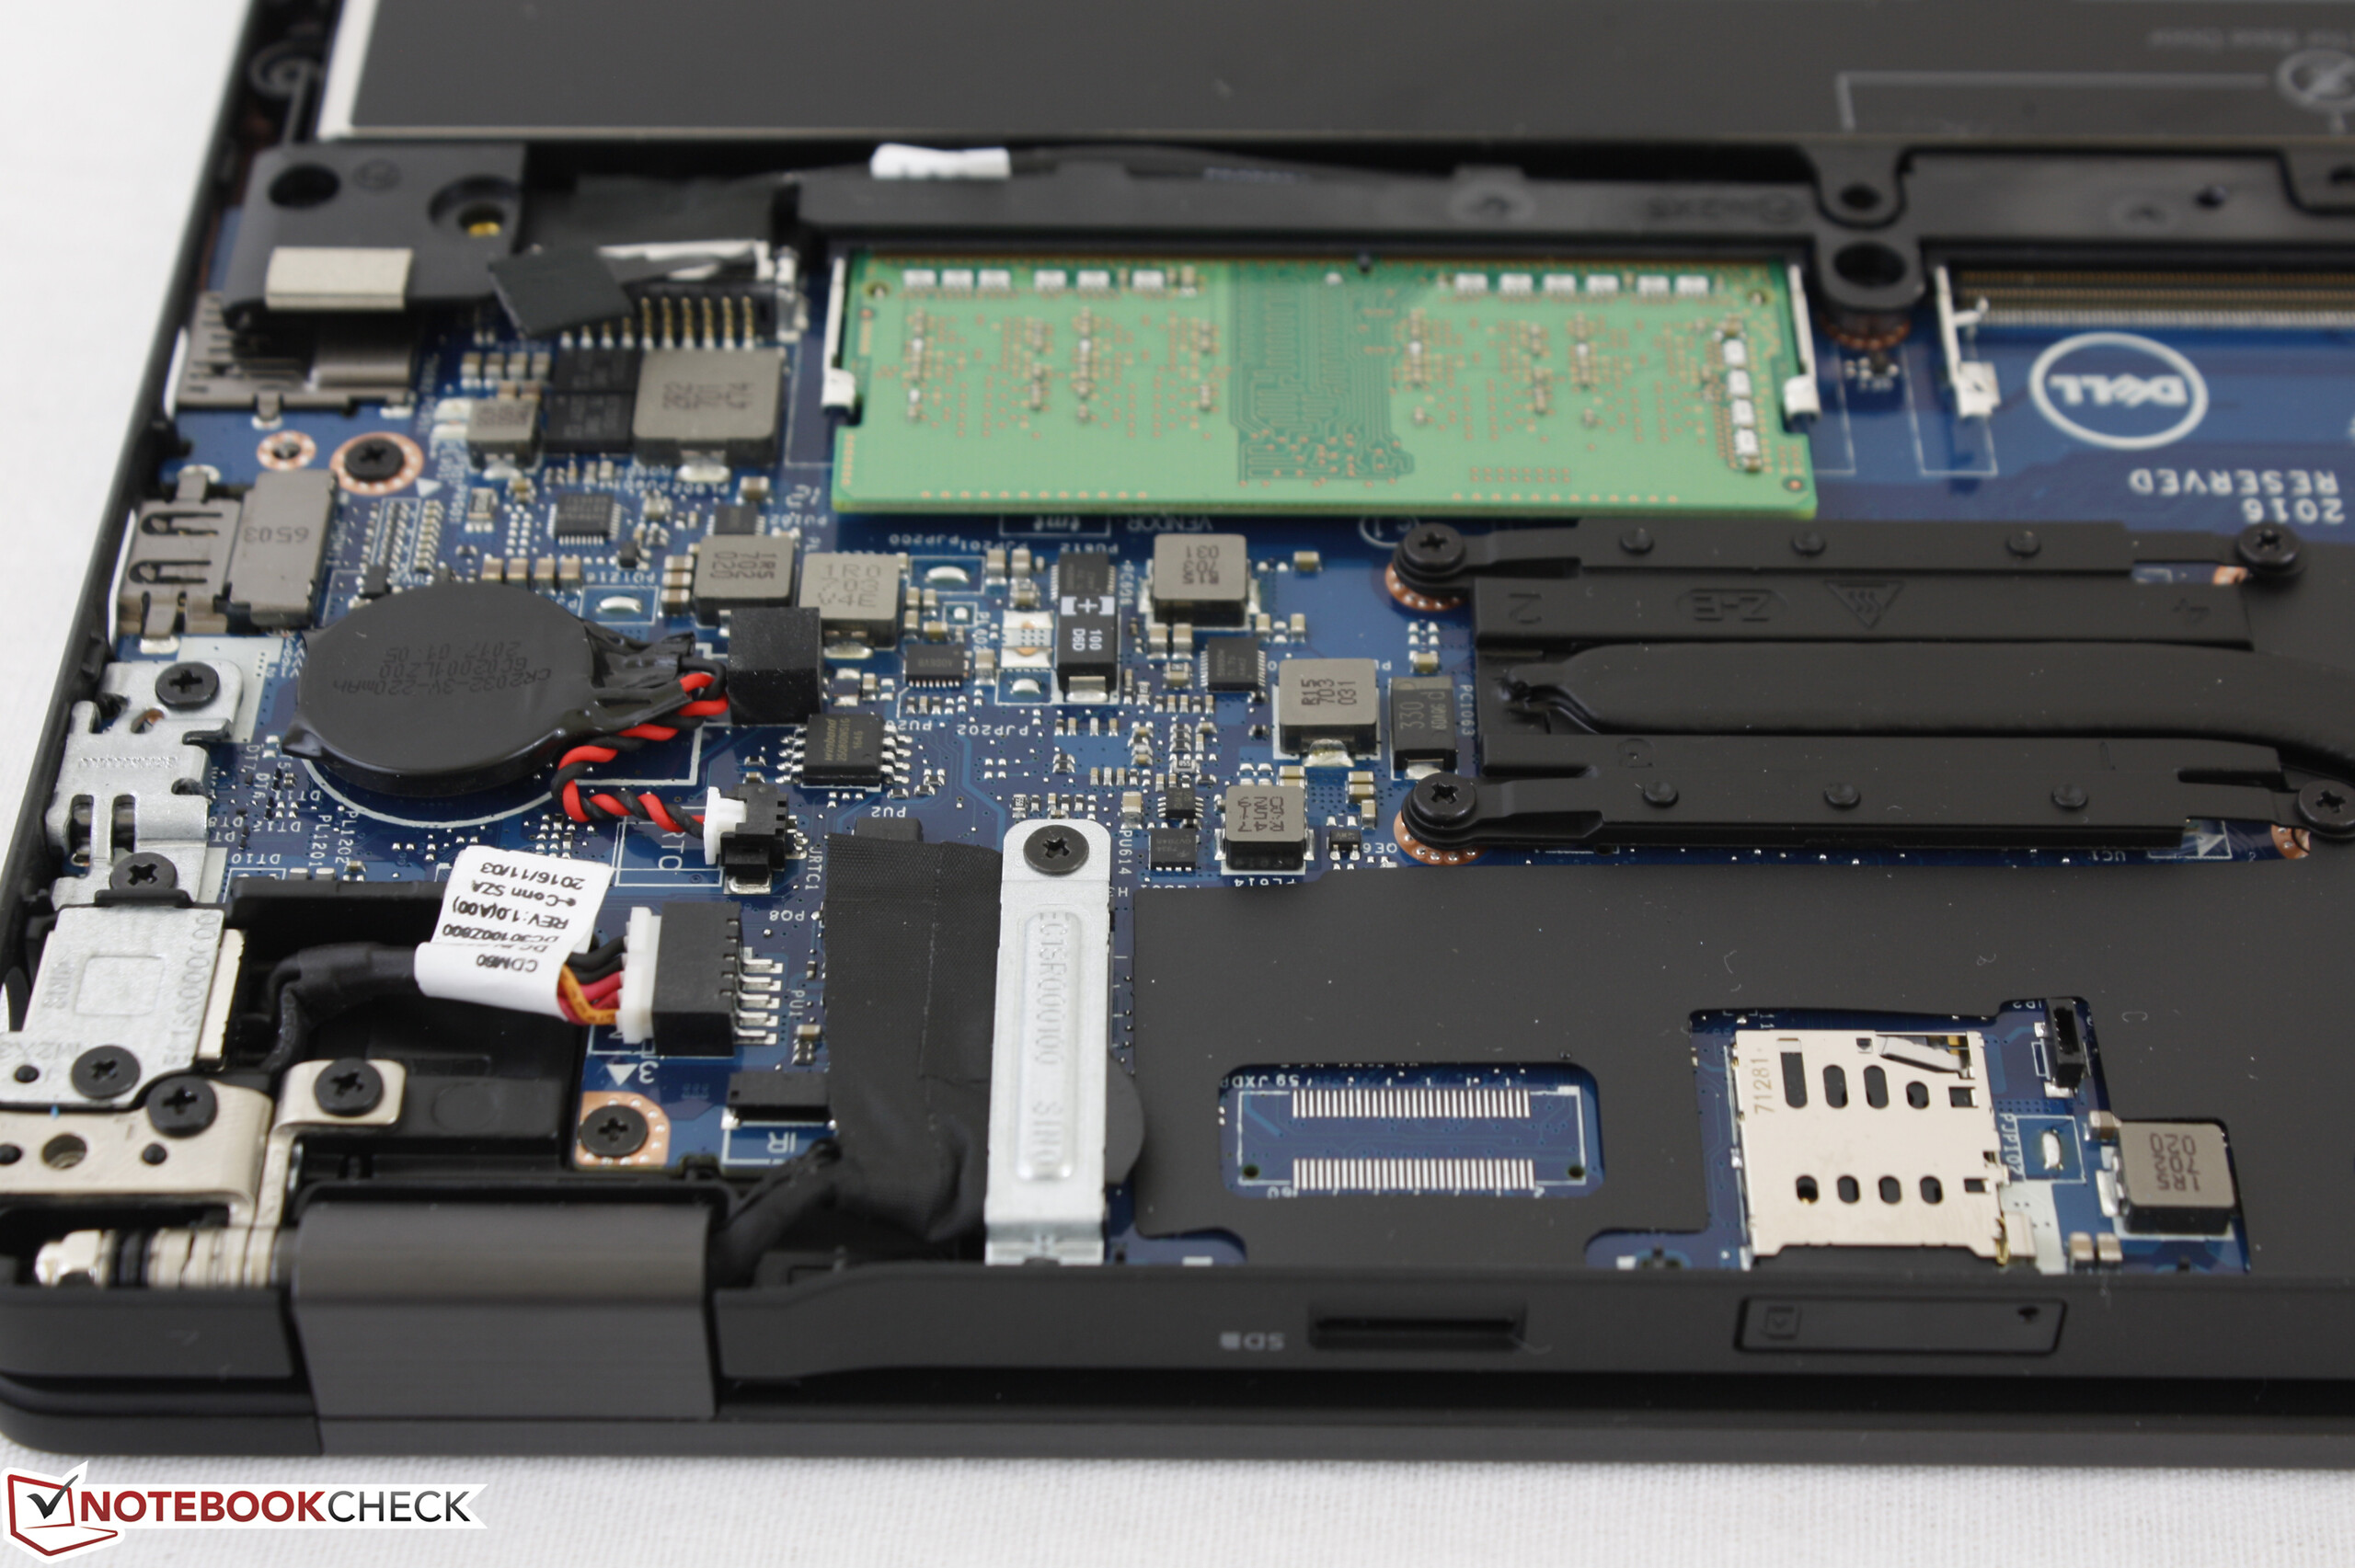
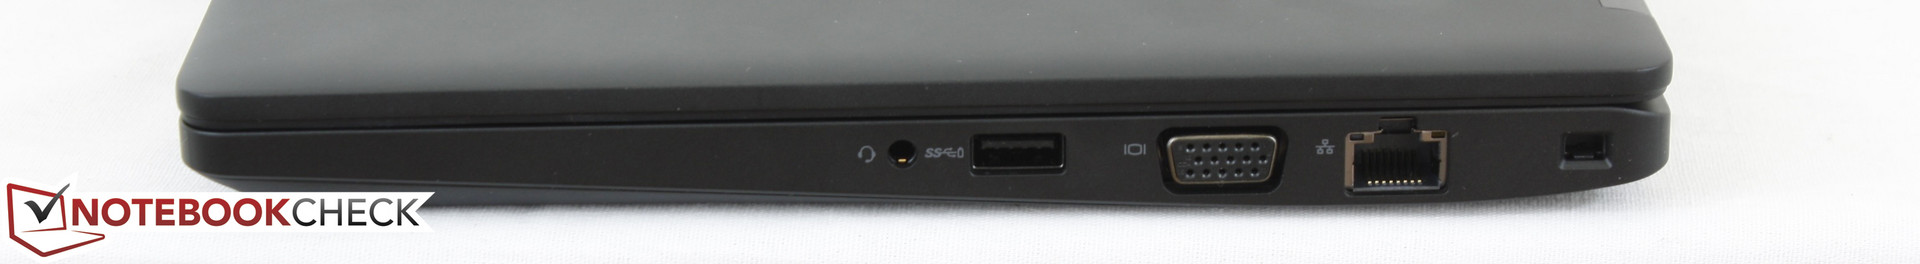
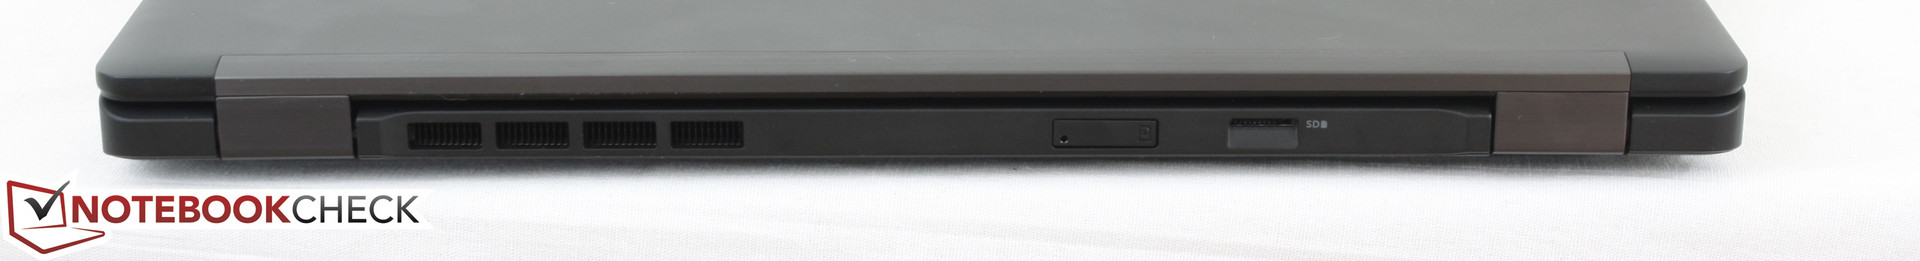
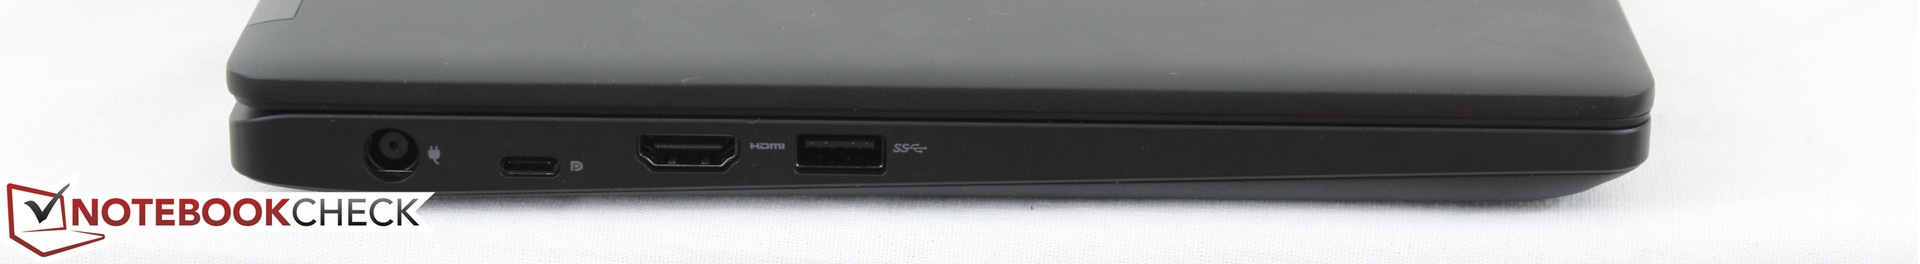
Een belangrijk verkoopargument van de meeste zakelijke notebooks is de mogelijkheid om eenvoudig docking-stations of secundaire batterijen aan te sluiten. Nu de Latitude 5280/5480/5580 de E-Port heeft laten vallen, is Thunderbolt 3 nog crucialer geworden om extra features te ondersteunen. De Latitude 5280 mist helaas beide poorten en is bijgevolg minder veelzijdig dan de 5480 en 5580, ook al is hij kleiner en mobieler. Daarnaast is de systeemventilator steeds actief, wat we onnodig vinden voor een notebook die slechts met een U-processor is uitgerust.
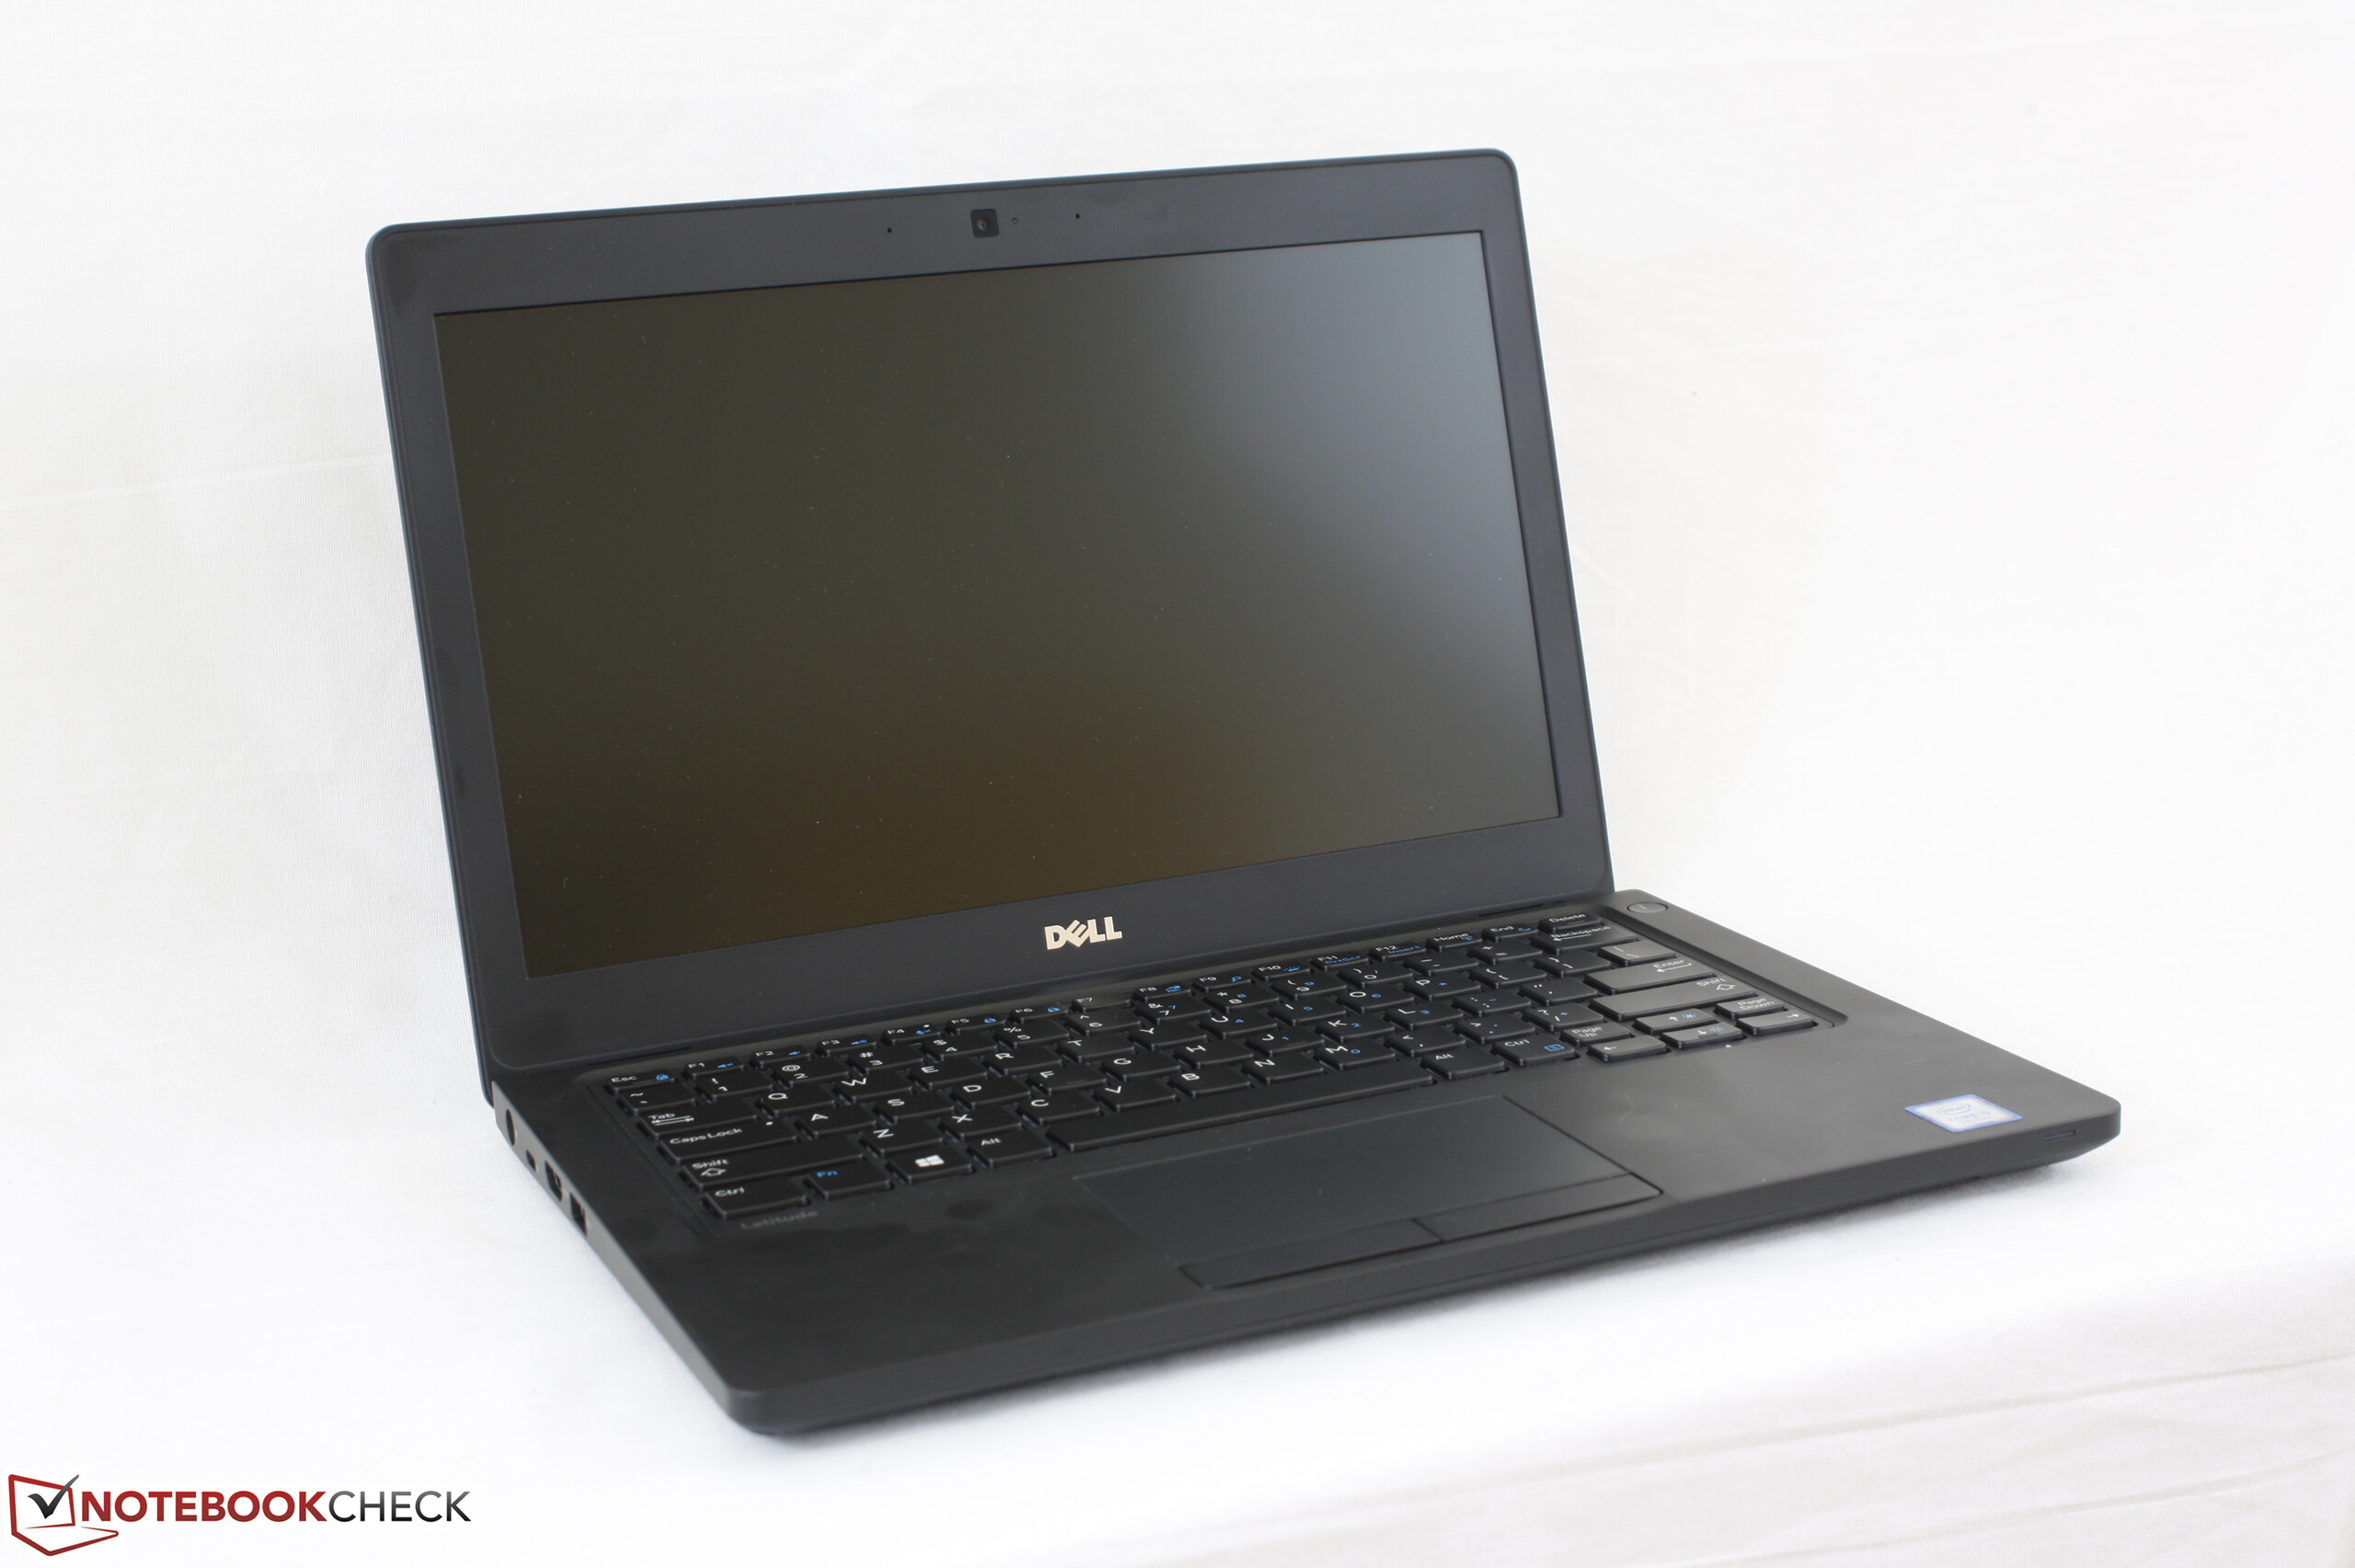
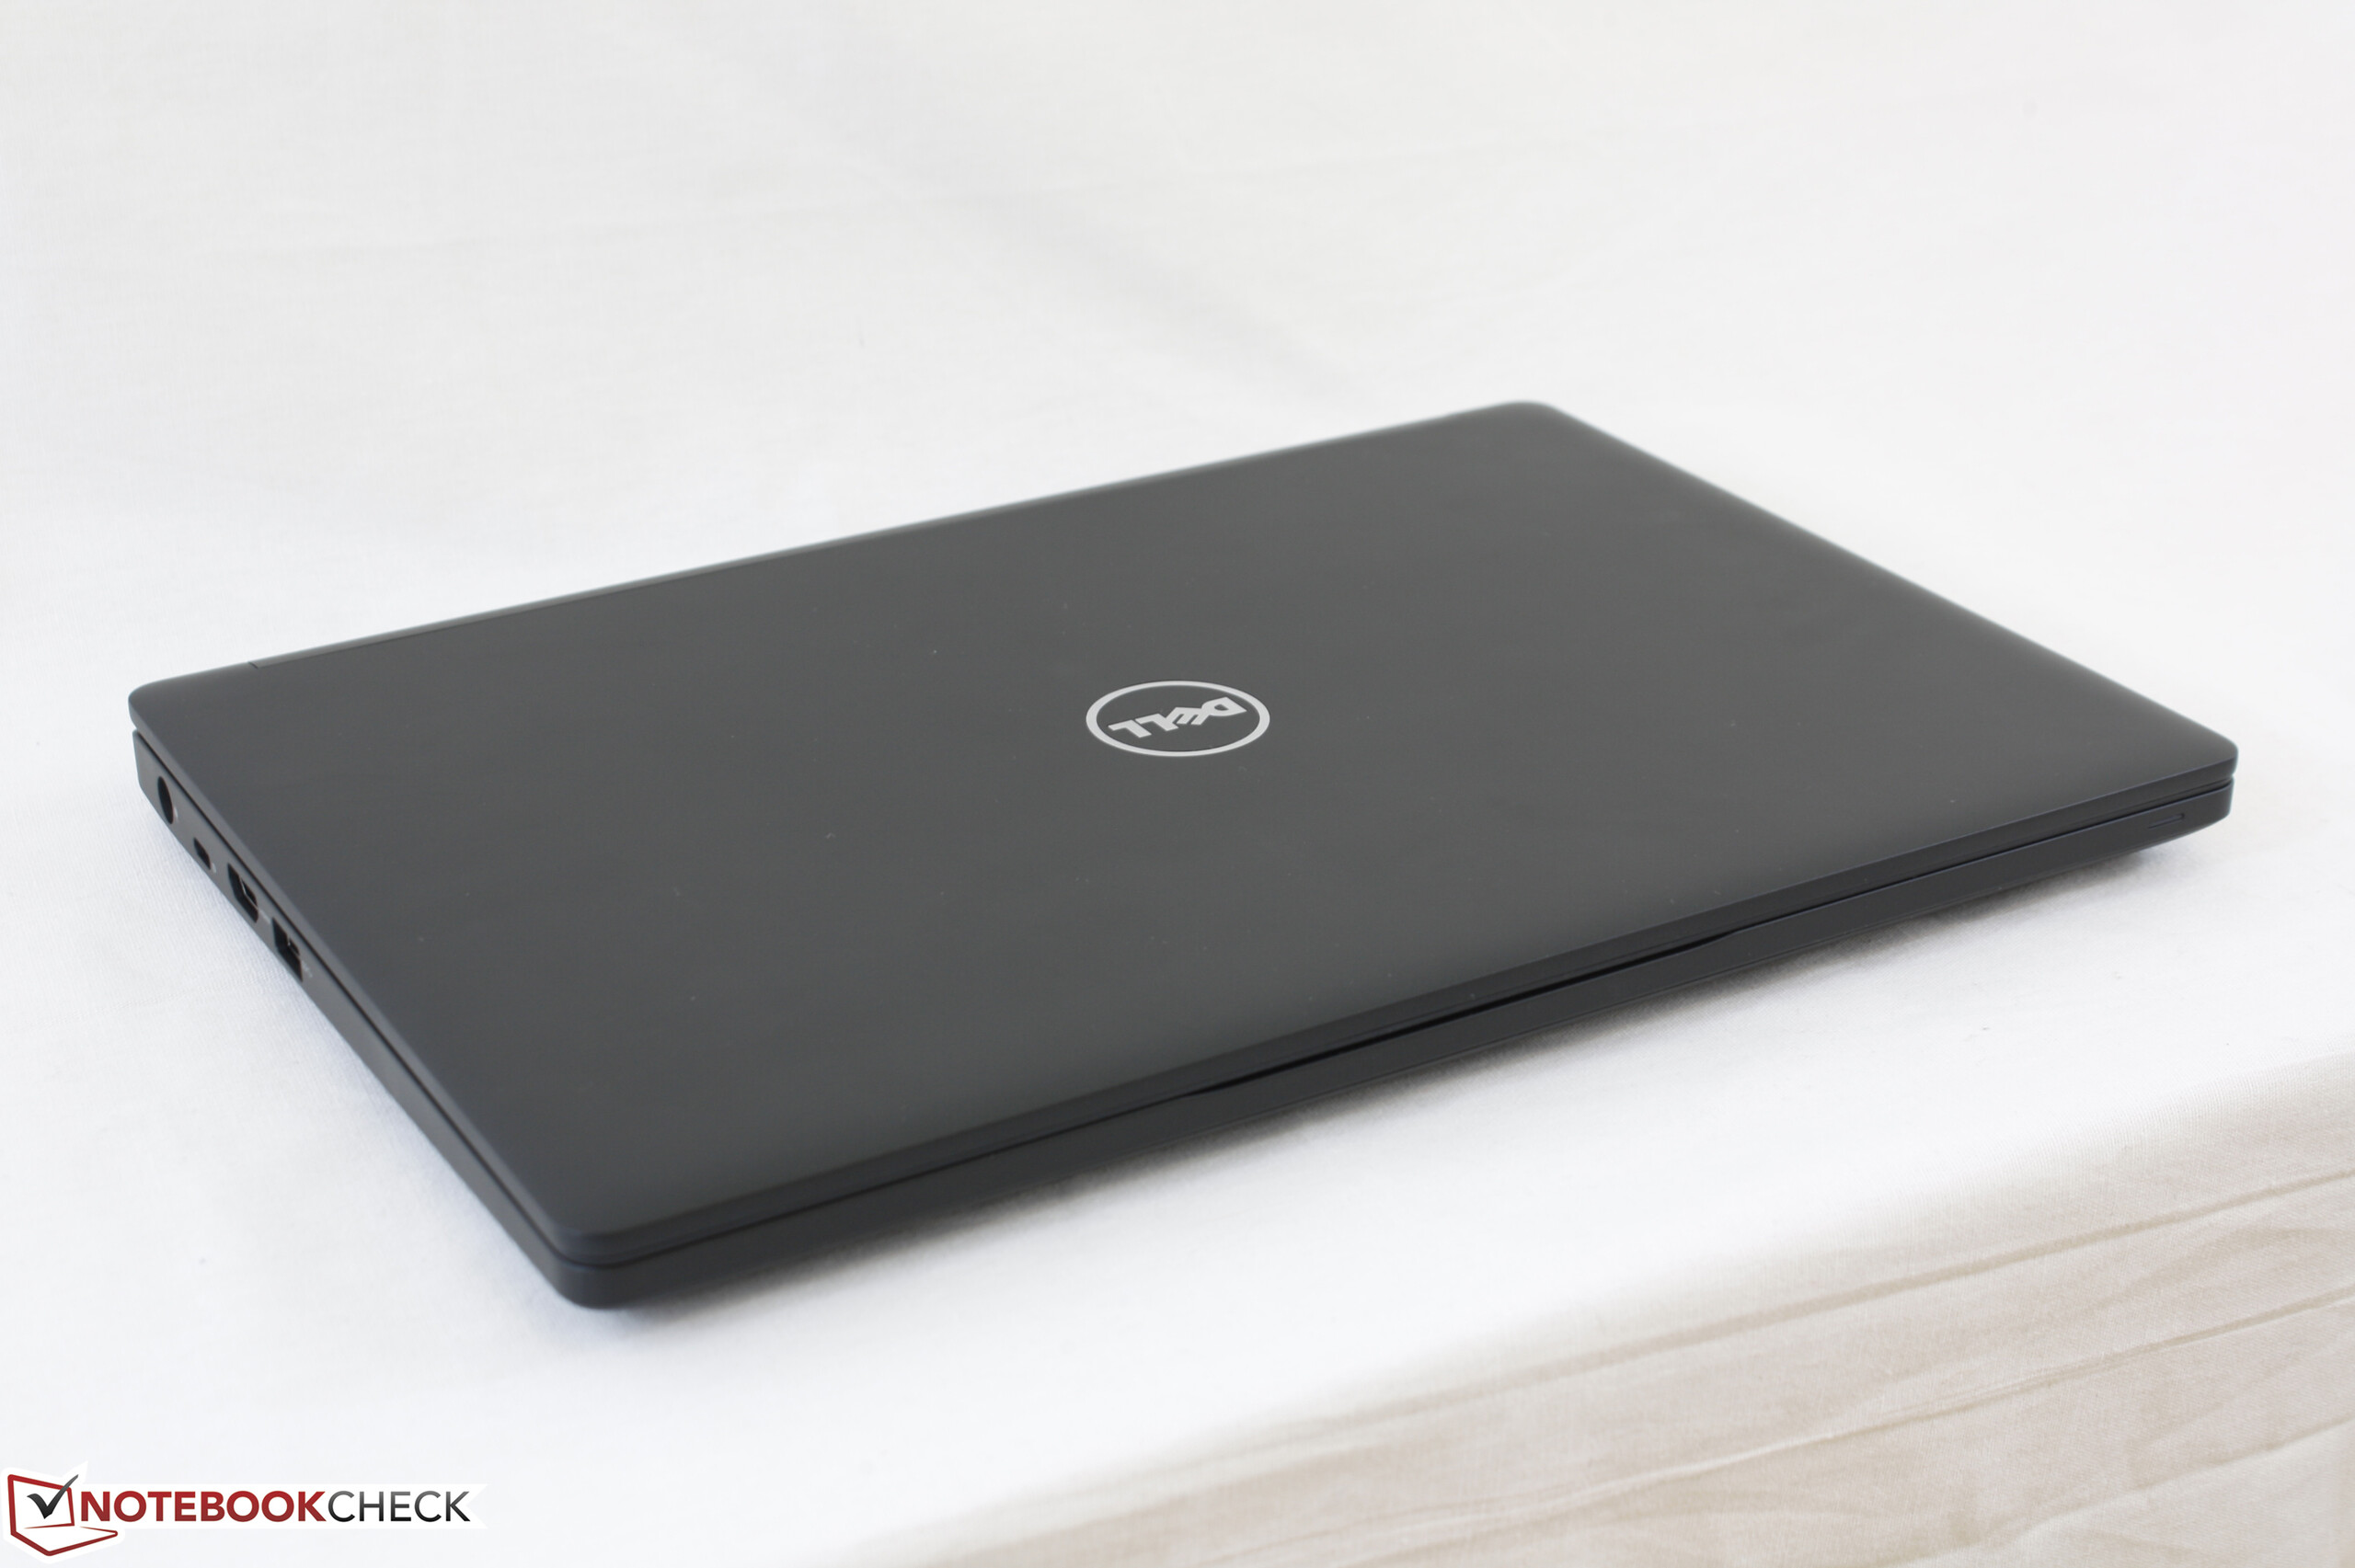
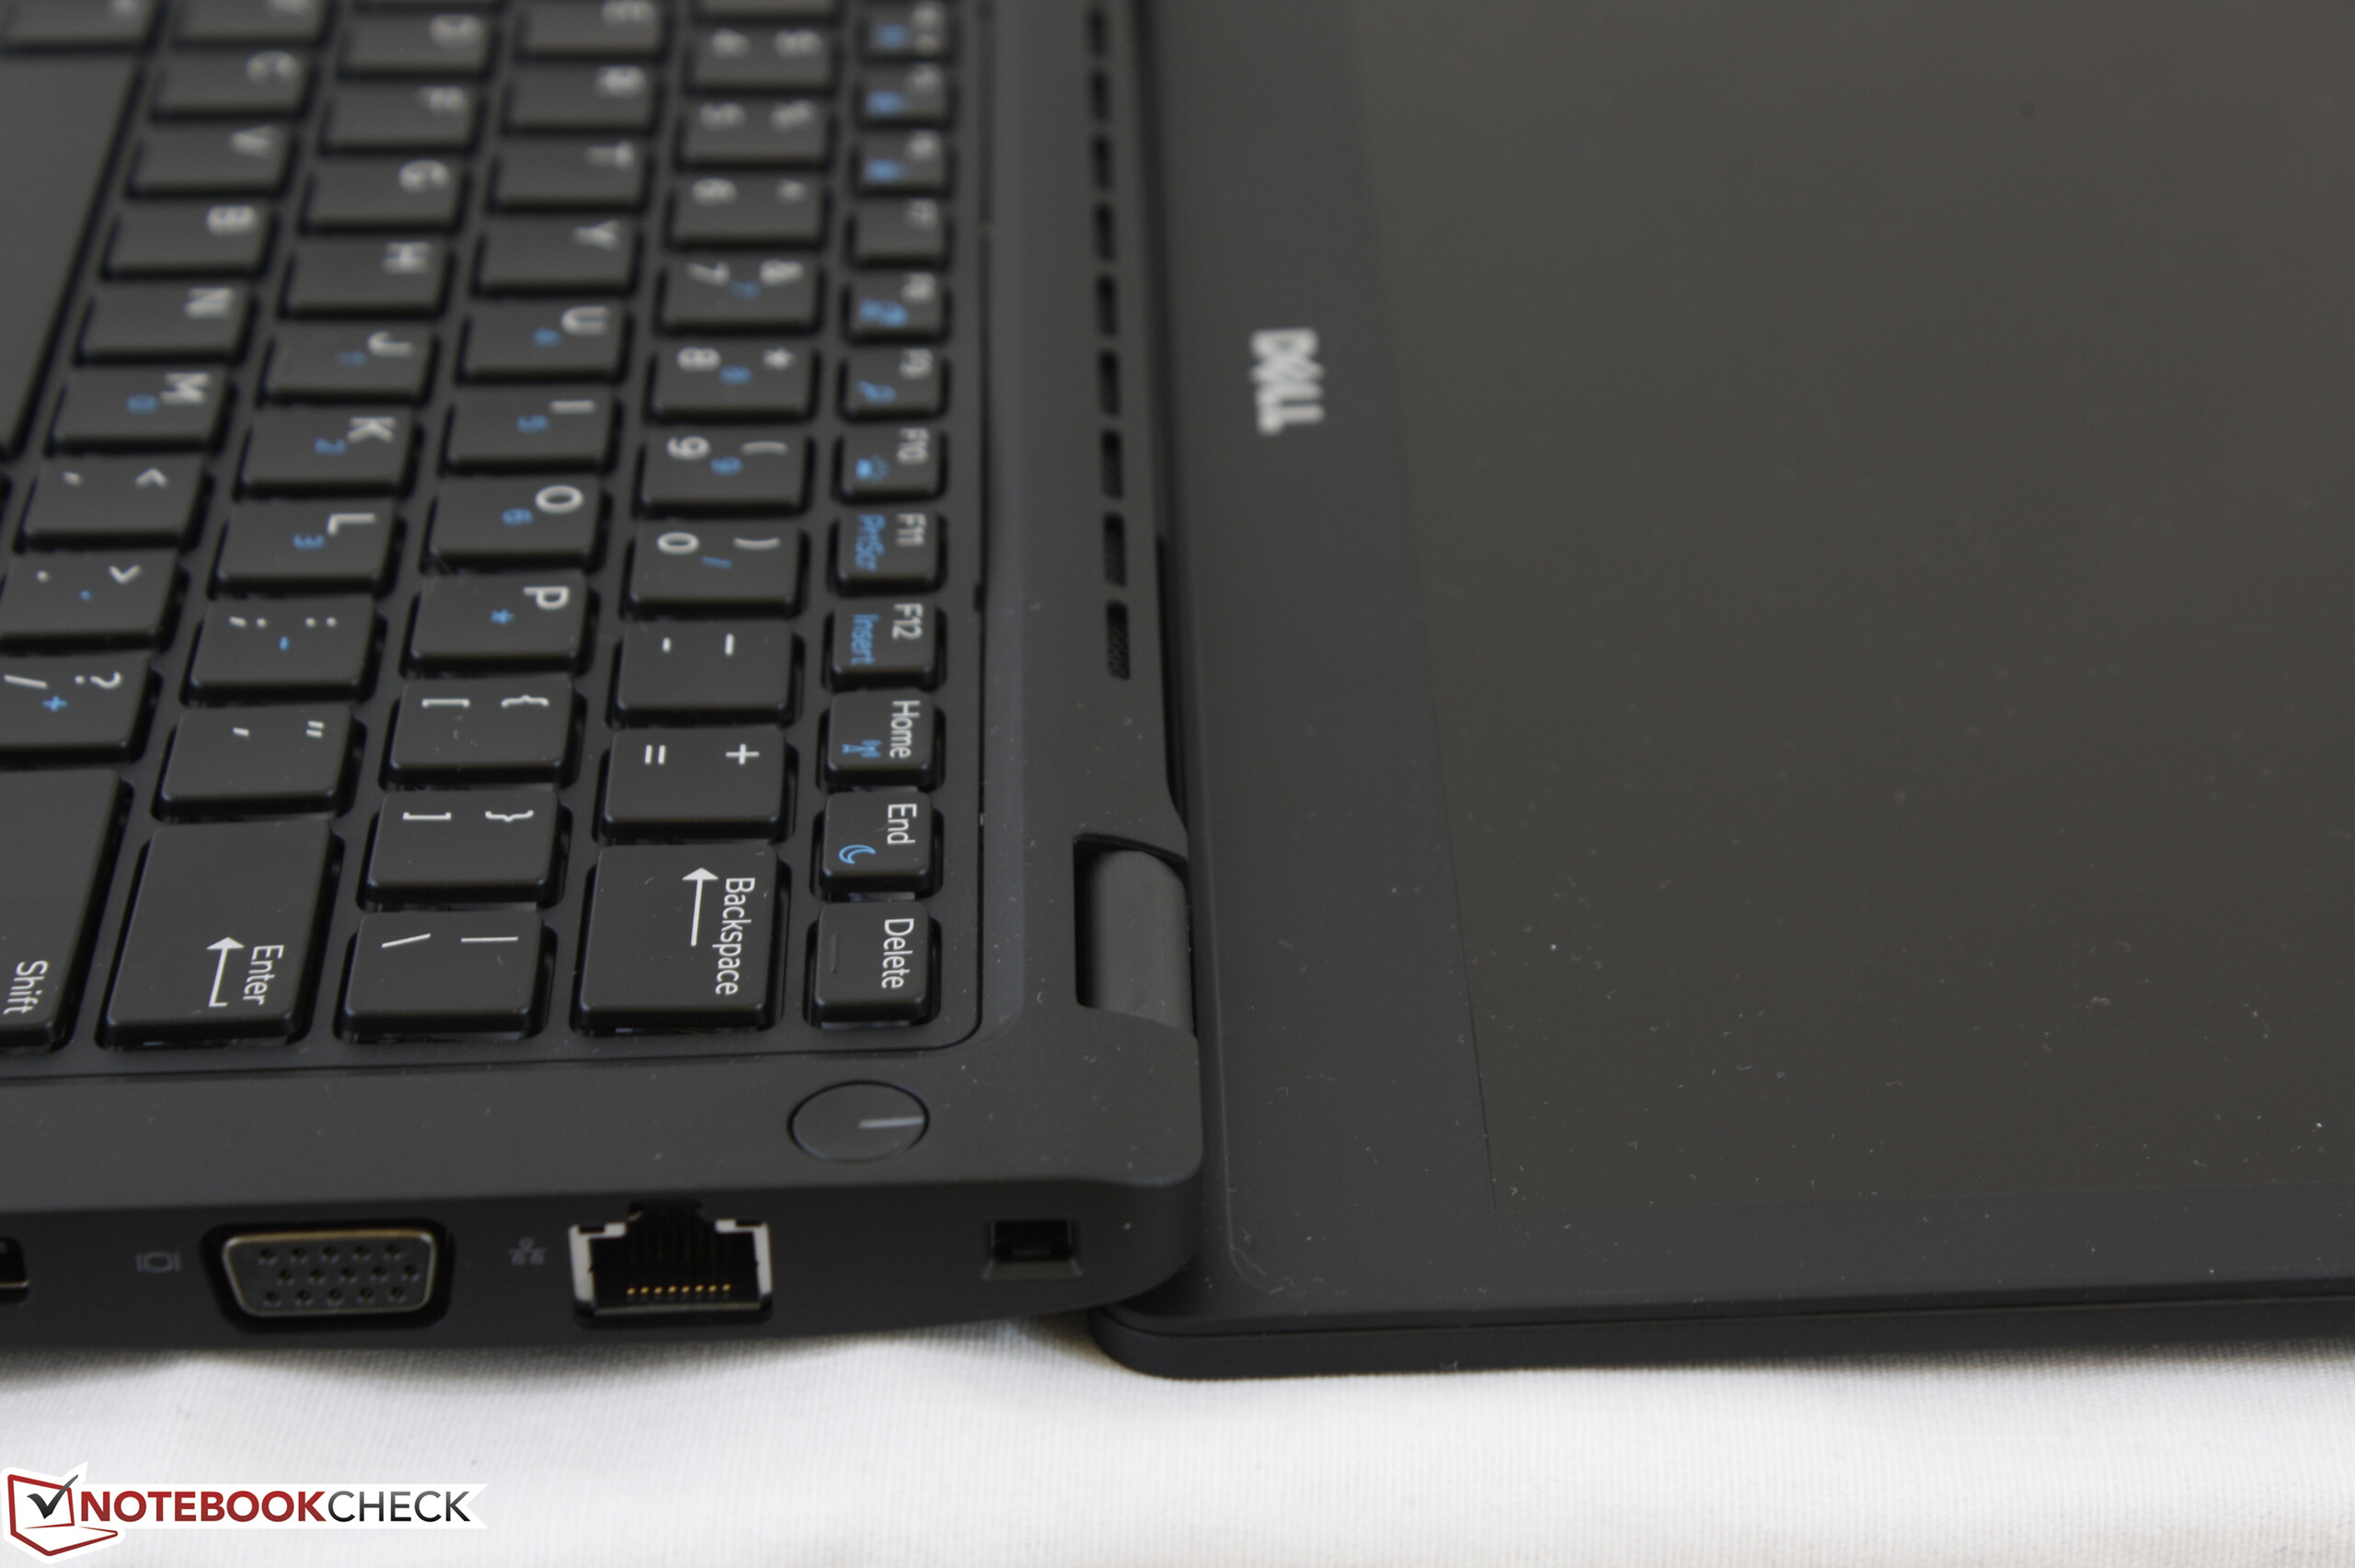
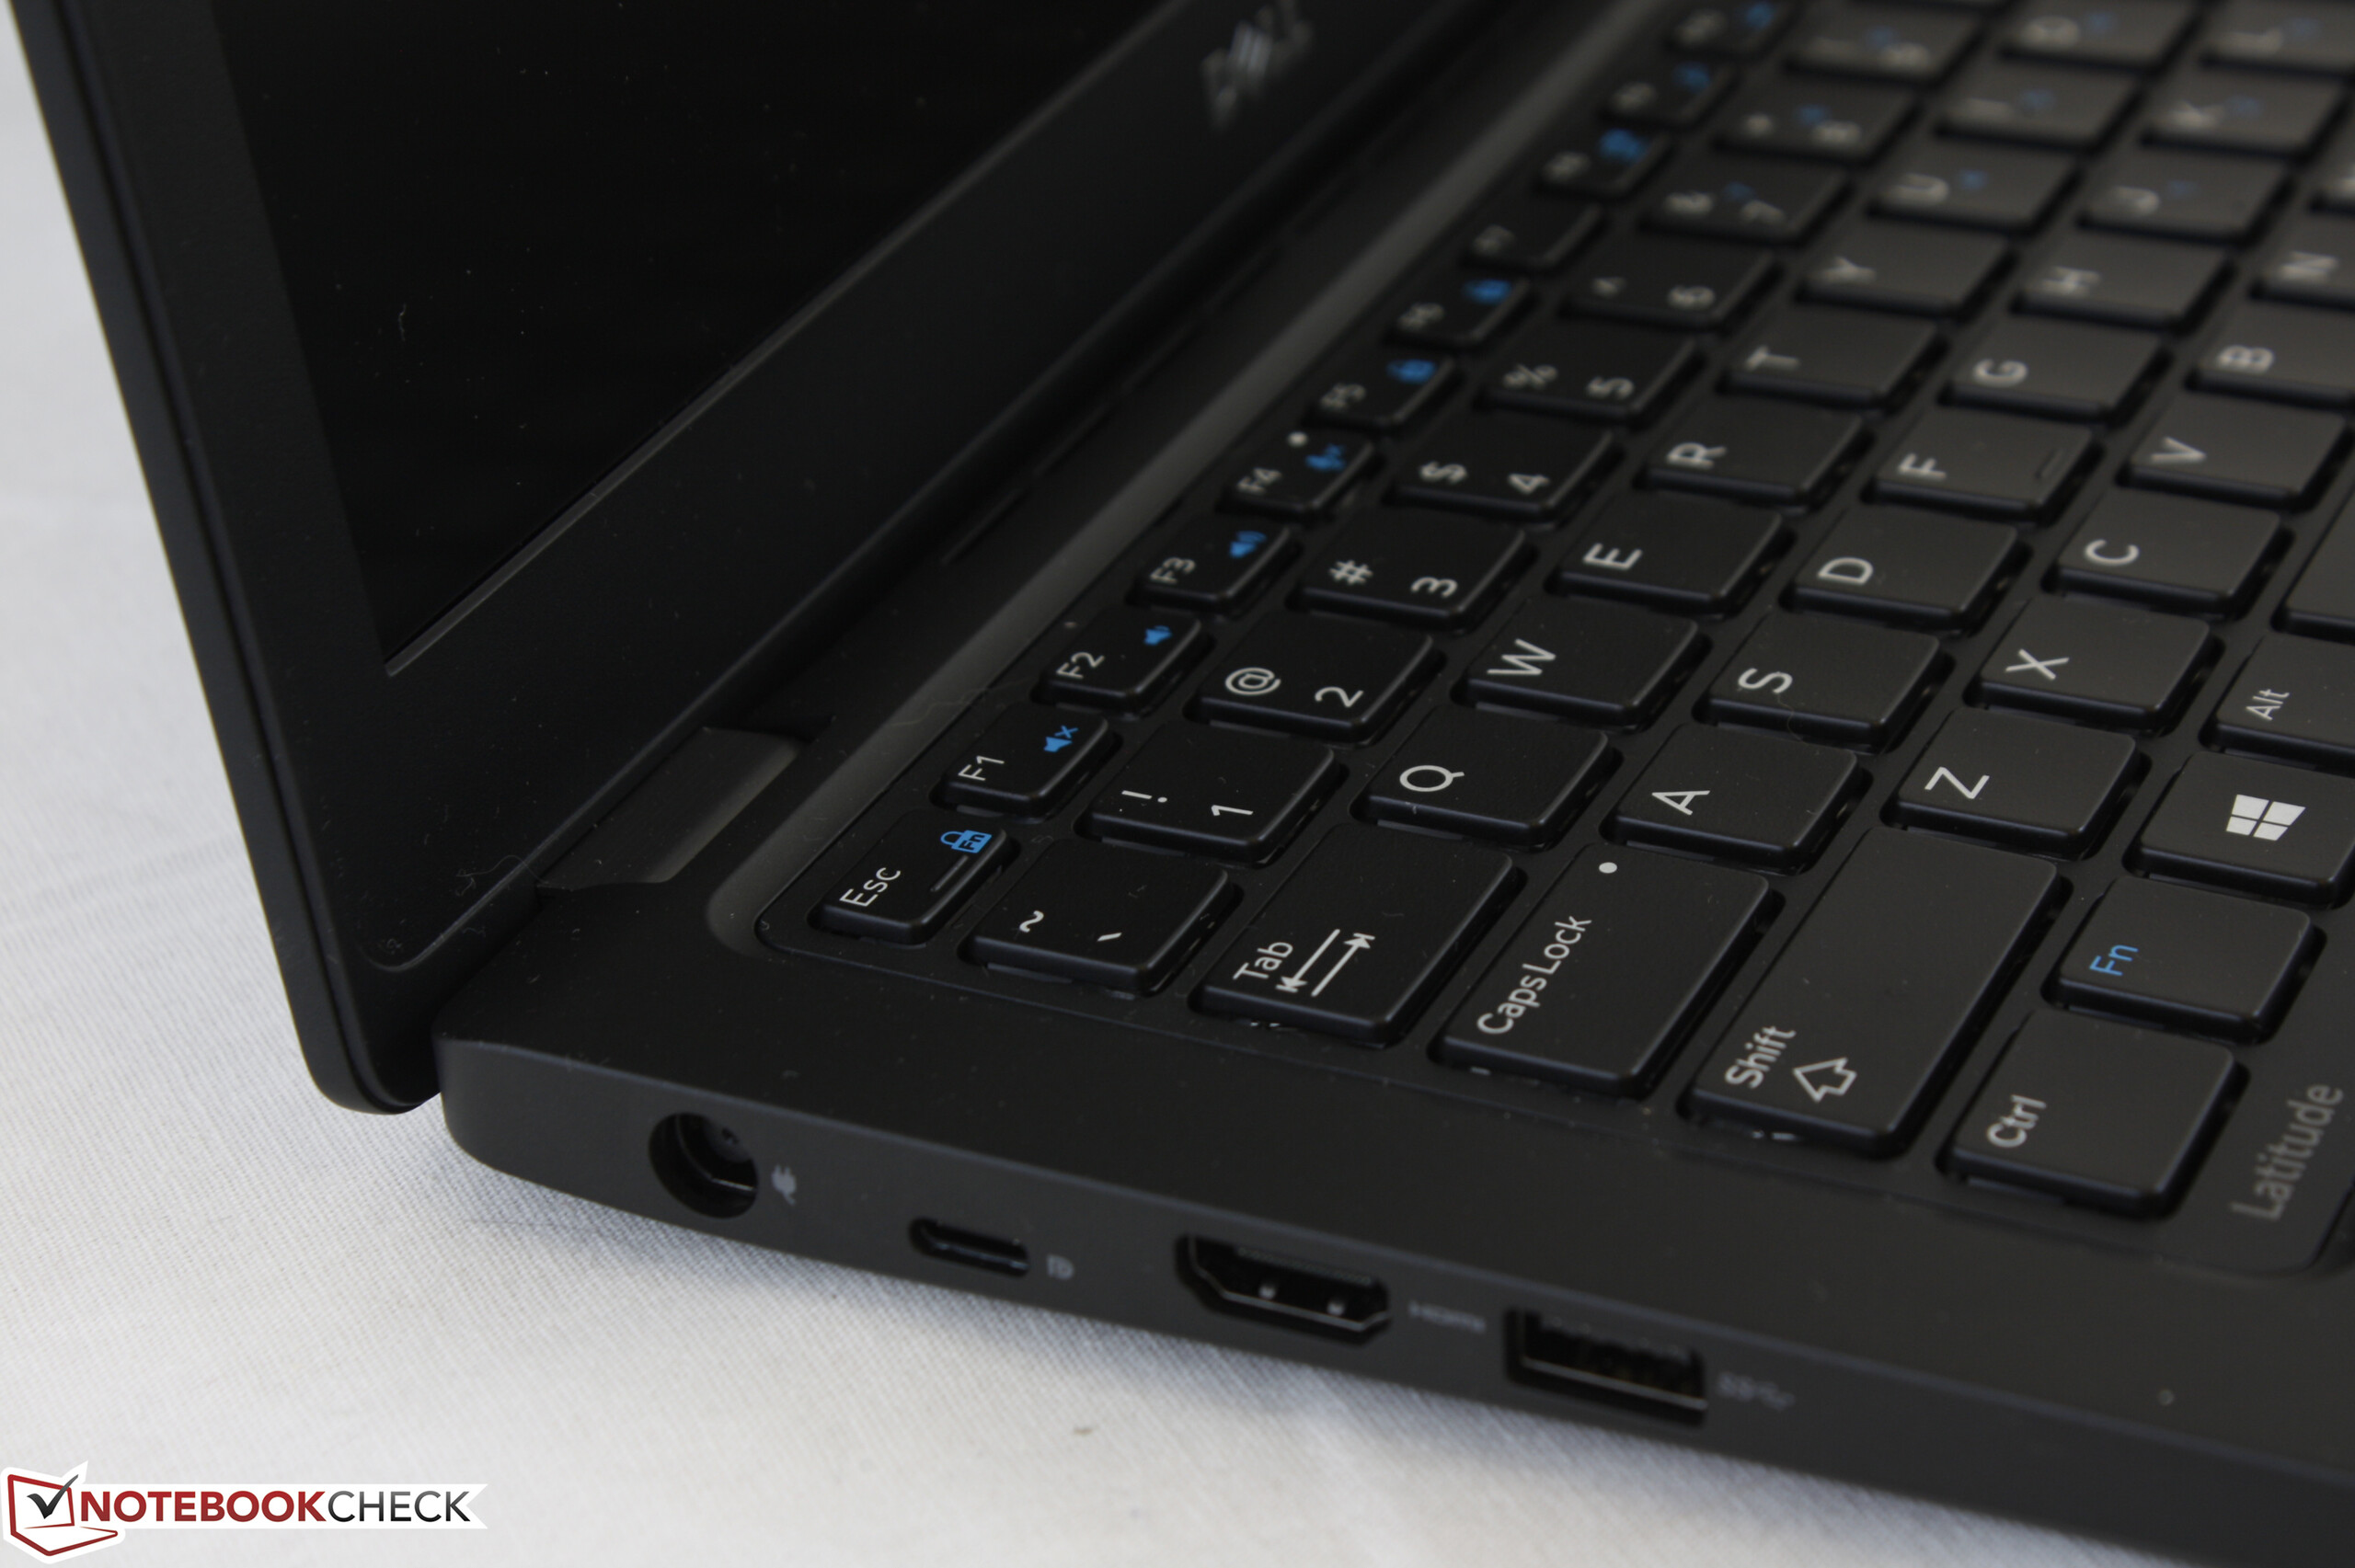
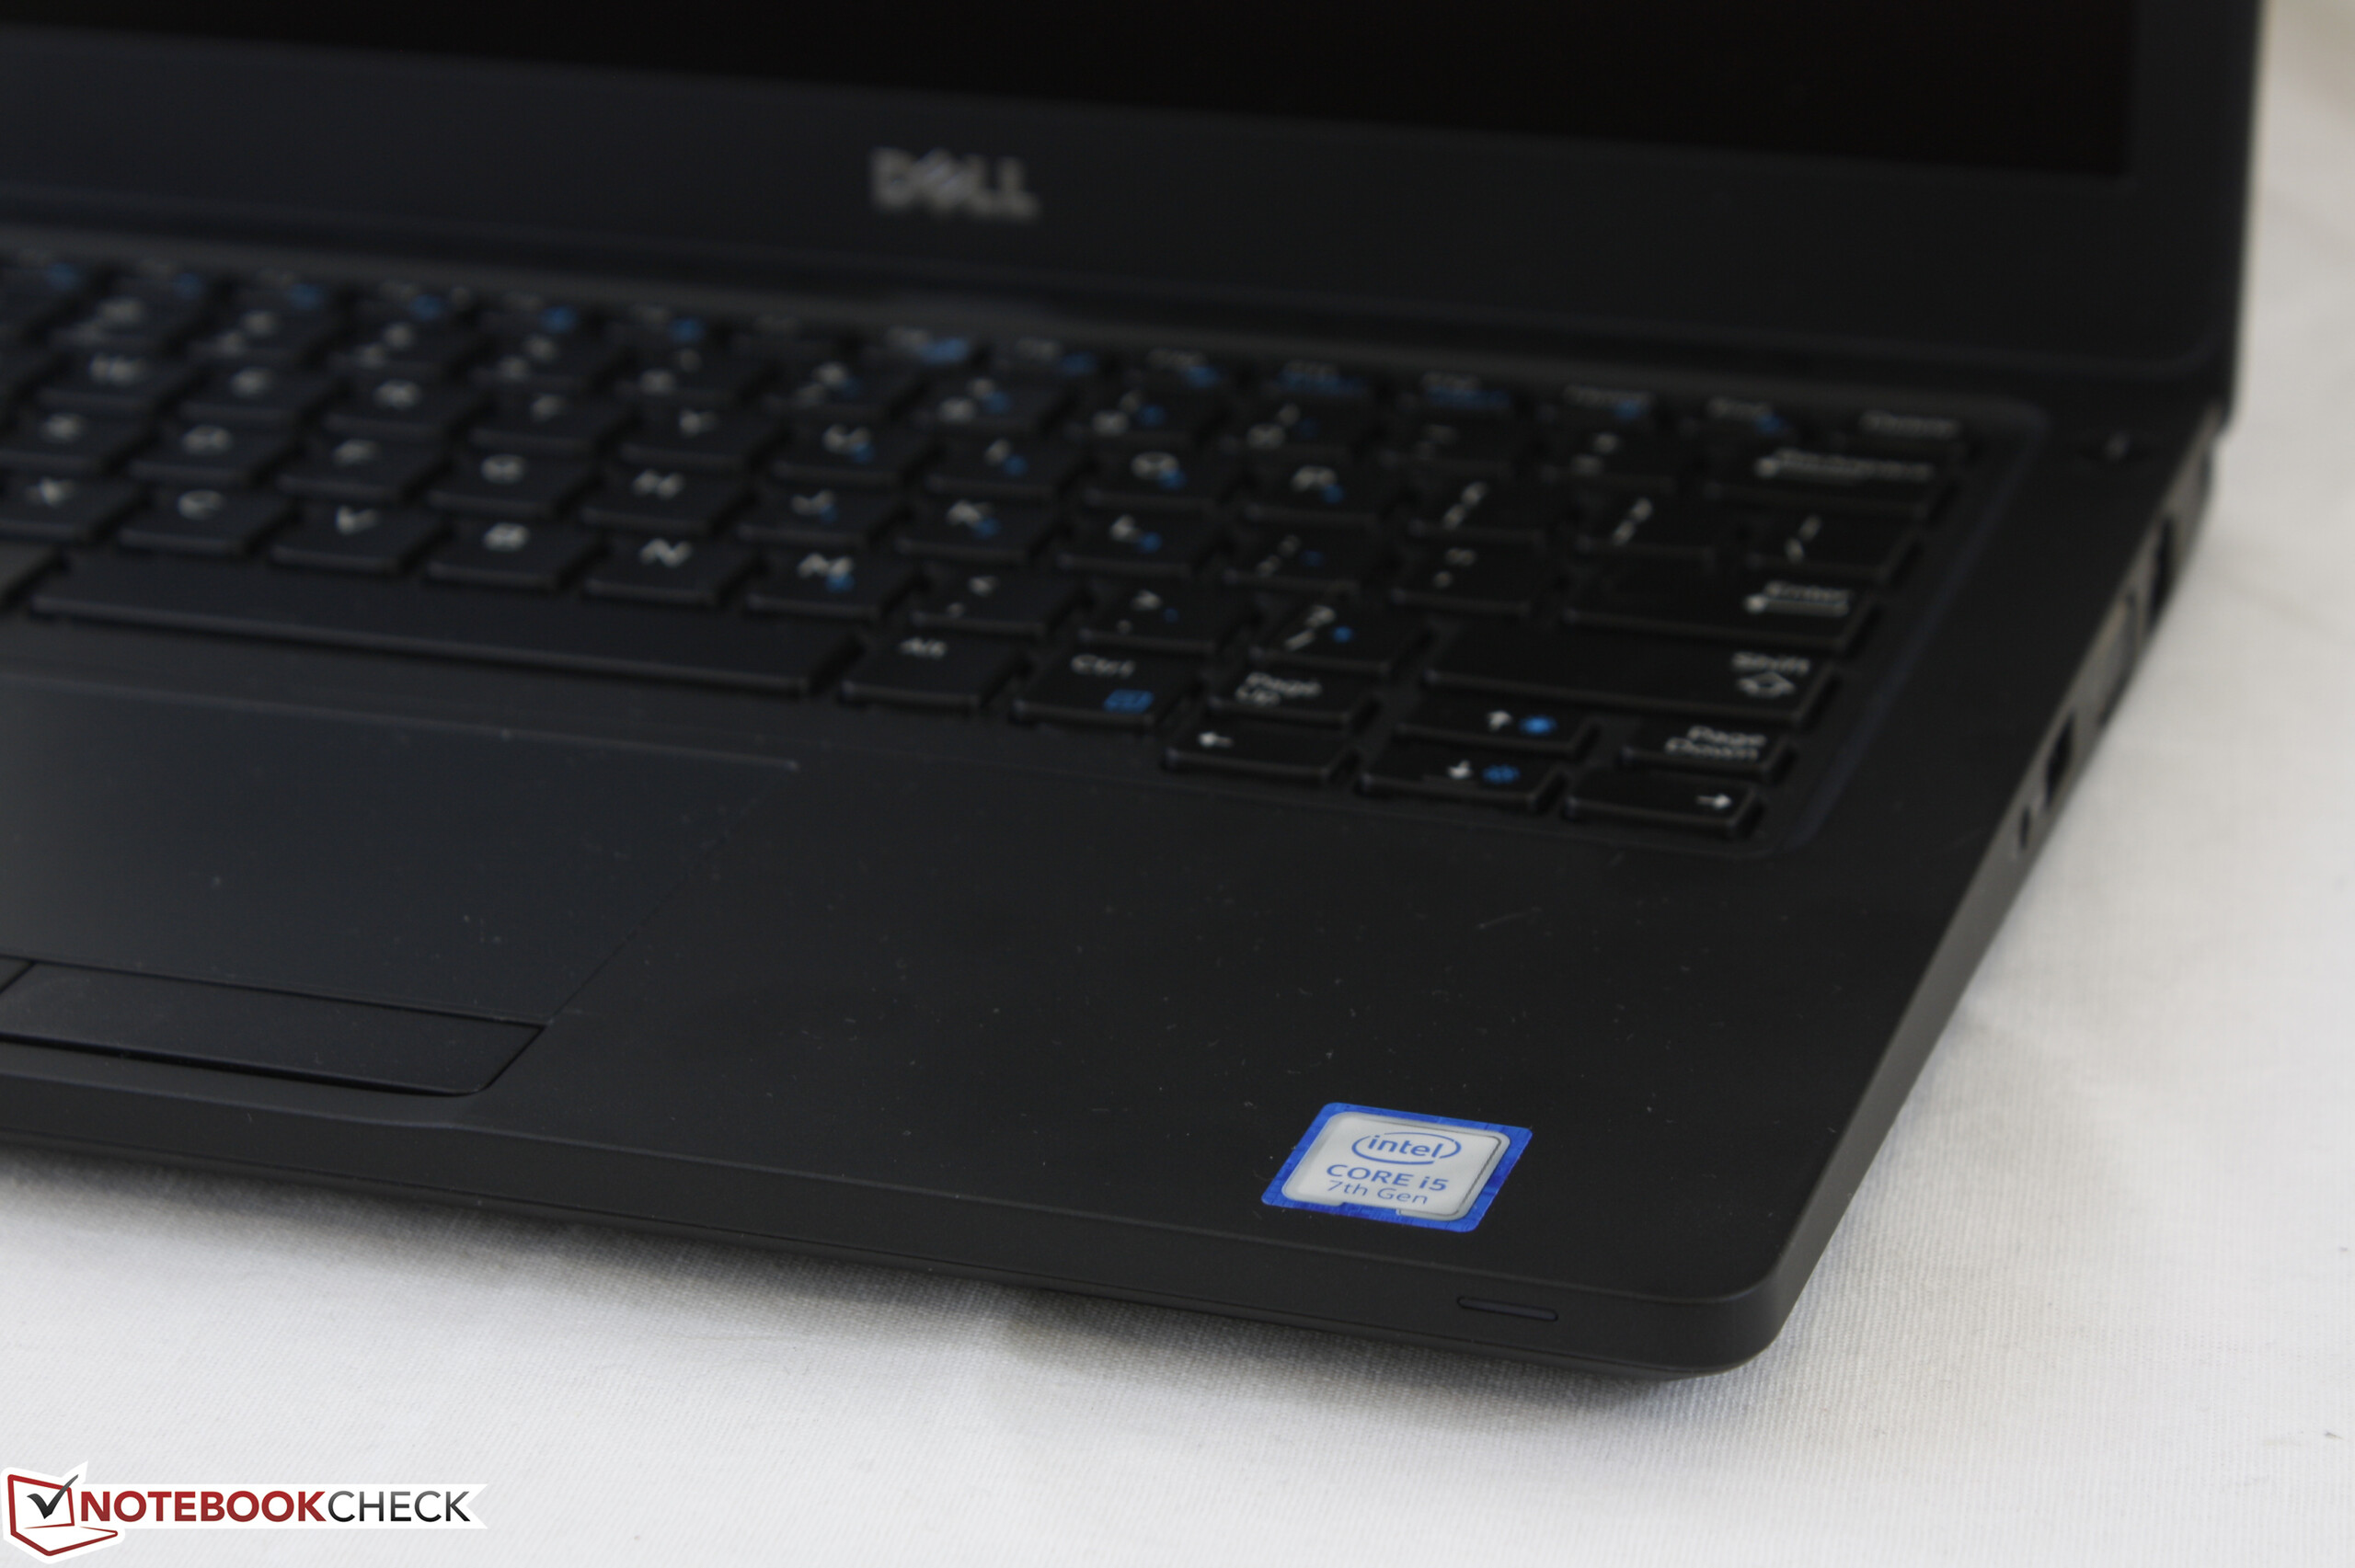
Als de hierboven genoemde nadelen geen afknappers zijn, is de 5280 een echte uitblinker in de meeste andere categorieën. Zijn USB Type-C-poort laat nog altijd toe om via DisplayPort externe monitors te verbinden en de nieuwe behuizing is veel lichter dan de E5270 zonder dat dit merkbaar ten koste gaat van stabiliteit. De batterijduur is uitstekend voor de middelste batterij-optie en het behoud van zowel VGA- en HDMI-output zal zonder twijfel van pas komen in de context van een universiteitslokaal of conferentieruimte. CPU-prestaties zijn erg indrukwekkend aangezien de processor in staat is om de maximale Turbo Boost-snelheid zelfs onder erg hoge belasting aan te houden.
We raden aan om het ondermaatse 768p-scherm links te laten liggen en te opteren voor de helderdere 1080p-variant en een snellere primaire SSD. De verhoging in resolutie en helderheid zal het gebruikscomfort ten goede komen en is absoluut de investering waard als je het systeem vaak zonder externe monitors zal gebruiken.
Het ietwat sponsachtige toetsenbord vergt wat tijd om gewoon te worden en gebruikers met grotere handen kunnen toestellen van dit formaat beter vermijden voor langere periodes van typen. De 5280 is meer geschikt voor gebruikers die voortdurend onderweg zijn dan voor wie zijn toestel vooral stationair gebruikt thuis of op kantoor.
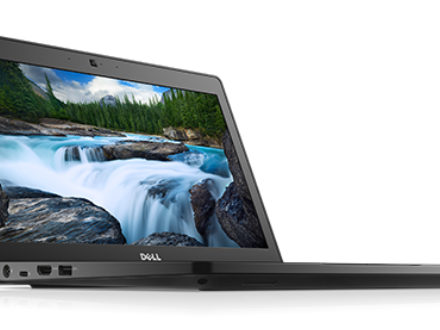
Dell Latitude 5280
- 27-05-2017 v6 (old)
Allen Ngo
Price comparison
