Core i7-1260U debuut: Dell Latitude 13 9330 2-in-1 convertible review
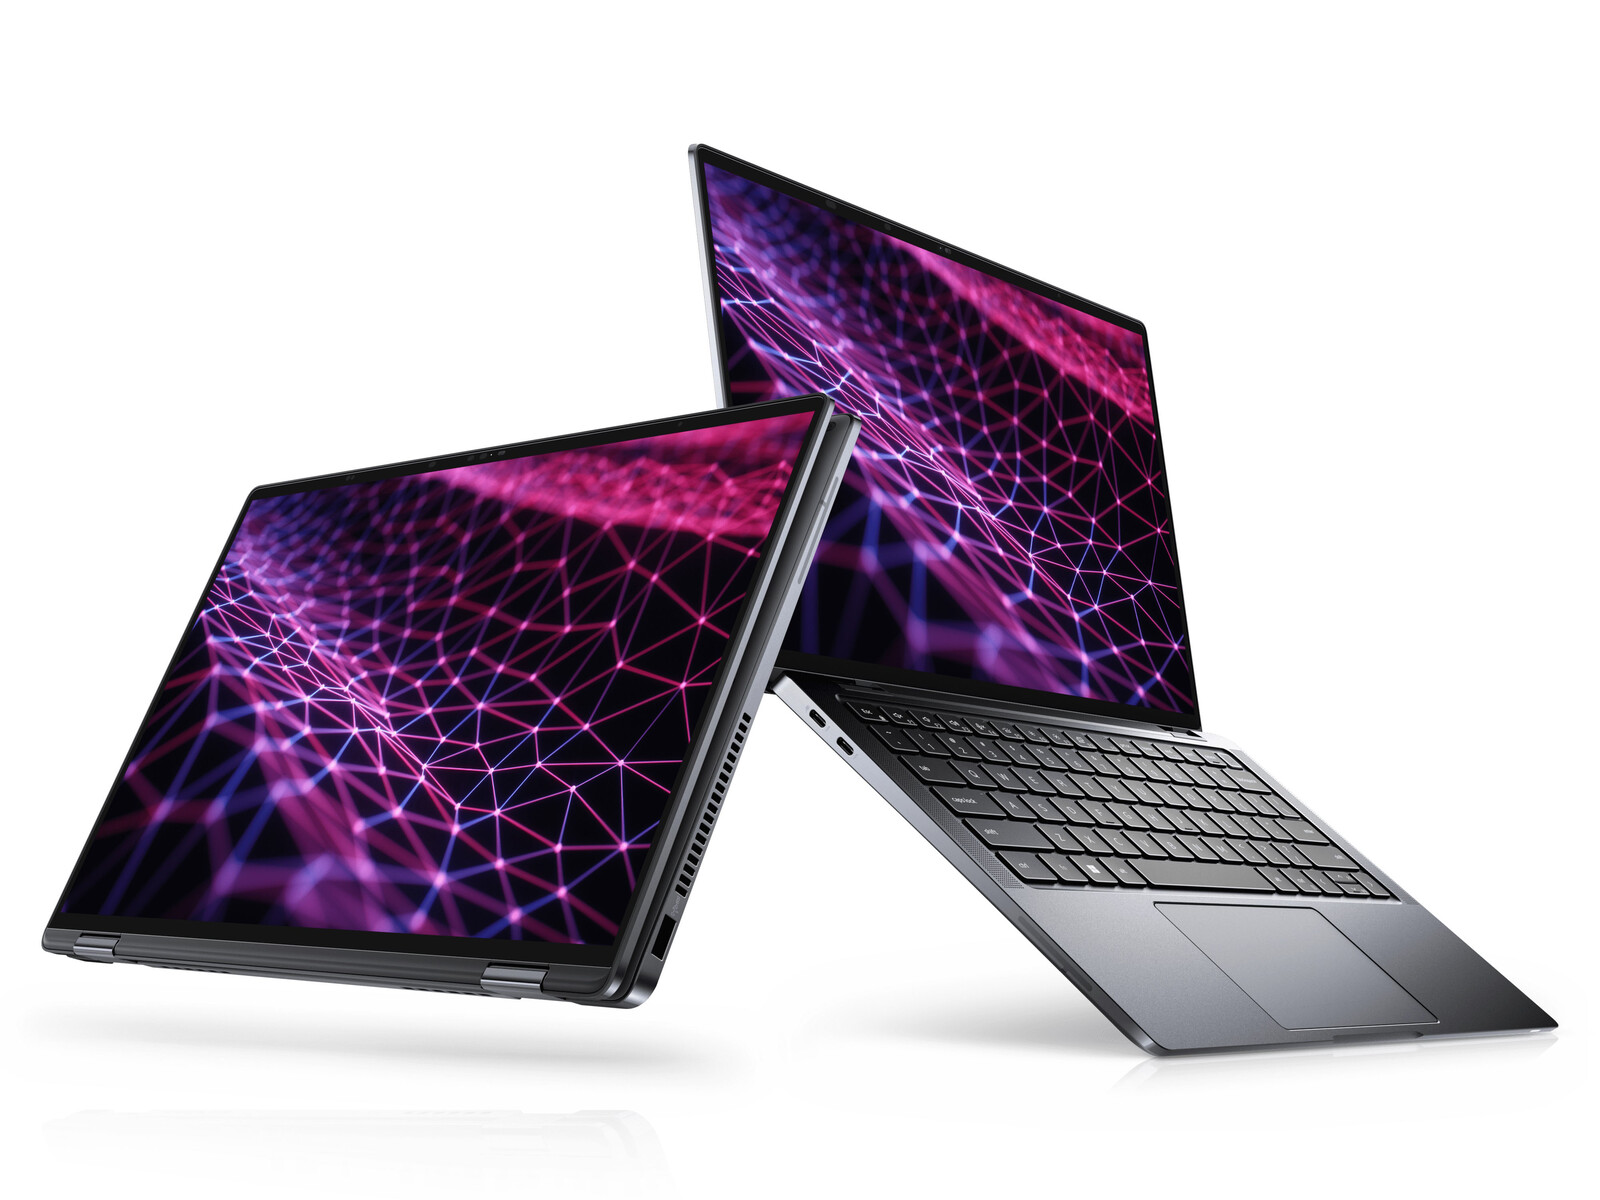
De Latitude 9000 serie is de thuisbasis van Dell's vlaggenschip zakelijke laptops in tegenstelling tot de hogere middenklasse Latitude 7000 serie, midrange Latitude 5000 serie, en low-end Latitude 3000 serie. Ons beoordeelde model is de Latitude 9330, de eerste 13,3-inch convertible in de Latitude 9000-familie
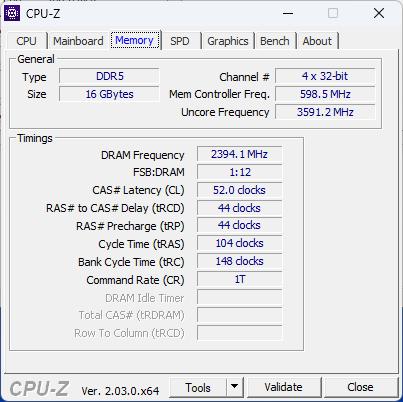
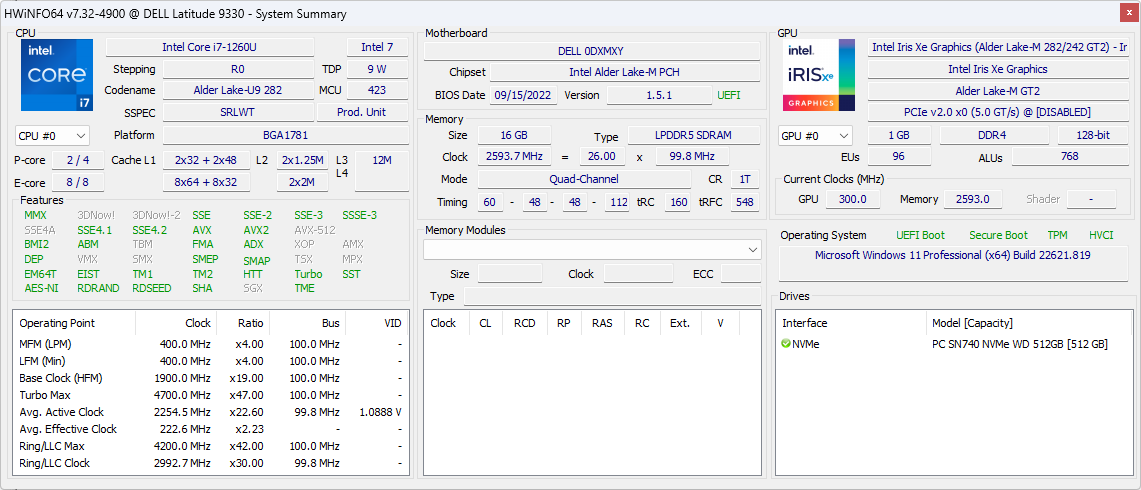
Onze specifieke configuratie is de hoogste SKU met de 12e generatie Core i7-1260U CPU, 32 GB LPDDR5 RAM en 512 GB NVMe SSD voor ongeveer 2700 USD. Andere SKU's met de langzamere Core i5-1240U CPU en de helft van de RAM en opslag zijn ook beschikbaar vanaf $2000 USD, maar alle opties hebben verder alleen geïntegreerde graphics en hetzelfde 2560 x 1600 resolutie IPS touchscreen
Concurrenten van de Latitude 9330 zijn andere high-end 13-inch business-centric convertibles zoals de Lenovo ThinkPad X1 Yoga G1, MSI Summit E13 Flipof HP Elite Dragonfly Max.
Meer Dell beoordelingen
Potentiële concurrenten in vergelijking
Evaluatie | Datum | Model | Gewicht | Hoogte | Formaat | Resolutie | Beste prijs |
|---|---|---|---|---|---|---|---|
| 89 % v7 (old) | 11-2022 | Dell Latitude 9330 i7-1260U, Iris Xe G7 96EUs | 1.2 kg | 14.1 mm | 13.30" | 2560x1600 | |
| 88.5 % v7 (old) | Lenovo ThinkPad X1 Titanium Yoga G1 20QB0016GE i5-1140G7, Iris Xe G7 80EUs | 1.2 kg | 11.5 mm | 13.50" | 2256x1504 | ||
| 86.9 % v7 (old) | 04-2021 | MSI Summit E13 Flip Evo A11MT i7-1185G7, Iris Xe G7 96EUs | 1.4 kg | 14.9 mm | 13.40" | 1920x1200 | |
| 90 % v7 (old) | 11-2020 | HP EliteBook x360 1030 G7 i7-10810U, UHD Graphics 620 | 1.2 kg | 16 mm | 13.30" | 1920x1080 | |
| 90.8 % v7 (old) | 06-2021 | HP Elite Dragonfly Max i7-1185G7, Iris Xe G7 96EUs | 1.2 kg | 16 mm | 13.30" | 1920x1080 | |
| 87.2 % v7 (old) | 01-2021 | Dell Latitude 5310-23VP6 i5-10310U, UHD Graphics 620 | 1.3 kg | 19.7 mm | 13.30" | 1920x1080 |
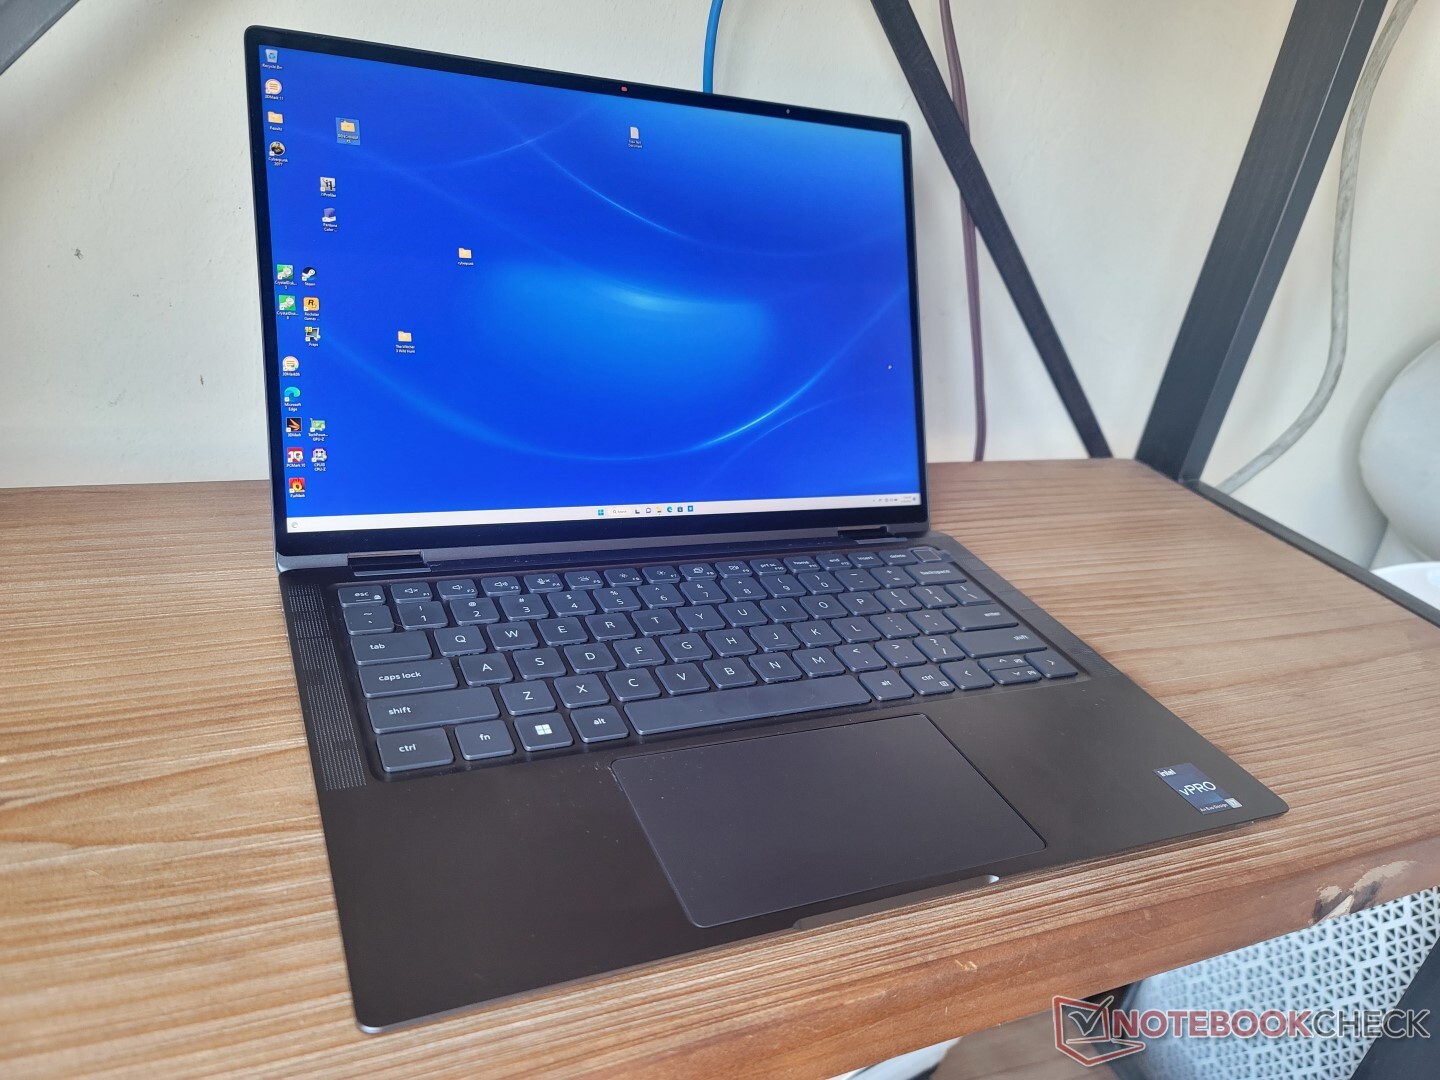
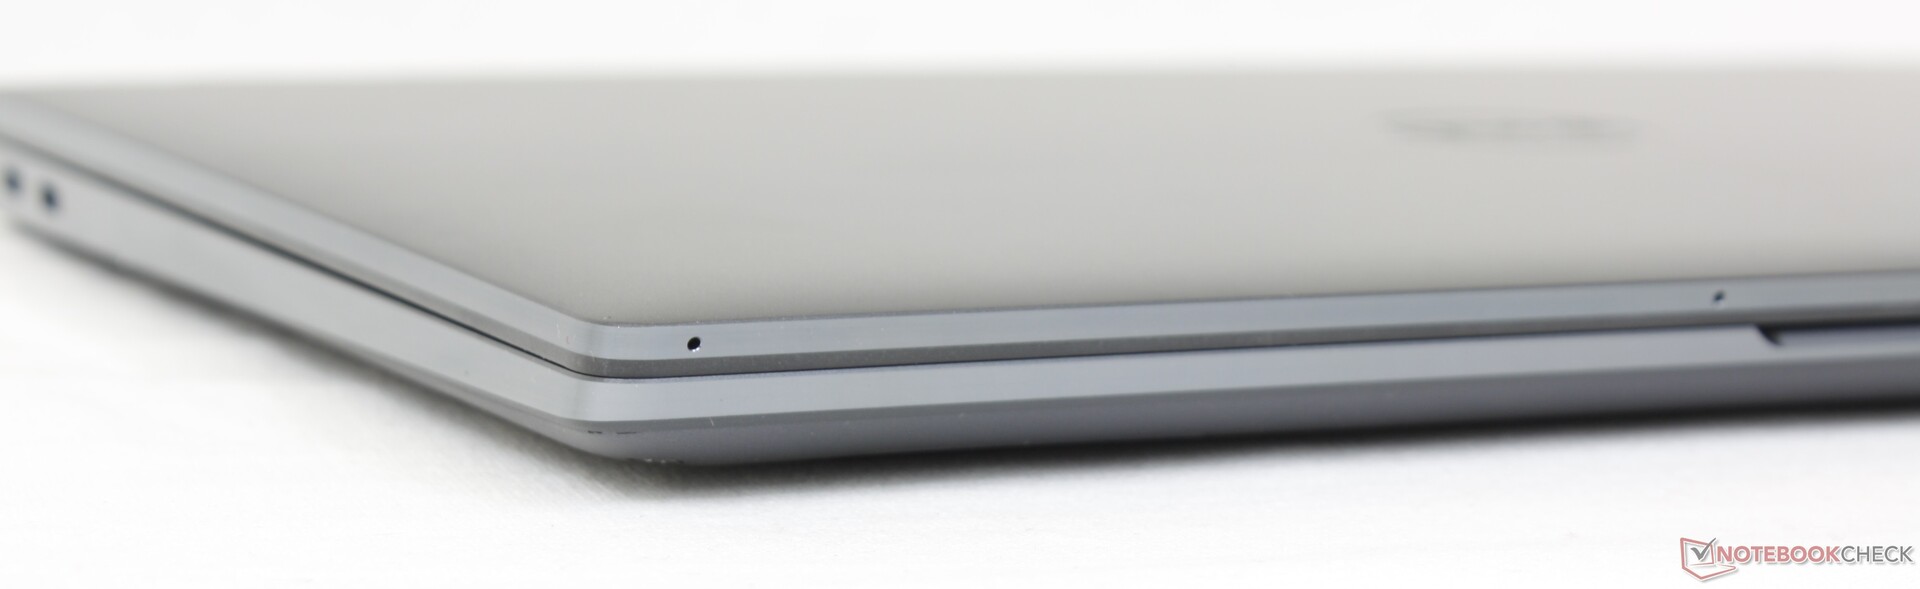
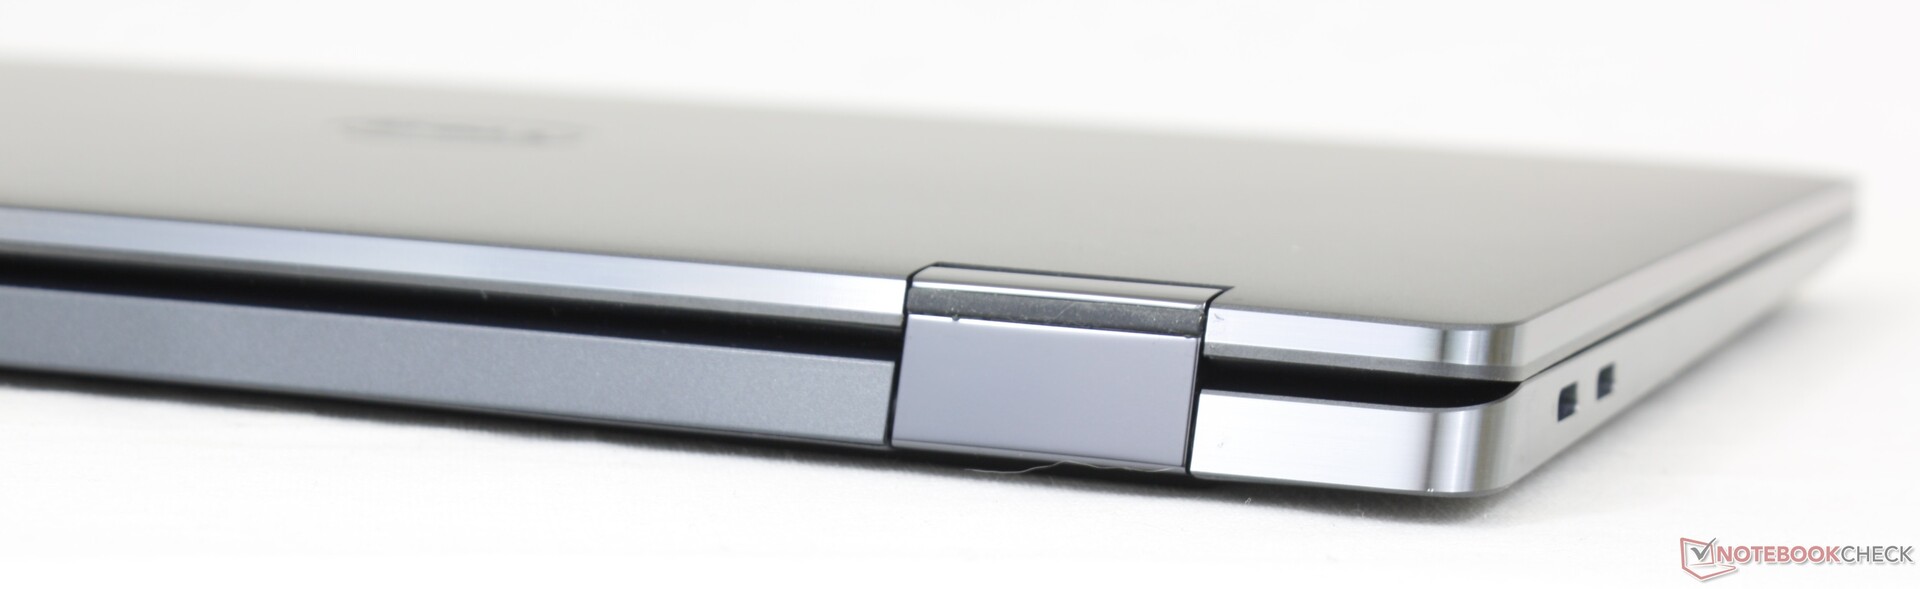
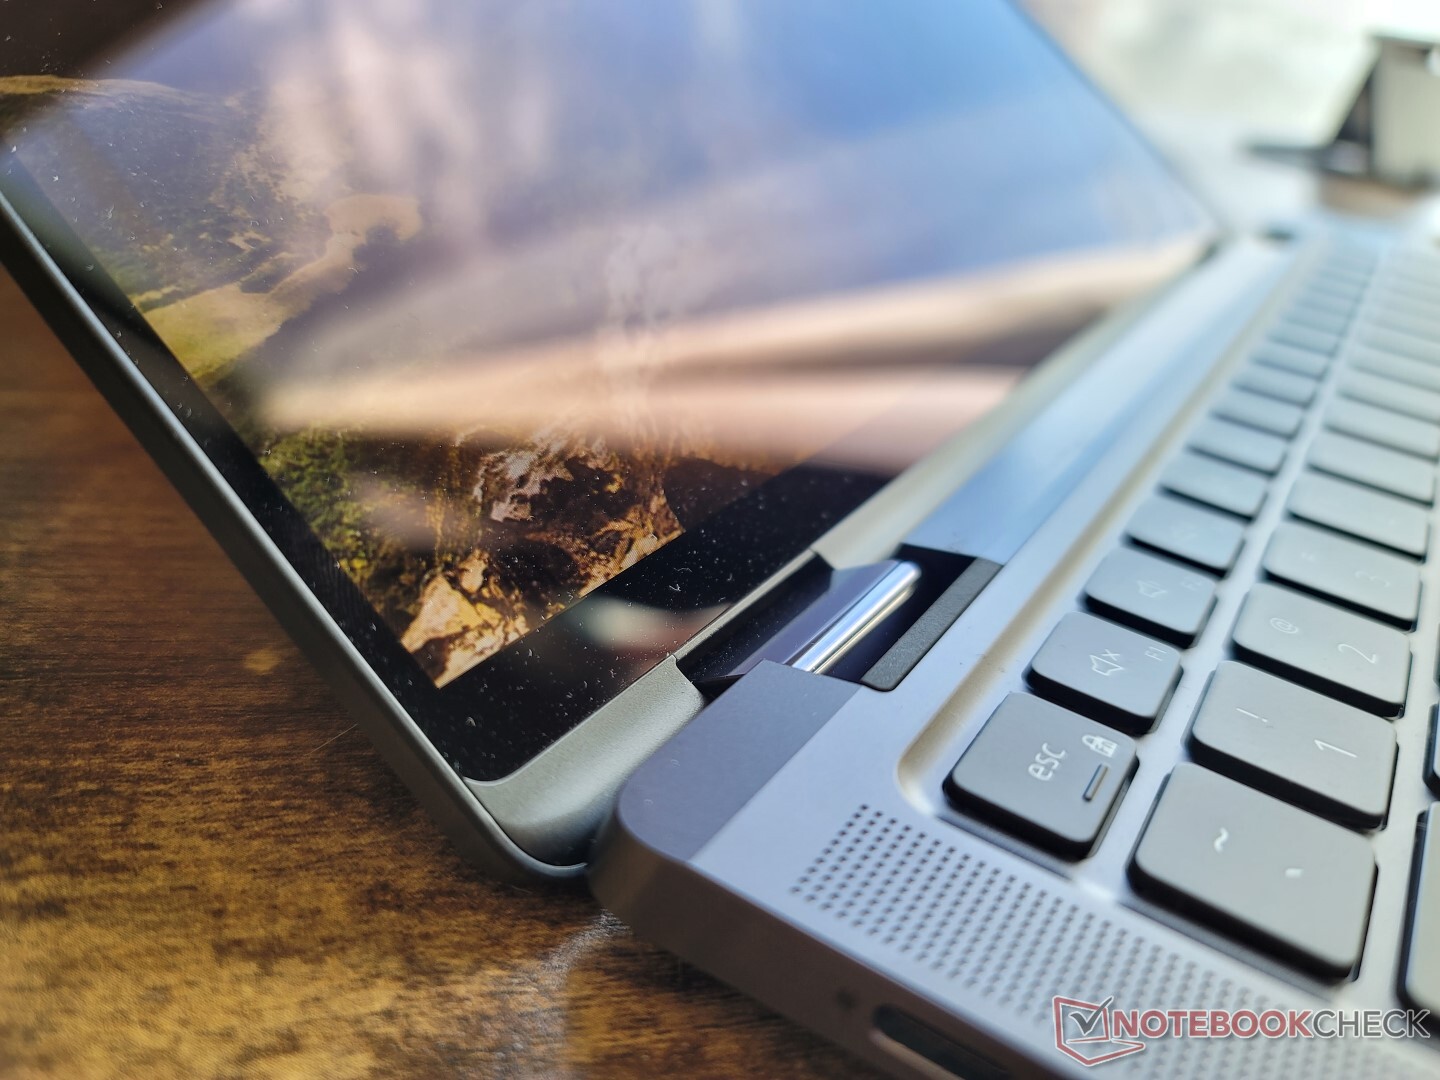
Zaak - Saai uiterlijk, sterk ontwerp
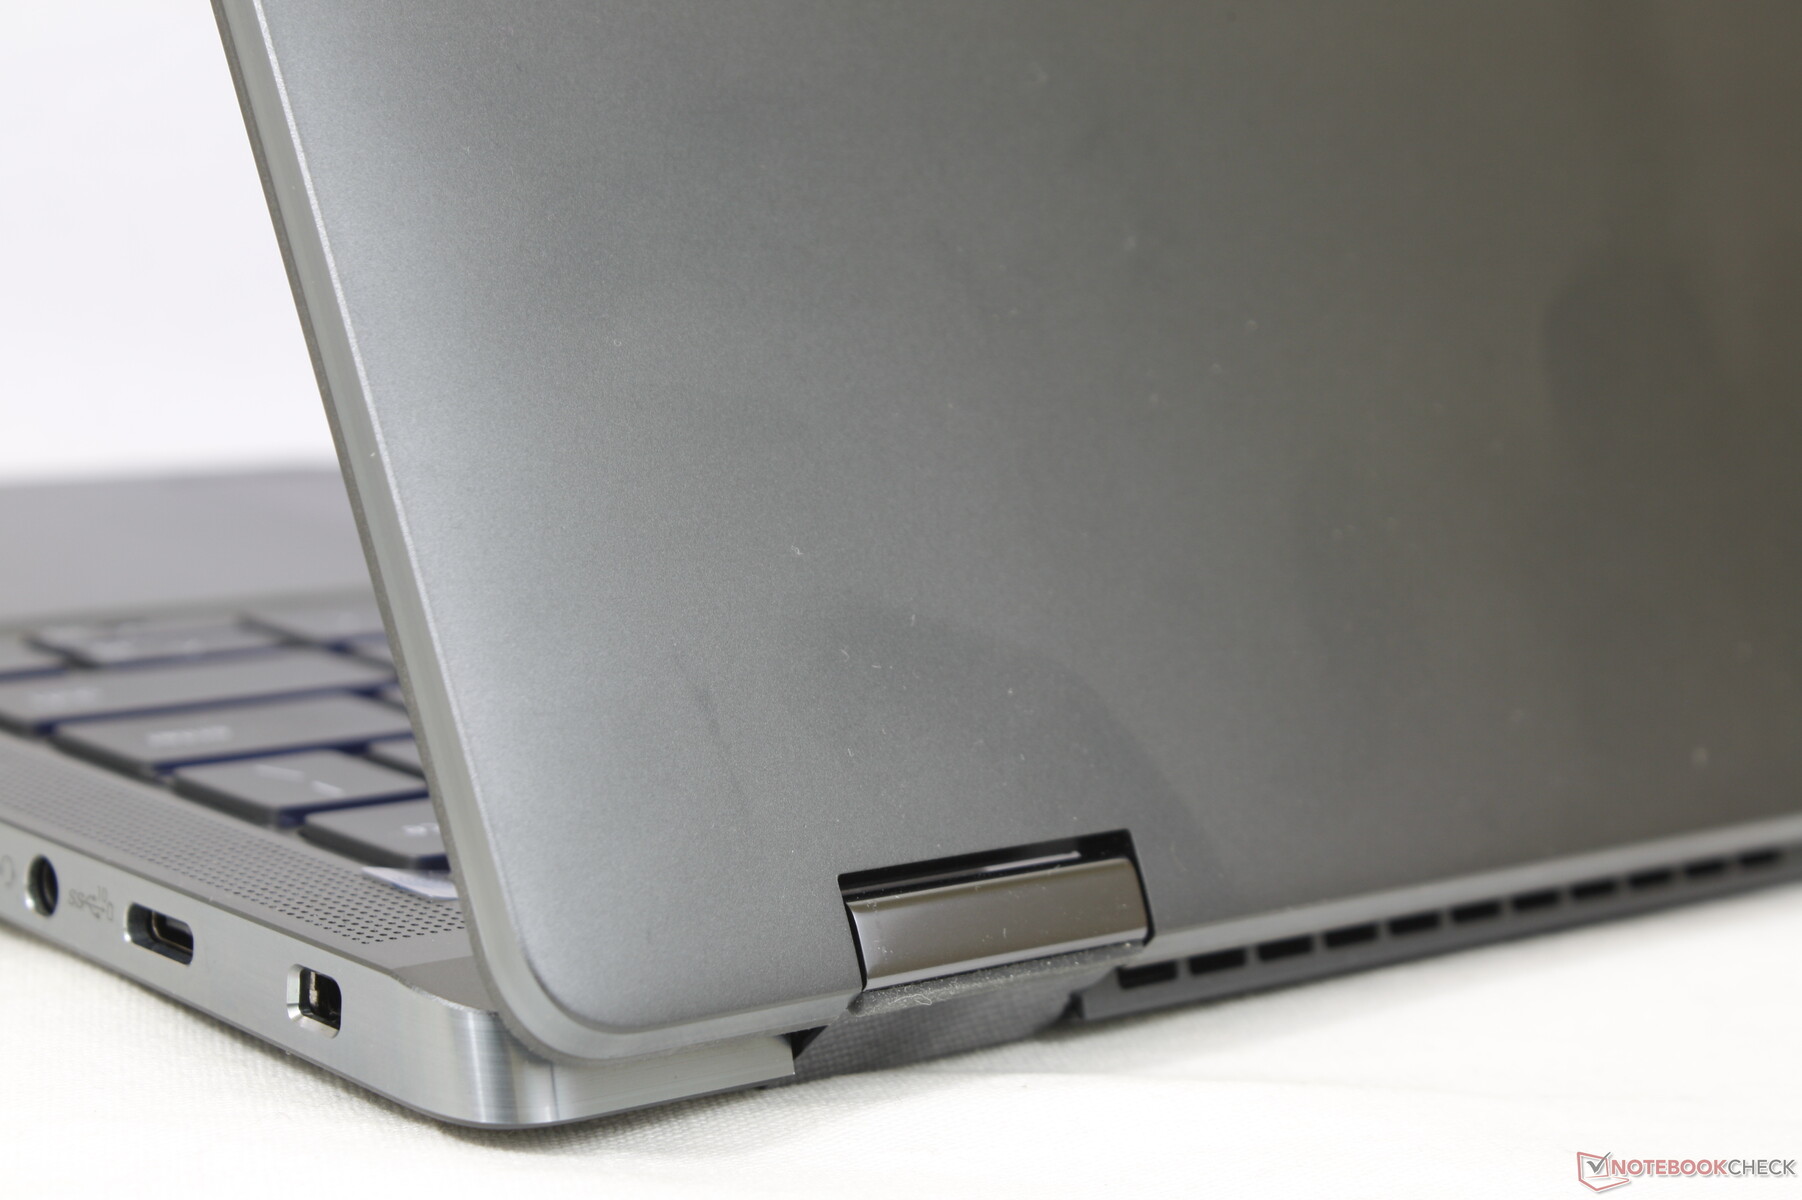
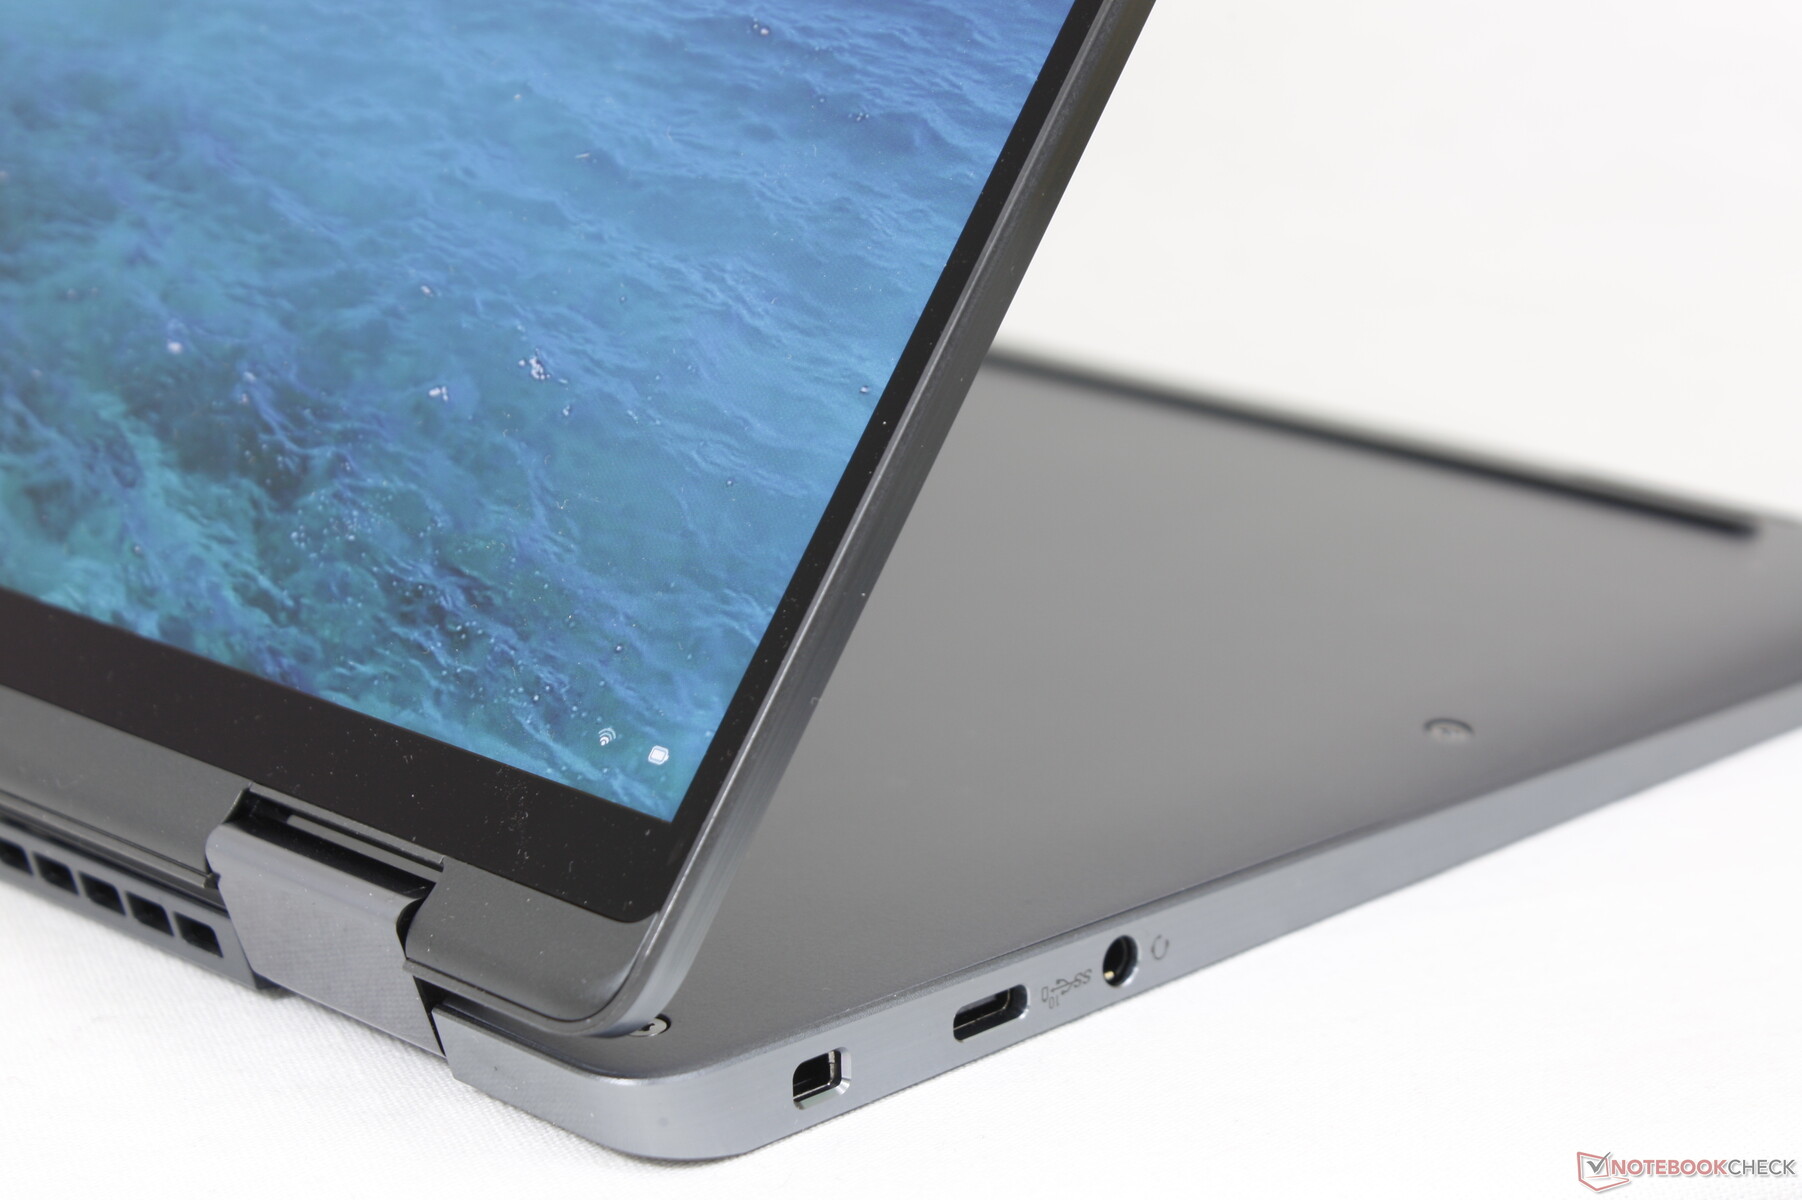
Het grijze metalen skelet lijkt misschien niet veel, vooral in vergelijking met de flitsende gouden ontwerpen van de MSI Summit E13 Flip of HP Spectre serie, maar het is net zo sterk, zo niet meer. Pogingen om de basis te verdraaien van de zijkanten of het toetsenbord centrum zou resulteren in slechts minimale vervorming voor een uitstekende eerste indruk. Zelfs het scherm is bestand tegen verdraaien of buigen. De algemene stijfheid is een van de beste die we hebben gezien op een ultradunne subnotebook convertible.
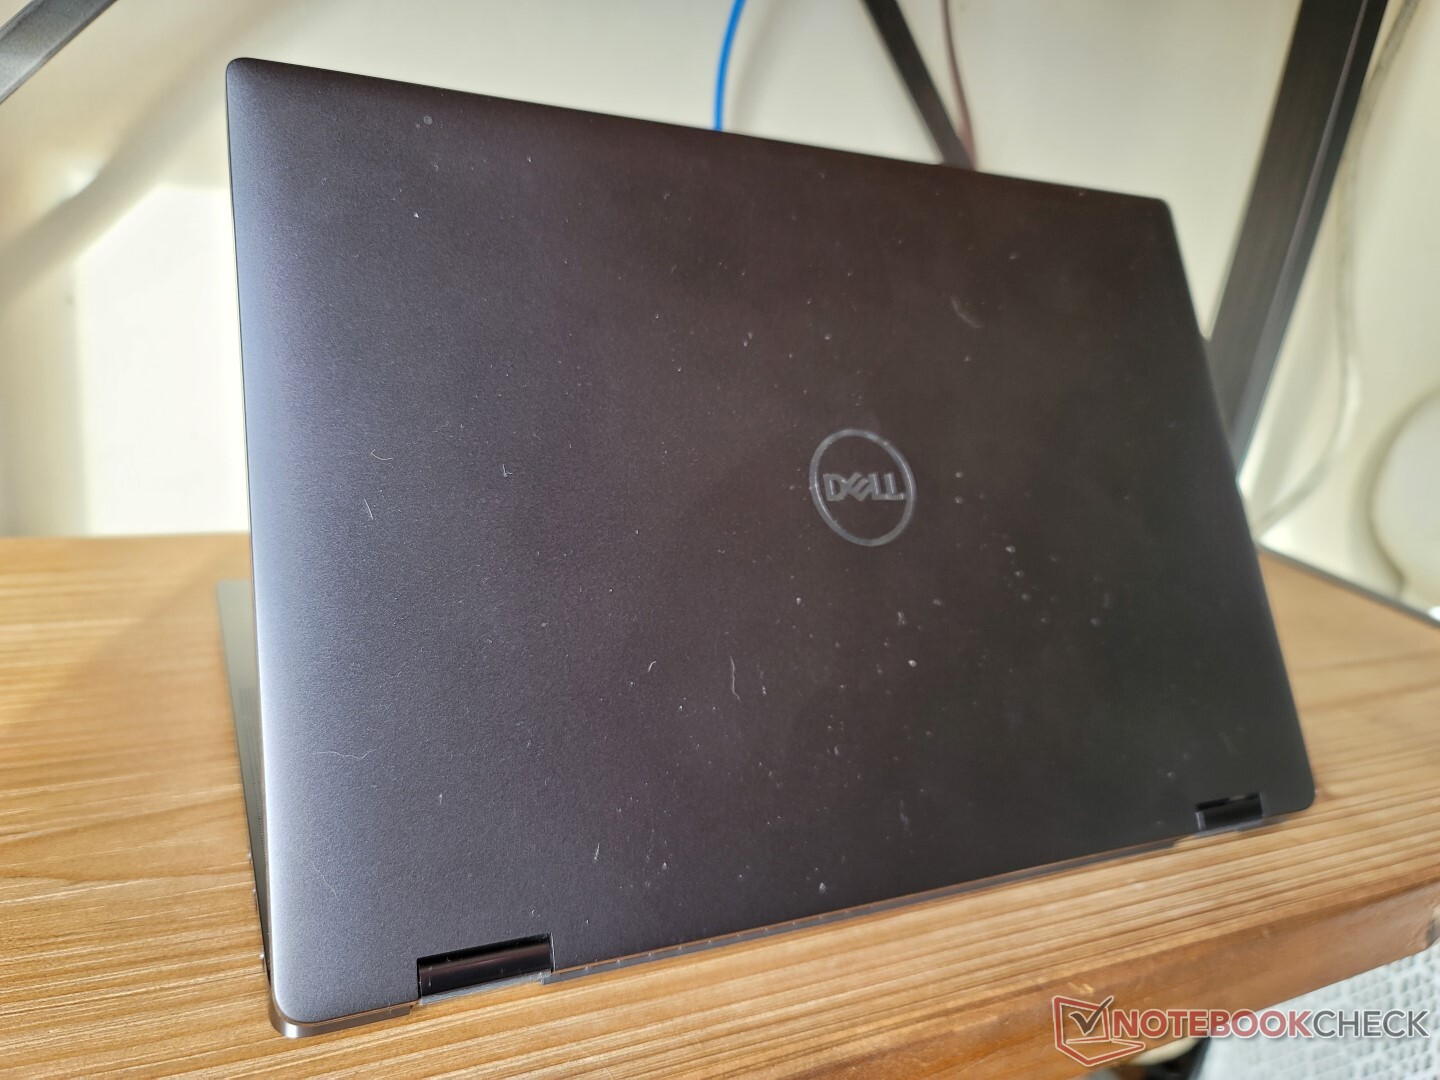
Afmetingen en gewicht liggen dicht bij de Elite Dragonfly Max. Het Dell model is iets langer door de grotere 16:10 beeldverhouding versus de 16:9 HP, maar het Dell ontwerp maakt dit goed met smallere zijranden en een dunner profiel. Ondertussen is de Summit E13 Flip is een nog grotere en zwaardere 13-inch convertible.
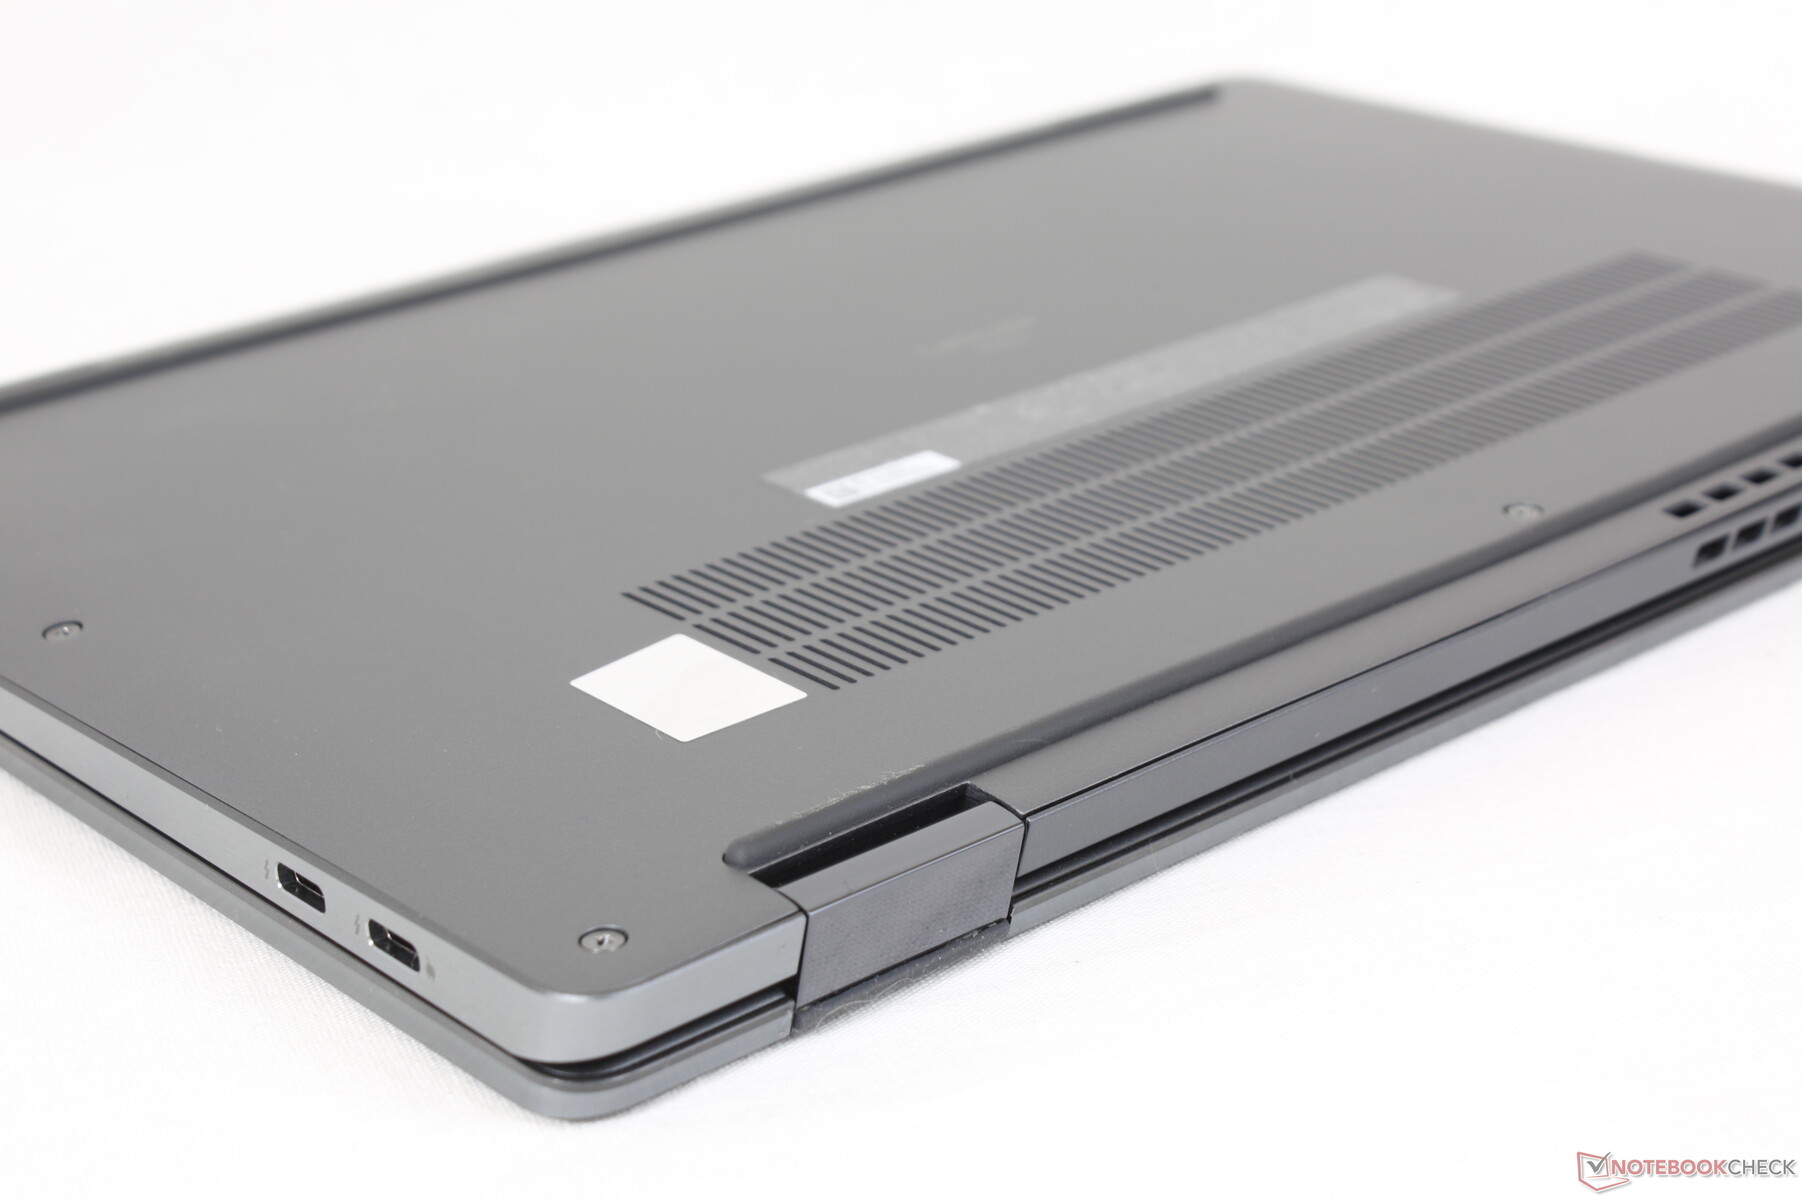
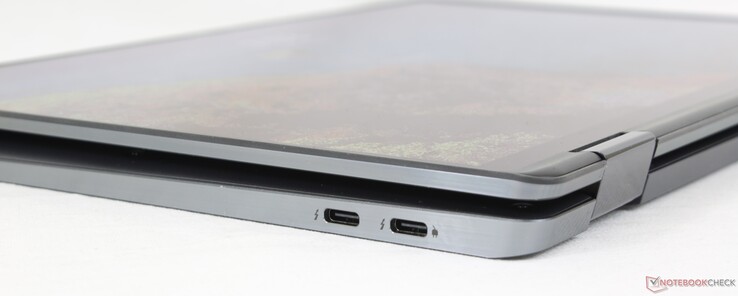
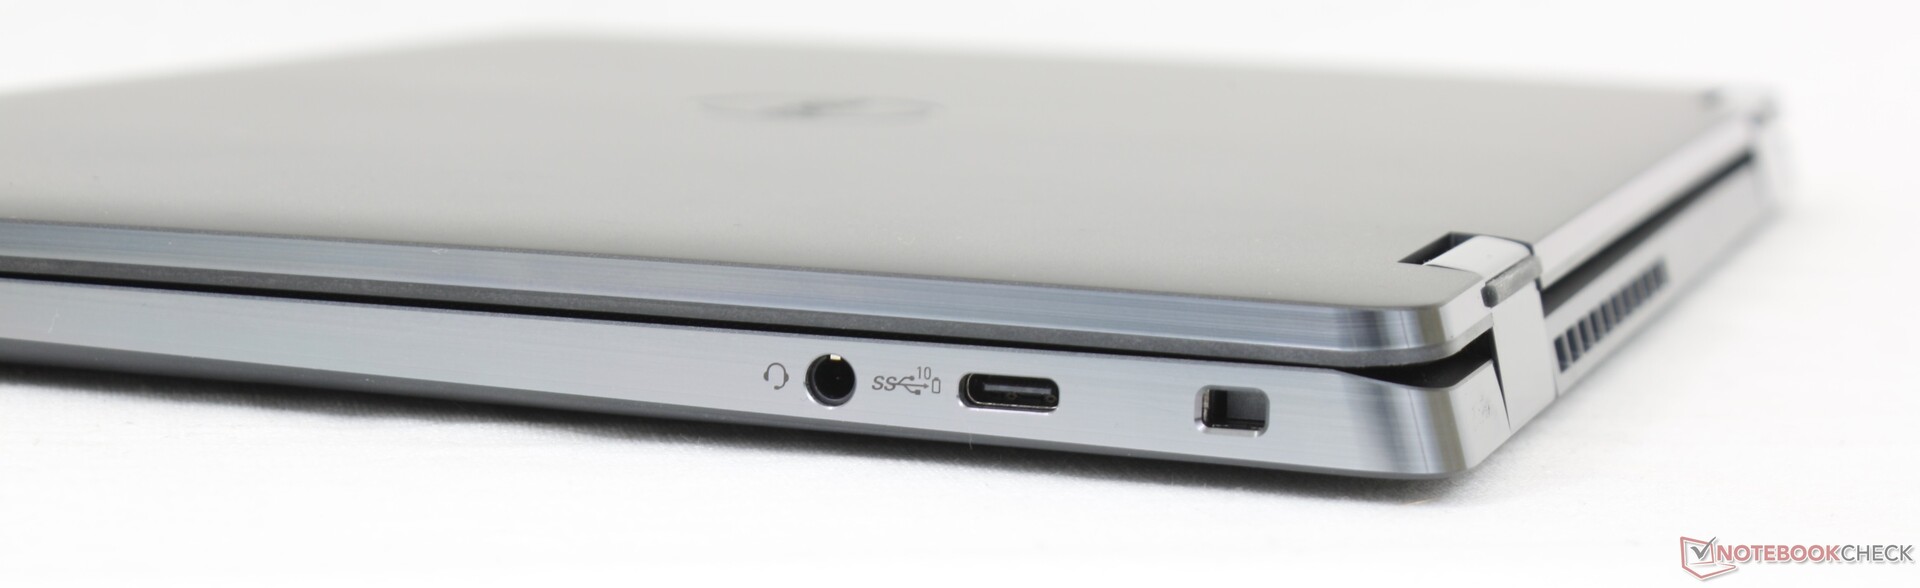
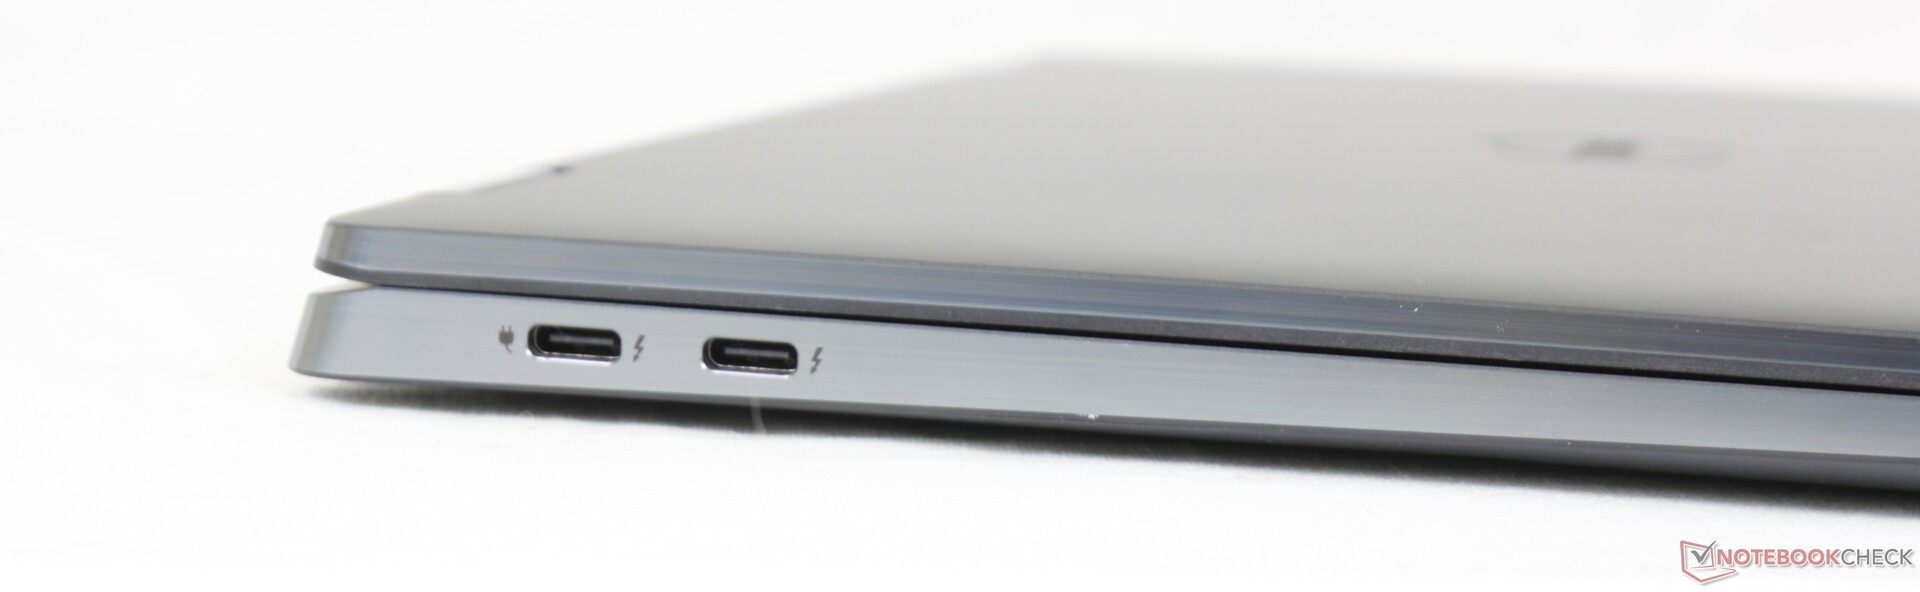
Connectiviteit - alleen USB-C
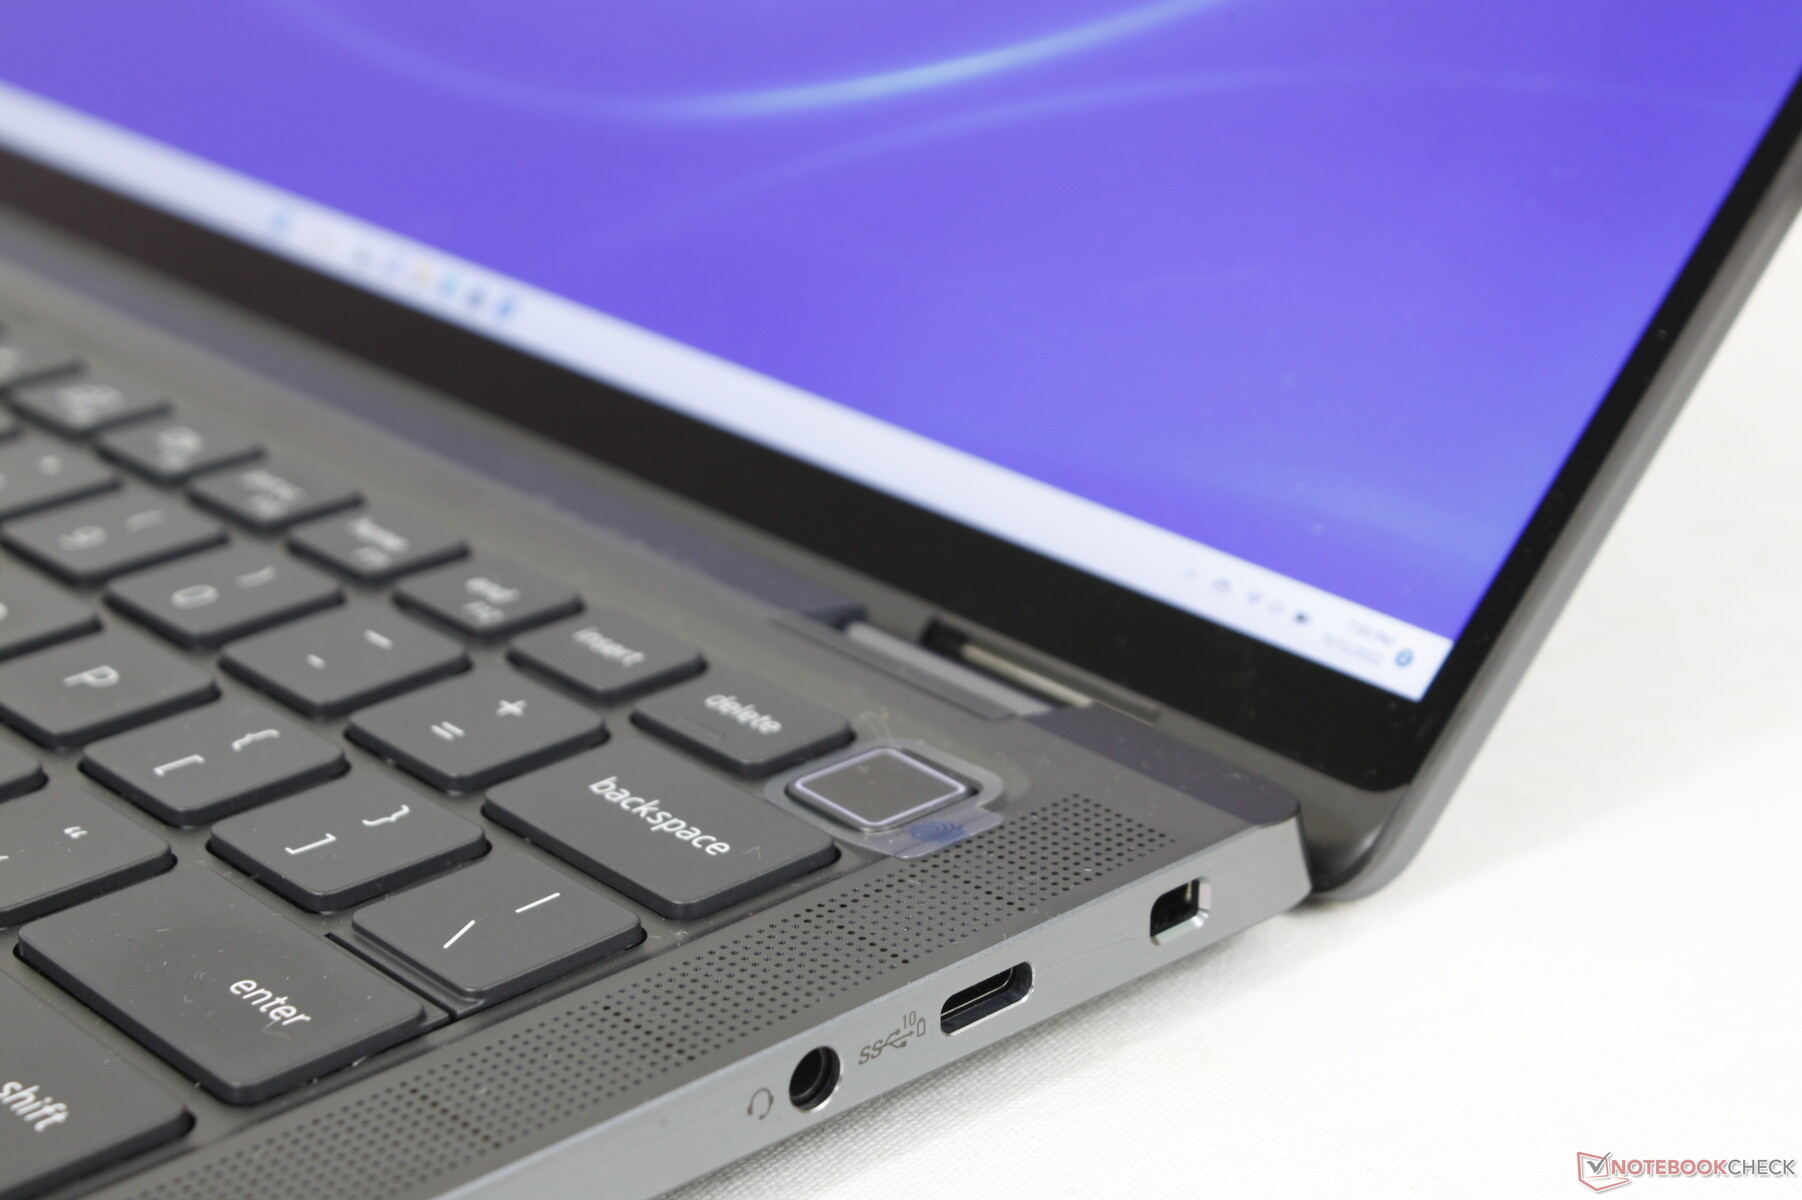
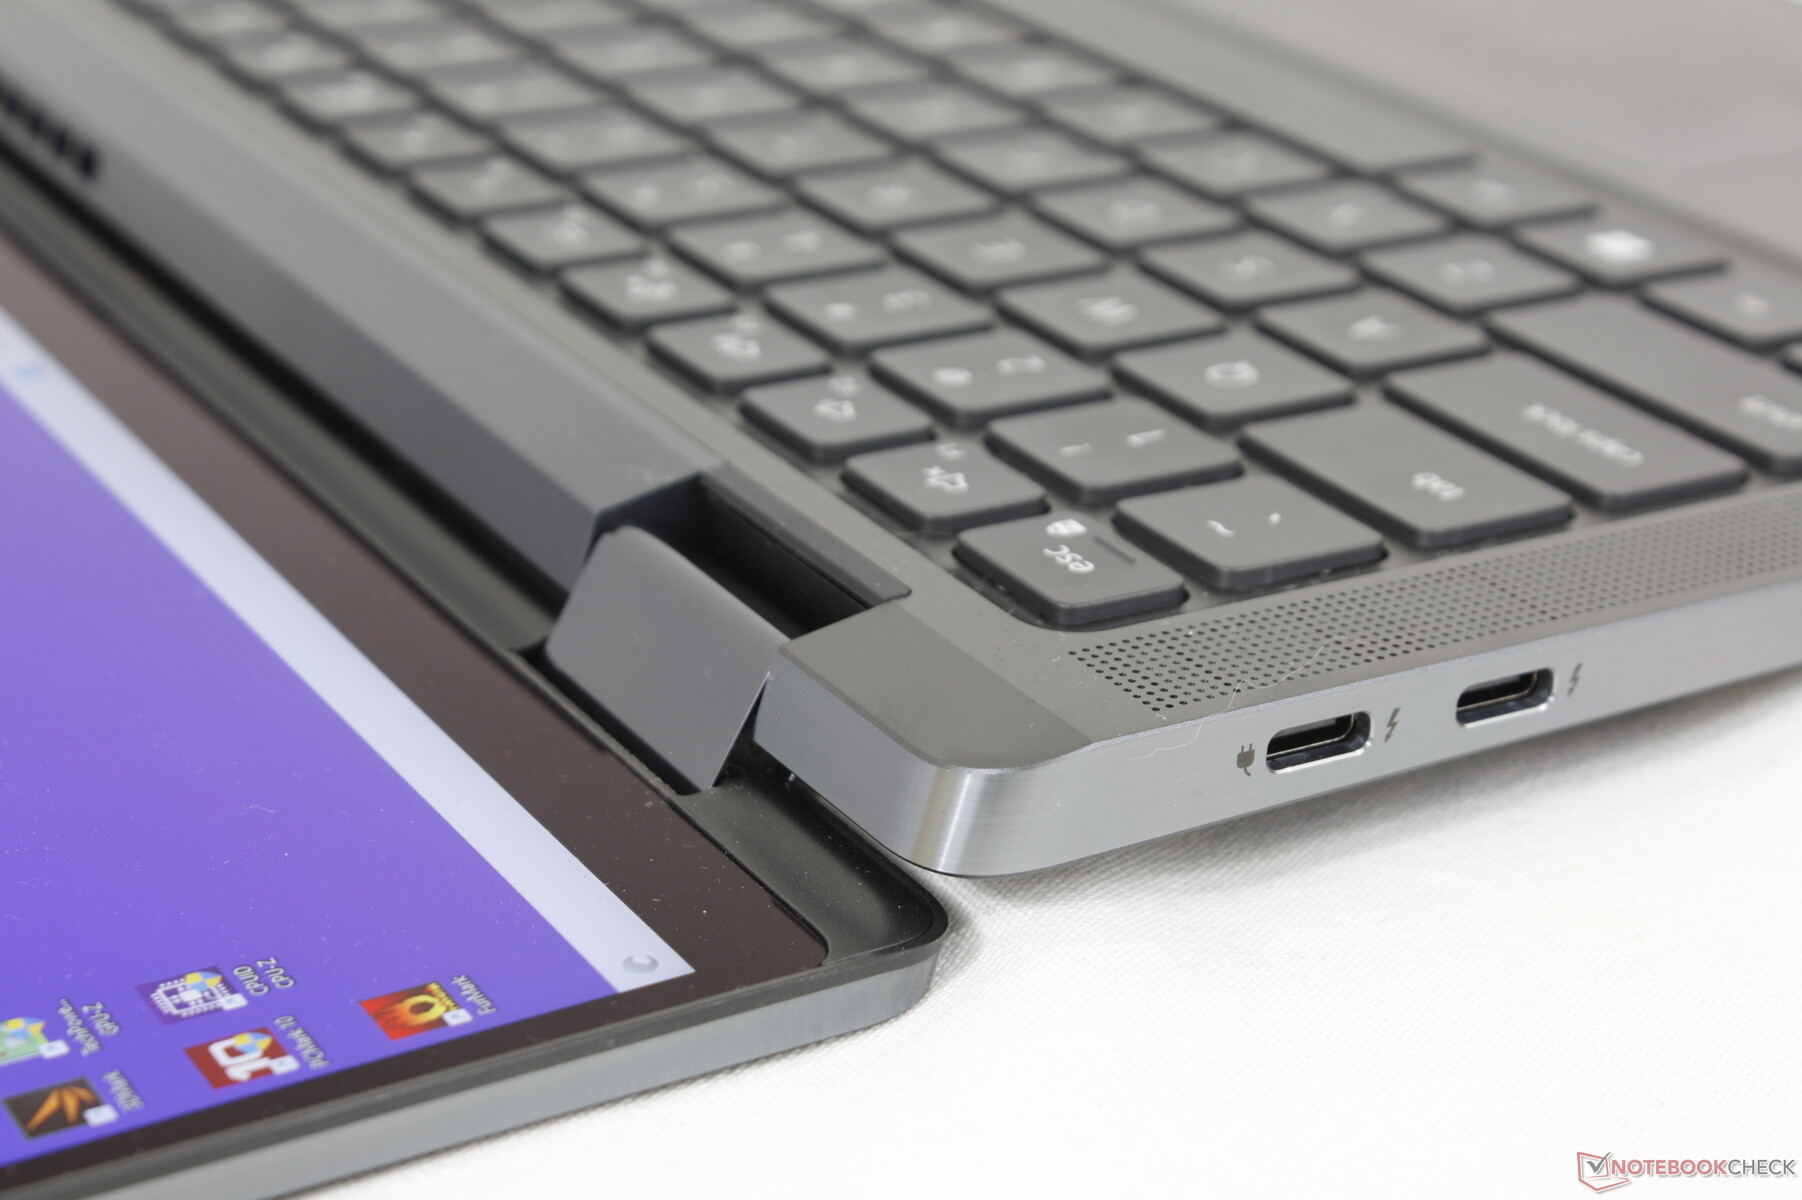
Wees bereid om USB-C-adapters overal mee naartoe te nemen, want het model heeft geen USB-A- of HDMI-poorten. Als dergelijke poorten nodig zijn, kunt u in plaats daarvan de Dragonfly Max of zelfs de Summit E13 Flip overwegen.
Houd er rekening mee dat alleen de linker twee USB-C-poorten Thunderbolt 4-apparaten ondersteunen. Elk van de drie USB-C poorten kan anders worden gebruikt voor externe monitors en oplaaddoeleinden.
Het is een beetje teleurstellend dat het model geen SD-kaartlezer integreert, aangezien de goedkopereLatitude 5310 2-in-1 er een bevat.
Communicatie
Een Intel AX211 wordt standaard geleverd voor Wi-Fi 6E en Bluetooth 5.2 connectiviteit. Overdrachtssnelheden zijn iets sneller op 6 GHz in vergelijking met 5 GHz, maar het verschil is niet zo groot als velen zouden verwachten
De Snapdragon X20 LTE-A of Intel 5000 5G zijn optioneel voor uSIM WWAN-connectiviteit. Helaas kunt u geen niet-WAN SKU kopen om later een WAN-module toe te voegen, omdat de antenne niet is inbegrepen in de niet-WAN-configuraties.
| Networking | |
| iperf3 transmit AX12 | |
| Dell Latitude 5310-23VP6 | |
| HP Elite Dragonfly Max | |
| HP EliteBook x360 1030 G7 | |
| MSI Summit E13 Flip Evo A11MT | |
| iperf3 receive AX12 | |
| HP EliteBook x360 1030 G7 | |
| HP Elite Dragonfly Max | |
| MSI Summit E13 Flip Evo A11MT | |
| Dell Latitude 5310-23VP6 | |
| iperf3 receive AXE11000 6GHz | |
| Dell Latitude 9330 | |
| iperf3 receive AXE11000 | |
| Dell Latitude 9330 | |
| iperf3 transmit AXE11000 | |
| Dell Latitude 9330 | |
| iperf3 transmit AXE11000 6GHz | |
| Dell Latitude 9330 | |
Webcam
De 2 MP webcam met IR komt standaard voor Windows Hello ondersteuning. Ter vergelijking, HP Elite en Spectre laptops worden geleverd met 5 MP sensoren voor scherpere beeldkwaliteit. Alle Dell Latitude en Lenovo ThinkPad laptop webcams blijven tot nu toe beperkt tot slechts 2 MP.


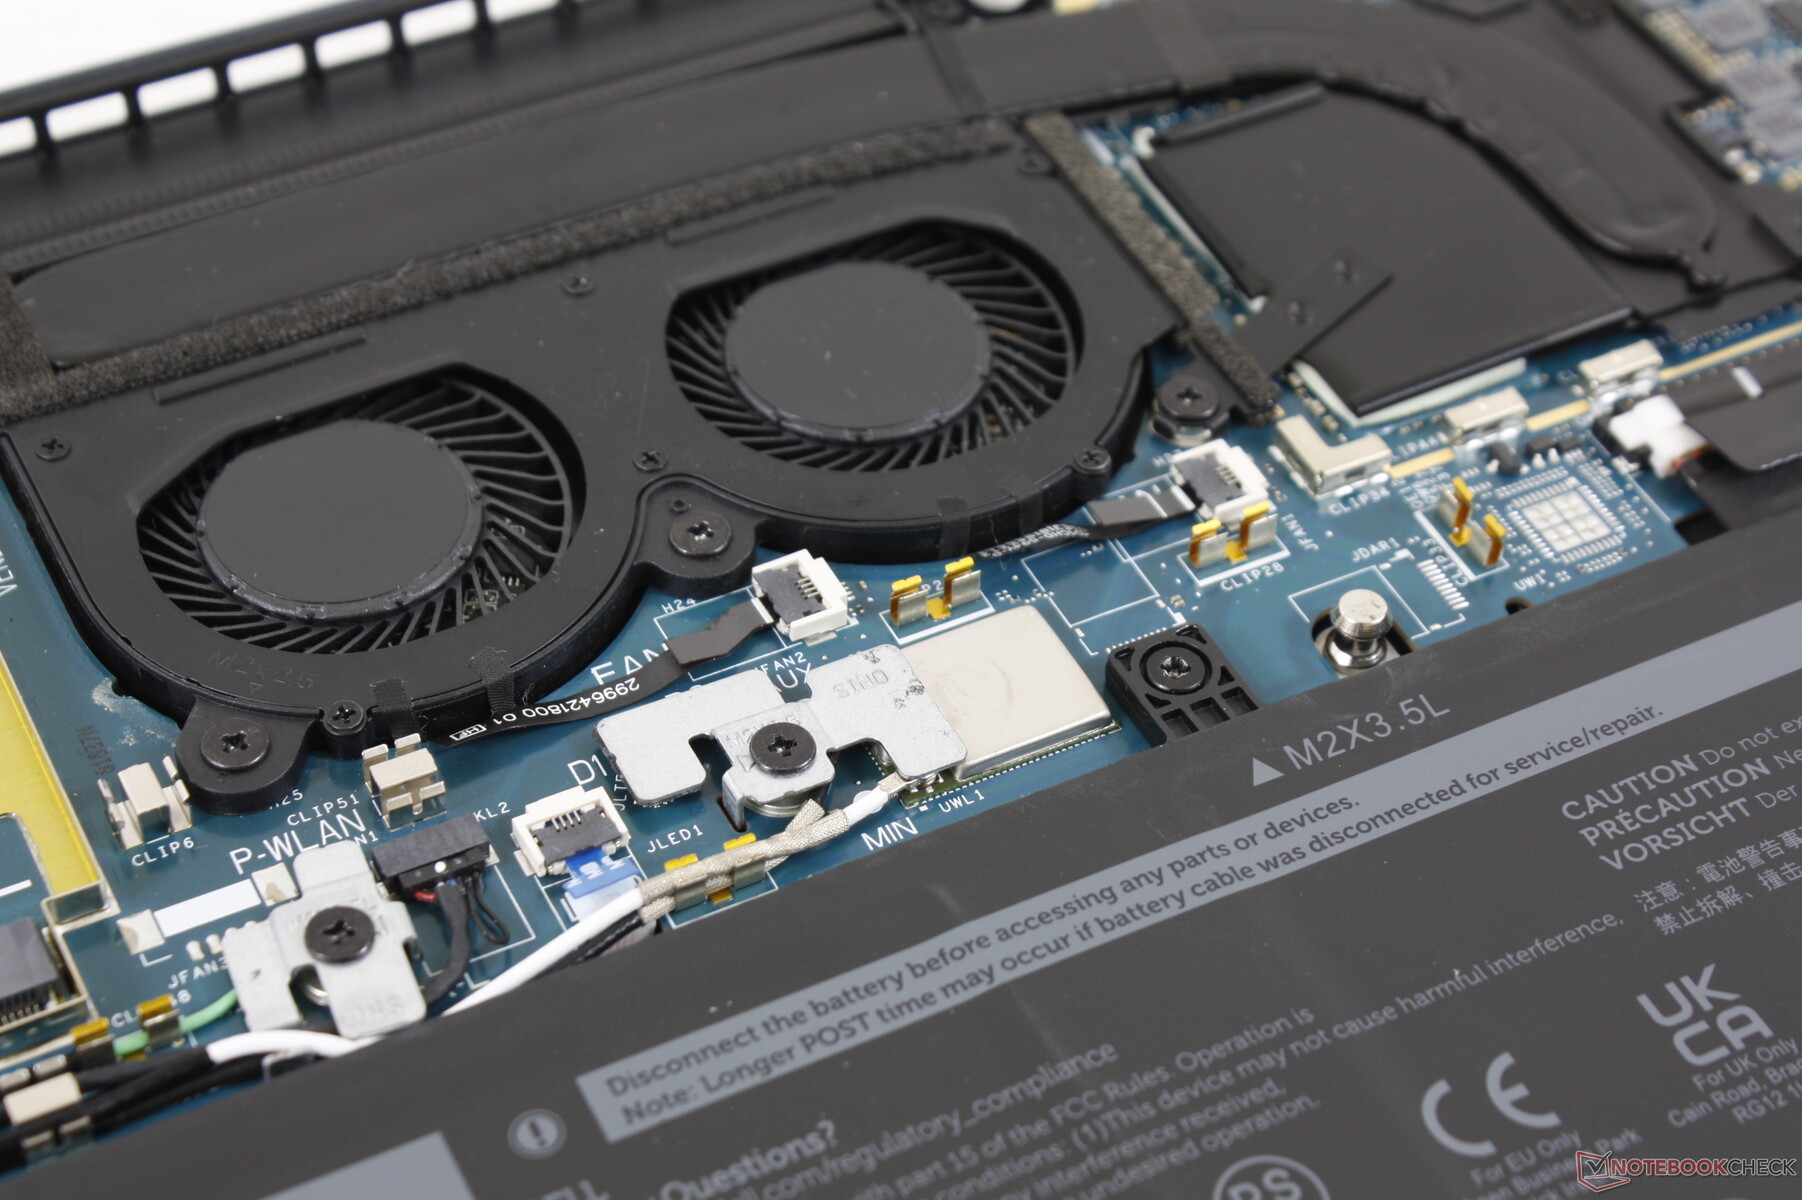
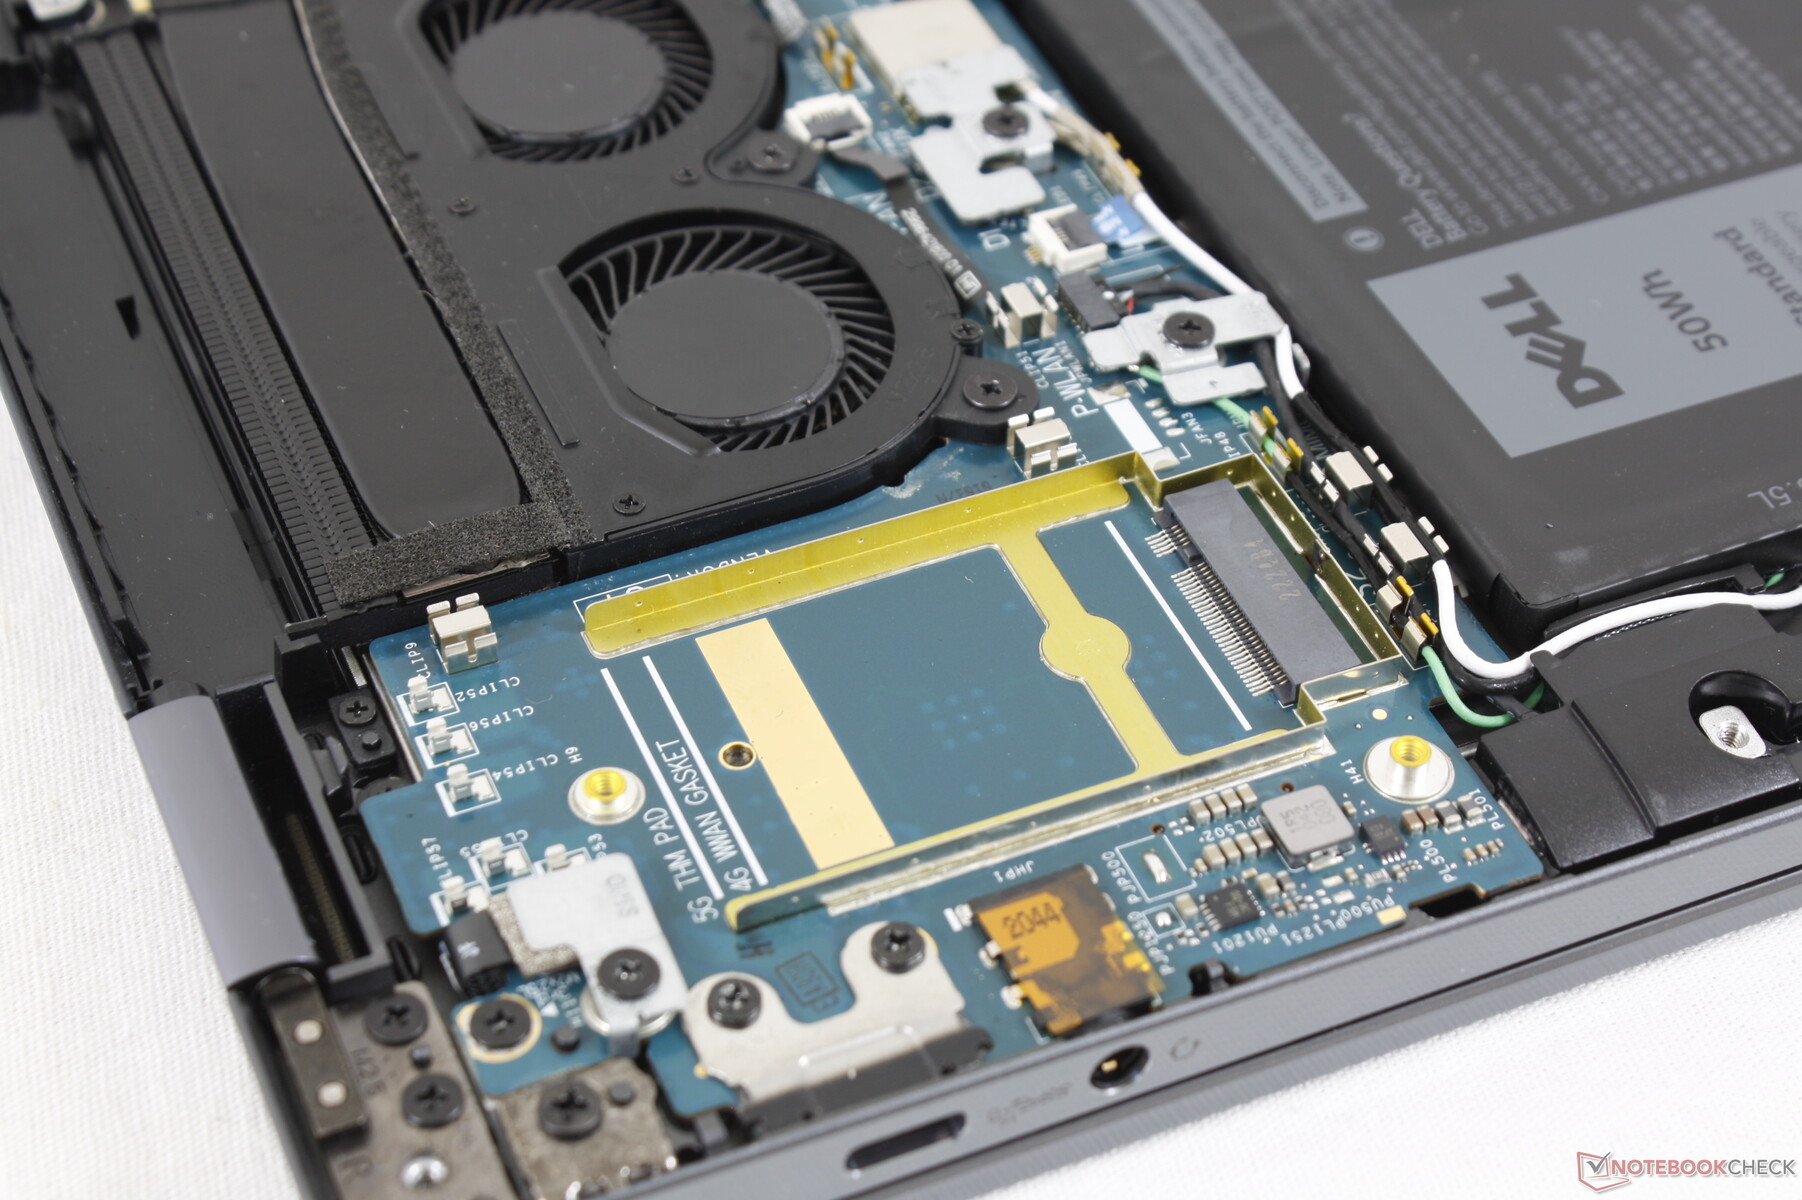
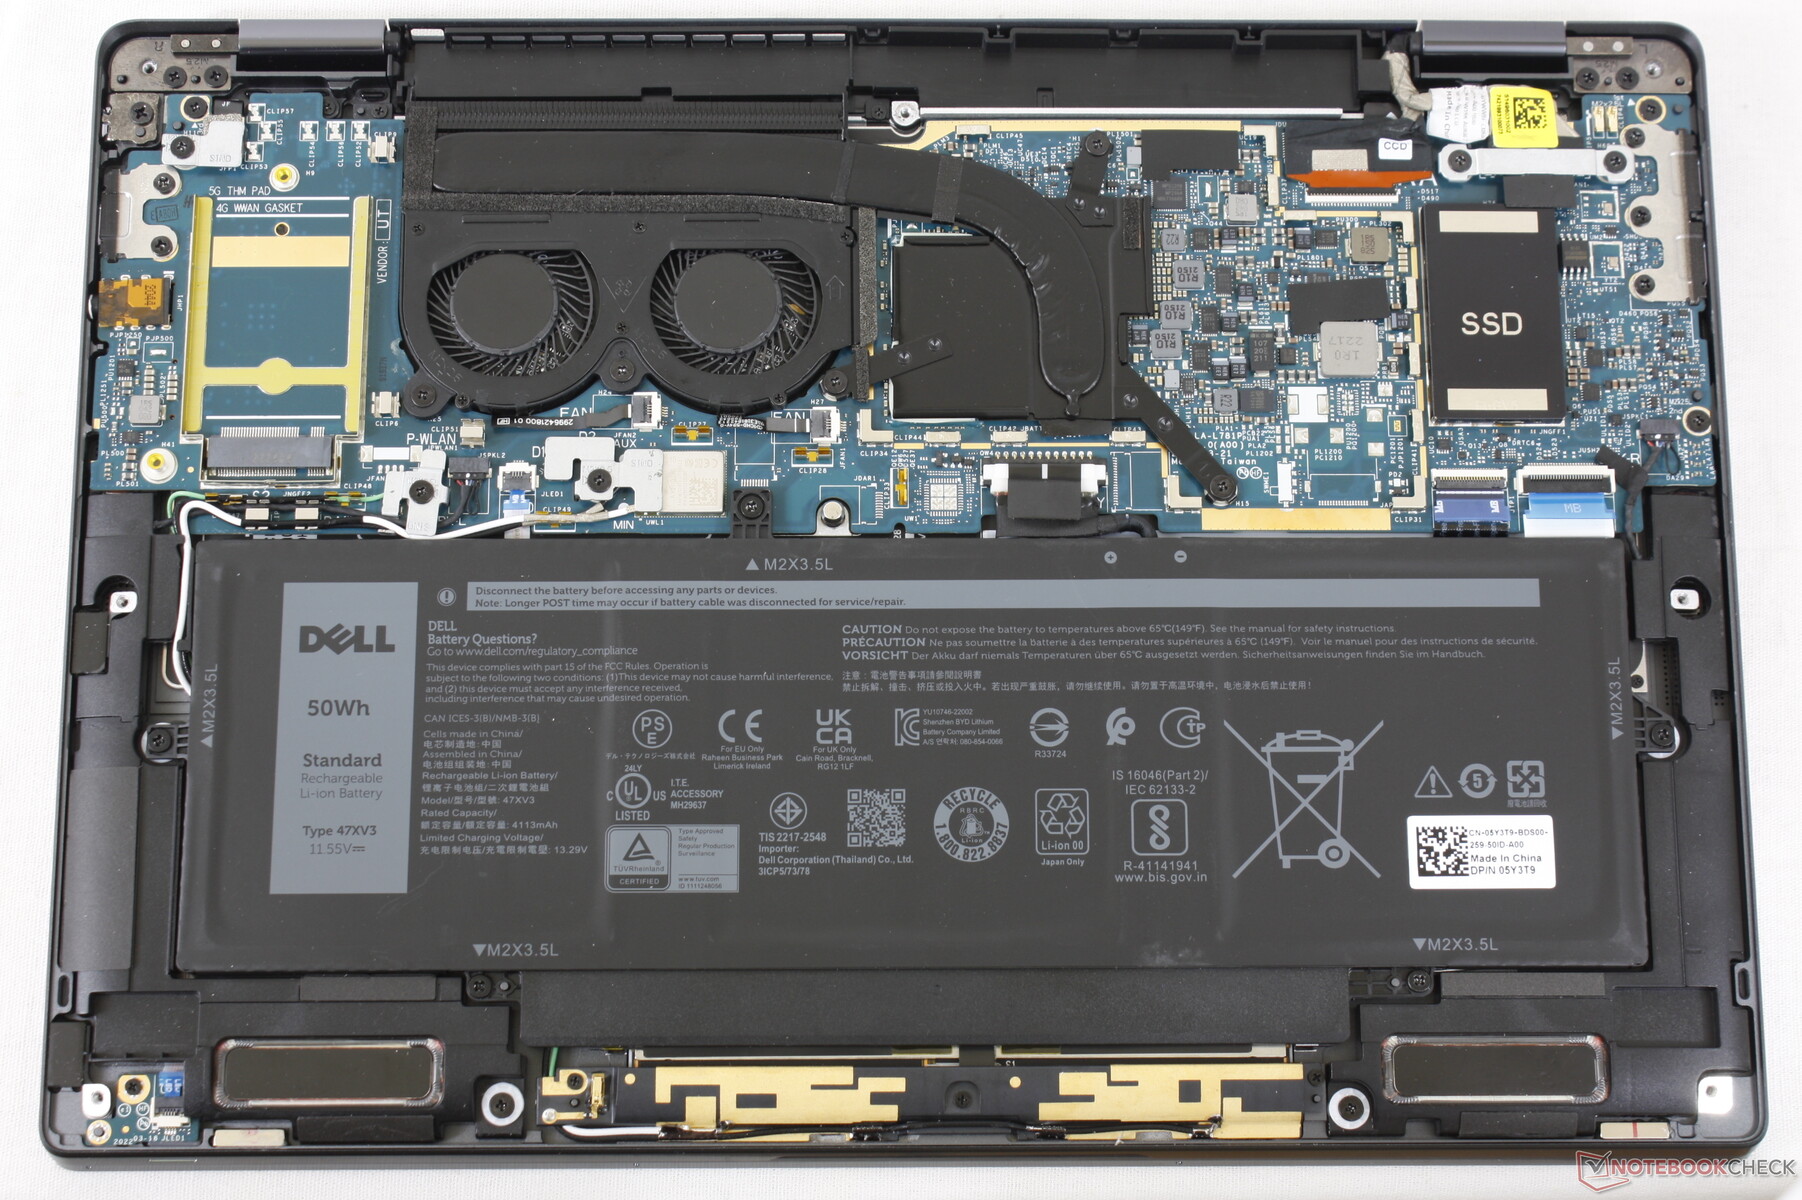
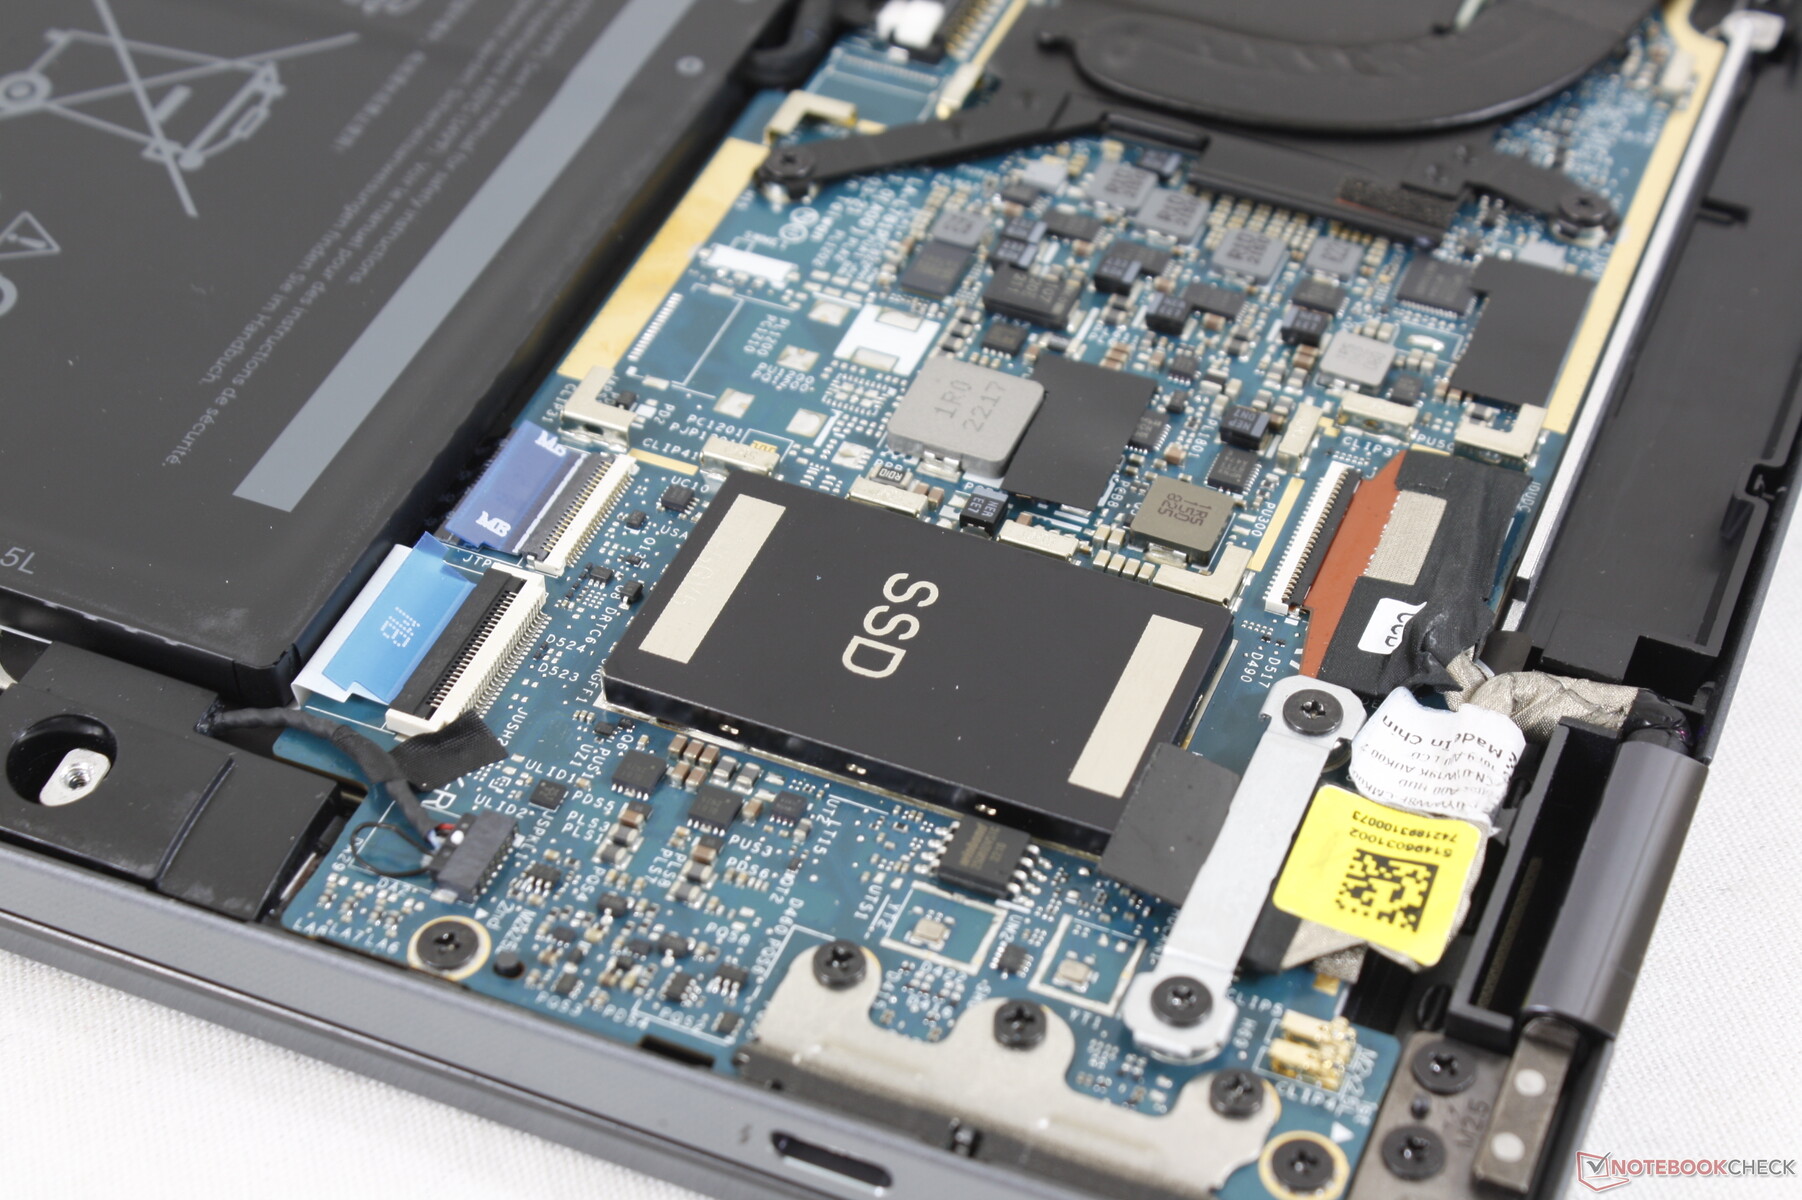
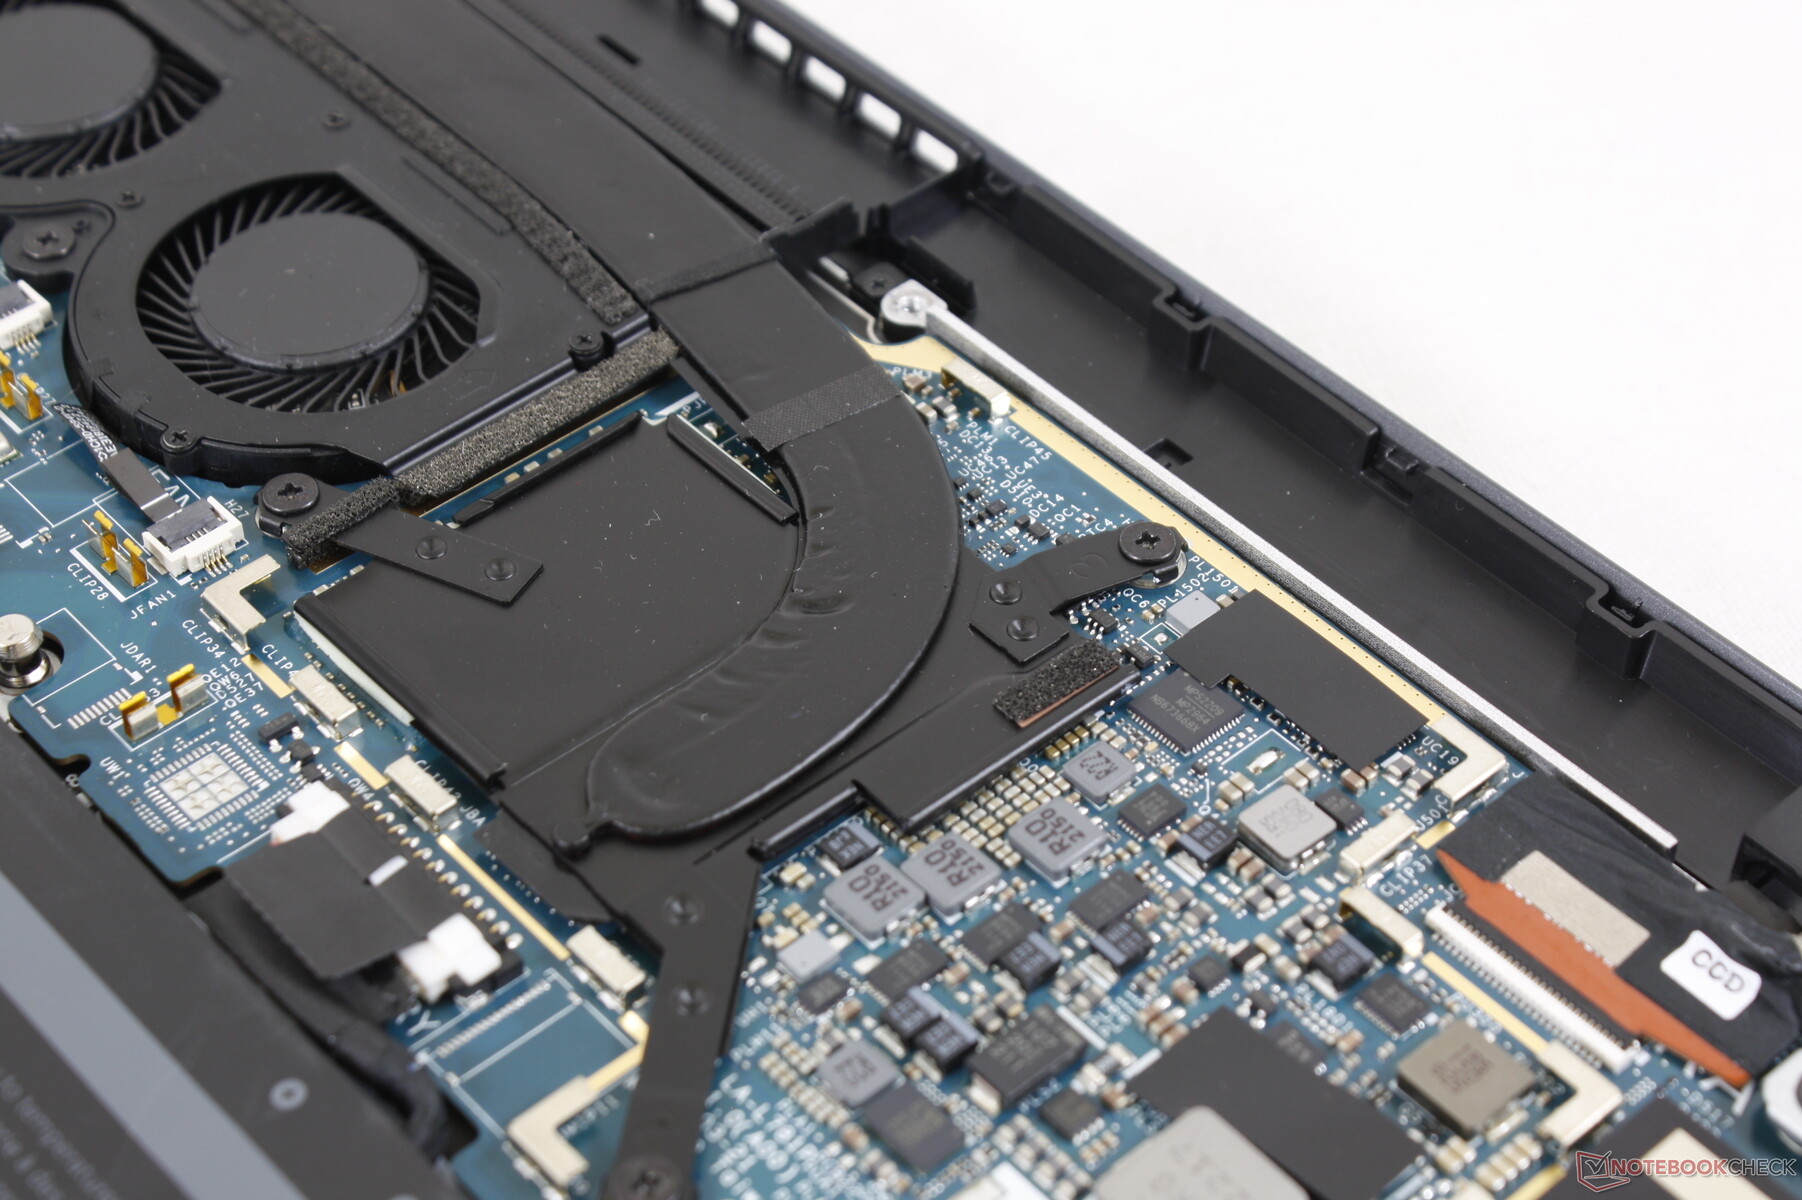
Onderhoud
Het onderpaneel wordt vastgezet met slechts 6 Philips-schroeven voor eenvoudig onderhoud. Gebruikers kunnen de batterij, WAN, en SSD modules verwijderen terwijl de WLAN en RAM modules worden gesoldeerd. Niet-upgradebaar WLAN en RAM zijn gebruikelijk op 13-inch subnotebooks.
Accessoires en garantie
De doos bevat een USB-C naar USB-A adapter om te voorkomen dat de Latitude 9330 geen USB-A poorten heeft. Een beperkte fabrieksgarantie van drie jaar is standaard, wat gebruikelijk is voor high-end zakelijke pc's van Dell of HP.
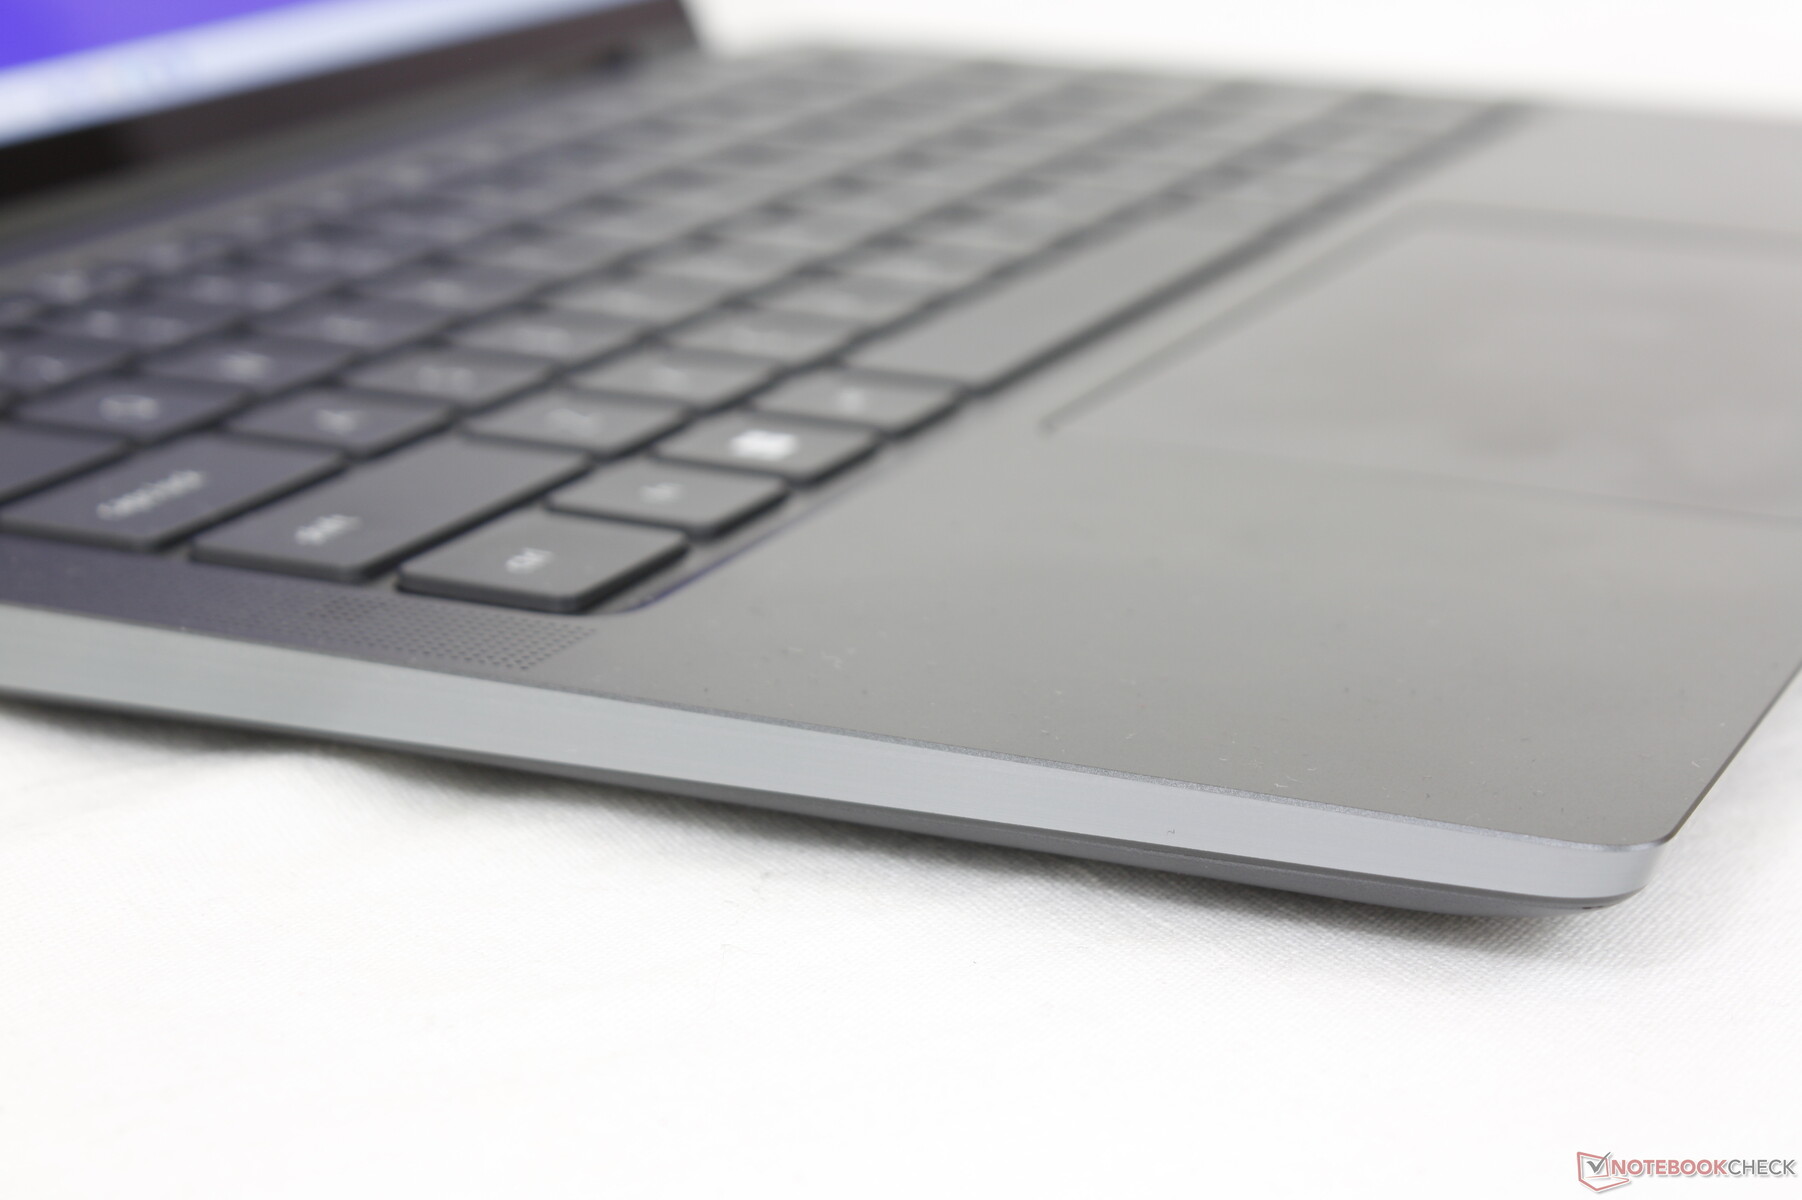
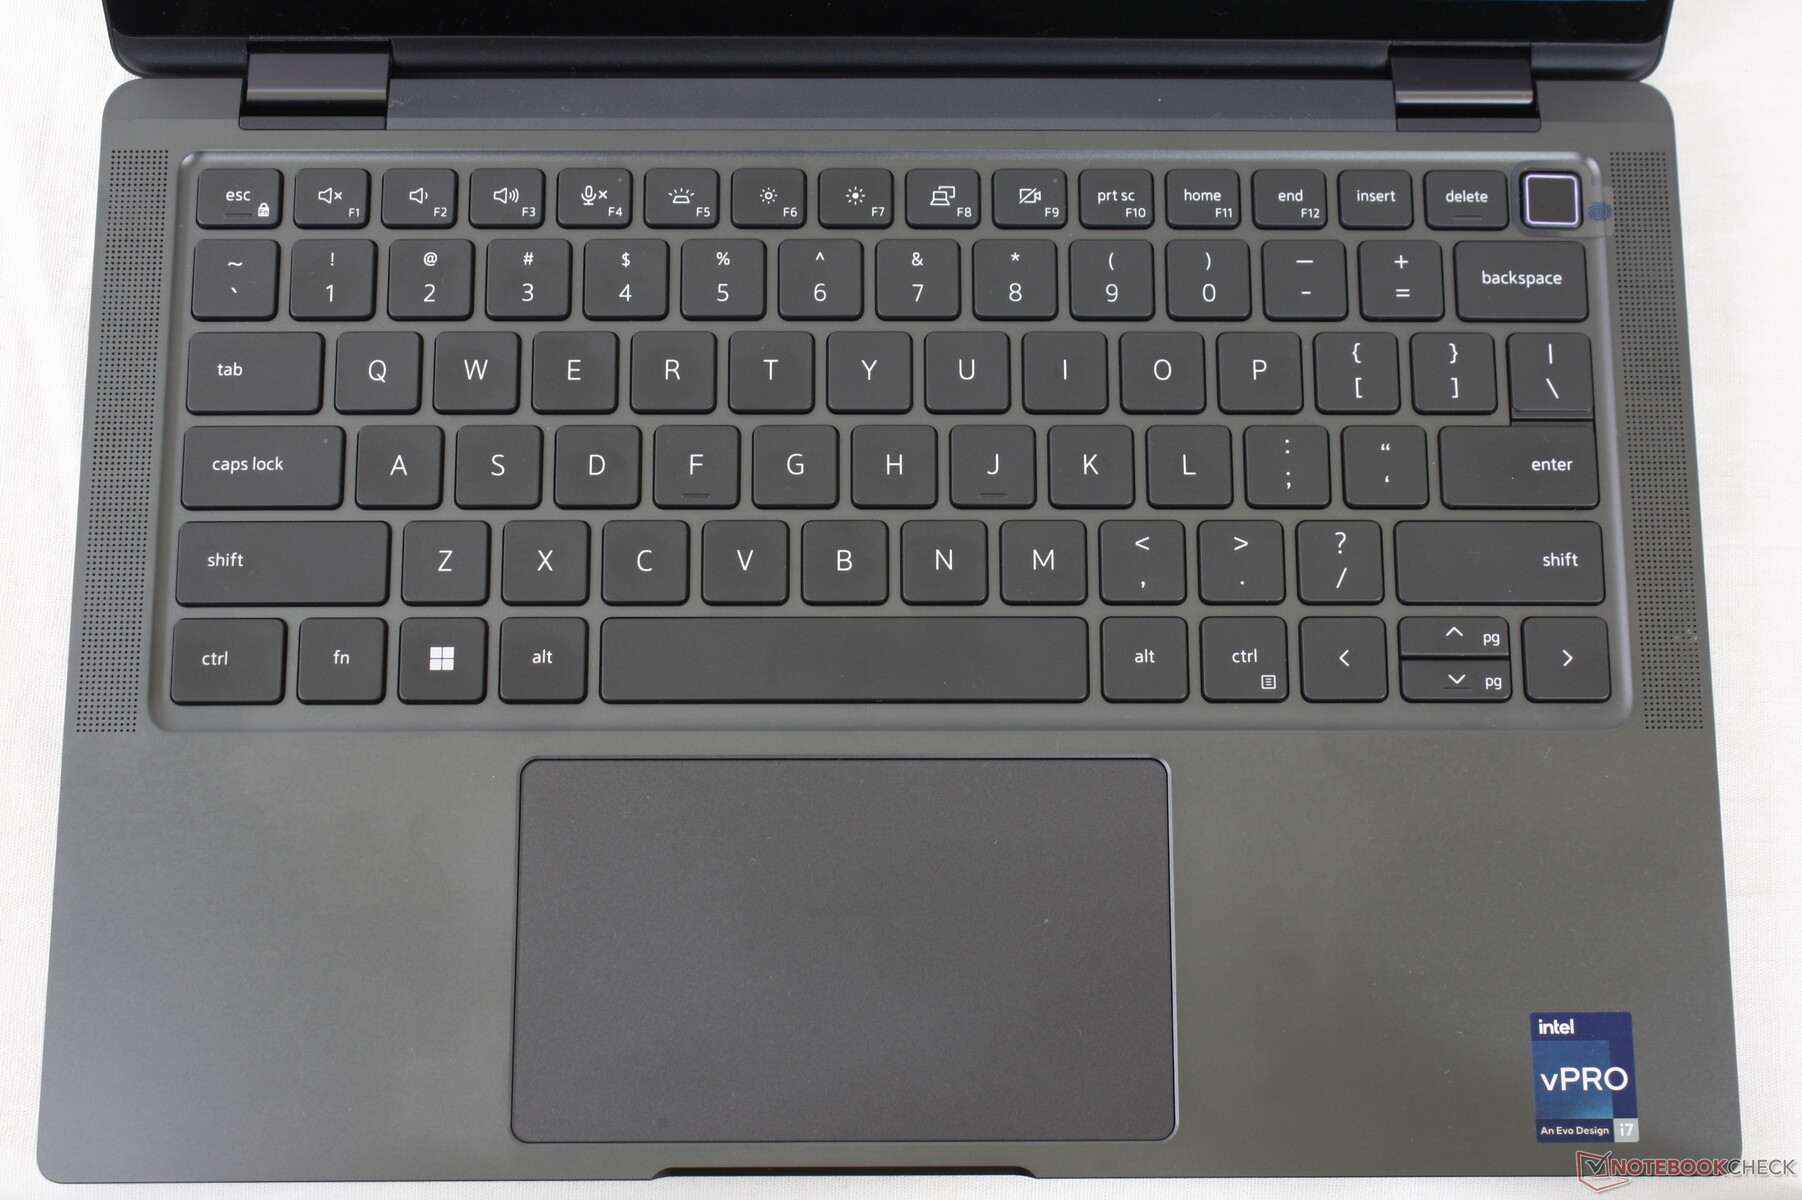
Invoerapparaten - Comfortabel toetsenbord en een sponsachtig clickpad
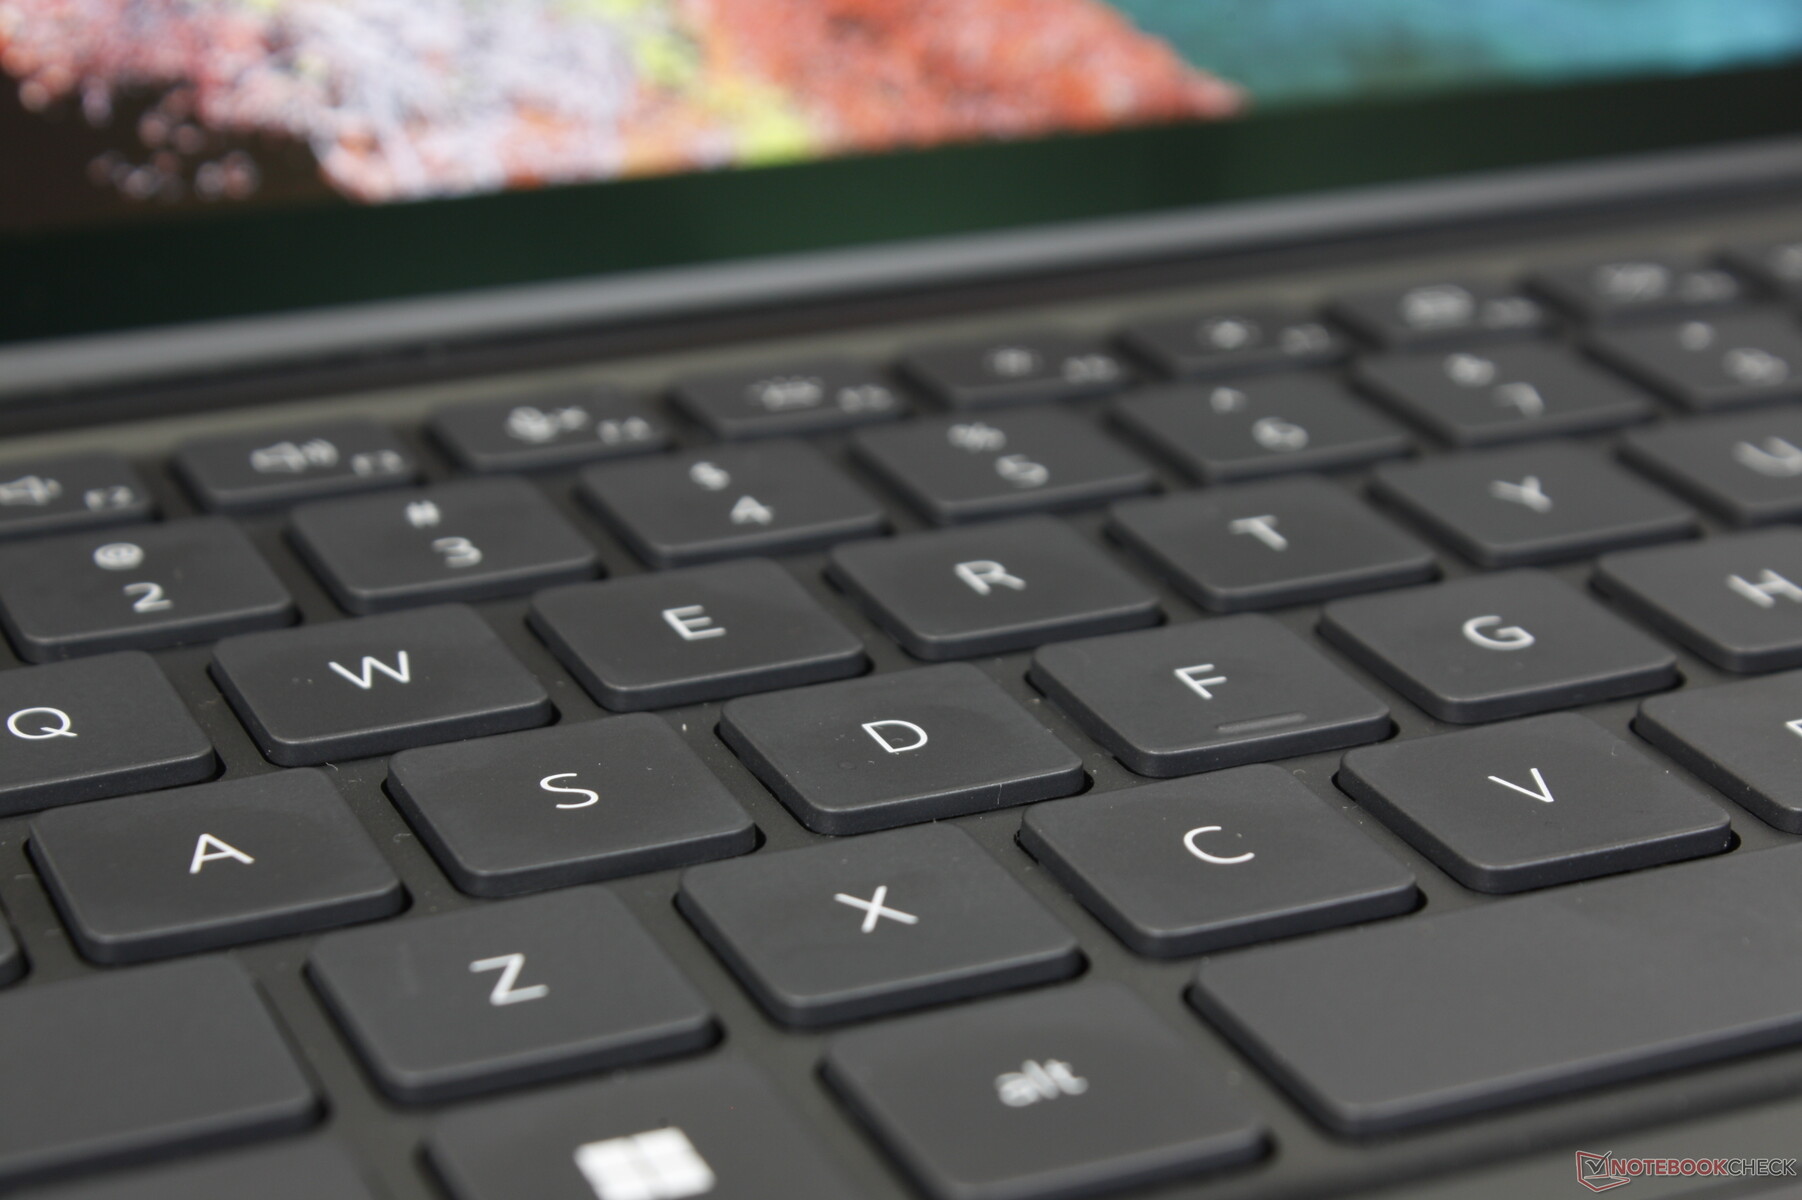
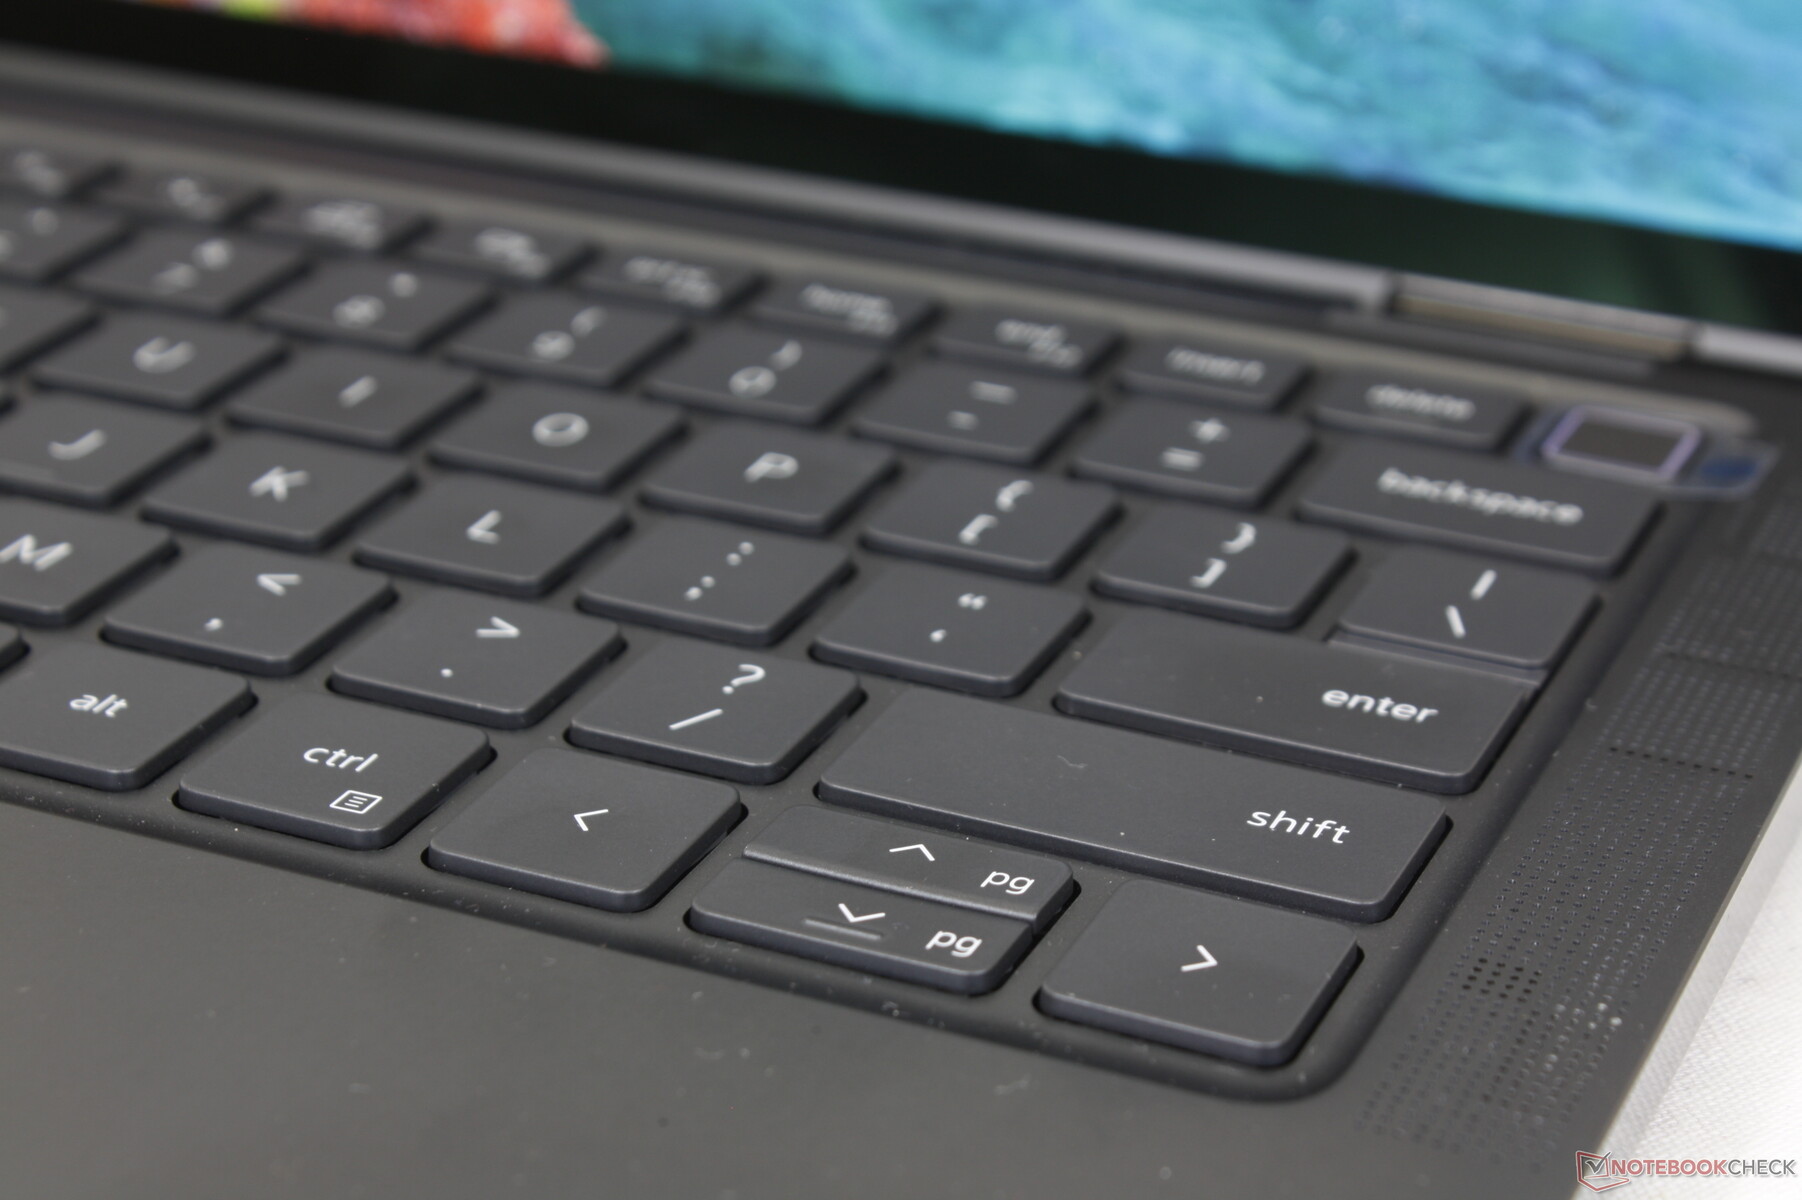
Toetsenbord
De toetsen op de Latitude 9330 zijn steviger en met sterkere feedback dan de toetsen op de XPS 13 9315 serie voor een comfortabelere type-ervaring. Ze zijn meer vergelijkbaar met de toetsen op de Spectre of EliteBook serie in tegenstelling tot de toetsen op goedkopere consumenten subnotebooks. Het gekletter is echter matig luid, wat een gevolg is van de scherpere feedback.
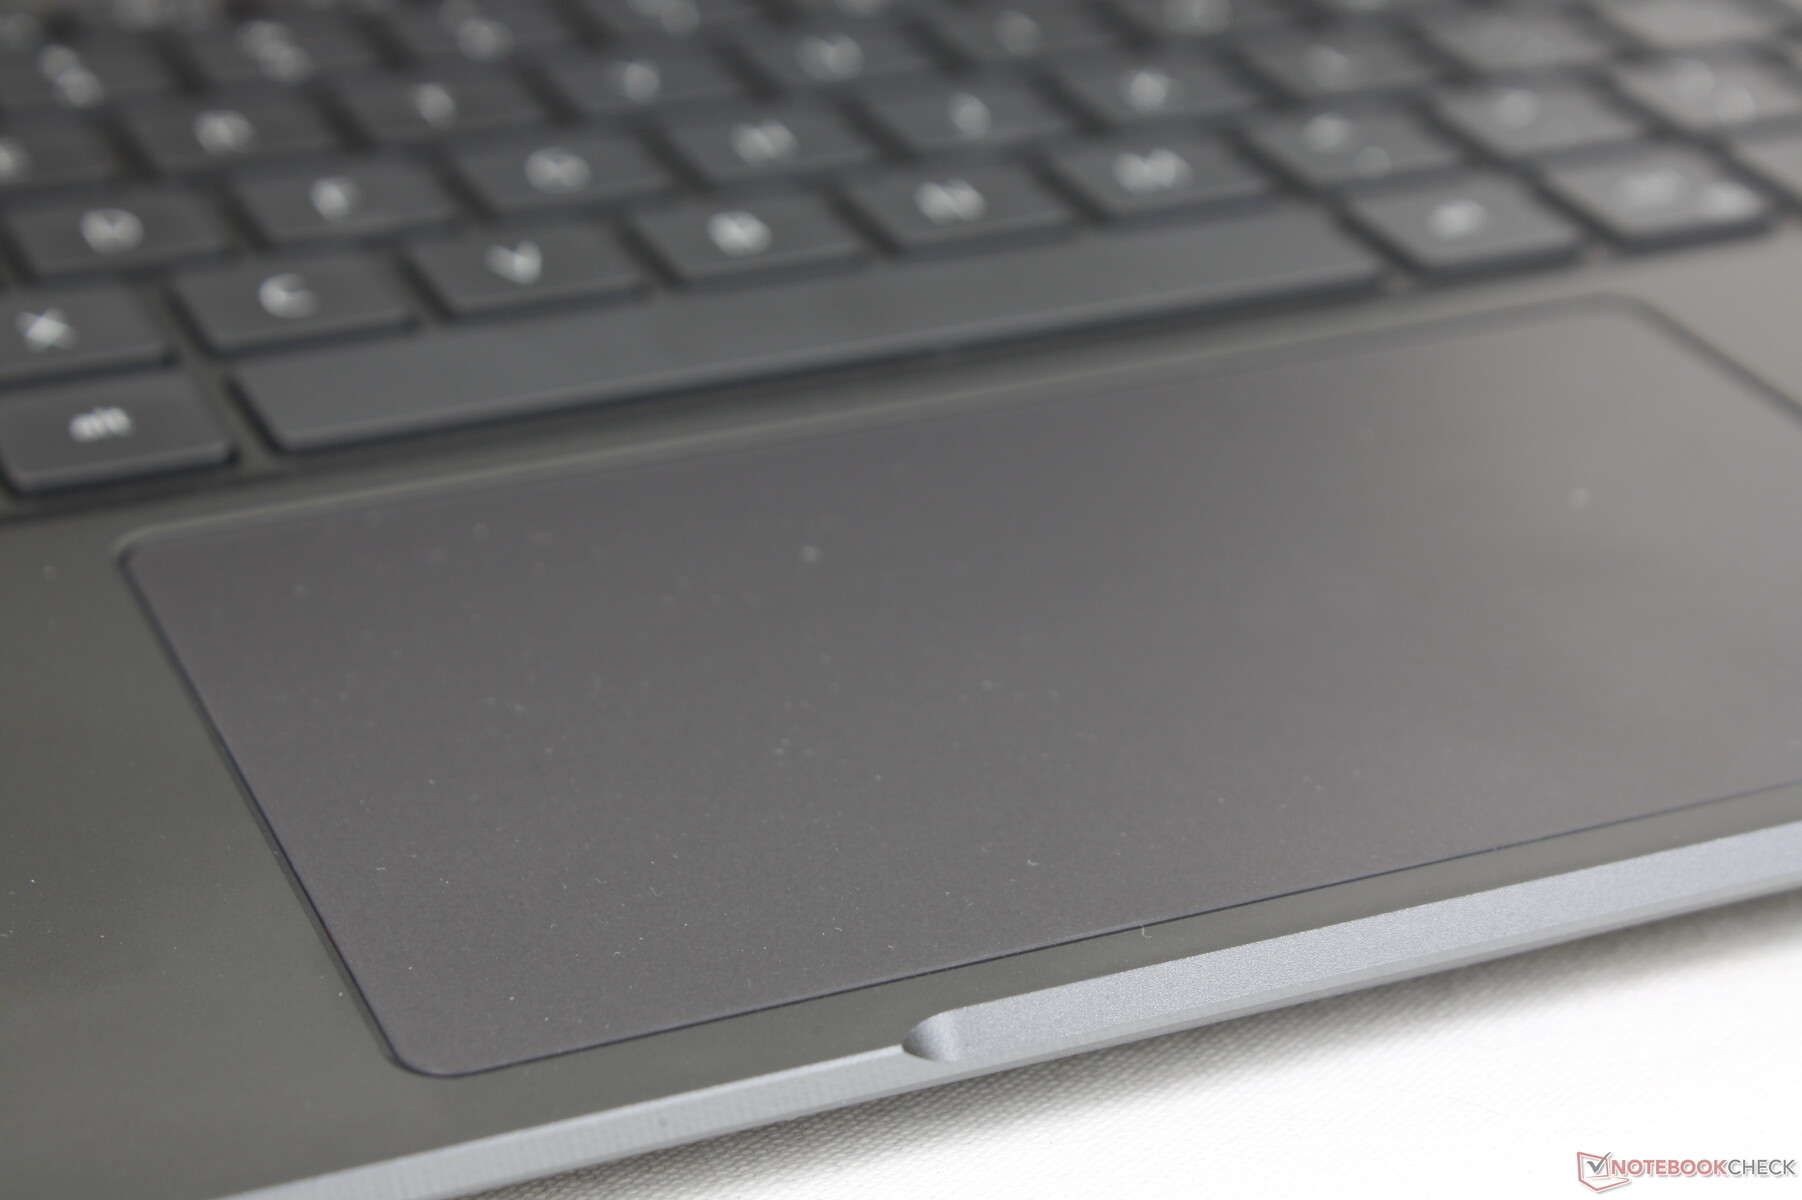
Touchpad
Het clickpad is groter dan dat van de ThinkPad X1 Titanium Yoga (11,5 x 6,8 cm vs. 9 x 6,5 cm) om multi-touch invoer te vergemakkelijken ondanks de kleine 13-inch vormfactor. Aan de andere kant zijn er geen speciale muisknoppen en dus zijn drag-and-drop acties moeilijker uit te voeren. Het oppervlak is volledig glad met slechts een beetje kleven bij lagere snelheden voor nauwkeuriger klikken.
De feedback bij het klikken op het clickpad is zachter en stiller dan op de meeste andere laptops. Hoewel sommigen de afwezigheid van een luide "klik" bij het indrukken zullen waarderen, is de sponsachtige feedback niet erg bevredigend.
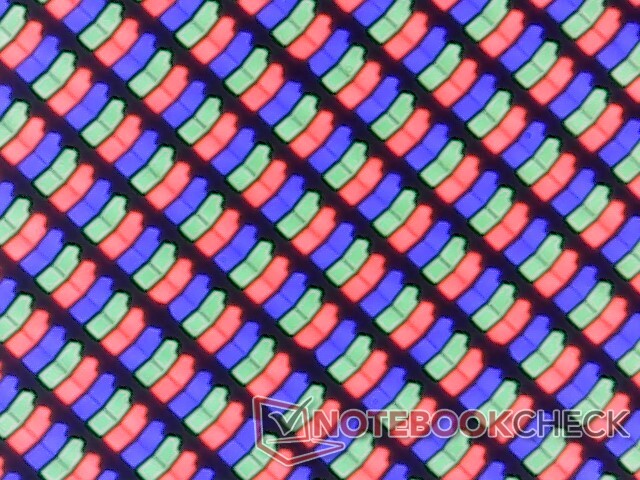
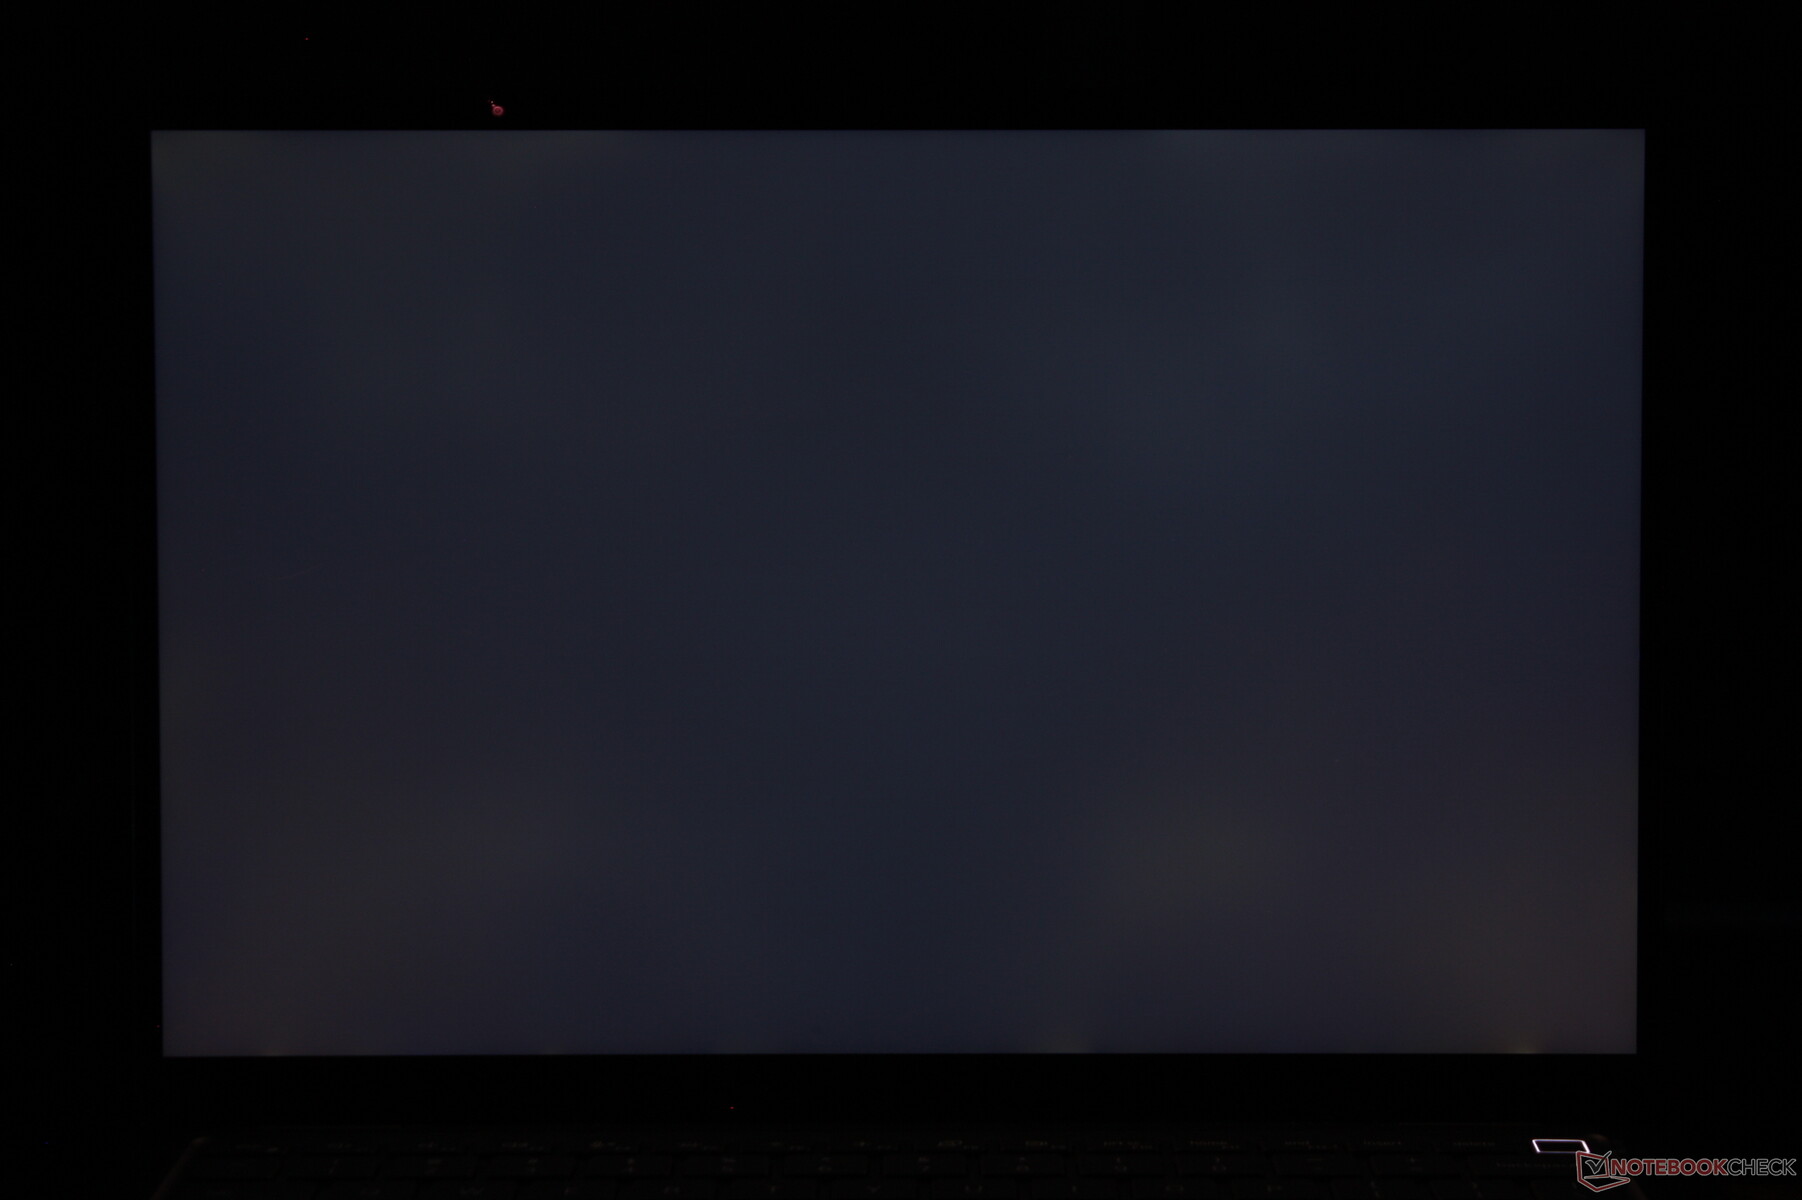
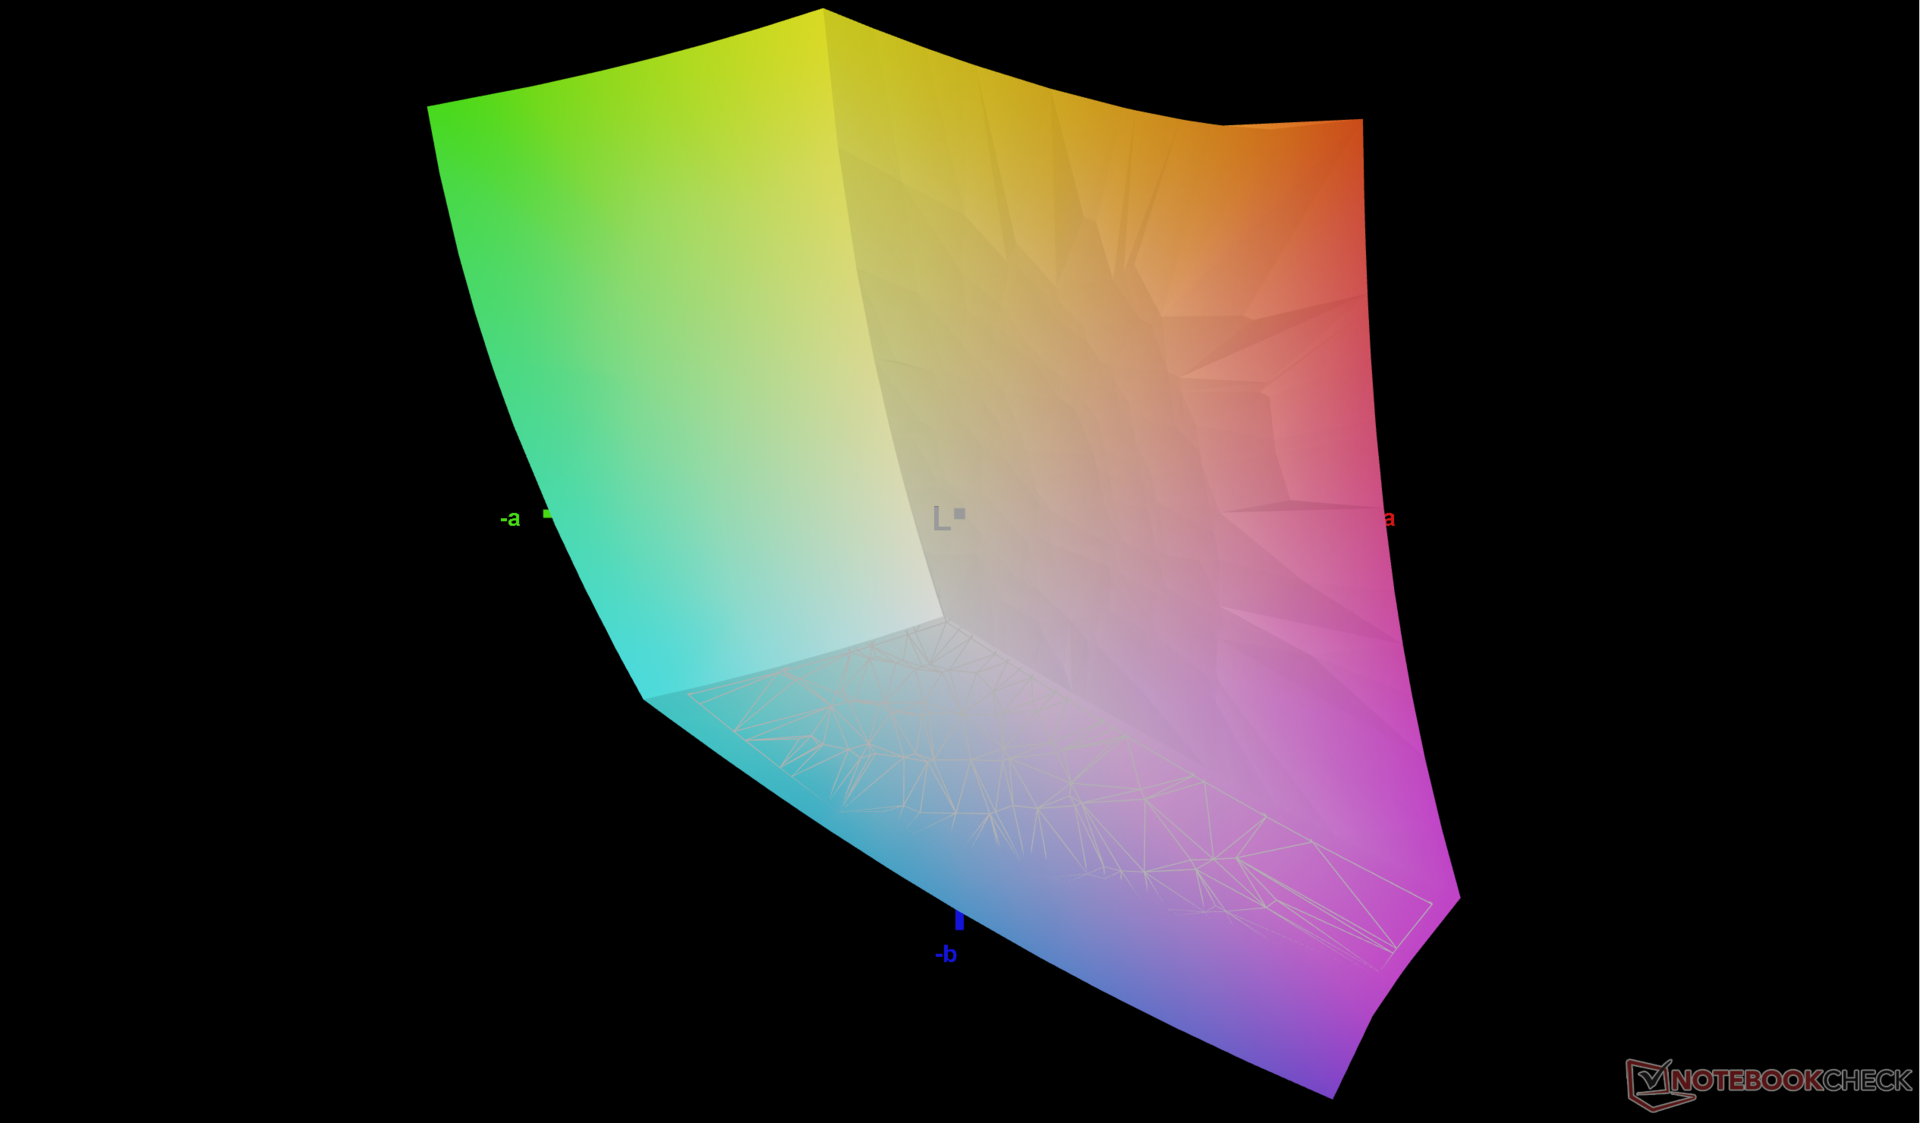
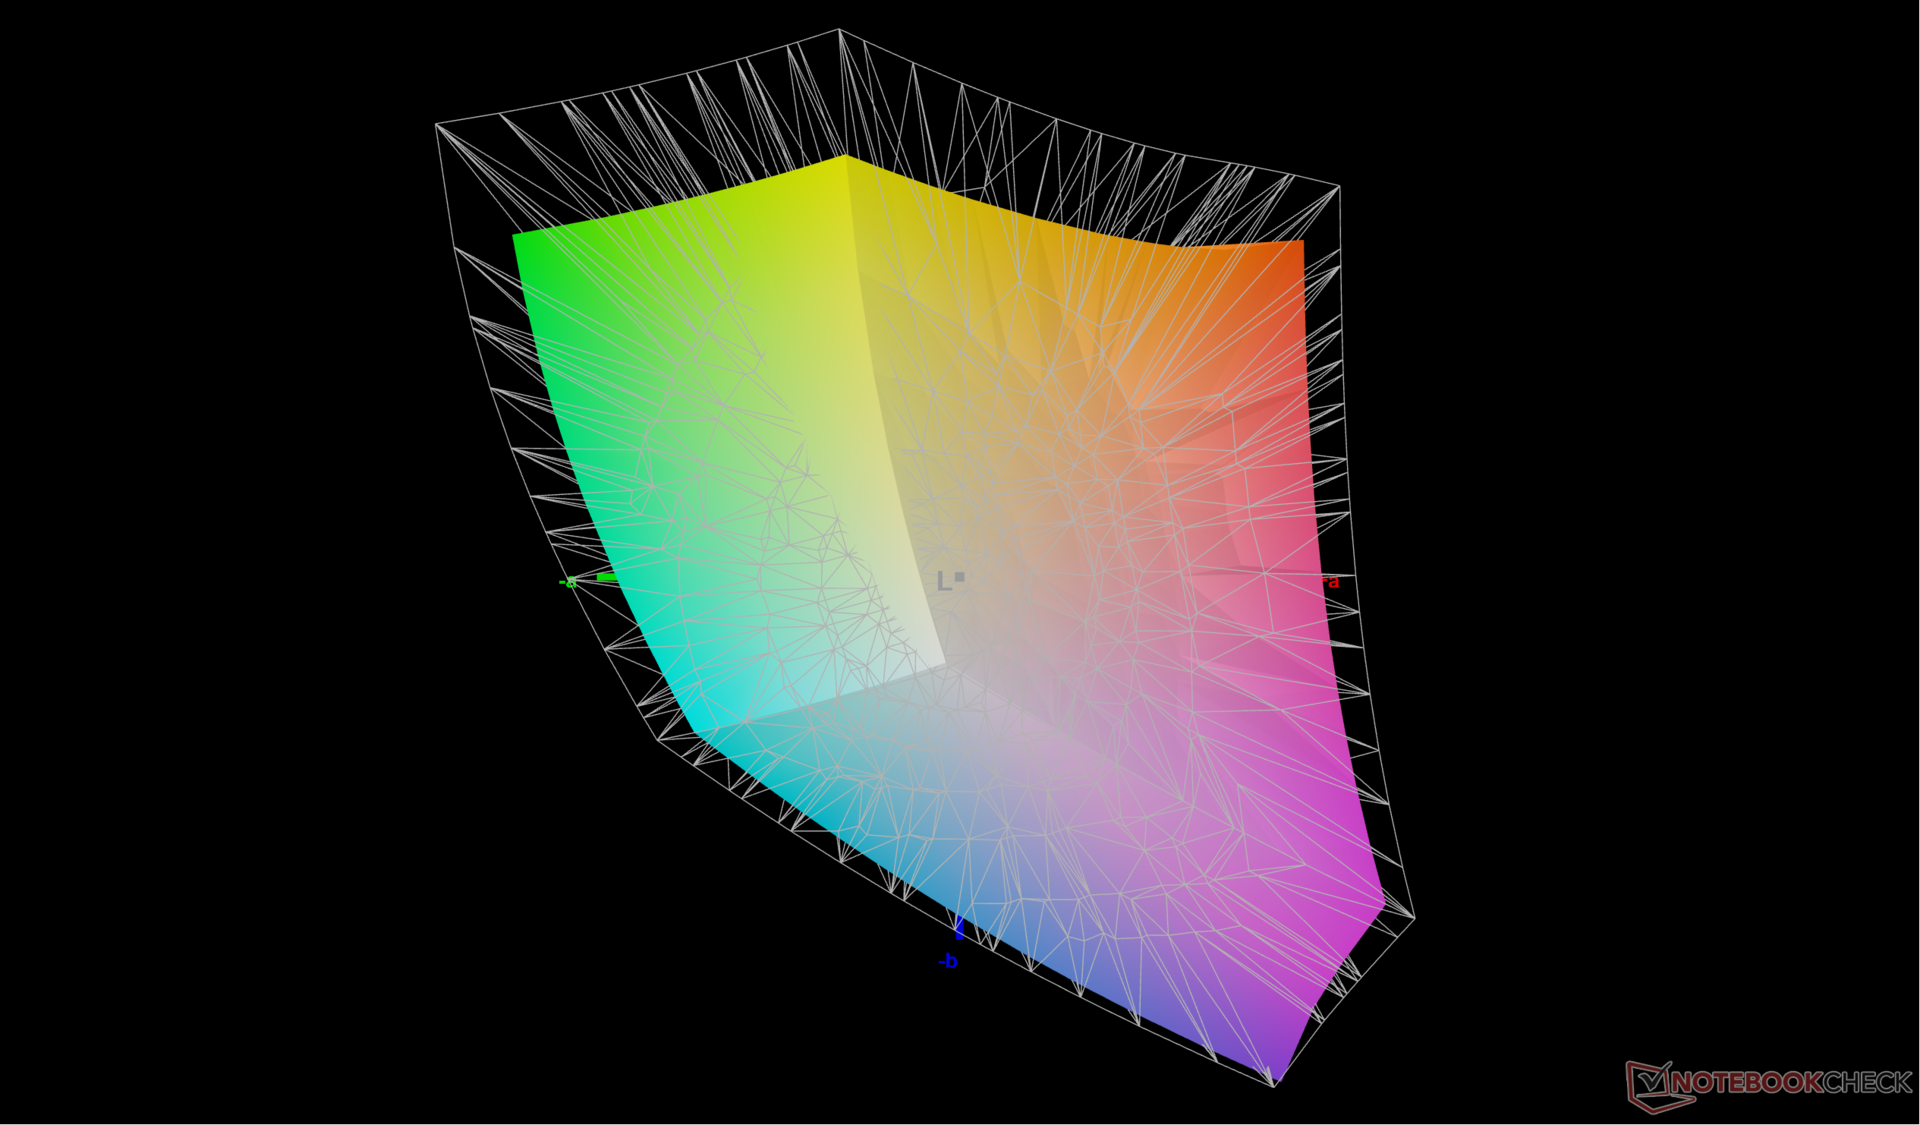
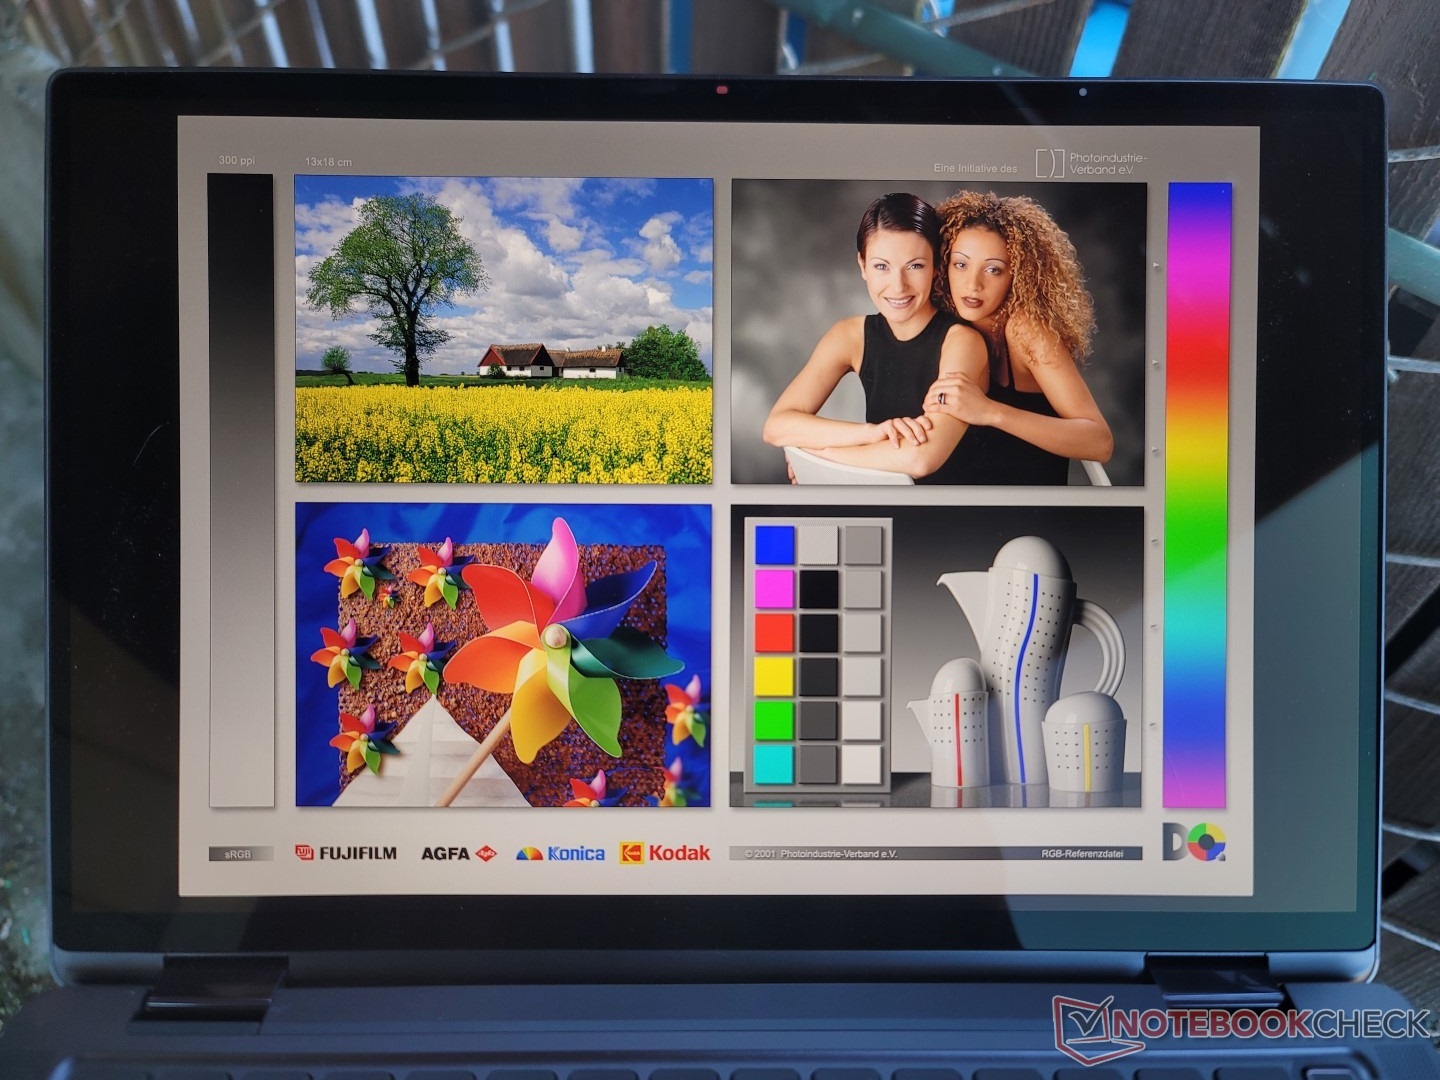
Beeldscherm - 100% sRGB, 500-nit IPS-aanraakscherm
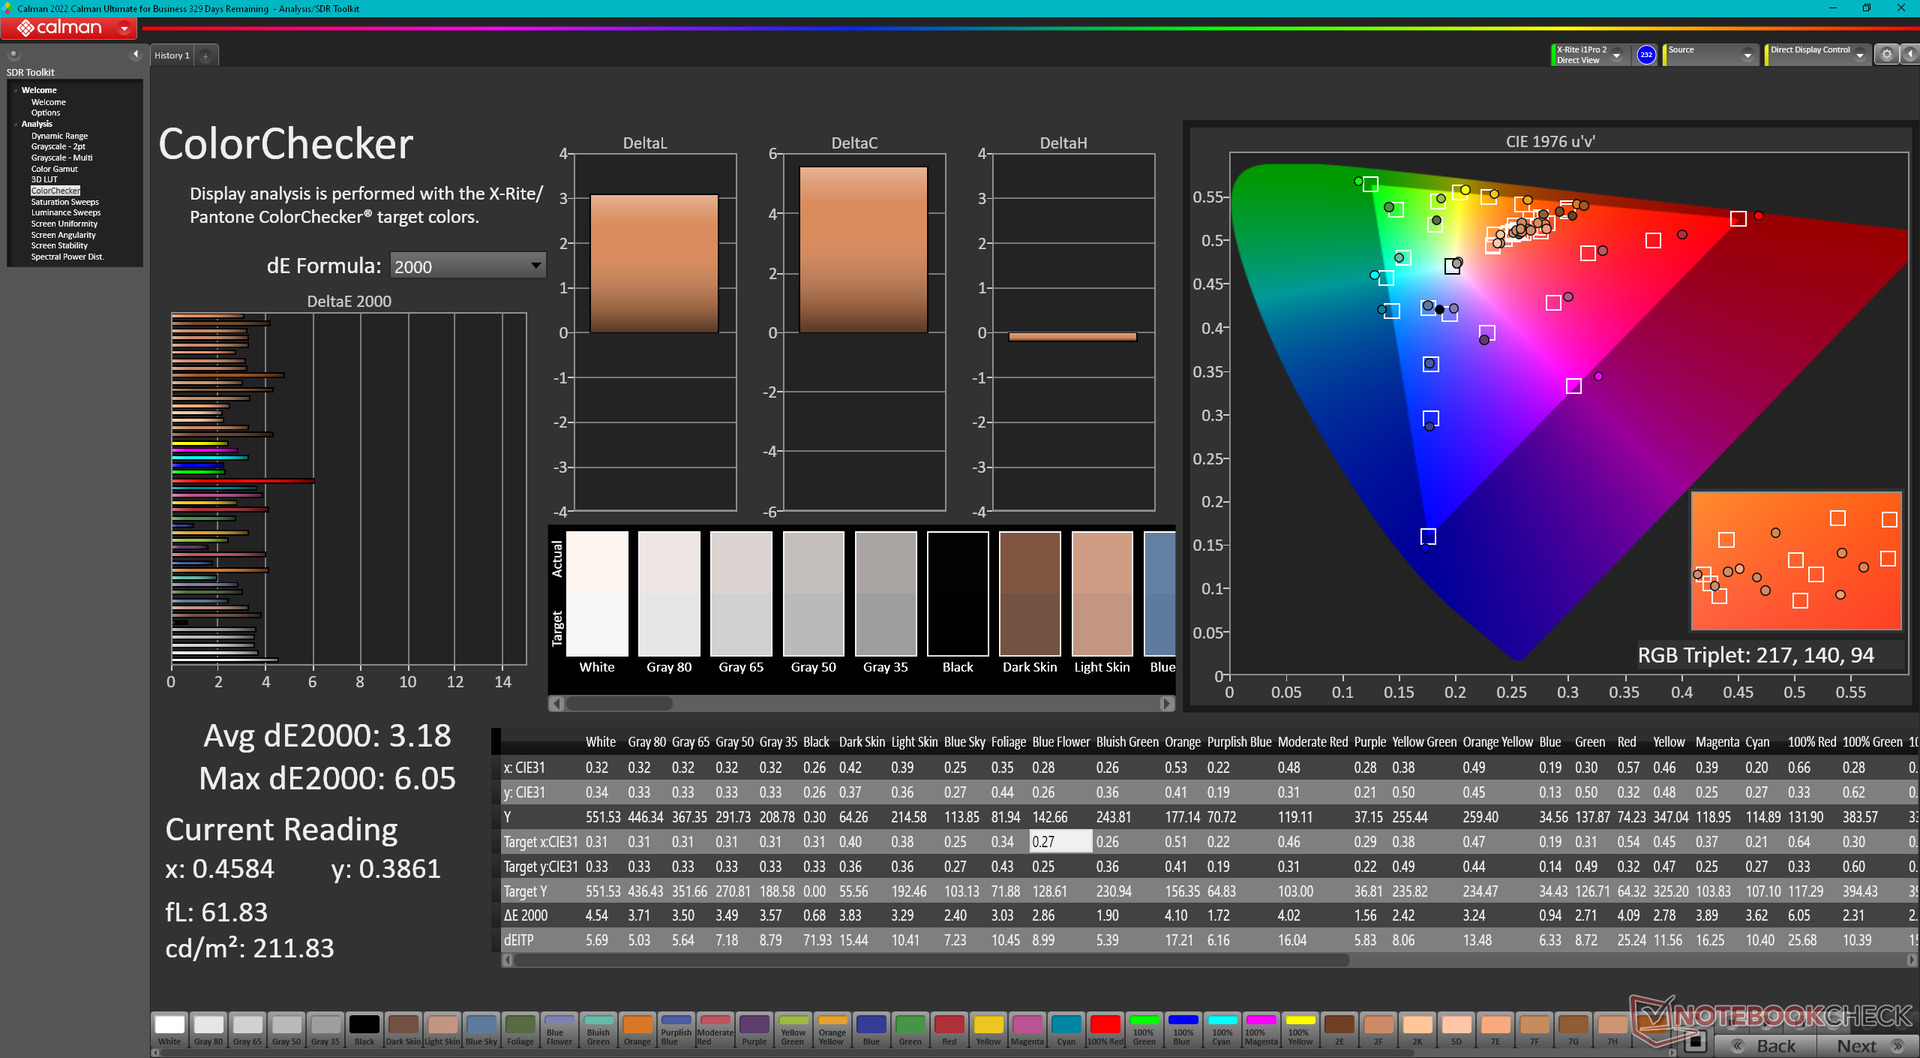
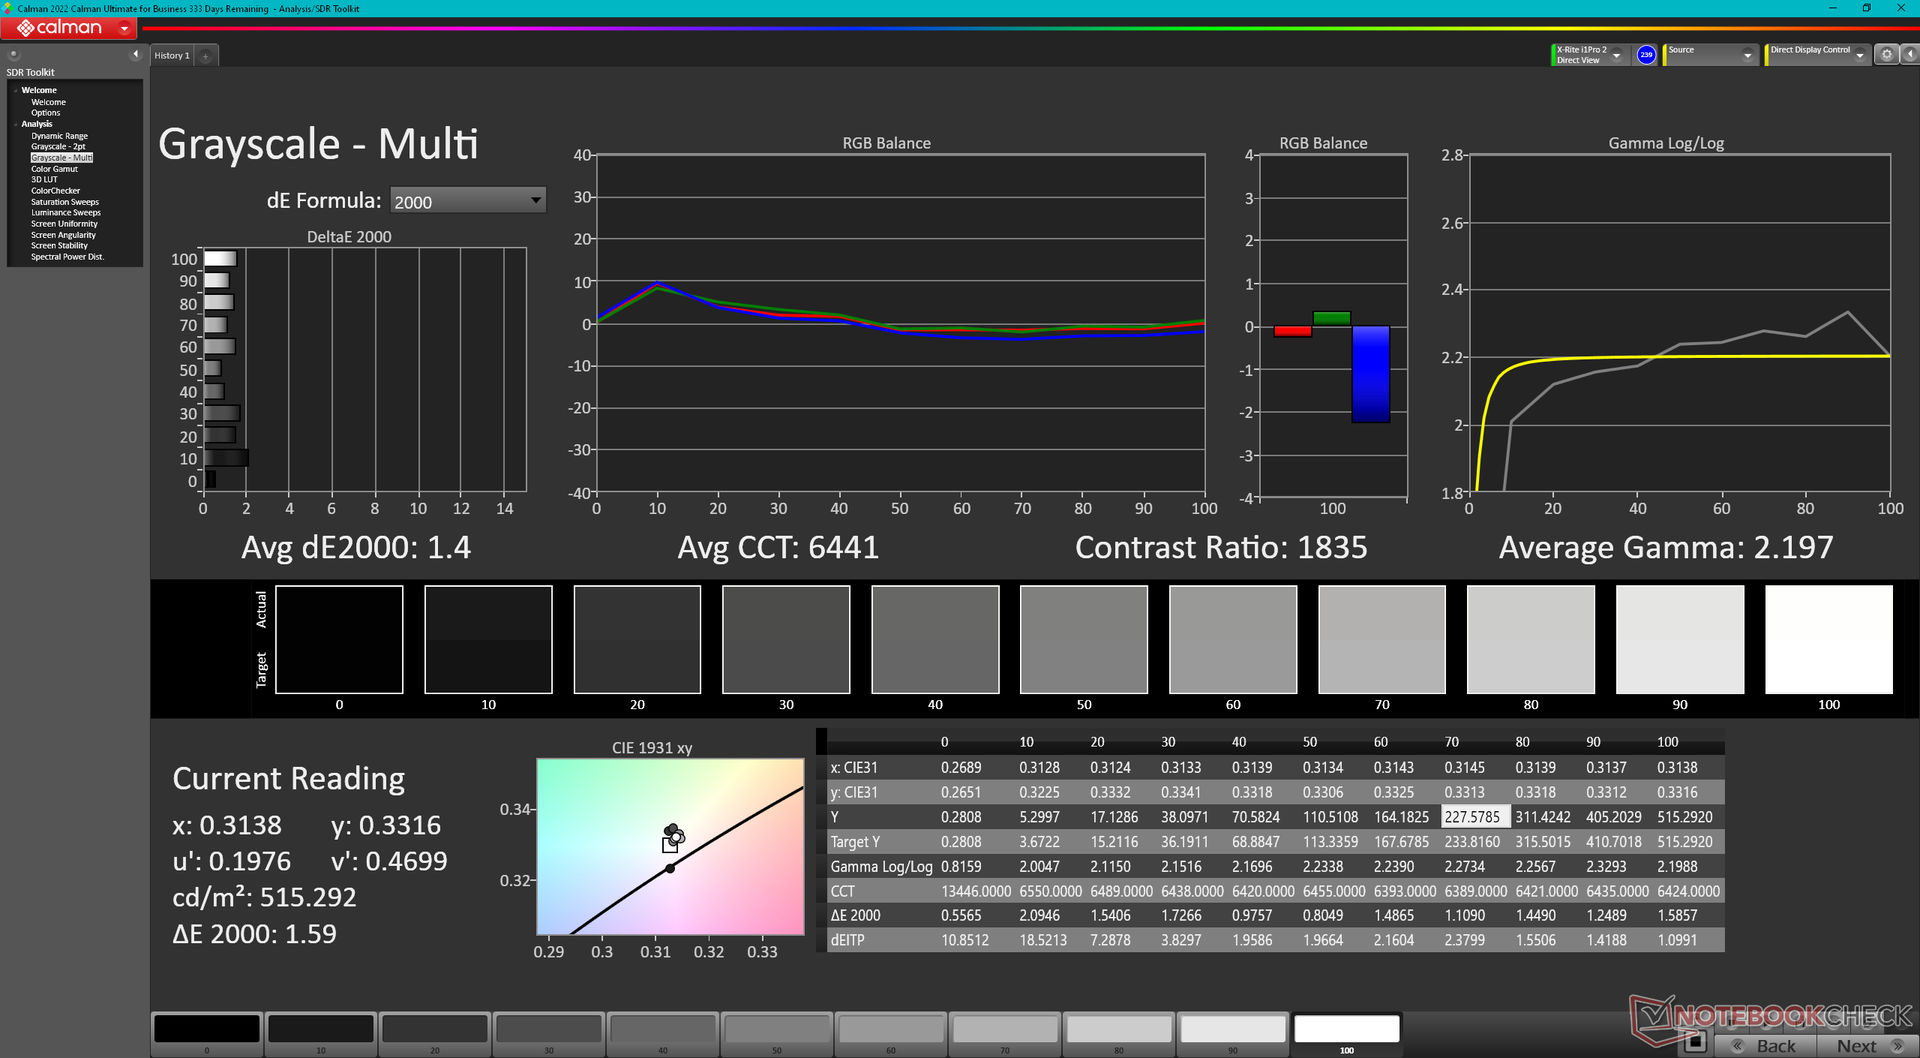
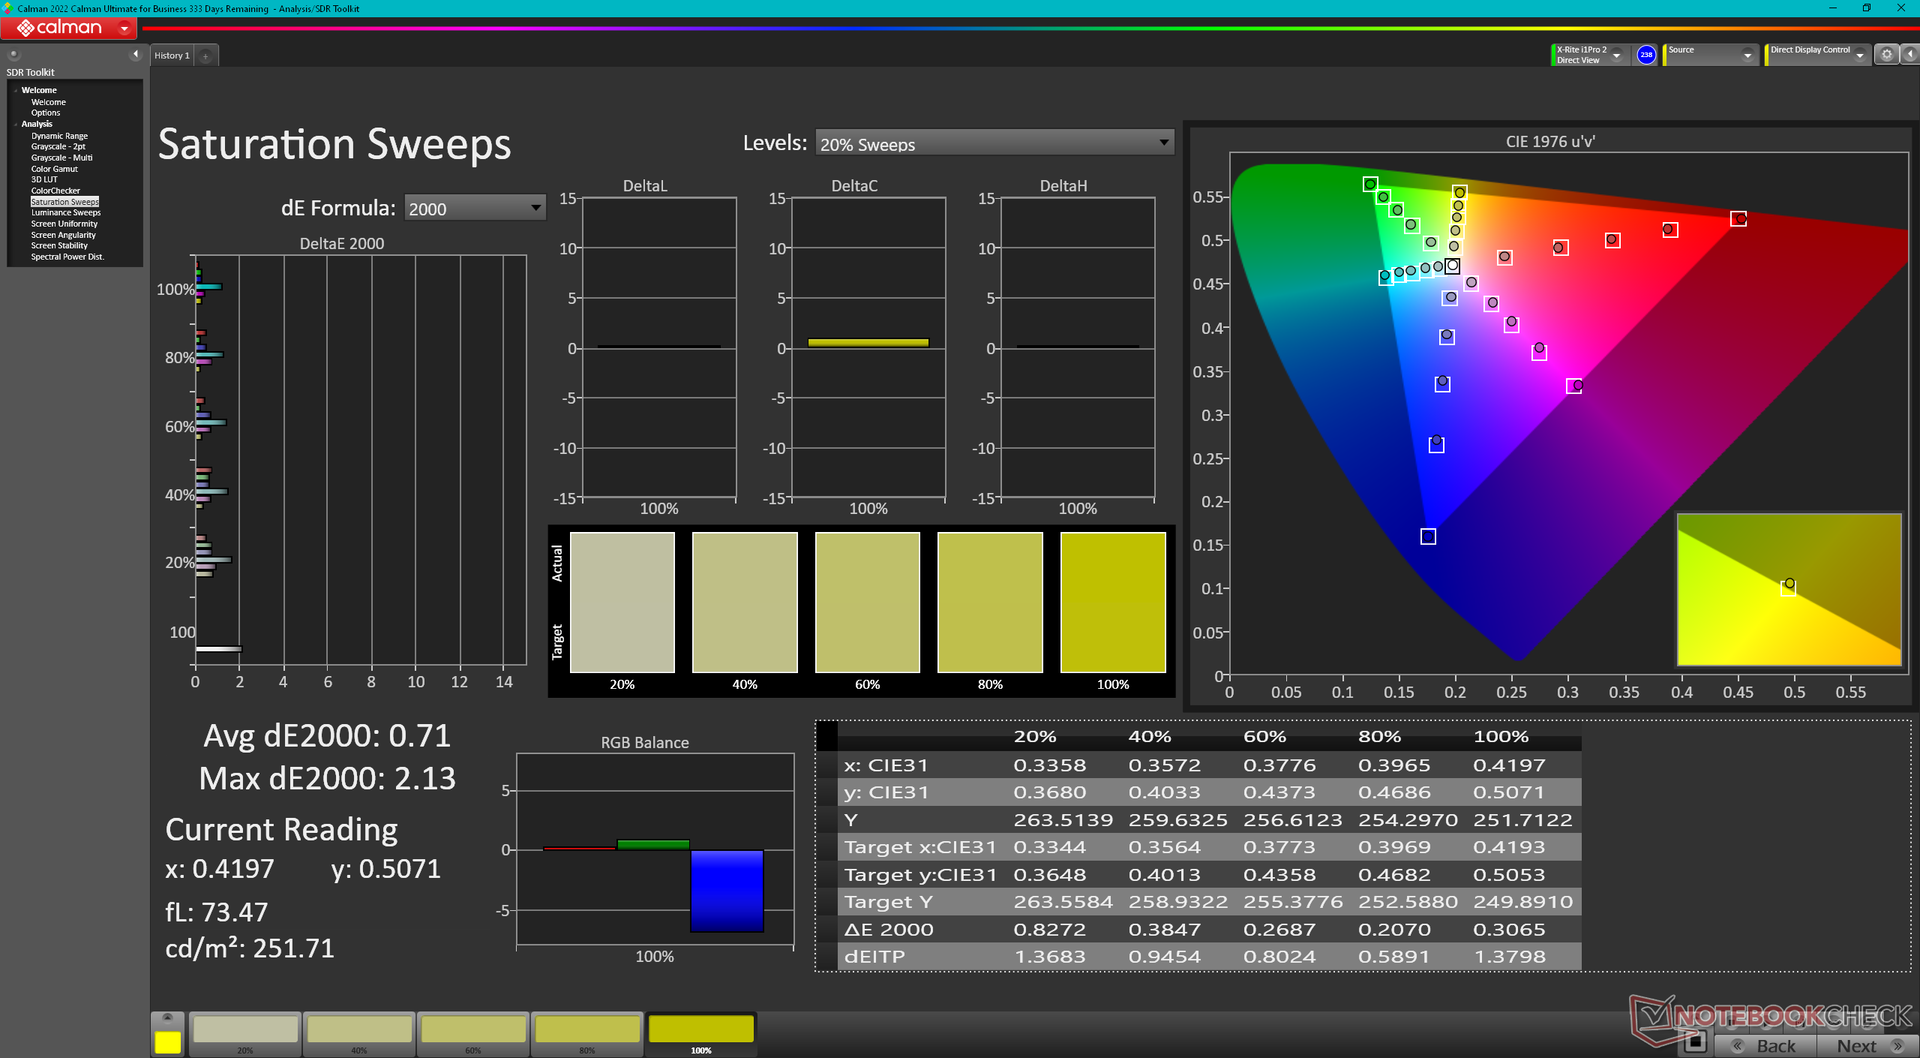
Dell adverteert een 500-nit touchscreen met volledige sRGB dekking, wat we kunnen bevestigen met onze onafhankelijke metingen. Dit is een high-end scherm met vergelijkbare helderheid en contrastniveaus als het scherm op de MSI Summit E13 Flip.
De twee grootste nadelen van het scherm zijn de zeer trage zwart-wit reactietijden en de beperkte 60 Hz verversingssnelheid. Hoewel dit geen gaming machine is, is de ghosting moeilijk te overzien, zelfs tijdens het surfen op het web, terwijl de 60 Hz verversingssnelheid zijn leeftijd begint te tonen. Een hogere verversingssnelheid zou ook de reactiesnelheid van het aanraakscherm hebben verbeterd.
Er zijn geen opties voor iets helderder of met bredere P3 kleuren, aangezien alle Latitude 9330 SKU's op dit moment worden geleverd met exact hetzelfde AU Optronics paneel.
| |||||||||||||||||||||||||
Helderheidsverdeling: 85 %
Helderheid in Batterij-modus: 542.3 cd/m²
Contrast: 1427:1 (Zwart: 0.38 cd/m²)
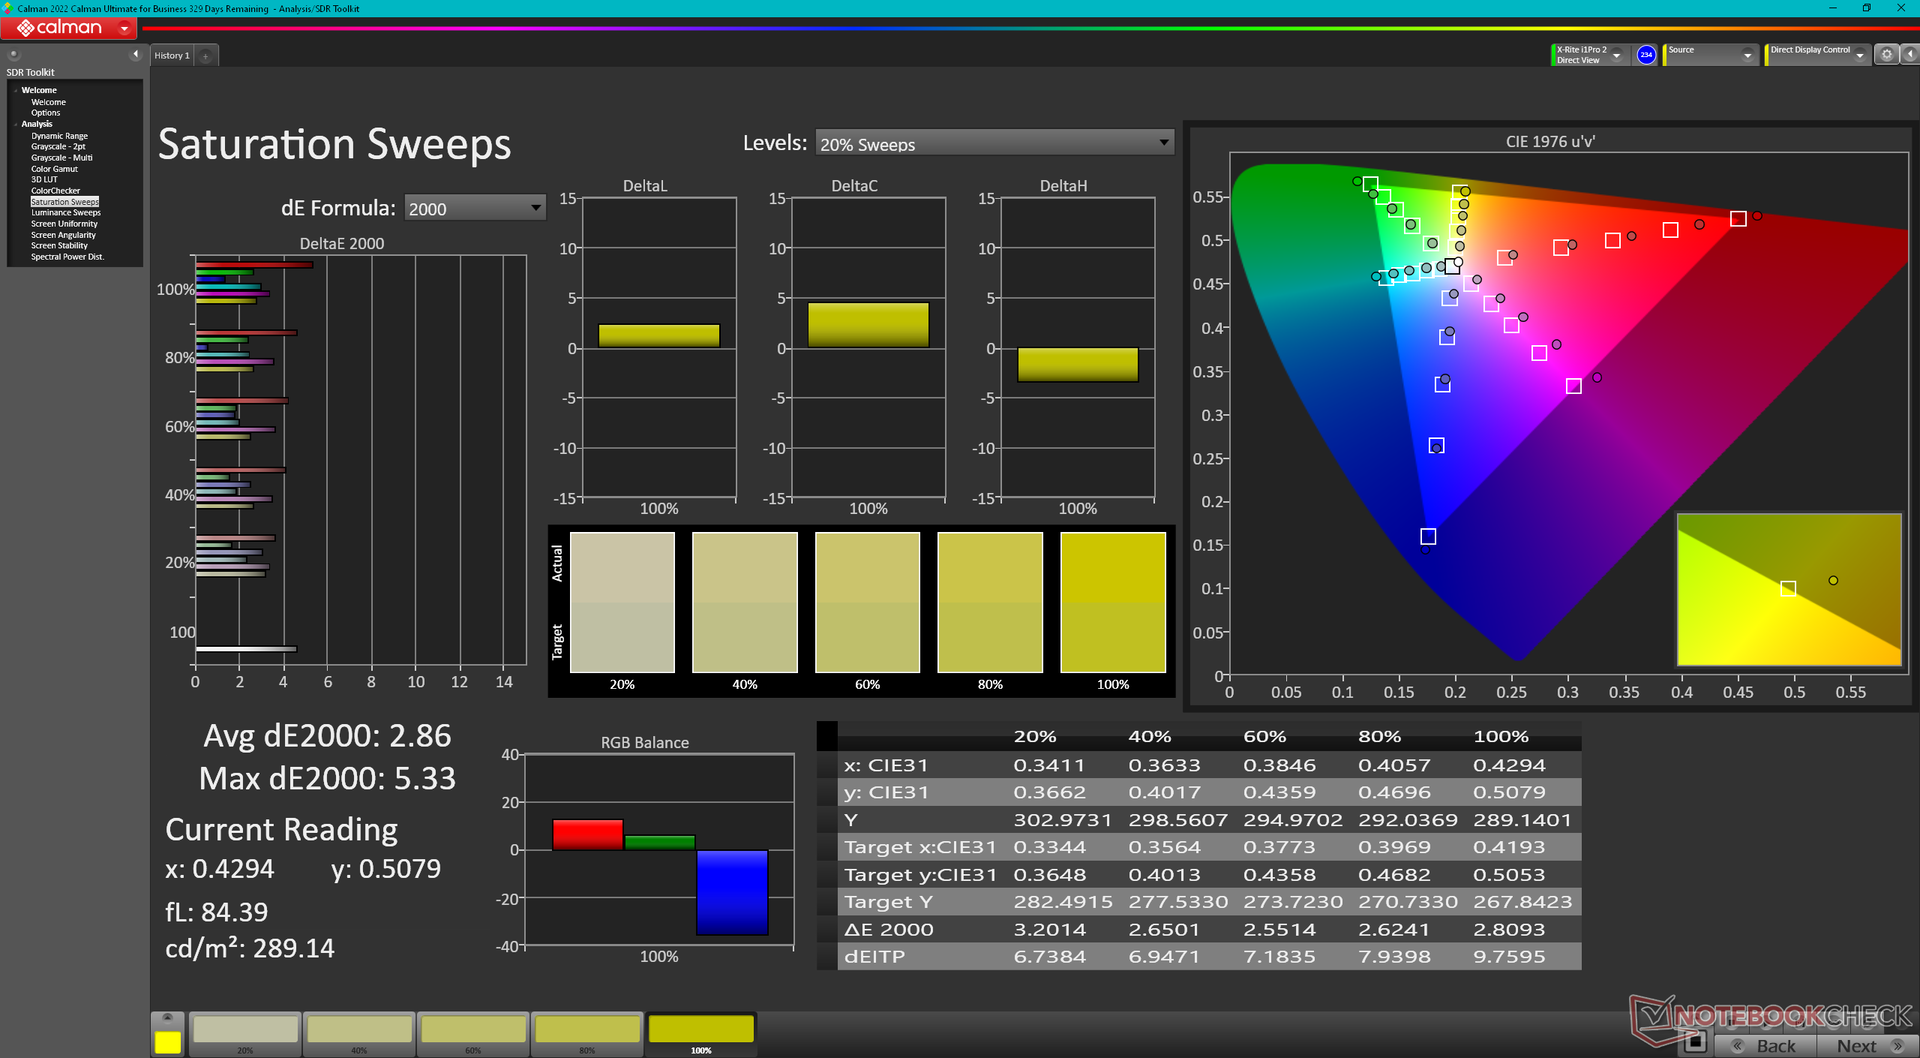
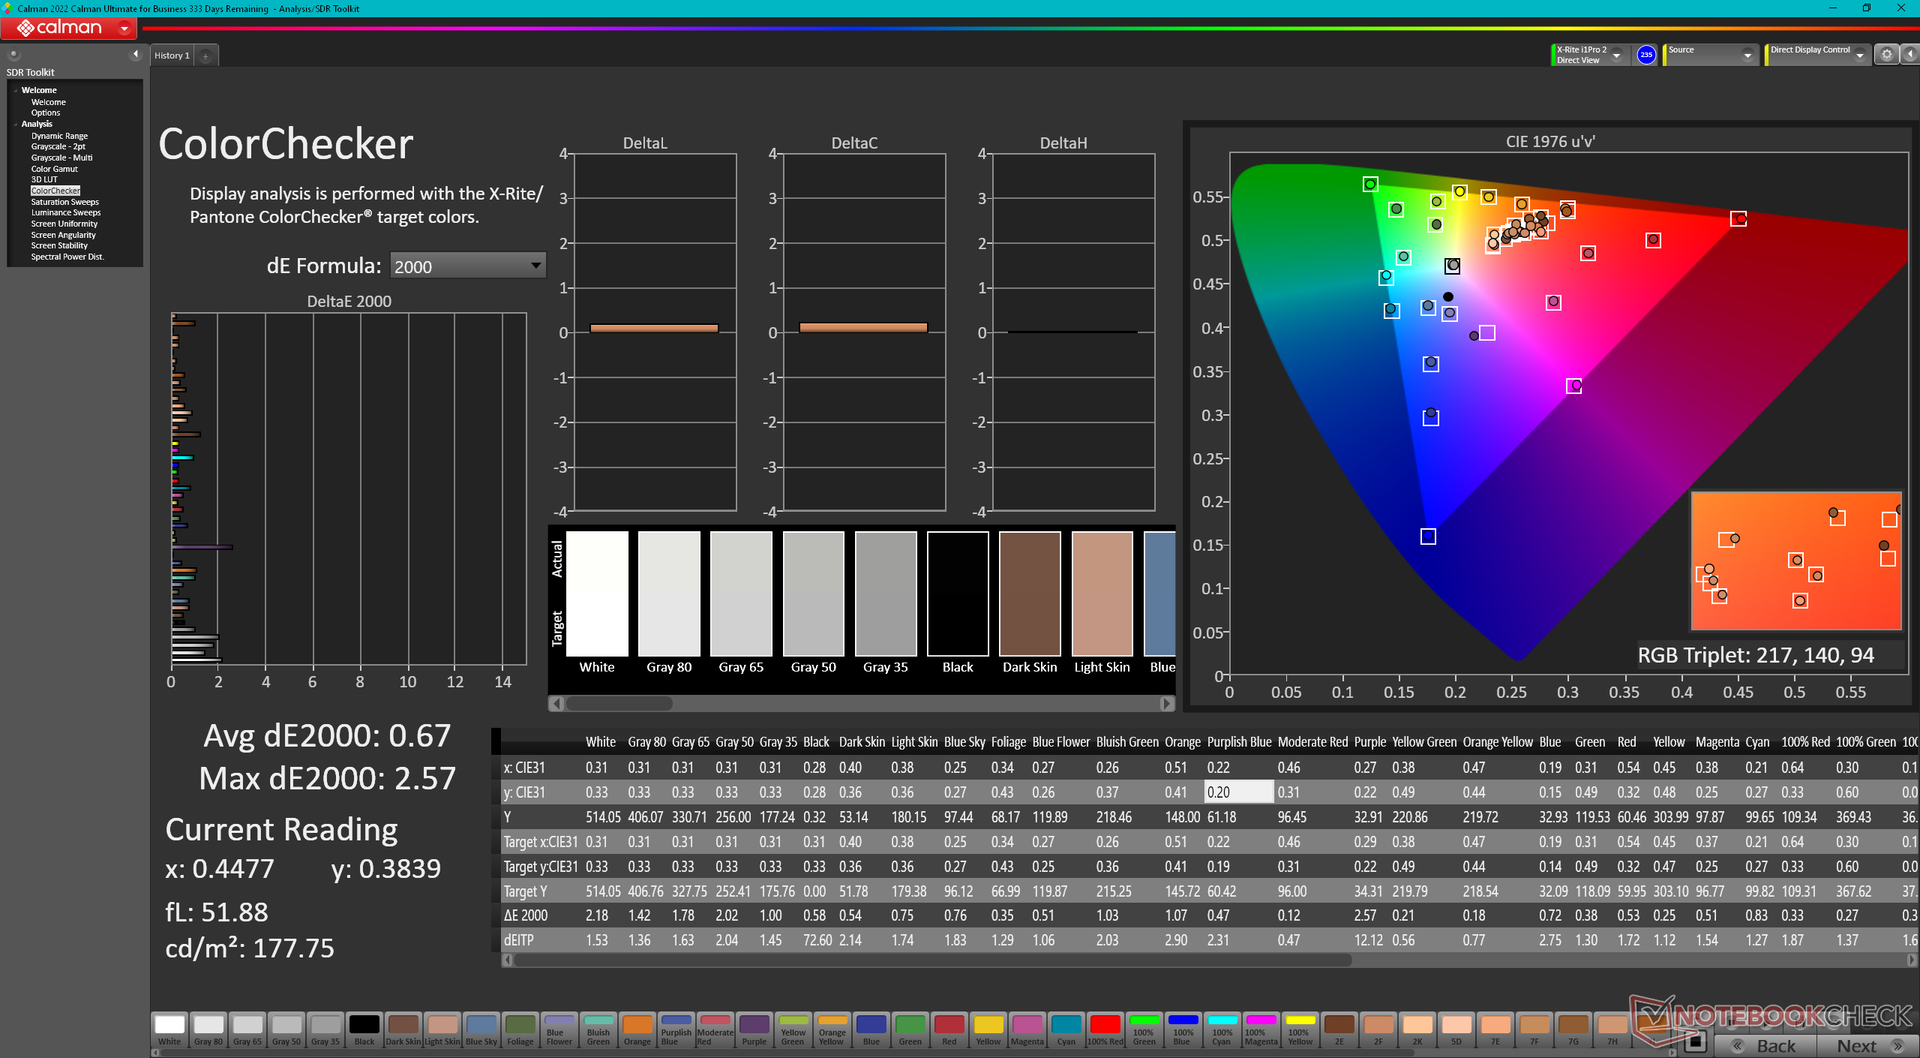
ΔE ColorChecker Calman: 3.18 | ∀{0.5-29.43 Ø4.71}
calibrated: 0.67
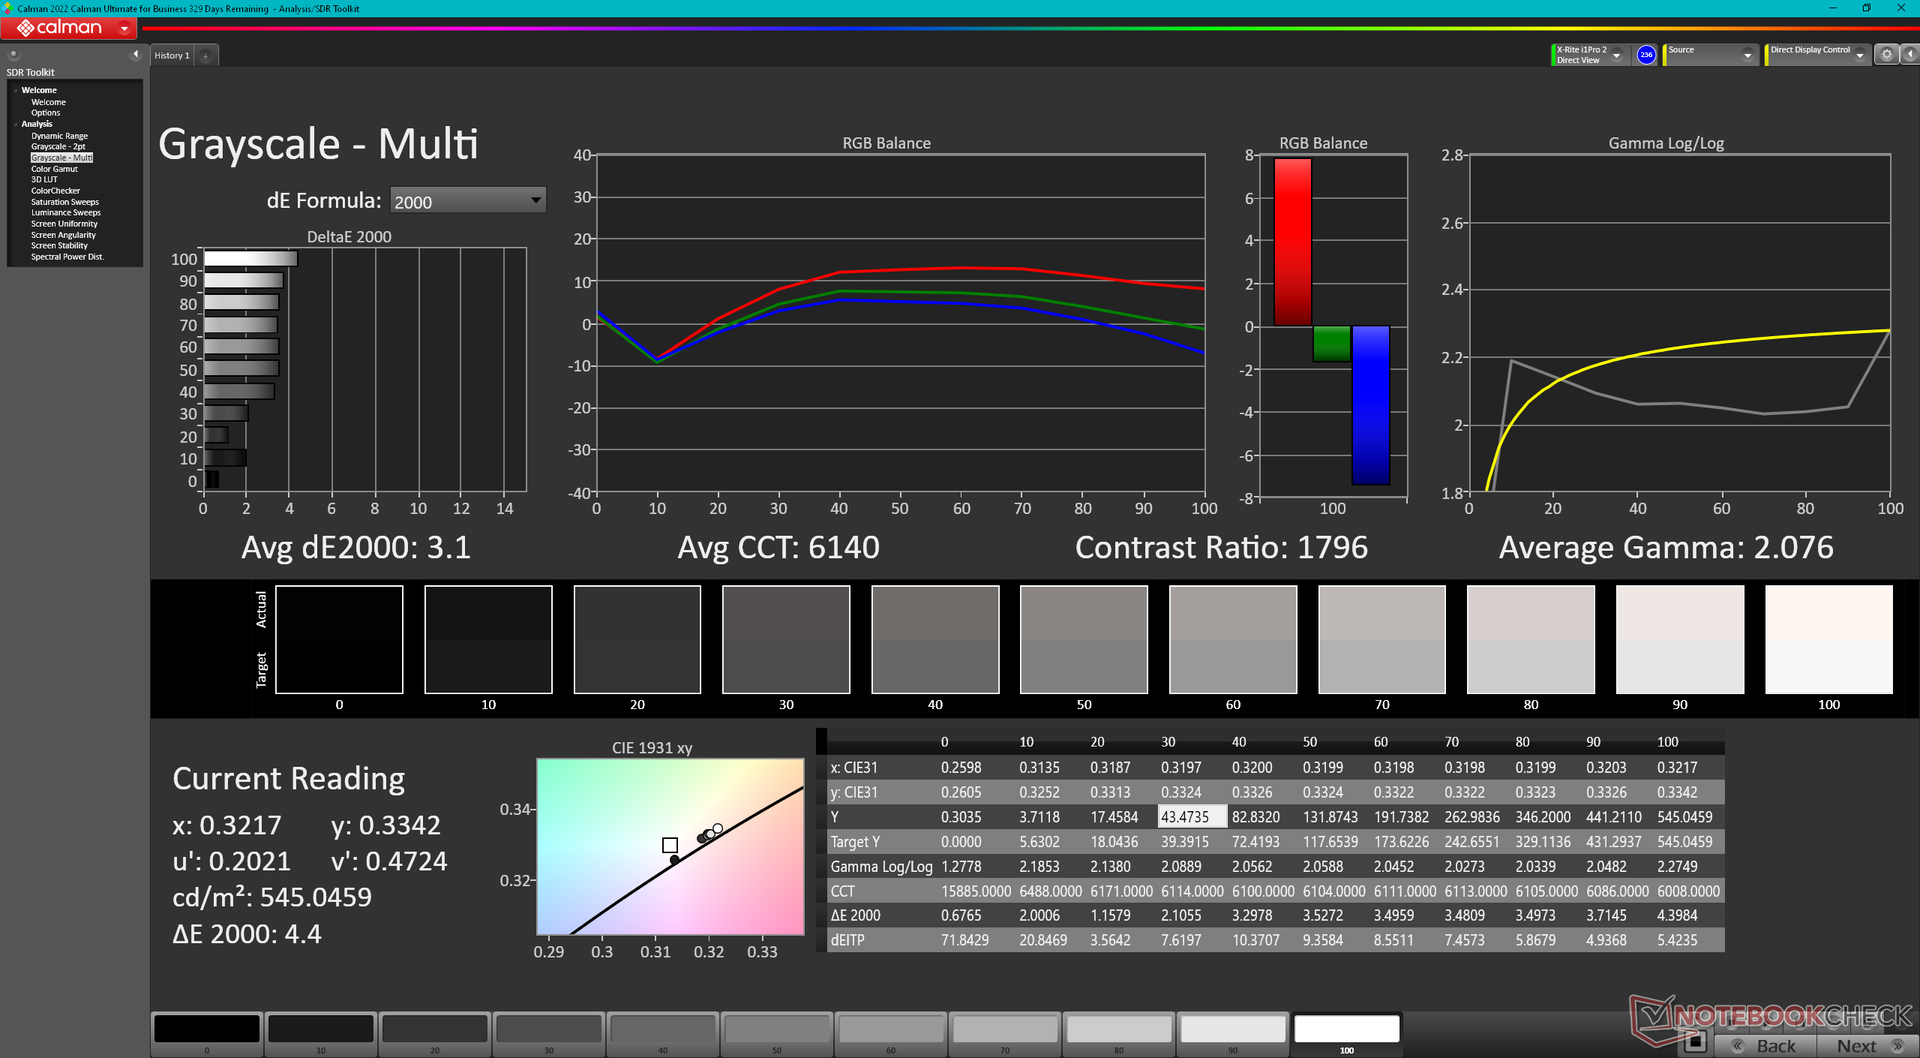
ΔE Greyscale Calman: 3.1 | ∀{0.09-98 Ø4.96}
77.5% AdobeRGB 1998 (Argyll 3D)
99.9% sRGB (Argyll 3D)
77.8% Display P3 (Argyll 3D)
Gamma: 2.08
CCT: 6140 K
| Dell Latitude 9330 AU Optronics B133QAA, IPS, 2560x1600, 13.3" | Lenovo ThinkPad X1 Titanium Yoga G1 20QB0016GE LPM135M467, IPS LED, 2256x1504, 13.5" | MSI Summit E13 Flip Evo A11MT Sharp LQ134N1JW53, IPS, 1920x1200, 13.4" | HP EliteBook x360 1030 G7 Chi Mei CMN13A9, IPS, 1920x1080, 13.3" | HP Elite Dragonfly Max InfoVision X133NVFL R0, IPS, 1920x1080, 13.3" | Dell Latitude 5310-23VP6 Chi Mei CMN1382, IPS, 1920x1080, 13.3" | |
|---|---|---|---|---|---|---|
| Display | -9% | -7% | -10% | -8% | ||
| Display P3 Coverage (%) | 77.8 | 66.8 -14% | 69.8 -10% | 66.1 -15% | 67.5 -13% | |
| sRGB Coverage (%) | 99.9 | 98 -2% | 98.8 -1% | 97 -3% | 99 -1% | |
| AdobeRGB 1998 Coverage (%) | 77.5 | 68.6 -11% | 70.6 -9% | 67.7 -13% | 69.2 -11% | |
| Response Times | 9% | 9% | 25% | 36% | 50% | |
| Response Time Grey 50% / Grey 80% * (ms) | 67.6 ? | 64 ? 5% | 64 ? 5% | 56.4 ? 17% | 44.8 ? 34% | 36 ? 47% |
| Response Time Black / White * (ms) | 50.4 ? | 44 ? 13% | 44 ? 13% | 34.4 ? 32% | 32 ? 37% | 24 ? 52% |
| PWM Frequency (Hz) | 26040 ? | 2500 ? | ||||
| Screen | 9% | 3% | -25% | 10% | 2% | |
| Brightness middle (cd/m²) | 542.3 | 465 -14% | 551.3 2% | 425.4 -22% | 777.5 43% | 383 -29% |
| Brightness (cd/m²) | 516 | 451 -13% | 517 0% | 407 -21% | 727 41% | 364 -29% |
| Brightness Distribution (%) | 85 | 92 8% | 91 7% | 89 5% | 75 -12% | 84 -1% |
| Black Level * (cd/m²) | 0.38 | 0.28 26% | 0.37 3% | 0.28 26% | 0.44 -16% | 0.34 11% |
| Contrast (:1) | 1427 | 1661 16% | 1490 4% | 1519 6% | 1767 24% | 1126 -21% |
| Colorchecker dE 2000 * | 3.18 | 2 37% | 1.45 54% | 4.39 -38% | 1.62 49% | 2.24 30% |
| Colorchecker dE 2000 max. * | 6.05 | 4.7 22% | 2.86 53% | 6.73 -11% | 5.26 13% | 3.32 45% |
| Colorchecker dE 2000 calibrated * | 0.67 | 0.7 -4% | 1.7 -154% | 1.65 -146% | 1.32 -97% | 0.72 -7% |
| Greyscale dE 2000 * | 3.1 | 2.9 6% | 1.3 58% | 3.9 -26% | 1.6 48% | 2.42 22% |
| Gamma | 2.08 106% | 2.09 105% | 2.14 103% | 1.87 118% | 2.2 100% | 2.65 83% |
| CCT | 6140 106% | 6181 105% | 6580 99% | 6758 96% | 6538 99% | 6776 96% |
| Color Space (Percent of AdobeRGB 1998) (%) | 65 | 61.7 | 72.3 | 56 | ||
| Color Space (Percent of sRGB) (%) | 99 | 96.6 | 94.8 | 99 | ||
| Totaal Gemiddelde (Programma / Instellingen) | 3% /
5% | 2% /
2% | -3% /
-15% | 23% /
15% | 15% /
7% |
* ... kleiner is beter
Het beeldscherm is niet voorgekalibreerd, wat teleurstellend is voor een laptop van meer dan 2000 dollar. Door het paneel zelf te kalibreren met een X-Rite colorimeter zouden de gemiddelde grijswaarden en kleur DeltaE waarden verbeteren van 3.1 en 3.18 naar respectievelijk slechts 1.4 en 0.67. Gebruikers kunnen ons bovenstaande ICM-profiel toepassen om de volledige sRGB-kleuren van het scherm beter te benutten.
Responstijd Scherm
| ↔ Responstijd Zwart naar Wit | ||
|---|---|---|
| 50.4 ms ... stijging ↗ en daling ↘ gecombineerd | ↗ 26.8 ms stijging | 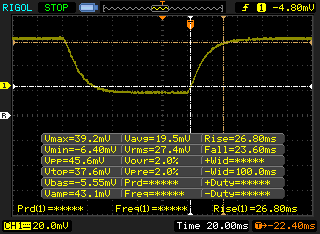 |
| ↘ 23.6 ms daling | ||
| Het scherm vertoonde trage responstijden in onze tests en is misschien te traag voor games. Ter vergelijking: alle testtoestellen variëren van 0.1 (minimum) tot 240 (maximum) ms. » 99 % van alle toestellen zijn beter. Dit betekent dat de gemeten responstijd slechter is dan het gemiddelde (19.8 ms) van alle geteste toestellen. | ||
| ↔ Responstijd 50% Grijs naar 80% Grijs | ||
| 67.6 ms ... stijging ↗ en daling ↘ gecombineerd | ↗ 34.8 ms stijging | 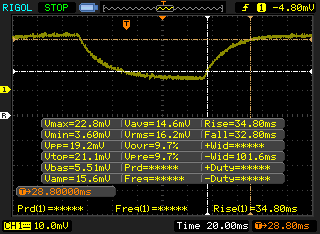 |
| ↘ 32.8 ms daling | ||
| Het scherm vertoonde trage responstijden in onze tests en is misschien te traag voor games. Ter vergelijking: alle testtoestellen variëren van 0.165 (minimum) tot 636 (maximum) ms. » 98 % van alle toestellen zijn beter. Dit betekent dat de gemeten responstijd slechter is dan het gemiddelde (31 ms) van alle geteste toestellen. | ||
Screen Flickering / PWM (Pulse-Width Modulation)
| Screen flickering / PWM niet waargenomen | 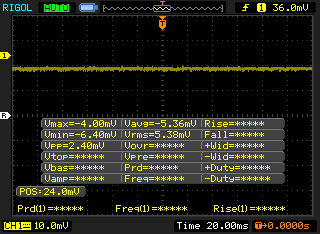 | ||
Ter vergelijking: 52 % van alle geteste toestellen maakten geen gebruik van PWM om de schermhelderheid te verlagen. Als het wel werd gebruikt, werd een gemiddelde van 7757 (minimum: 5 - maximum: 343500) Hz waargenomen. | |||
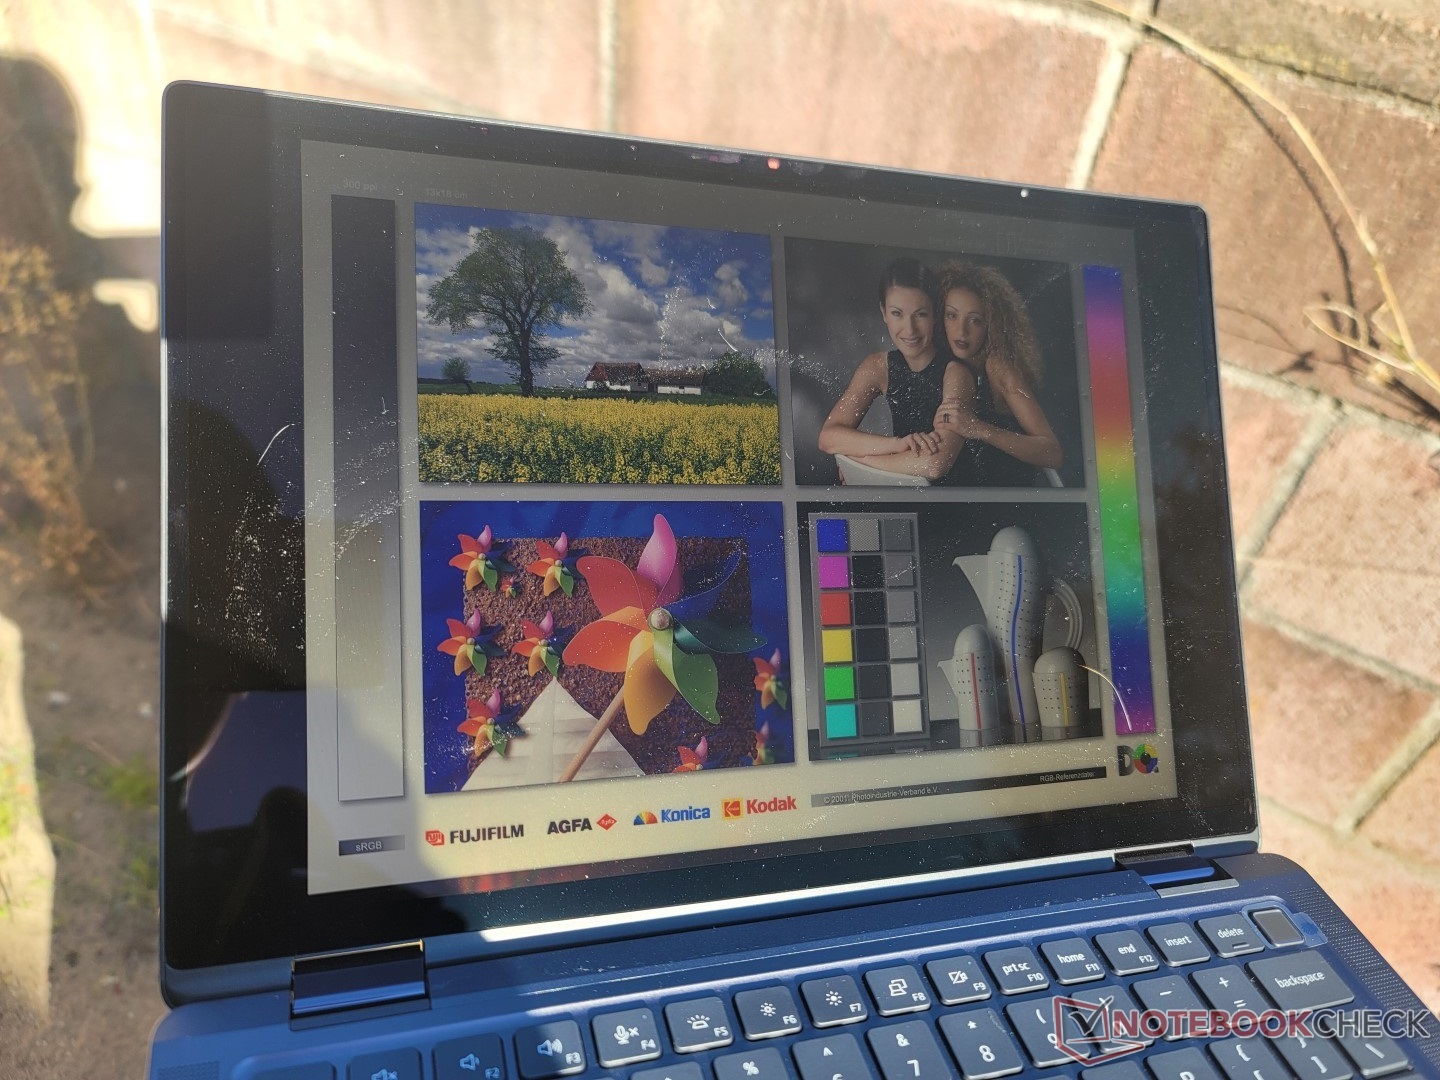
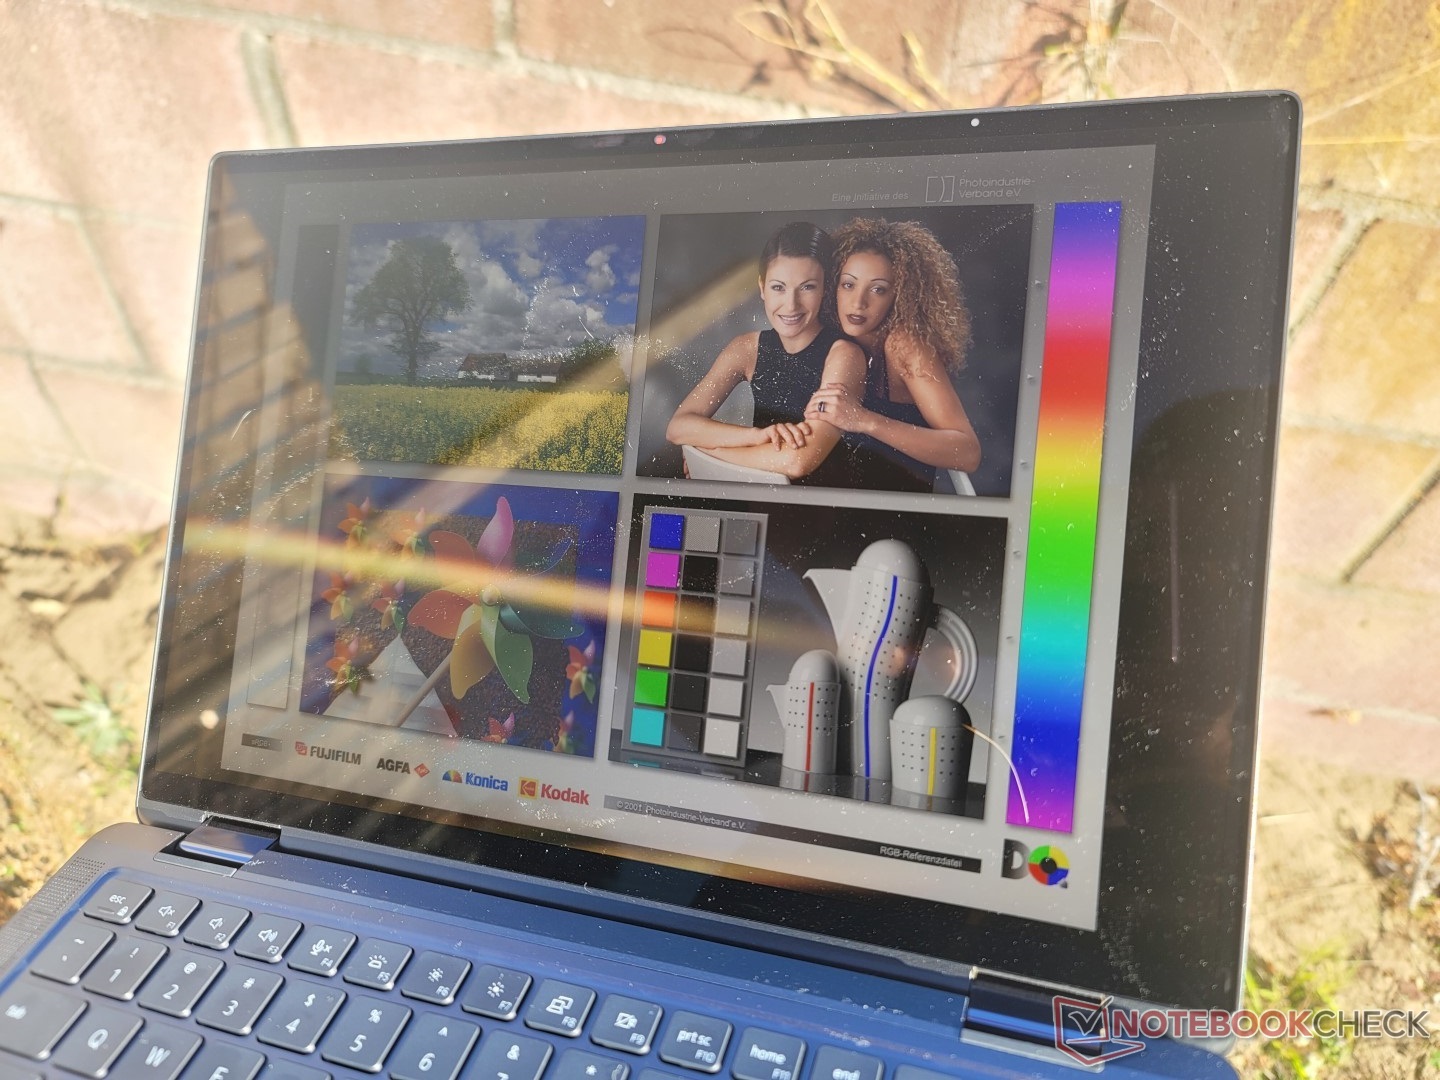
De zichtbaarheid buiten is goed in de schaduw, omdat het scherm helder genoeg is om lichte tot matige schittering te overwinnen. Toch moet direct zonlicht waar mogelijk worden vermeden om de kijkervaring te optimaliseren. De concurrerende Dragonfly Max biedt een nog helderder scherm dan de Latitude 9330 om buiten comfortabeler te kunnen kijken.
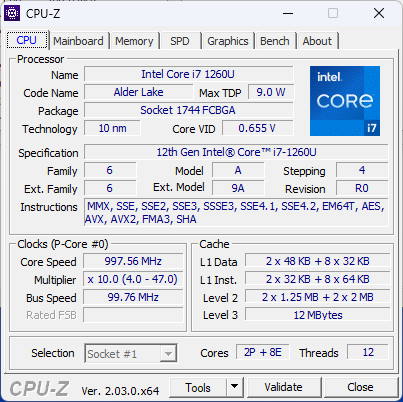
Prestaties - 12e generatie Alder Lake-U

Testomstandigheden
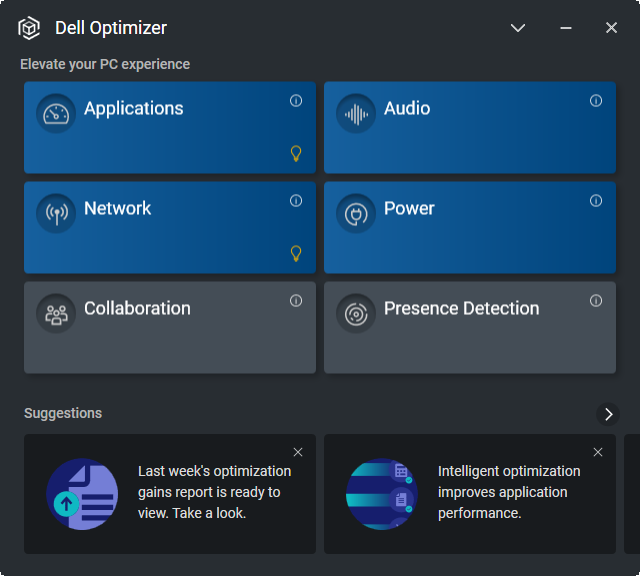
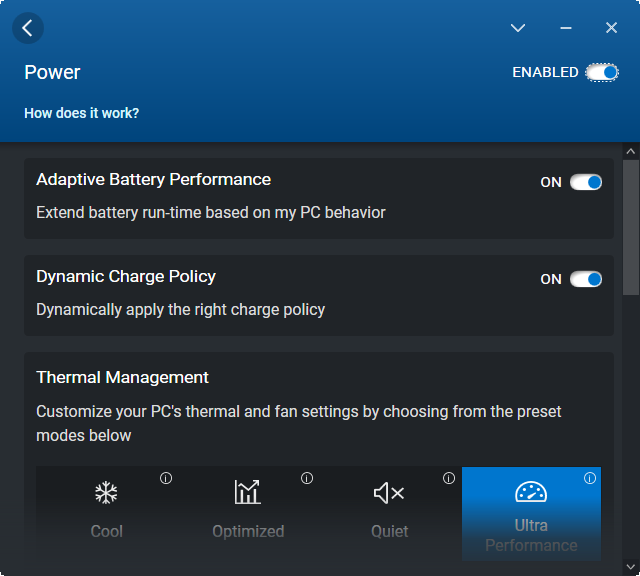
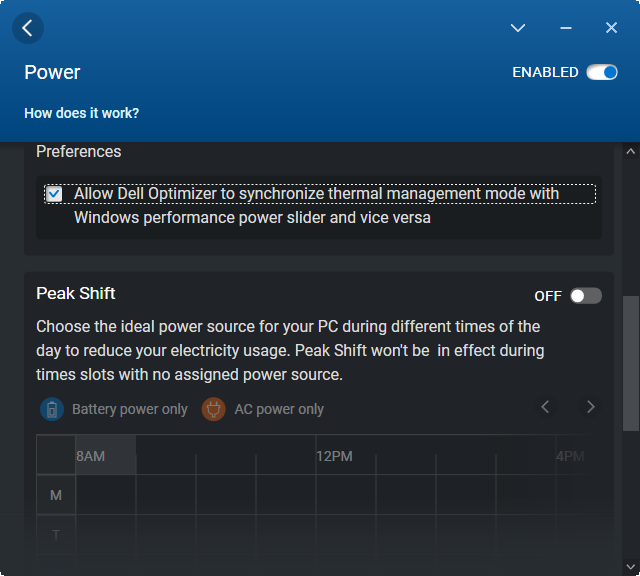
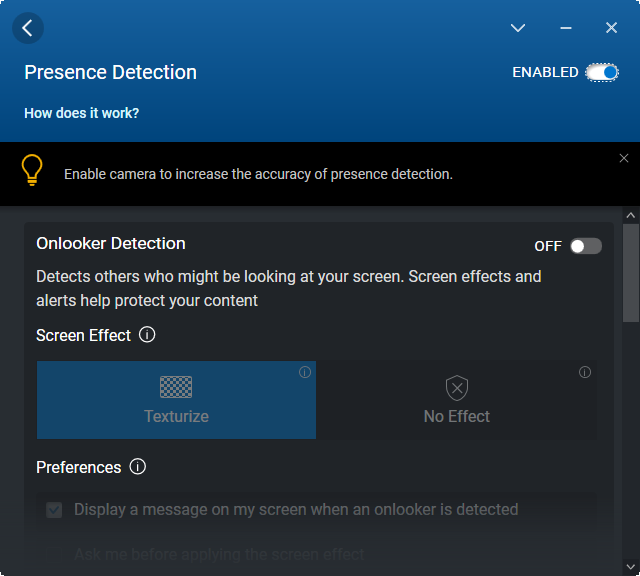
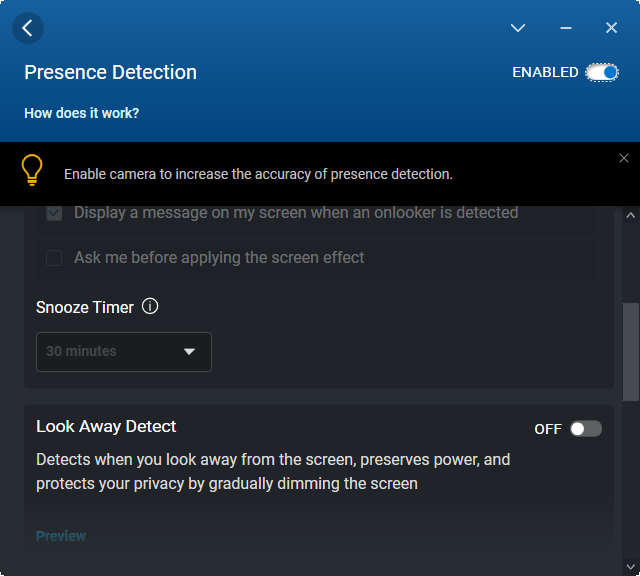
Ons toestel was ingesteld op de Ultra Performance modus via zowel Windows als de Dell Optimizer software. Het is sterk aanbevolen dat eigenaars vertrouwd raken met Optimizer, omdat het de hub is voor het schakelen van Latitude-specifieke functies zoals Presence Detection voor hands-free inloggen of het inschakelen van extra clickpad aanraakgevoelige knoppen. Prestatieprofielen zijn ook te vinden via de software, zoals blijkt uit de onderstaande screenshots.

Processor
De prestaties van de CPU zijn over het algemeen uitstekend, maar hij doet niet genoeg om zich te onderscheiden van de Core i5-1235U. Bijvoorbeeld, benchmark resultaten zijn allemaal binnen 5 tot 10 procent van de goedkopere Core i5-1235U in de IdeaPad Flex 5i. Ondertussen, de Core i7-1255U is sneller met ongeveer 10 tot 15 procent als gevolg van zijn hogere TDP doelen dan onze Core i7-1260U. Het multi-thread prestatievoordeel ten opzichte van de uitgaande 11e generatie Core i7-1165G7 is met ongeveer 35 procent nog steeds aanzienlijk, ondanks de kleinere verschillen tussen de 12e generatie i5-1235U en i7-1255U
De duurzaamheid van de prestaties is goed en veel beter dan wat we zagen op de concurrerende ThinkPad X1 Nano Gen 2 zoals blijkt uit onderstaande vergelijkingsgrafiek. Het Dell systeem is in staat om dit te bereiken door zeer hoge kerntemperaturen die onze Stress Test sectie zal illustreren.
Cinebench R15 Multi Loop
Cinebench R23: Multi Core | Single Core
Cinebench R15: CPU Multi 64Bit | CPU Single 64Bit
Blender: v2.79 BMW27 CPU
7-Zip 18.03: 7z b 4 | 7z b 4 -mmt1
Geekbench 5.5: Multi-Core | Single-Core
HWBOT x265 Benchmark v2.2: 4k Preset
LibreOffice : 20 Documents To PDF
R Benchmark 2.5: Overall mean
| Cinebench R20 / CPU (Multi Core) | |
| Asus Zenbook S 13 OLED | |
| Lenovo ThinkPad X1 Nano Gen 2 Core i7-1280P | |
| HP Spectre x360 13.5 14t-ef000 | |
| Gemiddeld Intel Core i7-1260U (2838 - 3165, n=2) | |
| Lenovo ThinkBook 13s G3 20YA0005GE | |
| Lenovo Yoga 6 13ALC6 | |
| Dell Latitude 9330 | |
| Lenovo IdeaPad Flex 5i 14IAU7 | |
| Samsung Galaxy Book2 Pro 13 NP930XED-KA1DE | |
| Framework Laptop 13.5 | |
| MSI Summit E13 Flip Evo A11MT | |
| HP EliteBook x360 1030 G7 | |
| HP Elite Dragonfly Max | |
| Dell Latitude 5310-23VP6 | |
| Lenovo ThinkPad X1 Titanium Yoga G1 20QB0016GE | |
| Cinebench R20 / CPU (Single Core) | |
| HP Spectre x360 13.5 14t-ef000 | |
| Lenovo IdeaPad Flex 5i 14IAU7 | |
| Lenovo ThinkPad X1 Nano Gen 2 Core i7-1280P | |
| Dell Latitude 9330 | |
| Framework Laptop 13.5 | |
| Gemiddeld Intel Core i7-1260U (566 - 588, n=2) | |
| Asus Zenbook S 13 OLED | |
| Lenovo ThinkBook 13s G3 20YA0005GE | |
| MSI Summit E13 Flip Evo A11MT | |
| HP Elite Dragonfly Max | |
| Lenovo Yoga 6 13ALC6 | |
| HP EliteBook x360 1030 G7 | |
| Lenovo ThinkPad X1 Titanium Yoga G1 20QB0016GE | |
| Dell Latitude 5310-23VP6 | |
| Samsung Galaxy Book2 Pro 13 NP930XED-KA1DE | |
| Cinebench R23 / Multi Core | |
| Asus Zenbook S 13 OLED | |
| Lenovo ThinkPad X1 Nano Gen 2 Core i7-1280P | |
| HP Spectre x360 13.5 14t-ef000 | |
| Lenovo IdeaPad Flex 5i 14IAU7 | |
| Lenovo ThinkBook 13s G3 20YA0005GE | |
| Gemiddeld Intel Core i7-1260U (7444 - 8381, n=2) | |
| Lenovo Yoga 6 13ALC6 | |
| Dell Latitude 9330 | |
| Samsung Galaxy Book2 Pro 13 NP930XED-KA1DE | |
| MSI Summit E13 Flip Evo A11MT | |
| Framework Laptop 13.5 | |
| HP Elite Dragonfly Max | |
| Lenovo ThinkPad X1 Titanium Yoga G1 20QB0016GE | |
| Cinebench R23 / Single Core | |
| HP Spectre x360 13.5 14t-ef000 | |
| Lenovo ThinkPad X1 Nano Gen 2 Core i7-1280P | |
| Lenovo IdeaPad Flex 5i 14IAU7 | |
| Gemiddeld Intel Core i7-1260U (1538 - 1664, n=2) | |
| Dell Latitude 9330 | |
| Framework Laptop 13.5 | |
| Asus Zenbook S 13 OLED | |
| MSI Summit E13 Flip Evo A11MT | |
| Lenovo ThinkBook 13s G3 20YA0005GE | |
| HP Elite Dragonfly Max | |
| Lenovo Yoga 6 13ALC6 | |
| Lenovo ThinkPad X1 Titanium Yoga G1 20QB0016GE | |
| Samsung Galaxy Book2 Pro 13 NP930XED-KA1DE | |
| Cinebench R15 / CPU Multi 64Bit | |
| Lenovo ThinkPad X1 Nano Gen 2 Core i7-1280P | |
| Lenovo ThinkBook 13s G3 20YA0005GE | |
| Lenovo ThinkBook 13s G3 20YA0005GE | |
| Asus Zenbook S 13 OLED | |
| HP Spectre x360 13.5 14t-ef000 | |
| Lenovo IdeaPad Flex 5i 14IAU7 | |
| Gemiddeld Intel Core i7-1260U (1117 - 1289, n=2) | |
| Lenovo Yoga 6 13ALC6 | |
| Dell Latitude 9330 | |
| Samsung Galaxy Book2 Pro 13 NP930XED-KA1DE | |
| MSI Summit E13 Flip Evo A11MT | |
| Framework Laptop 13.5 | |
| HP EliteBook x360 1030 G7 | |
| Lenovo ThinkPad X1 Titanium Yoga G1 20QB0016GE | |
| HP Elite Dragonfly Max | |
| Dell Latitude 5310-23VP6 | |
| Cinebench R15 / CPU Single 64Bit | |
| HP Spectre x360 13.5 14t-ef000 | |
| Lenovo IdeaPad Flex 5i 14IAU7 | |
| Lenovo ThinkPad X1 Nano Gen 2 Core i7-1280P | |
| Asus Zenbook S 13 OLED | |
| Lenovo ThinkBook 13s G3 20YA0005GE | |
| Framework Laptop 13.5 | |
| Dell Latitude 9330 | |
| Gemiddeld Intel Core i7-1260U (217 - 222, n=2) | |
| MSI Summit E13 Flip Evo A11MT | |
| Lenovo Yoga 6 13ALC6 | |
| HP EliteBook x360 1030 G7 | |
| Lenovo ThinkPad X1 Titanium Yoga G1 20QB0016GE | |
| HP Elite Dragonfly Max | |
| Dell Latitude 5310-23VP6 | |
| Samsung Galaxy Book2 Pro 13 NP930XED-KA1DE | |
| Blender / v2.79 BMW27 CPU | |
| Lenovo ThinkPad X1 Titanium Yoga G1 20QB0016GE | |
| Dell Latitude 5310-23VP6 | |
| HP Elite Dragonfly Max | |
| HP EliteBook x360 1030 G7 | |
| Samsung Galaxy Book2 Pro 13 NP930XED-KA1DE | |
| MSI Summit E13 Flip Evo A11MT | |
| Framework Laptop 13.5 | |
| Dell Latitude 9330 | |
| Gemiddeld Intel Core i7-1260U (393 - 431, n=2) | |
| Lenovo IdeaPad Flex 5i 14IAU7 | |
| Lenovo ThinkBook 13s G3 20YA0005GE | |
| HP Spectre x360 13.5 14t-ef000 | |
| Lenovo Yoga 6 13ALC6 | |
| Asus Zenbook S 13 OLED | |
| Lenovo ThinkPad X1 Nano Gen 2 Core i7-1280P | |
| 7-Zip 18.03 / 7z b 4 | |
| Asus Zenbook S 13 OLED | |
| Lenovo ThinkPad X1 Nano Gen 2 Core i7-1280P | |
| Lenovo ThinkBook 13s G3 20YA0005GE | |
| Lenovo Yoga 6 13ALC6 | |
| HP Spectre x360 13.5 14t-ef000 | |
| Gemiddeld Intel Core i7-1260U (32008 - 36480, n=2) | |
| Dell Latitude 9330 | |
| Lenovo IdeaPad Flex 5i 14IAU7 | |
| MSI Summit E13 Flip Evo A11MT | |
| Framework Laptop 13.5 | |
| Samsung Galaxy Book2 Pro 13 NP930XED-KA1DE | |
| HP EliteBook x360 1030 G7 | |
| HP Elite Dragonfly Max | |
| Dell Latitude 5310-23VP6 | |
| Lenovo ThinkPad X1 Titanium Yoga G1 20QB0016GE | |
| 7-Zip 18.03 / 7z b 4 -mmt1 | |
| Lenovo ThinkPad X1 Nano Gen 2 Core i7-1280P | |
| HP Spectre x360 13.5 14t-ef000 | |
| Asus Zenbook S 13 OLED | |
| Framework Laptop 13.5 | |
| Lenovo ThinkBook 13s G3 20YA0005GE | |
| MSI Summit E13 Flip Evo A11MT | |
| HP Elite Dragonfly Max | |
| Lenovo IdeaPad Flex 5i 14IAU7 | |
| Gemiddeld Intel Core i7-1260U (4746 - 5047, n=2) | |
| Dell Latitude 9330 | |
| Lenovo Yoga 6 13ALC6 | |
| HP EliteBook x360 1030 G7 | |
| Dell Latitude 5310-23VP6 | |
| Lenovo ThinkPad X1 Titanium Yoga G1 20QB0016GE | |
| Samsung Galaxy Book2 Pro 13 NP930XED-KA1DE | |
| Geekbench 5.5 / Multi-Core | |
| Lenovo ThinkPad X1 Nano Gen 2 Core i7-1280P | |
| Lenovo IdeaPad Flex 5i 14IAU7 | |
| HP Spectre x360 13.5 14t-ef000 | |
| Asus Zenbook S 13 OLED | |
| Gemiddeld Intel Core i7-1260U (7072 - 7444, n=2) | |
| Dell Latitude 9330 | |
| Lenovo ThinkBook 13s G3 20YA0005GE | |
| MSI Summit E13 Flip Evo A11MT | |
| HP Elite Dragonfly Max | |
| HP EliteBook x360 1030 G7 | |
| Samsung Galaxy Book2 Pro 13 NP930XED-KA1DE | |
| Lenovo ThinkPad X1 Titanium Yoga G1 20QB0016GE | |
| Dell Latitude 5310-23VP6 | |
| Geekbench 5.5 / Single-Core | |
| Lenovo ThinkPad X1 Nano Gen 2 Core i7-1280P | |
| HP Spectre x360 13.5 14t-ef000 | |
| Lenovo IdeaPad Flex 5i 14IAU7 | |
| Gemiddeld Intel Core i7-1260U (1560 - 1662, n=2) | |
| Dell Latitude 9330 | |
| HP Elite Dragonfly Max | |
| Asus Zenbook S 13 OLED | |
| MSI Summit E13 Flip Evo A11MT | |
| Lenovo ThinkBook 13s G3 20YA0005GE | |
| Lenovo ThinkPad X1 Titanium Yoga G1 20QB0016GE | |
| HP EliteBook x360 1030 G7 | |
| Dell Latitude 5310-23VP6 | |
| Samsung Galaxy Book2 Pro 13 NP930XED-KA1DE | |
| HWBOT x265 Benchmark v2.2 / 4k Preset | |
| Asus Zenbook S 13 OLED | |
| HP Spectre x360 13.5 14t-ef000 | |
| Lenovo ThinkBook 13s G3 20YA0005GE | |
| Lenovo ThinkPad X1 Nano Gen 2 Core i7-1280P | |
| Lenovo IdeaPad Flex 5i 14IAU7 | |
| Lenovo Yoga 6 13ALC6 | |
| Gemiddeld Intel Core i7-1260U (8.54 - 9.58, n=2) | |
| Dell Latitude 9330 | |
| MSI Summit E13 Flip Evo A11MT | |
| Framework Laptop 13.5 | |
| Samsung Galaxy Book2 Pro 13 NP930XED-KA1DE | |
| HP EliteBook x360 1030 G7 | |
| HP Elite Dragonfly Max | |
| Dell Latitude 5310-23VP6 | |
| Lenovo ThinkPad X1 Titanium Yoga G1 20QB0016GE | |
| LibreOffice / 20 Documents To PDF | |
| Samsung Galaxy Book2 Pro 13 NP930XED-KA1DE | |
| HP EliteBook x360 1030 G7 | |
| Dell Latitude 5310-23VP6 | |
| Lenovo Yoga 6 13ALC6 | |
| Asus Zenbook S 13 OLED | |
| Dell Latitude 9330 | |
| Lenovo ThinkPad X1 Titanium Yoga G1 20QB0016GE | |
| Lenovo ThinkBook 13s G3 20YA0005GE | |
| Lenovo IdeaPad Flex 5i 14IAU7 | |
| Gemiddeld Intel Core i7-1260U (45.9 - 51.4, n=2) | |
| MSI Summit E13 Flip Evo A11MT | |
| HP Elite Dragonfly Max | |
| Lenovo ThinkPad X1 Nano Gen 2 Core i7-1280P | |
| Framework Laptop 13.5 | |
| HP Spectre x360 13.5 14t-ef000 | |
| R Benchmark 2.5 / Overall mean | |
| Samsung Galaxy Book2 Pro 13 NP930XED-KA1DE | |
| Lenovo ThinkPad X1 Titanium Yoga G1 20QB0016GE | |
| Dell Latitude 5310-23VP6 | |
| HP EliteBook x360 1030 G7 | |
| HP Elite Dragonfly Max | |
| MSI Summit E13 Flip Evo A11MT | |
| Lenovo Yoga 6 13ALC6 | |
| Framework Laptop 13.5 | |
| Lenovo ThinkBook 13s G3 20YA0005GE | |
| Dell Latitude 9330 | |
| Asus Zenbook S 13 OLED | |
| Gemiddeld Intel Core i7-1260U (0.494 - 0.53, n=2) | |
| Lenovo IdeaPad Flex 5i 14IAU7 | |
| HP Spectre x360 13.5 14t-ef000 | |
| Lenovo ThinkPad X1 Nano Gen 2 Core i7-1280P | |
Cinebench R23: Multi Core | Single Core
Cinebench R15: CPU Multi 64Bit | CPU Single 64Bit
Blender: v2.79 BMW27 CPU
7-Zip 18.03: 7z b 4 | 7z b 4 -mmt1
Geekbench 5.5: Multi-Core | Single-Core
HWBOT x265 Benchmark v2.2: 4k Preset
LibreOffice : 20 Documents To PDF
R Benchmark 2.5: Overall mean
* ... kleiner is beter
AIDA64: FP32 Ray-Trace | FPU Julia | CPU SHA3 | CPU Queen | FPU SinJulia | FPU Mandel | CPU AES | CPU ZLib | FP64 Ray-Trace | CPU PhotoWorxx
| Performance rating | |
| MSI Summit E13 Flip Evo A11MT | |
| Gemiddeld Intel Core i7-1260U | |
| Dell Latitude 9330 | |
| HP Elite Dragonfly Max | |
| Lenovo ThinkPad X1 Titanium Yoga G1 20QB0016GE | |
| Dell Latitude 5310-23VP6 | |
| AIDA64 / FP32 Ray-Trace | |
| MSI Summit E13 Flip Evo A11MT | |
| Gemiddeld Intel Core i7-1260U (6694 - 7261, n=2) | |
| Dell Latitude 9330 | |
| HP Elite Dragonfly Max | |
| Dell Latitude 5310-23VP6 | |
| Lenovo ThinkPad X1 Titanium Yoga G1 20QB0016GE | |
| AIDA64 / FPU Julia | |
| Gemiddeld Intel Core i7-1260U (33823 - 37371, n=2) | |
| Dell Latitude 9330 | |
| MSI Summit E13 Flip Evo A11MT | |
| Dell Latitude 5310-23VP6 | |
| HP Elite Dragonfly Max | |
| Lenovo ThinkPad X1 Titanium Yoga G1 20QB0016GE | |
| AIDA64 / CPU SHA3 | |
| MSI Summit E13 Flip Evo A11MT | |
| Gemiddeld Intel Core i7-1260U (1816 - 1949, n=2) | |
| Dell Latitude 9330 | |
| HP Elite Dragonfly Max | |
| Lenovo ThinkPad X1 Titanium Yoga G1 20QB0016GE | |
| Dell Latitude 5310-23VP6 | |
| AIDA64 / CPU Queen | |
| MSI Summit E13 Flip Evo A11MT | |
| Gemiddeld Intel Core i7-1260U (50854 - 53090, n=2) | |
| Dell Latitude 9330 | |
| HP Elite Dragonfly Max | |
| Dell Latitude 5310-23VP6 | |
| Lenovo ThinkPad X1 Titanium Yoga G1 20QB0016GE | |
| AIDA64 / FPU SinJulia | |
| MSI Summit E13 Flip Evo A11MT | |
| Dell Latitude 5310-23VP6 | |
| Gemiddeld Intel Core i7-1260U (4067 - 4155, n=2) | |
| Dell Latitude 9330 | |
| HP Elite Dragonfly Max | |
| Lenovo ThinkPad X1 Titanium Yoga G1 20QB0016GE | |
| AIDA64 / FPU Mandel | |
| MSI Summit E13 Flip Evo A11MT | |
| Gemiddeld Intel Core i7-1260U (16988 - 17918, n=2) | |
| Dell Latitude 9330 | |
| HP Elite Dragonfly Max | |
| Dell Latitude 5310-23VP6 | |
| Lenovo ThinkPad X1 Titanium Yoga G1 20QB0016GE | |
| AIDA64 / CPU AES | |
| MSI Summit E13 Flip Evo A11MT | |
| HP Elite Dragonfly Max | |
| Lenovo ThinkPad X1 Titanium Yoga G1 20QB0016GE | |
| Gemiddeld Intel Core i7-1260U (33289 - 35061, n=2) | |
| Dell Latitude 9330 | |
| Dell Latitude 5310-23VP6 | |
| AIDA64 / CPU ZLib | |
| Gemiddeld Intel Core i7-1260U (506 - 586, n=2) | |
| Dell Latitude 9330 | |
| MSI Summit E13 Flip Evo A11MT | |
| Dell Latitude 5310-23VP6 | |
| HP Elite Dragonfly Max | |
| Lenovo ThinkPad X1 Titanium Yoga G1 20QB0016GE | |
| AIDA64 / FP64 Ray-Trace | |
| MSI Summit E13 Flip Evo A11MT | |
| Gemiddeld Intel Core i7-1260U (3666 - 3854, n=2) | |
| Dell Latitude 9330 | |
| HP Elite Dragonfly Max | |
| Dell Latitude 5310-23VP6 | |
| Lenovo ThinkPad X1 Titanium Yoga G1 20QB0016GE | |
| AIDA64 / CPU PhotoWorxx | |
| MSI Summit E13 Flip Evo A11MT | |
| HP Elite Dragonfly Max | |
| Gemiddeld Intel Core i7-1260U (37448 - 37790, n=2) | |
| Dell Latitude 9330 | |
| Lenovo ThinkPad X1 Titanium Yoga G1 20QB0016GE | |
| Dell Latitude 5310-23VP6 | |
Systeemprestaties
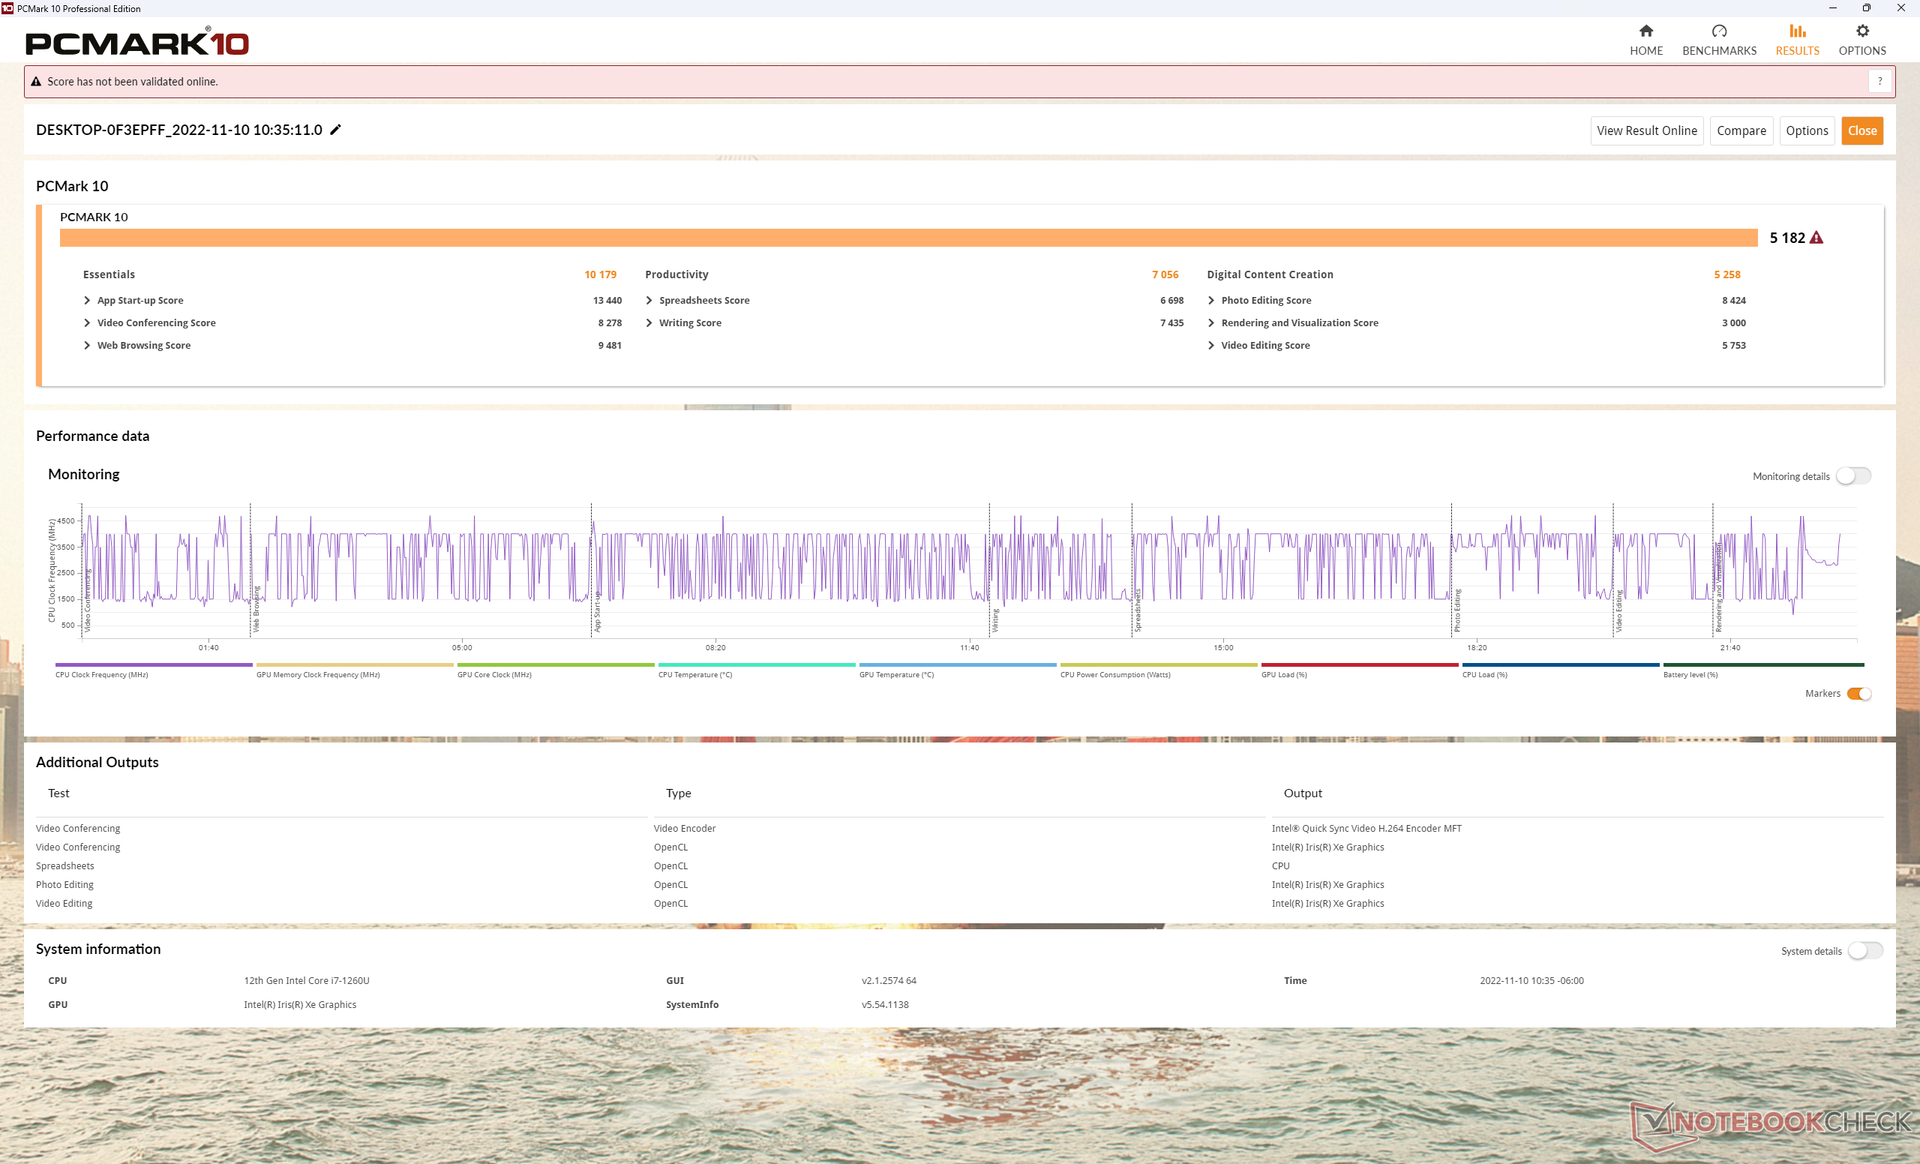
PCMark 10 resultaten zijn hoger dan op de meeste andere 13-inch subnotebooks te zijn een van de snelste in de categorie. Veel modellen in deze grootteklasse draaien meestal op CPU's met een lager TDP, zoals de ThinkPad X1 Yoga G1 voor uiteindelijk tragere prestaties.
| PCMark 10 / Score | |
| Gemiddeld Intel Core i7-1260U, Intel Iris Xe Graphics G7 96EUs (5182 - 5300, n=2) | |
| Dell Latitude 9330 | |
| HP Elite Dragonfly Max | |
| MSI Summit E13 Flip Evo A11MT | |
| Lenovo ThinkPad X1 Titanium Yoga G1 20QB0016GE | |
| HP EliteBook x360 1030 G7 | |
| Dell Latitude 5310-23VP6 | |
| PCMark 10 / Essentials | |
| HP Elite Dragonfly Max | |
| Dell Latitude 9330 | |
| Gemiddeld Intel Core i7-1260U, Intel Iris Xe Graphics G7 96EUs (9929 - 10179, n=2) | |
| Lenovo ThinkPad X1 Titanium Yoga G1 20QB0016GE | |
| HP EliteBook x360 1030 G7 | |
| Dell Latitude 5310-23VP6 | |
| MSI Summit E13 Flip Evo A11MT | |
| PCMark 10 / Productivity | |
| Gemiddeld Intel Core i7-1260U, Intel Iris Xe Graphics G7 96EUs (7056 - 7287, n=2) | |
| Dell Latitude 9330 | |
| MSI Summit E13 Flip Evo A11MT | |
| HP Elite Dragonfly Max | |
| Dell Latitude 5310-23VP6 | |
| HP EliteBook x360 1030 G7 | |
| Lenovo ThinkPad X1 Titanium Yoga G1 20QB0016GE | |
| PCMark 10 / Digital Content Creation | |
| Gemiddeld Intel Core i7-1260U, Intel Iris Xe Graphics G7 96EUs (5258 - 5584, n=2) | |
| Dell Latitude 9330 | |
| MSI Summit E13 Flip Evo A11MT | |
| HP Elite Dragonfly Max | |
| Lenovo ThinkPad X1 Titanium Yoga G1 20QB0016GE | |
| HP EliteBook x360 1030 G7 | |
| Dell Latitude 5310-23VP6 | |
| PCMark 10 Score | 5182 punten | |
Help | ||
| AIDA64 / Memory Copy | |
| Dell Latitude 9330 | |
| Gemiddeld Intel Core i7-1260U (68849 - 69994, n=2) | |
| HP Elite Dragonfly Max | |
| MSI Summit E13 Flip Evo A11MT | |
| Lenovo ThinkPad X1 Titanium Yoga G1 20QB0016GE | |
| Dell Latitude 5310-23VP6 | |
| AIDA64 / Memory Read | |
| HP Elite Dragonfly Max | |
| Dell Latitude 9330 | |
| Gemiddeld Intel Core i7-1260U (59219 - 60804, n=2) | |
| MSI Summit E13 Flip Evo A11MT | |
| Lenovo ThinkPad X1 Titanium Yoga G1 20QB0016GE | |
| Dell Latitude 5310-23VP6 | |
| AIDA64 / Memory Write | |
| HP Elite Dragonfly Max | |
| Dell Latitude 9330 | |
| Gemiddeld Intel Core i7-1260U (62367 - 63786, n=2) | |
| Lenovo ThinkPad X1 Titanium Yoga G1 20QB0016GE | |
| MSI Summit E13 Flip Evo A11MT | |
| Dell Latitude 5310-23VP6 | |
| AIDA64 / Memory Latency | |
| Dell Latitude 9330 | |
| Gemiddeld Intel Core i7-1260U (107.2 - 107.7, n=2) | |
| HP Elite Dragonfly Max | |
| Dell Latitude 5310-23VP6 | |
| MSI Summit E13 Flip Evo A11MT | |
| Lenovo ThinkPad X1 Titanium Yoga G1 20QB0016GE | |
* ... kleiner is beter
DPC latentie
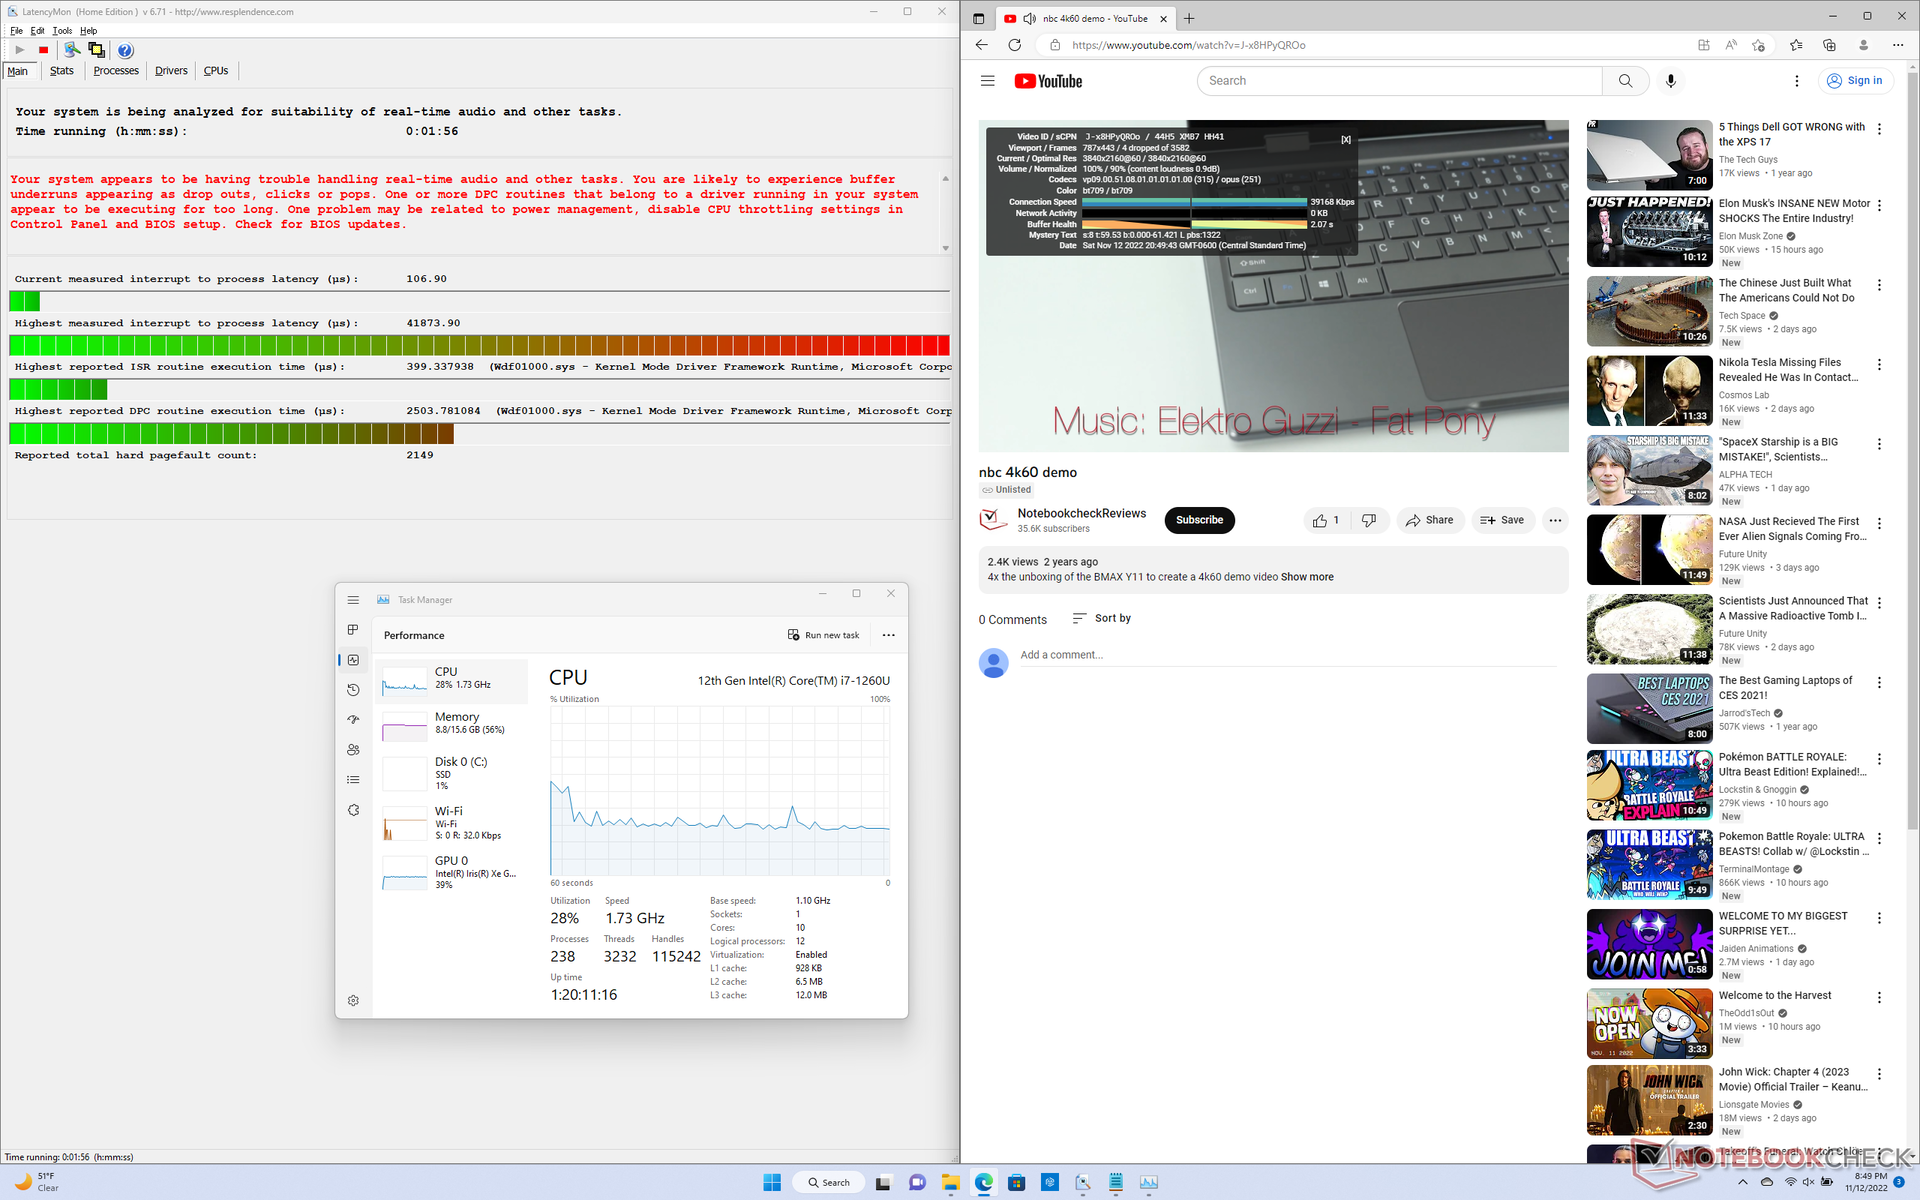
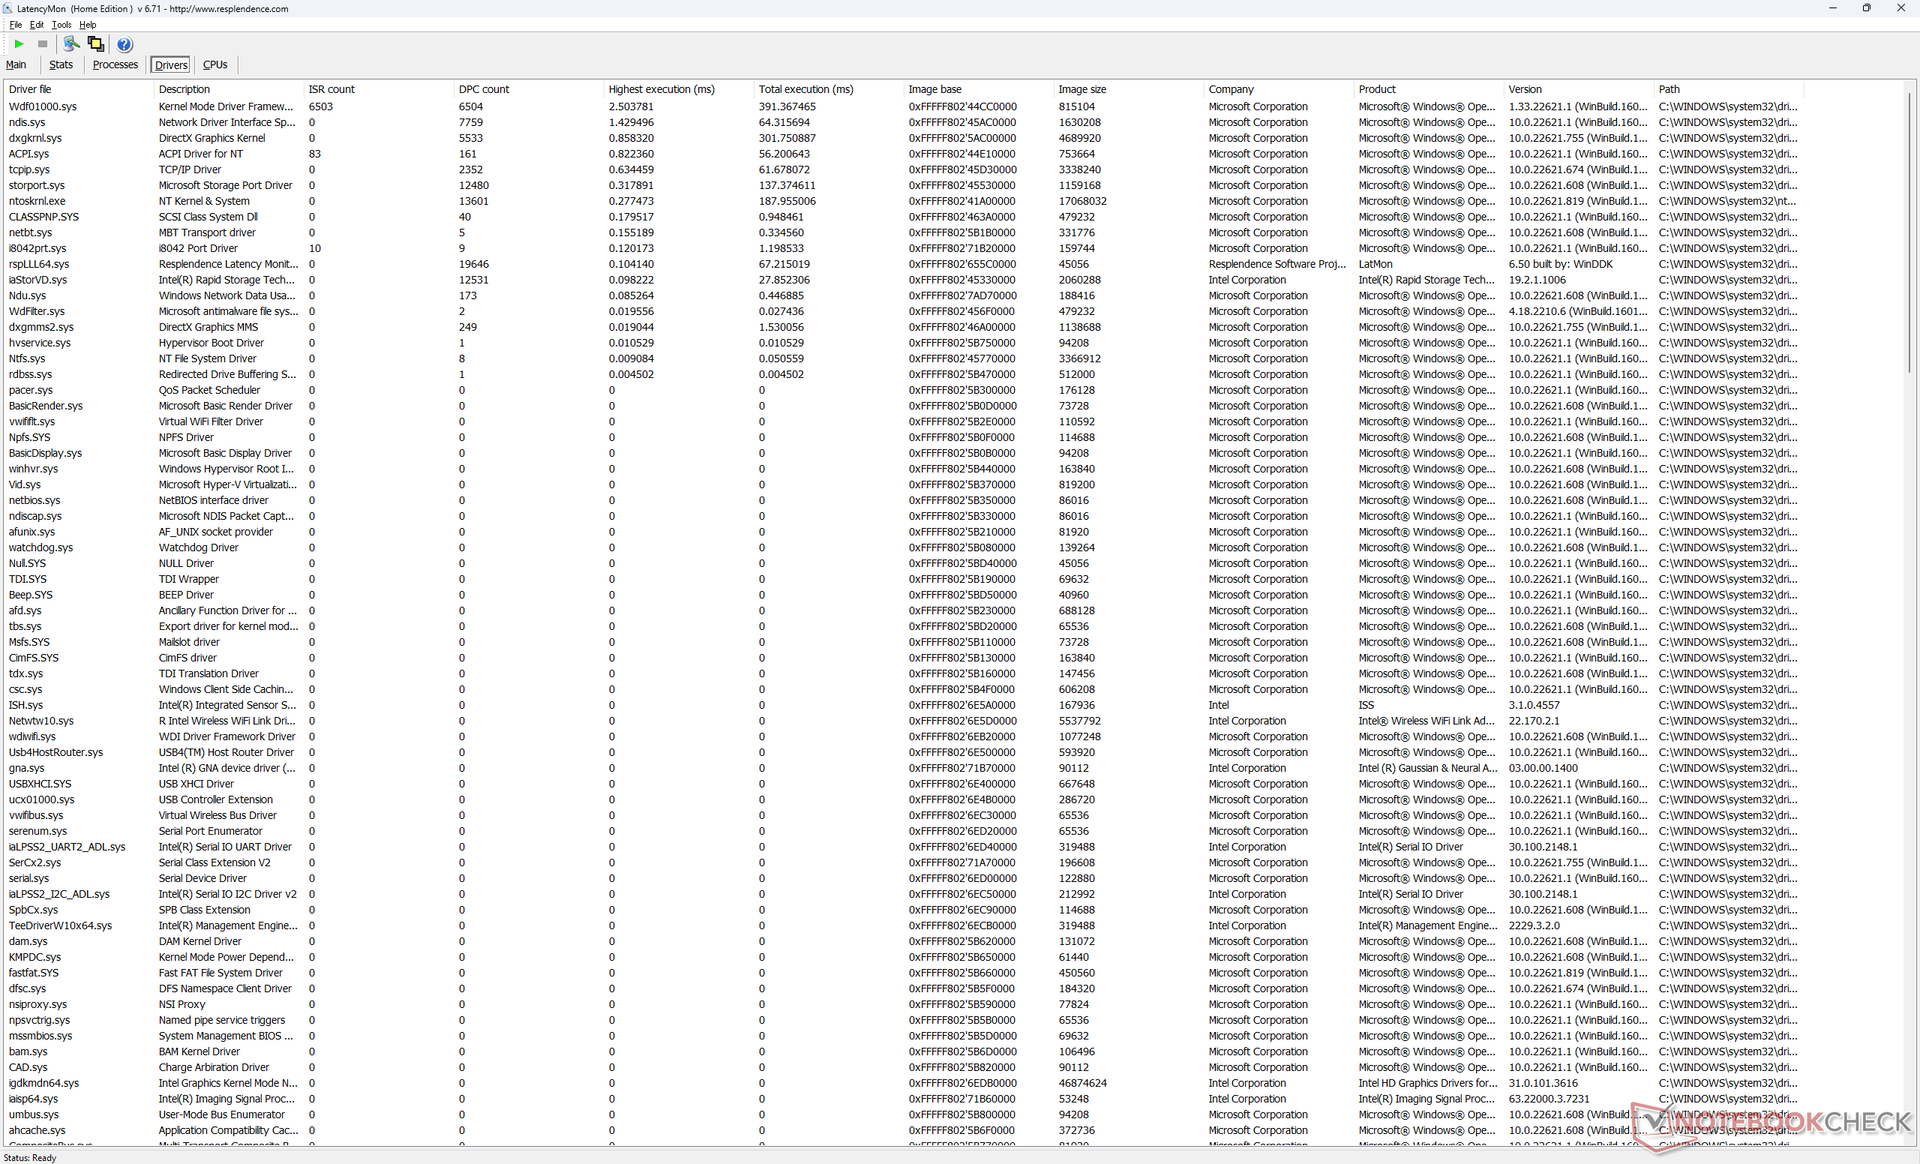
Ons toestel vertoonde grote DPC-problemen bij het openen van meerdere browsertabbladen van onze homepage, zelfs na meerdere hertests. 4K video afspelen bij 60 FPS is ook onvolmaakt met 4 dropped frames tijdens de minutenlange testvideo. De resultaten zijn teleurstellend om te zien van een high-end zakelijke laptop waar consistente prestaties belangrijk zijn.
| DPC Latencies / LatencyMon - interrupt to process latency (max), Web, Youtube, Prime95 | |
| Dell Latitude 9330 | |
| HP EliteBook x360 1030 G7 | |
| HP Elite Dragonfly Max | |
| MSI Summit E13 Flip Evo A11MT | |
| Lenovo ThinkPad X1 Titanium Yoga G1 20QB0016GE | |
| Dell Latitude 5310-23VP6 | |
* ... kleiner is beter
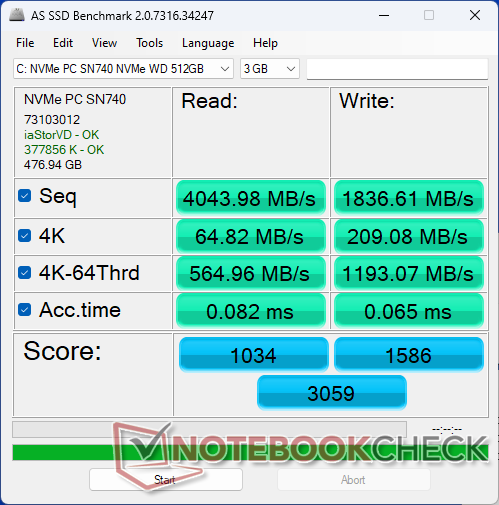
Opslagapparaten - alleen PCIe4 x4 2230
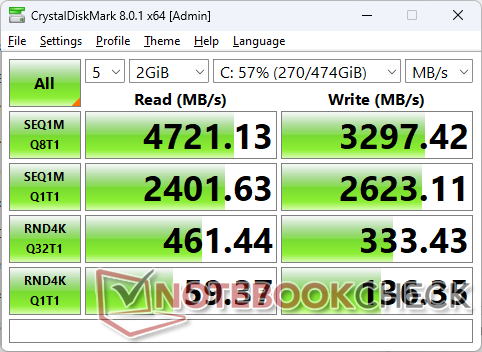
Onze testunit wordt geleverd met een 512 GB WD SN740 PCIe4 x4 NVMe SSD met stabiele sequentiële lees- en schrijfsnelheden tot respectievelijk 4700 MB/s en 3300 MB/s. Dit is een middelgrote schijf, aangezien de nieuwste PCIe4 x4-schijven van Samsung meer dan 7000 MB/s kunnen halen. Het systeem kan slechts één interne schijf ondersteunen, zonder secundaire opties.

| Drive Performance rating - Percent | |
| MSI Summit E13 Flip Evo A11MT | |
| Dell Latitude 9330 | |
| HP EliteBook x360 1030 G7 | |
| HP Elite Dragonfly Max | |
| Lenovo ThinkPad X1 Titanium Yoga G1 20QB0016GE | |
| Dell Latitude 5310-23VP6 | |
* ... kleiner is beter
Disk Throttling: DiskSpd Read Loop, Queue Depth 8
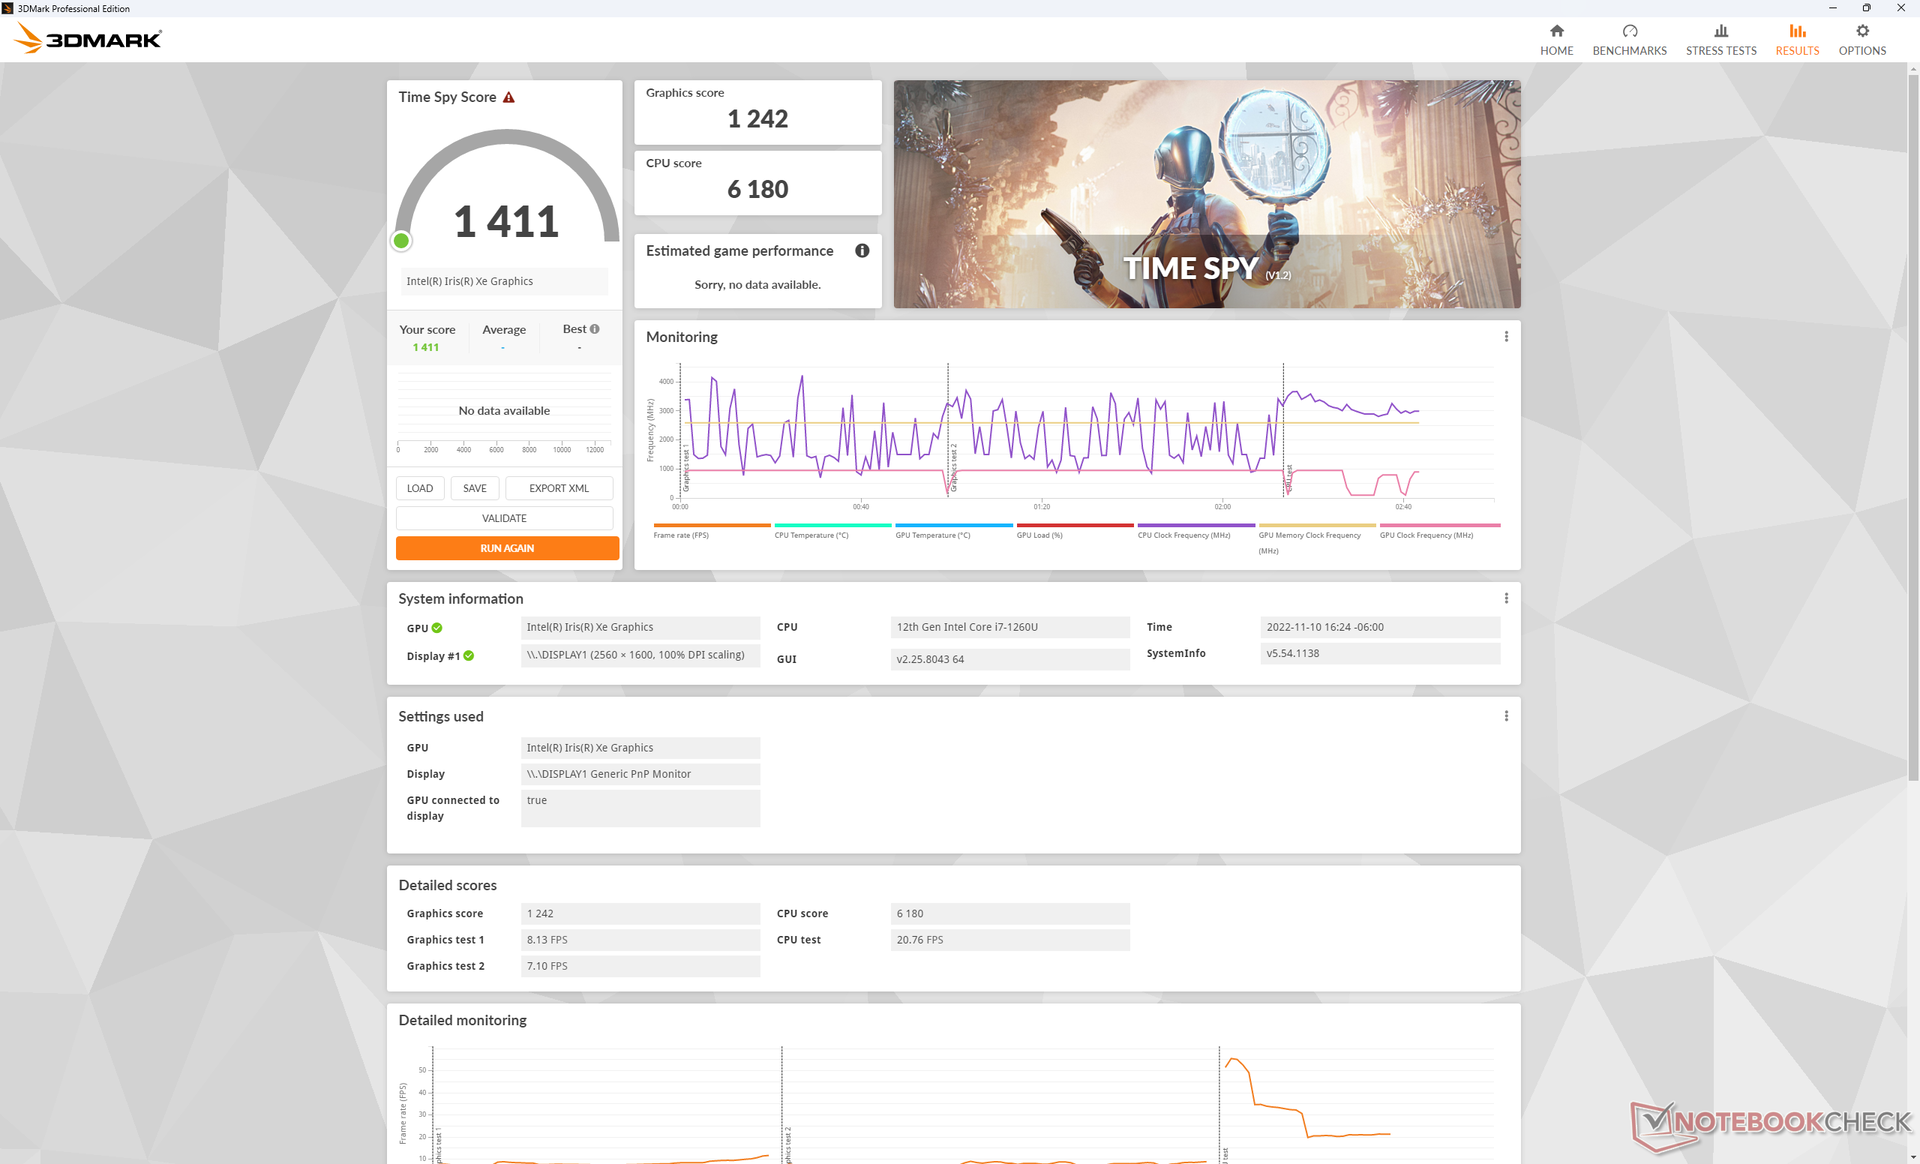
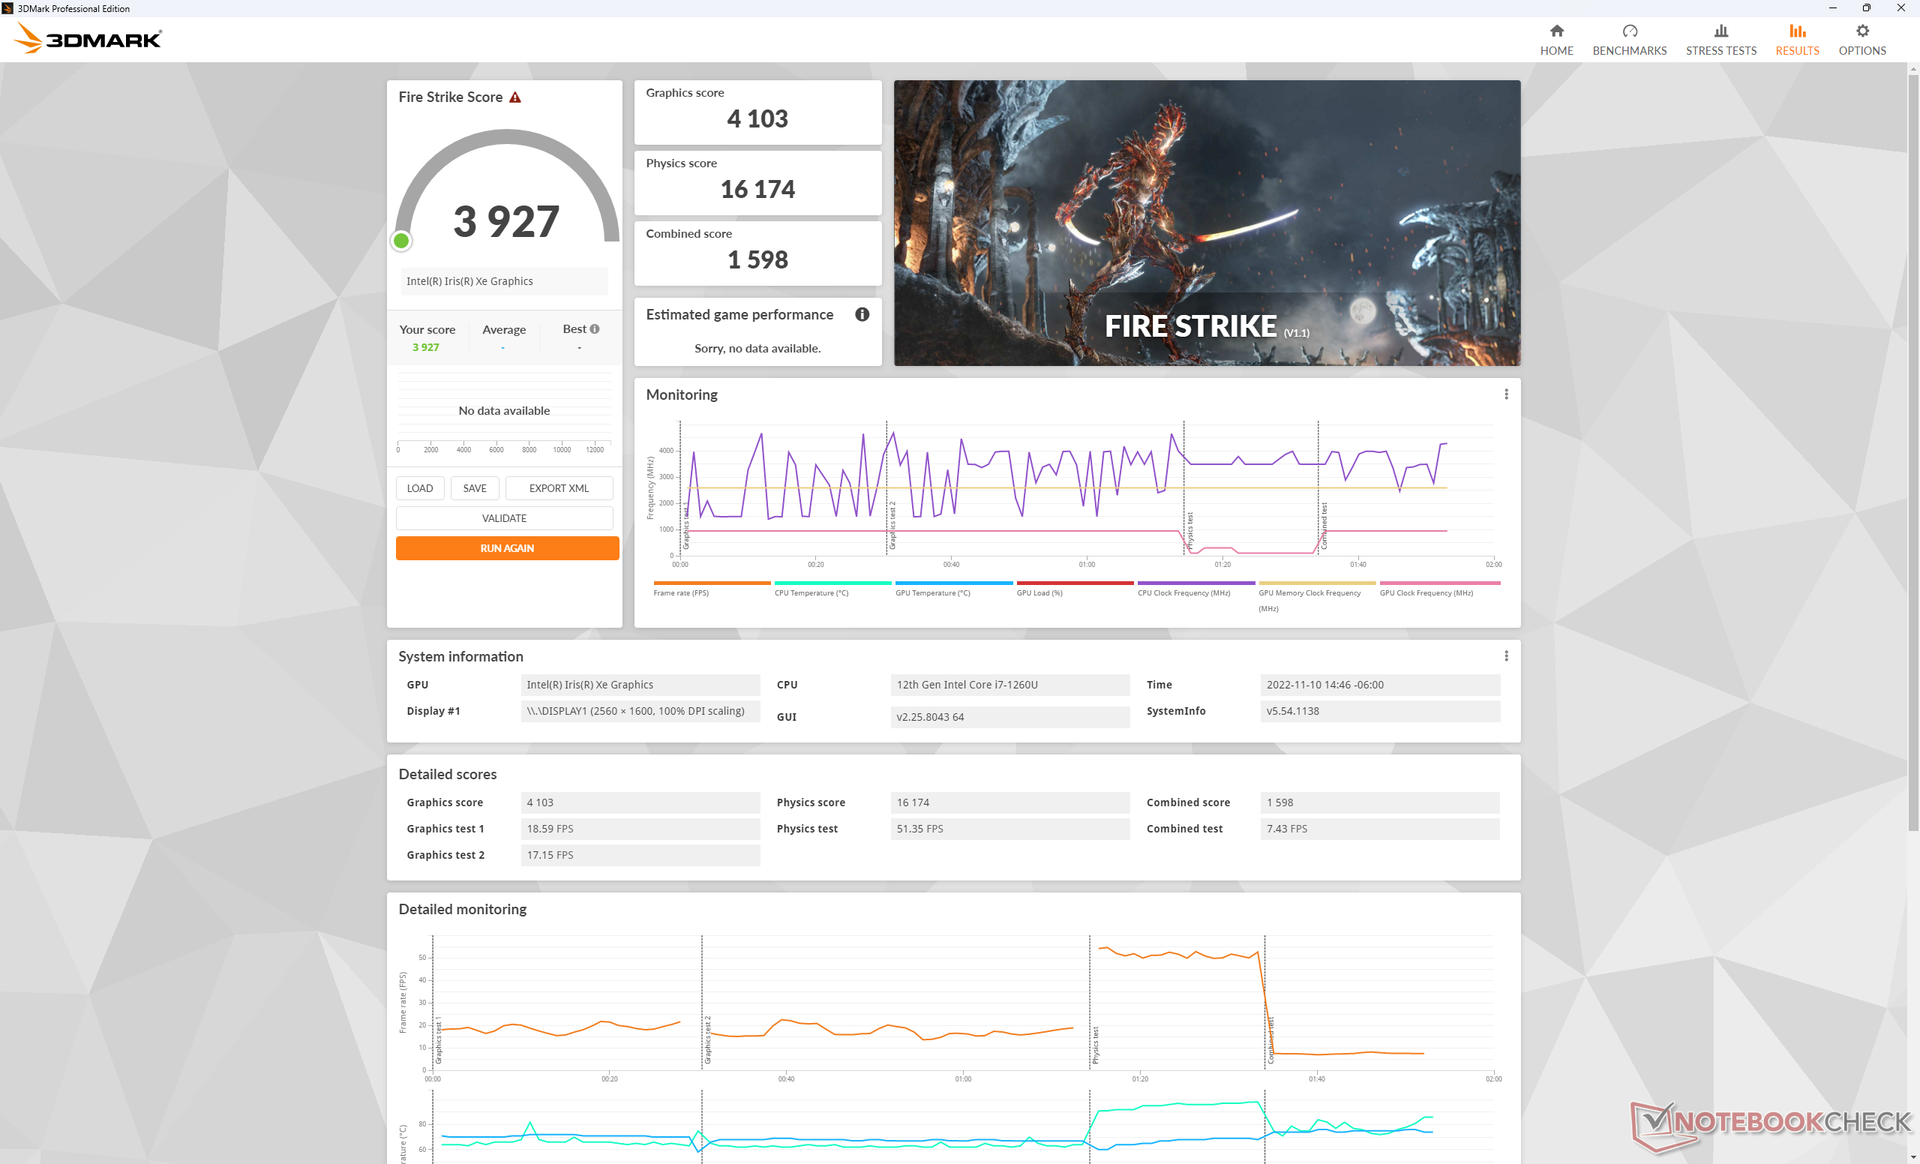
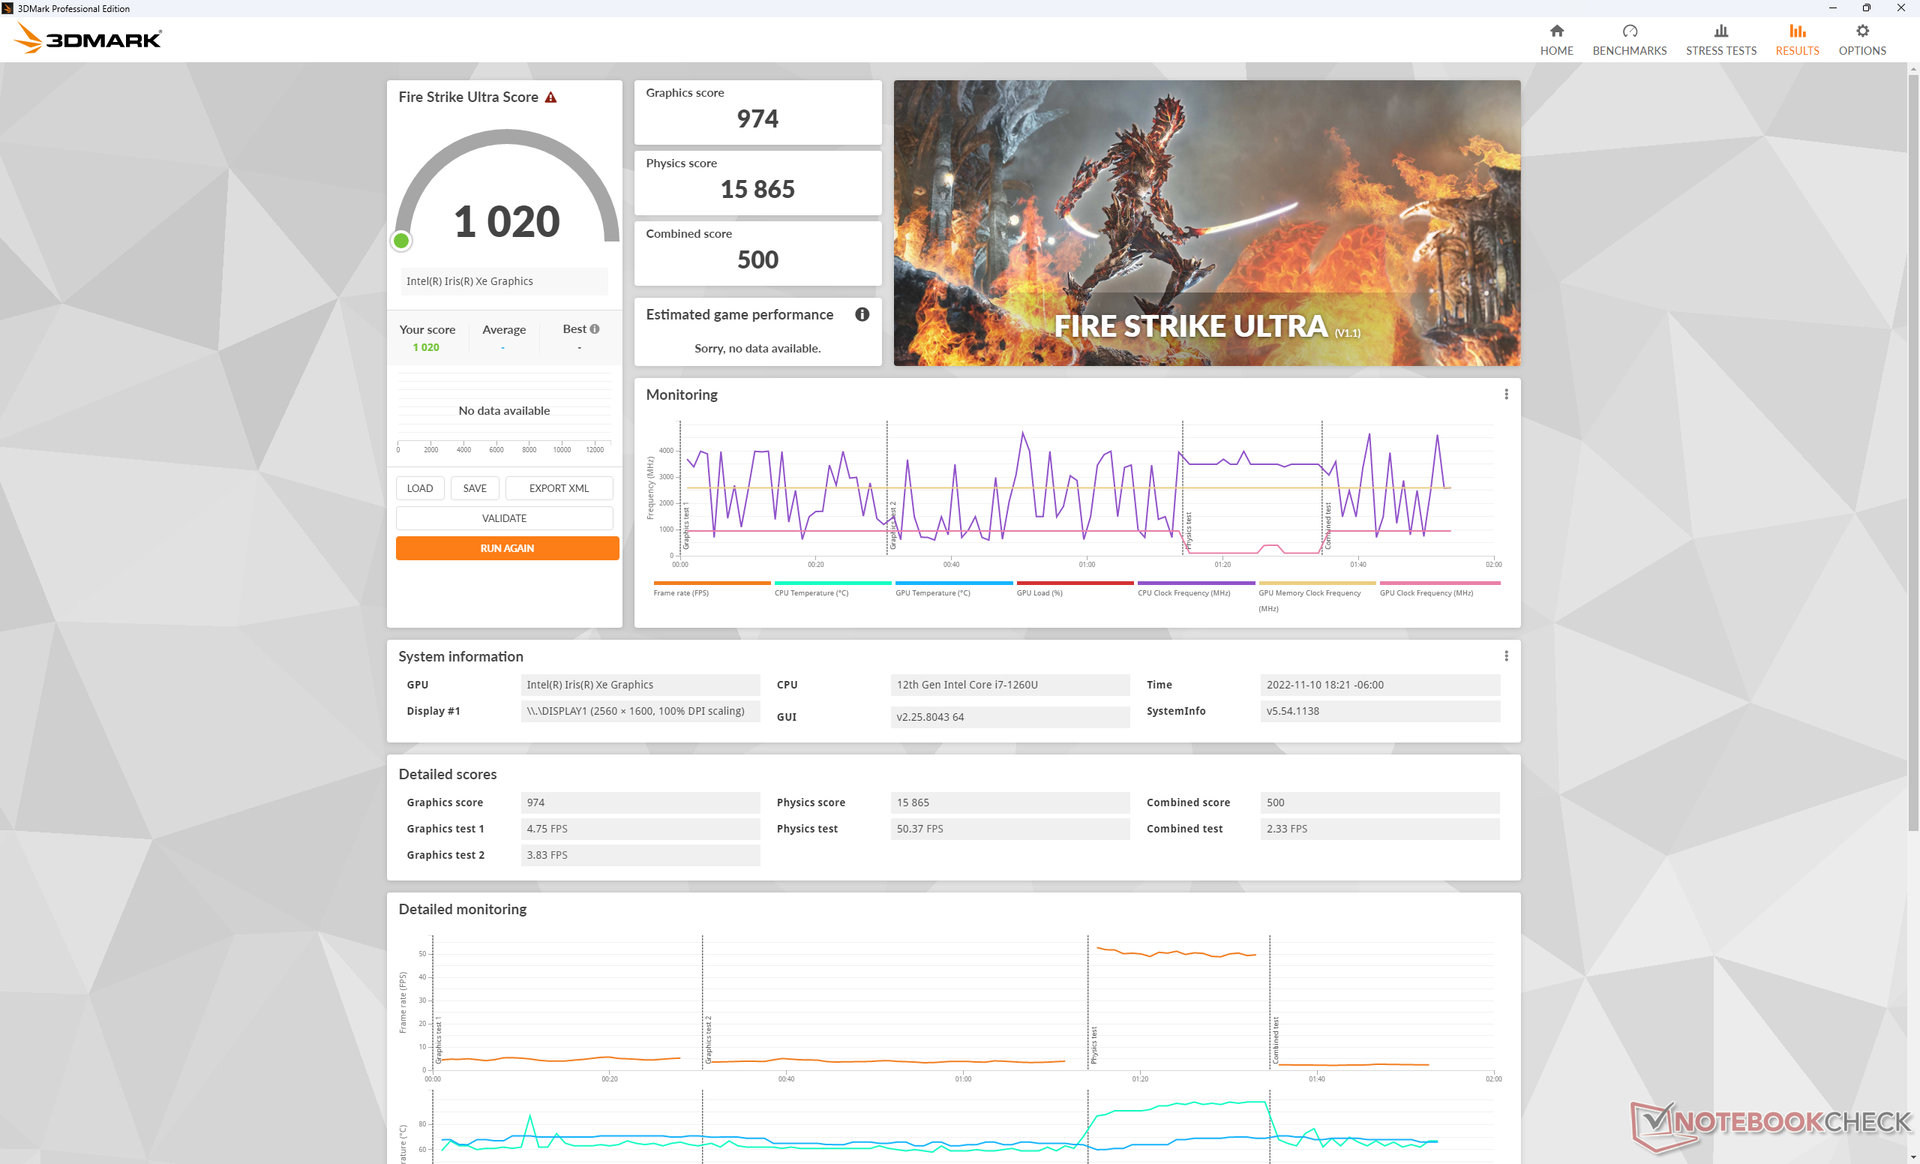
GPU-prestaties - Goed maar niet geweldig
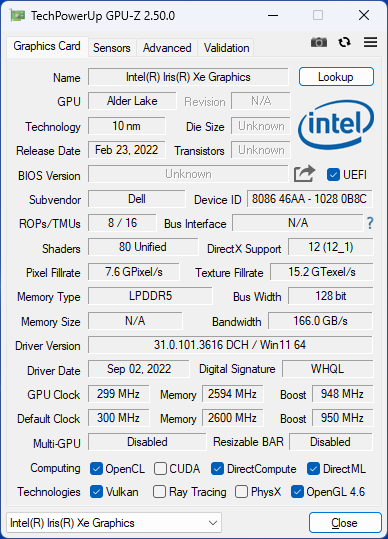
De grafische prestaties zijn 15 procent langzamer dan de gemiddelde laptop in onze database met dezelfde geïntegreerde Iris Xe 96 EUs GPU ondanks de ruime 32 GB LPDDR5-5200 RAM. De Latitude serie is niet ontworpen voor gaming en dus is deze achterstand geen groot probleem. De algemene prestaties liggen dichter bij de Iris Xe 80 EU's zoals gevonden op veel Core i5 CPU's
De meeste games zijn nog steeds speelbaar op de Latitude 9330, zij het alleen op lage instellingen.
| 3DMark 11 - 1280x720 Performance GPU | |
| Asus Zenbook S 13 OLED | |
| MSI Summit E13 Flip Evo A11MT | |
| Lenovo ThinkPad X1 Nano Gen 2 Core i7-1280P | |
| Gemiddeld Intel Iris Xe Graphics G7 96EUs (2867 - 7676, n=209) | |
| HP Spectre x360 13.5 14t-ef000 | |
| Lenovo ThinkBook 13s G3 20YA0005GE | |
| Lenovo Yoga 6 13ALC6 | |
| Lenovo IdeaPad Flex 5i 14IAU7 | |
| Samsung Galaxy Book2 Pro 13 NP930XED-KA1DE | |
| HP Elite Dragonfly Max | |
| Dell Latitude 9330 | |
| Lenovo ThinkPad X1 Titanium Yoga G1 20QB0016GE | |
| HP EliteBook x360 1030 G7 | |
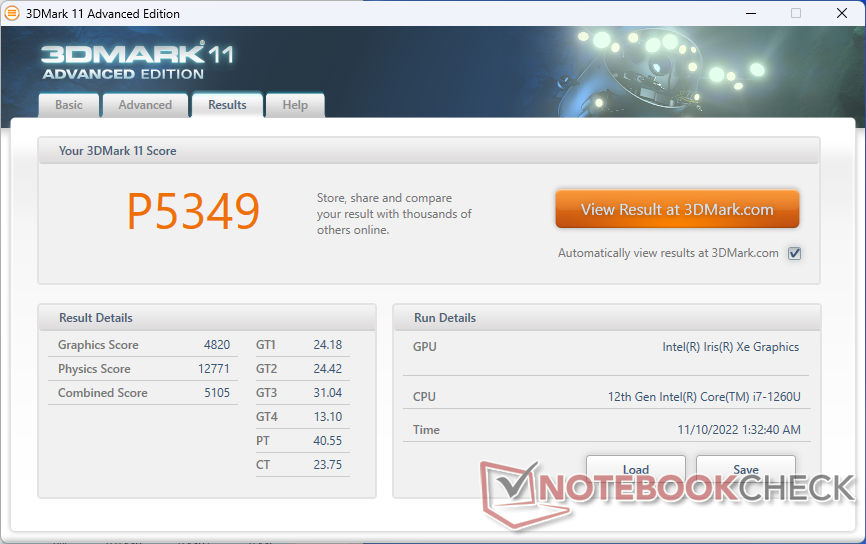
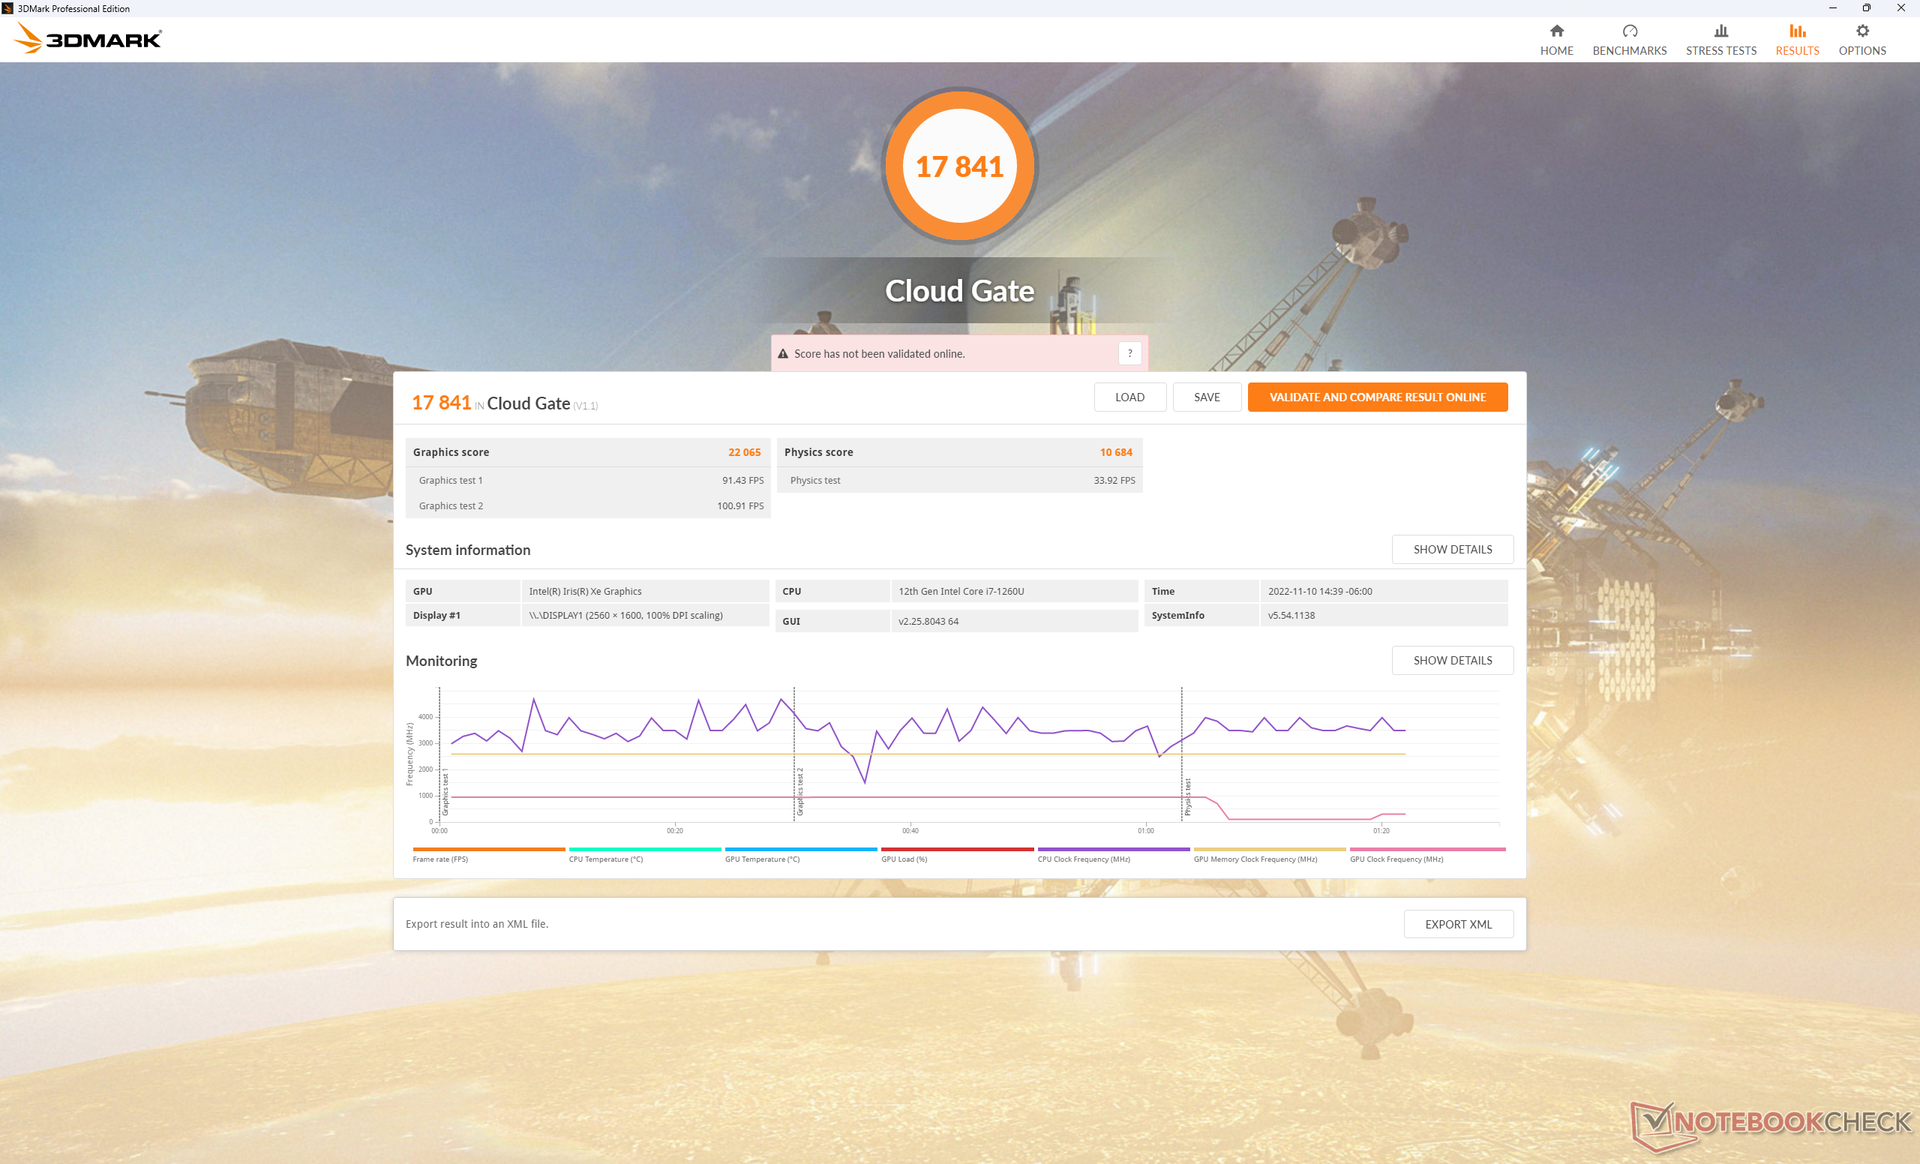
| 3DMark 11 Performance | 5349 punten | |
| 3DMark Cloud Gate Standard Score | 17841 punten | |
| 3DMark Fire Strike Score | 3927 punten | |
| 3DMark Time Spy Score | 1411 punten | |
Help | ||
| Blender - v3.3 Classroom CPU | |
| Dell Latitude 9330 | |
| Gemiddeld Intel Iris Xe Graphics G7 96EUs (336 - 1259, n=109) | |
* ... kleiner is beter
| Performance rating - Percent | |
| MSI Summit E13 Flip Evo A11MT | |
| Dell Latitude 9330 | |
| HP Elite Dragonfly Max -1! | |
| Lenovo ThinkPad X1 Titanium Yoga G1 20QB0016GE -3! | |
| HP EliteBook x360 1030 G7 -3! | |
| Dell Latitude 5310-23VP6 -4! | |
| The Witcher 3 - 1920x1080 Ultra Graphics & Postprocessing (HBAO+) | |
| MSI Summit E13 Flip Evo A11MT | |
| HP Elite Dragonfly Max | |
| Dell Latitude 9330 | |
| Lenovo ThinkPad X1 Titanium Yoga G1 20QB0016GE | |
| GTA V - 1920x1080 Highest AA:4xMSAA + FX AF:16x | |
| MSI Summit E13 Flip Evo A11MT | |
| Dell Latitude 9330 | |
| Final Fantasy XV Benchmark - 1920x1080 High Quality | |
| MSI Summit E13 Flip Evo A11MT | |
| Dell Latitude 9330 | |
| HP Elite Dragonfly Max | |
| HP EliteBook x360 1030 G7 | |
| Strange Brigade - 1920x1080 ultra AA:ultra AF:16 | |
| MSI Summit E13 Flip Evo A11MT | |
| Dell Latitude 9330 | |
| HP Elite Dragonfly Max | |
| Dota 2 Reborn - 1920x1080 ultra (3/3) best looking | |
| Dell Latitude 9330 | |
| MSI Summit E13 Flip Evo A11MT | |
| Lenovo ThinkPad X1 Titanium Yoga G1 20QB0016GE | |
| HP Elite Dragonfly Max | |
| HP EliteBook x360 1030 G7 | |
| Dell Latitude 5310-23VP6 | |
| X-Plane 11.11 - 1920x1080 high (fps_test=3) | |
| MSI Summit E13 Flip Evo A11MT | |
| Dell Latitude 9330 | |
| HP Elite Dragonfly Max | |
| Lenovo ThinkPad X1 Titanium Yoga G1 20QB0016GE | |
| HP EliteBook x360 1030 G7 | |
| Dell Latitude 5310-23VP6 | |
Witcher 3 FPS Chart
| lage | gem. | hoge | ultra | |
|---|---|---|---|---|
| GTA V (2015) | 102.1 | 91.1 | 21.7 | 8.94 |
| The Witcher 3 (2015) | 75.8 | 47.2 | 25.9 | 11.4 |
| Dota 2 Reborn (2015) | 100.3 | 80.1 | 58.6 | 53.4 |
| Final Fantasy XV Benchmark (2018) | 37.3 | 21 | 14.6 | |
| X-Plane 11.11 (2018) | 37.1 | 34.4 | 30.8 | |
| Strange Brigade (2018) | 69.1 | 32.4 | 25 | 20.4 |
| Cyberpunk 2077 1.6 (2022) | 17.5 | 14.5 | 11.2 | 8.9 |
Emissies
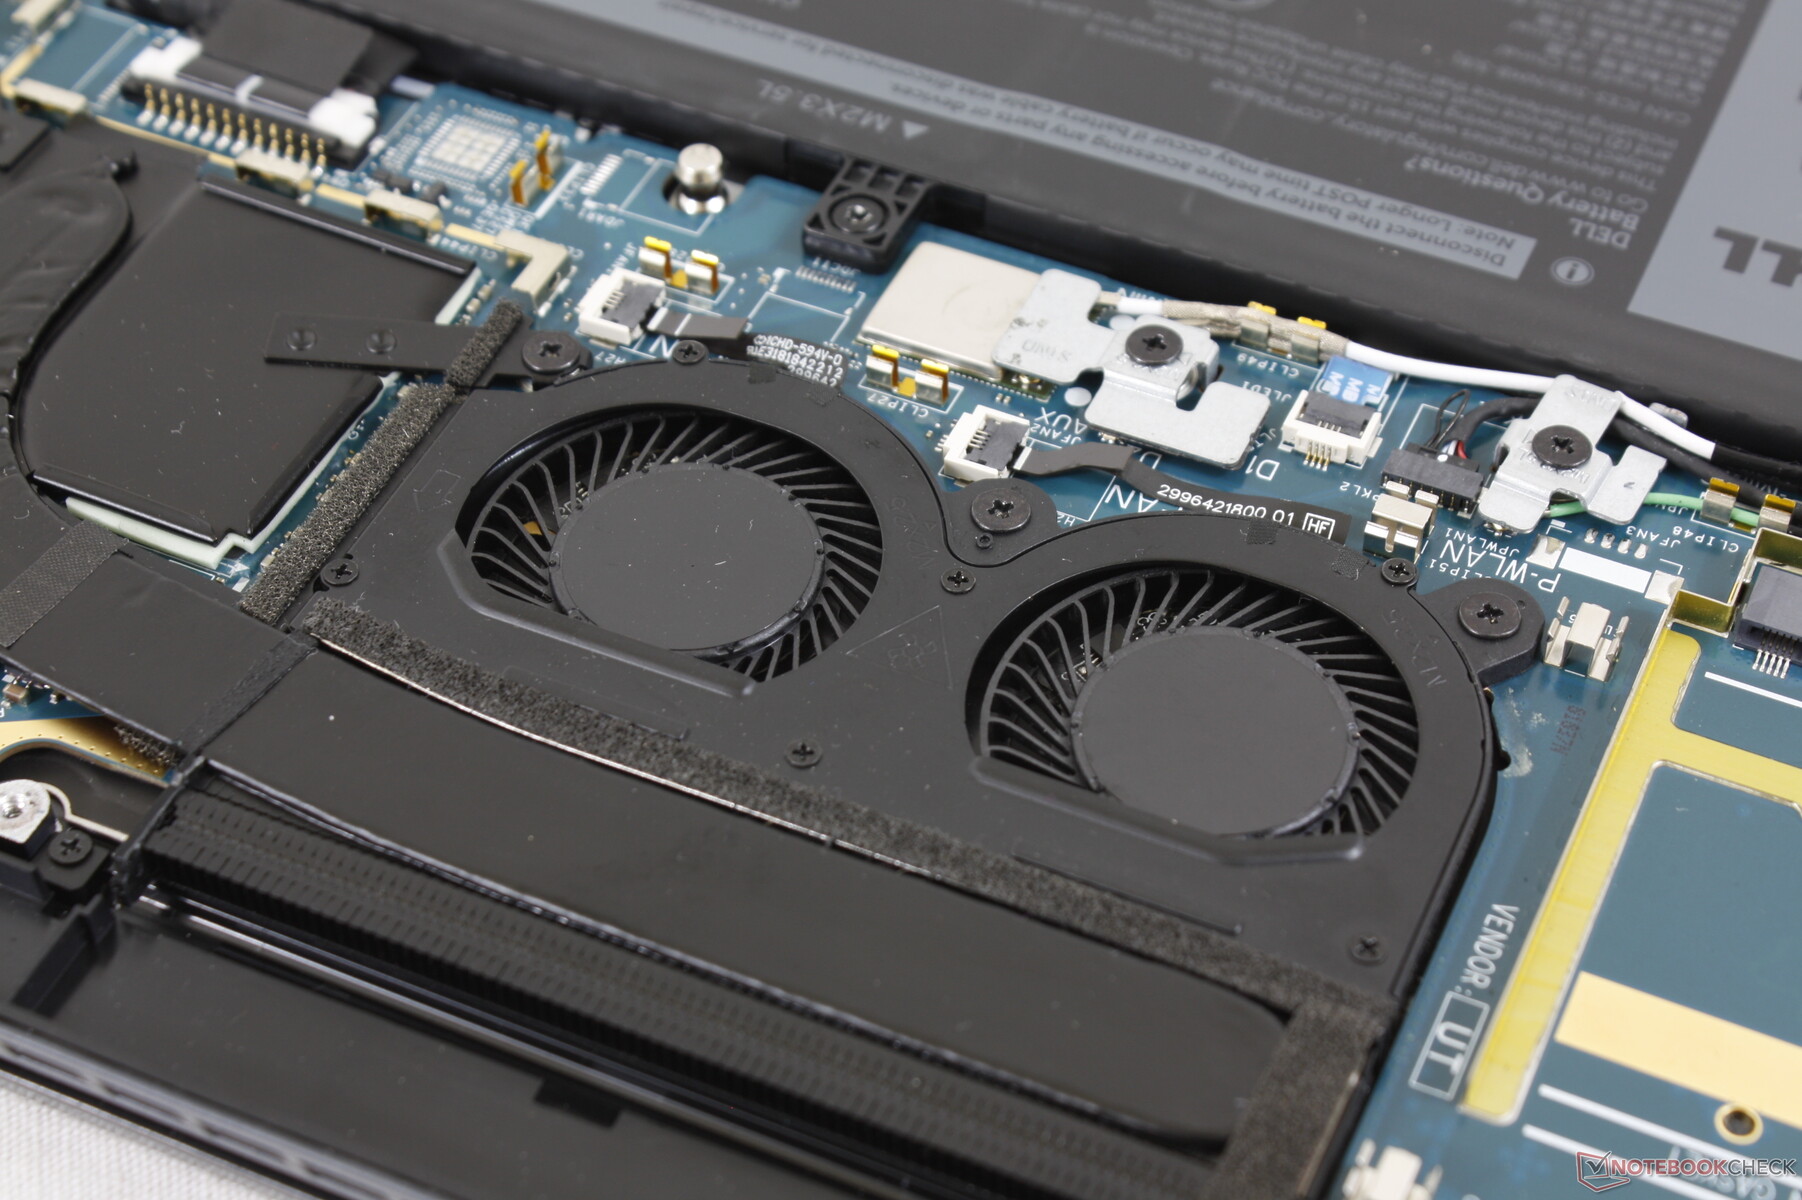
Systeemgeluid - Ventilatoren met hoge tonen
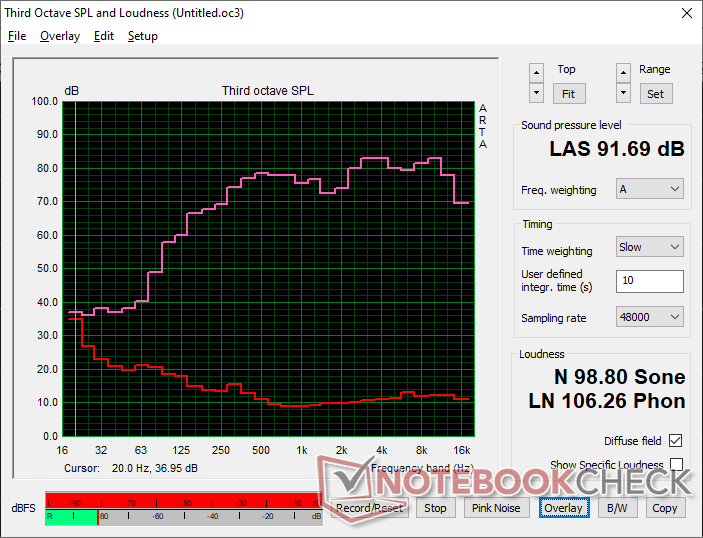
De twee interne ventilatoren zijn vrij klein, elk met een diameter van slechts 30 mm, vergeleken met 40 mm of meer op de meeste andere laptops. Het belangrijkste nadeel van kleinere ventilatoren is dat ze over het algemeen hogere tonen hebben dan grotere en dus meer opvallen als ze actief zijn. Onze microfoonmetingen hieronder bevestigen het hogere geluid met een relatief scherpe piek van ongeveer 3k Hz in vergelijking met de bredere pieken van andere 13-inch subnotebooks zoals de XPS 13 Plus 9320. Met andere woorden, de ventilatoren in de Latitude 9330 zullen eerder afleiden tijdens het surfen op het web of het streamen van video.
Bij het uitvoeren van 3DMark 06 nam het geluid van de ventilator sterk toe van stil naar 37 dB(A) ongeveer halverwege de eerste benchmarkscène. De Dell is veel luider dan wat we registreerden op deHP Dragonfly Max terwijl hij op gelijke hoogte staat met de Summit E13 Flip. We raden aan het systeem op Quiet of Balanced mode te zetten om het pulseren van de ventilator tot een minimum te beperken.
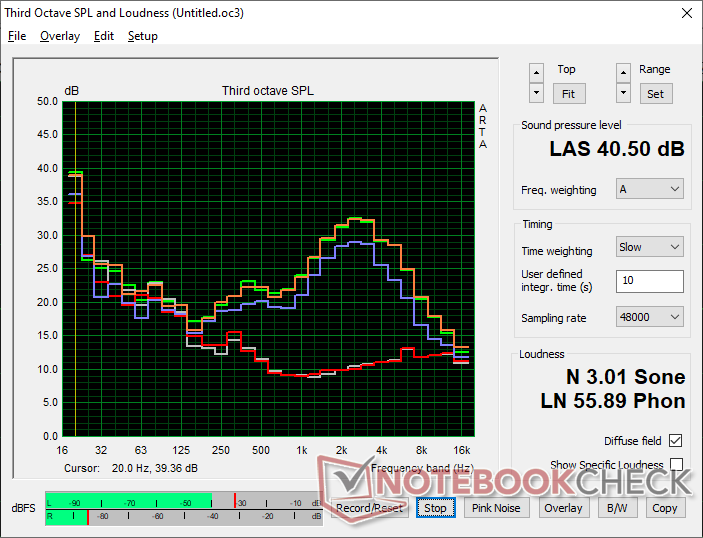
Geluidsniveau
| Onbelast |
| 23 / 23.1 / 23.1 dB (A) |
| Belasting |
| 37.1 / 40.5 dB (A) |
 | ||
30 dB stil 40 dB(A) hoorbaar 50 dB(A) luid |
||
min: | ||
| Dell Latitude 9330 Iris Xe G7 96EUs, i7-1260U | Lenovo ThinkPad X1 Titanium Yoga G1 20QB0016GE Iris Xe G7 80EUs, i5-1140G7, Lenovo UMIS RPJTJ256MEE1OWX | MSI Summit E13 Flip Evo A11MT Iris Xe G7 96EUs, i7-1185G7, Phison 1TB SM2801T24GKBB4S-E162 | HP EliteBook x360 1030 G7 UHD Graphics 620, i7-10810U, Samsung SSD PM981a MZVLB512HBJQ | HP Elite Dragonfly Max Iris Xe G7 96EUs, i7-1185G7, Toshiba XG6 KXG60ZNV512G | Dell Latitude 5310-23VP6 UHD Graphics 620, i5-10310U, SK hynix BC511 HFM512GDHTNI-87A0B | |
|---|---|---|---|---|---|---|
| Noise | -9% | -8% | -13% | 5% | 1% | |
| uit / omgeving * (dB) | 23 | 25.61 -11% | 24.5 -7% | 28.1 -22% | 24.9 -8% | 24.9 -8% |
| Idle Minimum * (dB) | 23 | 25.61 -11% | 24.7 -7% | 28.1 -22% | 24.9 -8% | 24.9 -8% |
| Idle Average * (dB) | 23.1 | 25.61 -11% | 24.7 -7% | 28.1 -22% | 24.9 -8% | 24.9 -8% |
| Idle Maximum * (dB) | 23.1 | 25.61 -11% | 26.4 -14% | 28.1 -22% | 24.9 -8% | 24.9 -8% |
| Load Average * (dB) | 37.1 | 40.14 -8% | 37.8 -2% | 35.1 5% | 29.7 20% | 30 19% |
| Witcher 3 ultra * (dB) | 40.6 | 41.4 -2% | 31.3 23% | 36 11% | ||
| Load Maximum * (dB) | 40.5 | 40.14 1% | 48.8 -20% | 37.6 7% | 31.3 23% | 36.3 10% |
* ... kleiner is beter
Temperatuur
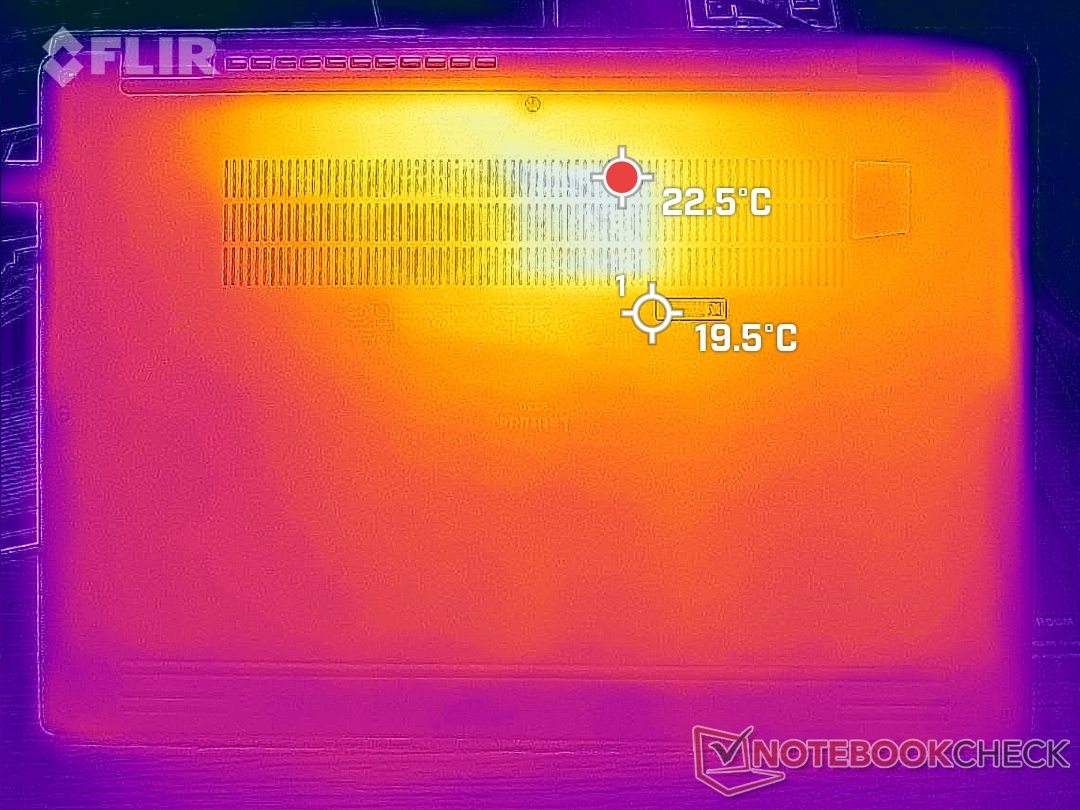
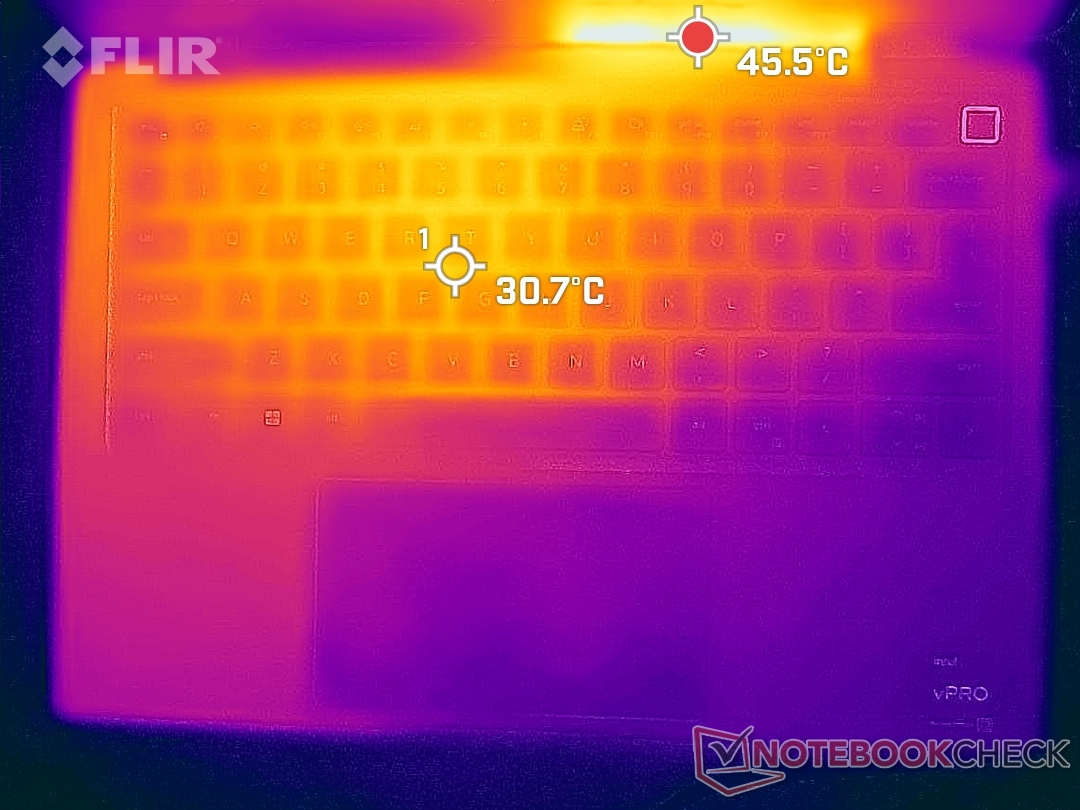
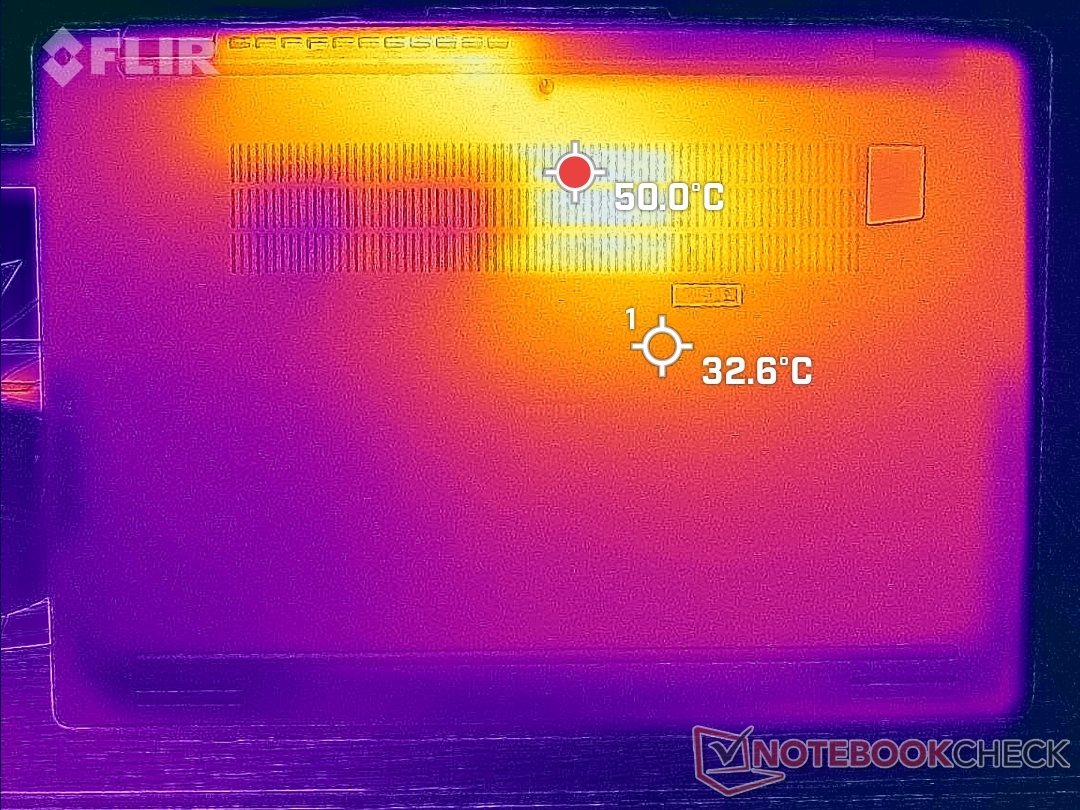
De oppervlaktetemperaturen zijn zeer koel bij lage belastingen, aangezien het grootste deel van het chassis uit metaal bestaat. Bij hogere belastingen kunnen de hete plekken echter oplopen tot respectievelijk 41 C en 50 C aan de boven- en onderkant. De hete plekken bevinden zich aan de achterkant van het chassis, zodat het toetsenbord en de palmsteunen koeler blijven voor comfortabel typen. De concurrerende Dragonfly Max bereikt vergelijkbare maxima, terwijl de Summit E13 Flip nog warmer kan worden tot 57 C.
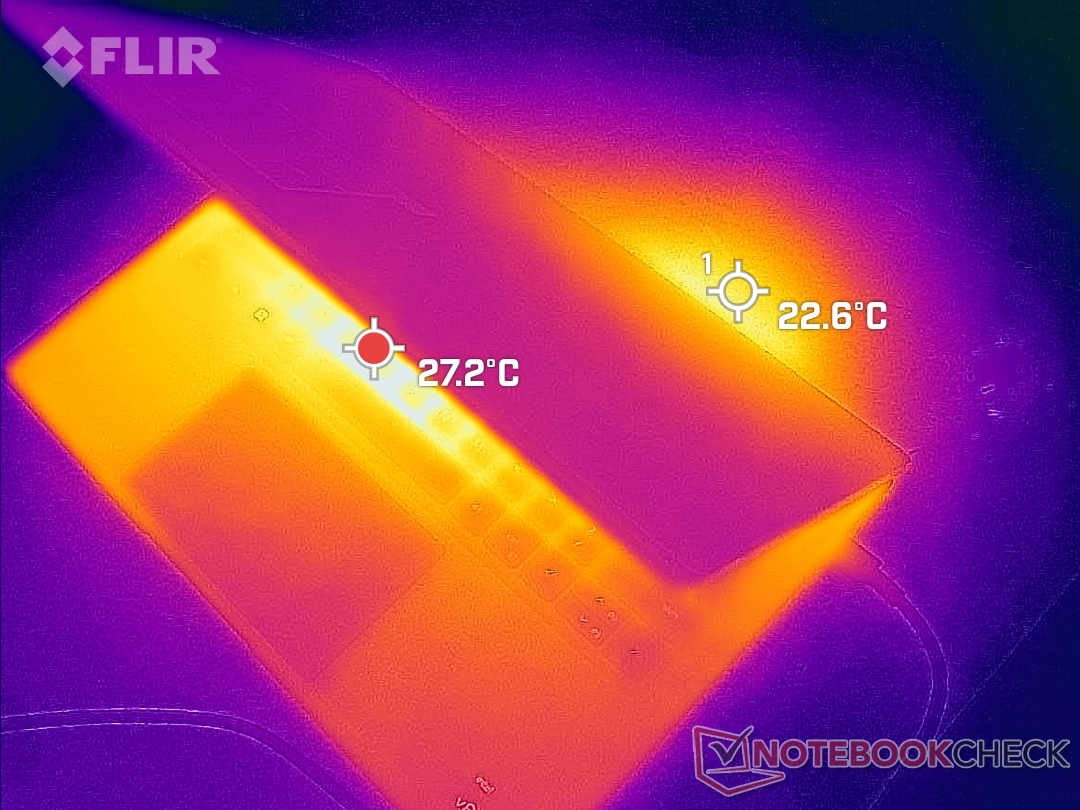
(±) De maximumtemperatuur aan de bovenzijde bedraagt 40.6 °C / 105 F, vergeleken met het gemiddelde van 35.4 °C / 96 F, variërend van 19.6 tot 60 °C voor de klasse Convertible.
(-) De bodem warmt op tot een maximum van 50.2 °C / 122 F, vergeleken met een gemiddelde van 36.9 °C / 98 F
(+) Bij onbelast gebruik bedraagt de gemiddelde temperatuur voor de bovenzijde 23.5 °C / 74 F, vergeleken met het apparaatgemiddelde van 30.3 °C / 87 F.
(+) De palmsteunen en het touchpad zijn met een maximum van ###max## °C / 82.4 F koeler dan de huidtemperatuur en voelen daarom koel aan.
(±) De gemiddelde temperatuur van de handpalmsteun van soortgelijke toestellen bedroeg 28 °C / 82.4 F (0 °C / 0 F).

| Dell Latitude 9330 Intel Core i7-1260U, Intel Iris Xe Graphics G7 96EUs | Lenovo ThinkPad X1 Titanium Yoga G1 20QB0016GE Intel Core i5-1140G7, Intel Iris Xe Graphics G7 80EUs | MSI Summit E13 Flip Evo A11MT Intel Core i7-1185G7, Intel Iris Xe Graphics G7 96EUs | HP EliteBook x360 1030 G7 Intel Core i7-10810U, Intel UHD Graphics 620 | HP Elite Dragonfly Max Intel Core i7-1185G7, Intel Iris Xe Graphics G7 96EUs | Dell Latitude 5310-23VP6 Intel Core i5-10310U, Intel UHD Graphics 620 | |
|---|---|---|---|---|---|---|
| Heat | -3% | -22% | -2% | -11% | 6% | |
| Maximum Upper Side * (°C) | 40.6 | 46.3 -14% | 52 -28% | 37 9% | 39.4 3% | 39 4% |
| Maximum Bottom * (°C) | 50.2 | 43.3 14% | 57.4 -14% | 47.2 6% | 50 -0% | 44.8 11% |
| Idle Upper Side * (°C) | 25 | 26.8 -7% | 30.4 -22% | 25.8 -3% | 31.6 -26% | 24.3 3% |
| Idle Bottom * (°C) | 27.6 | 28.3 -3% | 34.2 -24% | 32.6 -18% | 33.4 -21% | 25.6 7% |
* ... kleiner is beter
Stresstest
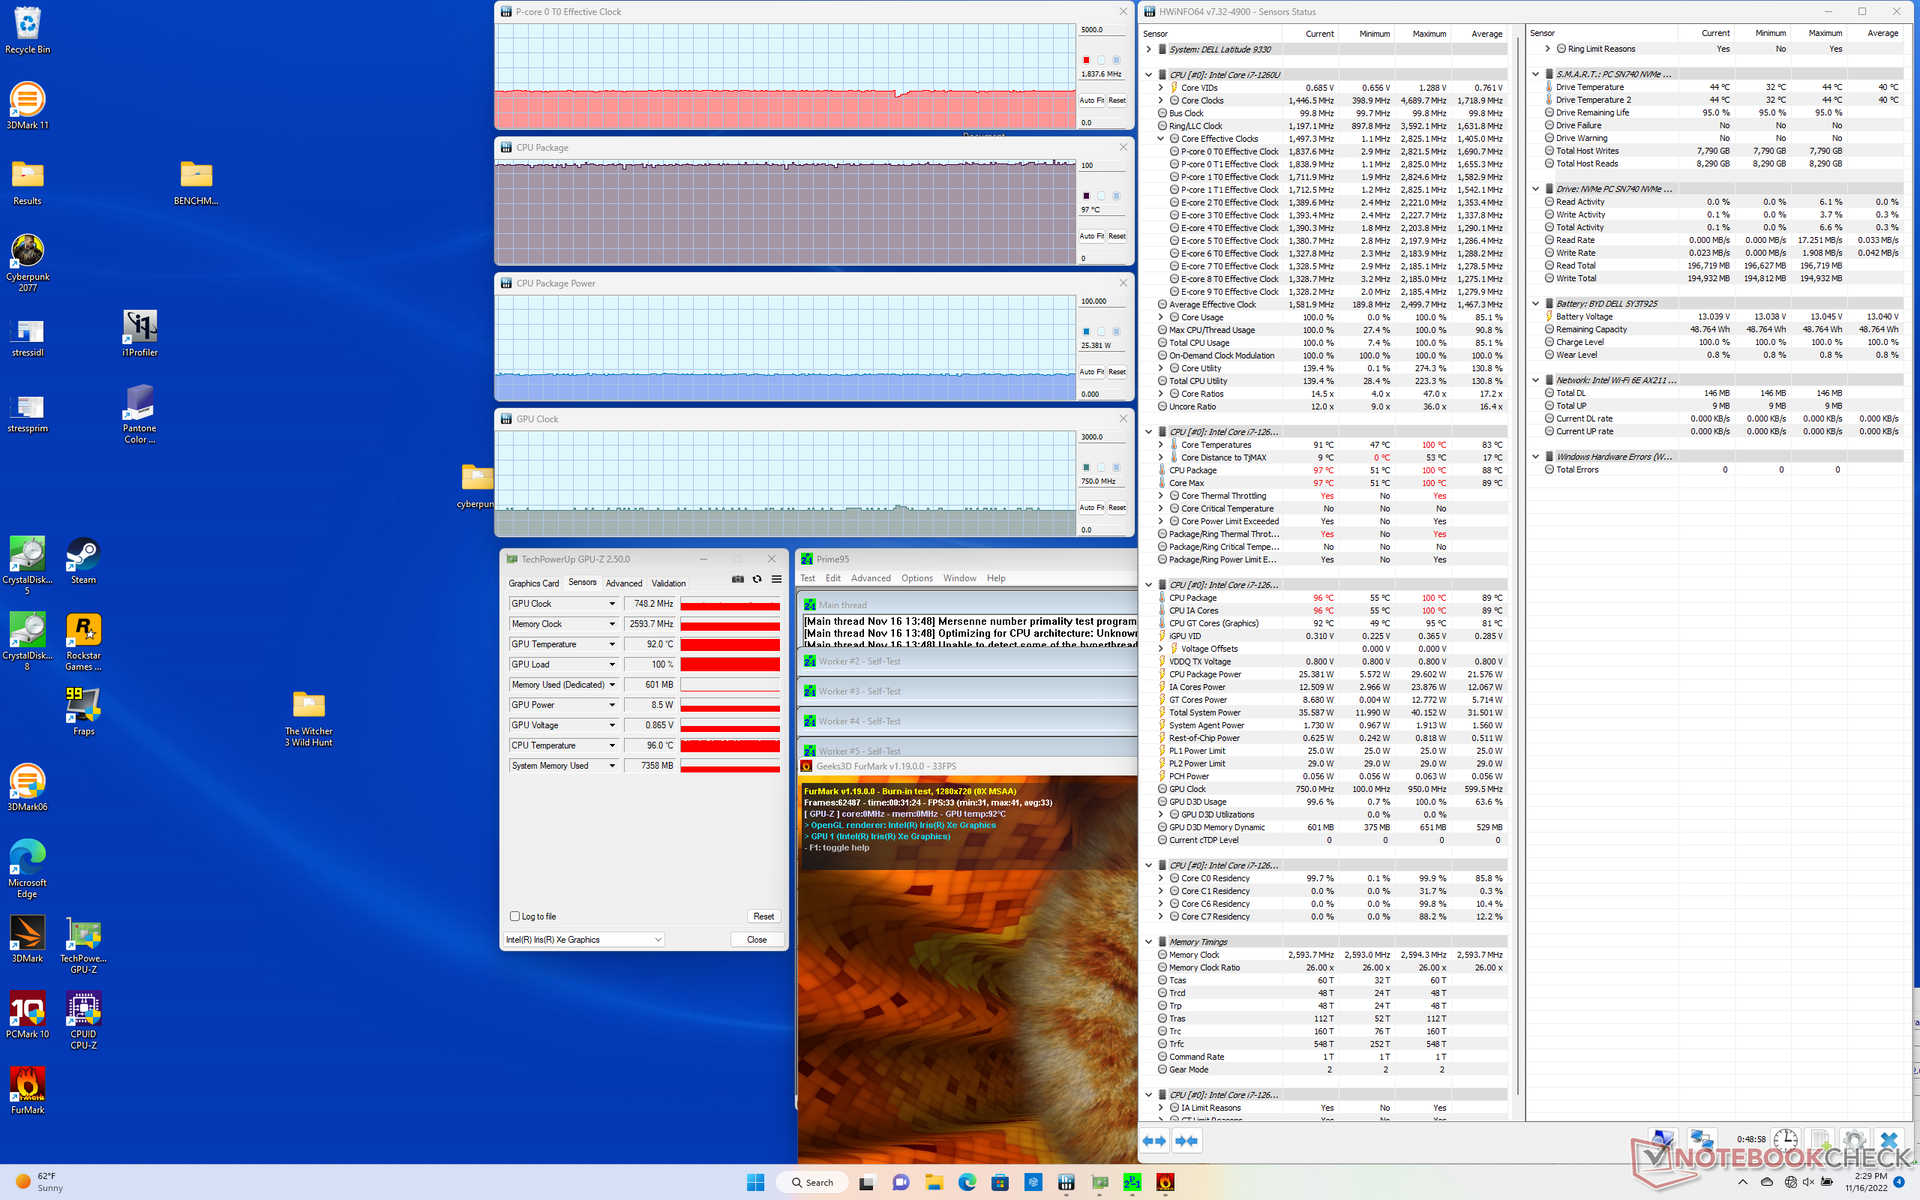
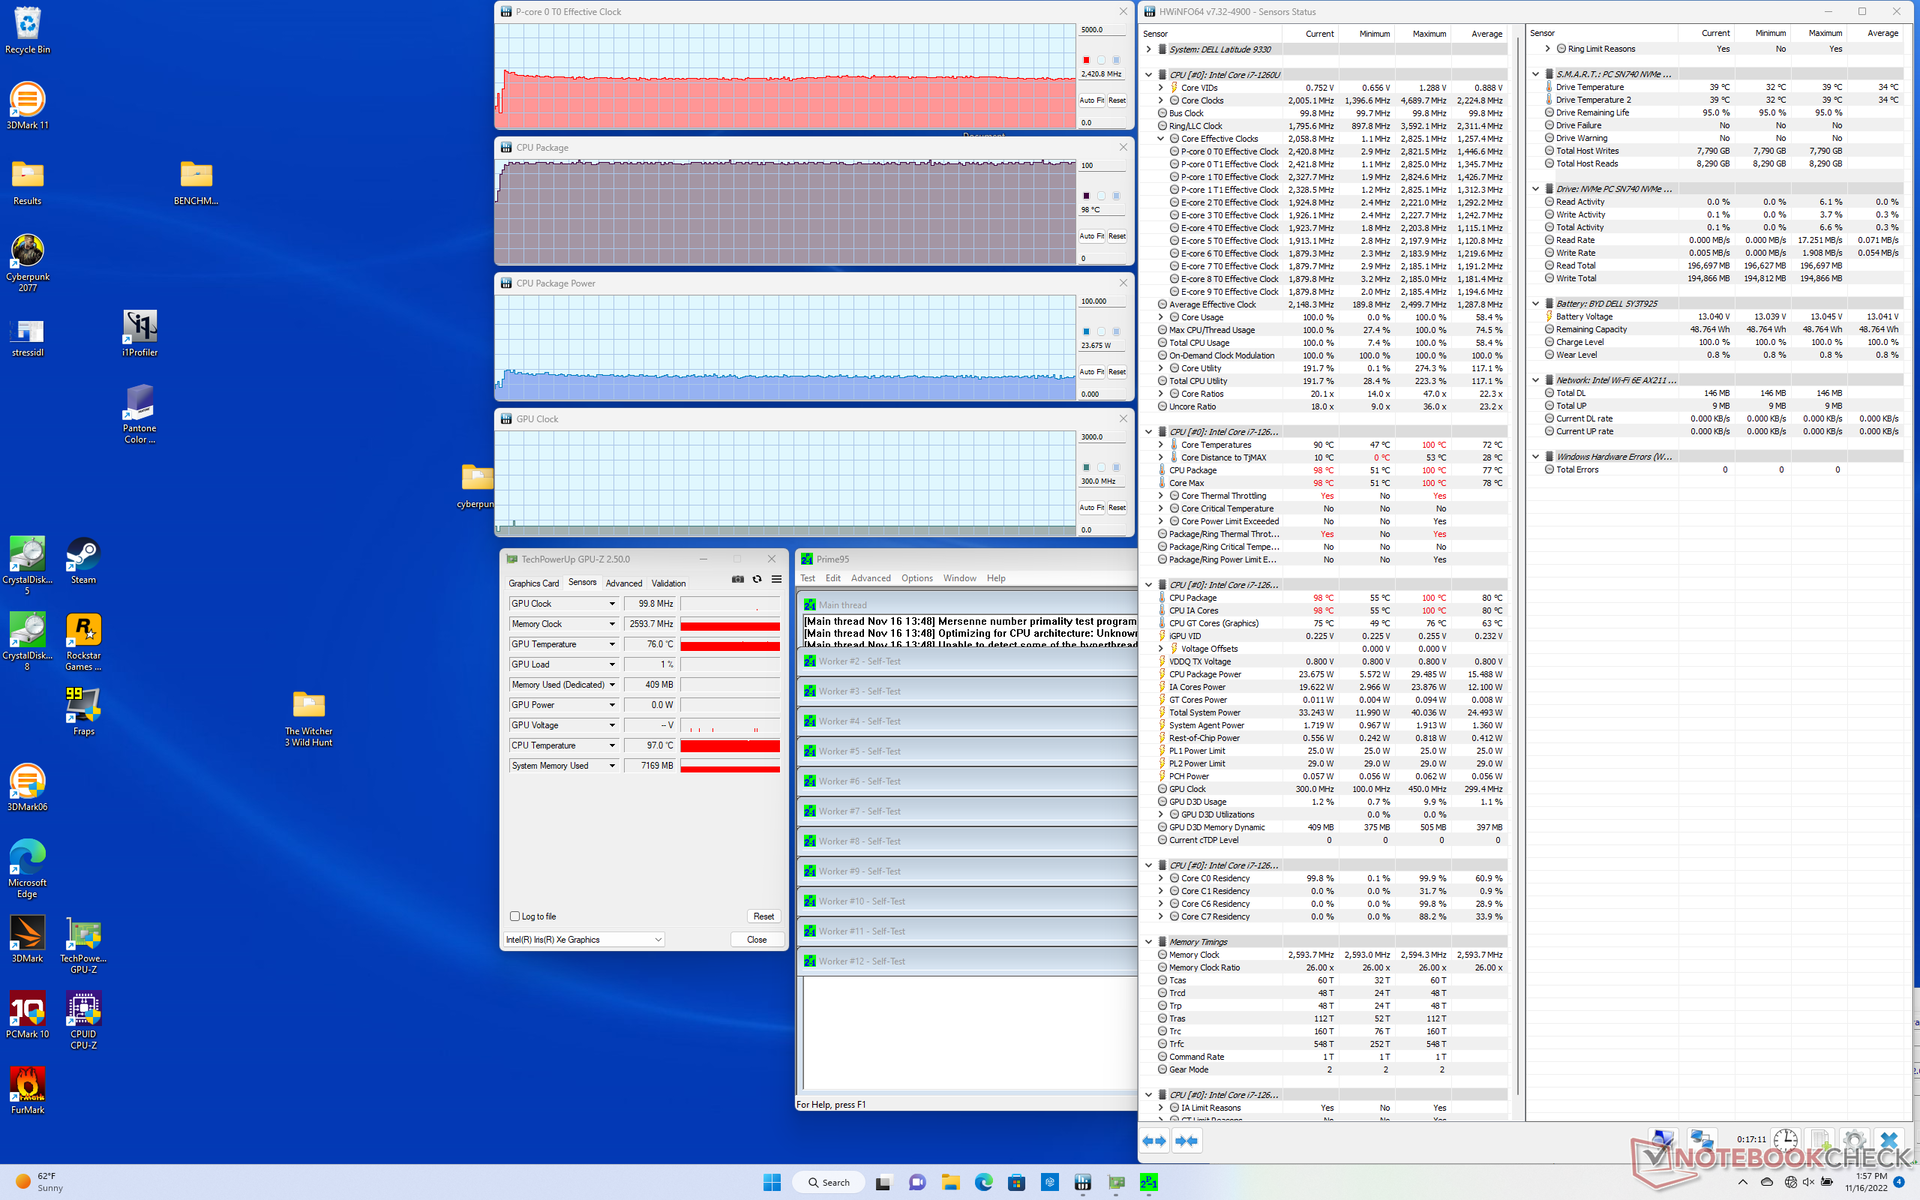
De temperatuur van de CPU bereikt regelmatig 90 C of hoger bij zware belasting. Bij het uitvoeren van Prime95, bijvoorbeeld, zou de CPU bijna onmiddellijk omhoog schieten naar 99 C, 2,8 GHz, en 29 W, respectievelijk, alvorens snel te dalen en te stabiliseren op 2,4 GHz en 25 W om een kerntemperatuur van ~98 C te handhaven. Het uitvoeren van dezelfde test op de Dragonfly Max met de Core i7-1185G7 zou resulteren in veel lagere kloksnelheden en een koelere kerntemperatuur van slechts 1,5 GHz en 71 C, respectievelijk. Dell is niet bang om de processor warmer te laten draaien dan op de meeste andere modellen om snellere prestaties te bieden.
GPU kloksnelheid en temperatuur bij Witcher 3 om veeleisende grafische belasting weer te geven zouden stabiliseren op respectievelijk 948 MHz en 91 C, vergeleken met slechts 700 MHz en 61 C op de eerder genoemde HP.
Werken op de batterij beperkt de prestaties. Een 3DMark 11 test op batterijen levert Physics en Graphics scores op van respectievelijk 7531 en 4193 punten, vergeleken met 12771 en 4820 punten op netstroom.
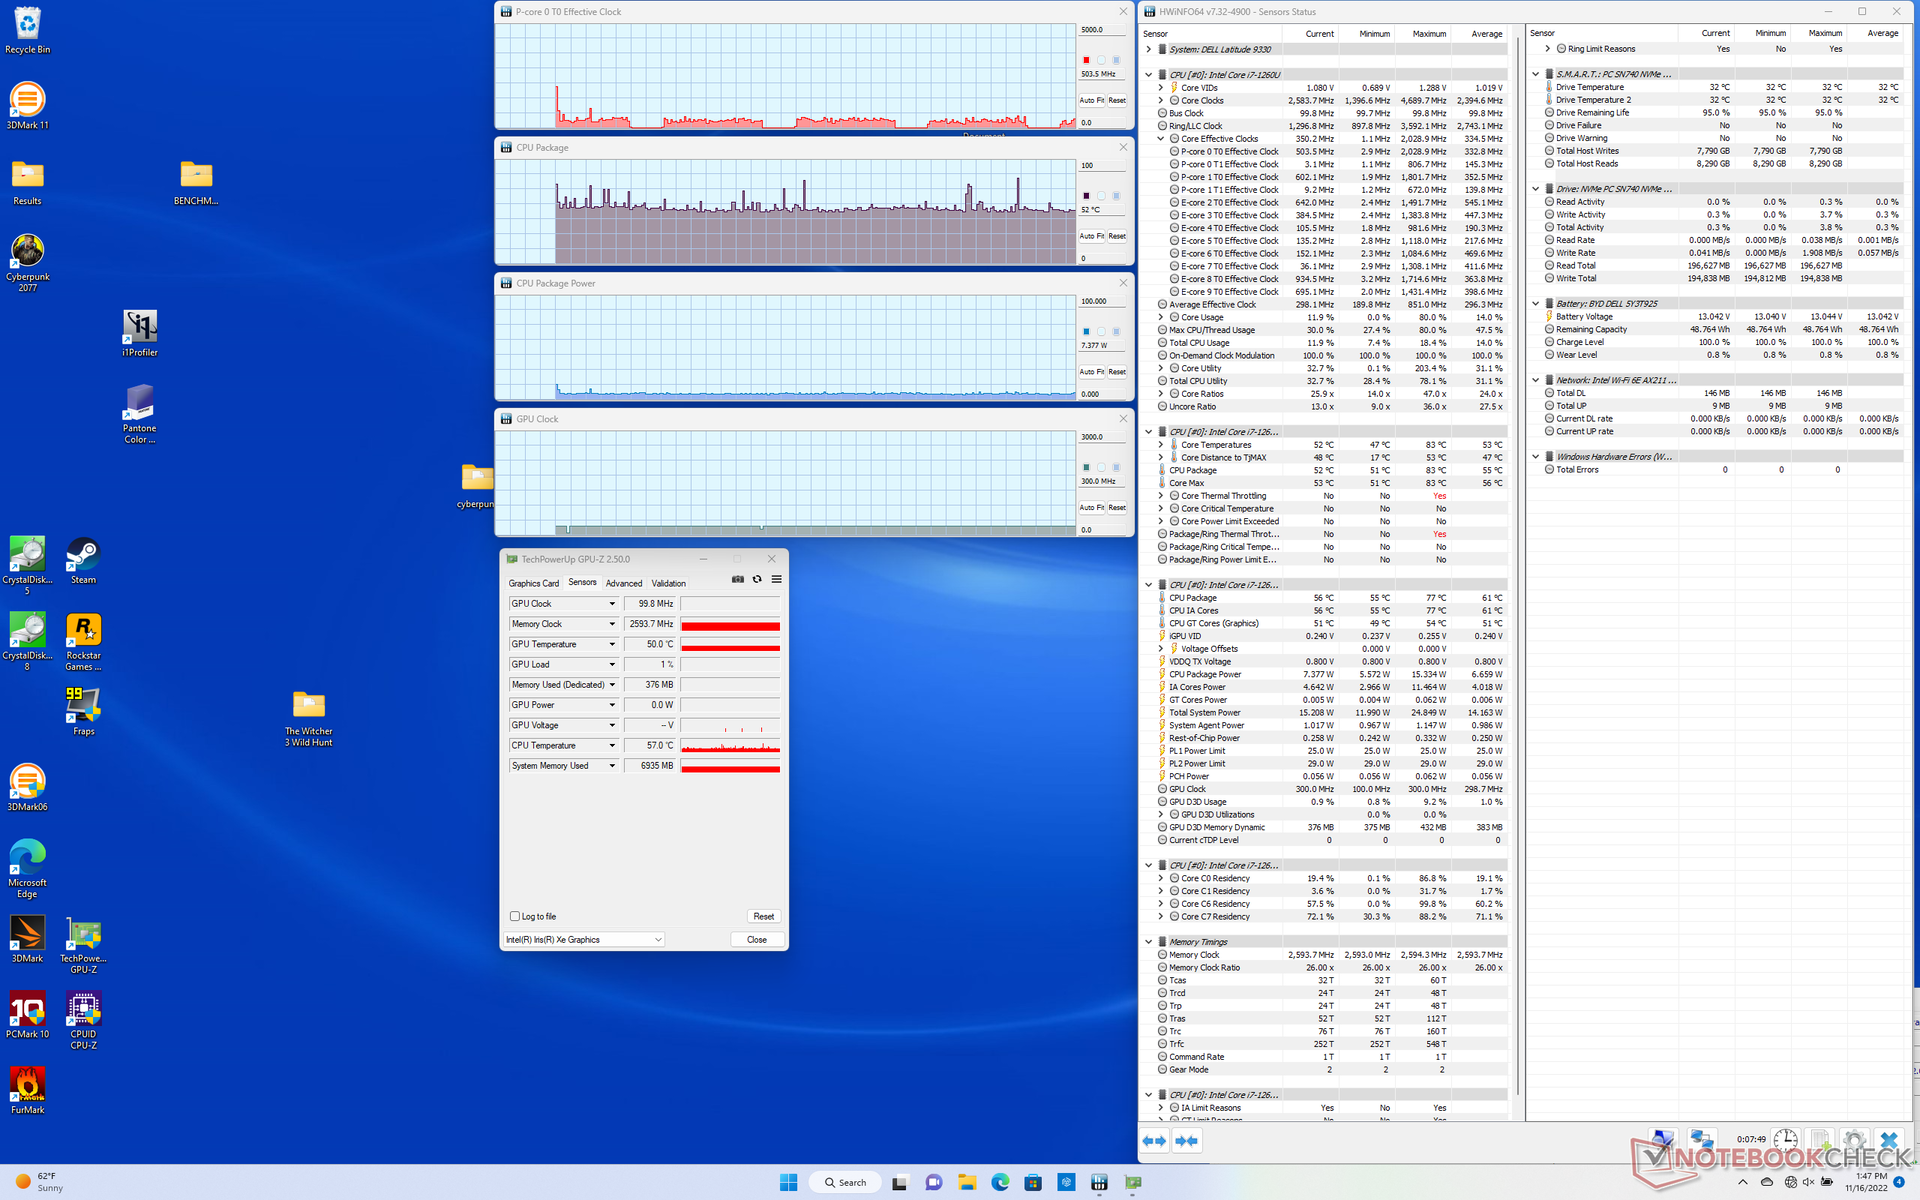
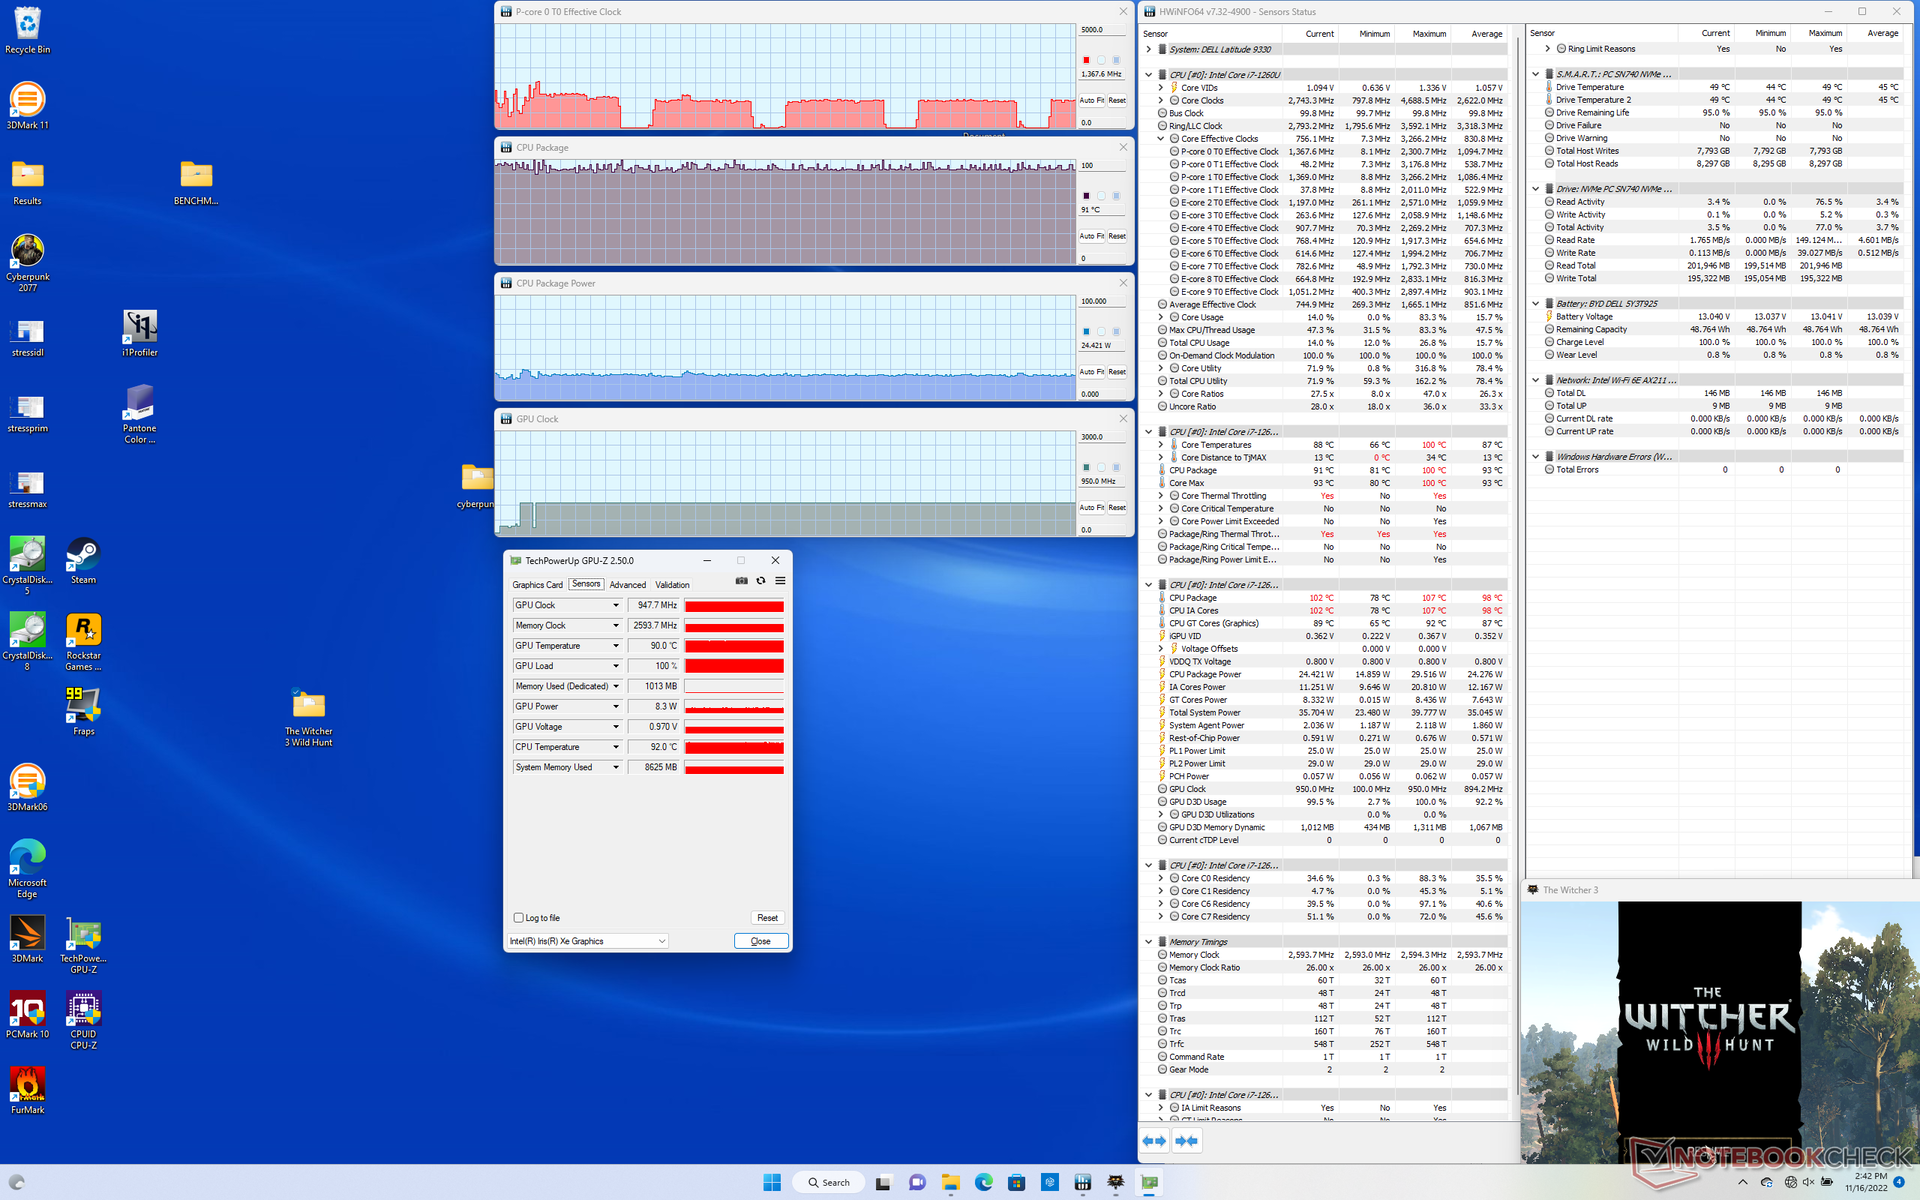
| CPU Klok (GHz) | GPU Klok (MHz) | Gemiddelde CPU Temperatuur (°C) | |
| Systeem Idle | -- | -- | 52 |
| Prime95 Stress | 2.4 | -- | 98 |
| Prime95 + FurMark Stress | 1.8 | 748 | 97 |
| Witcher 3 Stress | 1.4 | 948 | 91 |
Luidsprekers
Dell is erin geslaagd om er vier afzonderlijke luidsprekers in te proppen met een uitstekende geluidsweergave, ondanks de kleine vormfactor. Het maximale volume is luid en duidelijk zonder merkbare ruis. Het is duidelijk dat de interne luidsprekers zijn geoptimaliseerd voor audio- of videoconferenties.
Dell Latitude 9330 audioanalyse
(+) | luidsprekers kunnen relatief luid spelen (91.7 dB)
Bas 100 - 315 Hz
(±) | verminderde zeebaars - gemiddeld 11.9% lager dan de mediaan
(+) | de lage tonen zijn lineair (6.3% delta naar de vorige frequentie)
Midden 400 - 2000 Hz
(+) | evenwichtige middens - slechts 1.9% verwijderd van de mediaan
(+) | de middentonen zijn lineair (2.7% delta ten opzichte van de vorige frequentie)
Hoog 2 - 16 kHz
(+) | evenwichtige hoogtepunten - slechts 3.4% verwijderd van de mediaan
(+) | de hoge tonen zijn lineair (3.5% delta naar de vorige frequentie)
Algemeen 100 - 16.000 Hz
(+) | het totale geluid is lineair (9.2% verschil met de mediaan)
Vergeleken met dezelfde klasse
» 4% van alle geteste apparaten in deze klasse waren beter, 1% vergelijkbaar, 95% slechter
» De beste had een delta van 6%, het gemiddelde was 20%, de slechtste was 57%
Vergeleken met alle geteste toestellen
» 3% van alle geteste apparaten waren beter, 1% gelijk, 96% slechter
» De beste had een delta van 4%, het gemiddelde was 23%, de slechtste was 134%
Apple MacBook Pro 16 2021 M1 Pro audioanalyse
(+) | luidsprekers kunnen relatief luid spelen (84.7 dB)
Bas 100 - 315 Hz
(+) | goede baars - slechts 3.8% verwijderd van de mediaan
(+) | de lage tonen zijn lineair (5.2% delta naar de vorige frequentie)
Midden 400 - 2000 Hz
(+) | evenwichtige middens - slechts 1.3% verwijderd van de mediaan
(+) | de middentonen zijn lineair (2.1% delta ten opzichte van de vorige frequentie)
Hoog 2 - 16 kHz
(+) | evenwichtige hoogtepunten - slechts 1.9% verwijderd van de mediaan
(+) | de hoge tonen zijn lineair (2.7% delta naar de vorige frequentie)
Algemeen 100 - 16.000 Hz
(+) | het totale geluid is lineair (4.6% verschil met de mediaan)
Vergeleken met dezelfde klasse
» 0% van alle geteste apparaten in deze klasse waren beter, 0% vergelijkbaar, 100% slechter
» De beste had een delta van 5%, het gemiddelde was 17%, de slechtste was 45%
Vergeleken met alle geteste toestellen
» 0% van alle geteste apparaten waren beter, 0% gelijk, 100% slechter
» De beste had een delta van 4%, het gemiddelde was 23%, de slechtste was 134%
Energiebeheer
Stroomverbruik - Hoge prestaties per watt
Het systeem is zeer energiezuinig, zoals men zou verwachten van een laptop met een Core U-serie CPU. Het meest opvallende is het feit dat onze Latitude 9330 ongeveer 23 procent minder stroom verbruikt dan de oudereLatitude 5310 bij het uitvoeren van GPU-intensieve toepassingen, terwijl hij 2x tot 3x zoveel grafische prestaties levert. Gebruikers die upgraden van 10e generatie of oudere Intel CPU's zullen hierdoor aanzienlijke prestatiewinst per watt zien.
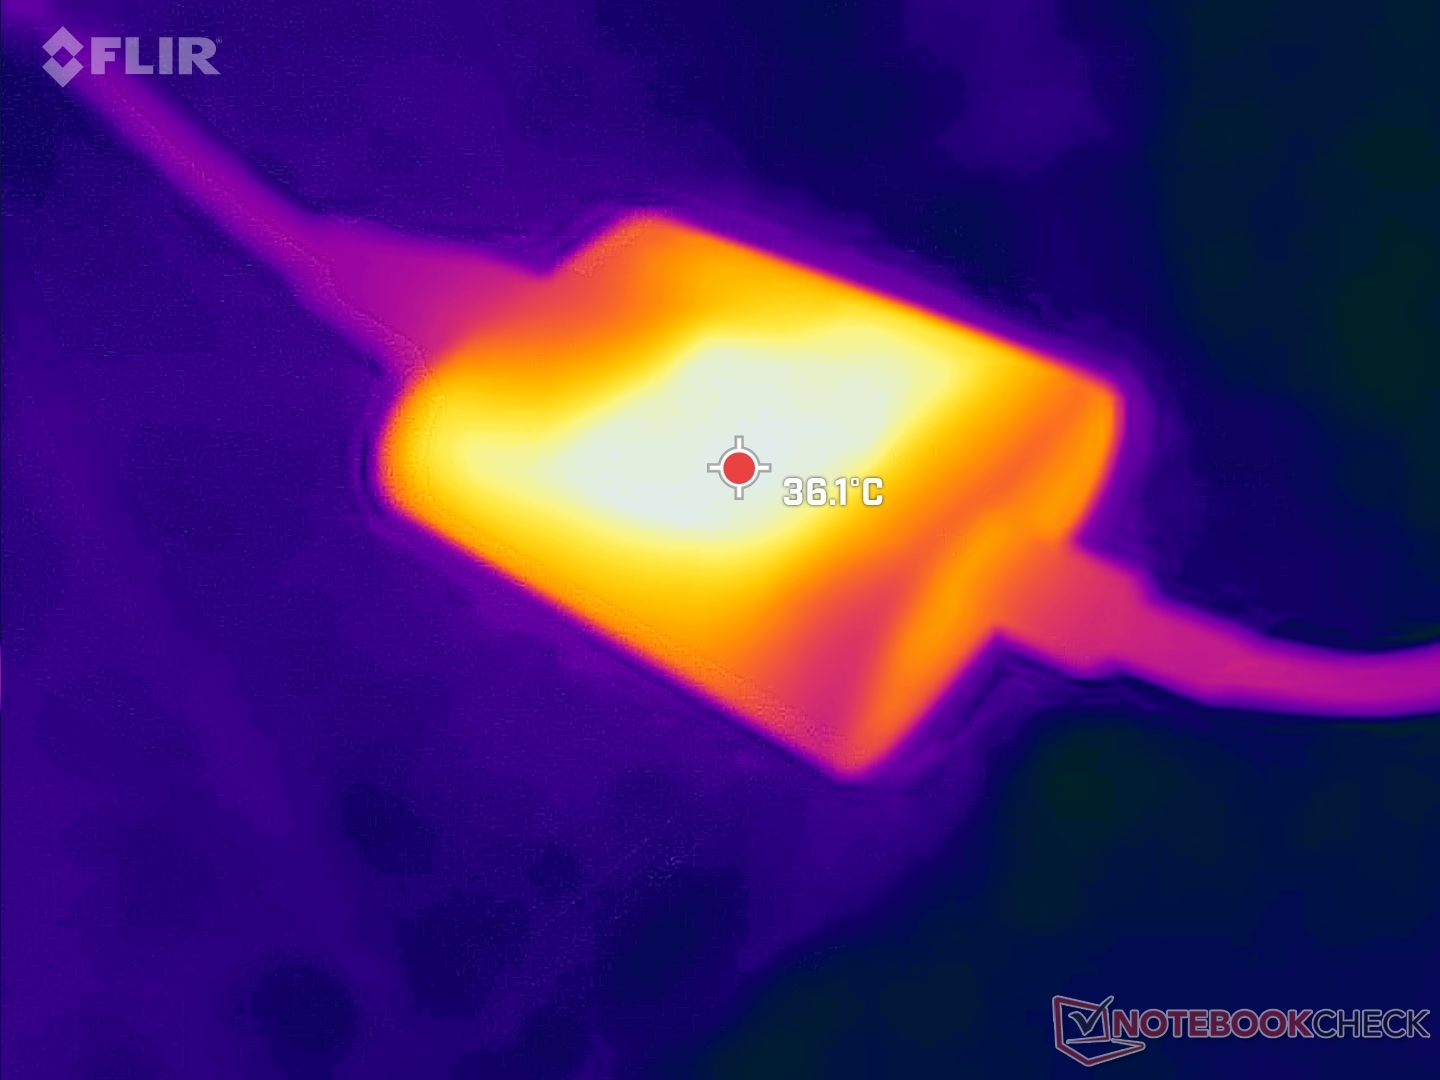
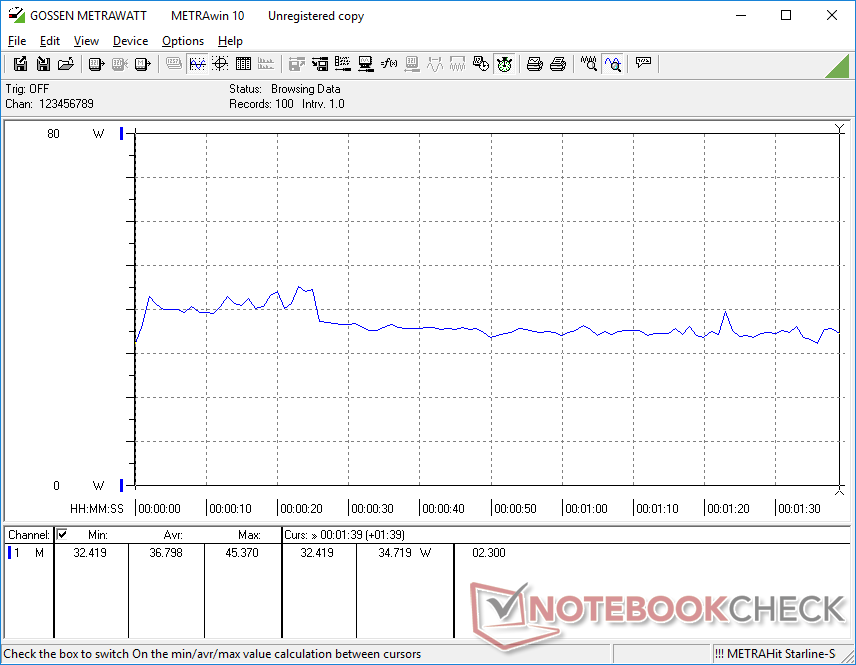
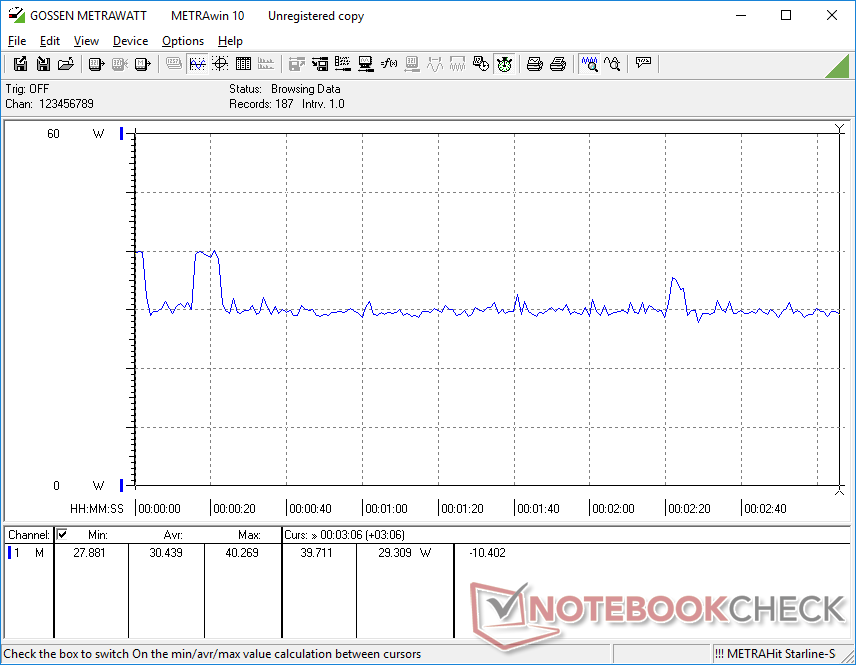
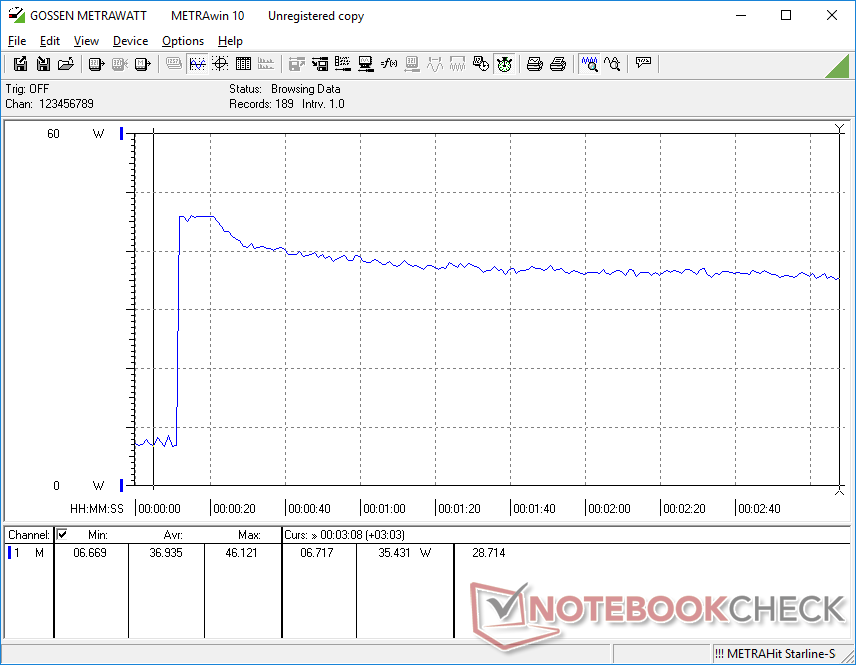
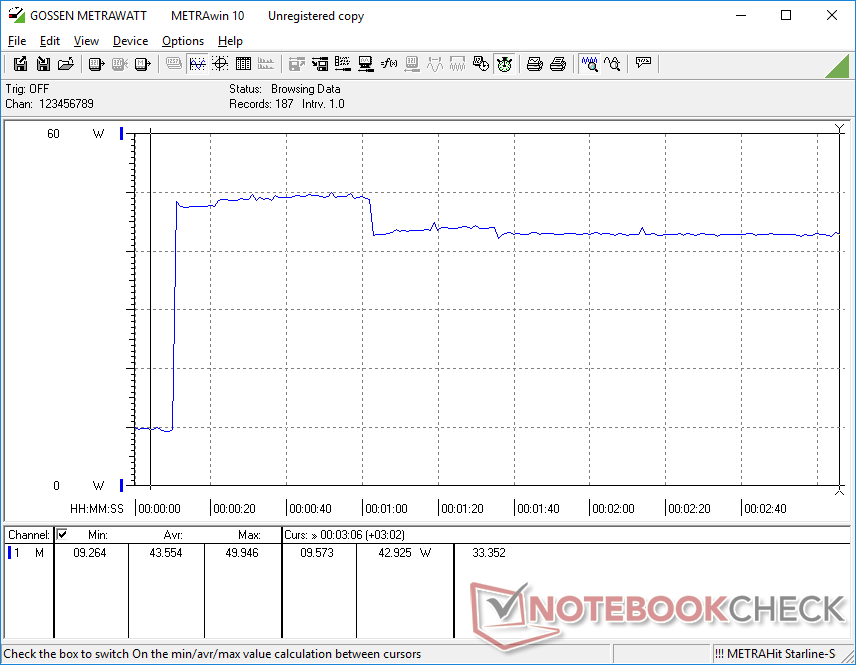
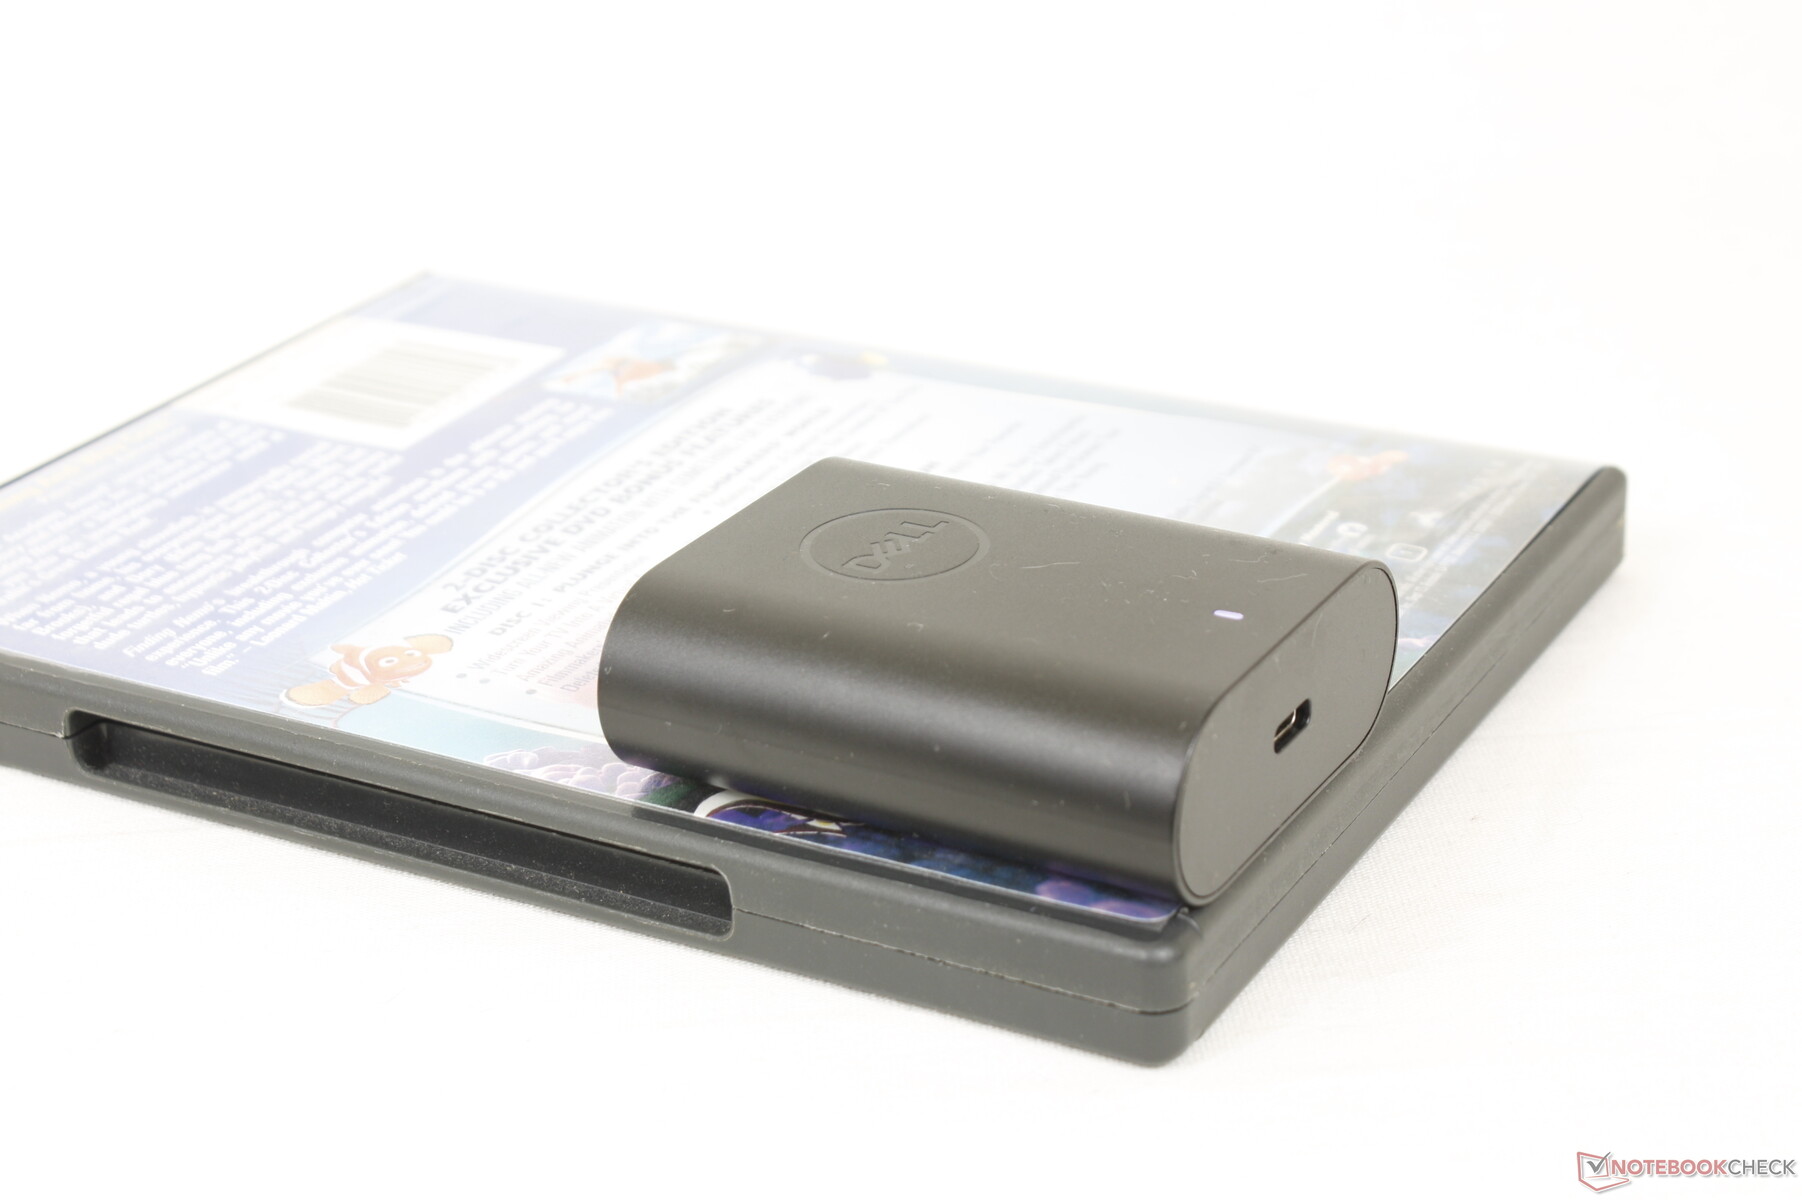
Het stroomverbruik is ongeveer 27 procent lager dan de Core i7-1255U-aangedreven Spectre x360 13.5 bij het uitvoeren van Prime95 stress. We zijn in staat om een tijdelijke maximale opname van 50 W te meten van de kleine (~6,7 x 5,3 x 2,3 cm) 60 W USB-C AC-adapter wanneer de CPU op 100 procent gebruik is. Het stroomverbruik daalt na verloop van tijd, zoals blijkt uit onze onderstaande grafieken, omdat de maximale Turbo Boost-prestaties niet onbeperkt zijn.
| Uit / Standby | |
| Inactief | |
| Belasting |
|
Key:
min: | |
| Dell Latitude 9330 i7-1260U, Iris Xe G7 96EUs, , IPS, 2560x1600, 13.3" | Lenovo ThinkPad X1 Titanium Yoga G1 20QB0016GE i5-1140G7, Iris Xe G7 80EUs, Lenovo UMIS RPJTJ256MEE1OWX, IPS LED, 2256x1504, 13.5" | MSI Summit E13 Flip Evo A11MT i7-1185G7, Iris Xe G7 96EUs, Phison 1TB SM2801T24GKBB4S-E162, IPS, 1920x1200, 13.4" | HP Elite Dragonfly Max i7-1185G7, Iris Xe G7 96EUs, Toshiba XG6 KXG60ZNV512G, IPS, 1920x1080, 13.3" | Dell Latitude 5310-23VP6 i5-10310U, UHD Graphics 620, SK hynix BC511 HFM512GDHTNI-87A0B, IPS, 1920x1080, 13.3" | Lenovo Yoga Slim 9 14IAP7 i7-1280P, Iris Xe G7 96EUs, Samsung PM9B1 1024GB MZAL41T0HBLB, OLED, 2880x1800, 14" | |
|---|---|---|---|---|---|---|
| Power Consumption | 11% | -23% | -5% | 5% | -98% | |
| Idle Minimum * (Watt) | 4.7 | 3.75 20% | 4.8 -2% | 2.9 38% | 2.9 38% | 11.8 -151% |
| Idle Average * (Watt) | 8.2 | 7.75 5% | 8.4 -2% | 9.9 -21% | 5.9 28% | 17.4 -112% |
| Idle Maximum * (Watt) | 8.4 | 8.69 -3% | 8.6 -2% | 10.4 -24% | 6.7 20% | 22.4 -167% |
| Load Average * (Watt) | 36.8 | 33.12 10% | 47.1 -28% | 37.1 -1% | 42 -14% | 53 -44% |
| Witcher 3 ultra * (Watt) | 30.4 | 28.7 6% | 51.6 -70% | 31.5 -4% | 43 -41% | 52.6 -73% |
| Load Maximum * (Watt) | 49.9 | 35.19 29% | 65.9 -32% | 58.8 -18% | 50 -0% | 71 -42% |
* ... kleiner is beter
Power Consumption Witcher 3 / Stresstest
Power Consumption external Monitor
Batterijduur - Goed voor een werkdag
De batterijcapaciteit is met 50 Wh gemiddeld voor een subnotebook. Runtimes zijn niettemin nog steeds goed met bijna 9,5 uur echt WLAN gebruik, net iets korter dan op de HP Dragonfly Max of MSI Summit E13 Flip.
Opladen van leeg naar volledige capaciteit duurt ongeveer 90 minuten.
| Dell Latitude 9330 i7-1260U, Iris Xe G7 96EUs, 50 Wh | Lenovo ThinkPad X1 Titanium Yoga G1 20QA001RGE i7-1160G7, Iris Xe G7 96EUs, 44.5 Wh | MSI Summit E13 Flip Evo A11MT i7-1185G7, Iris Xe G7 96EUs, 70 Wh | HP EliteBook x360 1030 G7 i7-10810U, UHD Graphics 620, 54 Wh | HP Elite Dragonfly Max i7-1185G7, Iris Xe G7 96EUs, 56 Wh | Dell Latitude 5310-23VP6 i5-10310U, UHD Graphics 620, 60 Wh | |
|---|---|---|---|---|---|---|
| Batterijduur | -14% | 11% | 37% | 43% | 18% | |
| Reader / Idle (h) | 15.4 | 21.1 37% | 30.9 101% | 28.7 86% | ||
| WiFi v1.3 (h) | 9.4 | 8.4 -11% | 11.2 19% | 10.3 10% | 11 17% | 11.1 18% |
| Load (h) | 2.3 | 1.9 -17% | 1.8 -22% | 2.3 0% | 2.9 26% | |
| H.264 (h) | 11.4 |
Pro
Contra
Verdict - Uitblinken waar het telt
De Latitude 9330 2-in-1 is in hoge mate geoptimaliseerd voor kantooromgevingen met functies die niet beschikbaar zijn op de meeste consumentgerichte modellen, waaronder de XPS 13. De bouwkwaliteit en stevigheid behoren tot de beste die we hebben gezien voor een ultradunne 13-inch convertible, wat ons meer vertrouwen geeft in de levensduur en betrouwbaarheid van het model. Als u besluit te investeren in de Latitude 9330, dan zal deze meer dan waarschijnlijk meerdere jaren meegaan.
Hoewel het Dell-systeem op de meeste gebieden goed tot uitstekend is, begint het op enkele andere gebieden achterop te raken Concurrerende modellen van HP worden geleverd met 1000-nit schermopties en 5 MP webcams, terwijl de Latitude 9330 blijft steken op 500 nits en 2 MP. Het ontbreken van USB-A en HDMI-poorten zal waarschijnlijk ook veel gebruikers irriteren. Wees voorbereid op merkbaar harder ventilatorgeluid als u van plan bent veeleisende belastingen op de Dell te draaien.
Afgezien van een paar gemiddelde specificaties is de Dell Latitude 9330 2-in-1 onze top zakelijke convertible om aan te bevelen als u iets wilt dat meerdere jaren meegaat.
Andere nadelen zoals de mindere grafische prestaties, warmere kerntemperaturen en geen ondersteuning voor M.2 2280 SSD's zijn relatief klein gezien de doelgroep van zakelijke of zakelijke gebruikers. We zouden absoluut graag in de toekomst schermopties met een hogere verversingssnelheid en snellere zwart-wit reactietijden zien, omdat de soepelere framerate de gebruikerservaring van het touchscreen aanzienlijk zou verbeteren.
Prijs en beschikbaarheid
Delllevert nu de Latitude 9330 2-in-1 vanaf 2065 USD tot meer dan 2700 USD indien volledig geconfigureerd.
Dell Latitude 9330
- 18-11-2022 v7 (old)
Allen Ngo
Price comparison

