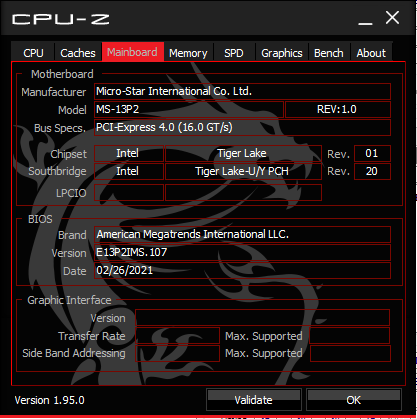
MSI Summit E13 Flip Evo Convertible Review: Een tijdloos ontwerp
MSI staat bekend om zijn brede scala aan gaming laptops, maar is de laatste tijd ook actief in andere categorieën met zijn mobiele werkstations en Core U-aangedreven Ultrabooks zoals de Modern en Prestige series. De nieuwste is de high-end Summit serie gericht op prosumenten die bereid zijn wat extra te betalen voor een luxueuzer ontwerp en gebruikerservaring. MSI kondigde een handvol modellen eind vorig jaar, waaronder de 13,4-inch Summit E13 Flip, 14-inch Summit B14 en E14, en 15,6-inch Summit B15 en E15.
Het model dat we hier zullen bekijken is de Summit E13 Flip convertible die wordt verkocht voor ongeveer $1600 tot $1900 USD, afhankelijk van de opslag- en RAM-configuratie. Alle SKU's worden op dit moment verder geleverd met dezelfde Core i7-1185G7 CPU en 16:10 1200p IPS touchscreen. Directe concurrenten zijn andere high-end convertible subnotebooks zoals de Dell XPS 13 9310 2-in-1, Lenovo ThinkPad X1 Yoga, Asus ZenBook Flip Sof de HP Spectre x360 13 of Spectre x360 14.
Meer MSI reviews:
potential competitors in comparison
Evaluatie | Datum | Model | Gewicht | Hoogte | Formaat | Resolutie | Beste prijs |
|---|---|---|---|---|---|---|---|
| 86.9 % v7 (old) | 04-2021 | MSI Summit E13 Flip Evo A11MT i7-1185G7, Iris Xe G7 96EUs | 1.4 kg | 14.9 mm | 13.40" | 1920x1200 | |
| 86.3 % v7 (old) | 11-2019 | Dell XPS 13 7390 2-in-1 Core i7 i7-1065G7, Iris Plus Graphics G7 (Ice Lake 64 EU) | 1.3 kg | 13 mm | 13.40" | 1920x1200 | |
| 89.4 % v7 (old) | 12-2020 | HP Spectre x360 14t-ea000 i7-1165G7, Iris Xe G7 96EUs | 1.3 kg | 17.2 mm | 13.50" | 1920x1280 | |
| 87.8 % v7 (old) | 03-2021 | Huawei MateBook X Pro 2021 i7-1165G7, Iris Xe G7 96EUs | 1.3 kg | 14.6 mm | 13.90" | 3000x2000 | |
| 87.3 % v7 (old) | 04-2021 | Lenovo ThinkPad X1 Titanium Yoga G1 20QA001RGE i7-1160G7, Iris Xe G7 96EUs | 1.2 kg | 11.5 mm | 13.50" | 2256x1504 | |
| 84.1 % v7 (old) | 01-2021 | Asus Zenbook 14 UX435EG i7-1165G7, GeForce MX450 | 1.3 kg | 16.9 mm | 14.00" | 1920x1080 |
Zaak
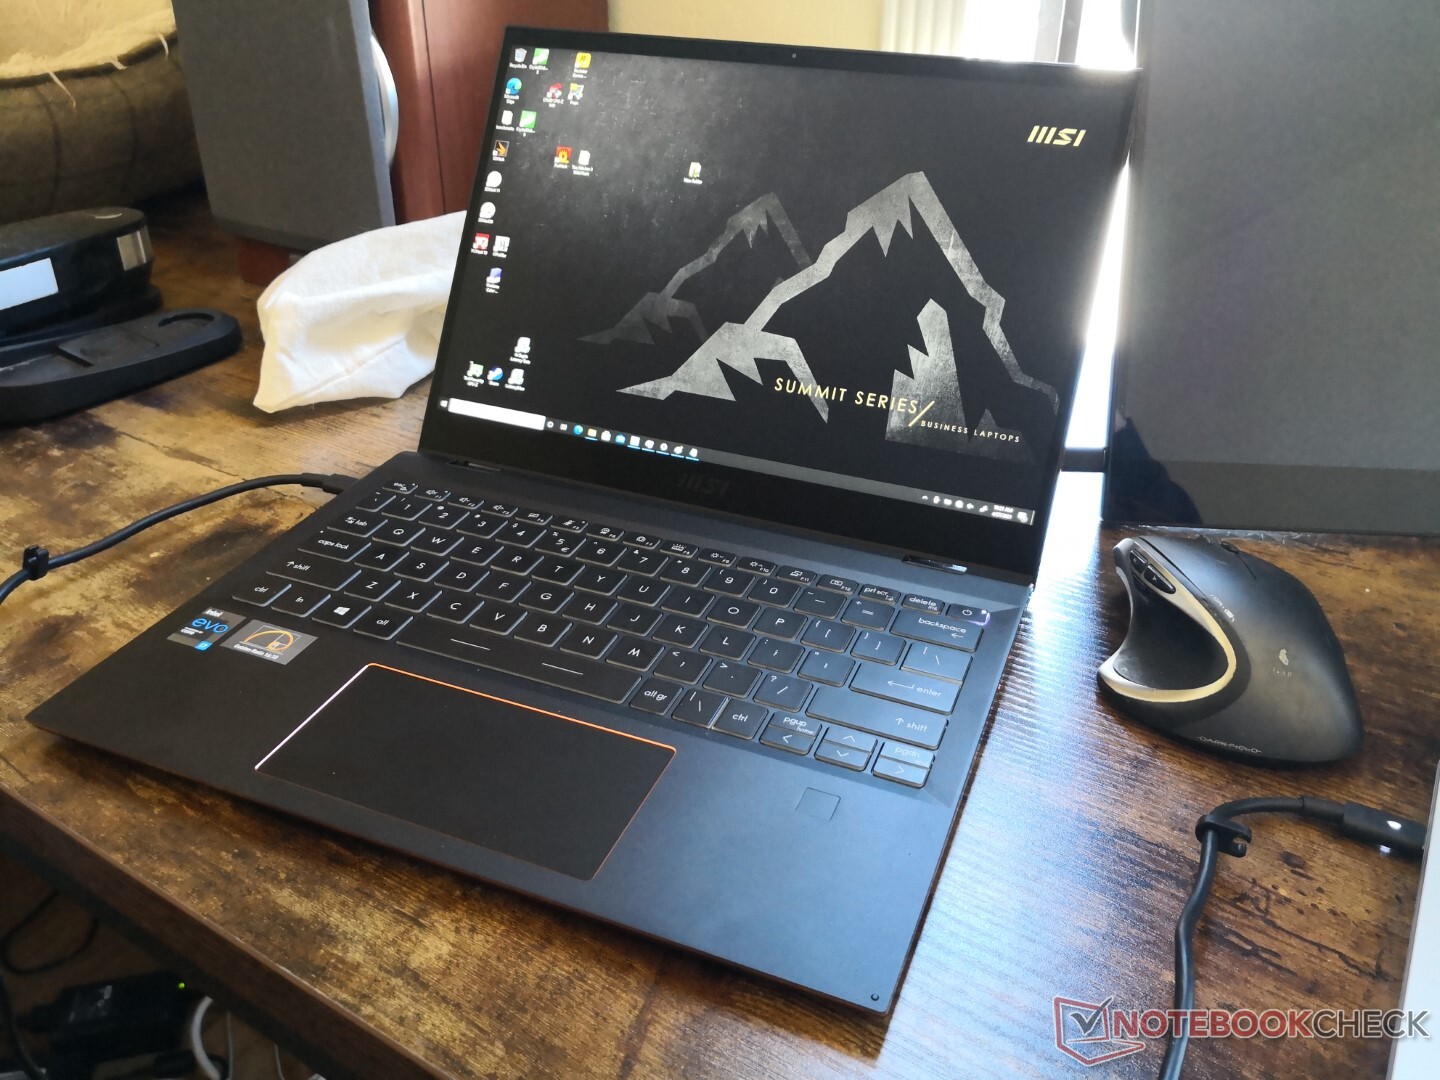
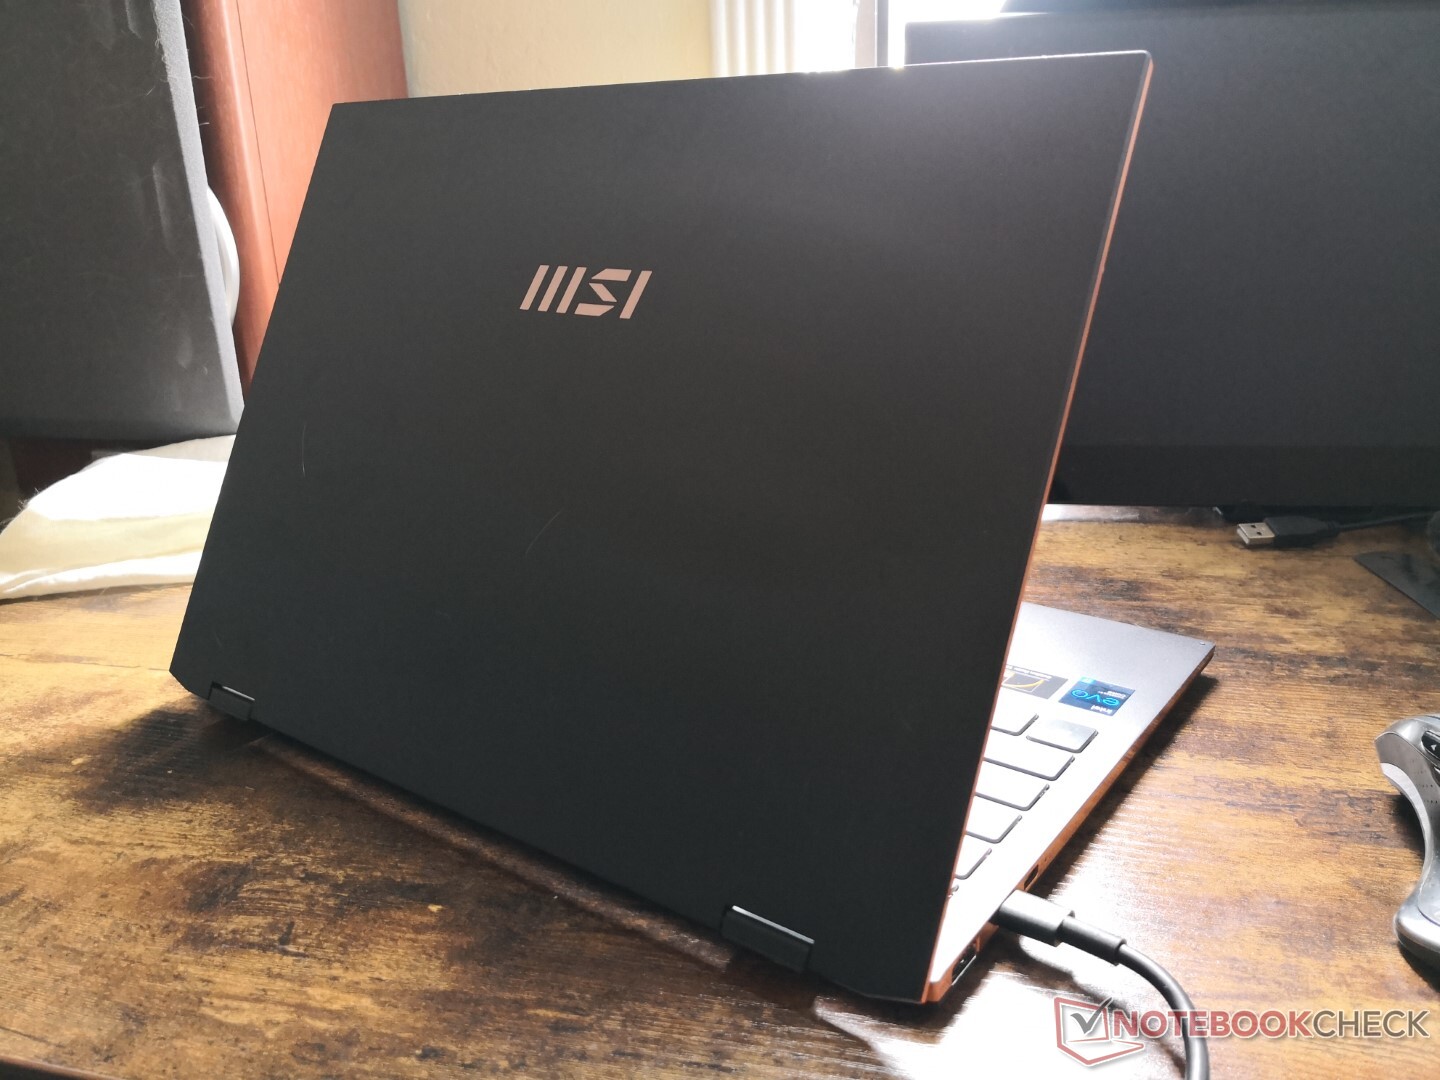
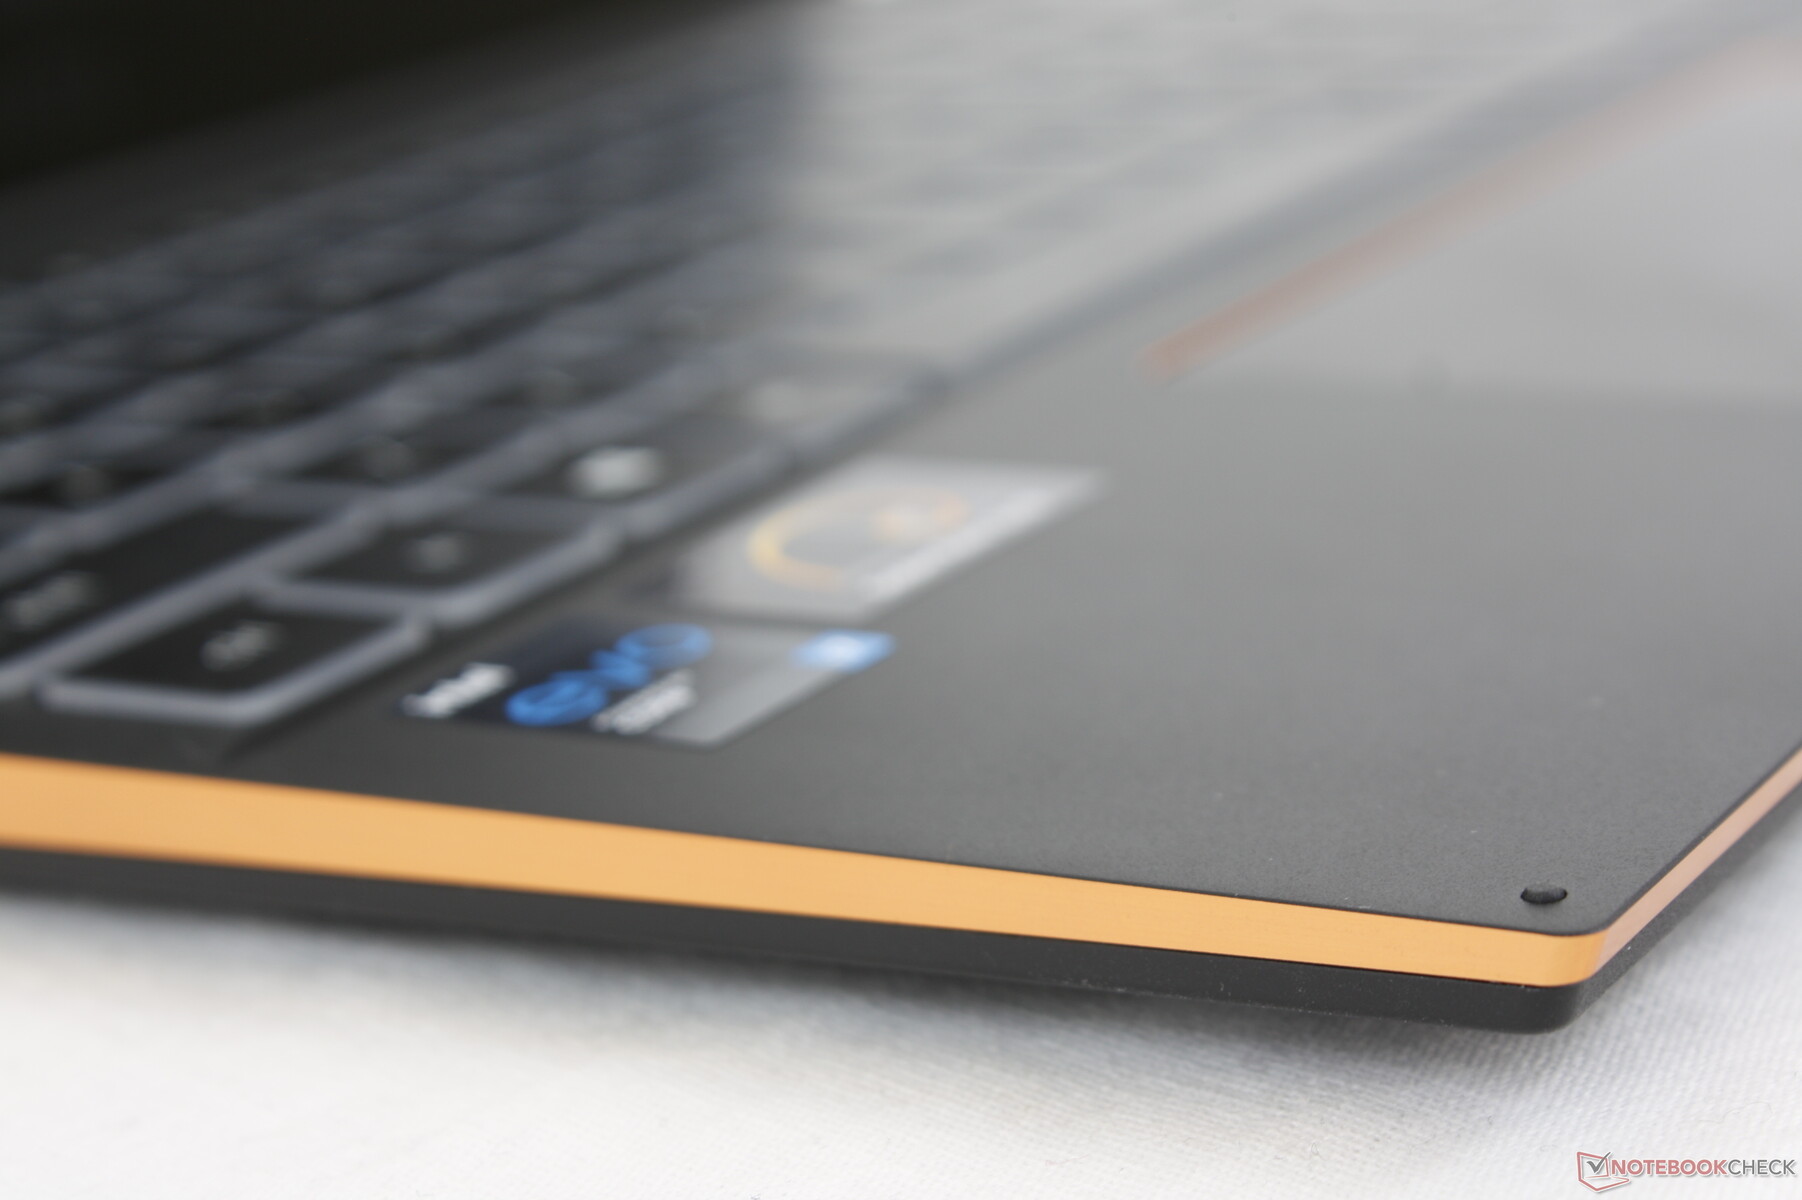
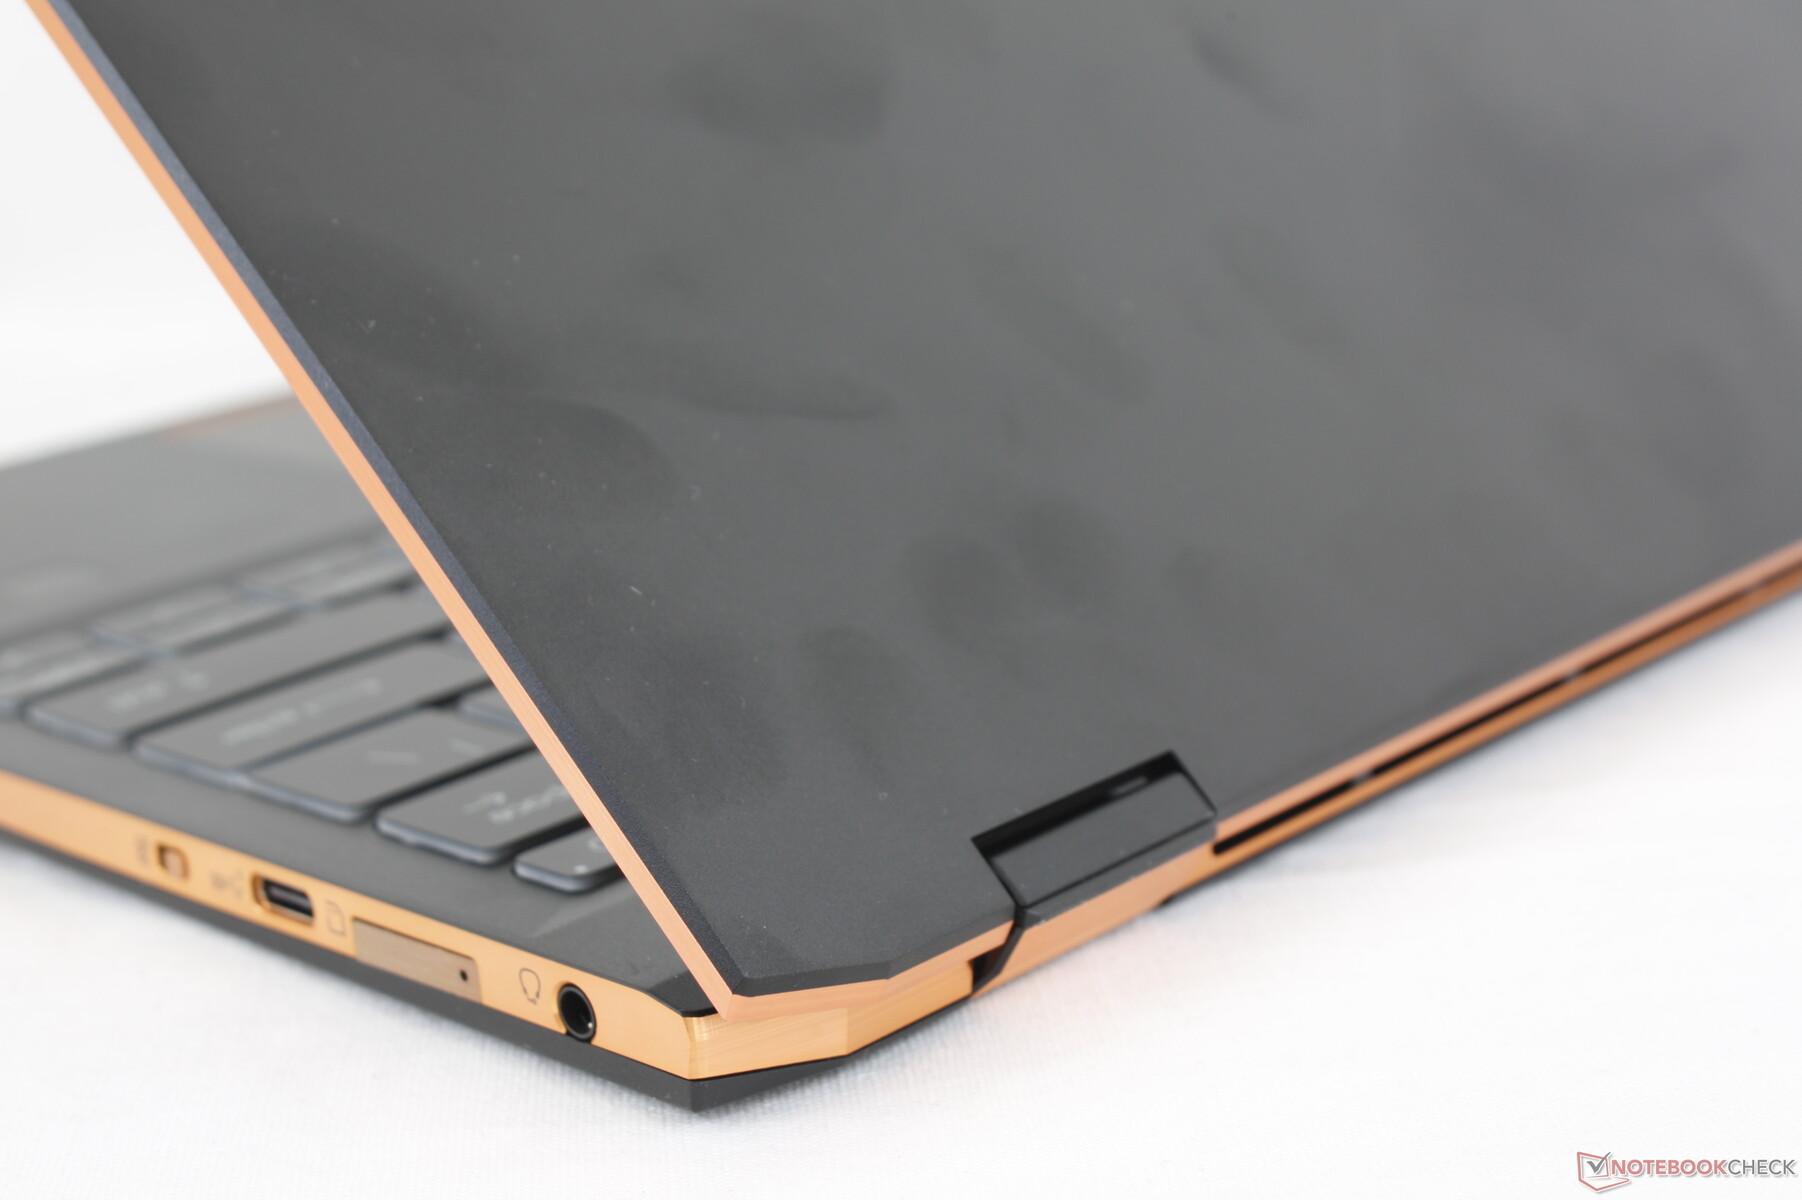
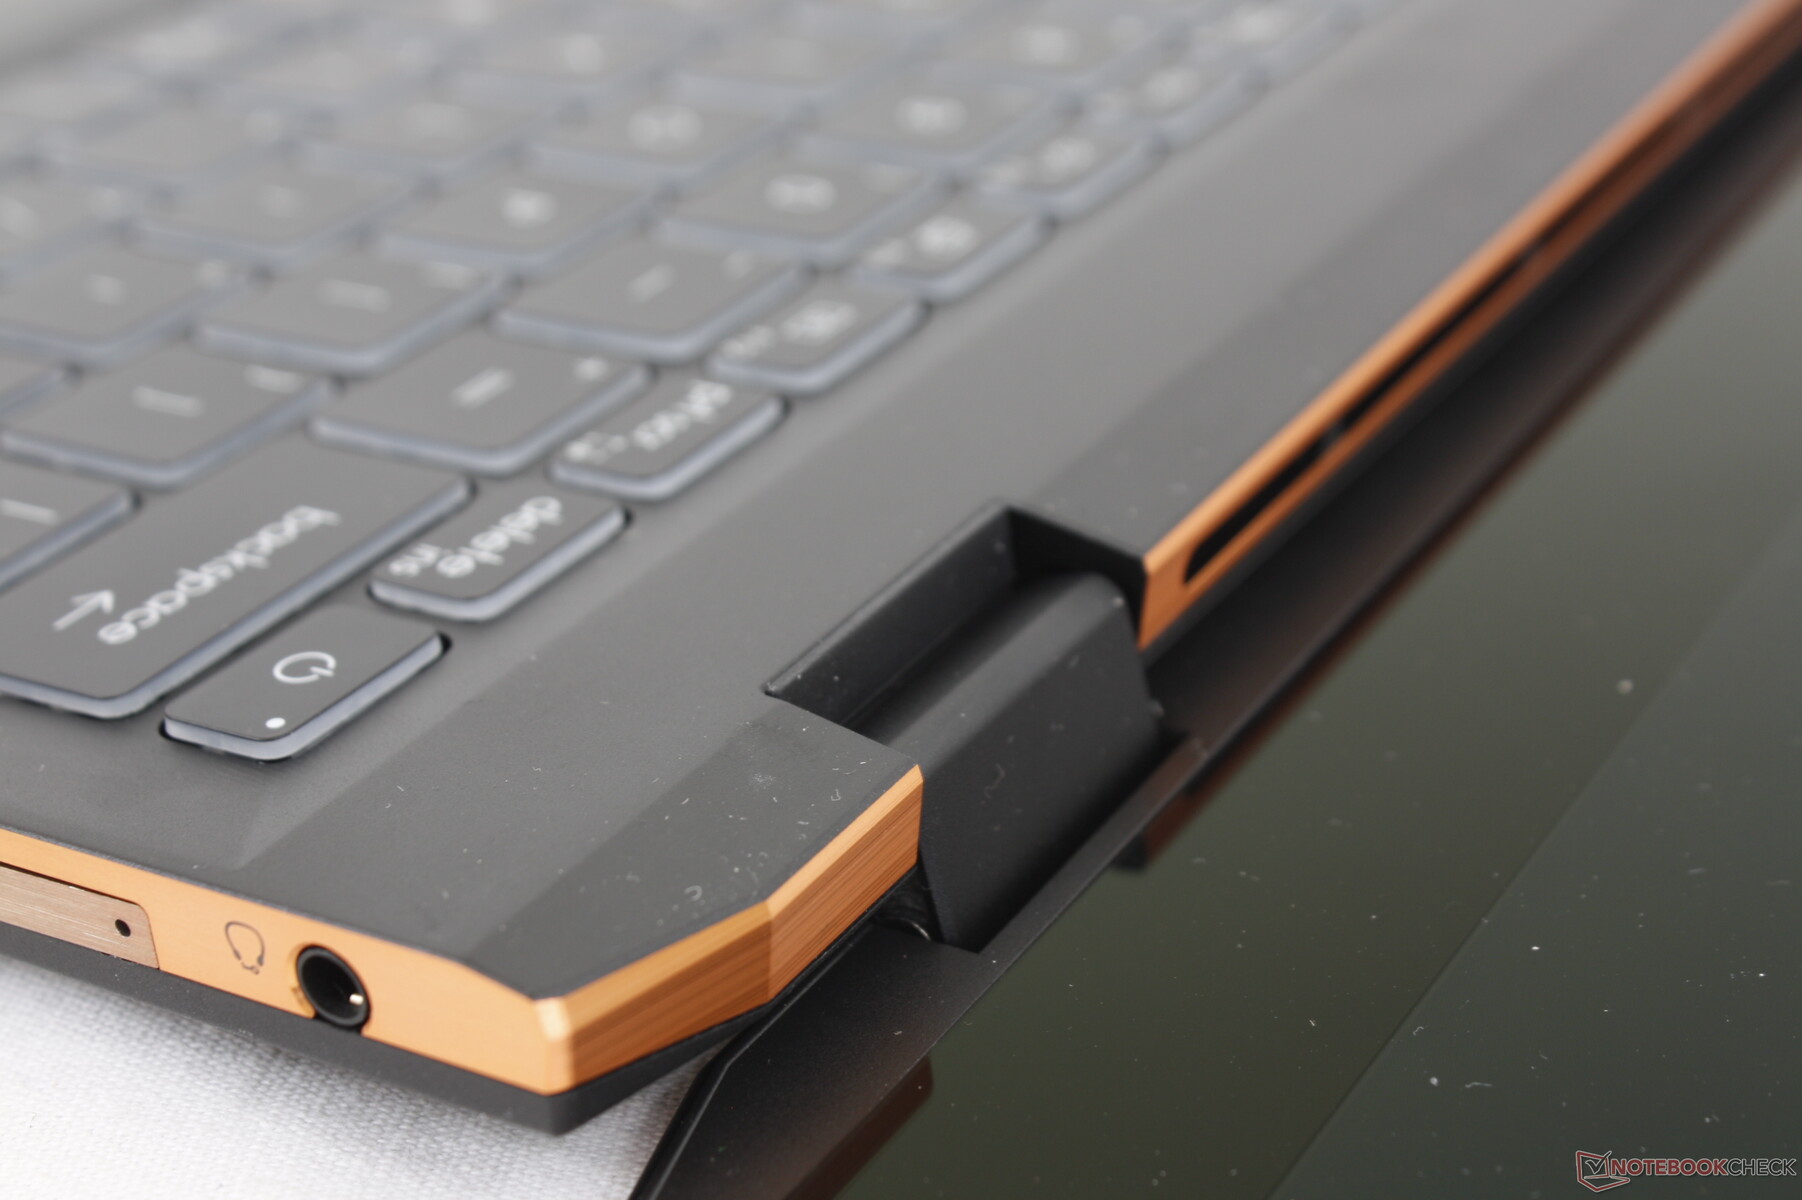
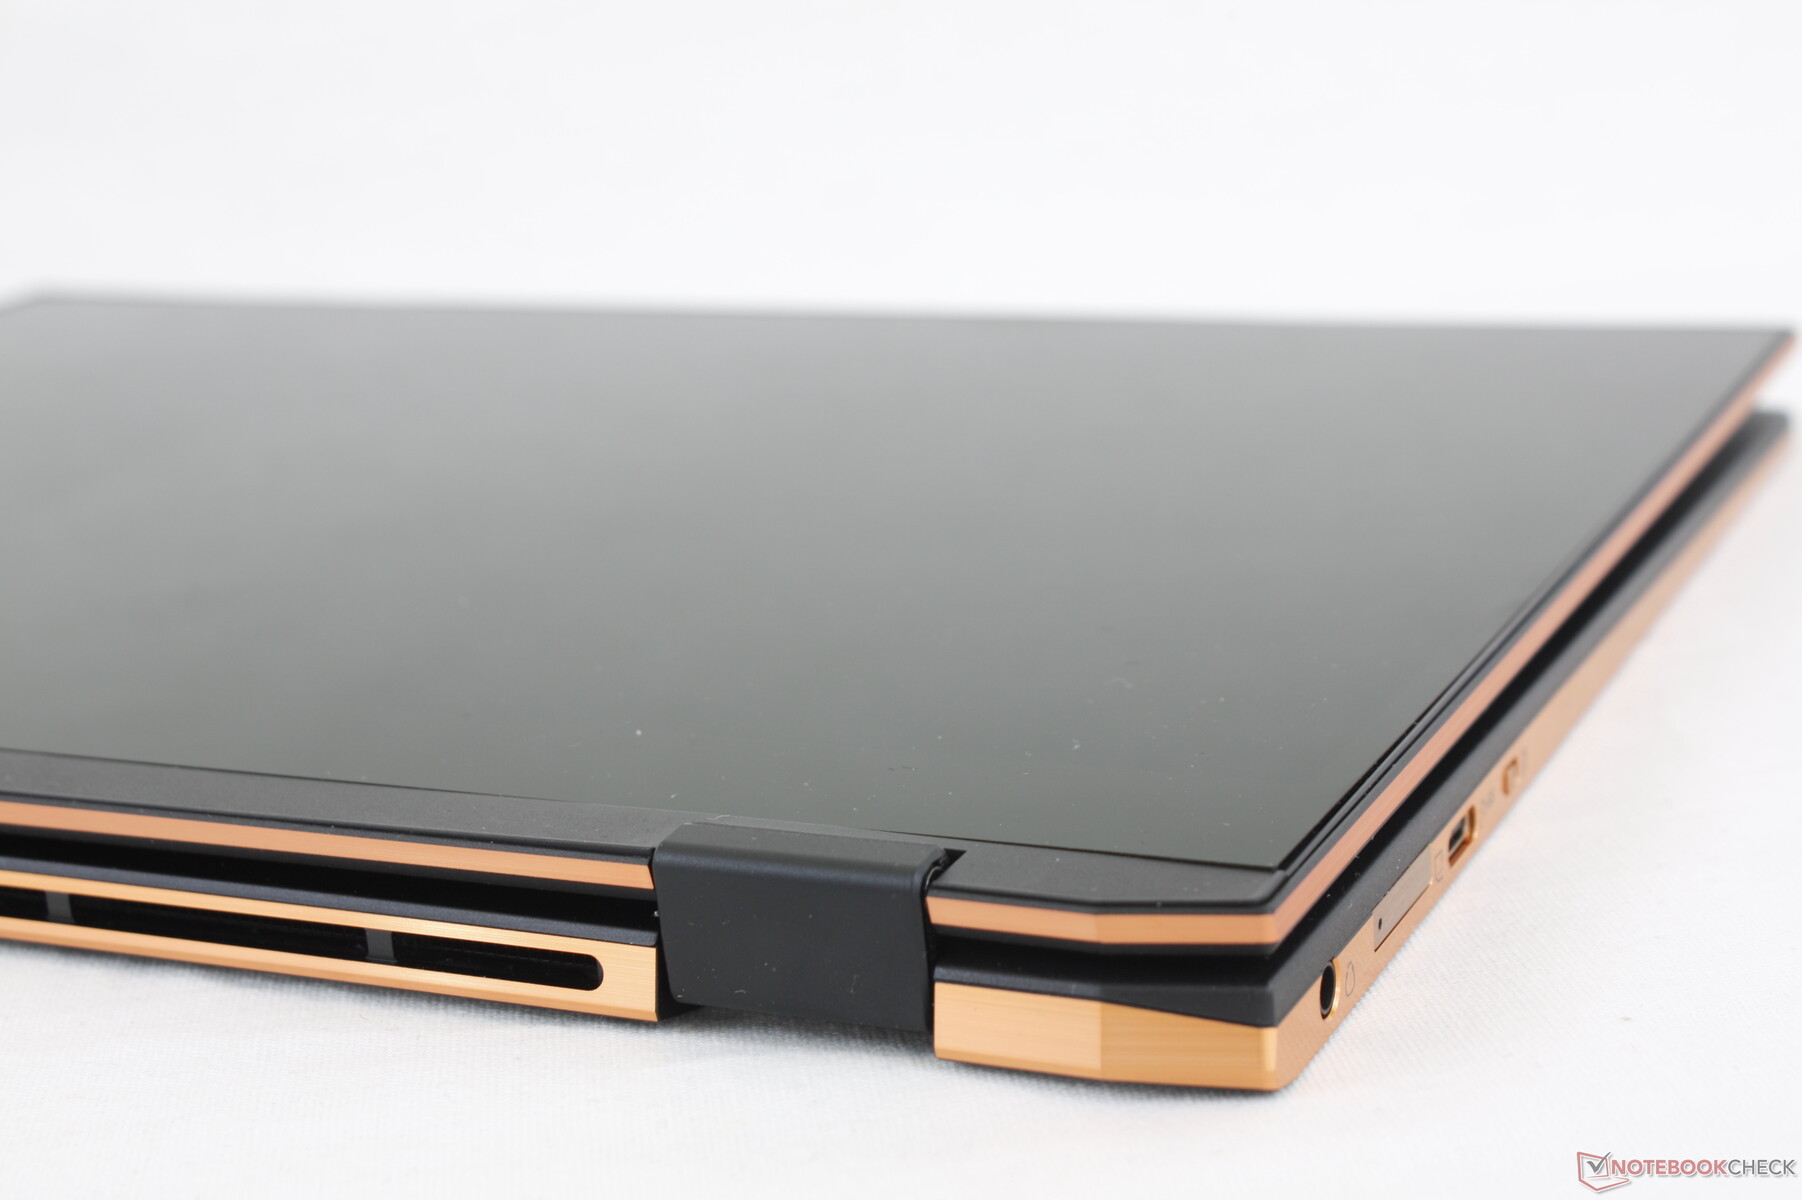
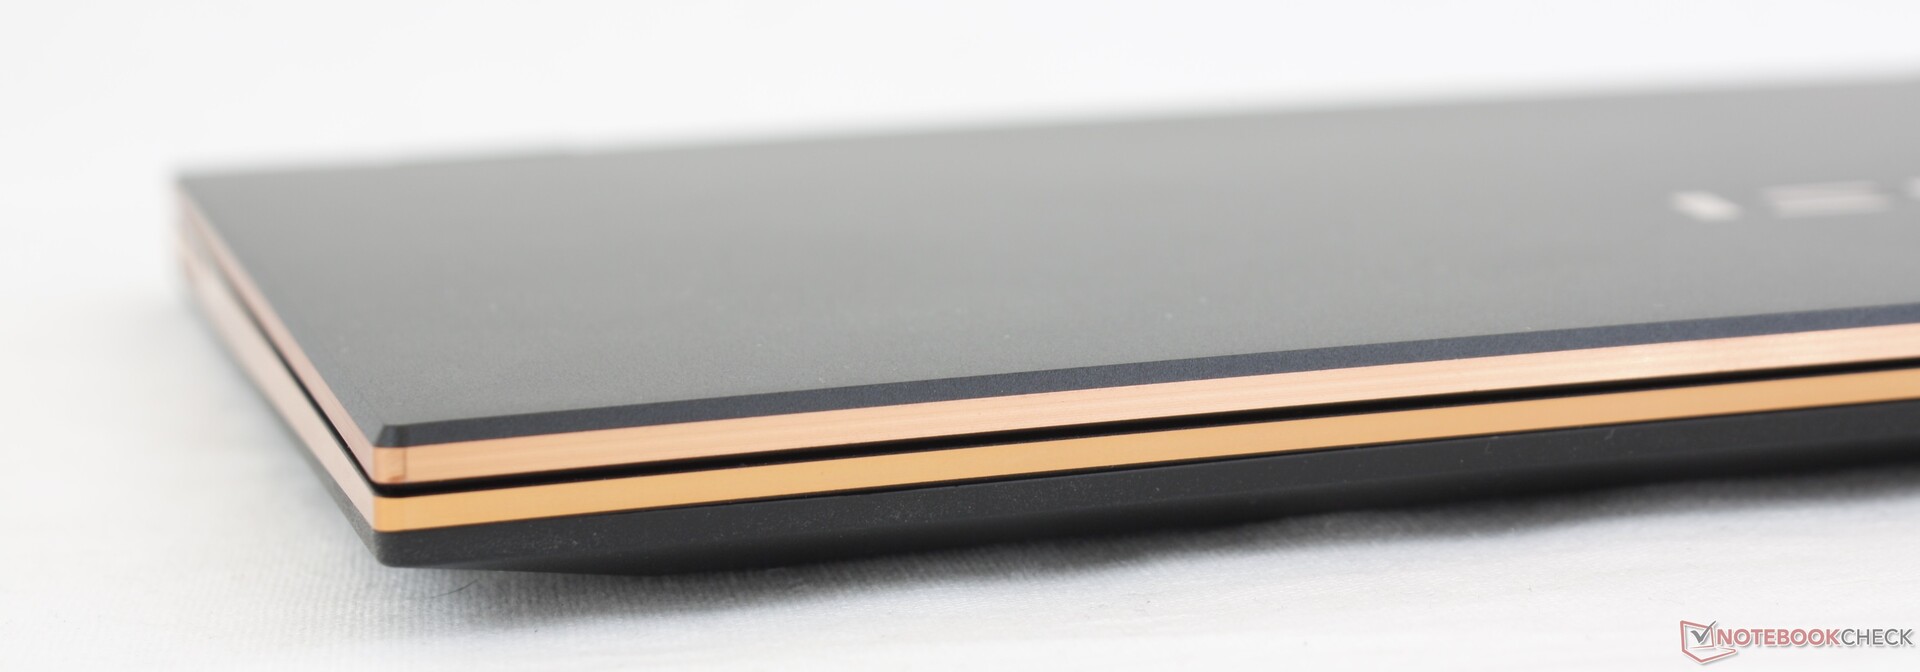
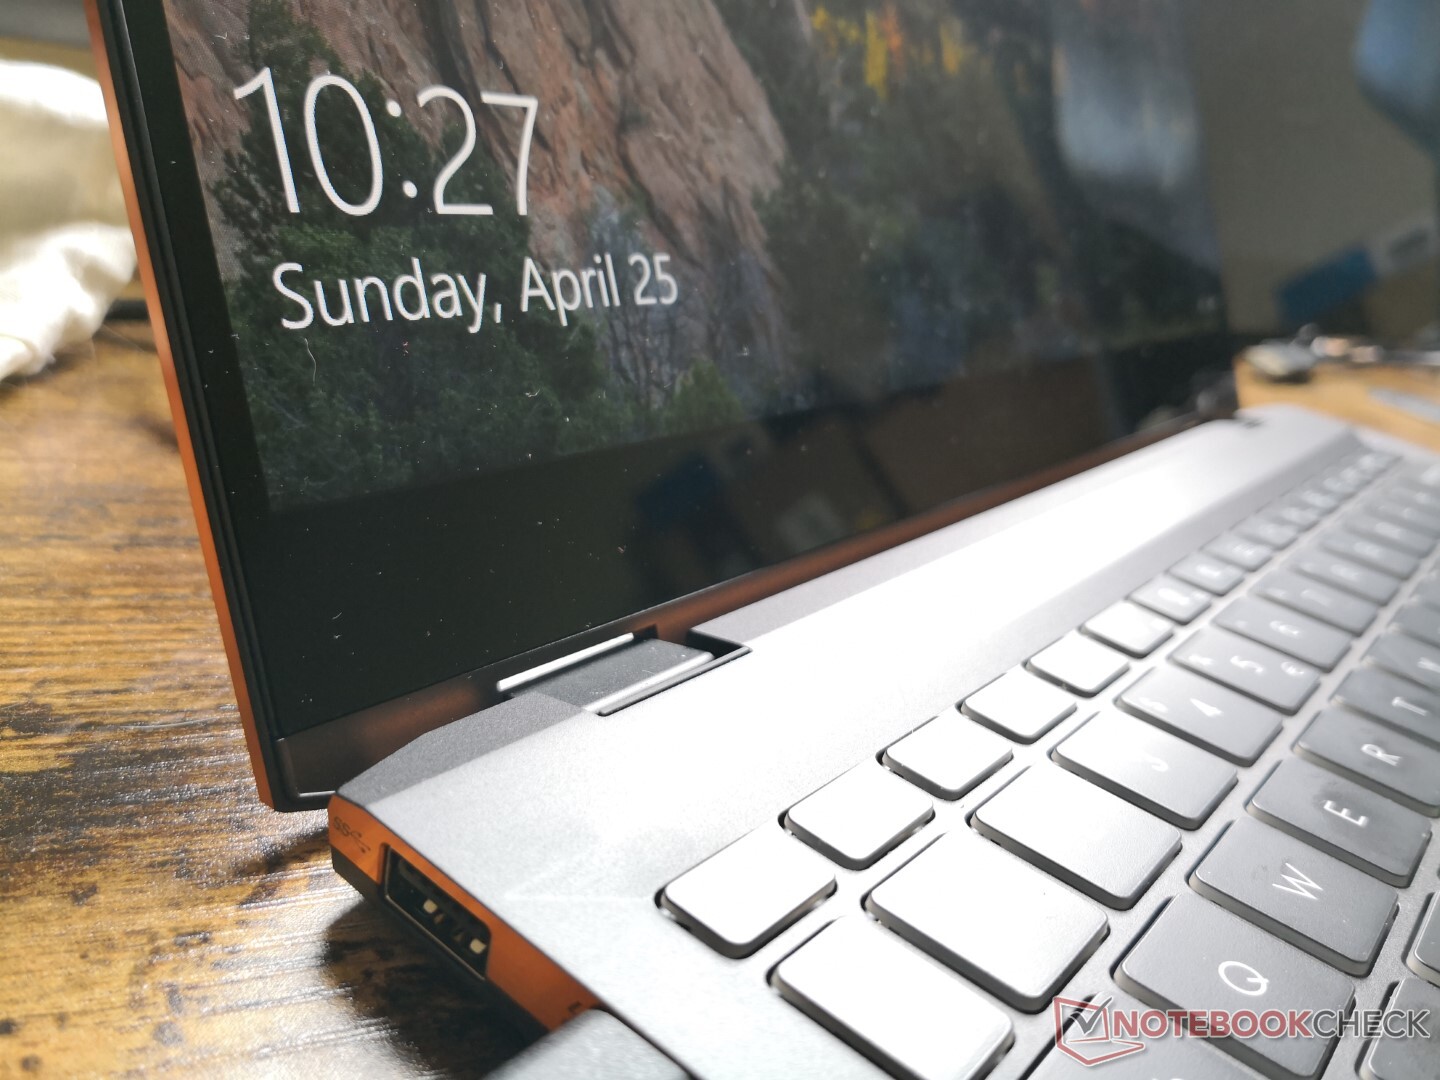
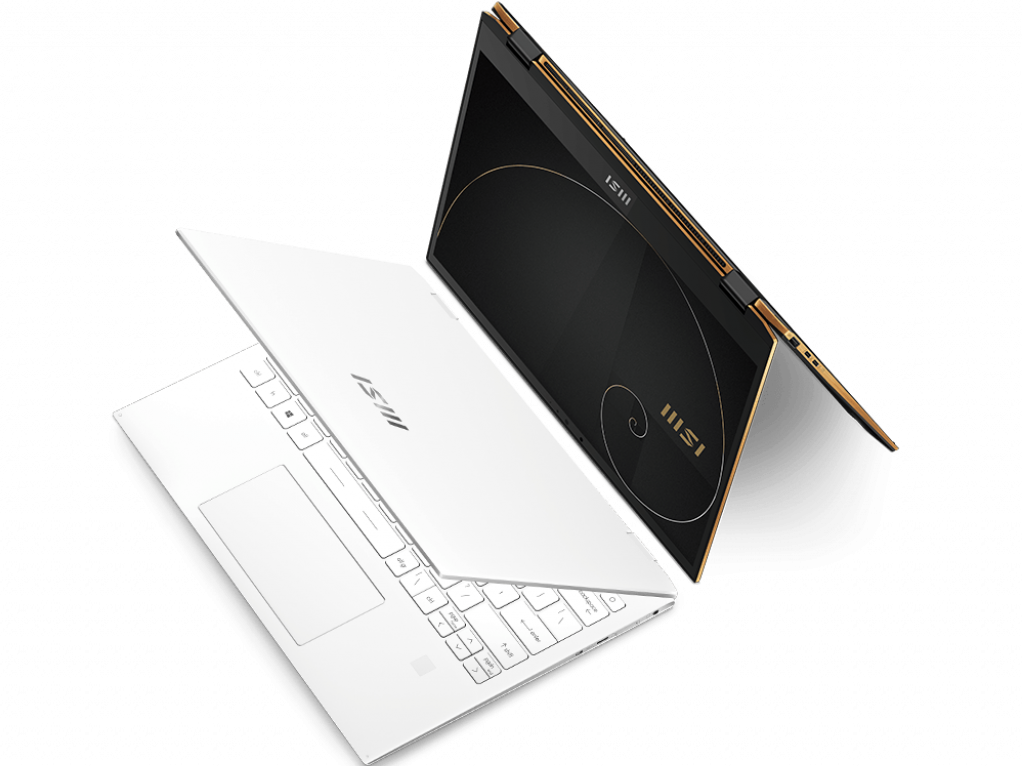
De matte askleurige oppervlakken en bronskleurige randafwerkingen staan in contrast met de lichtgrijze Modern en Prestige series van MSI. In feite komen de algehele esthetiek en kleuren heel dicht in de buurt van wat HP biedt via zijn Spectre serie. Zelfs het scherpe, cursief gedrukte MSI logo op het buitenste deksel en de achterste "diamant-gesneden" hoeken lijken veel op de nieuwste Spectre laptops. Dit is geen sneer naar MSI of wat dan ook, we delen gewoon onze indrukken en observaties van het Summit ontwerp.
De stevigheid van de basis is uitstekend met slechts minimale vervorming en geen gekraak bij het draaien van de hoeken of het indrukken van het midden van het toetsenbord. Het deksel buigt echter een beetje meer dan op de Dell XPS 13 of HP Spectre x360 13 voor een iets zwakkere indruk. De scharnieren zijn ons minst favoriete aspect van de Summit E13 Flip, omdat ze zwak aanvoelen, vooral zodra je voorbij de 140 graden gaat. Het deksel heeft ook de neiging om te wankelen bij het aanpassen van de hoeken.
Hoe mooi hij er ook uitziet, de Summit E13 Flip is niet de kleinste in zijn categorie. Het systeem is nog steeds groter in lengte en breedte dan zowel de XPS 13 2-in-1 en Spectre x360 14, ook al biedt de laatste een iets groter 13,5-inch scherm. Het is ook een beetje zwaarder met ongeveer 100 g of zelfs 200 g in vergelijking met de Lenovo X1 Titanium Yoga. Dit wil niet zeggen dat de MSI niet licht of draagbaar is, maar er zijn zeker betere opties beschikbaar in dit opzicht.
Connectiviteit
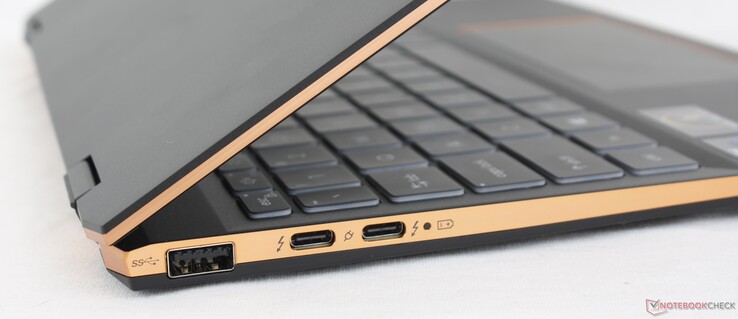
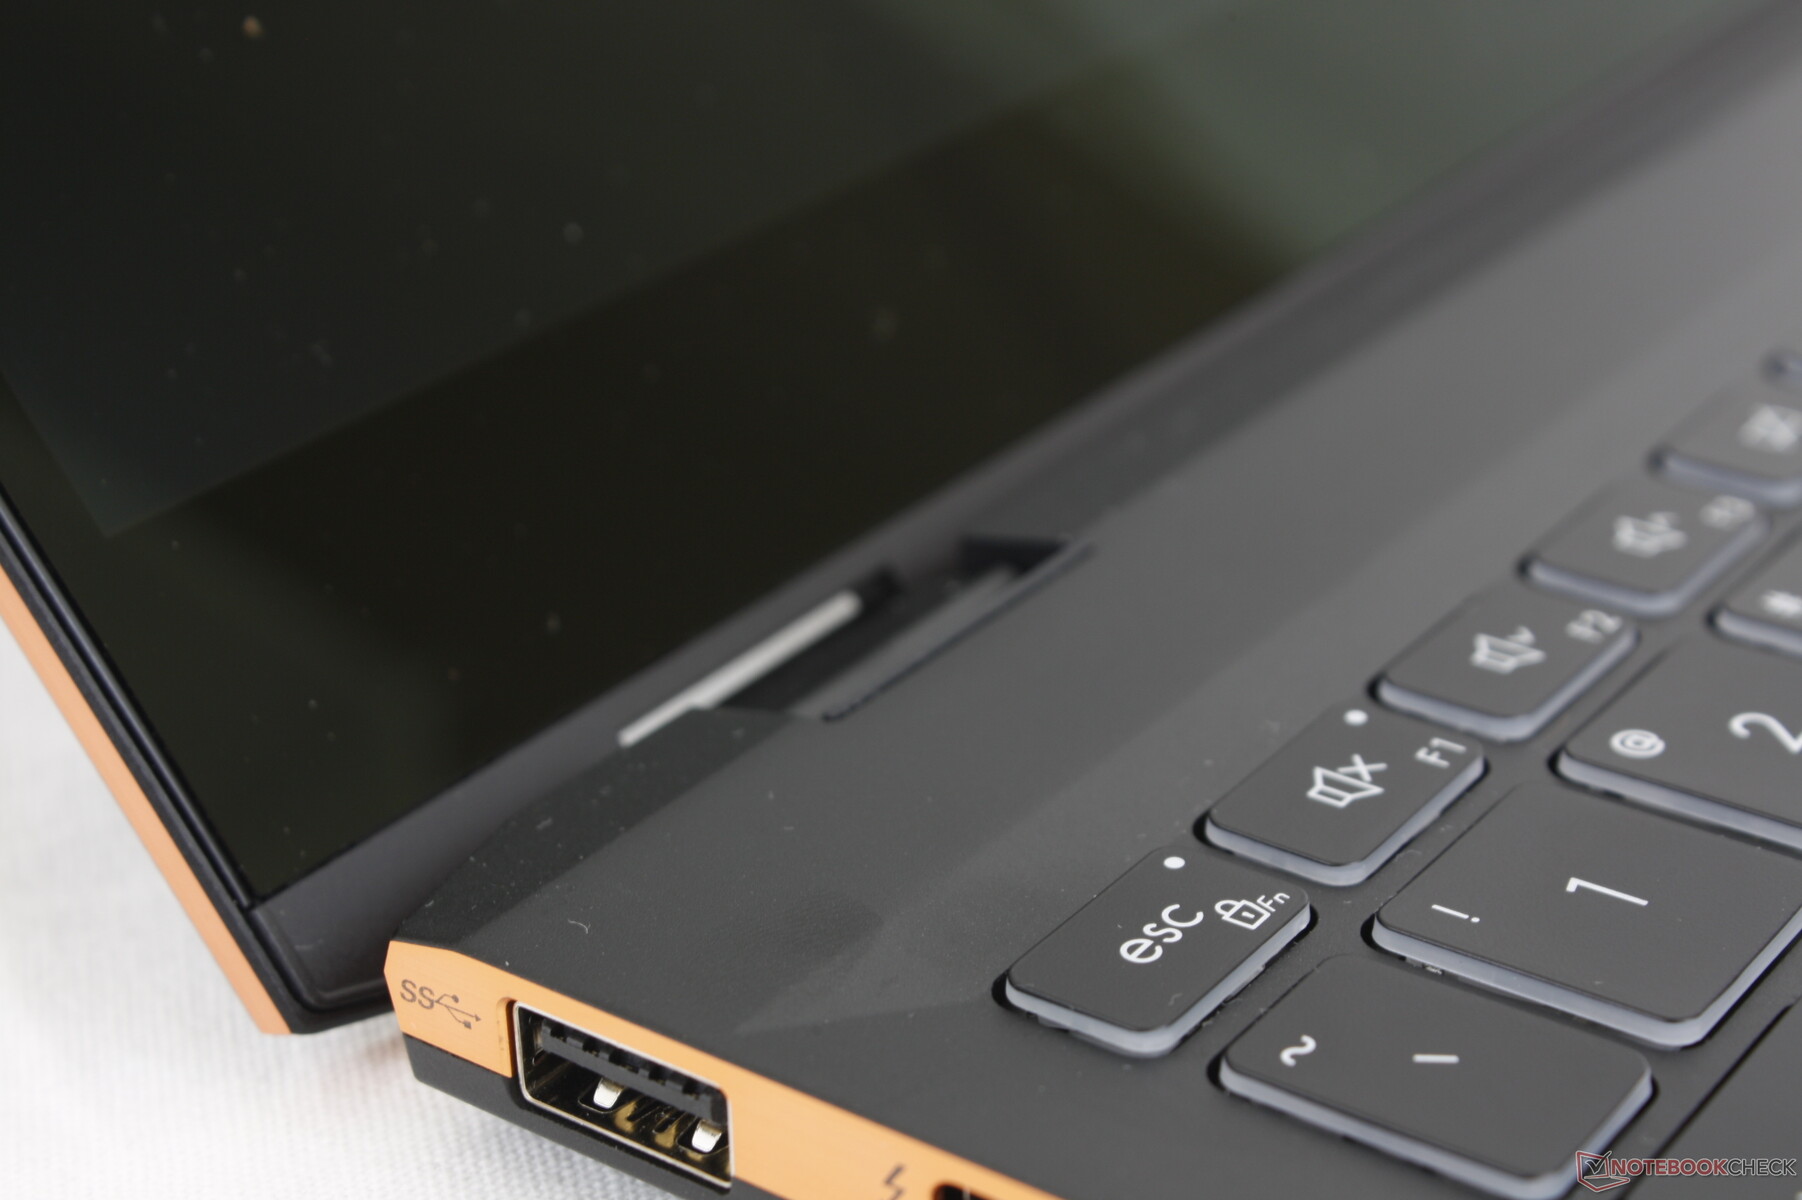
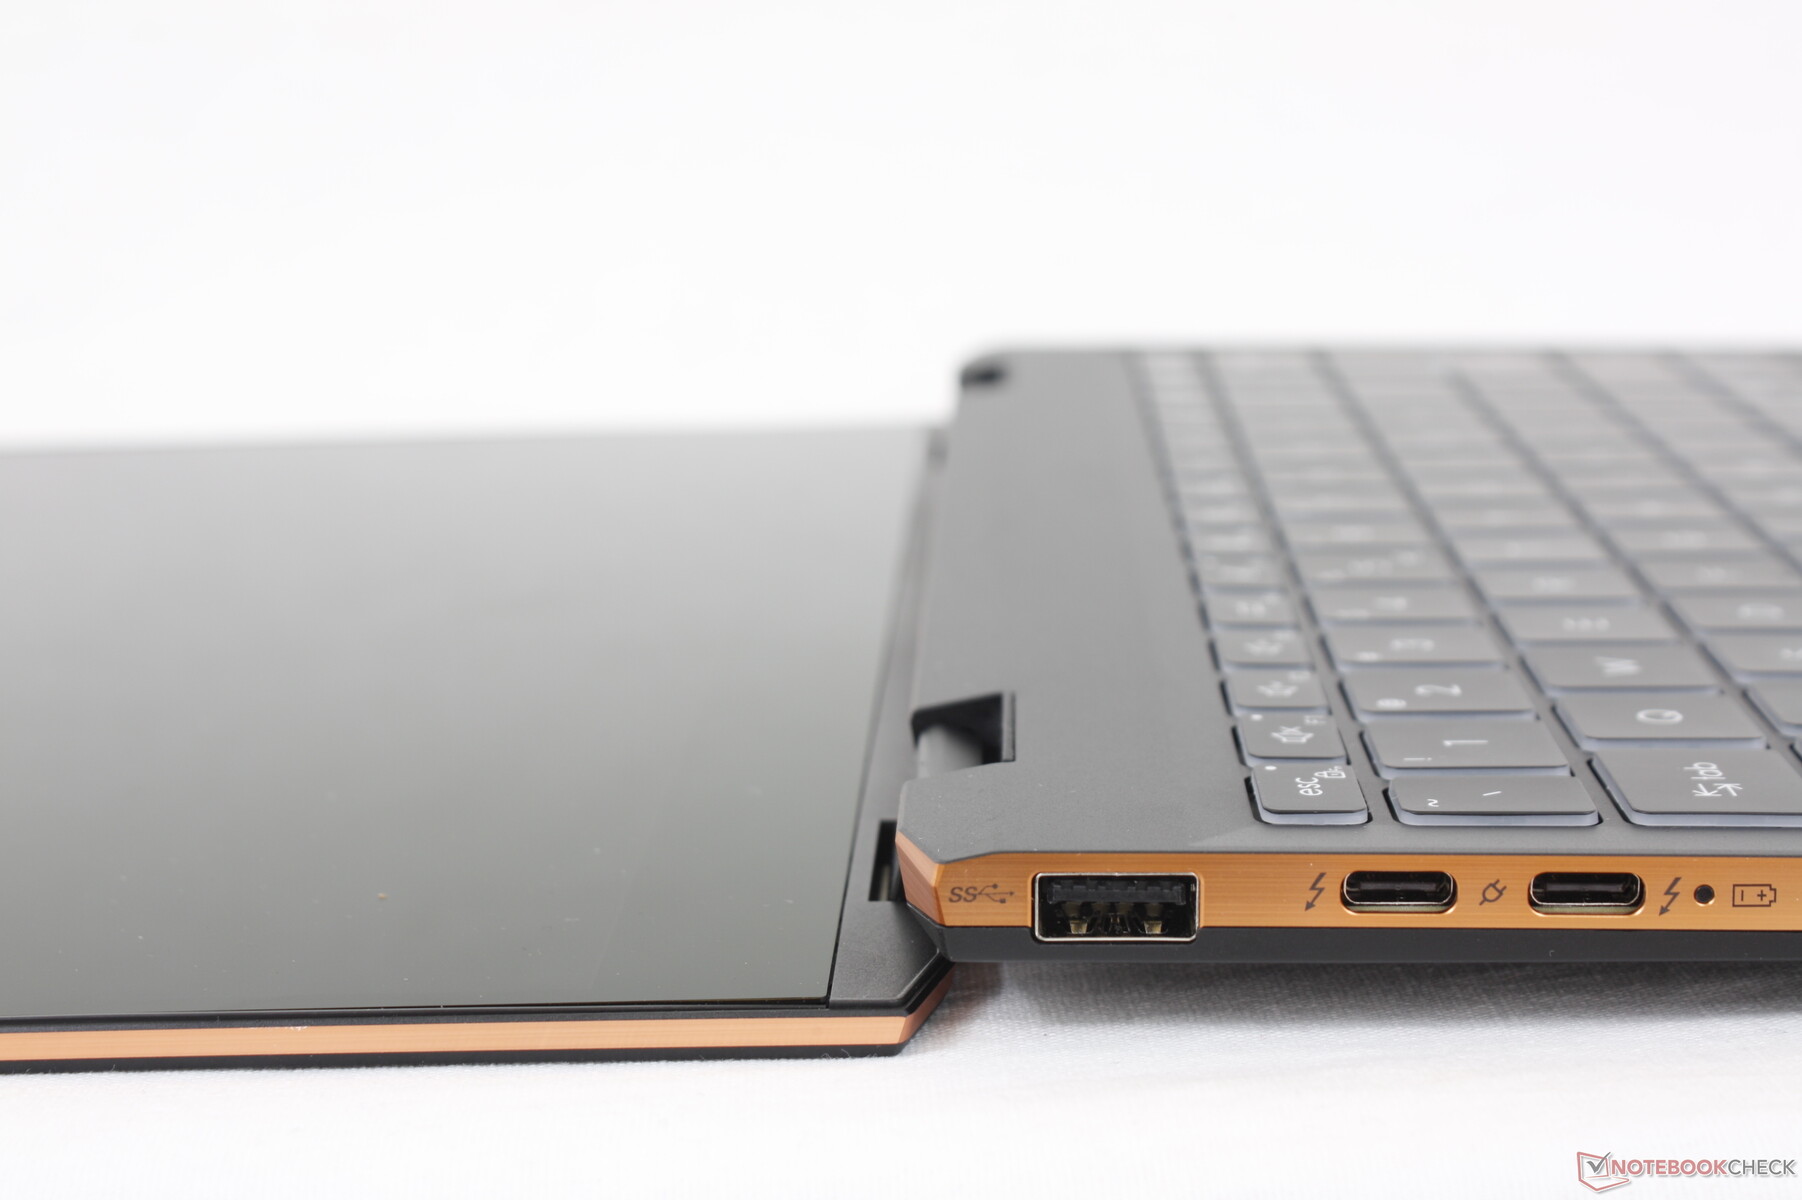
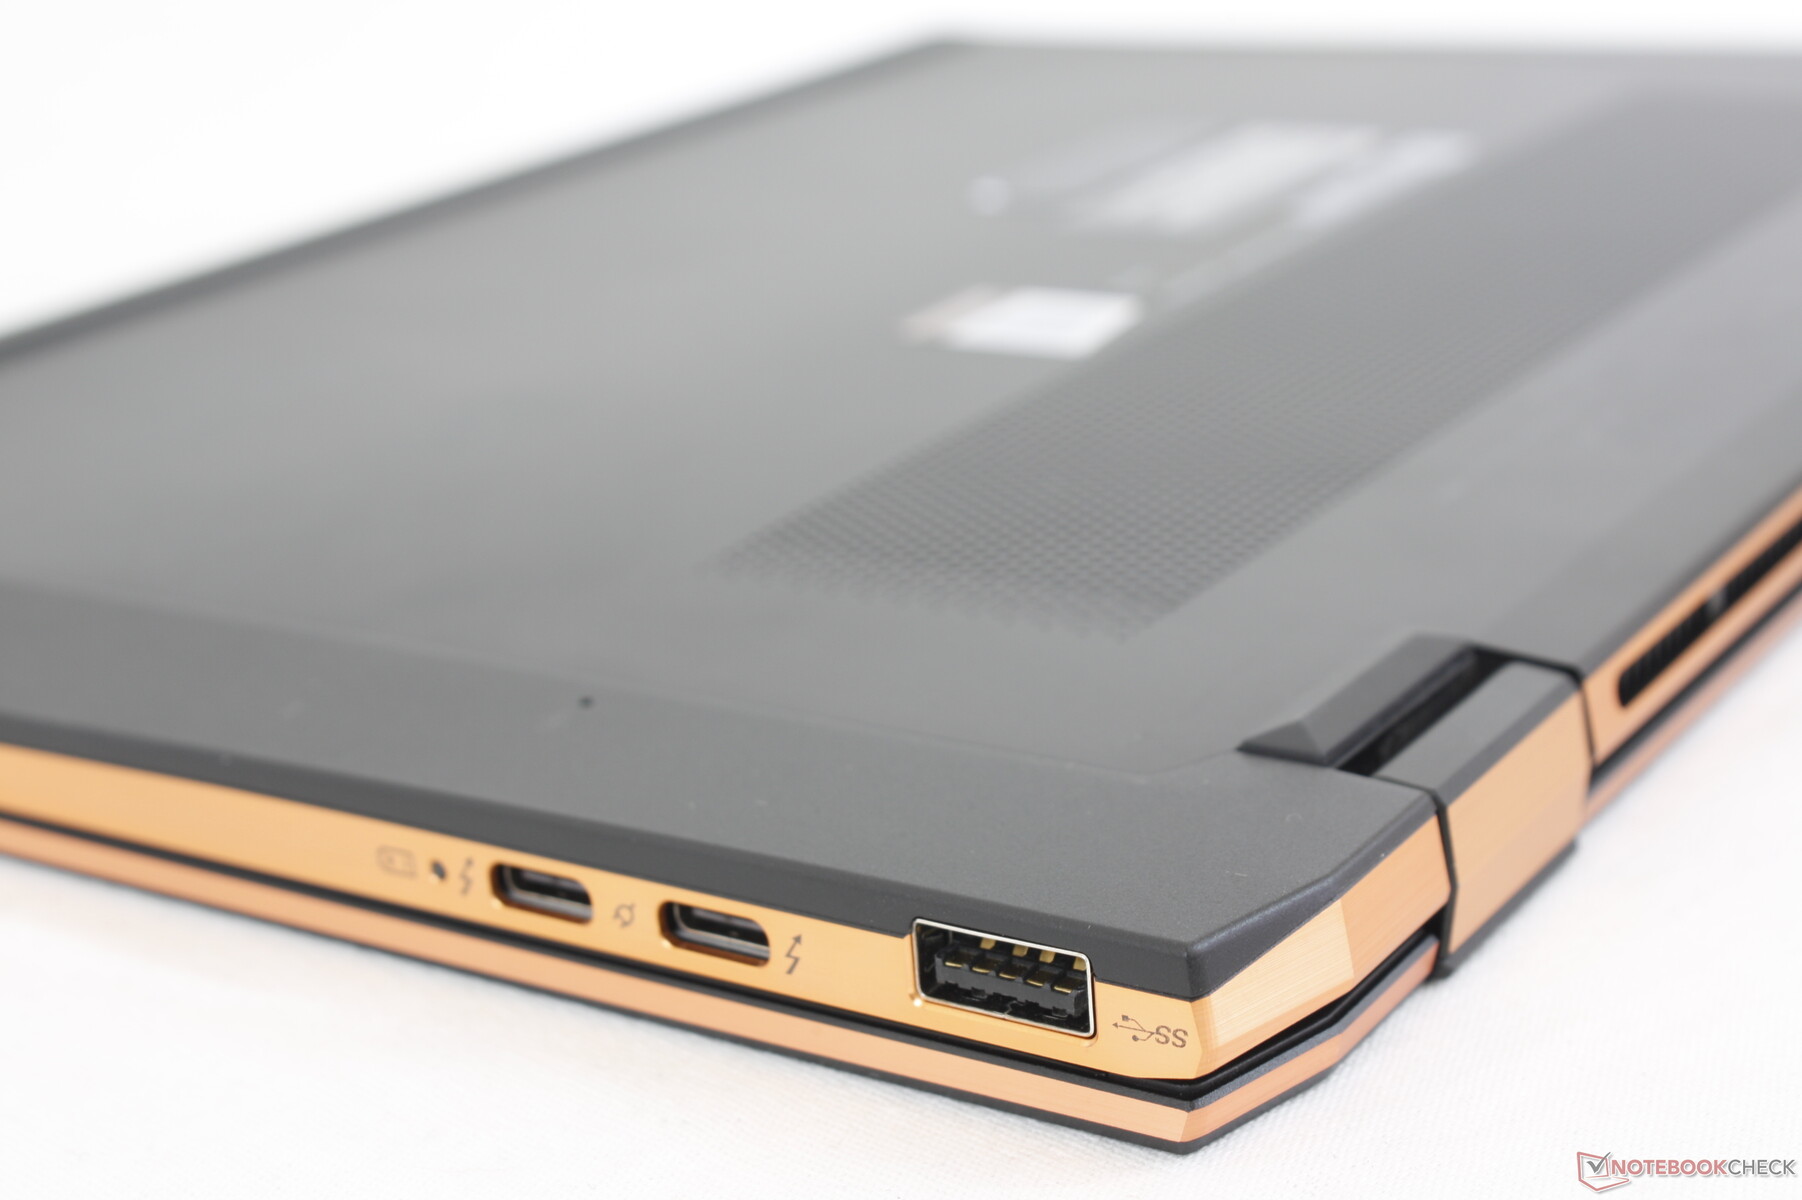
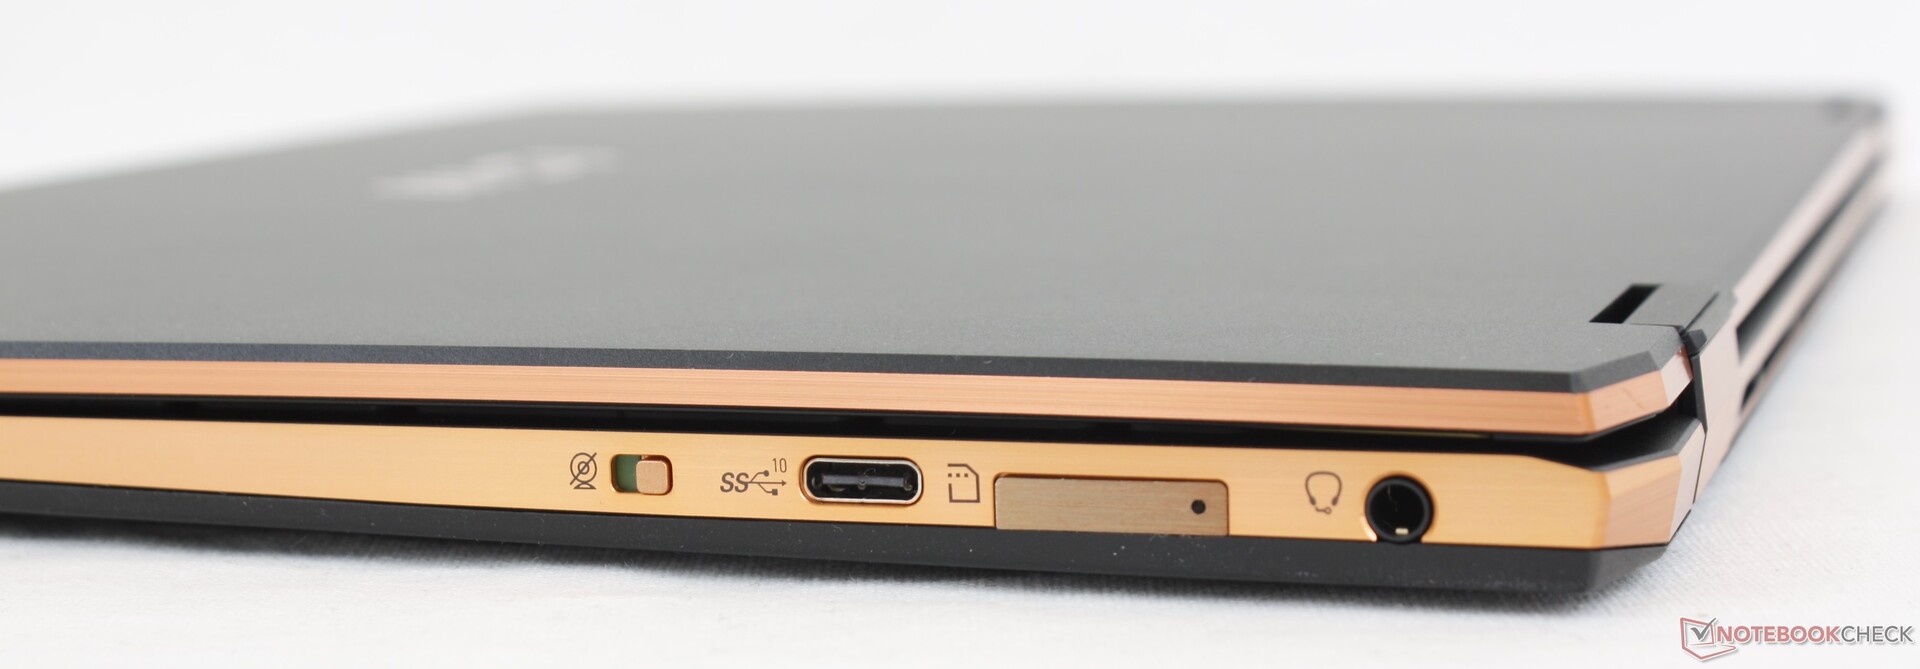
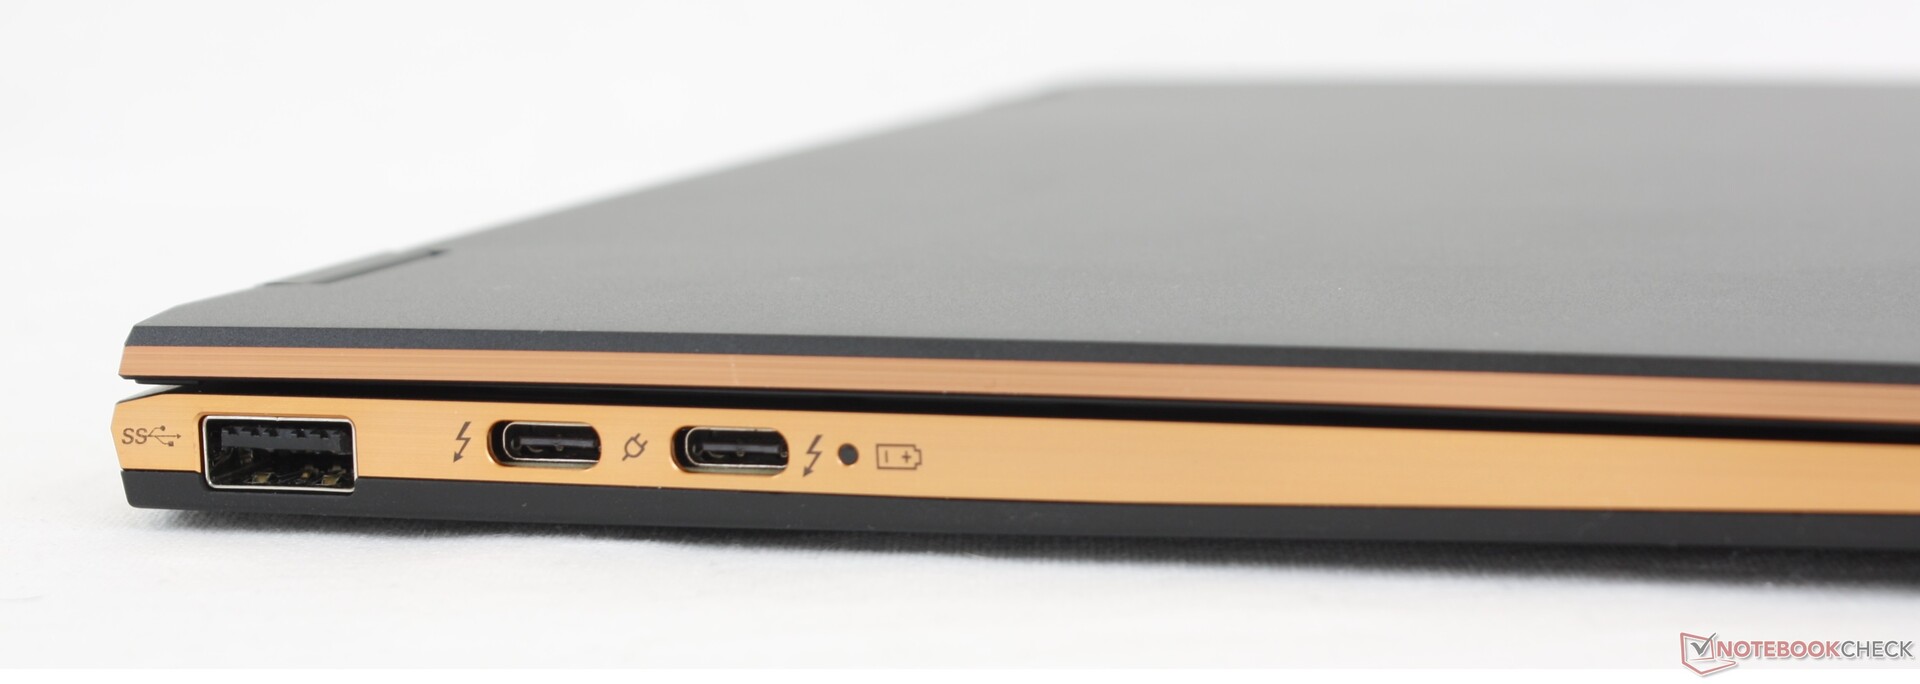
Poortopties zijn respectabel voor de categorie, want er zijn hier meer opties dan op de HP Spectre x360 14 of Dell XPS 13 7390 2-in-1. Het meest opvallend is dat het systeem wordt geleverd met drie USB-C poorten voor compatibiliteit met meerdere adapters. Merk op dat Power Delivery en DisplayPort alleen compatibel zijn op de USB-C poorten langs de linkerrand, terwijl de USB-C poort aan de rechterrand geen van beide ondersteunt.
Een bizar kenmerk van de MSI laptop is dat het twee camera kill-schakelaars heeft: een op het toetsenbord en een langs de rechterrand. Het zou eenvoudiger zijn geweest om slechts één uitschakelaar te hebben om te voorkomen dat je met twee verschillende schakelaars moet klungelen.
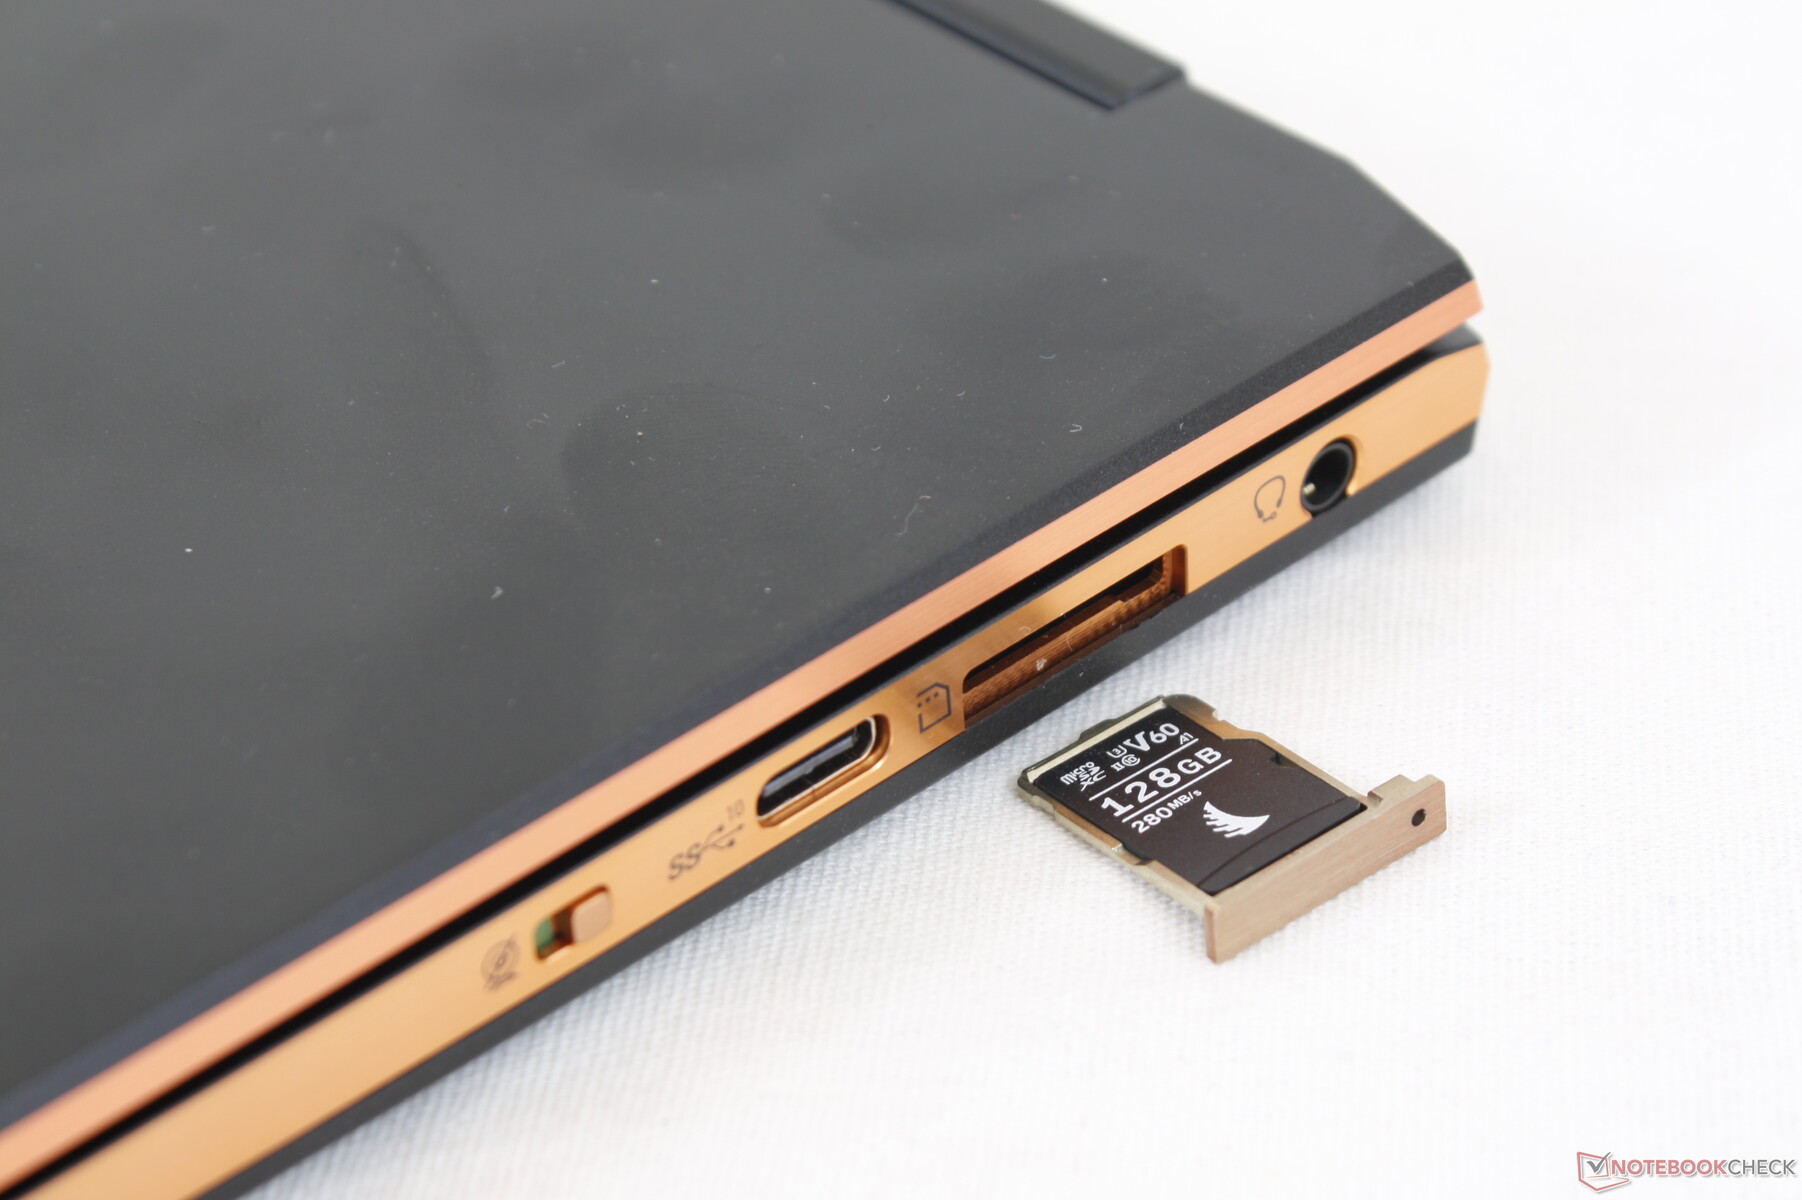
SD-kaartlezer
In tegenstelling tot op de meeste andere laptops, is de toegang tot de MicroSD-lezer op de Summit E13 Flip een SIM-pick nodig, wat een beetje een gedoe is. Overdrachtssnelheden zijn ook langzamer dan verwacht op minder dan de helft van die van de Spectre x360 14 of XPS 13.
| SD Card Reader | |
| average JPG Copy Test (av. of 3 runs) | |
| HP Spectre x360 14t-ea000 (Toshiba Exceria Pro M501 microSDXC 32GB) | |
| Dell XPS 13 7390 2-in-1 Core i7 (Toshiba Exceria Pro M501 64 GB UHS-II) | |
| Asus Zenbook 14 UX435EG (Toshiba Exceria Pro M501 microSDXC 64GB) | |
| MSI Summit E13 Flip Evo A11MT (AV PRO microSD 128 GB V60) | |
| maximum AS SSD Seq Read Test (1GB) | |
| HP Spectre x360 14t-ea000 (Toshiba Exceria Pro M501 microSDXC 32GB) | |
| Dell XPS 13 7390 2-in-1 Core i7 (Toshiba Exceria Pro M501 64 GB UHS-II) | |
| Asus Zenbook 14 UX435EG (Toshiba Exceria Pro M501 microSDXC 64GB) | |
| MSI Summit E13 Flip Evo A11MT (AV PRO microSD 128 GB V60) | |
Communicatie
Het systeem wordt geleverd met de nieuwere Intel AX210 in plaats van de AX200/201 voor compatibiliteit met Wi-Fi 6E. Desondanks zijn de overdrachtsnelheden trager dan verwacht wanneer het systeem is verbonden met onze Netgear RAX200-testrouter, zelfs na meerdere hertests.
Killer USB-C Ethernet Adapter - Upgrade naar een stabiele verbinding
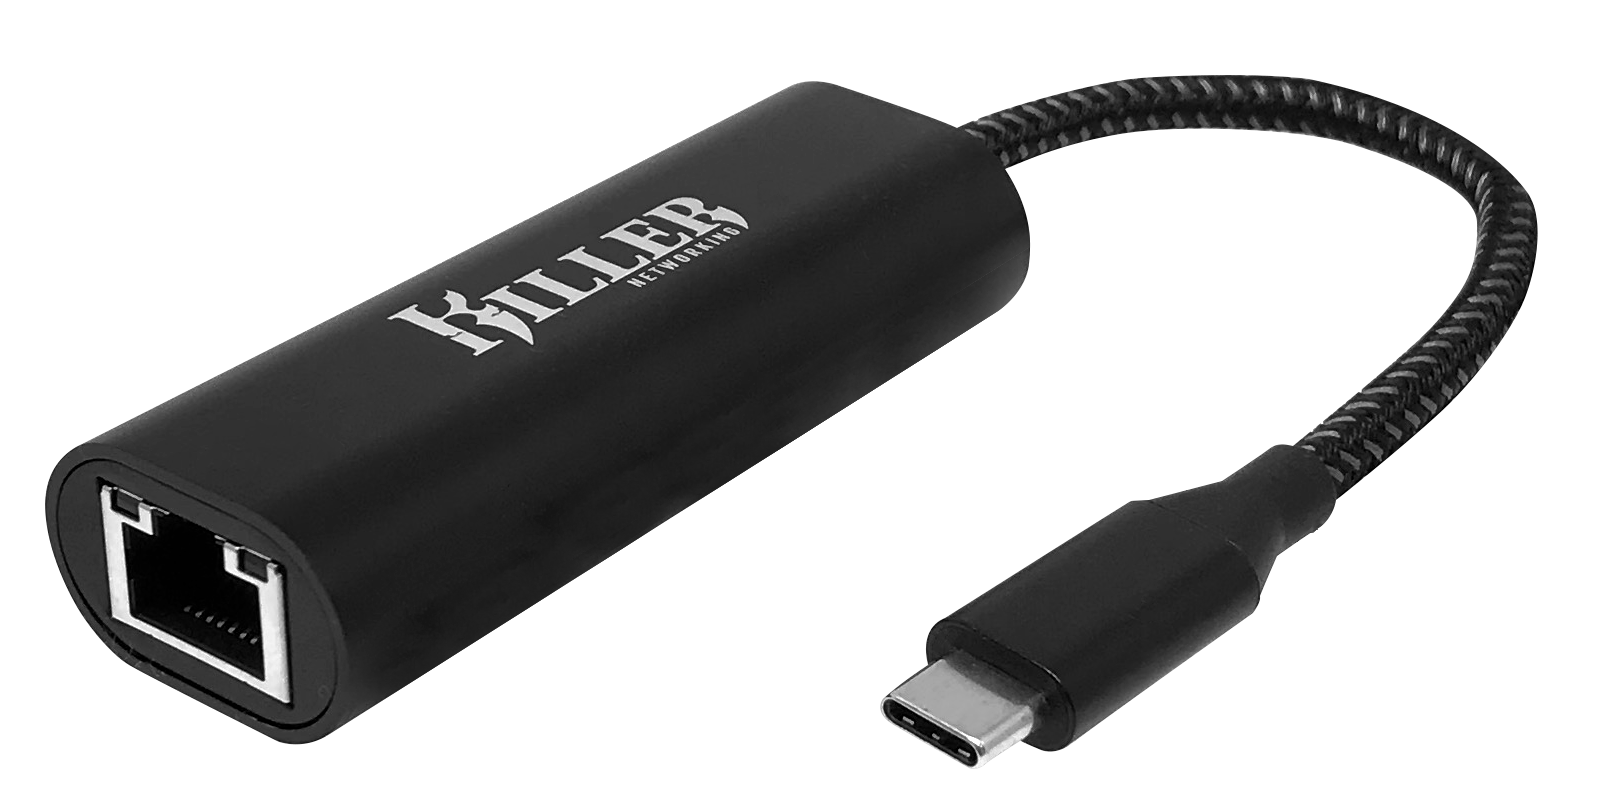
Ondanks de vooruitgang in draadloze netwerken, is Ethernet nog steeds de eerste keuze voor gamers en power users. De Killer 2.5G Ethernet naar USB-C Adapter maakt naadloze Ethernet-connectiviteit mogelijk met volledige 2,5 Gbps doorvoer. Het brengt ook het beste van Killer-technologieën, waaronder de veel geprezen Killer Prioritization Engine, GameFast, Extreme Mode, en Intelligence Engine die ervoor zorgen dat uw favoriete game of app de bandbreedte en prioriteit krijgt die het verdient. Voor laptops die al zijn uitgerust met een draadloze Killer-kaart, biedt Killer DoubleShot Pro bandbreedteverdubbeling en fijnkorrelige controle over netwerkpakketten die door elke verbinding gaan.
Tijdens onze tests heeft de Killer 2.5G Ethernet Adapter de geadverteerde snelheden consequent waargemaakt. U kunt meer lezen over de prestatievergelijking met andere USB Ethernet Adapters in onsartikel.
De Killer 2.5G Ethernet naar USB-C adapter kan worden gekocht op Amazon voor US$ 49,99
Webcam


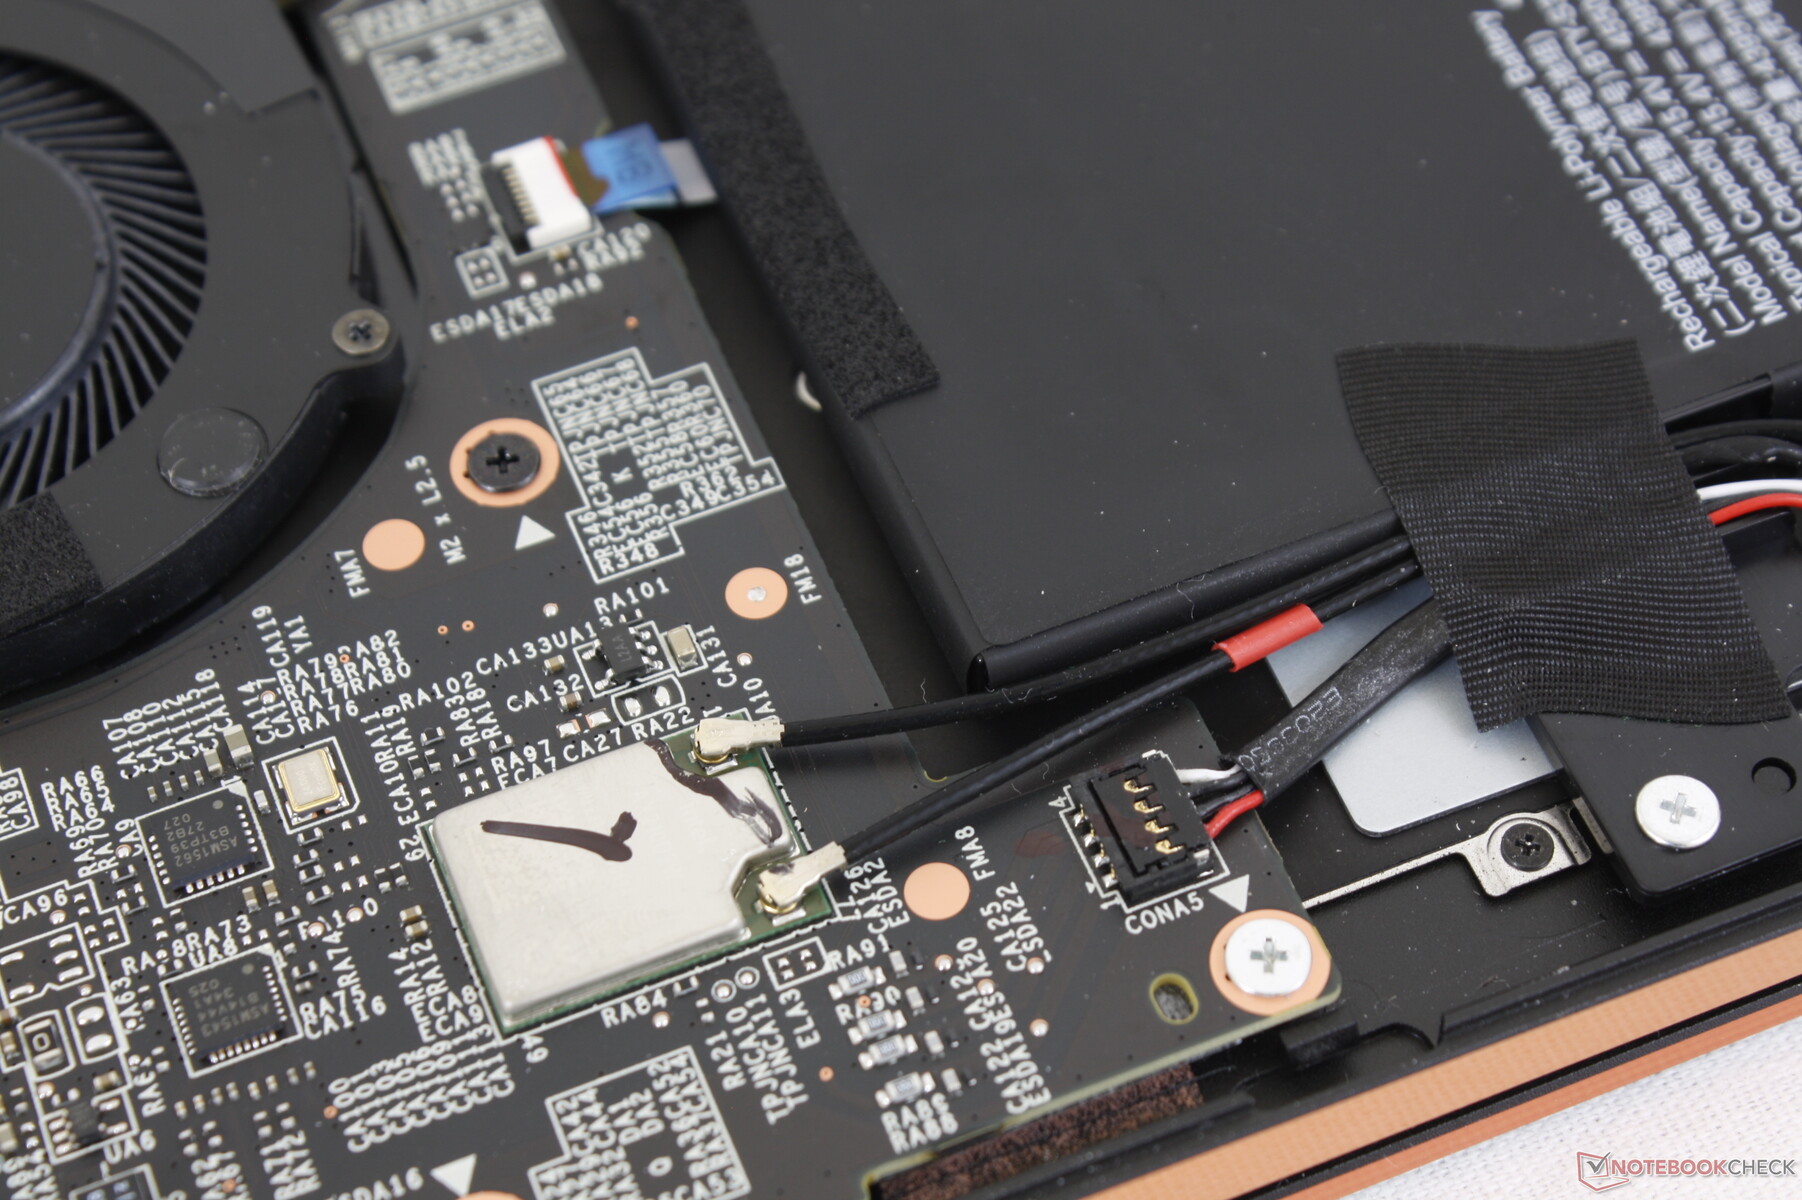
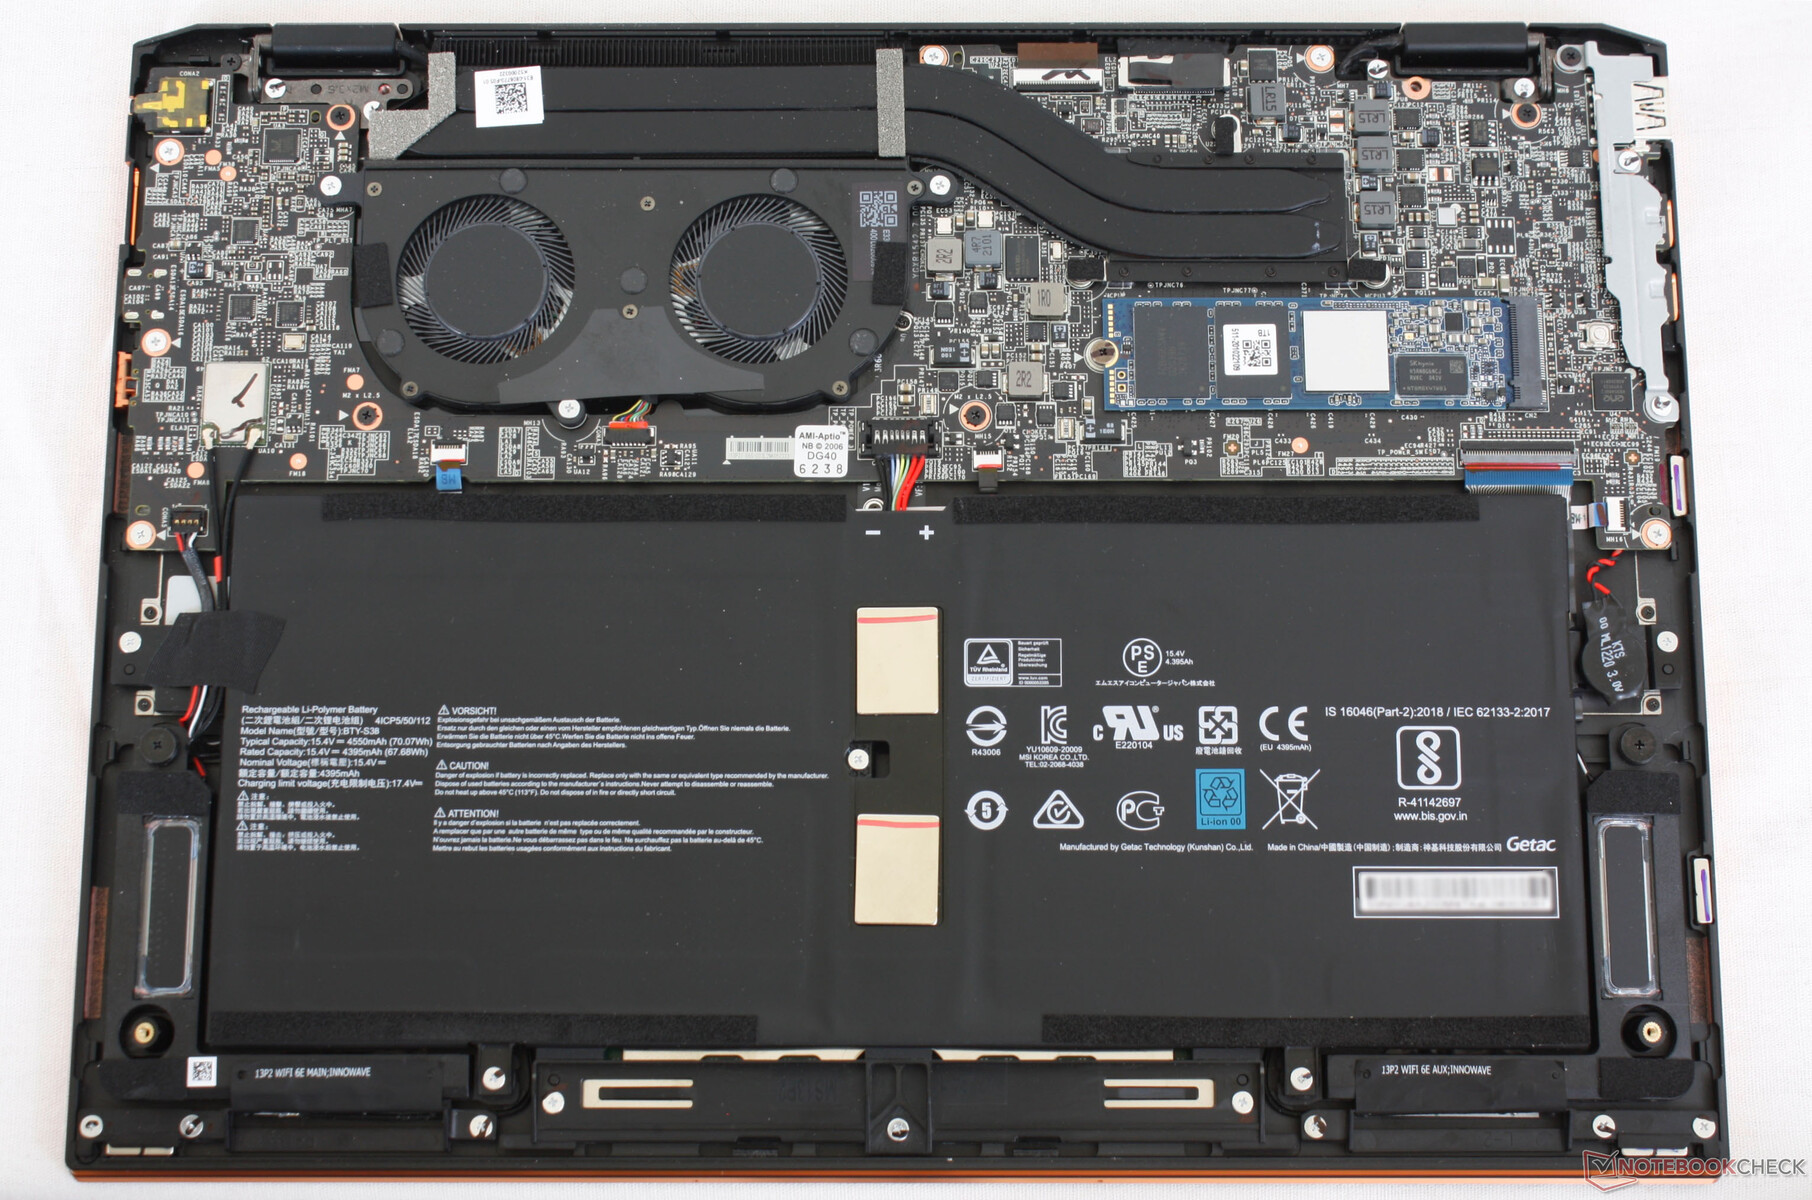
Onderhoud
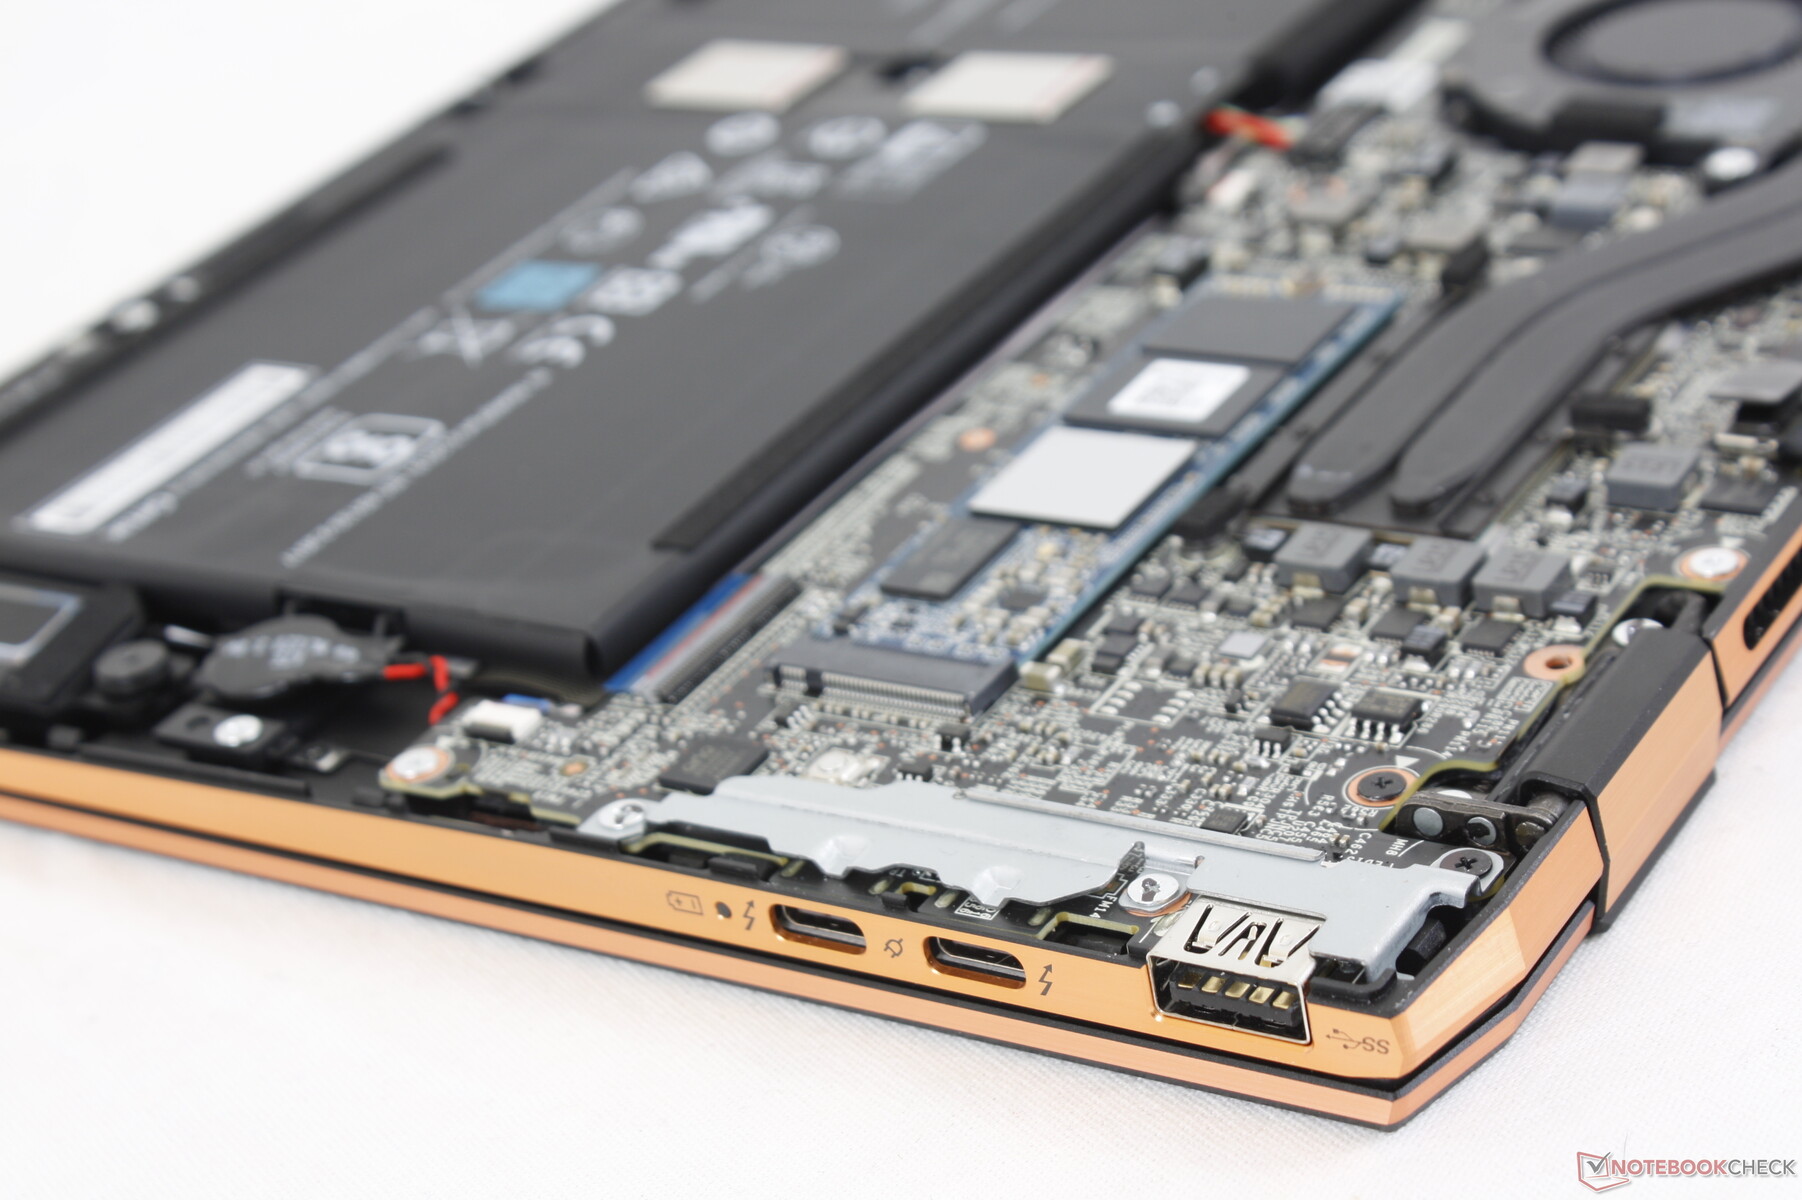
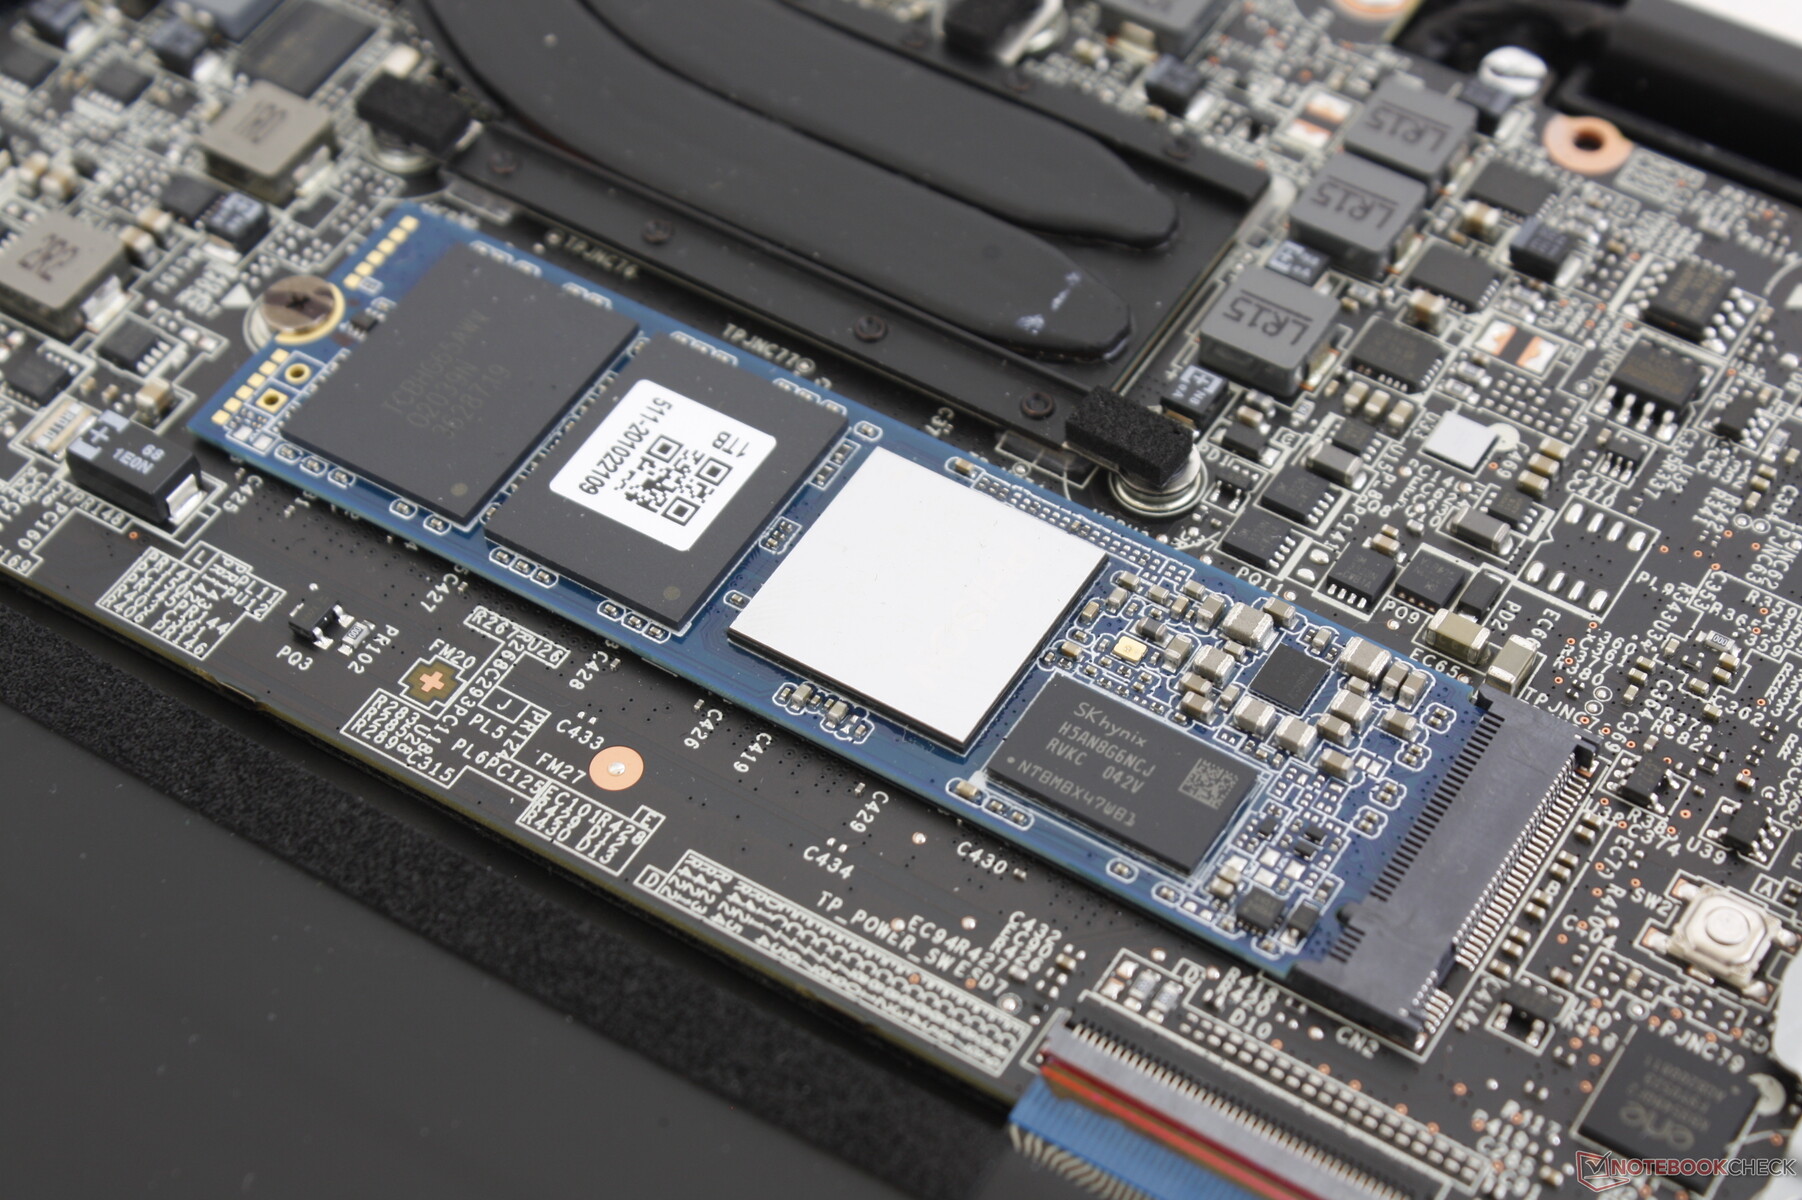
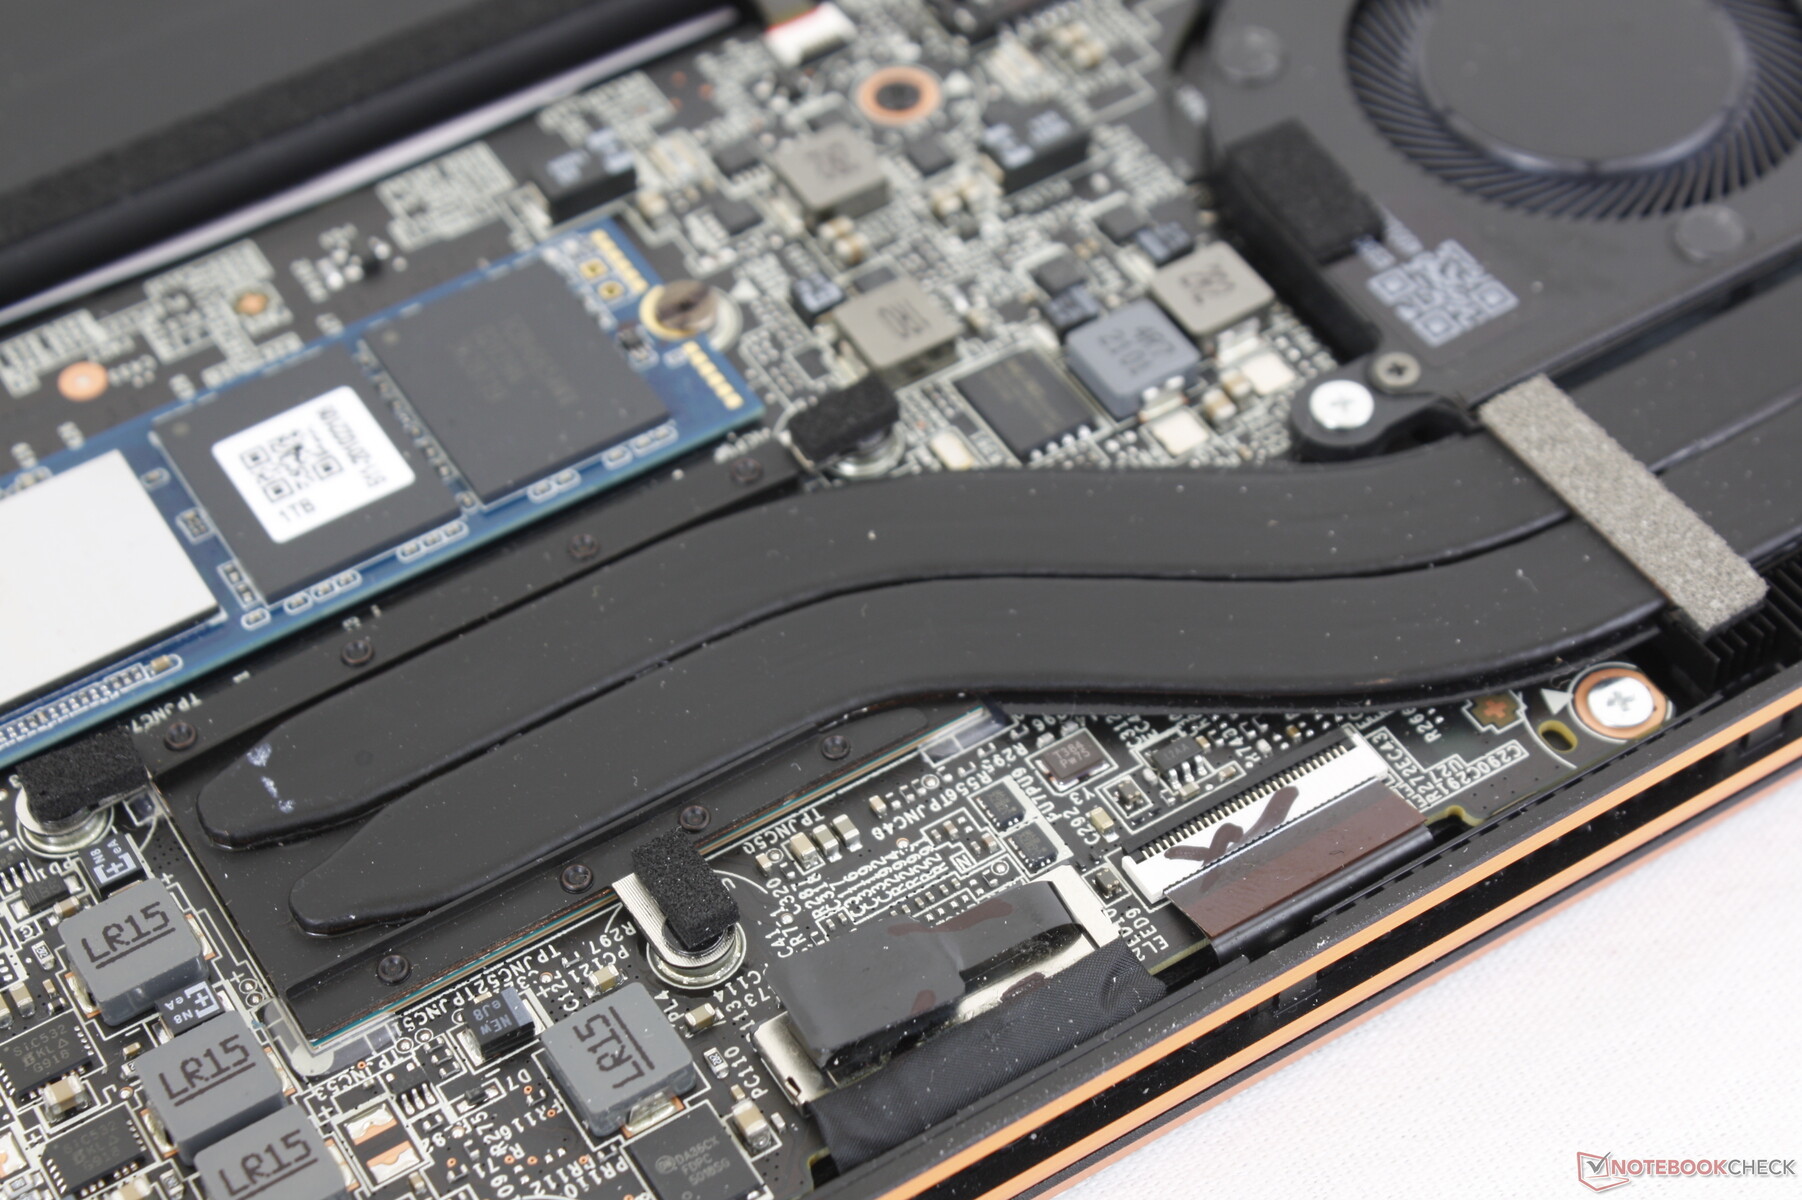
Het bodempaneel wordt vastgezet met slechts vier Philips-schroeven. Houd er echter rekening mee dat een 'fabriekszegel' sticker moet worden verbroken en dat de twee achterste schroeven zijn verborgen onder de rubberen voetjes. Het is dus moeilijker om de Summit E13 Flip te onderhouden in vergelijking met de meeste andere laptops van MSI.
Alleen het enkele M.2 2280 slot is upgradebaar, aangezien zowel RAM als WLAN zijn gesoldeerd.
Accessoires en garantie
De verpakking bevat een actieve MSI pen en een beschermende draaghoes naast het gebruikelijke papierwerk. Een reinigingsdoekje wordt niet meegeleverd
De standaard beperkte garantie van een jaar is van toepassing met extra bescherming indien besteld bij Xotic PC.
Invoerapparaten
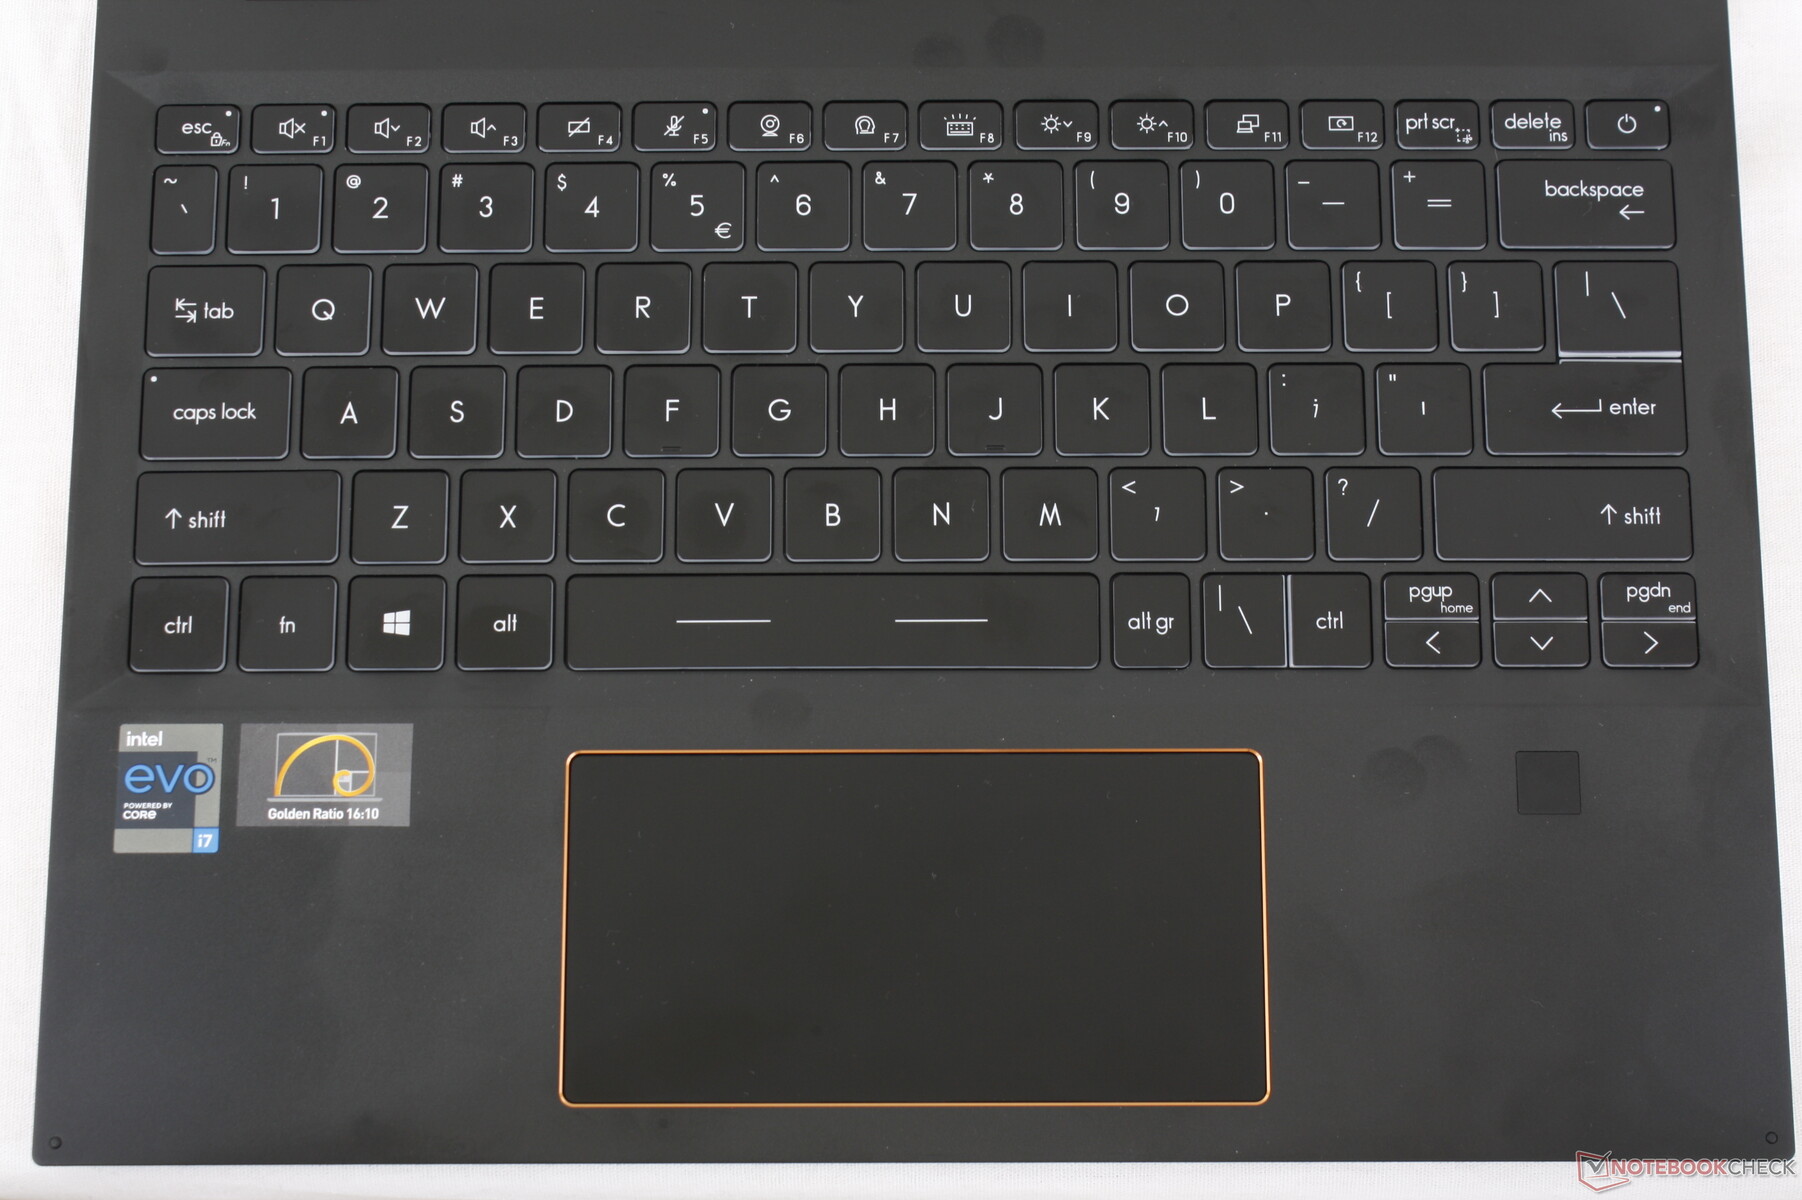
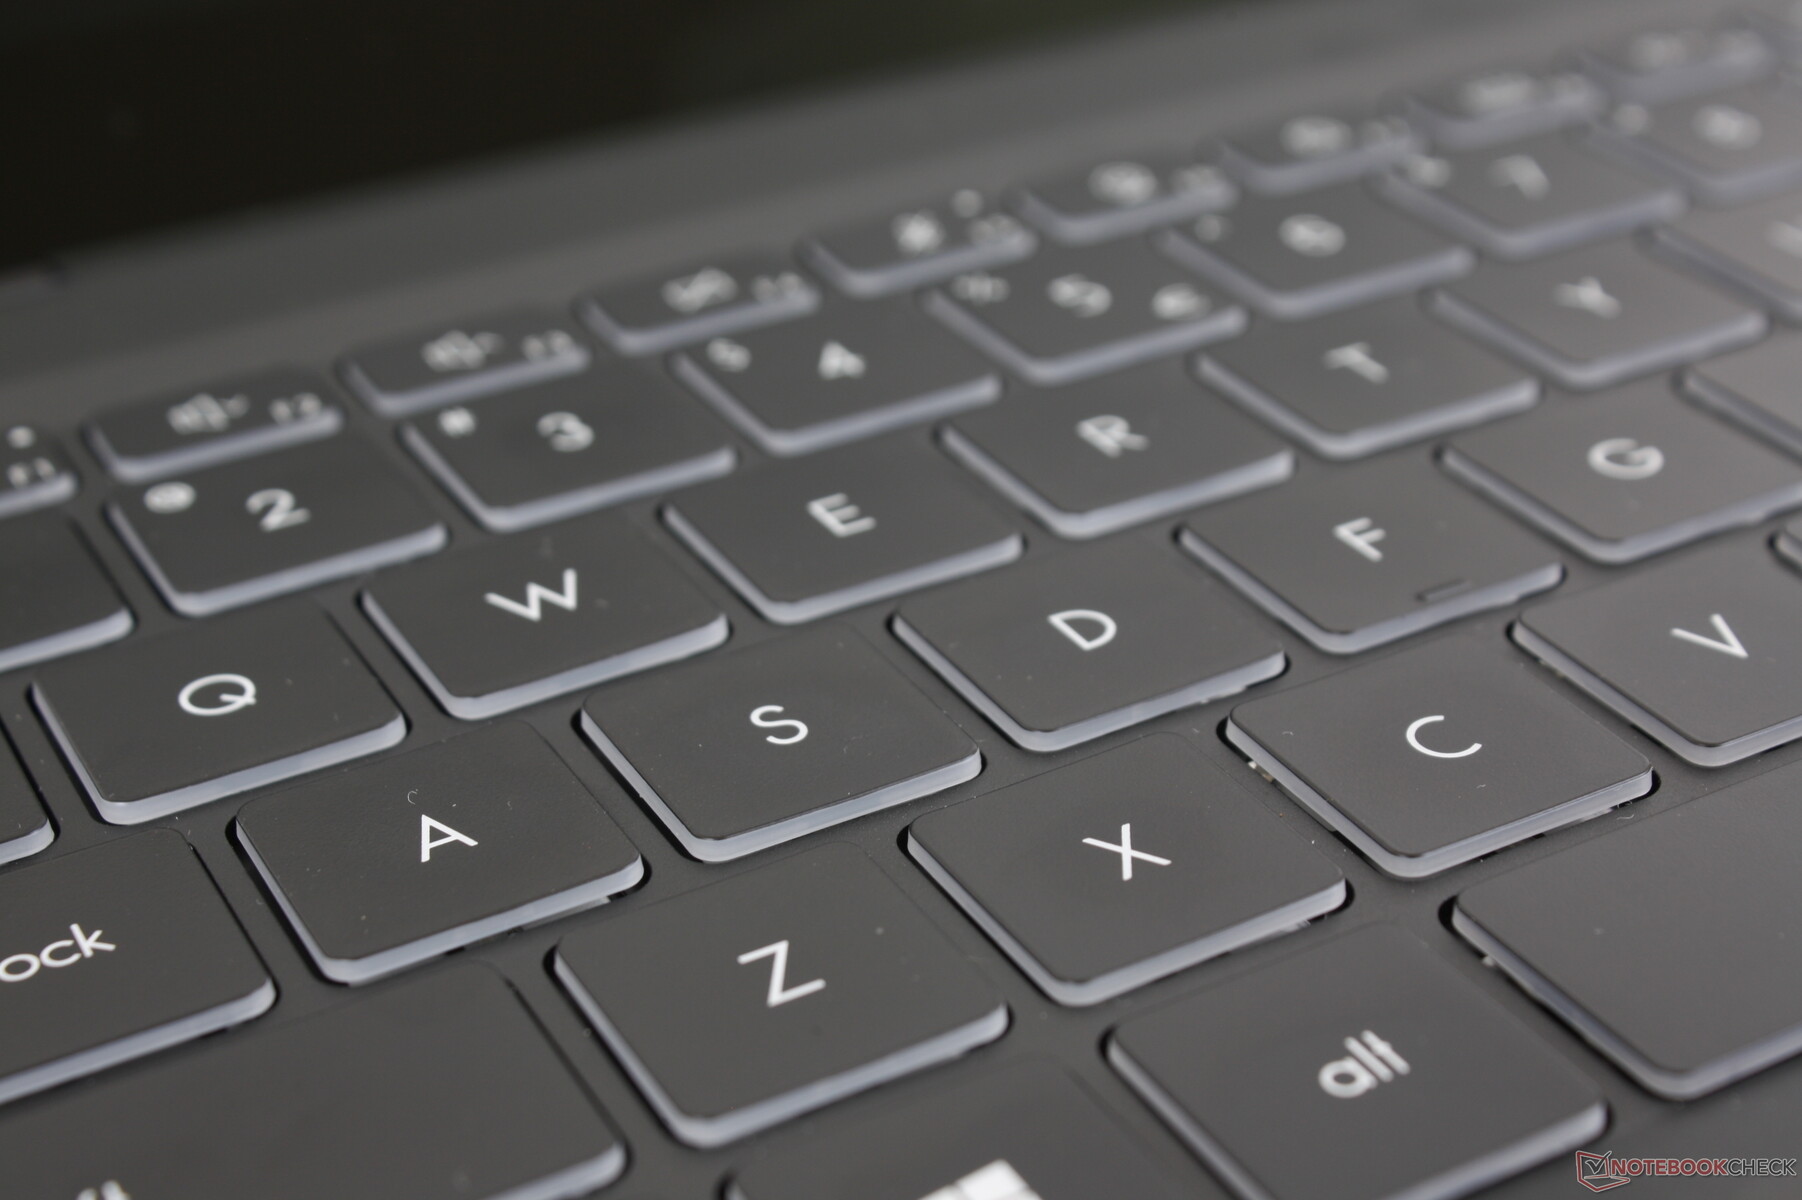
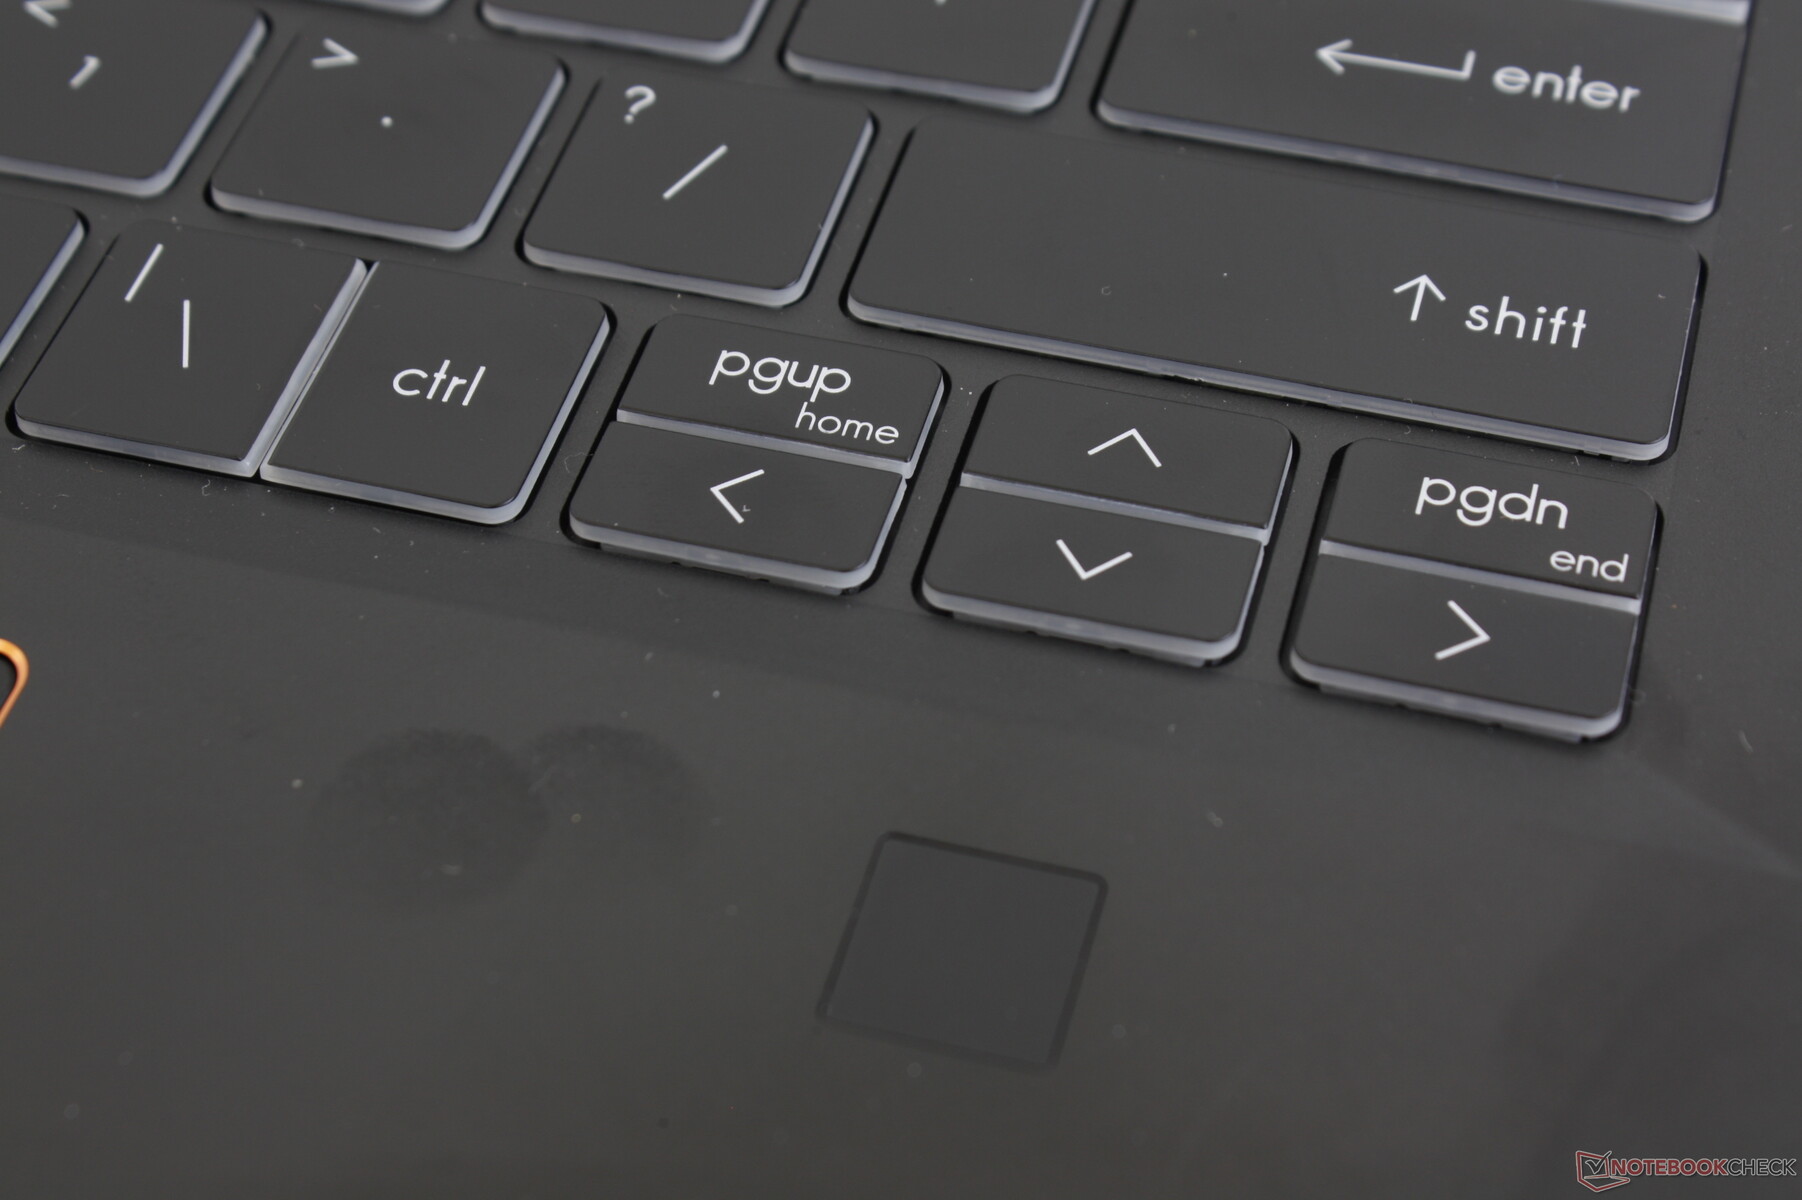
Toetsenbord
De toetsenbordindeling is geheel nieuw voor de Summit serie. De grote richtingstoetsen, PgUp, PgDn, en Delete toetsen op de Prestige 14bijvoorbeeld, zijn nu veel kleiner op de Summit E13 Flip. De Ctrl-toets is ook samengedrukt met de "g"-toets, waardoor hij vervelend in het gebruik is
De travel is ondiep en de toets feedback is aan de lichte kant in vergelijking met de stevigere en diepere toetsen van de HP Spectre. MSI biedt niet iets bijzonder innovatiefs of speciaals in dit opzicht, omdat de type-ervaring hier vergelijkbaar is met mid-range Ultrabooks zoals de Asus VivoBook.
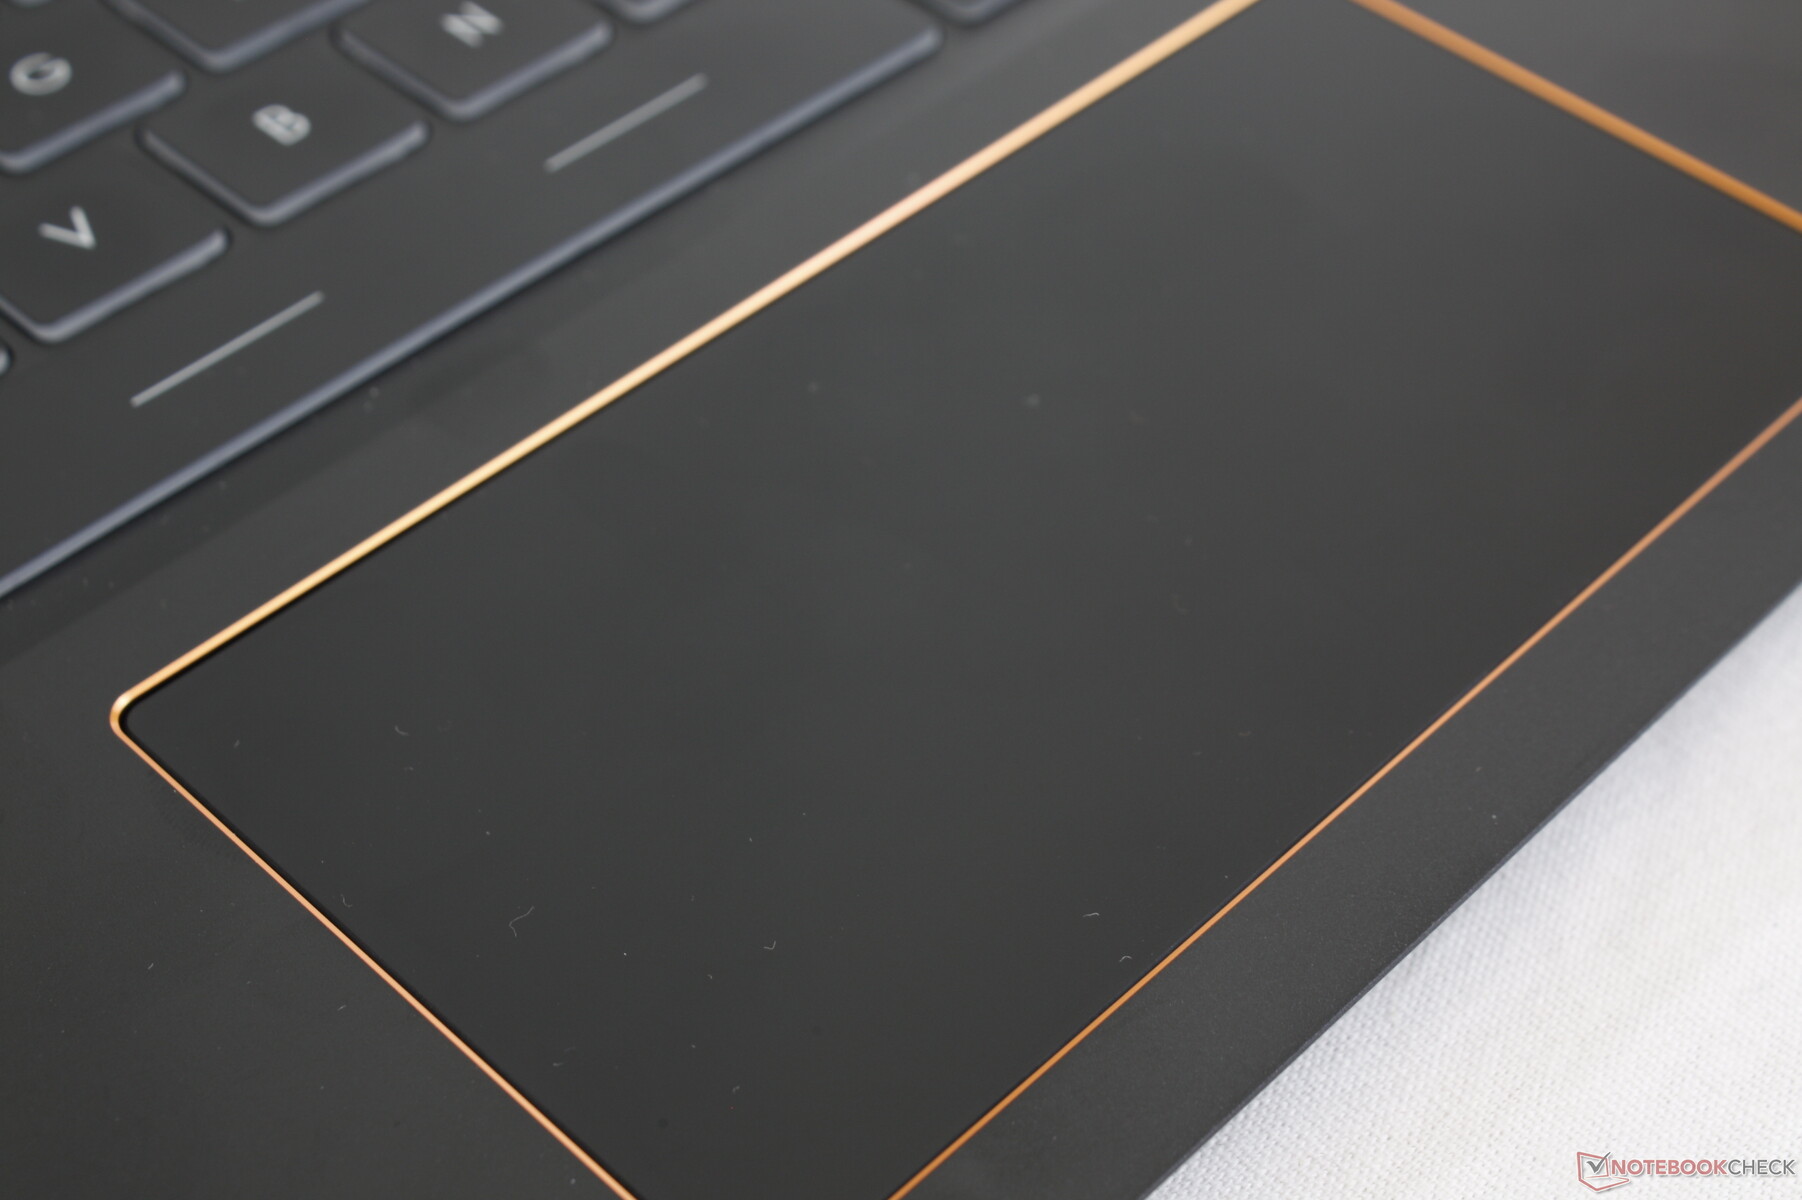
Touchpad
Het brede clickpad is iets groter dan het clickpad op de HP Spectre x360 13 (~12 x 6 cm vs. 11,1 x 5,6 cm). Het oppervlak is volledig glad en textuurloos met slechts een beetje plakken bij het glijden op langzamere snelheden. Cursorbesturing voelt responsiever aan dan op de meeste andere subnotebooks dankzij de native 120 Hz verversingssnelheid van het beeldscherm.
De geïntegreerde muisknoppen geven een matige feedback en kletteren relatief zachtjes wanneer ze worden ingedrukt. Hoewel er niets bijzonders mis is met de manier waarop de muisknoppen zijn geïmplementeerd, hadden we persoonlijk liever een hardere en luidere feedback gehad voor meer bevredigende klikken.
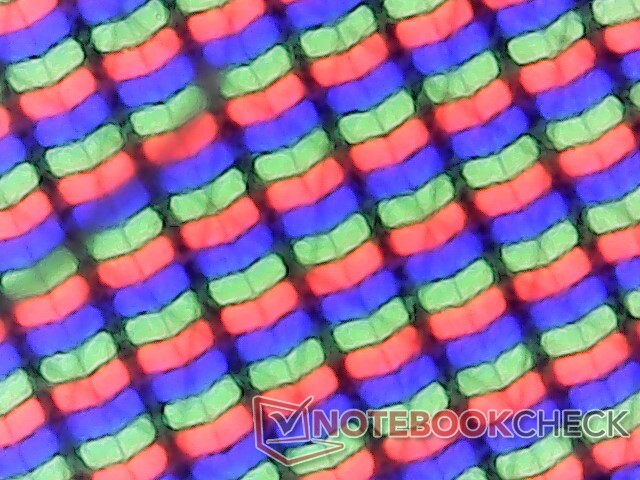
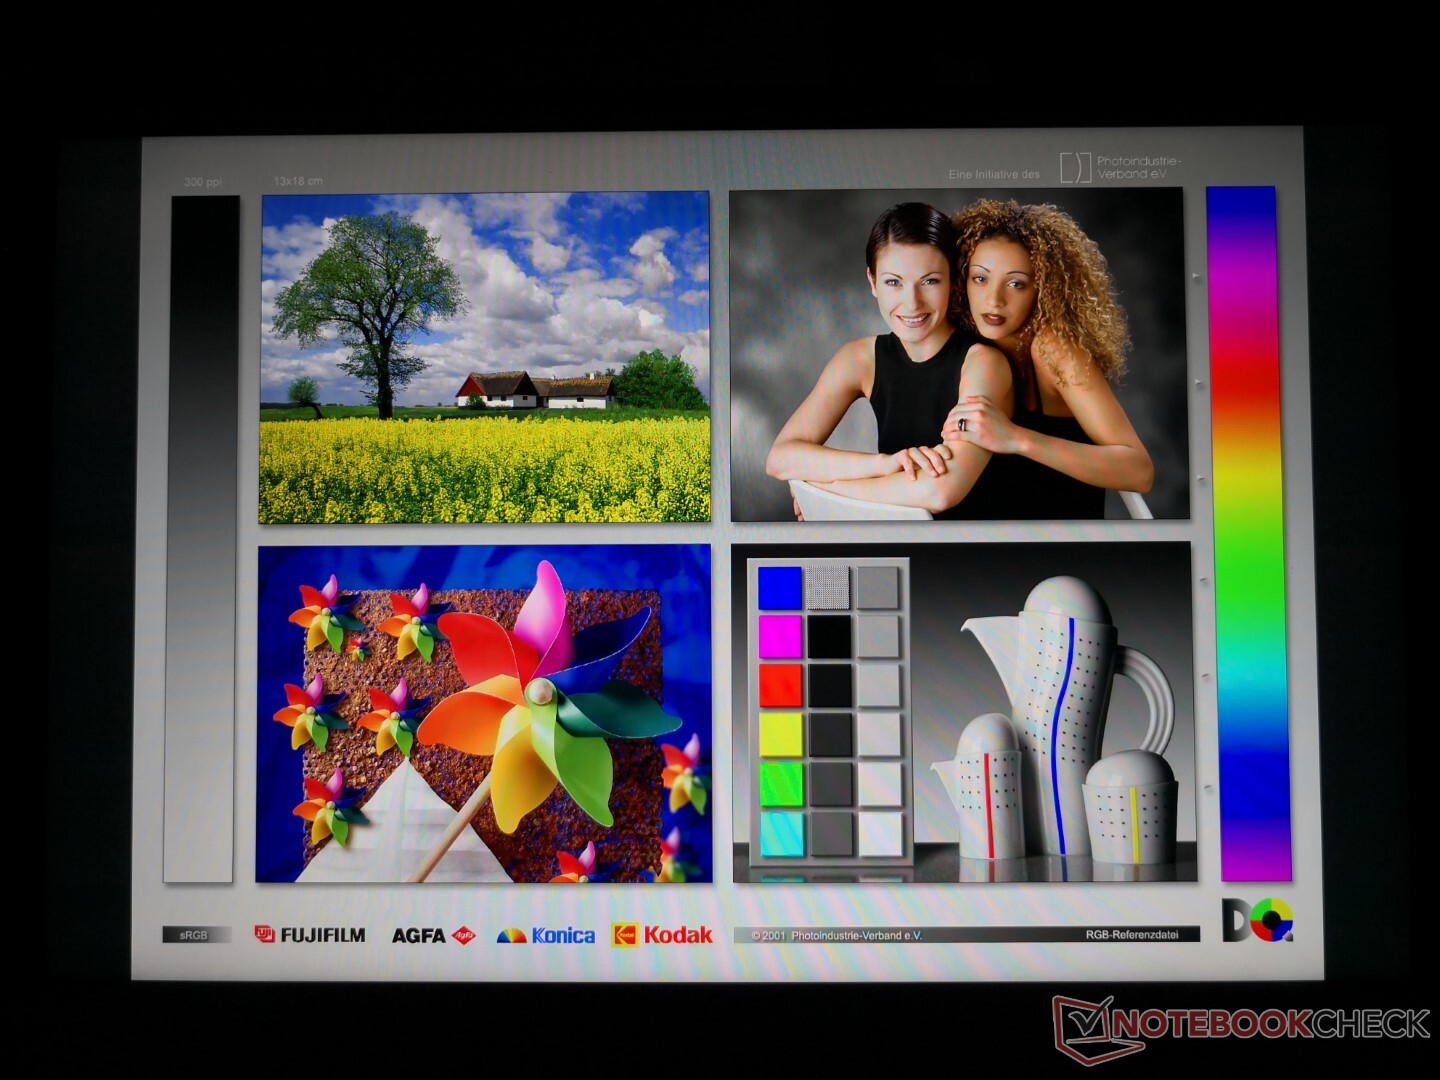
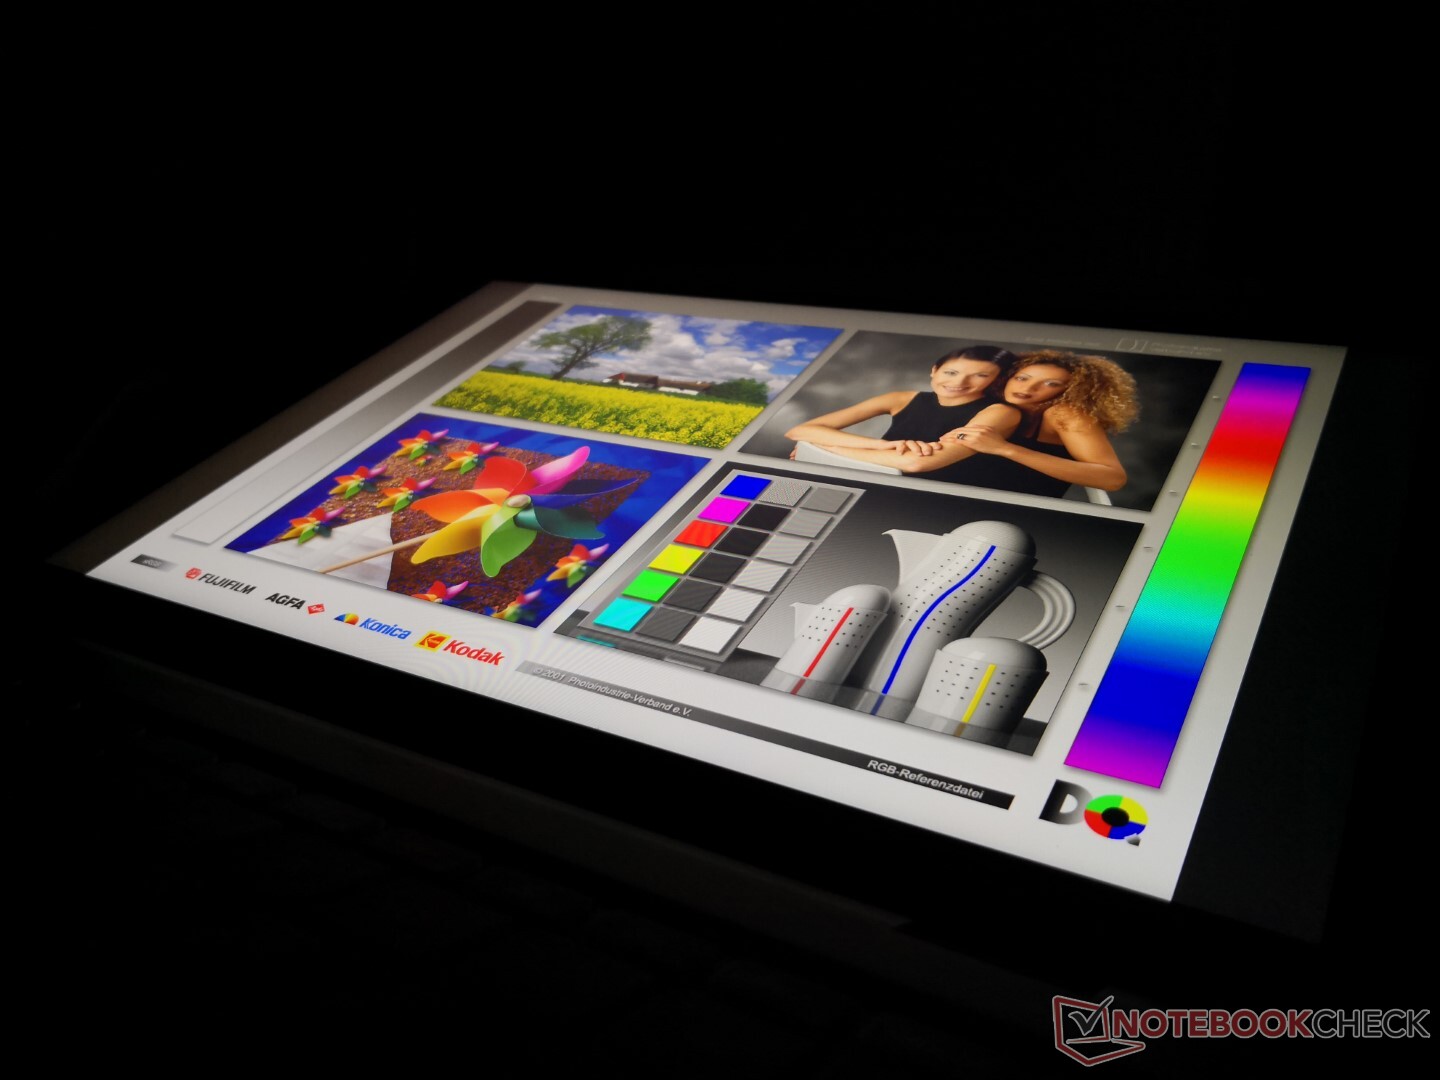
Weergave
Het scherm is helder met meer dan 500 nits met zowel een uitstekend contrast als kleuren die kunnen wedijveren met het 13,4 inch touchscreen van de Dell XPS 13 2-in-1. In feite maken beide laptops gebruik van zeer vergelijkbare Sharp panelen (LQ134N1JW53 vs. LQ134N1), wat hun vergelijkbare aangeboren kenmerken zou verklaren.
De grote onderscheidende factor tussen de MSI en de meeste andere subnotebooks zoals de Dell XPS 13 is de 120 Hz native refresh rate voor ultra vloeiende bewegingen. Zwart-wit en grijs-grijs reactietijden zijn echter helaas veel langzamer als gevolg voor meer merkbare ghosting.

| |||||||||||||||||||||||||
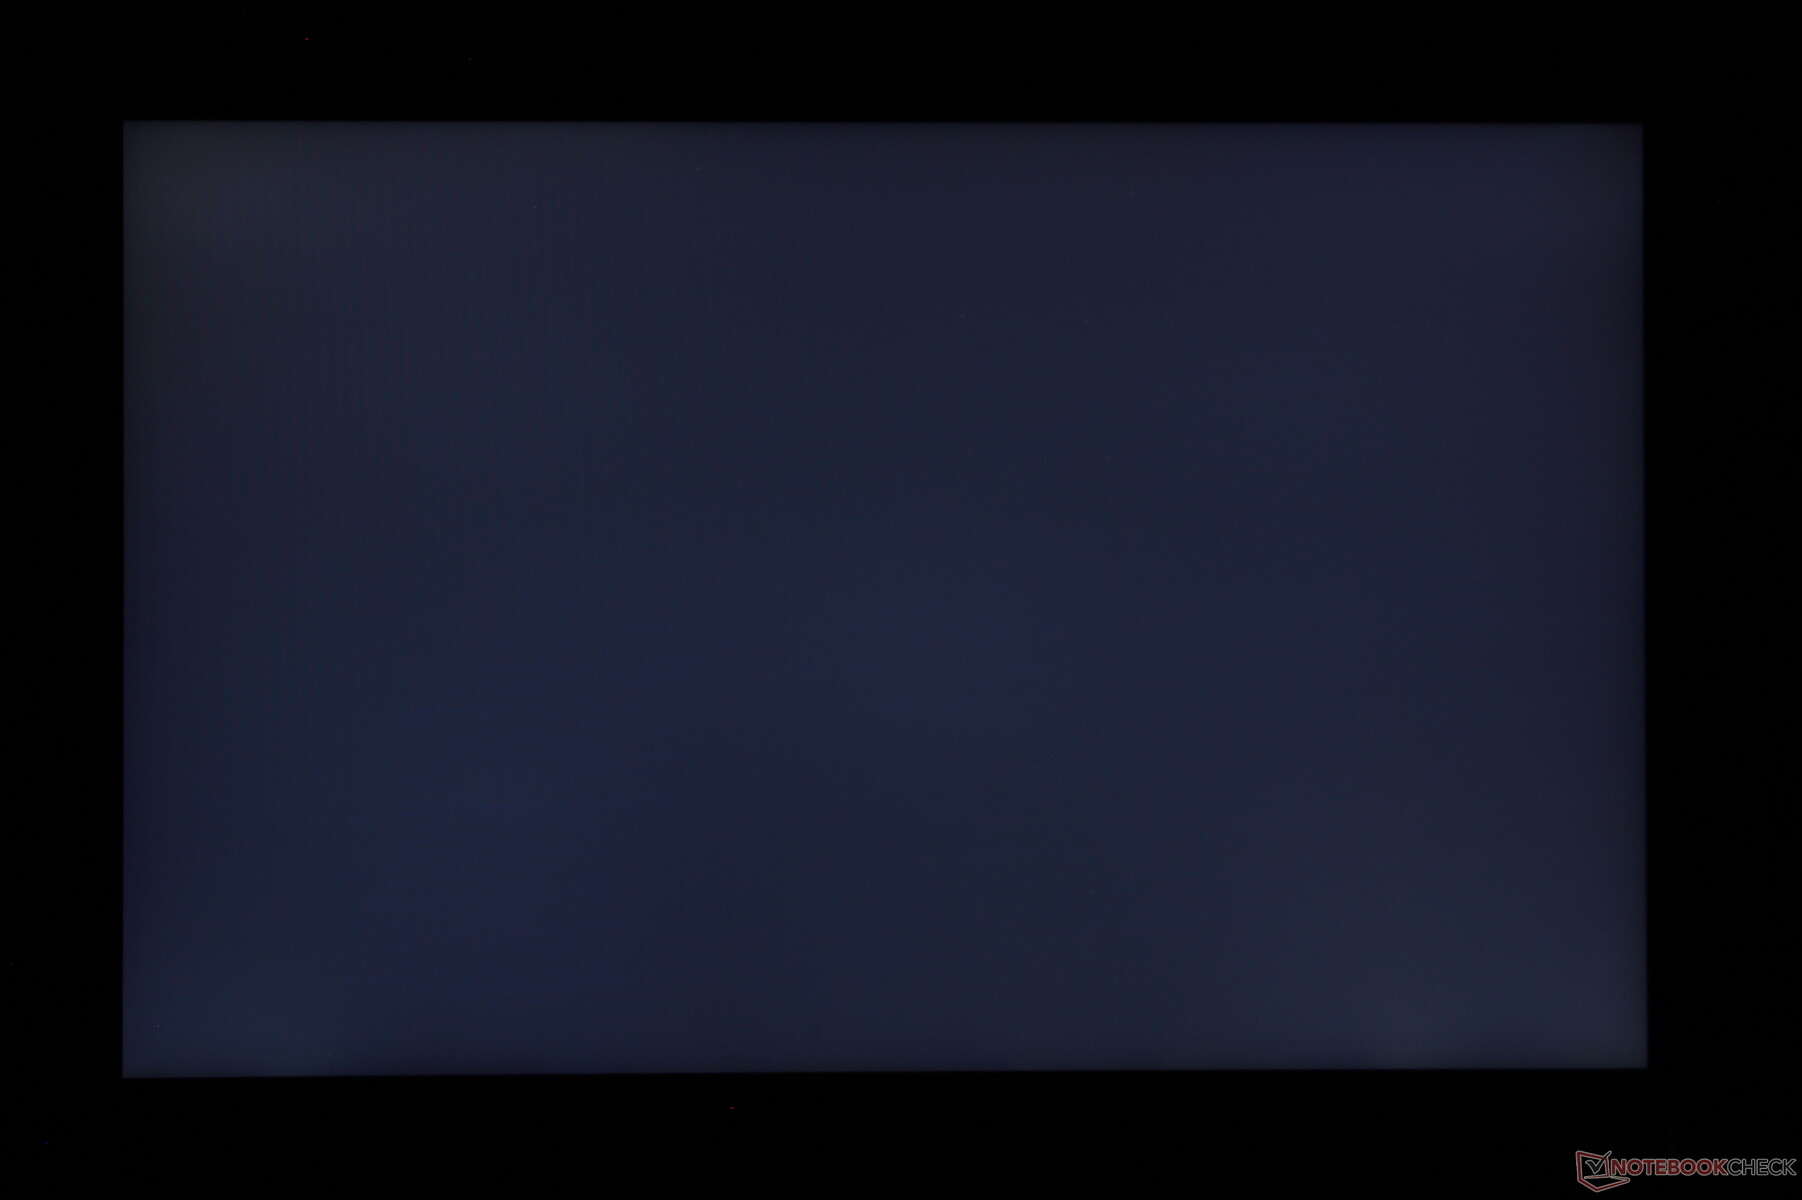
Helderheidsverdeling: 91 %
Helderheid in Batterij-modus: 551.3 cd/m²
Contrast: 1490:1 (Zwart: 0.37 cd/m²)
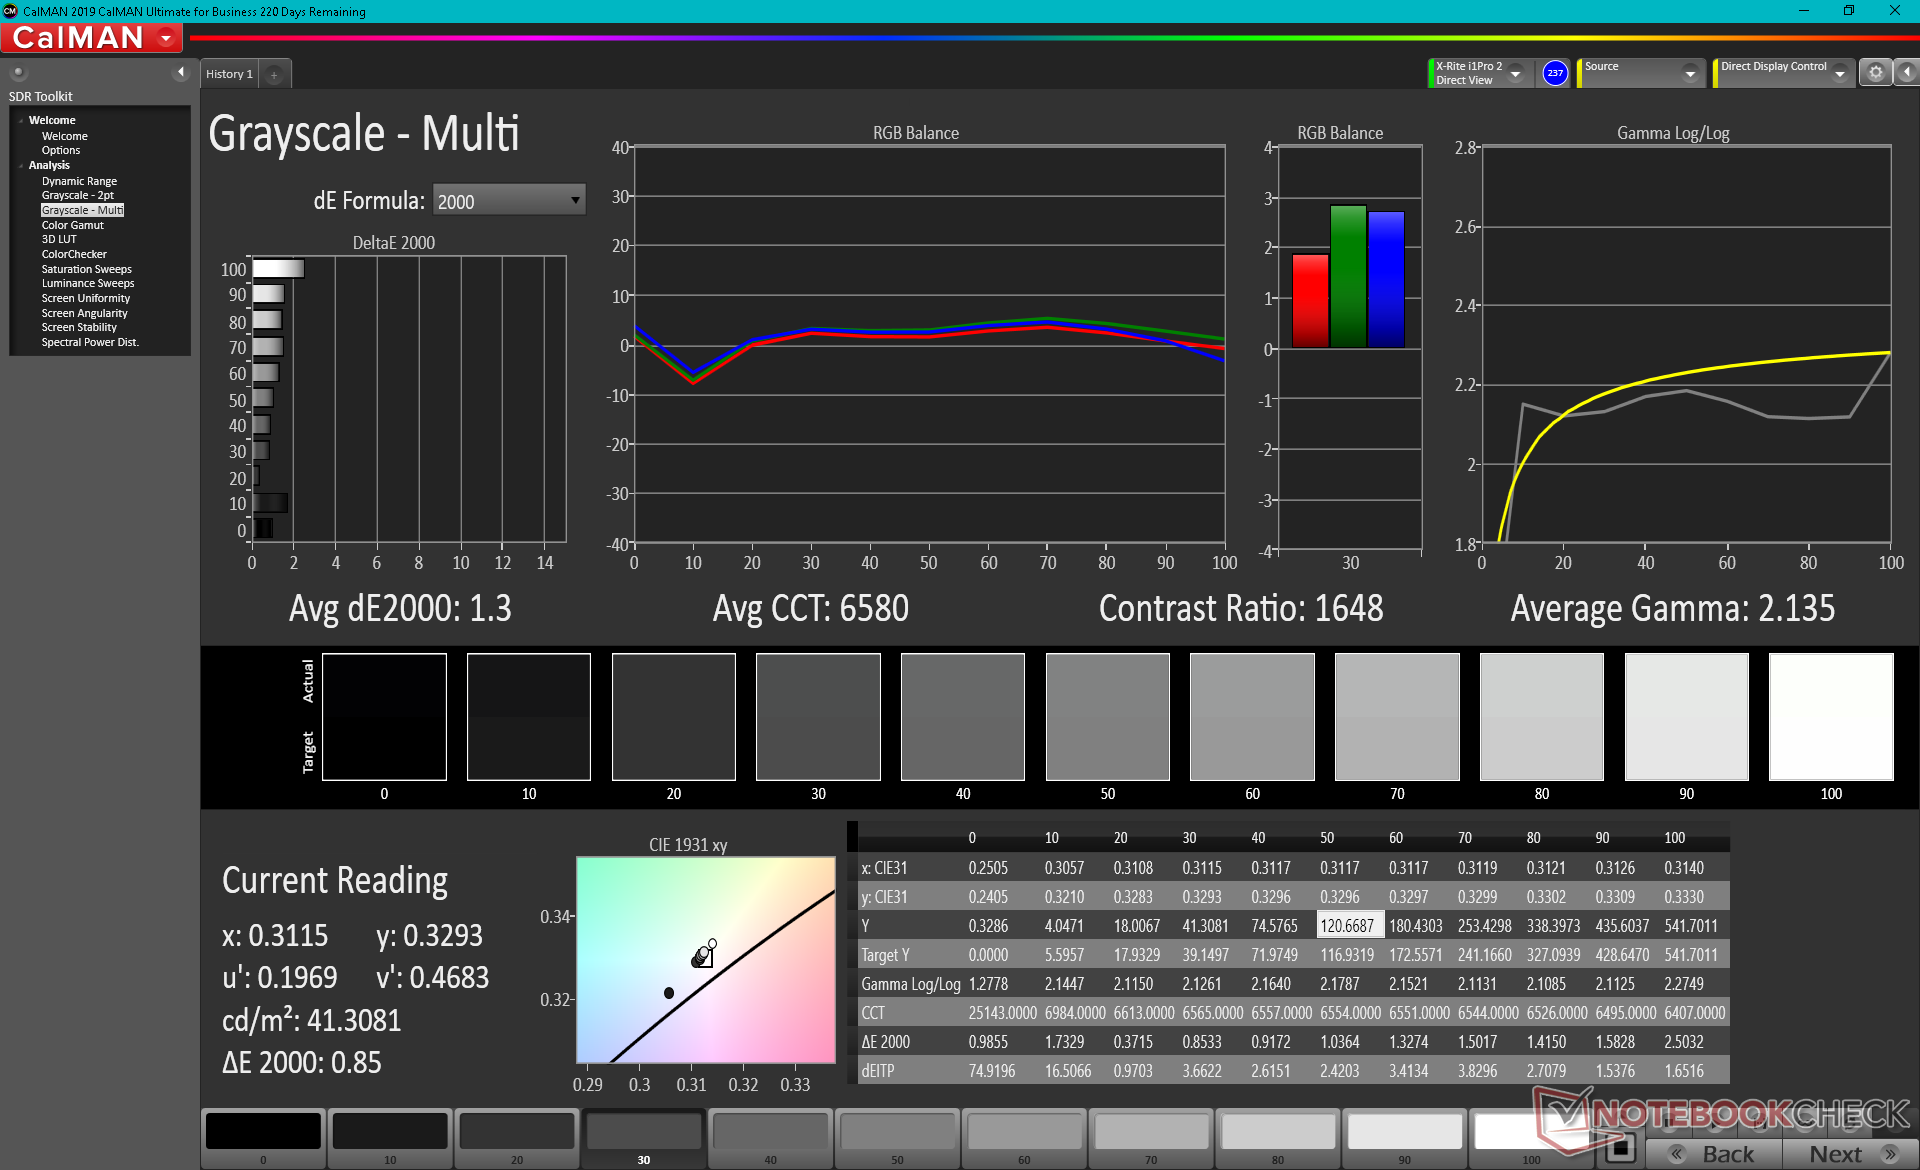
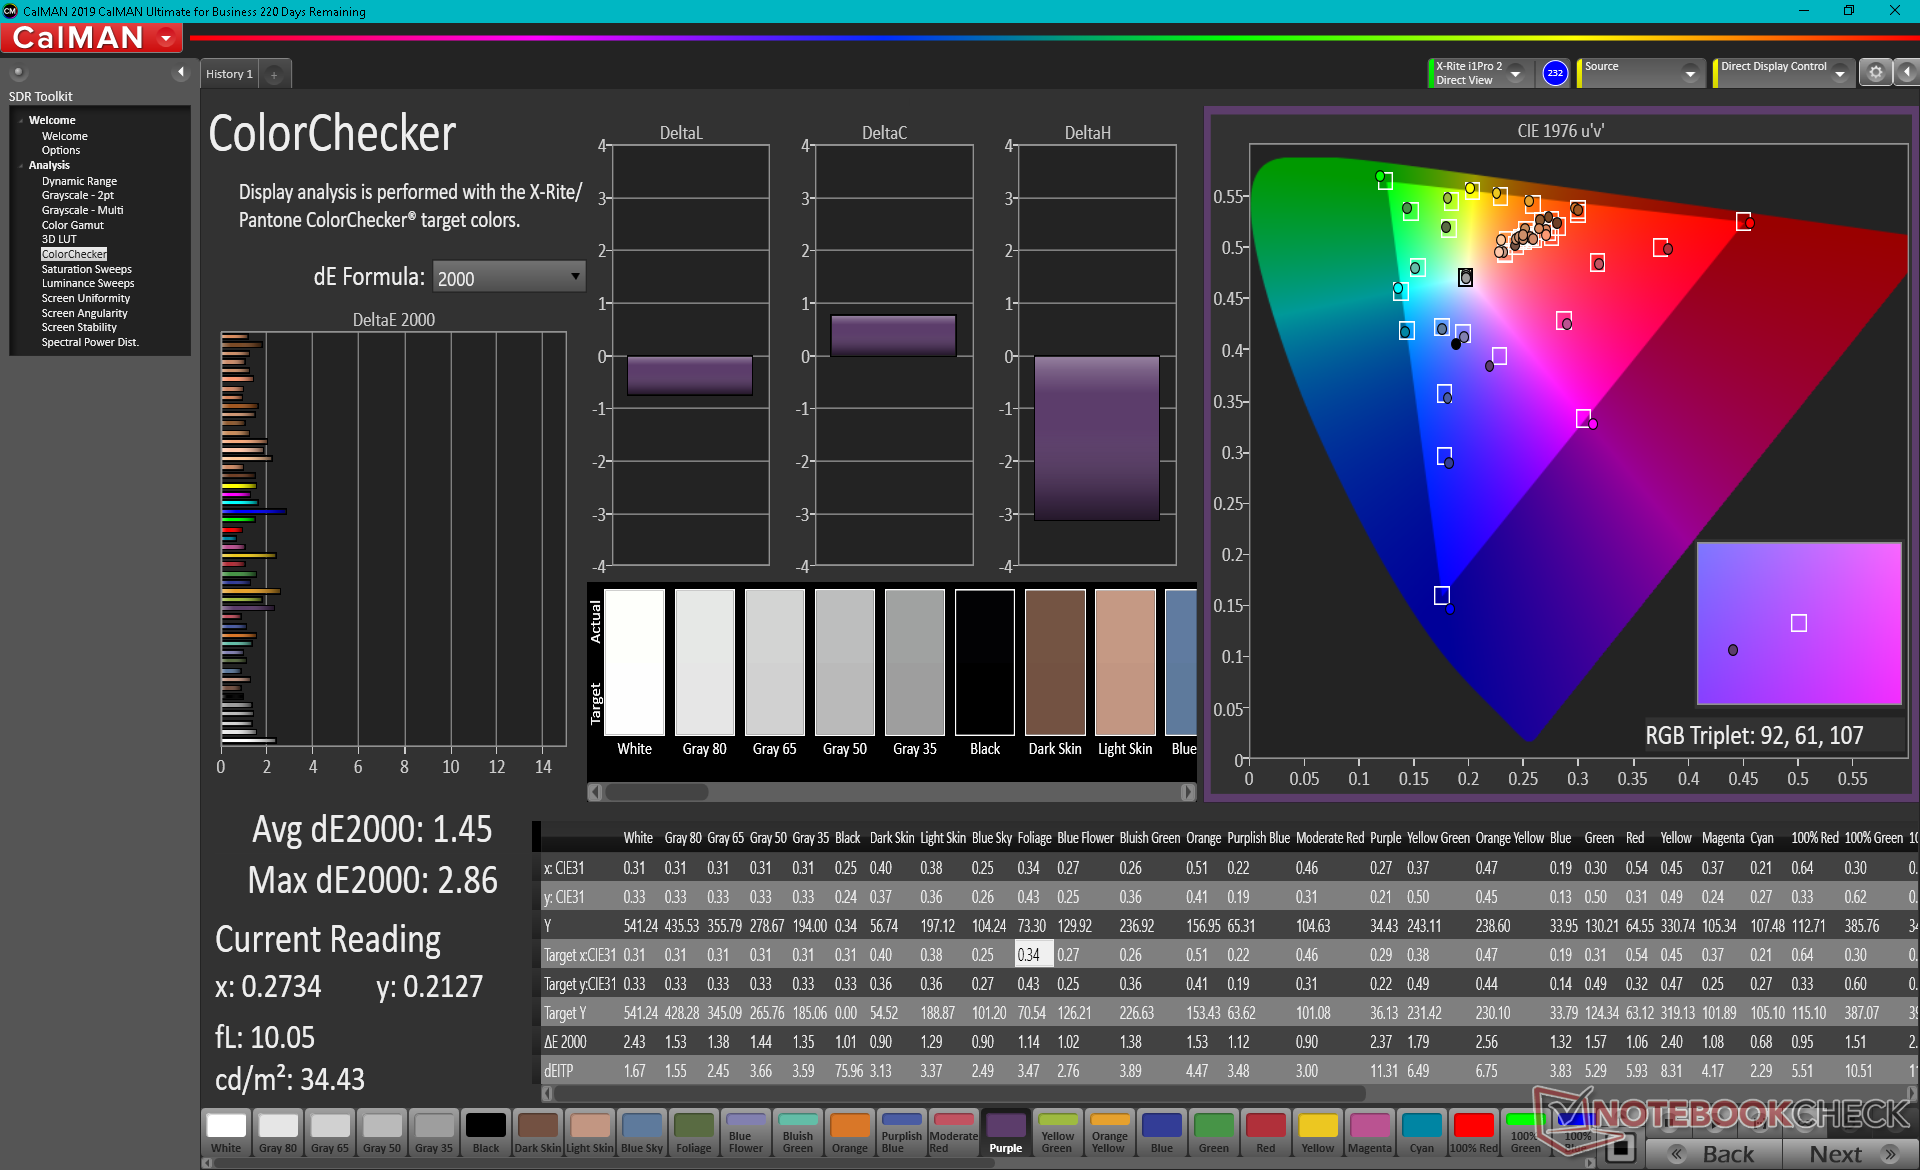
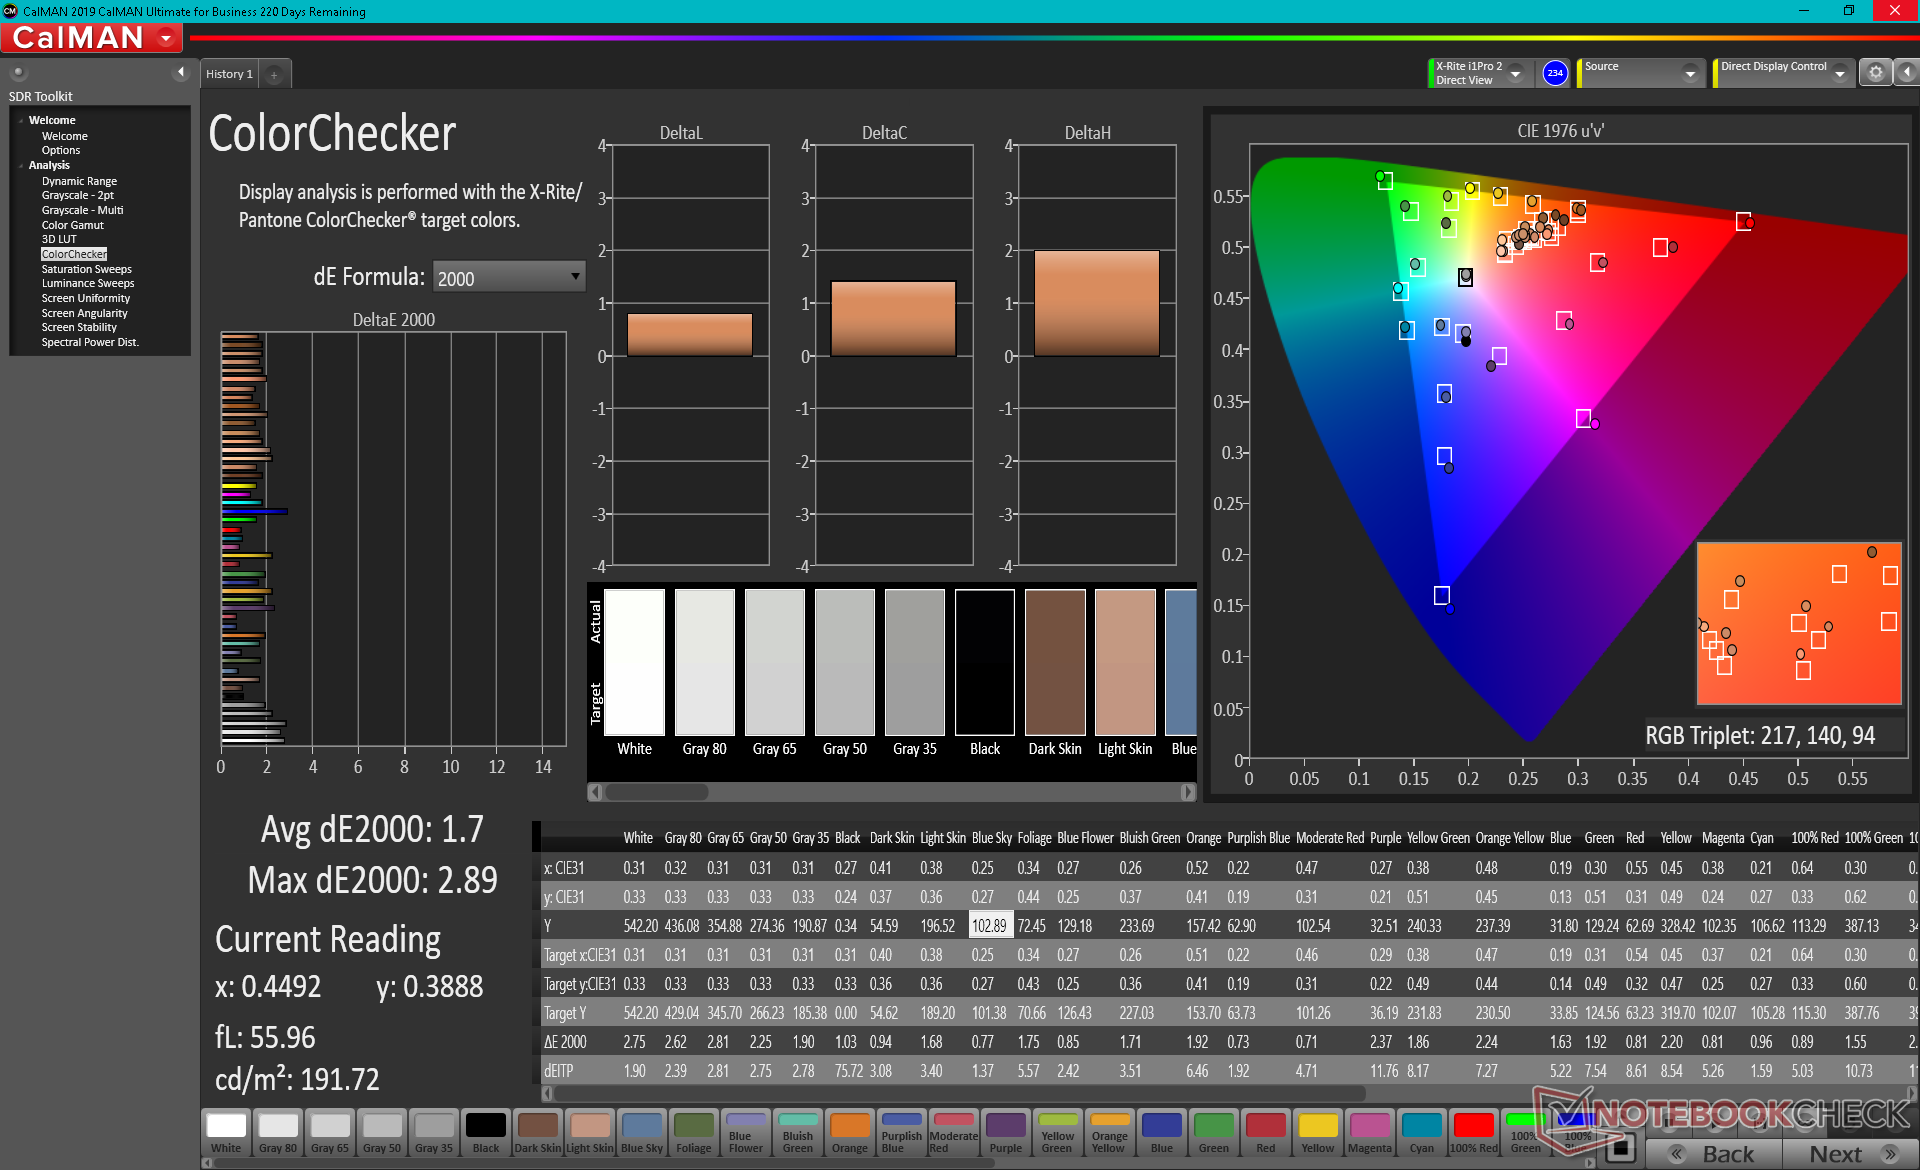
ΔE ColorChecker Calman: 1.45 | ∀{0.5-29.43 Ø4.73}
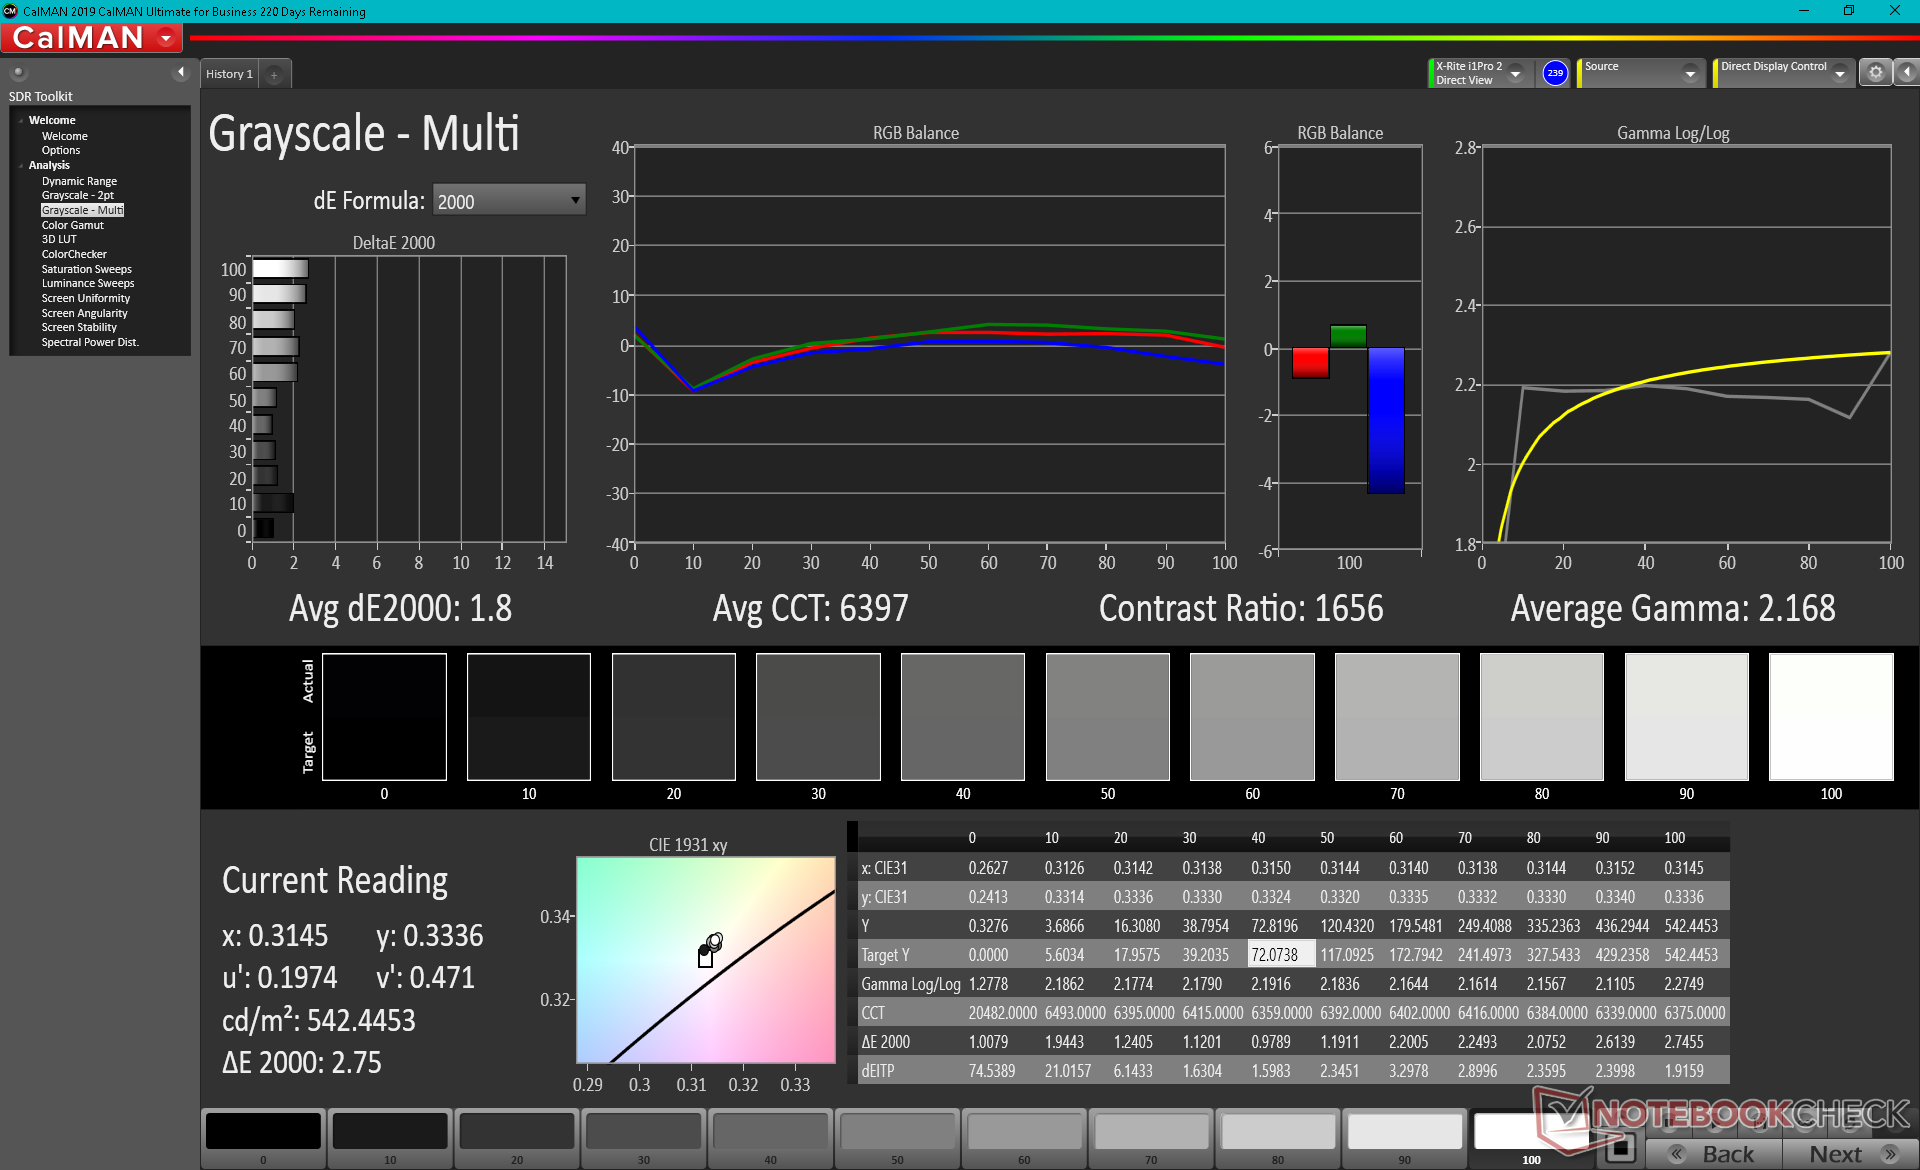
calibrated: 1.7
ΔE Greyscale Calman: 1.3 | ∀{0.09-98 Ø4.97}
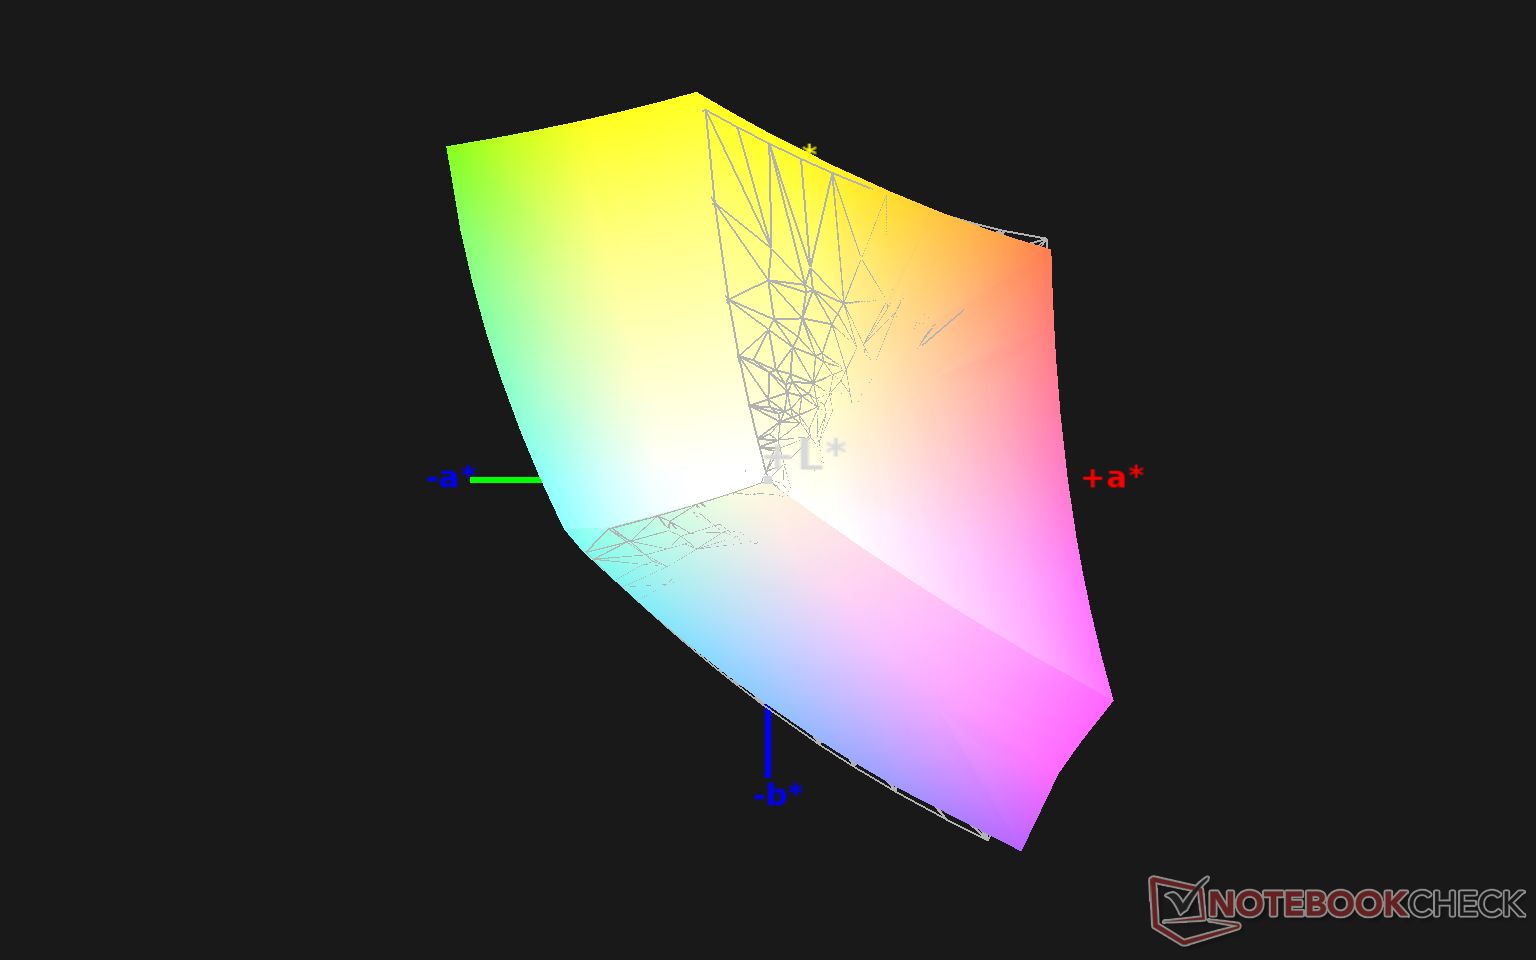
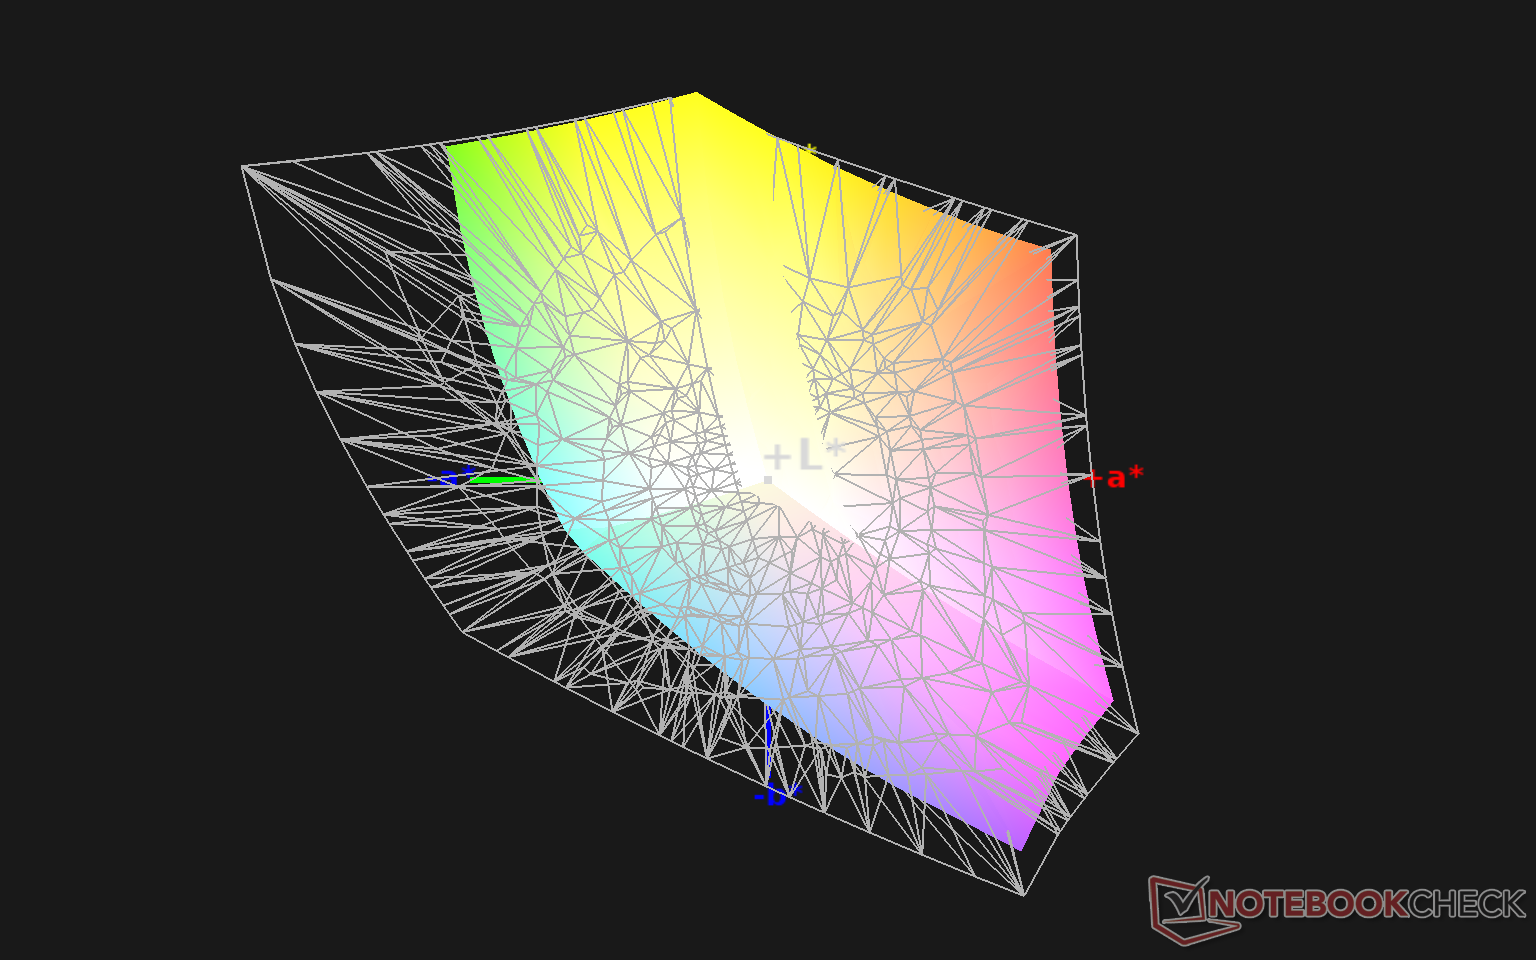
99% sRGB (Argyll 1.6.3 3D)
65% AdobeRGB 1998 (Argyll 1.6.3 3D)
70.6% AdobeRGB 1998 (Argyll 3D)
98.8% sRGB (Argyll 3D)
69.8% Display P3 (Argyll 3D)
Gamma: 2.14
CCT: 6580 K
| MSI Summit E13 Flip Evo A11MT Sharp LQ134N1JW53, IPS, 13.4", 1920x1200 | Dell XPS 13 7390 2-in-1 Core i7 Sharp LQ134N1, IPS, 13.4", 1920x1200 | HP Spectre x360 14t-ea000 LG Philips LGD0663, IPS, 13.5", 1920x1280 | Huawei MateBook X Pro 2021 TIANMA XM, IPS, 13.9", 3000x2000 | Lenovo ThinkPad X1 Titanium Yoga G1 20QA001RGE LPM135M467, IPS, 13.5", 2256x1504 | Asus Zenbook 14 UX435EG Au Optronics B140HAN03.2, IPS, 14", 1920x1080 | |
|---|---|---|---|---|---|---|
| Display | 0% | -4% | -6% | -11% | ||
| Display P3 Coverage (%) | 69.8 | 69.9 0% | 65.8 -6% | 64.9 -7% | 60.9 -13% | |
| sRGB Coverage (%) | 98.8 | 99.2 0% | 98.2 -1% | 94.4 -4% | 90.4 -9% | |
| AdobeRGB 1998 Coverage (%) | 70.6 | 71.5 1% | 67.9 -4% | 66.3 -6% | 62.3 -12% | |
| Response Times | 30% | 7% | 41% | 31% | 38% | |
| Response Time Grey 50% / Grey 80% * (ms) | 64 ? | 47.6 ? 26% | 62 ? 3% | 37.6 ? 41% | 53.6 ? 16% | 39 ? 39% |
| Response Time Black / White * (ms) | 44 ? | 29.2 ? 34% | 39.6 ? 10% | 26.4 ? 40% | 24 ? 45% | 28 ? 36% |
| PWM Frequency (Hz) | 2500 ? | |||||
| Screen | -15% | -26% | -4% | -17% | -85% | |
| Brightness middle (cd/m²) | 551.3 | 549.8 0% | 443.5 -20% | 502 -9% | 466 -15% | 323 -41% |
| Brightness (cd/m²) | 517 | 520 1% | 394 -24% | 474 -8% | 454 -12% | 313 -39% |
| Brightness Distribution (%) | 91 | 86 -5% | 78 -14% | 89 -2% | 94 3% | 80 -12% |
| Black Level * (cd/m²) | 0.37 | 0.39 -5% | 0.17 54% | 0.33 11% | 0.23 38% | 0.36 3% |
| Contrast (:1) | 1490 | 1410 -5% | 2609 75% | 1521 2% | 2026 36% | 897 -40% |
| Colorchecker dE 2000 * | 1.45 | 2.12 -46% | 2.7 -86% | 1.35 7% | 2.1 -45% | 4.86 -235% |
| Colorchecker dE 2000 max. * | 2.86 | 3.66 -28% | 4.36 -52% | 3.67 -28% | 4.5 -57% | 7.52 -163% |
| Colorchecker dE 2000 calibrated * | 1.7 | 1.37 19% | 2.61 -54% | 1.2 29% | 3.64 -114% | |
| Greyscale dE 2000 * | 1.3 | 2.6 -100% | 3.4 -162% | 1.7 -31% | 2.7 -108% | 4.83 -272% |
| Gamma | 2.14 103% | 2.3 96% | 2.09 105% | 2.24 98% | 2.08 106% | 2.64 83% |
| CCT | 6580 99% | 6884 94% | 6144 106% | 6440 101% | 6210 105% | 7405 88% |
| Color Space (Percent of AdobeRGB 1998) (%) | 65 | 65.4 1% | 62.1 -4% | 61.1 -6% | 61.1 -6% | 57.5 -12% |
| Color Space (Percent of sRGB) (%) | 99 | 99.7 1% | 98.5 -1% | 94.3 -5% | 94.9 -4% | 90.3 -9% |
| Totaal Gemiddelde (Programma / Instellingen) | 5% /
-7% | -8% /
-18% | 10% /
2% | 7% /
-9% | -19% /
-56% |
* ... kleiner is beter
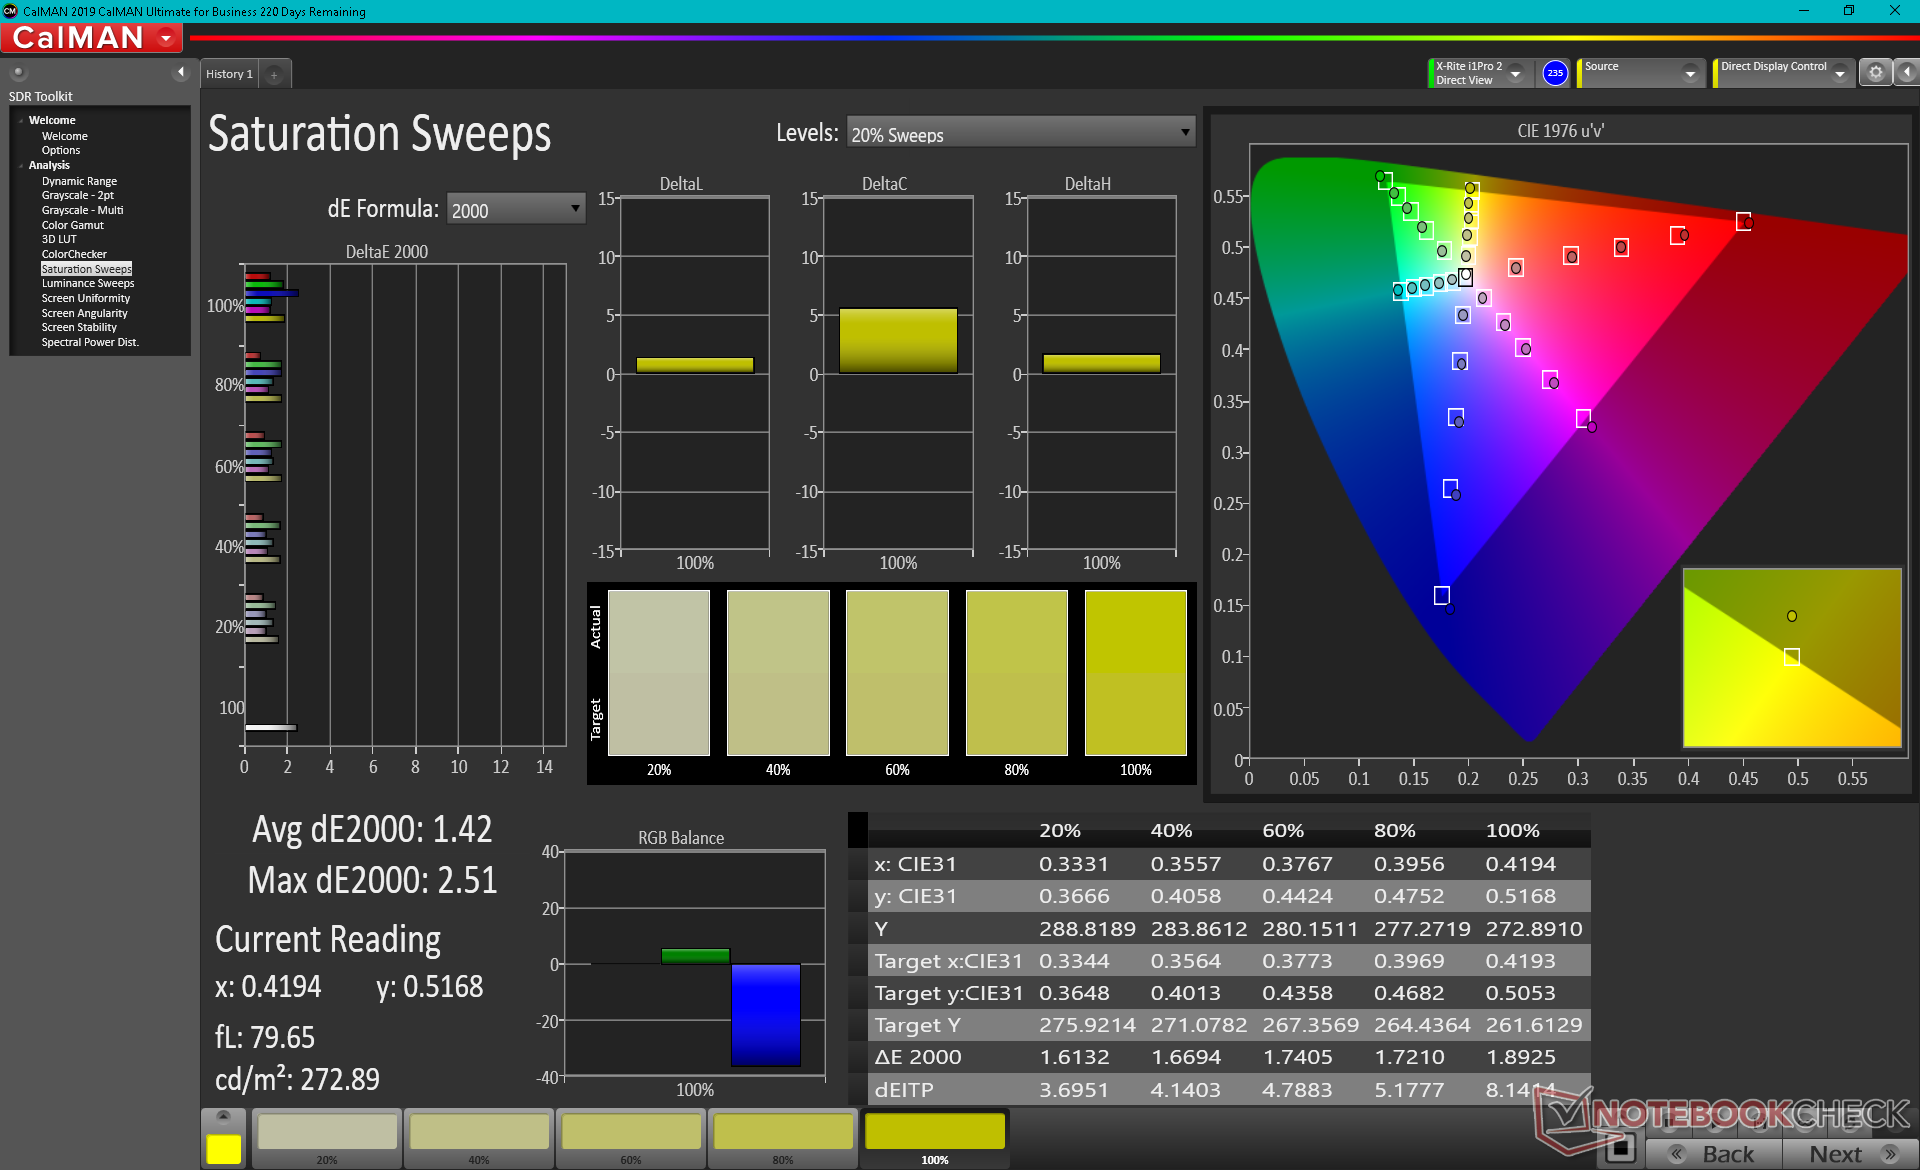
De kleurruimte dekt alle sRGB en niet een grotere zoals op de meeste andere high-end Ultrabooks. OLED zou nog diepere kleuren hebben geboden in de buurt van DCI-P3, maar een dergelijke paneeloptie is niet beschikbaar op de MSI.
X-Rite colorimeter metingen tonen een goed gekalibreerd beeldscherm uit de doos met gemiddelde DeltaE grijswaarden en ColorChecker waarden van slechts 1,3 en 1,45, respectievelijk. Een eindgebruikerskalibratie is niet nodig.

Responstijd Scherm
| ↔ Responstijd Zwart naar Wit | ||
|---|---|---|
| 44 ms ... stijging ↗ en daling ↘ gecombineerd | ↗ 22 ms stijging | 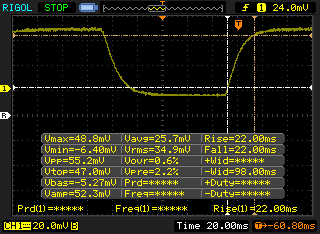 |
| ↘ 22 ms daling | ||
| Het scherm vertoonde trage responstijden in onze tests en is misschien te traag voor games. Ter vergelijking: alle testtoestellen variëren van 0.1 (minimum) tot 240 (maximum) ms. » 98 % van alle toestellen zijn beter. Dit betekent dat de gemeten responstijd slechter is dan het gemiddelde (19.9 ms) van alle geteste toestellen. | ||
| ↔ Responstijd 50% Grijs naar 80% Grijs | ||
| 64 ms ... stijging ↗ en daling ↘ gecombineerd | ↗ 30.8 ms stijging | 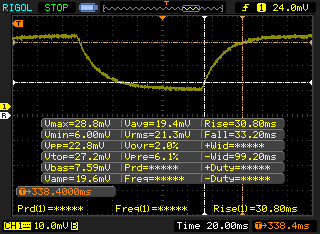 |
| ↘ 33.2 ms daling | ||
| Het scherm vertoonde trage responstijden in onze tests en is misschien te traag voor games. Ter vergelijking: alle testtoestellen variëren van 0.165 (minimum) tot 636 (maximum) ms. » 97 % van alle toestellen zijn beter. Dit betekent dat de gemeten responstijd slechter is dan het gemiddelde (31.1 ms) van alle geteste toestellen. | ||
Screen Flickering / PWM (Pulse-Width Modulation)
| Screen flickering / PWM niet waargenomen | 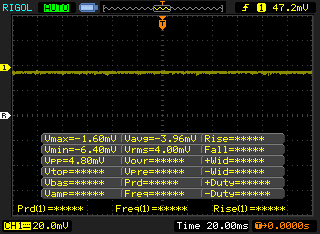 | ||
Ter vergelijking: 52 % van alle geteste toestellen maakten geen gebruik van PWM om de schermhelderheid te verlagen. Als het wel werd gebruikt, werd een gemiddelde van 7798 (minimum: 5 - maximum: 343500) Hz waargenomen. | |||
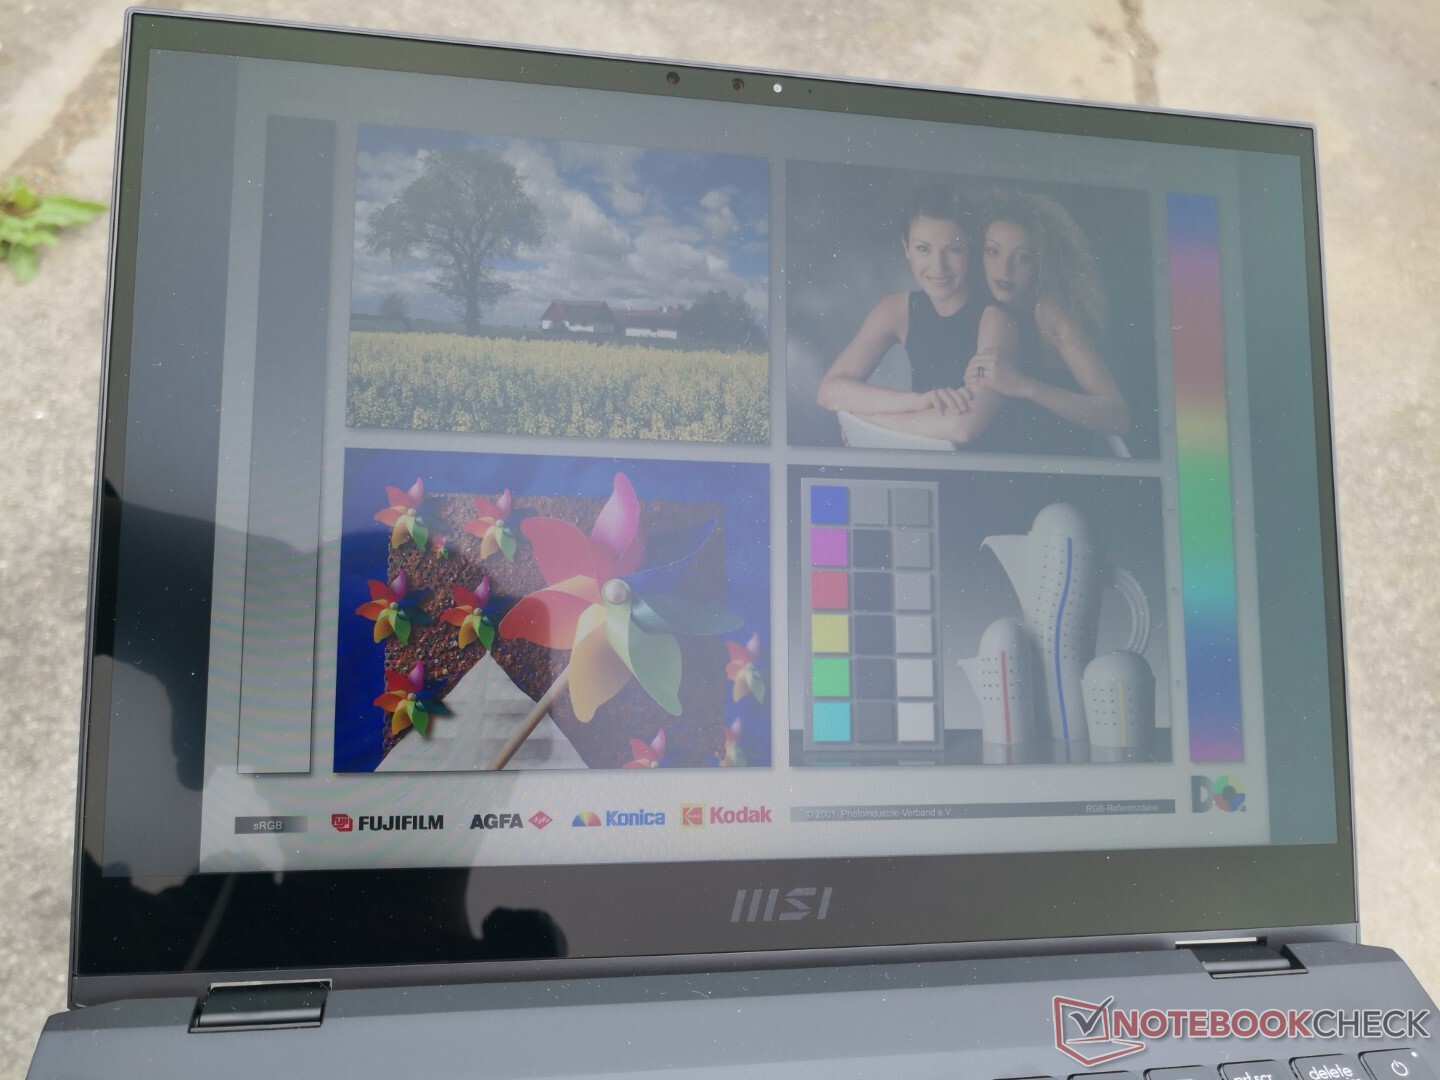
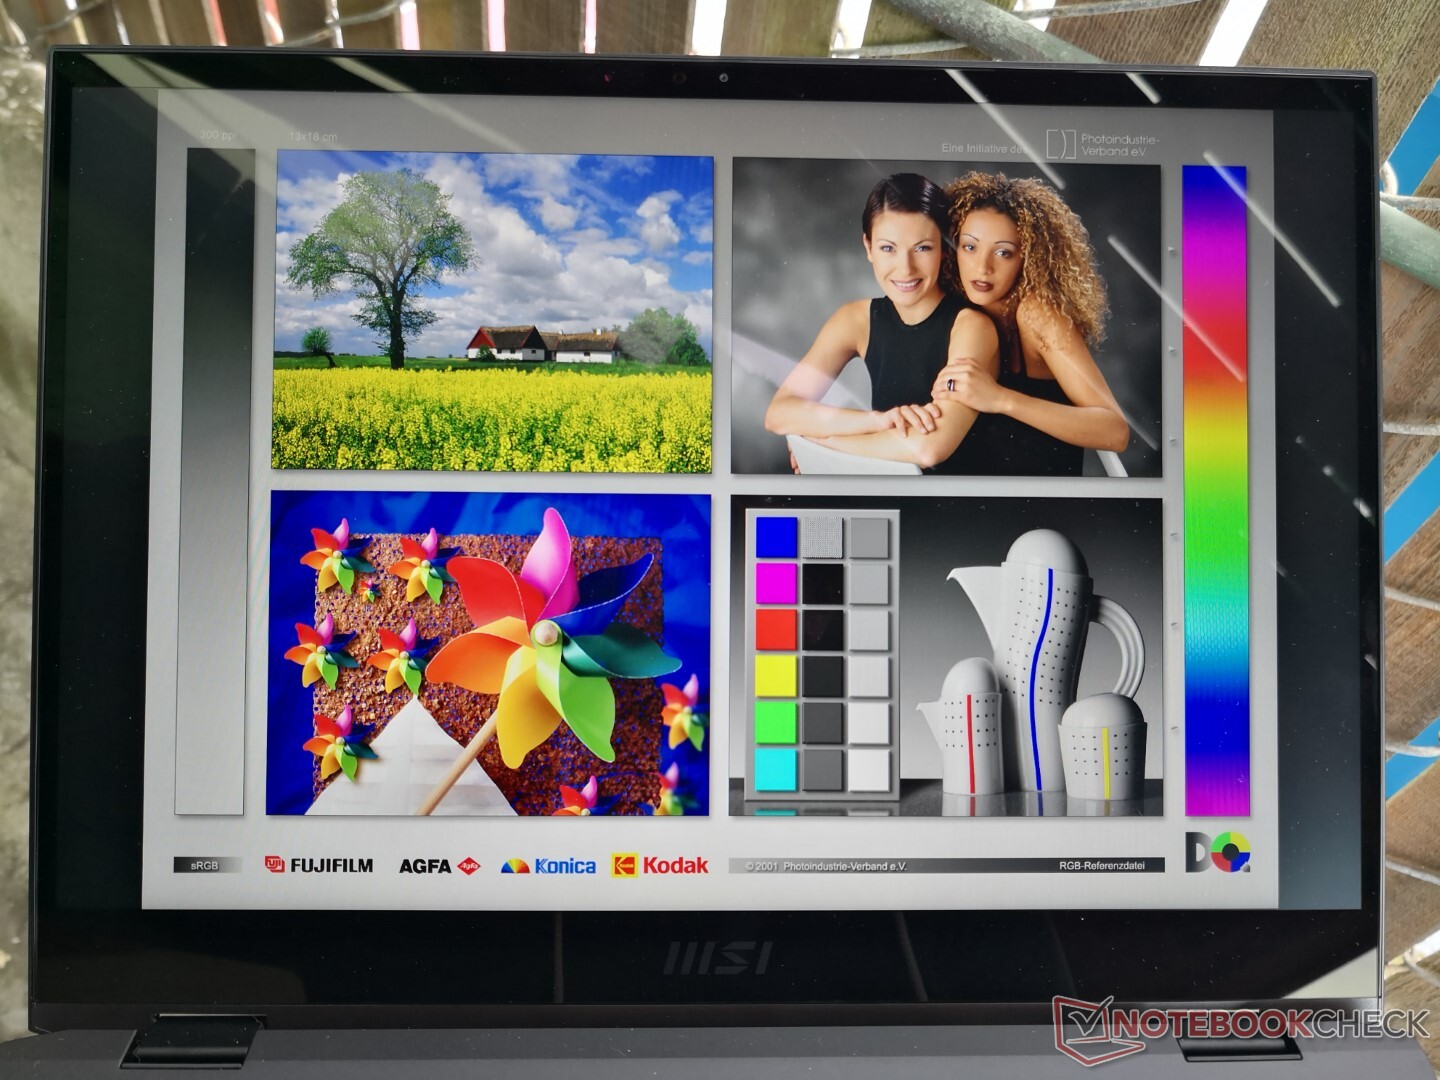
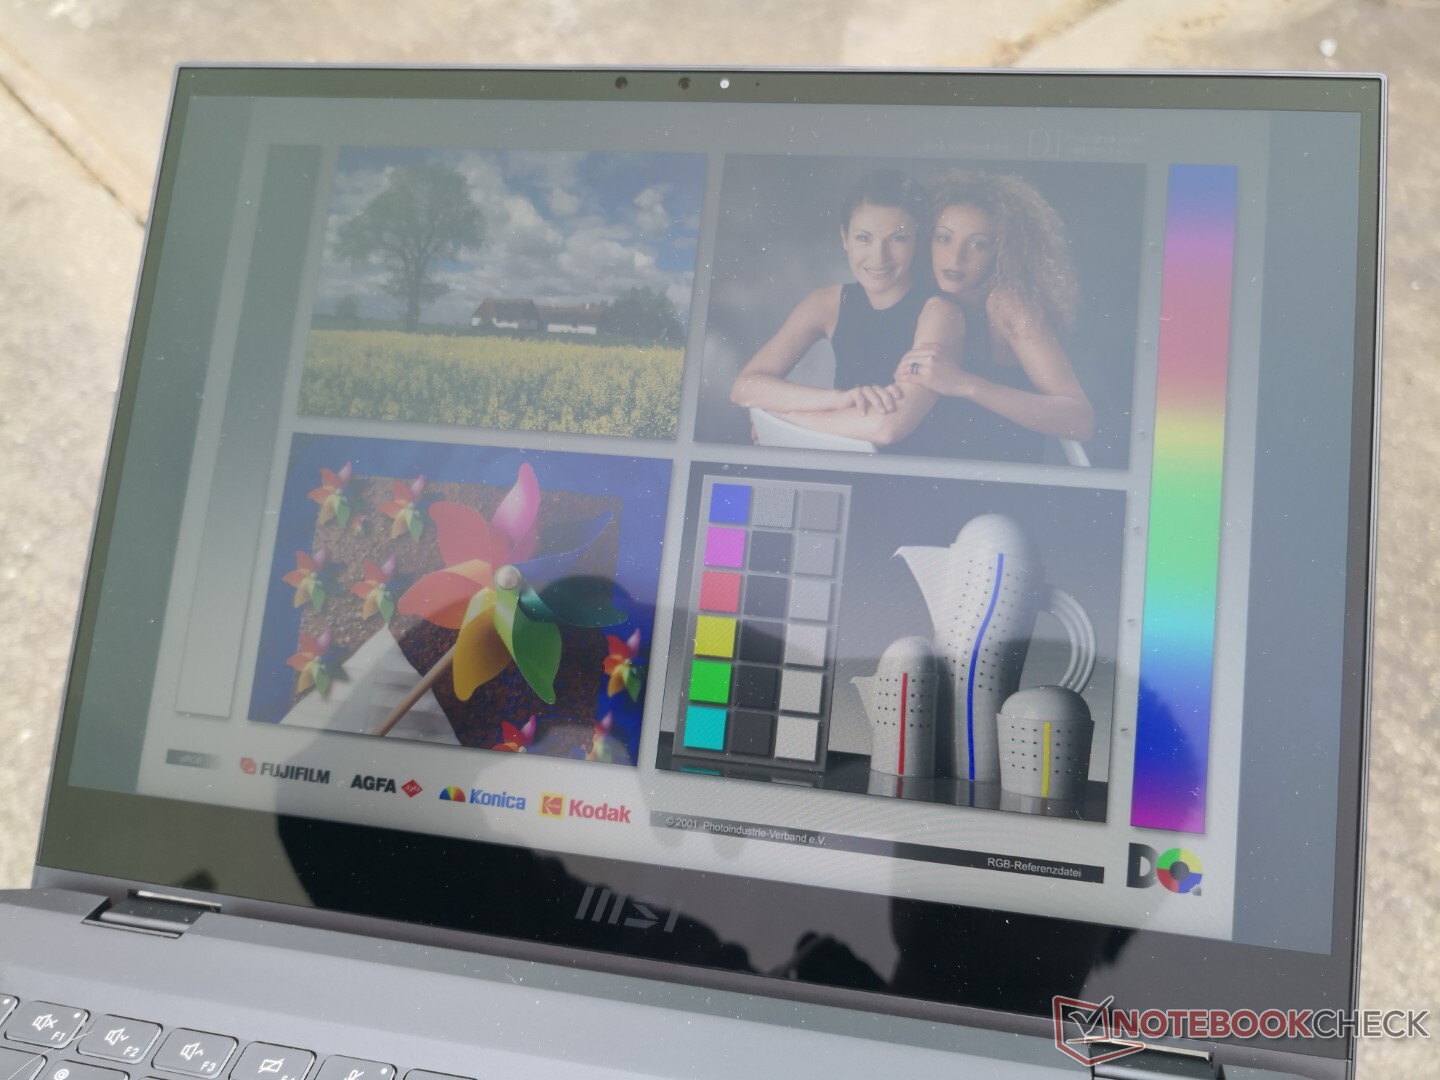
Verblinding is onvermijdelijk als u buiten werkt vanwege de glanzende overlay, en op heldere of bewolkte dagen wordt het scherm nog steeds uitgewassen. Gelukkig is het scherm helder genoeg om veel van de schittering te verminderen als je in de schaduw werkt. De zichtbaarheid buitenshuis is het meest vergelijkbaar met de XPS 13 2-in-1, aangezien beide een vergelijkbare maximale helderheid en contrastniveau hebben.
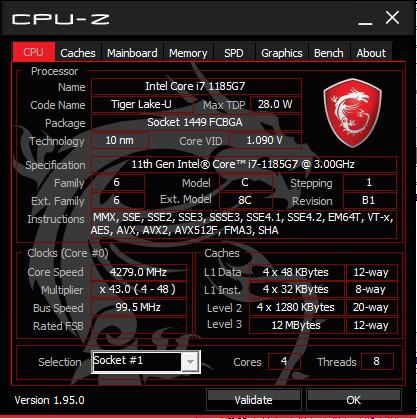
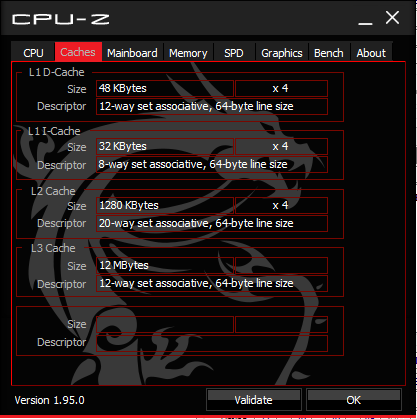
Prestaties
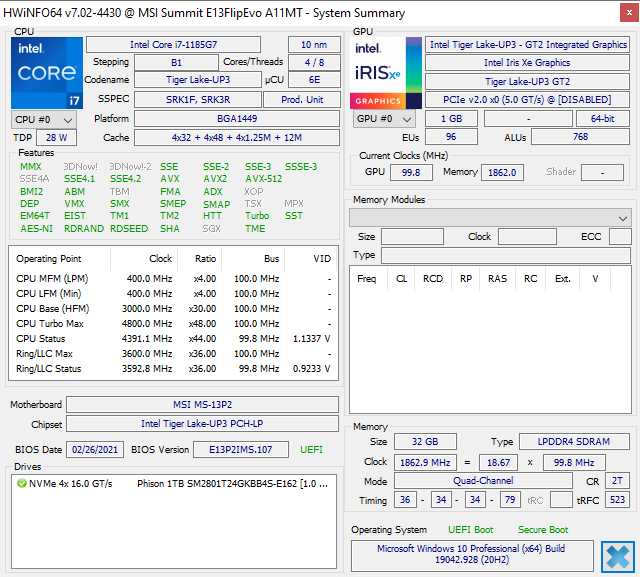
Alle SKU's worden op dit moment geleverd met de 11e gen Core i7-1185G7 CPU zonder andere opties. Het zou geweldig zijn geweest om een Core i7-1165G7 configuratie voor gebruikers die misschien niet geïnteresseerd zijn in vPro. Het prestatieverschil tussen een Core i7-1165G7 en i7-1185G7 is ook op zijn best minimaal.
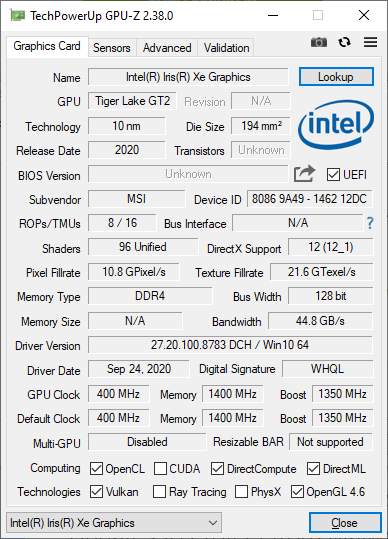
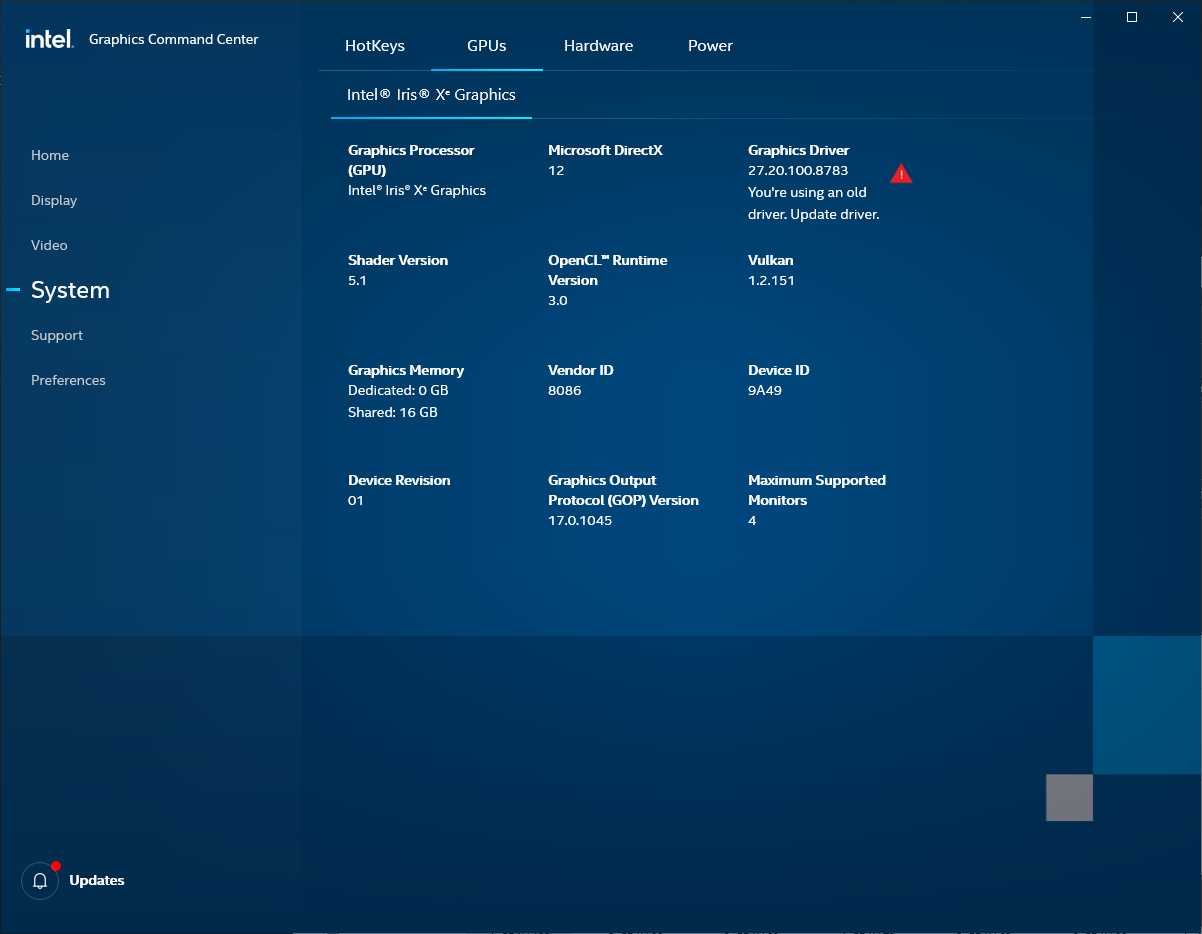
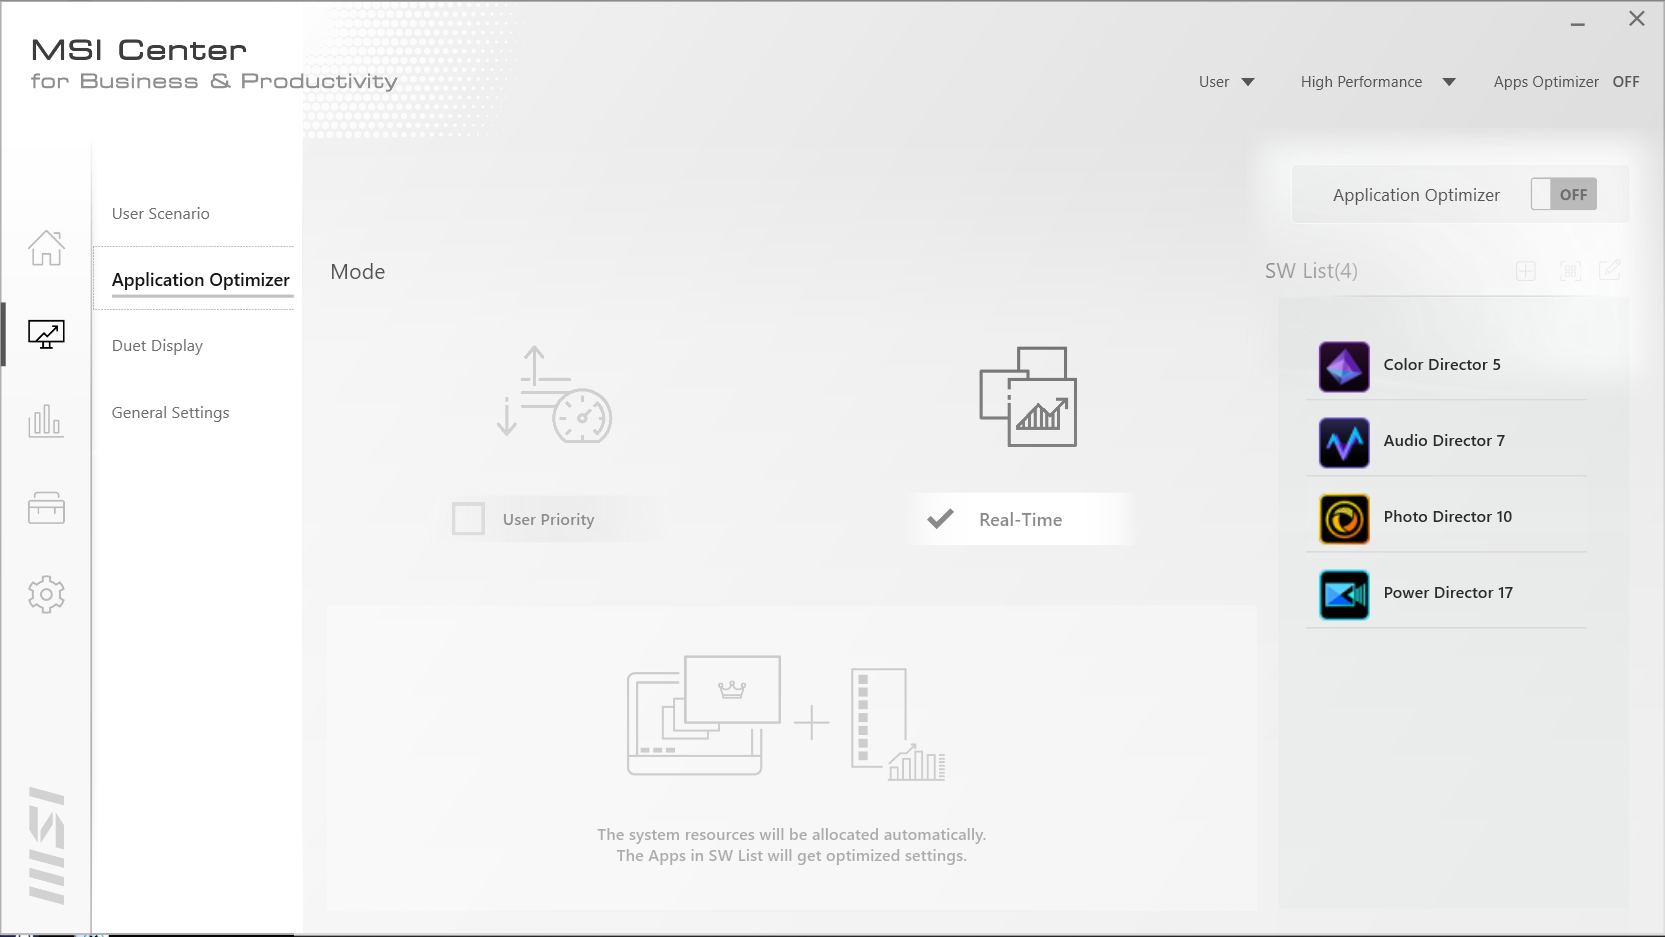
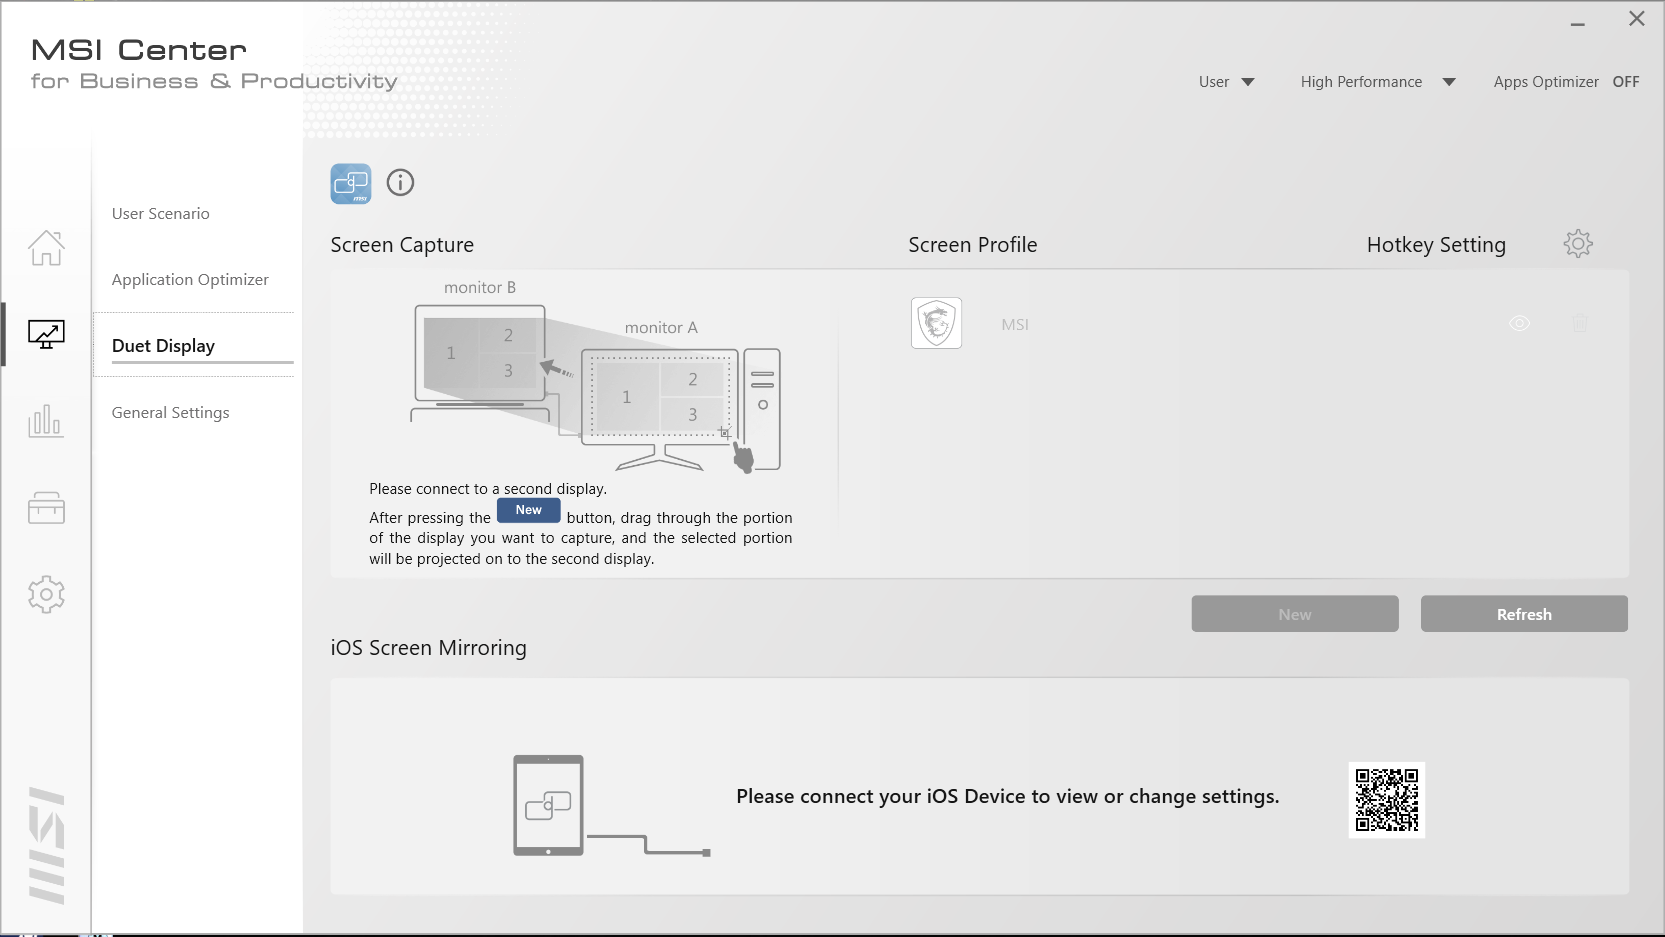
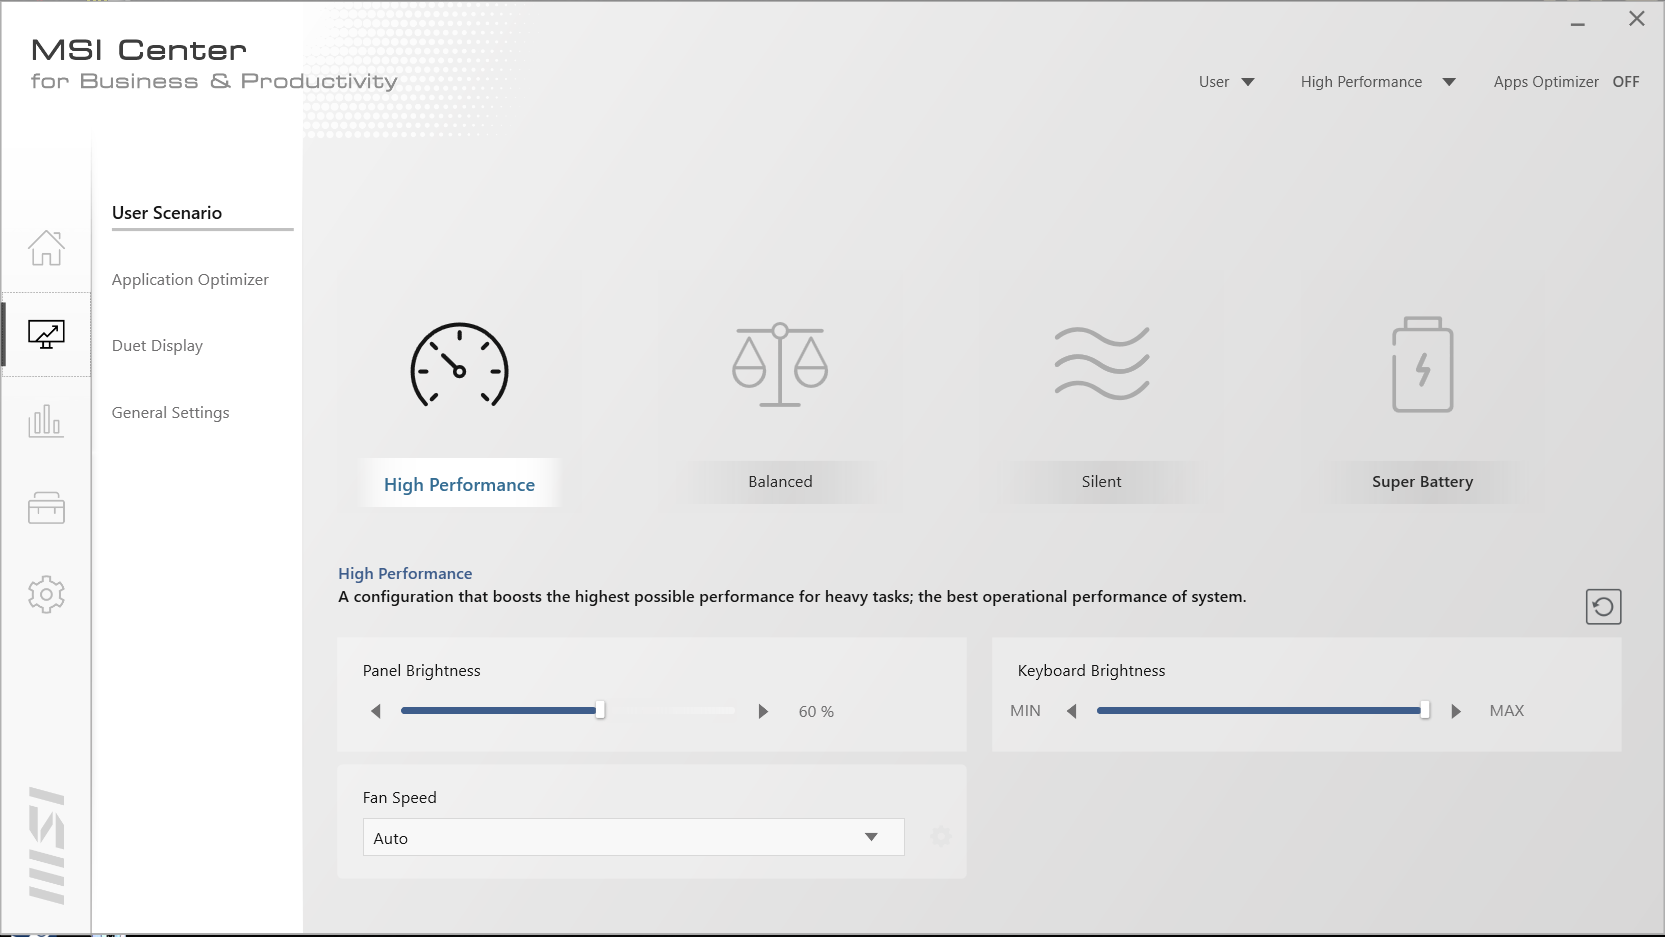
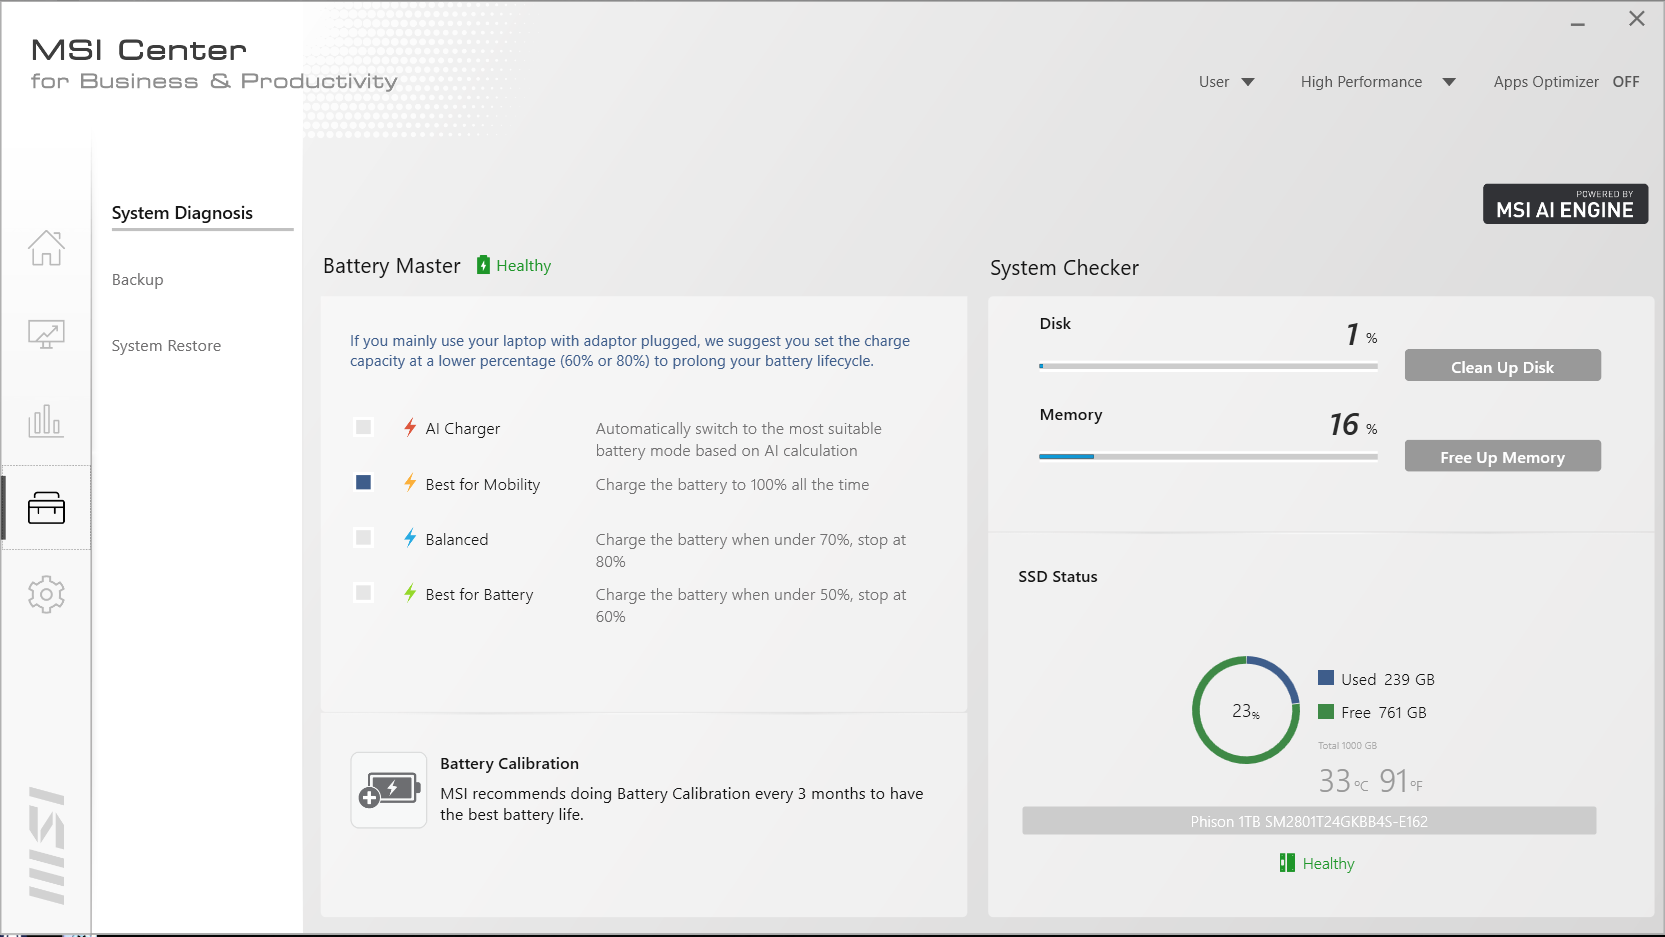
Iris Xe graphics worden standaard geleverd op alle SKU's zonder discrete opties. Ons apparaat werd ingesteld op High Performance mode via MSI Center voordat alle onderstaande prestatie benchmarks werden uitgevoerd. We raden eigenaren aan om bekend te raken met MSI Center, omdat belangrijke systeeminstellingen hier worden omgeschakeld.
Processor
De CPU-prestaties zijn uitstekend met een betere Turbo Boost duurzaamheid dan veel andere subnotebooks met dezelfde Tiger Lake-U CPU. Bijvoorbeeld, de nieuwste Lenovo Yoga 9i 14 en Huawei MateBook X Pro zijn ruwweg 13 procent en 25 procent langzamer, respectievelijk, na rekening te houden met prestatie throttling op alle systemen. De concurrerende Ryzen 7 4700U is nog steeds de snellere processor in multi-threaded belastingen, terwijl hij langzamer is in single-threaded applicaties.
Cinebench R23: Multi Core | Single Core
Cinebench R15: CPU Single 64Bit | CPU Multi 64Bit
Blender: v2.79 BMW27 CPU
7-Zip 18.03: 7z b 4 -mmt1 | 7z b 4
Geekbench 5.5: Single-Core | Multi-Core
HWBOT x265 Benchmark v2.2: 4k Preset
LibreOffice : 20 Documents To PDF
R Benchmark 2.5: Overall mean
| Cinebench R23 / Multi Core | |
| MSI Summit E13 Flip Evo A11MT | |
| Lenovo ThinkBook 14 G2 ITL 20VD008WGE | |
| Gemiddeld Intel Core i7-1185G7 (3610 - 6383, n=24) | |
| Huawei MateBook X Pro 2021 | |
| Lenovo Yoga Slim 7i Carbon 13 ITL | |
| Cinebench R23 / Single Core | |
| MSI Summit E13 Flip Evo A11MT | |
| Gemiddeld Intel Core i7-1185G7 (1251 - 1532, n=24) | |
| Lenovo ThinkBook 14 G2 ITL 20VD008WGE | |
| Lenovo Yoga Slim 7i Carbon 13 ITL | |
| Huawei MateBook X Pro 2021 | |
| HWBOT x265 Benchmark v2.2 / 4k Preset | |
| Asus VivoBook Flip 14 TM420IA | |
| MSI Summit E13 Flip Evo A11MT | |
| HP Envy x360 13-ay0010nr | |
| Lenovo ThinkBook 14 G2 ITL 20VD008WGE | |
| Gemiddeld Intel Core i7-1185G7 (5.02 - 8.13, n=27) | |
| Lenovo Yoga Slim 7i Carbon 13 ITL | |
| Huawei MateBook X Pro 2021 | |
| Asus Zenbook S UX393JA | |
| Samsung Galaxy Book Flex 13.3 | |
| R Benchmark 2.5 / Overall mean | |
| Samsung Galaxy Book Flex 13.3 | |
| Asus Zenbook S UX393JA | |
| Lenovo ThinkBook 14 G2 ITL 20VD008WGE | |
| HP Envy x360 13-ay0010nr | |
| Asus VivoBook Flip 14 TM420IA | |
| Huawei MateBook X Pro 2021 | |
| MSI Summit E13 Flip Evo A11MT | |
| Gemiddeld Intel Core i7-1185G7 (0.55 - 0.615, n=27) | |
| Lenovo Yoga Slim 7i Carbon 13 ITL | |
* ... kleiner is beter
Systeemprestaties
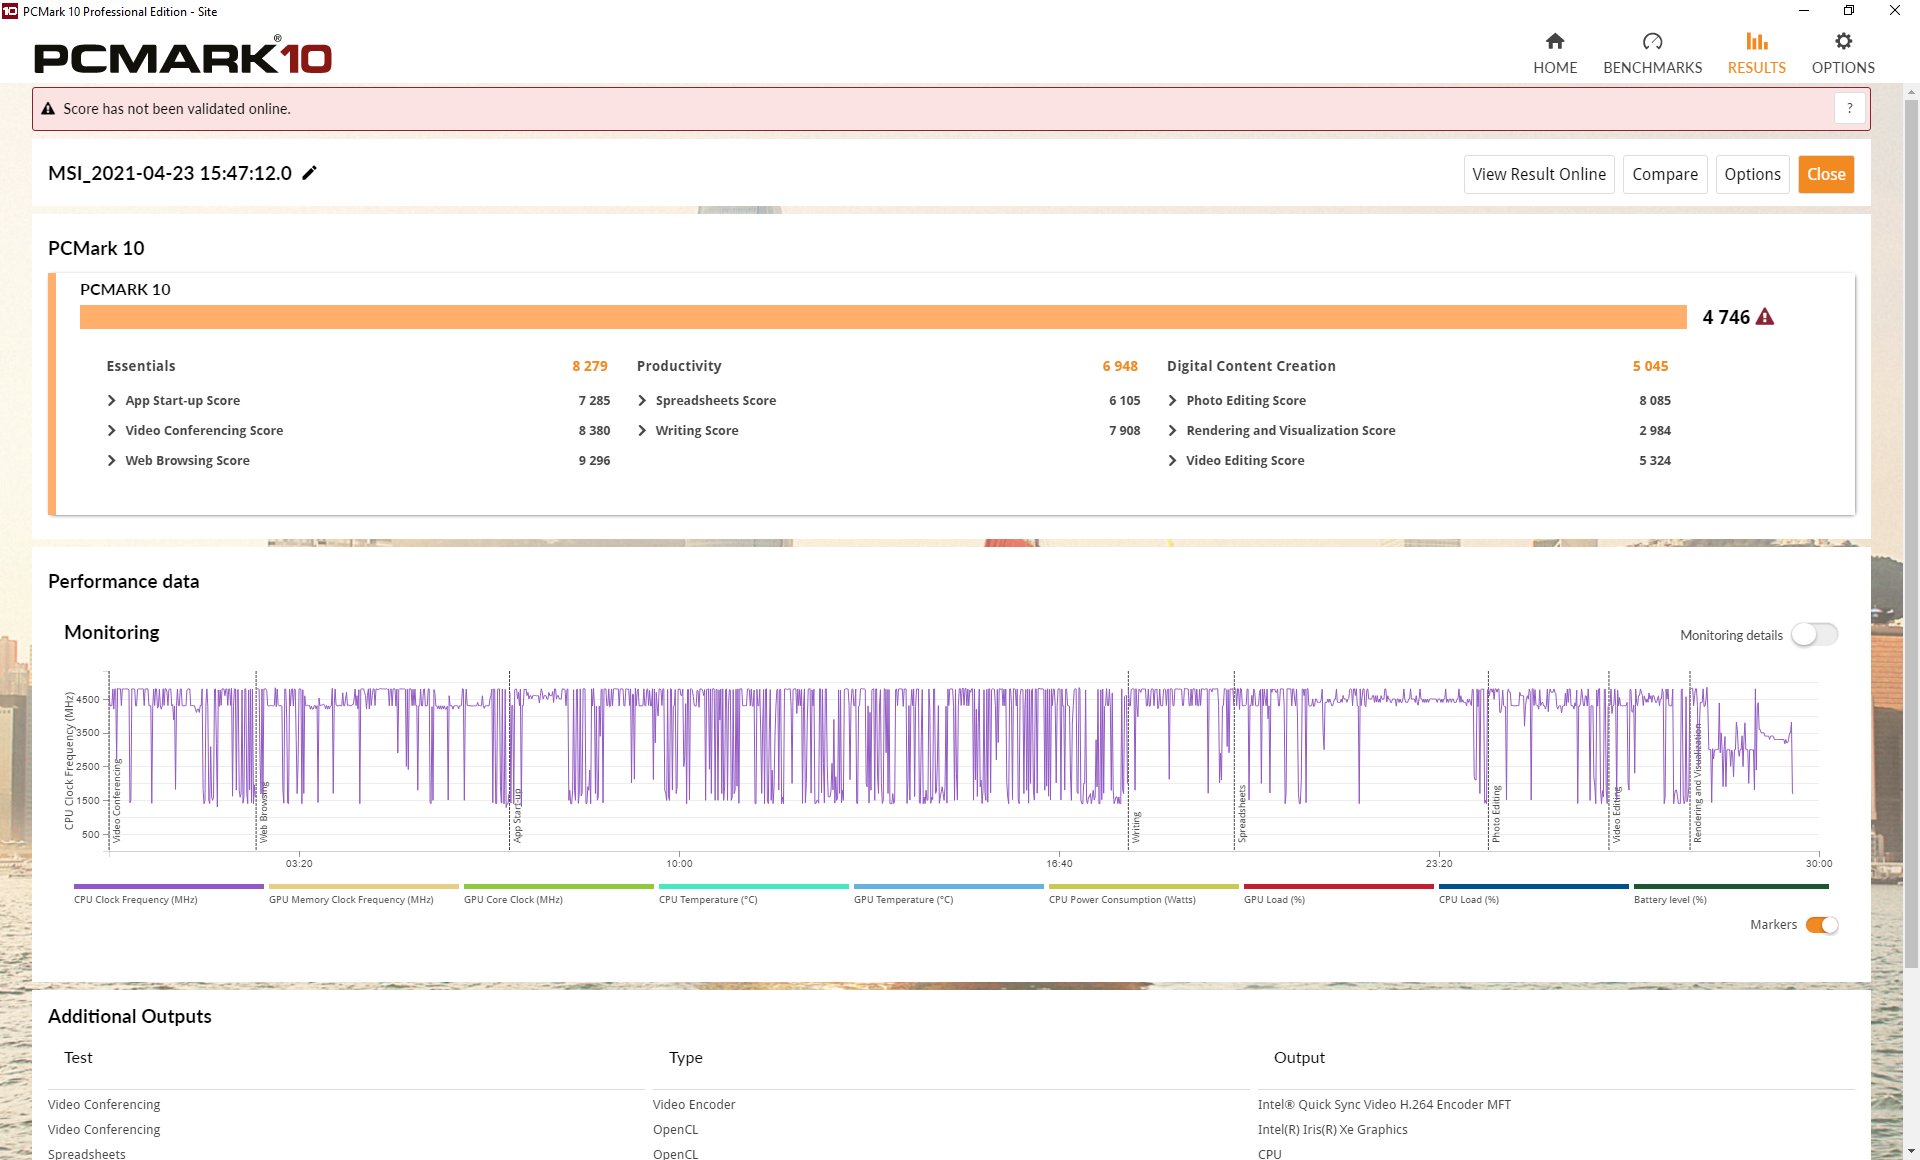
| PCMark 10 Score | 4746 punten | |
Help | ||
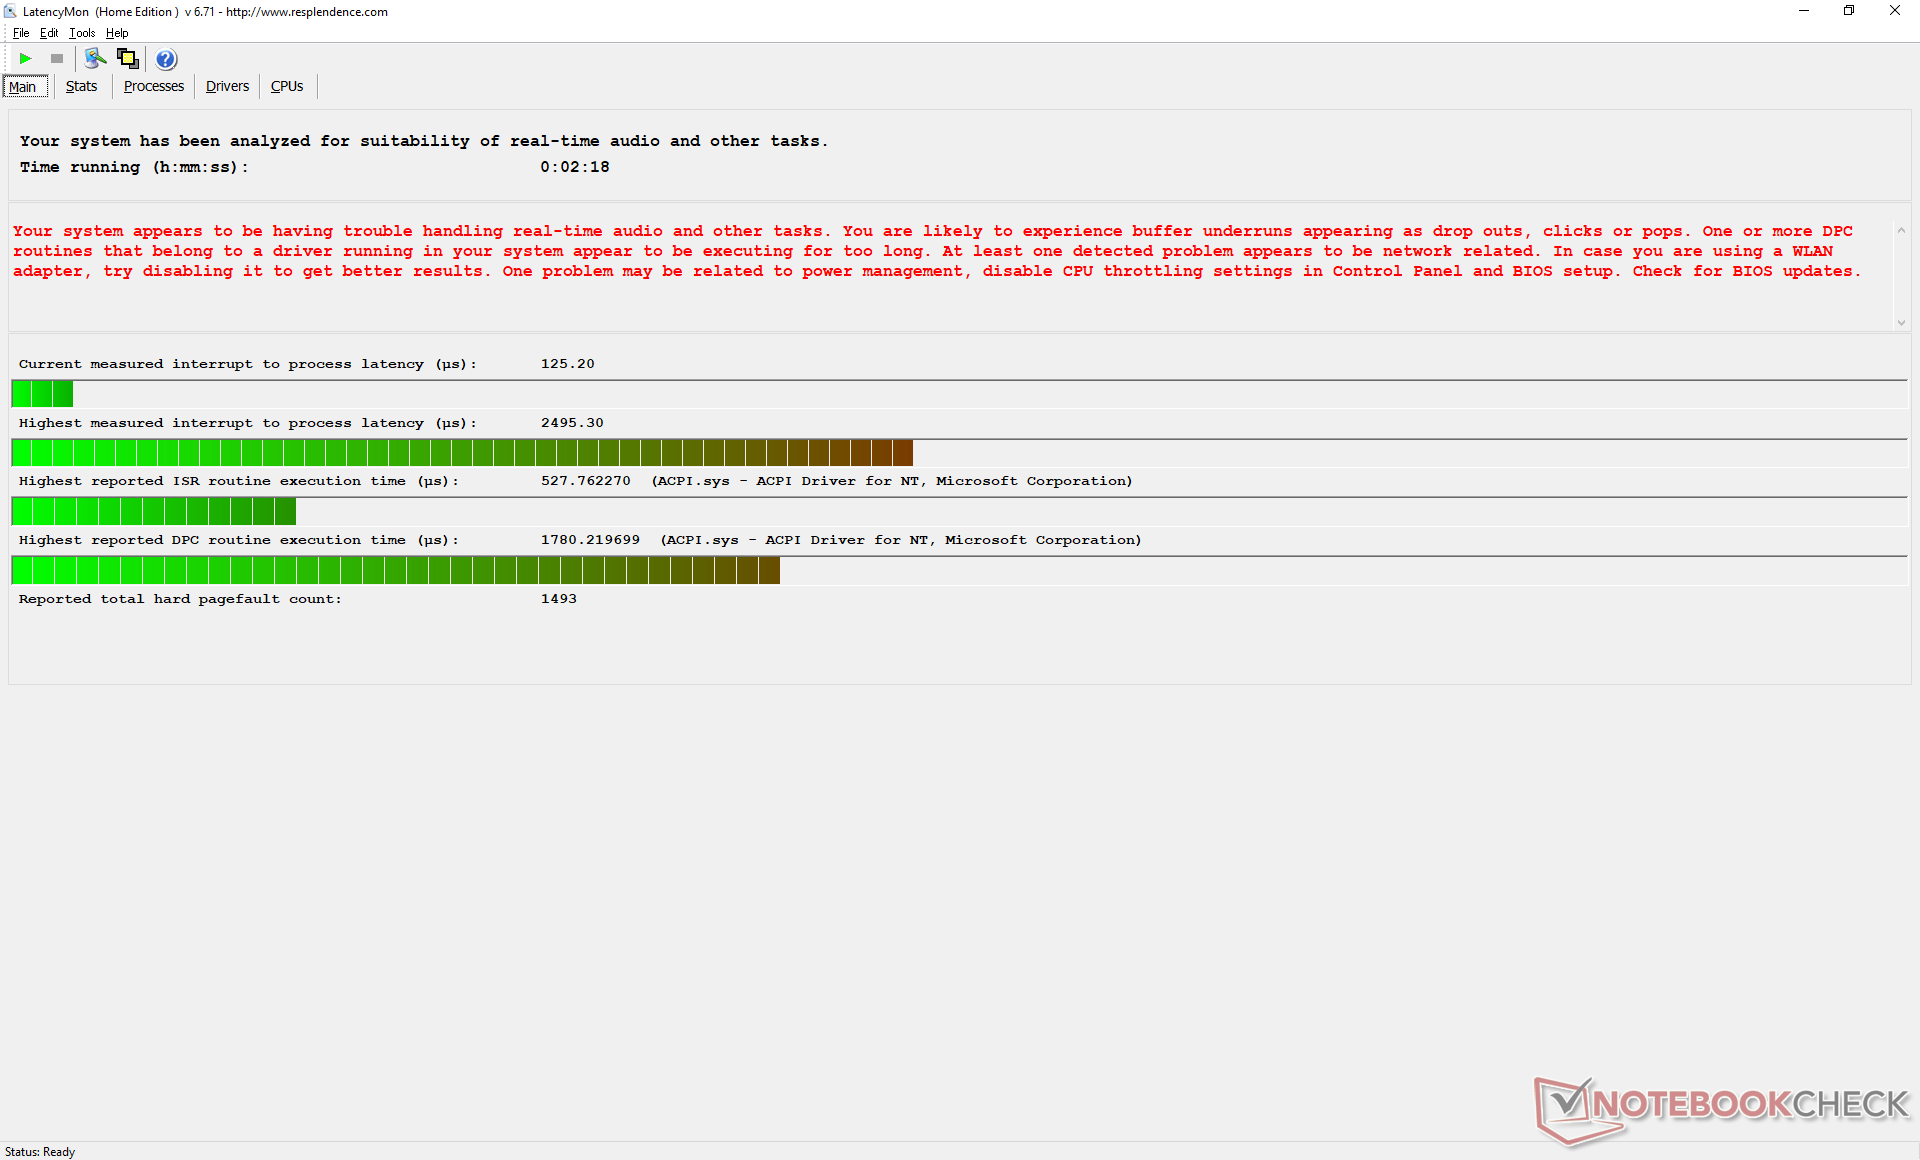
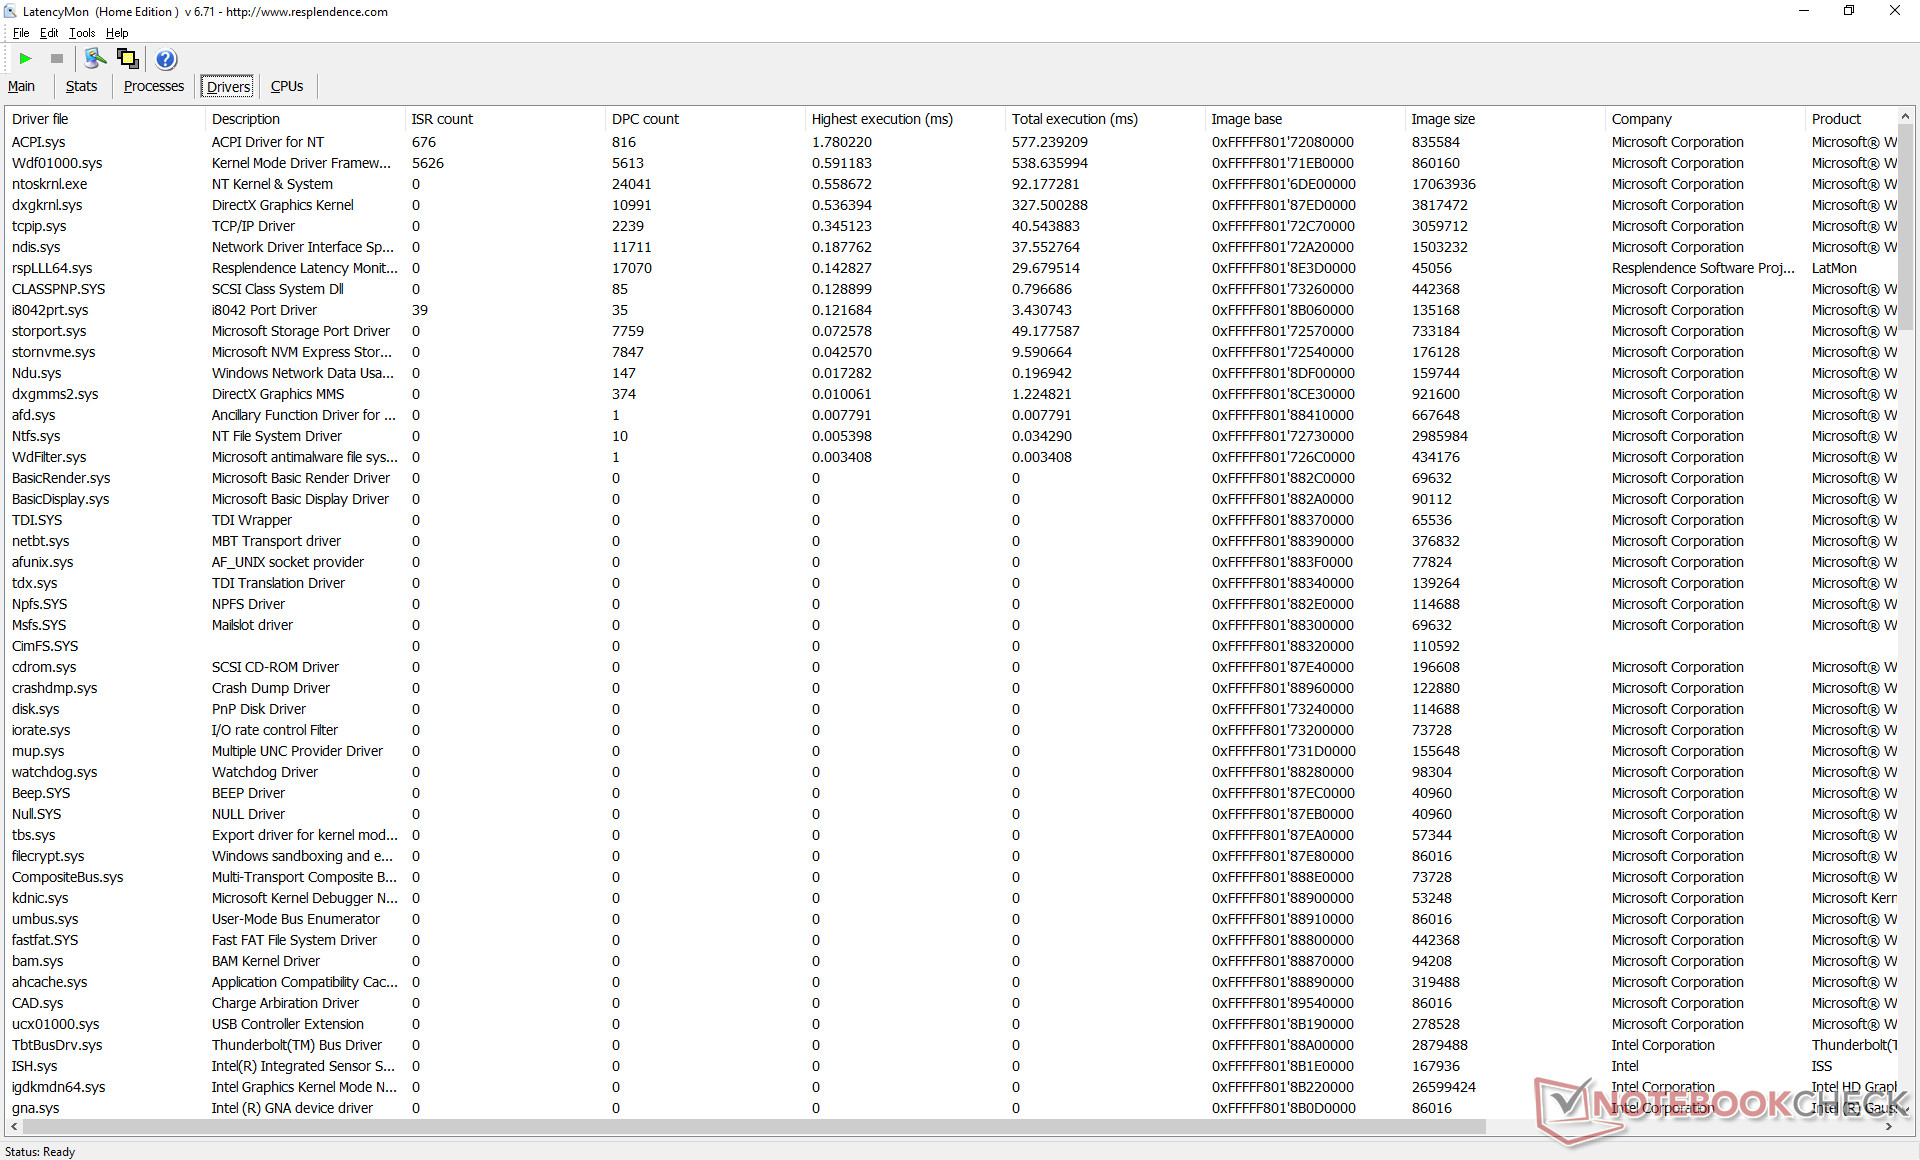
DPC latentie
LatencyMon onthult DPC latency problemen bij het openen van meerdere tabbladen op onze homepage. Het afspelen van 4K UHD video resulteerde ook in 4 dropped frames tijdens onze minuut lange testvideo.
| DPC Latencies / LatencyMon - interrupt to process latency (max), Web, Youtube, Prime95 | |
| MSI Summit E13 Flip Evo A11MT | |
| HP Spectre x360 14t-ea000 | |
| Lenovo ThinkPad X1 Titanium Yoga G1 20QA001RGE | |
| Huawei MateBook X Pro 2021 | |
| Asus Zenbook 14 UX435EG | |
* ... kleiner is beter
Opslagapparaten
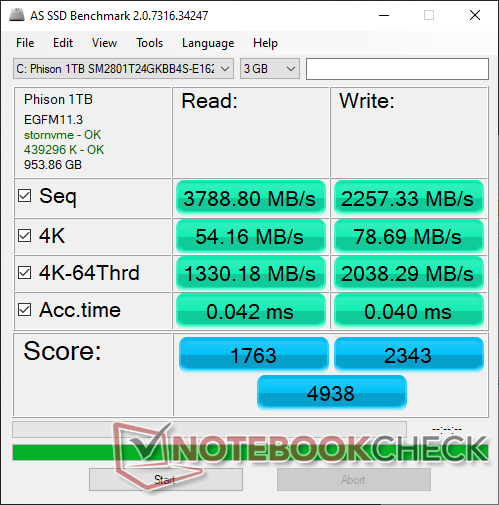
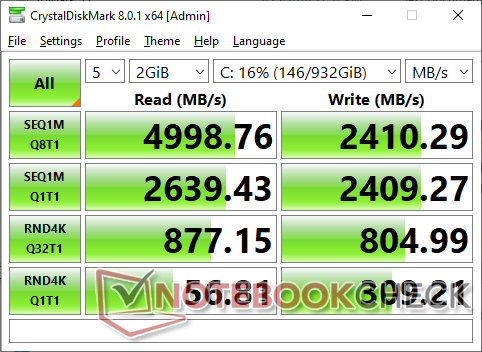
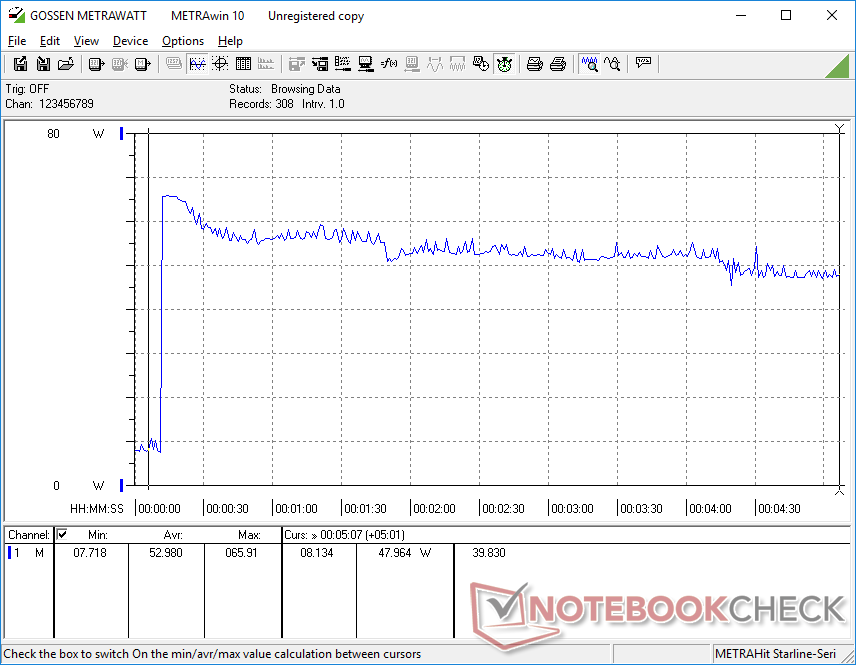
De Summit E13 Flip is een van de weinige in zijn grootte categorie op dit moment om te komen met een PCIe 4.0 M.2 slot om snelheden te ondersteunen tot twee keer de typische PCIe 3.0 NVMe schijf. Onze testeenheid wordt geleverd met dezelfde 1 TB Phison PCIe 4.0 NVMe SSD als gevonden op de grotere Summit E15. Dit is een PCIe 4.0 SSD uit het middensegment, want de overdrachtsnelheden liggen rond de 5000 MB/s, vergeleken met bijna 7000 MB/s met de Samsung PM9A1.
Vreemd genoeg is er een aanlooptijd voordat overdrachtssnelheden hun volledige potentieel kunnen bereiken wanneer DiskSpd in een lus wordt uitgevoerd, zoals blijkt uit de onderstaande grafiek. Onze resultaten wijken af van die van de eerder genoemde Summit E15, zelfs na meerdere hertests.
| MSI Summit E13 Flip Evo A11MT Phison 1TB SM2801T24GKBB4S-E162 | Dell XPS 13 7390 2-in-1 Core i7 Toshiba BG4 KBG40ZPZ512G | HP Spectre x360 14t-ea000 Samsung SSD PM981a MZVLB512HBJQ | Huawei MateBook X Pro 2021 Samsung PM981a MZVLB1T0HBLR | Lenovo ThinkPad X1 Titanium Yoga G1 20QA001RGE Toshiba BG4 KBG40ZNT512G | Asus Zenbook 14 UX435EG Samsung PM981a MZVLB1T0HBLR | |
|---|---|---|---|---|---|---|
| AS SSD | -144% | -16% | 7% | -45% | 10% | |
| Seq Read (MB/s) | 3789 | 1801 -52% | 2188 -42% | 2794 -26% | 1898 -50% | 2861 -24% |
| Seq Write (MB/s) | 2257 | 1125 -50% | 1320 -42% | 2385 6% | 1065 -53% | 2837 26% |
| 4K Read (MB/s) | 54.2 | 39.7 -27% | 53.5 -1% | 60.7 12% | 58 7% | 60.3 11% |
| 4K Write (MB/s) | 78.7 | 67 -15% | 123.7 57% | 180.8 130% | 200.7 155% | 164.2 109% |
| 4K-64 Read (MB/s) | 1330 | 1253 -6% | 1010 -24% | 1768 33% | 580 -56% | 1598 20% |
| 4K-64 Write (MB/s) | 2038 | 209 -90% | 1808 -11% | 1800 -12% | 779 -62% | 1572 -23% |
| Access Time Read * (ms) | 0.042 | 0.069 -64% | 0.055 -31% | 0.037 12% | 0.052 -24% | 0.046 -10% |
| Access Time Write * (ms) | 0.04 | 0.625 -1463% | 0.076 -90% | 0.073 -83% | 0.16 -300% | 0.021 47% |
| Score Read (Points) | 1763 | 1472 -17% | 1282 -27% | 2108 20% | 828 -53% | 1945 10% |
| Score Write (Points) | 2343 | 388 -83% | 2063 -12% | 2219 -5% | 1087 -54% | 2020 -14% |
| Score Total (Points) | 4938 | 2583 -48% | 3970 -20% | 5392 9% | 2316 -53% | 4966 1% |
| Copy ISO MB/s (MB/s) | 2270 | 1293 -43% | 1644 -28% | 2065 -9% | 1659 -27% | 2414 6% |
| Copy Program MB/s (MB/s) | 670 | 560 -16% | 920 37% | 734 10% | 519 -23% | 575 -14% |
| Copy Game MB/s (MB/s) | 1525 | 927 -39% | 1725 13% | 1629 7% | 872 -43% | 1408 -8% |
| CrystalDiskMark 5.2 / 6 | -43% | -28% | -13% | -30% | -5% | |
| Write 4K (MB/s) | 311.1 | 106.7 -66% | 82.2 -74% | 197.5 -37% | 226.6 -27% | 211.8 -32% |
| Read 4K (MB/s) | 56.6 | 49.94 -12% | 45.7 -19% | 52.9 -7% | 62.8 11% | 50.1 -11% |
| Write Seq (MB/s) | 2397 | 1223 -49% | 2000 -17% | 2174 -9% | 1296 -46% | 2938 23% |
| Read Seq (MB/s) | 2277 | 1801 -21% | 2206 -3% | 2156 -5% | 1445 -37% | 2639 16% |
| Write 4K Q32T1 (MB/s) | 803 | 325.3 -59% | 451.2 -44% | 632 -21% | 545 -32% | 656 -18% |
| Read 4K Q32T1 (MB/s) | 849 | 551 -35% | 351 -59% | 694 -18% | 687 -19% | 723 -15% |
| Write Seq Q32T1 (MB/s) | 2410 | 1224 -49% | 2982 24% | 3017 25% | 1483 -38% | 3022 25% |
| Read Seq Q32T1 (MB/s) | 4954 | 2350 -53% | 3529 -29% | 3561 -28% | 2334 -53% | 3561 -28% |
| Totaal Gemiddelde (Programma / Instellingen) | -94% /
-107% | -22% /
-20% | -3% /
0% | -38% /
-40% | 3% /
4% |
* ... kleiner is beter

Disk Throttling: DiskSpd Read Loop, Queue Depth 8
GPU prestatie
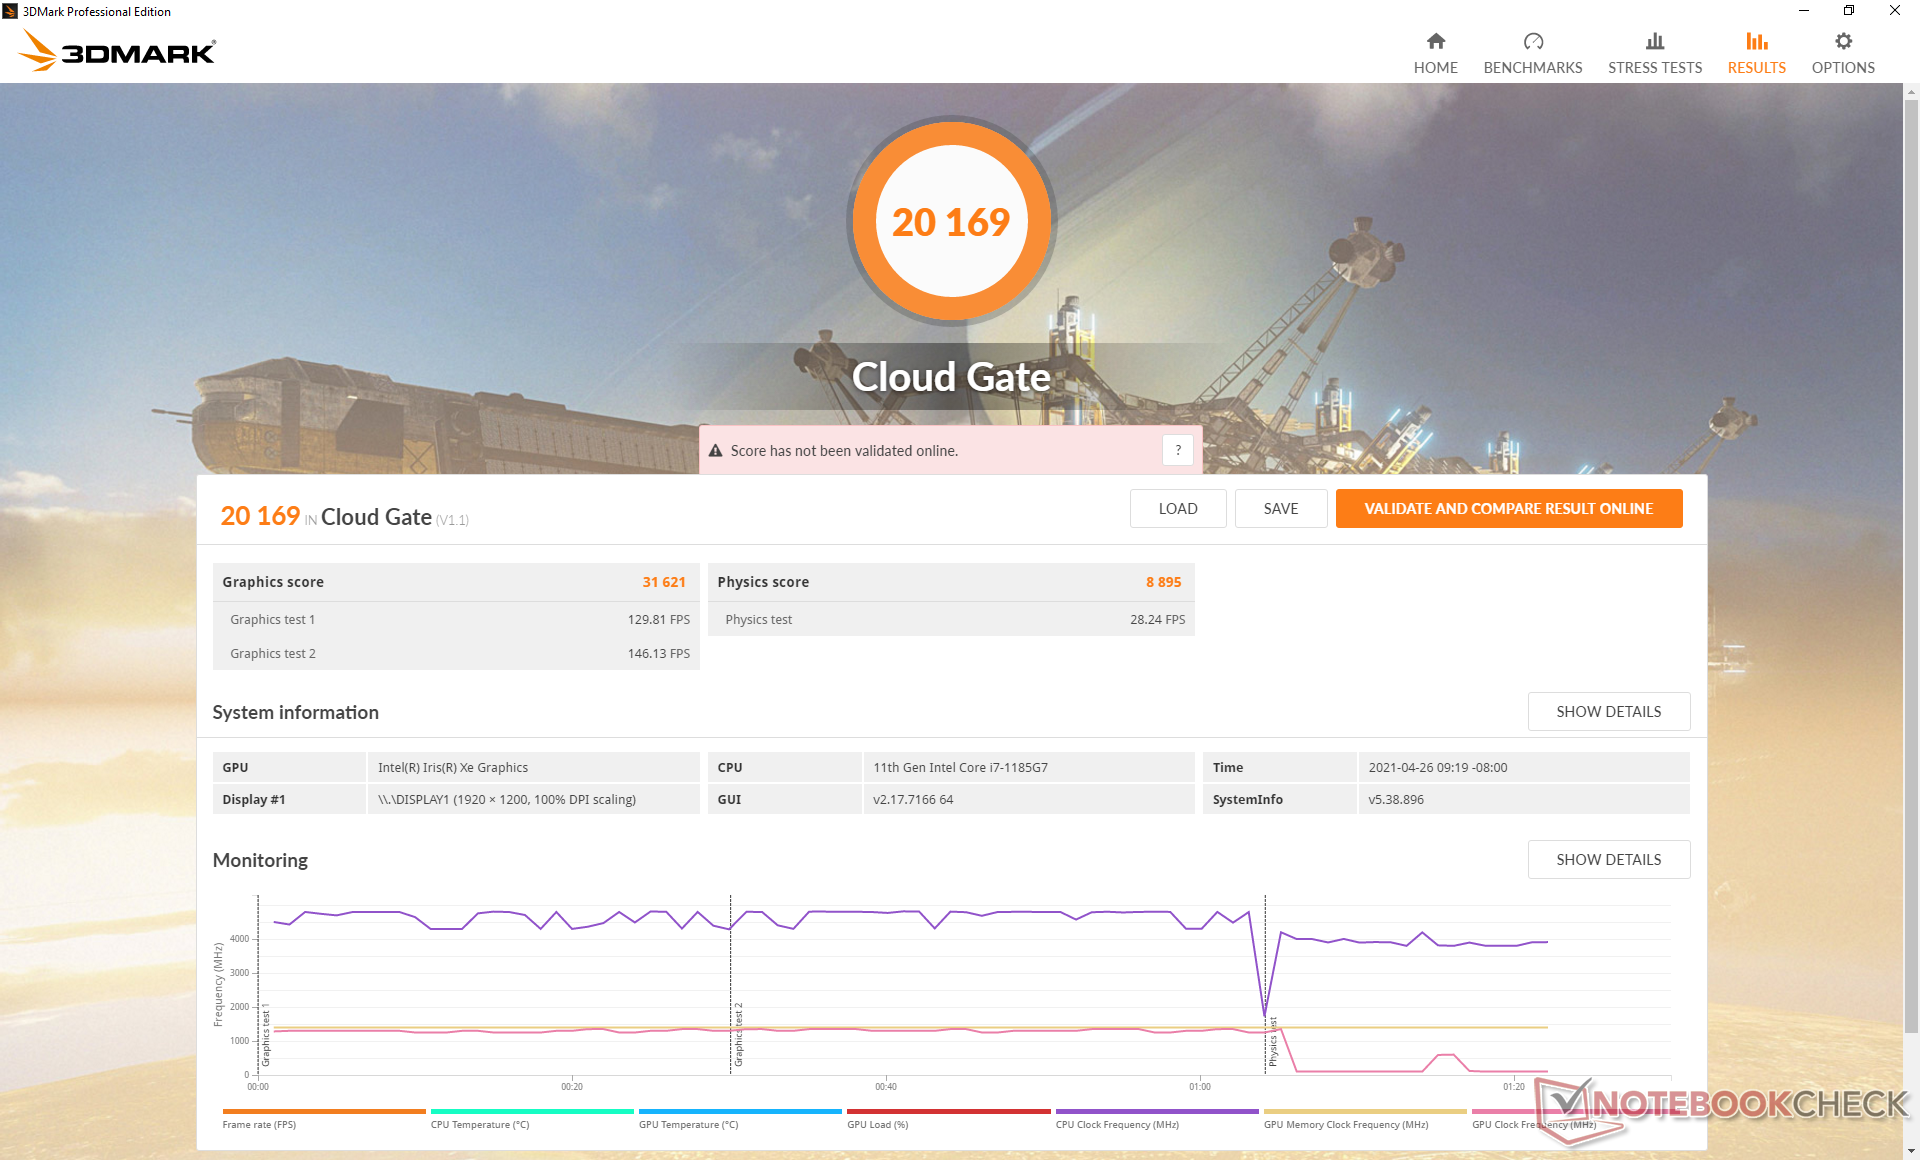
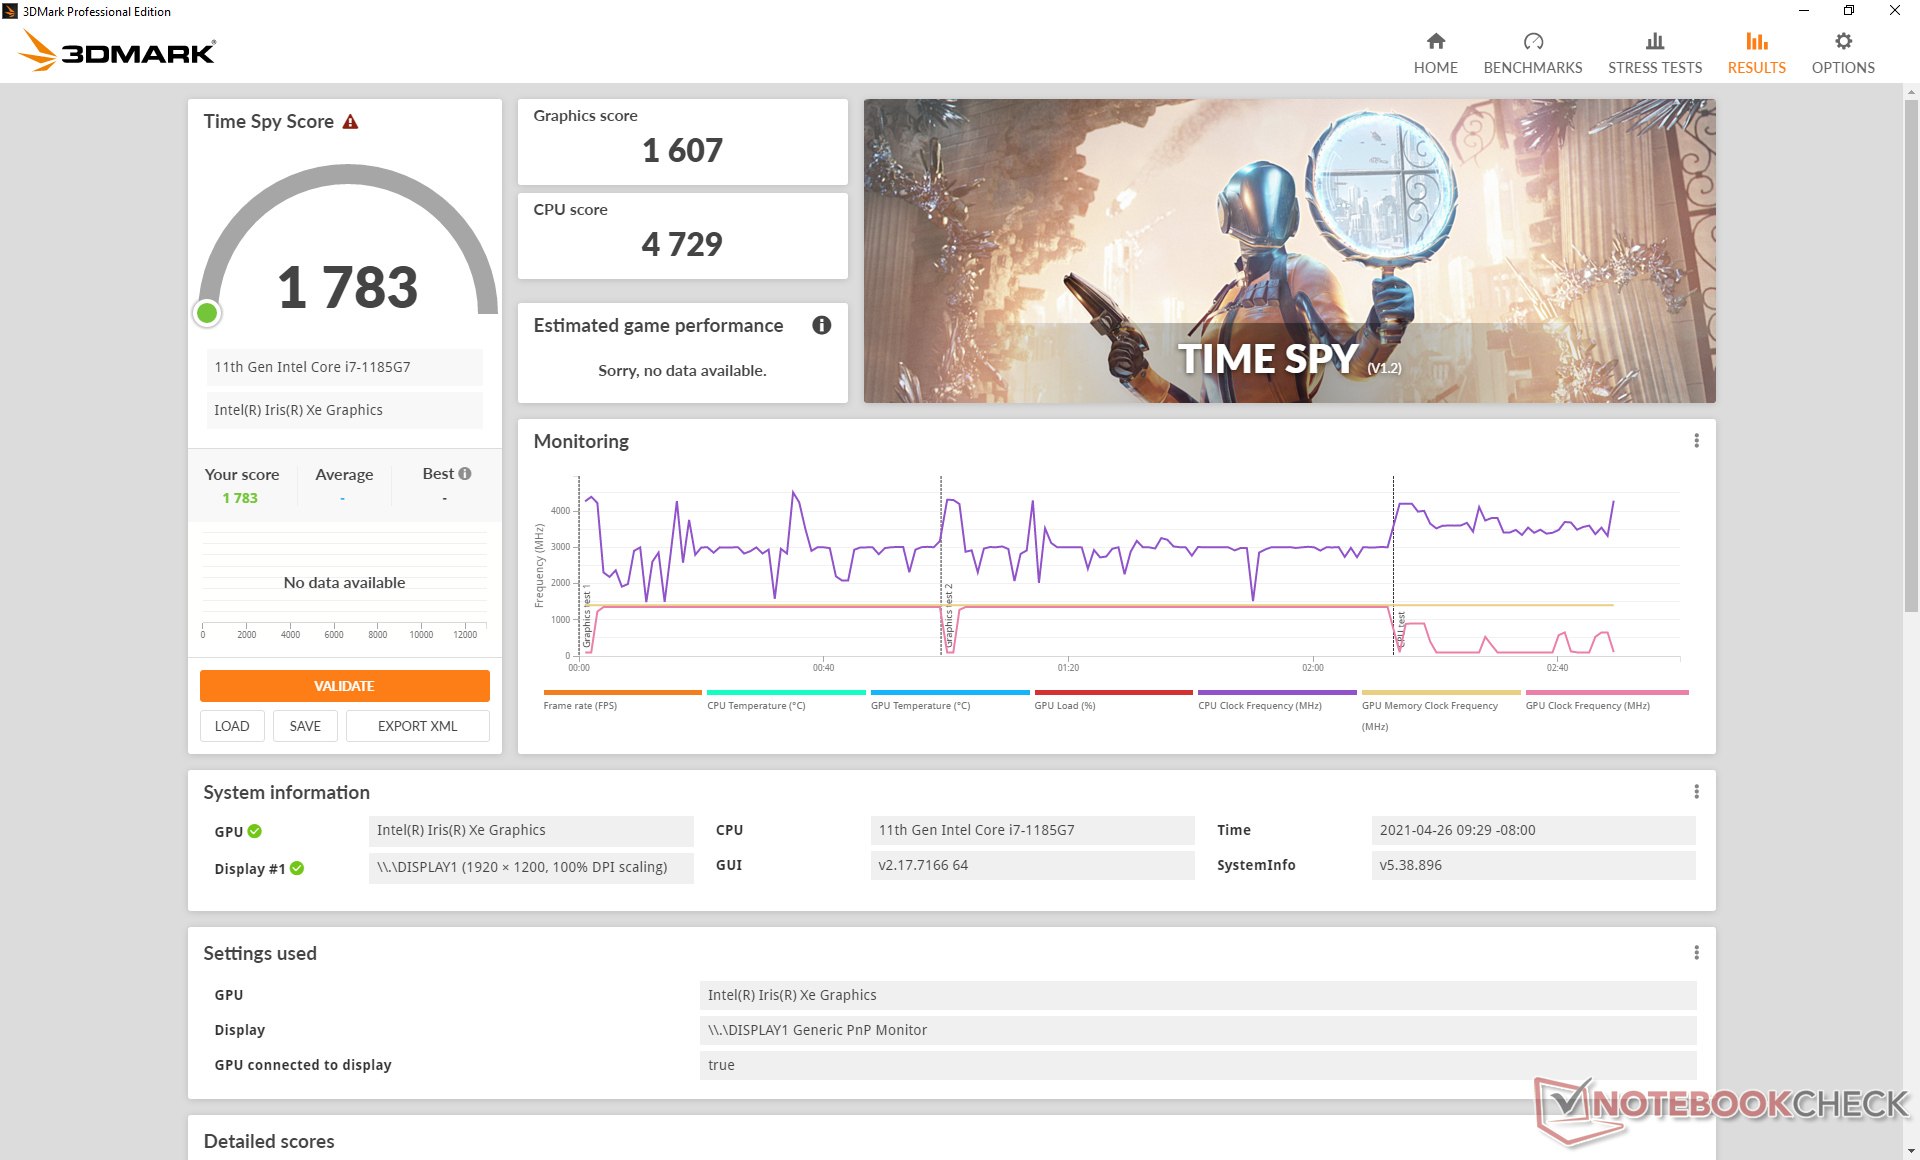
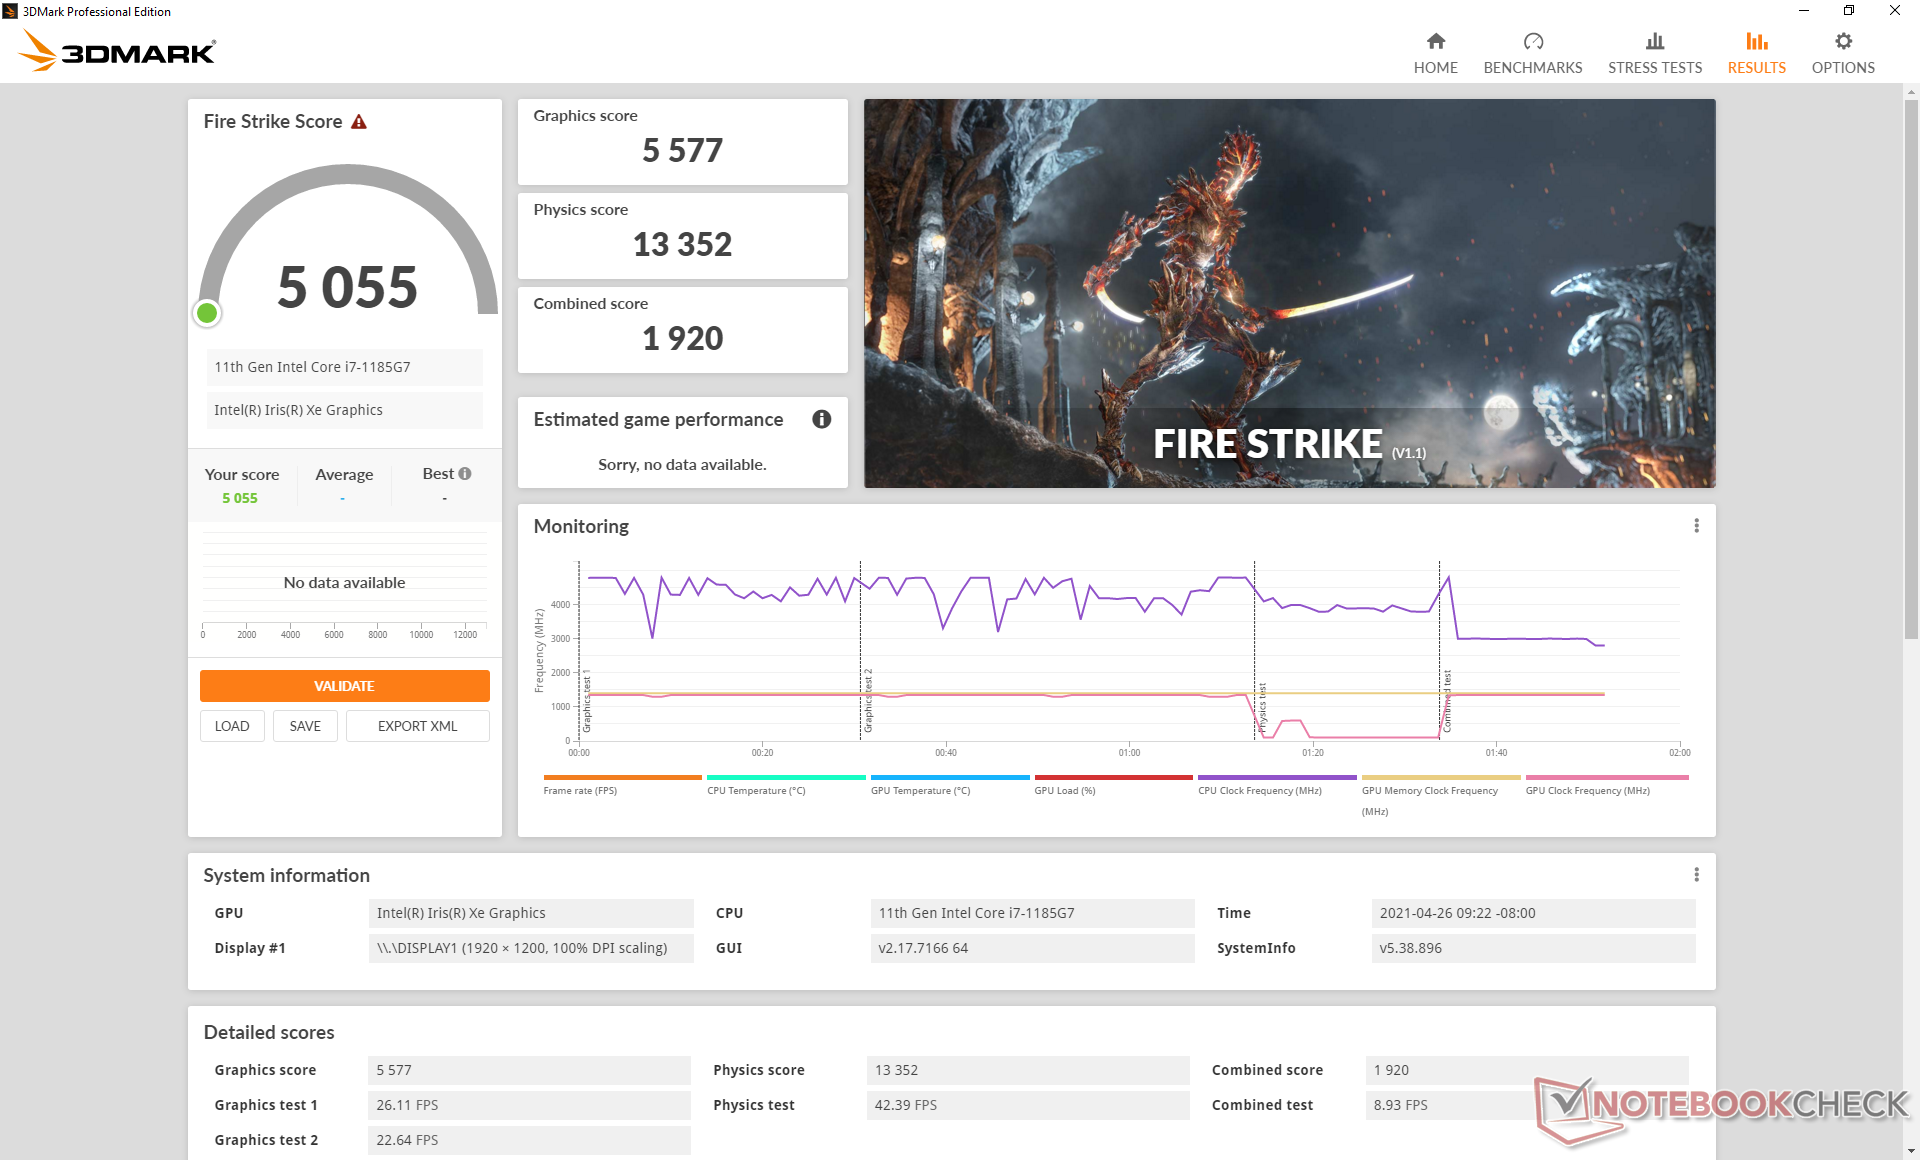
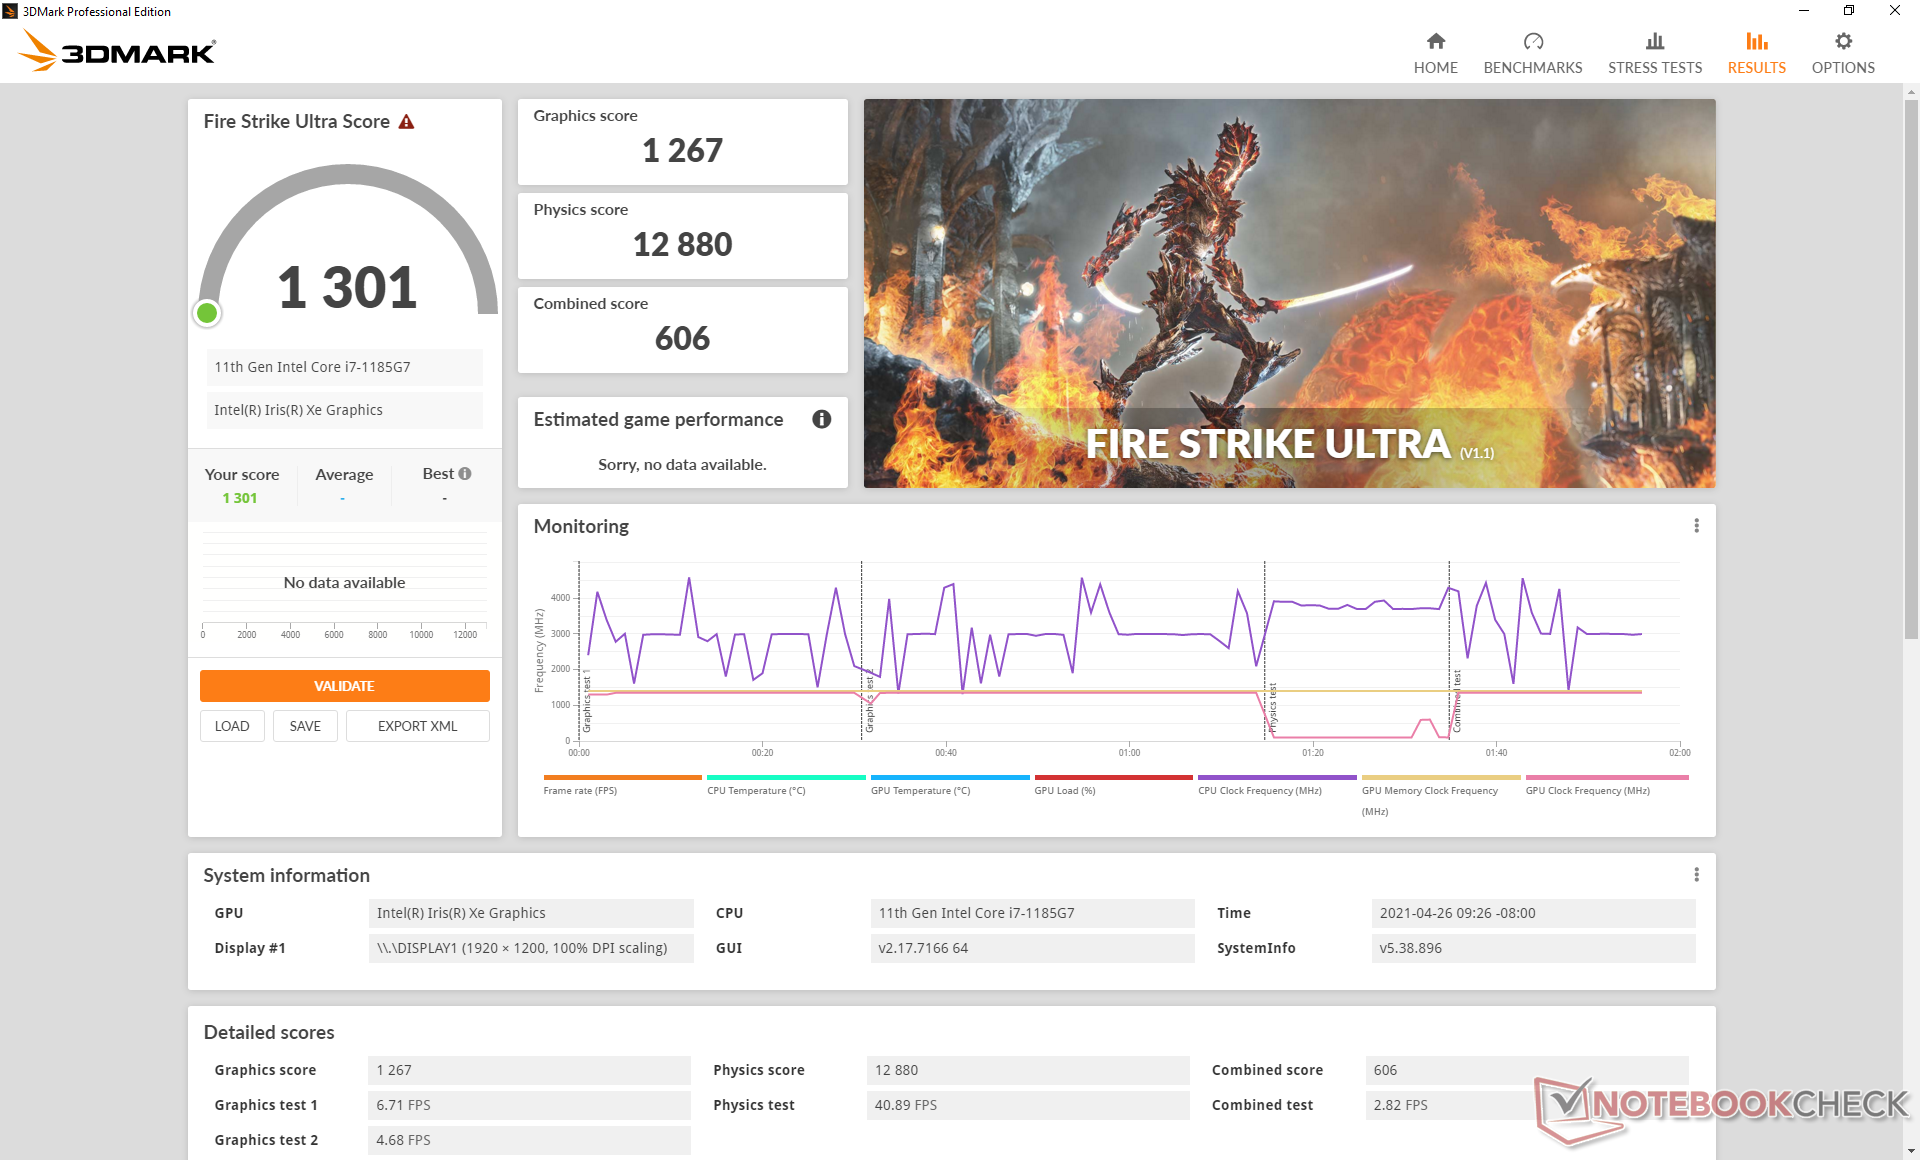
De ruwe grafische prestaties zijn uitstekend, aangezien de 3DMark resultaten consistent ten minste 10 procent hoger zijn dan de gemiddelde Iris Xe 96 EU's in onze database. Dit voordeel vertaalt zich goed naar echte games, waar gemiddelde framerates de meeste andere Core i7 Tiger Lake-U laptops voorbijstreven. We vermoeden dat de 32 GB RAM hier deels verantwoordelijk voor is, aangezien dit twee keer zoveel is als wat doorgaans bij Ultrabooks wordt geleverd. Gebruikers die upgraden van de UHD Graphics 620 of zelfs de Iris Plus G7 zullen merkbare voordelen zien.
Gamen is mogelijk, maar snel bewegende games zoals Overwatch of Rocket League moeten worden vermeden op het hoofdscherm vanwege zware ghosting.
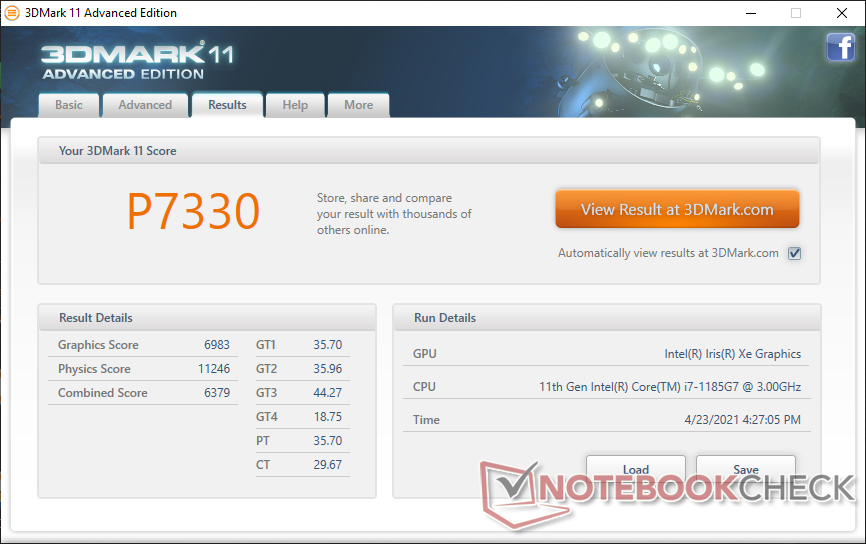
| 3DMark 11 Performance | 7330 punten | |
| 3DMark Cloud Gate Standard Score | 20169 punten | |
| 3DMark Fire Strike Score | 5055 punten | |
| 3DMark Time Spy Score | 1783 punten | |
Help | ||
| lage | gem. | hoge | ultra | |
|---|---|---|---|---|
| GTA V (2015) | 90.6 | 76.1 | 23.7 | 11.2 |
| The Witcher 3 (2015) | 99.9 | 61.8 | 31 | 14.7 |
| Dota 2 Reborn (2015) | 82.6 | 69.6 | 48.5 | 47.2 |
| Final Fantasy XV Benchmark (2018) | 44.7 | 24.1 | 18.2 | |
| X-Plane 11.11 (2018) | 26.7 | 37.7 | 33.1 | |
| Strange Brigade (2018) | 97.4 | 39.1 | 30.8 | 25.1 |
Emissions
Systeemgeluid
De ventilatoren zijn over het algemeen stil tijdens lage belastingen voor een stille browse- of video-streaming ervaring. In de High Performance modus hebben ze echter de neiging om vaker te pulseren en te springen naar 26,4 dB(A) of hoger tegen een stille achtergrond van 24,5 dB(A). Gebruikers moeten het systeem instellen op de Stille of Gebalanceerde modus via MSI Center als het minimaliseren van het ventilatorgeluid een prioriteit is.
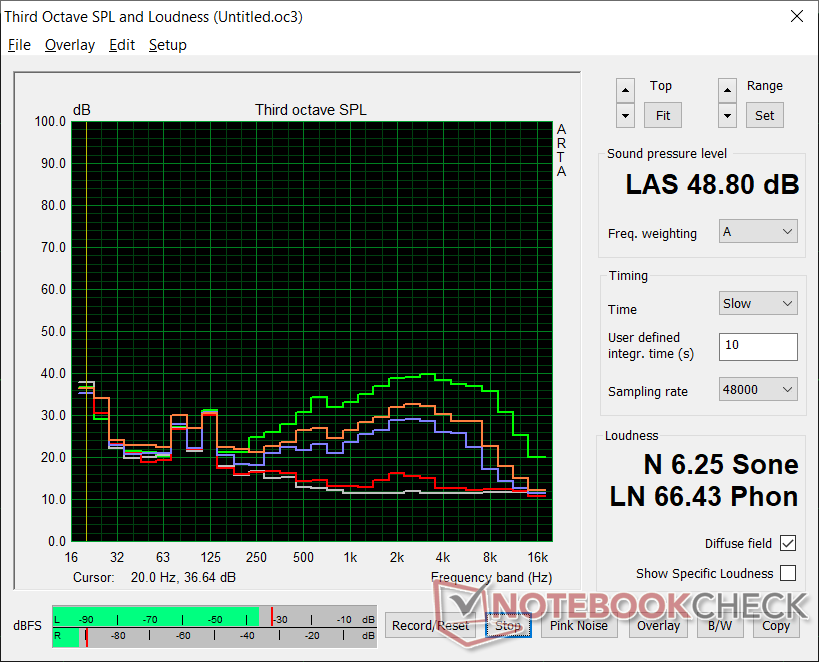
Gaming zal een ventilatorgeluid veroorzaken tussen 37,8 dB(A) en 41,4 dB(A) om zo luid te zijn als de Asus ZenBook 14 met de discrete GeForce MX450 GPU. Het inschakelen van Cooler Boost zal het ventilatorgeluid nog verder opdrijven tot bijna 49 dB(A) en is daarmee een van de luidste Core U-aangedreven convertibles. Gelukkig is de functie niet nodig voor de meeste toepassingen.
| MSI Summit E13 Flip Evo A11MT Iris Xe G7 96EUs, i7-1185G7, Phison 1TB SM2801T24GKBB4S-E162 | Dell XPS 13 7390 2-in-1 Core i7 Iris Plus Graphics G7 (Ice Lake 64 EU), i7-1065G7, Toshiba BG4 KBG40ZPZ512G | HP Spectre x360 14t-ea000 Iris Xe G7 96EUs, i7-1165G7, Samsung SSD PM981a MZVLB512HBJQ | Huawei MateBook X Pro 2021 Iris Xe G7 96EUs, i7-1165G7, Samsung PM981a MZVLB1T0HBLR | Lenovo ThinkPad X1 Titanium Yoga G1 20QA001RGE Iris Xe G7 96EUs, i7-1160G7, Toshiba BG4 KBG40ZNT512G | Asus Zenbook 14 UX435EG GeForce MX450, i7-1165G7, Samsung PM981a MZVLB1T0HBLR | |
|---|---|---|---|---|---|---|
| Noise | -4% | 6% | 9% | 7% | -1% | |
| uit / omgeving * (dB) | 24.5 | 28.1 -15% | 25.8 -5% | 25.4 -4% | 25.1 -2% | 25.6 -4% |
| Idle Minimum * (dB) | 24.7 | 28.1 -14% | 25.9 -5% | 25.6 -4% | 25.1 -2% | 25.6 -4% |
| Idle Average * (dB) | 24.7 | 28.1 -14% | 25.9 -5% | 25.6 -4% | 25.1 -2% | 25.6 -4% |
| Idle Maximum * (dB) | 26.4 | 28.1 -6% | 25.9 2% | 25.6 3% | 27.1 -3% | 26.3 -0% |
| Load Average * (dB) | 37.8 | 31.7 16% | 26.4 30% | 28.7 24% | 32.7 13% | 41.6 -10% |
| Witcher 3 ultra * (dB) | 41.4 | 43.4 -5% | 36.9 11% | 32 23% | 32.7 21% | 41.6 -0% |
| Load Maximum * (dB) | 48.8 | 43.4 11% | 41.5 15% | 38.2 22% | 35.8 27% | 41.6 15% |
* ... kleiner is beter
Geluidsniveau
| Onbelast |
| 24.7 / 24.7 / 26.4 dB (A) |
| Belasting |
| 37.8 / 48.8 dB (A) |
 | ||
30 dB stil 40 dB(A) hoorbaar 50 dB(A) luid |
||
min: | ||
Temperatuur
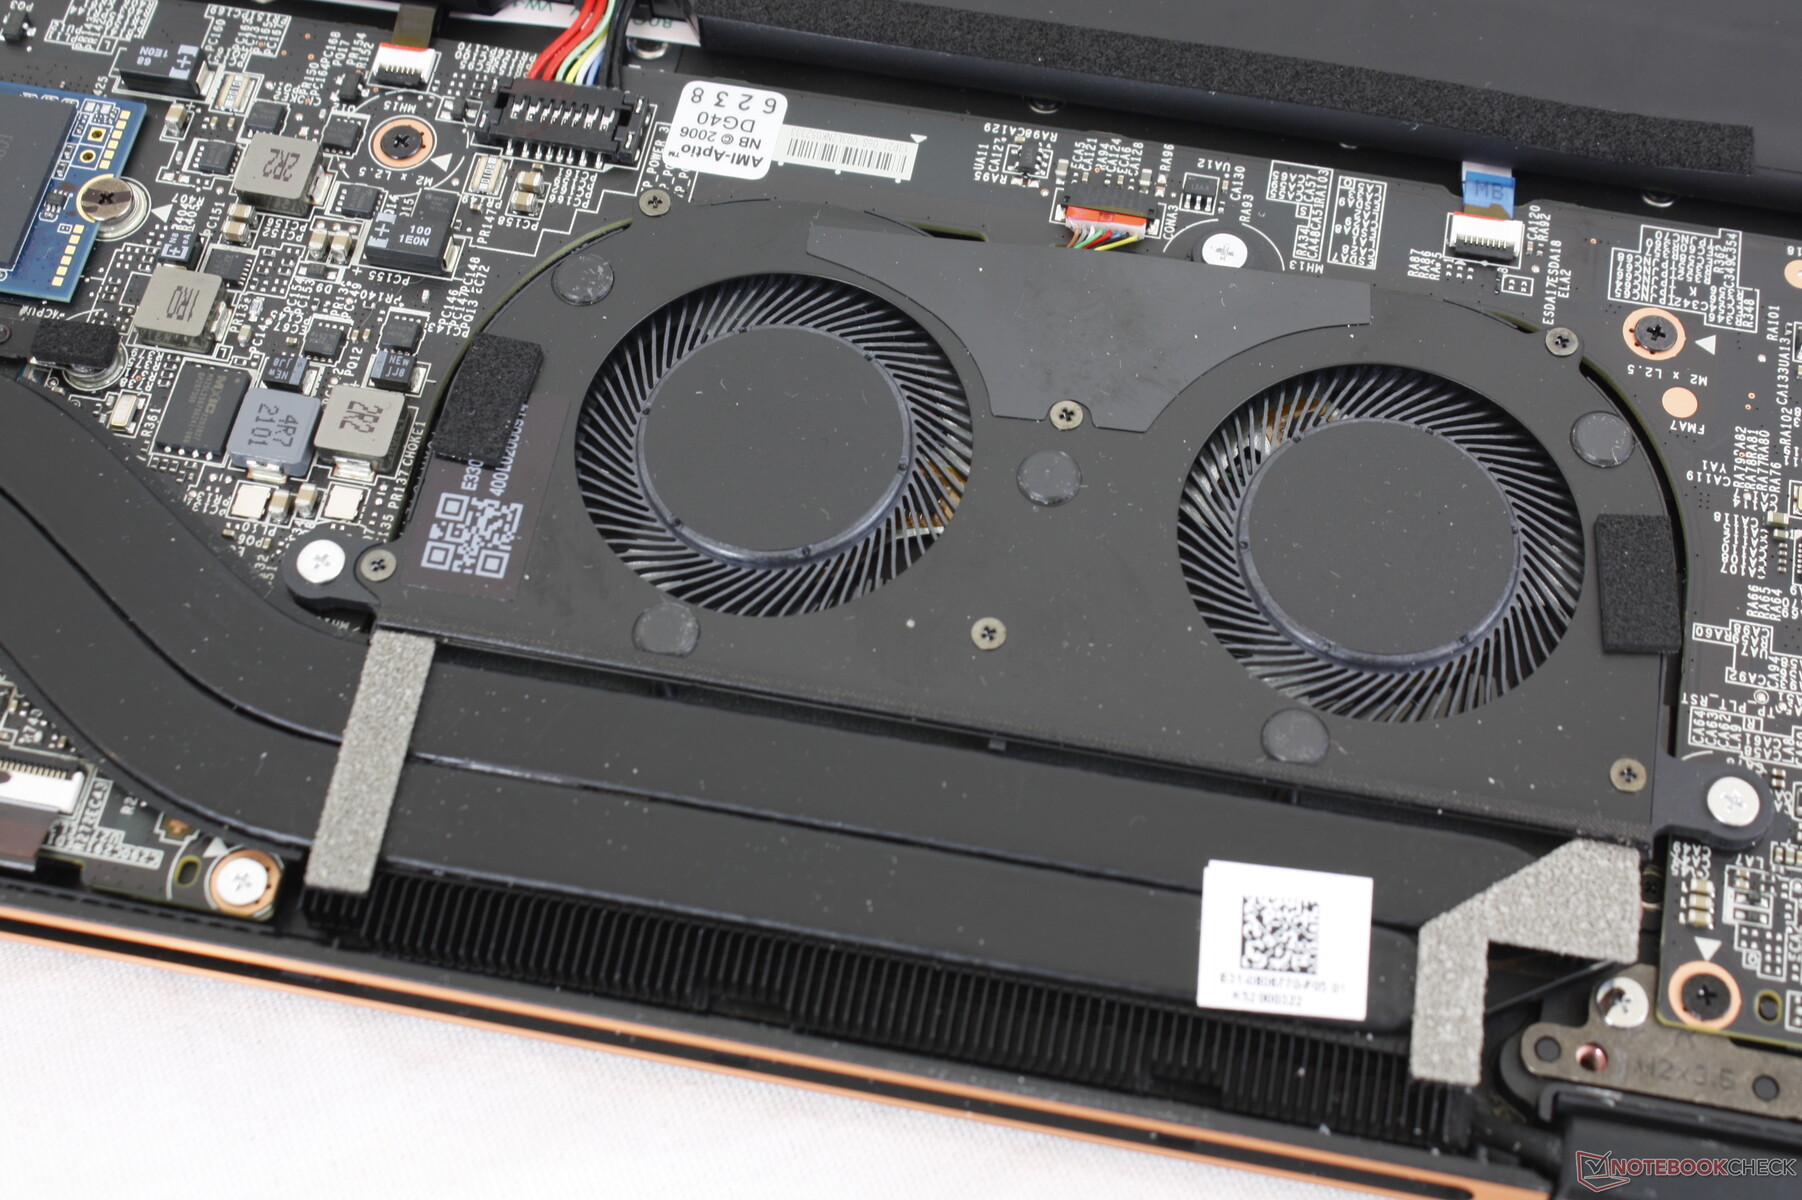
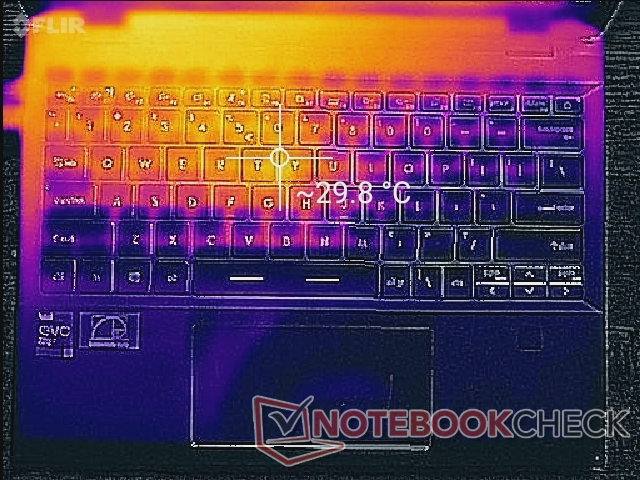
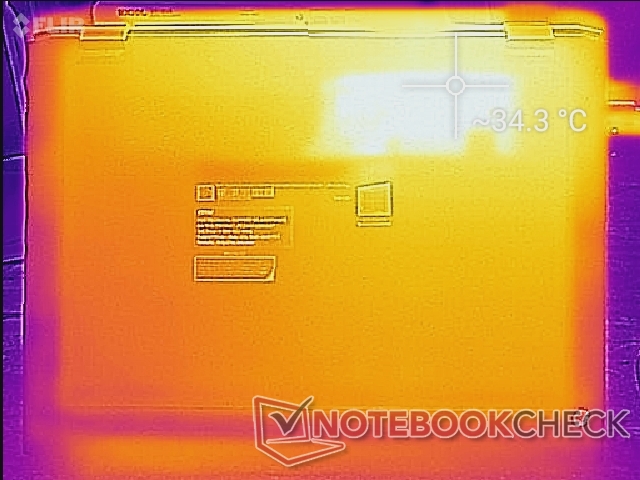
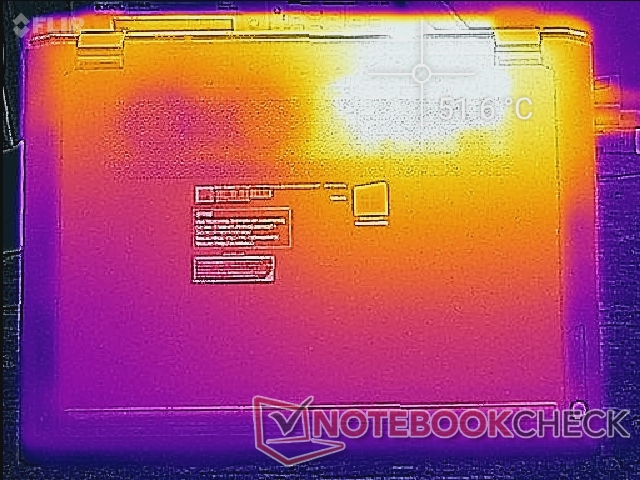
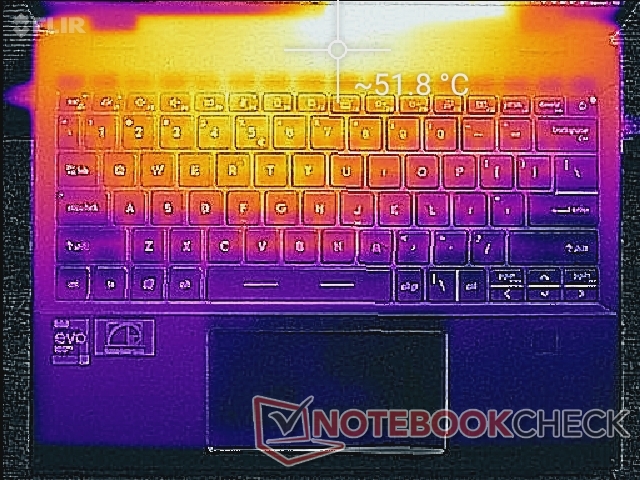
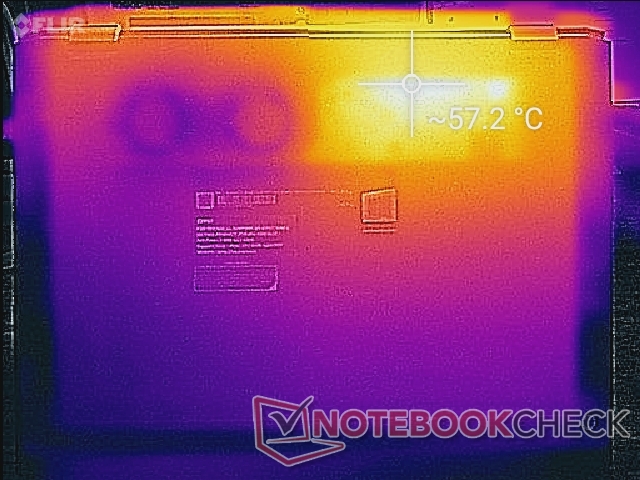
De oppervlaktetemperaturen zijn altijd het warmst aan de linkerhelft van de laptop dan aan de rechter, vanwege de plaatsing van de koeloplossing binnenin. De warme plek op het toetsenbord kan wel 46 C worden, terwijl de onderkant tot 52 C kan oplopen tijdens het gamen. Hoewel niet hinderlijk, zijn de warme gebieden zeker merkbaar en waarschijnlijk te wijten aan de hoge kerntemperaturen zoals beschreven in onze Stress Test sectie. Zorg ervoor dat u het relatief kleine ventilatieraam aan de onderkant van de laptop niet blokkeert wanneer u veeleisende belastingen uitvoert.
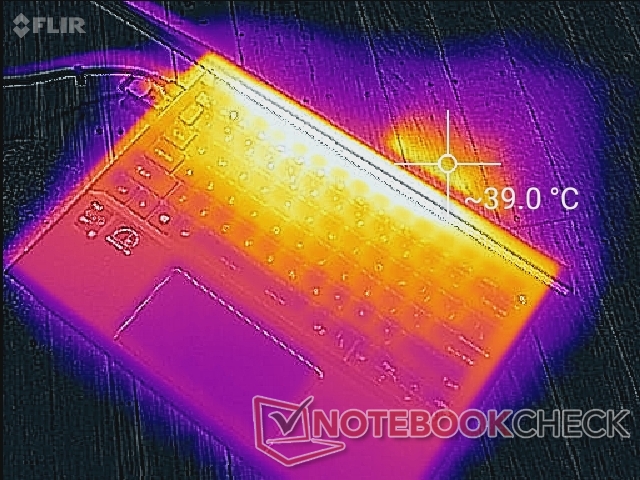
(-) De maximumtemperatuur aan de bovenzijde bedraagt 52 °C / 126 F, vergeleken met het gemiddelde van 35.4 °C / 96 F, variërend van 19.6 tot 60 °C voor de klasse Convertible.
(-) De bodem warmt op tot een maximum van 57.4 °C / 135 F, vergeleken met een gemiddelde van 36.9 °C / 98 F
(+) Bij onbelast gebruik bedraagt de gemiddelde temperatuur voor de bovenzijde 27 °C / 81 F, vergeleken met het apparaatgemiddelde van 30.3 °C / 87 F.
(±) Bij het spelen van The Witcher 3 is de gemiddelde temperatuur voor de bovenzijde 35.7 °C / 96 F, vergeleken met het apparaatgemiddelde van 30.3 °C / 87 F.
(+) De palmsteunen en het touchpad zijn met een maximum van ###max## °C / 81.7 F koeler dan de huidtemperatuur en voelen daarom koel aan.
(±) De gemiddelde temperatuur van de handpalmsteun van soortgelijke toestellen bedroeg 28 °C / 82.4 F (+0.4 °C / 0.7 F).

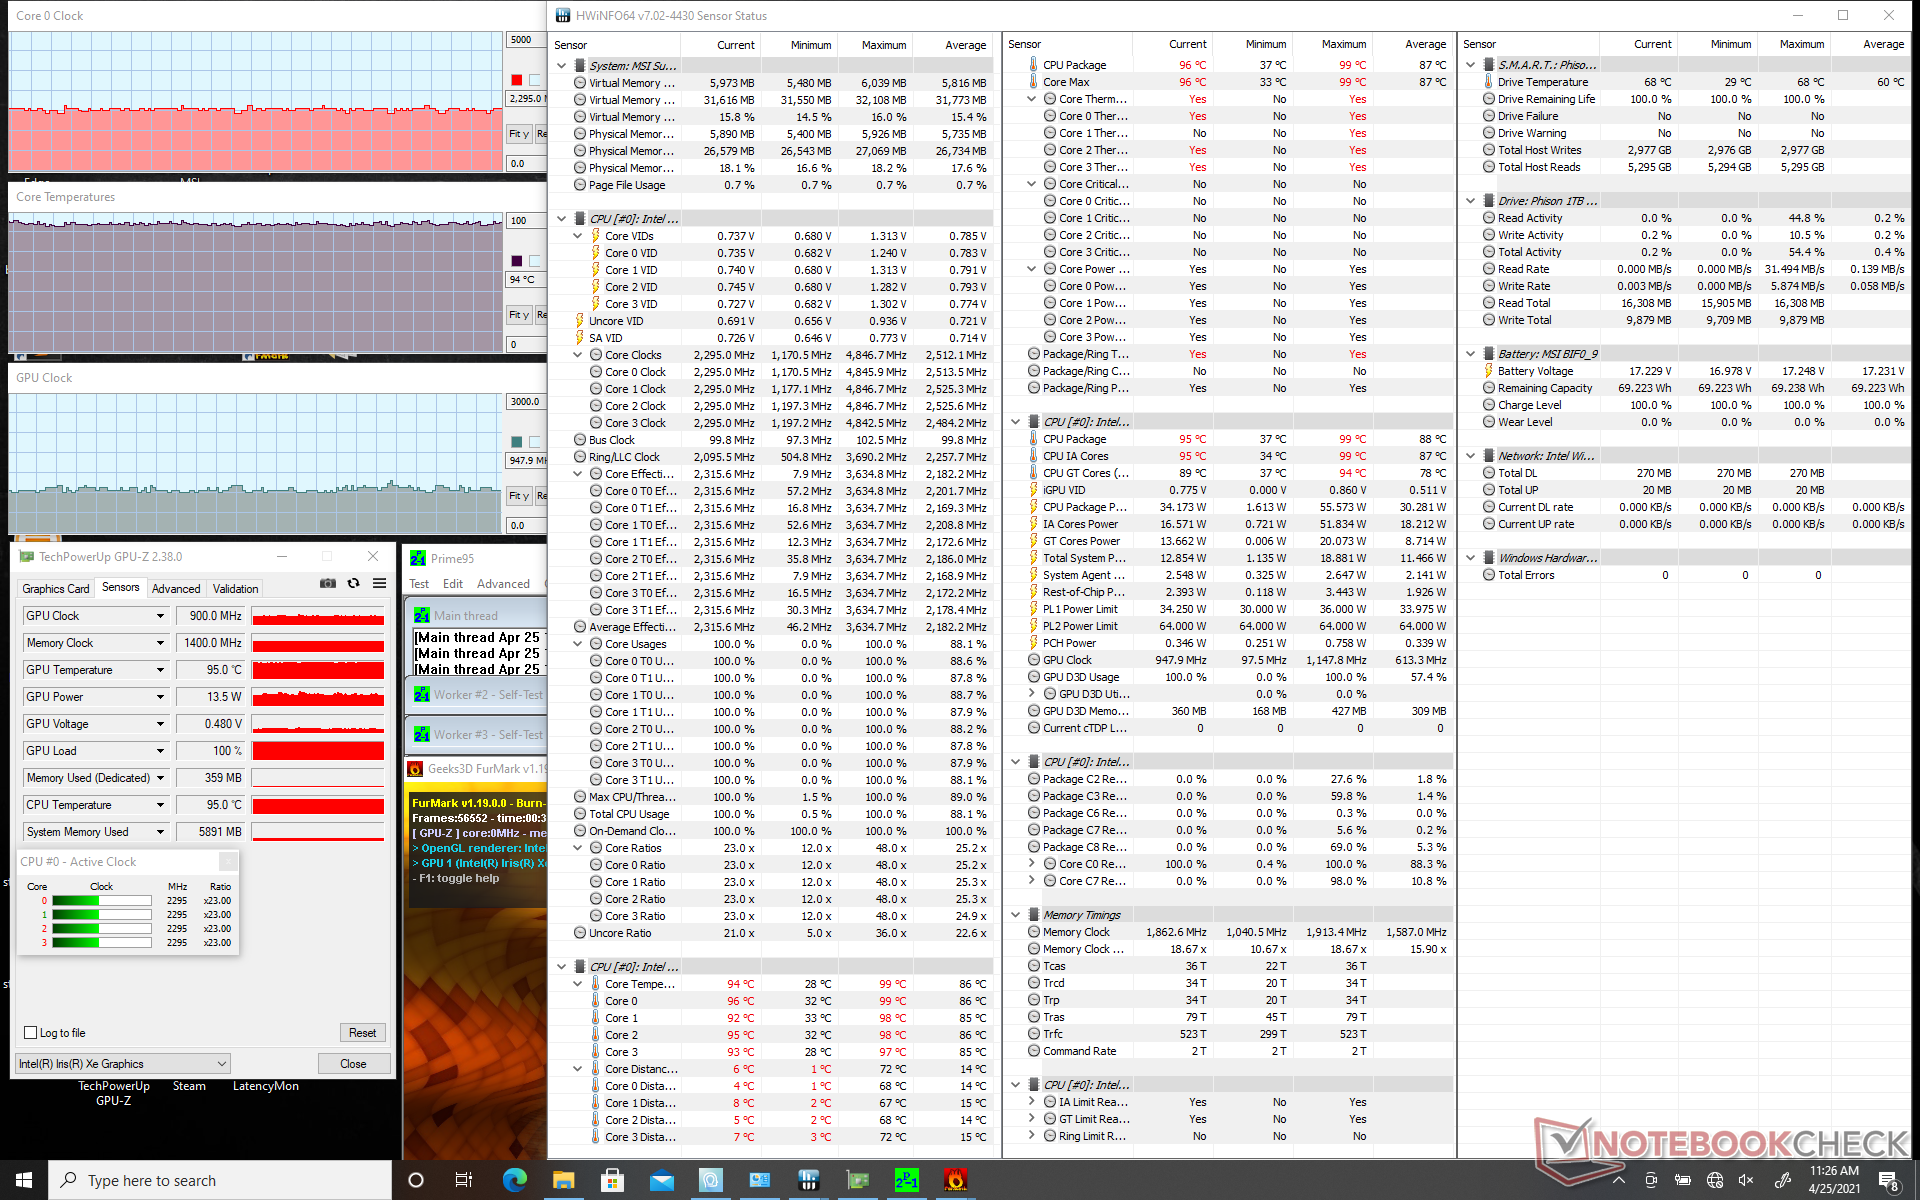
Stresstest
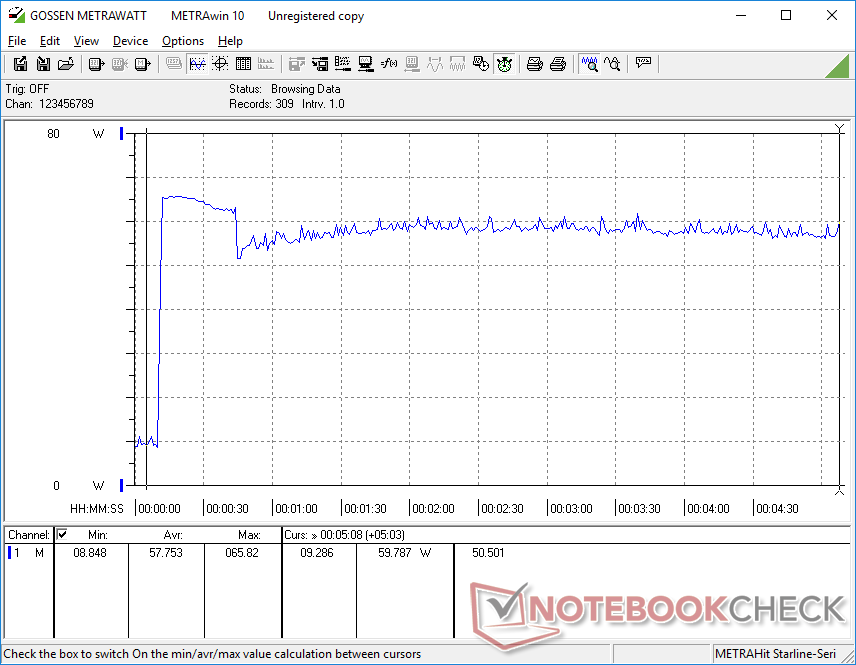
Wanneer de CPU wordt belast met Prime95, zal deze de eerste paar seconden een boost geven tot 3,7 GHz, voordat een kerntemperatuur van 95 C wordt bereikt. De kloksnelheid zal zich vervolgens stabiliseren rond 2,7 tot 2,9 GHz om een kerntemperatuur van 91 C te behouden. De MSI draait veel warmer dan de meeste andere Ultrabooks, waar kerntemperaturen meestal stabiliseren in het 70 C tot 80 C bereik, zoals bij de Huawei MateBook X Pro of Asus ZenBook 14.
Het inschakelen van de Cooler Boost modus (d.w.z. maximale ventilatormodus) heeft geen significante invloed op de CPU of GPU prestaties. De kerntemperatuur tijdens gamen kan echter tot 10 C koeler zijn als de functie is ingeschakeld.
Werken op de batterij beperkt de grafische prestaties. Een Fire Strike test op batterijen zou Physics en Graphics scores van respectievelijk 12682 en 4701 punten opleveren, vergeleken met 13352 en 5577 punten op netstroom.
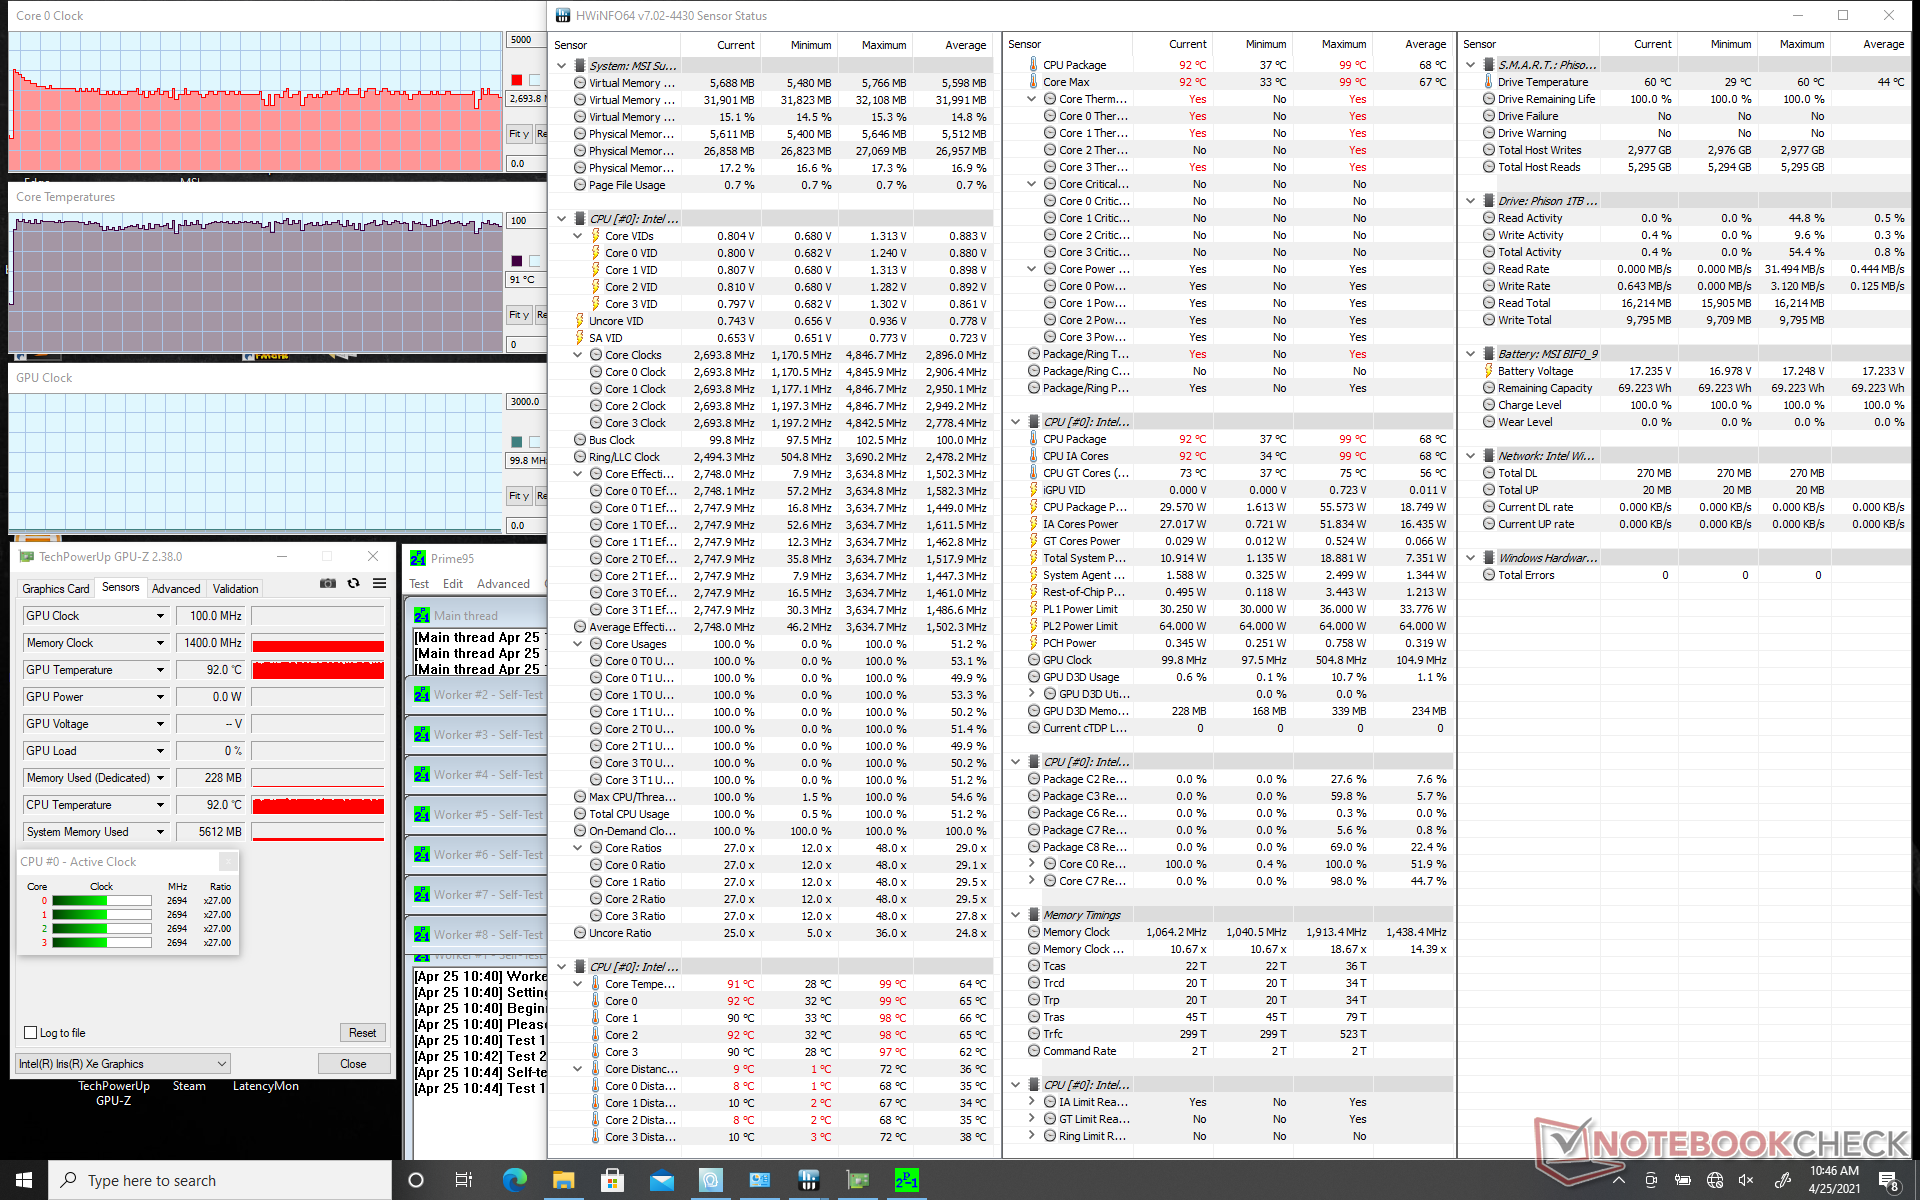
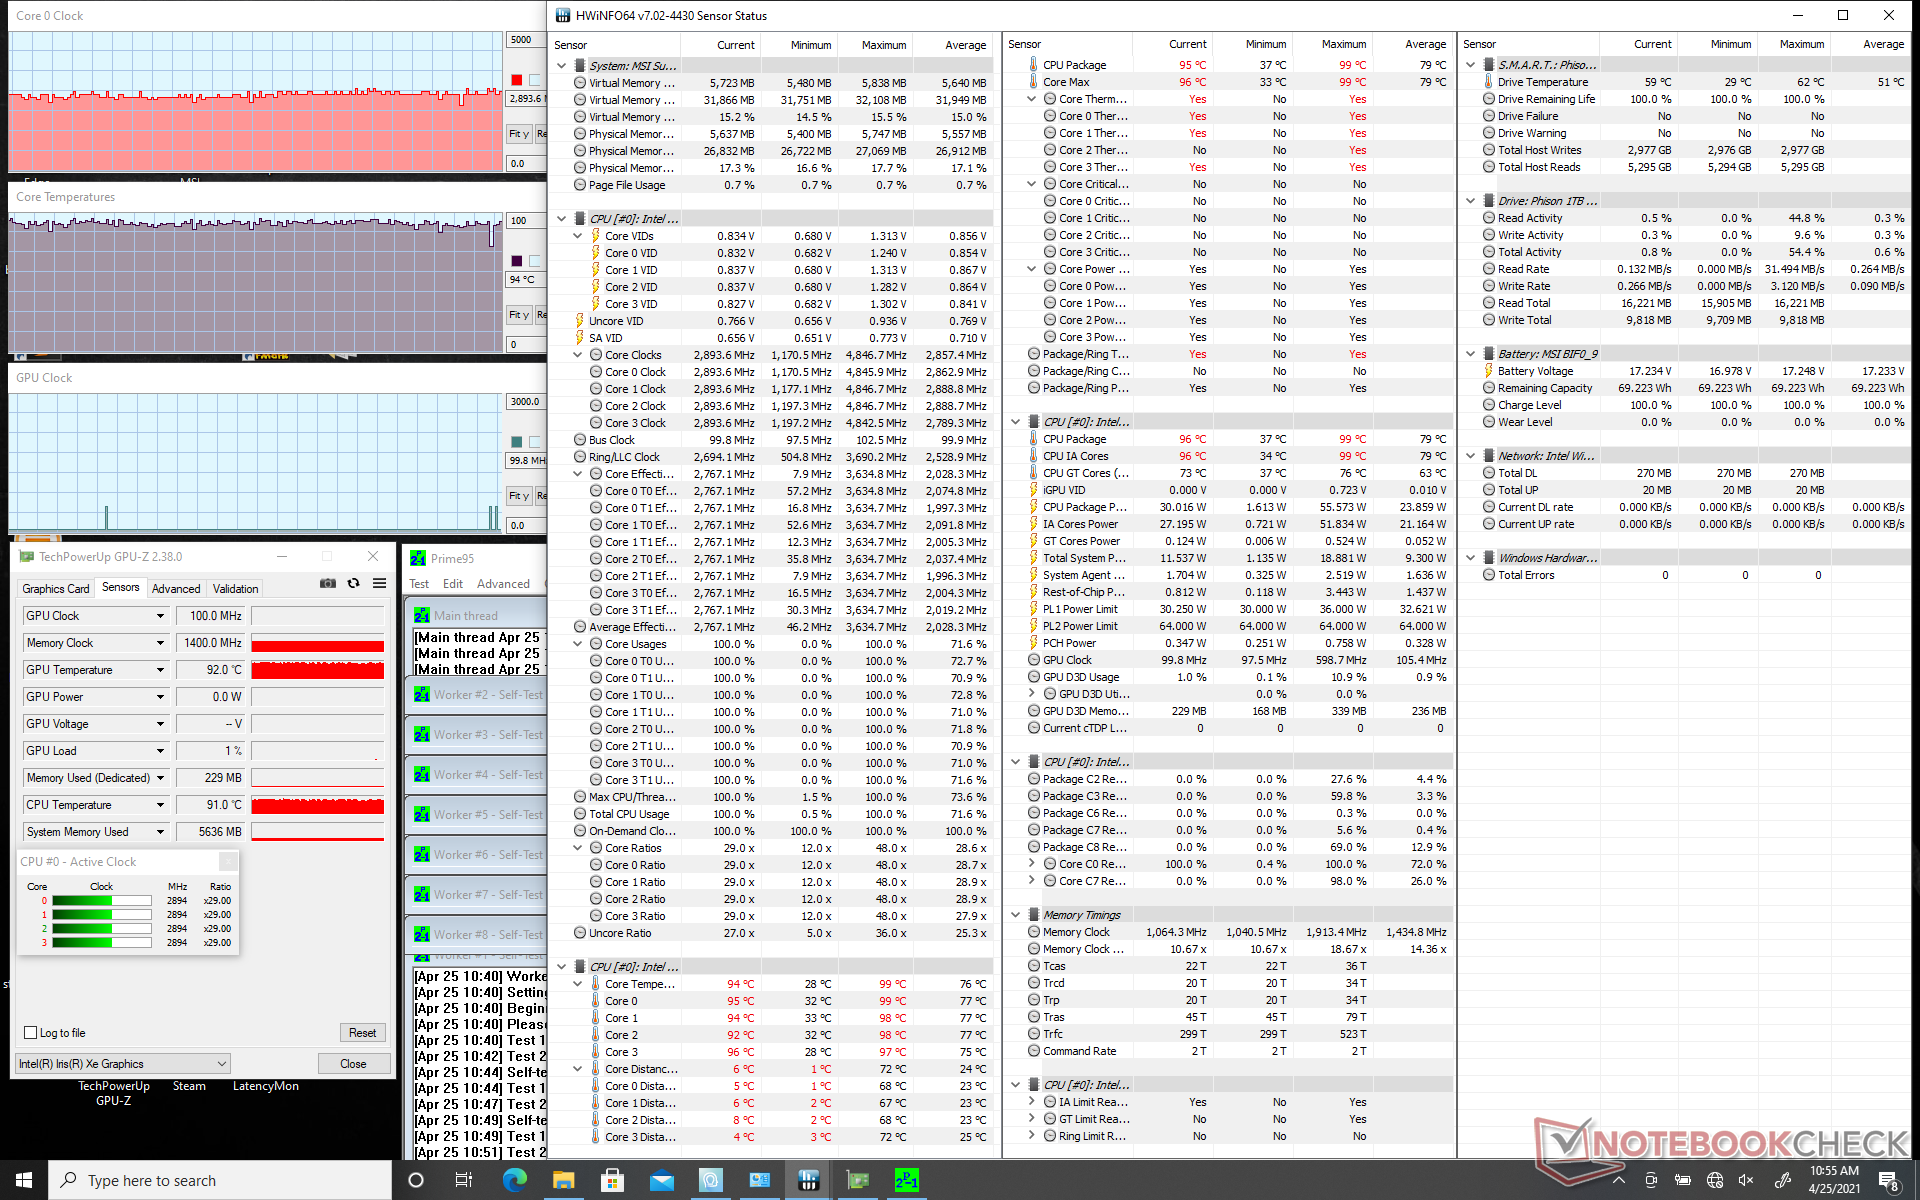
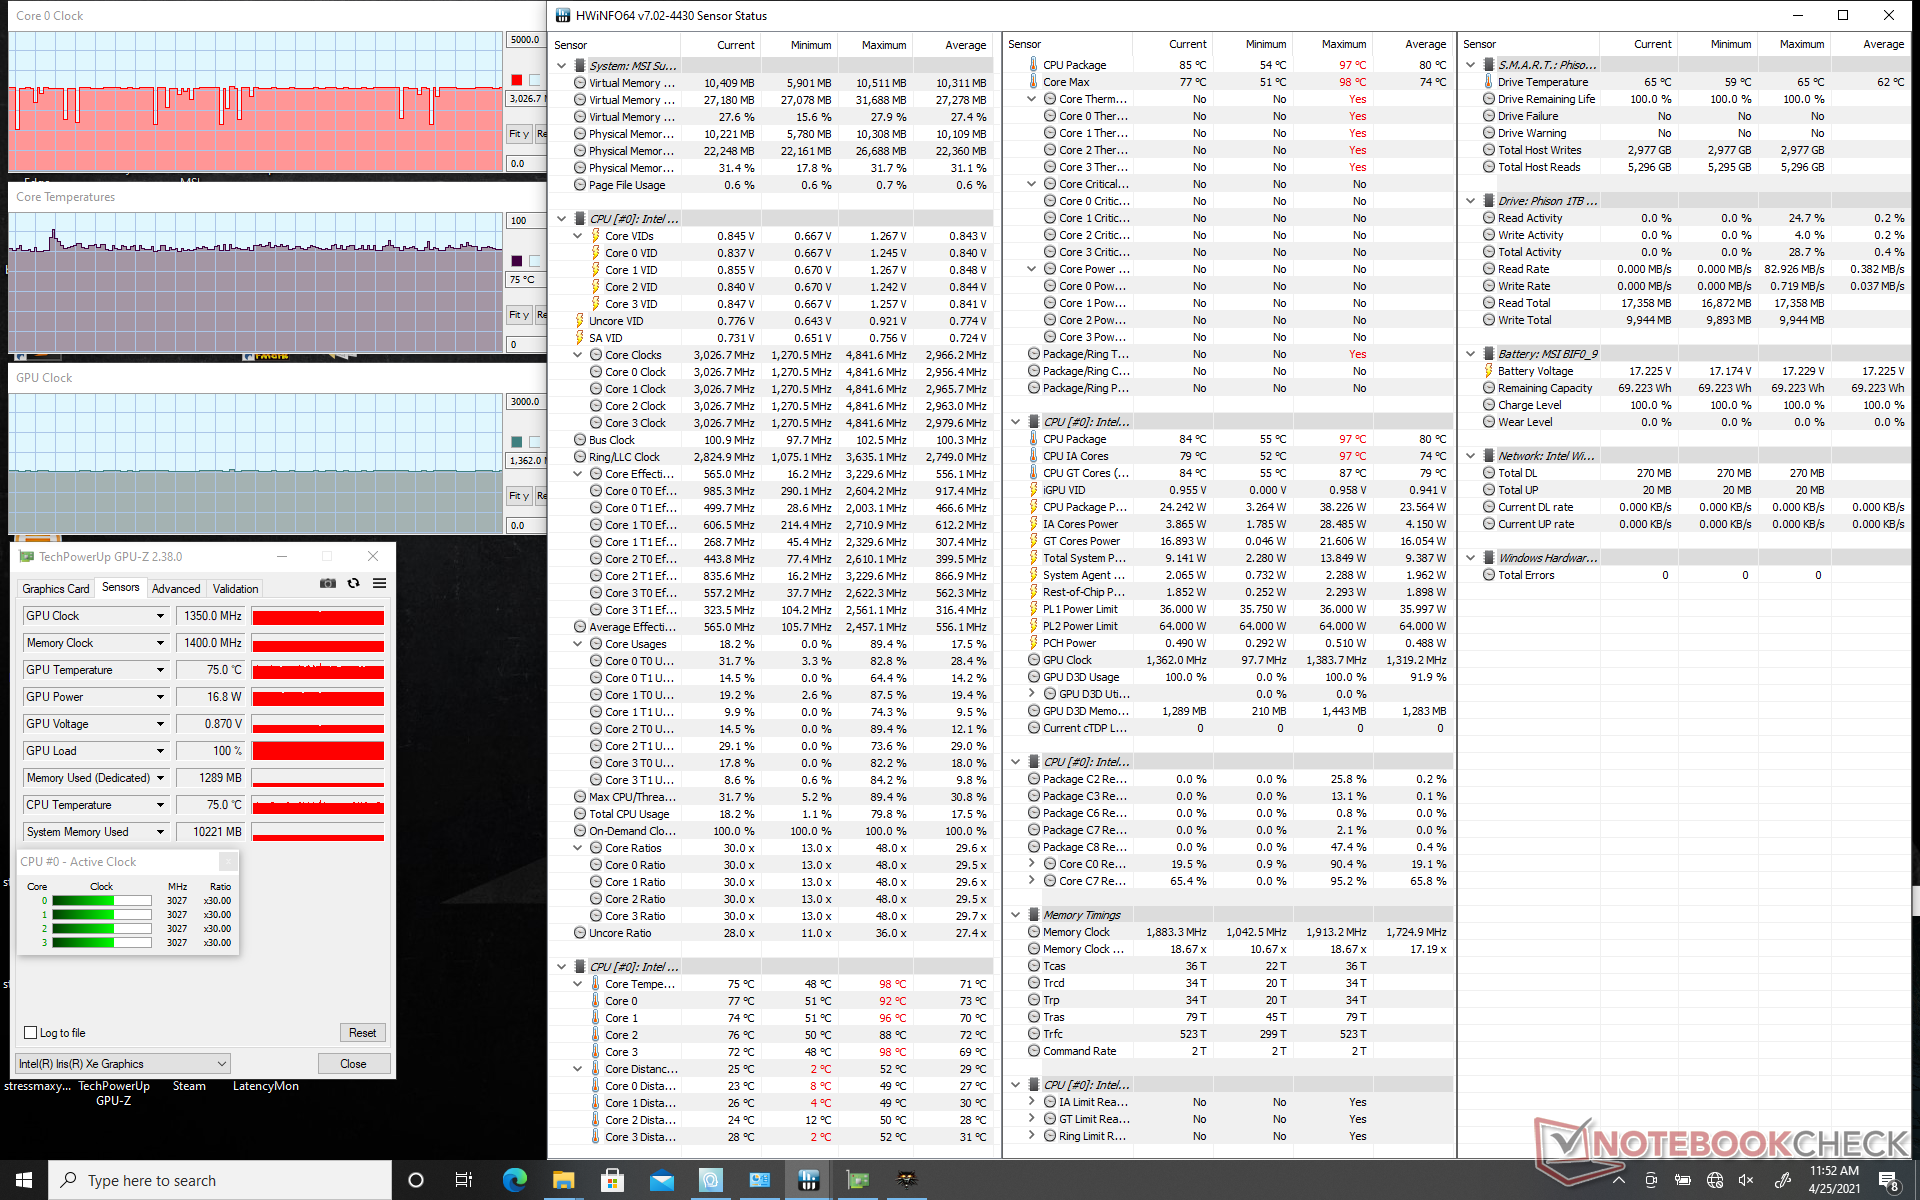
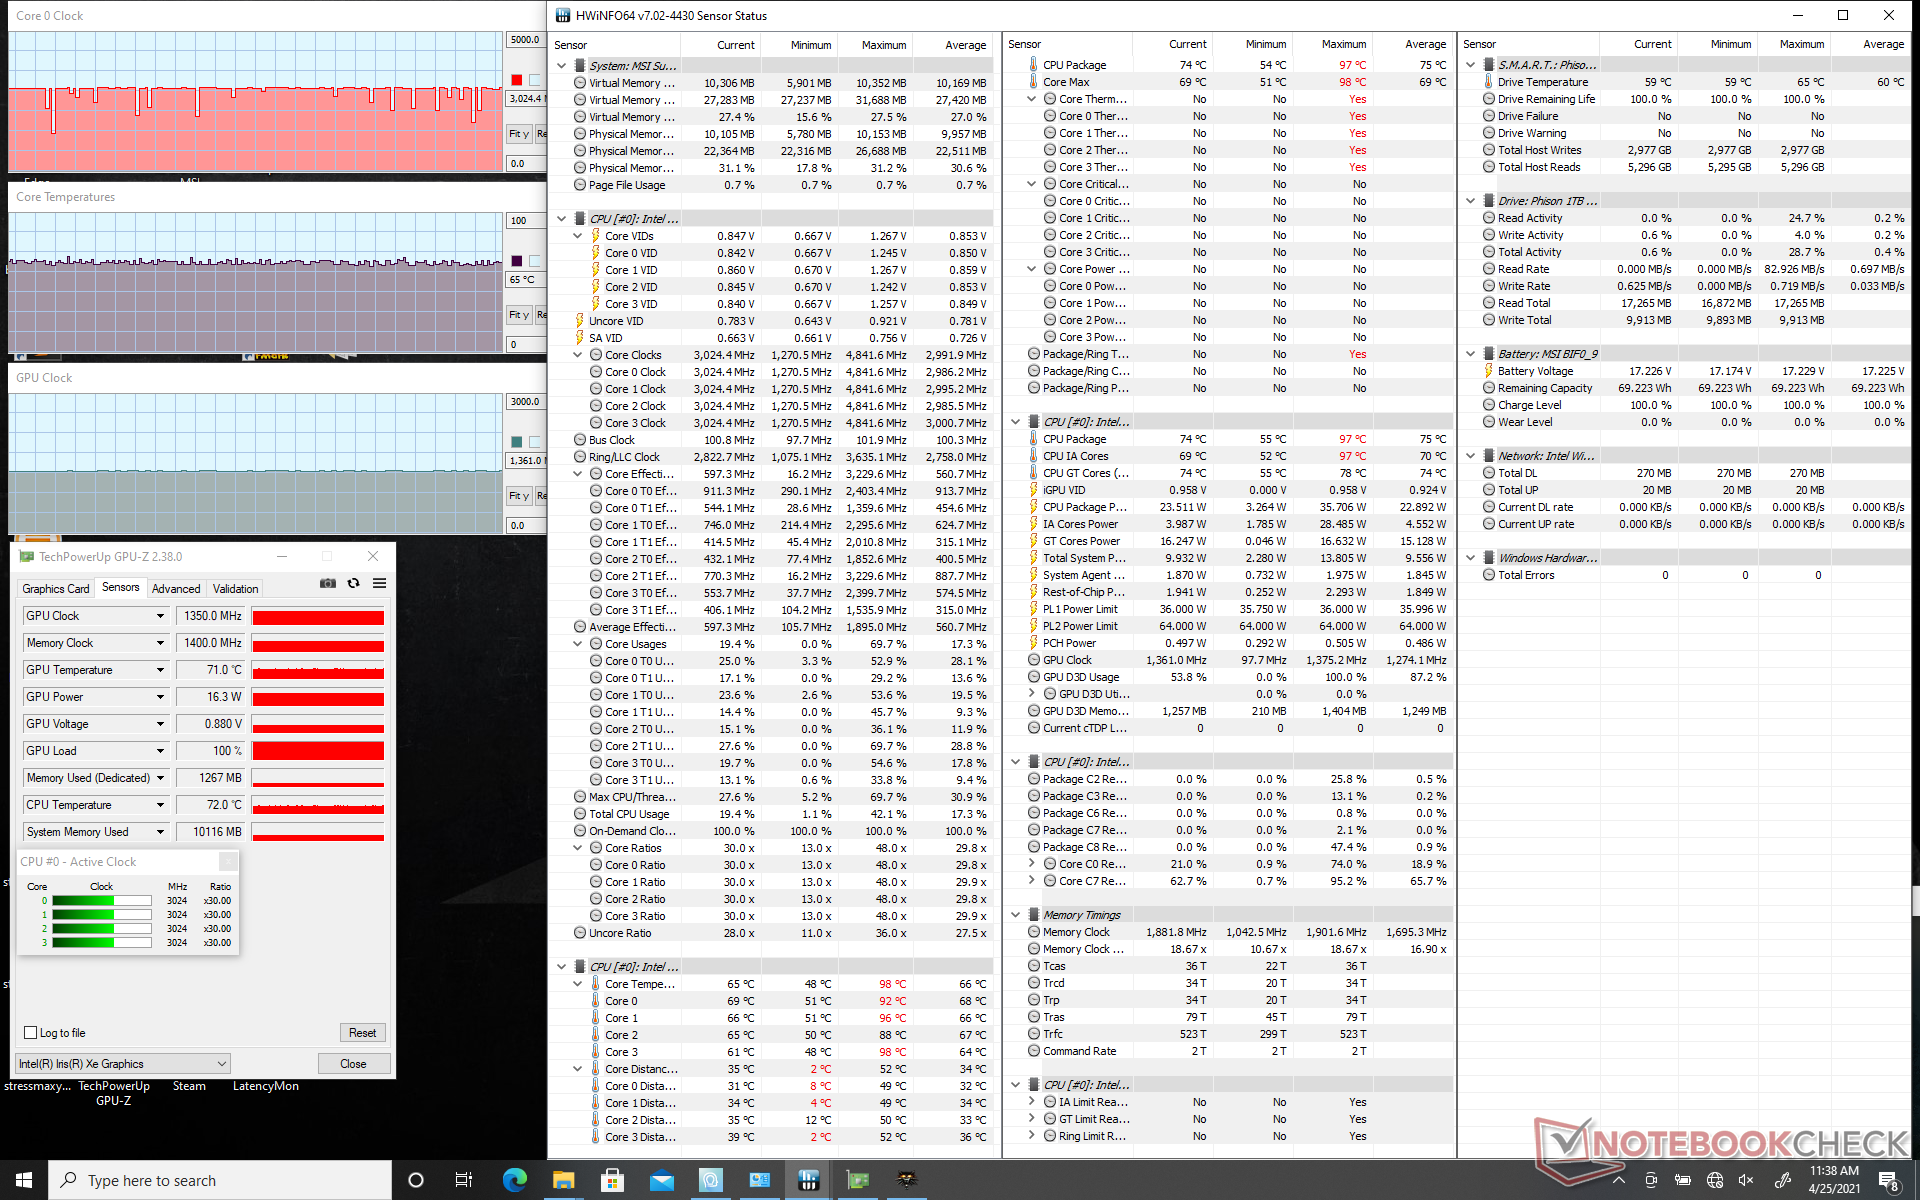
| CPUklok (GHz) GPUklok (MHz) GemiddeldeCPU temperatuur (°C) |
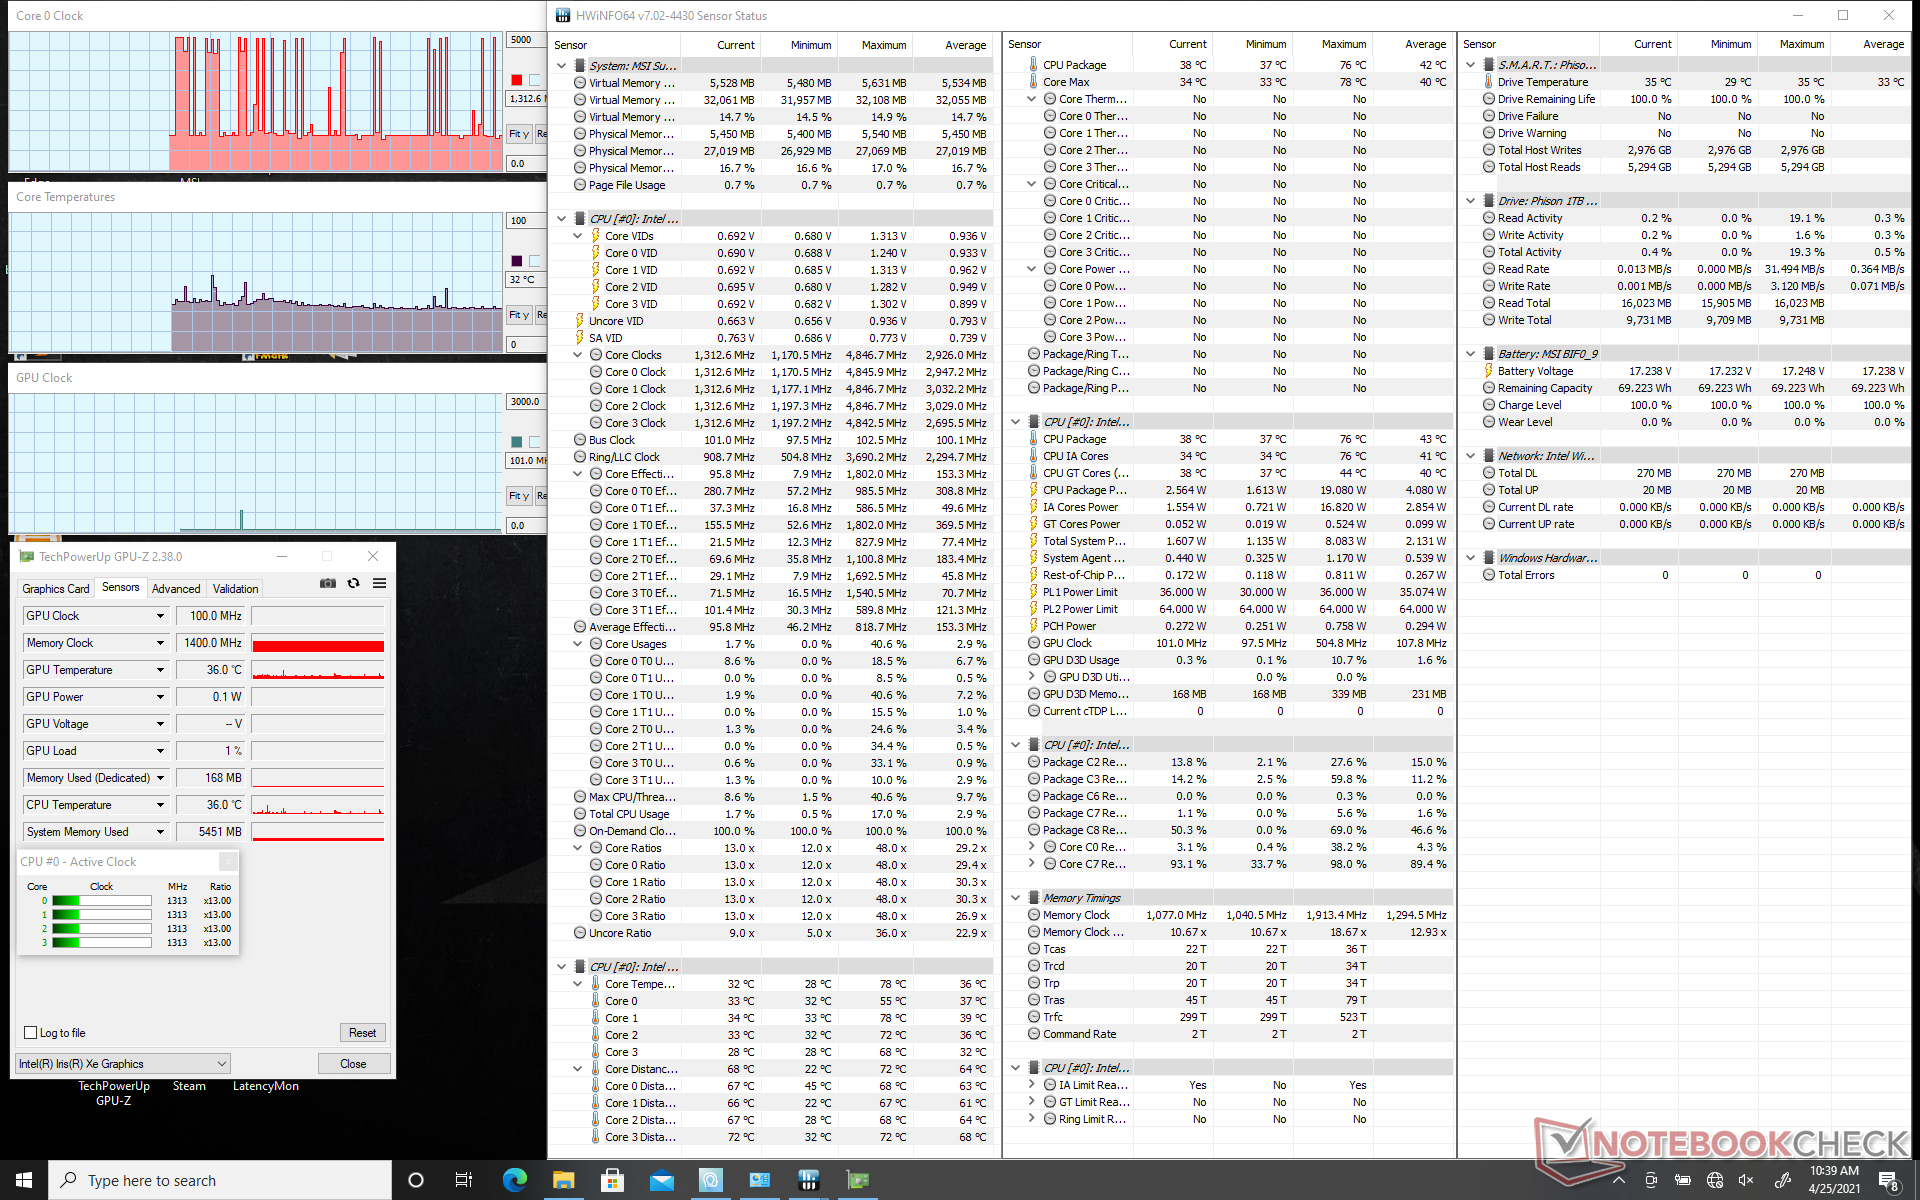
| Systeem in ruststand |
| Prime95 Stress (Cooler Boost uit) |
| Prime95 Stress (Cooler Boost aan) 2.8 - 3.0 |
| Witcher 3 Stress (Cooler Boost uit) |
| Witcher 3 Stress (Cooler Boost aan) |
| Prime95 + FurMark Stress (Cooler Boost aan) 2.3 900 900 94 |
Sprekers


MSI Summit E13 Flip Evo A11MT audioanalyse
(±) | luidspreker luidheid is gemiddeld maar goed (79.6 dB)
Bas 100 - 315 Hz
(±) | verminderde zeebaars - gemiddeld 7.6% lager dan de mediaan
(±) | lineariteit van de lage tonen is gemiddeld (8.8% delta ten opzichte van de vorige frequentie)
Midden 400 - 2000 Hz
(+) | evenwichtige middens - slechts 3% verwijderd van de mediaan
(+) | de middentonen zijn lineair (6.1% delta ten opzichte van de vorige frequentie)
Hoog 2 - 16 kHz
(+) | evenwichtige hoogtepunten - slechts 3.7% verwijderd van de mediaan
(+) | de hoge tonen zijn lineair (5.3% delta naar de vorige frequentie)
Algemeen 100 - 16.000 Hz
(+) | het totale geluid is lineair (12.5% verschil met de mediaan)
Vergeleken met dezelfde klasse
» 14% van alle geteste apparaten in deze klasse waren beter, 3% vergelijkbaar, 83% slechter
» De beste had een delta van 6%, het gemiddelde was 20%, de slechtste was 57%
Vergeleken met alle geteste toestellen
» 11% van alle geteste apparaten waren beter, 2% gelijk, 87% slechter
» De beste had een delta van 4%, het gemiddelde was 24%, de slechtste was 134%
Apple MacBook 12 (Early 2016) 1.1 GHz audioanalyse
(+) | luidsprekers kunnen relatief luid spelen (83.6 dB)
Bas 100 - 315 Hz
(±) | verminderde zeebaars - gemiddeld 11.3% lager dan de mediaan
(±) | lineariteit van de lage tonen is gemiddeld (14.2% delta ten opzichte van de vorige frequentie)
Midden 400 - 2000 Hz
(+) | evenwichtige middens - slechts 2.4% verwijderd van de mediaan
(+) | de middentonen zijn lineair (5.5% delta ten opzichte van de vorige frequentie)
Hoog 2 - 16 kHz
(+) | evenwichtige hoogtepunten - slechts 2% verwijderd van de mediaan
(+) | de hoge tonen zijn lineair (4.5% delta naar de vorige frequentie)
Algemeen 100 - 16.000 Hz
(+) | het totale geluid is lineair (10.2% verschil met de mediaan)
Vergeleken met dezelfde klasse
» 7% van alle geteste apparaten in deze klasse waren beter, 2% vergelijkbaar, 91% slechter
» De beste had een delta van 5%, het gemiddelde was 18%, de slechtste was 53%
Vergeleken met alle geteste toestellen
» 5% van alle geteste apparaten waren beter, 1% gelijk, 94% slechter
» De beste had een delta van 4%, het gemiddelde was 24%, de slechtste was 134%
Energy Management
Stroomverbruik
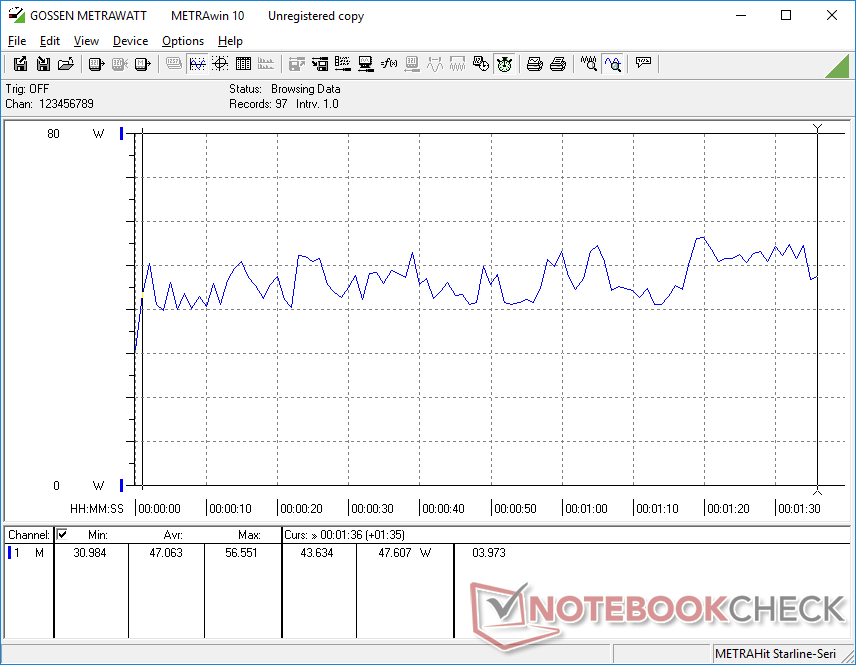
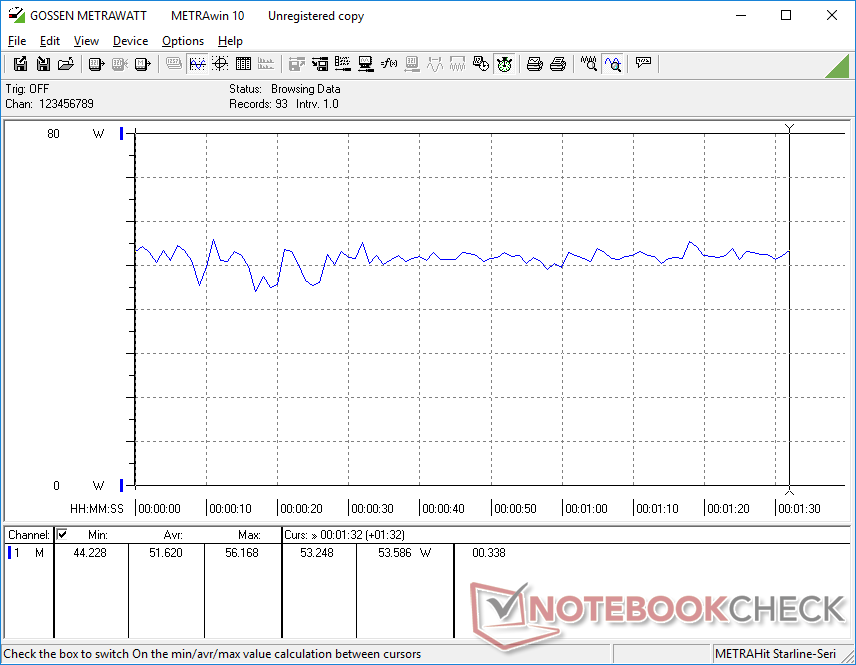
Ons MSI-systeem verbruikt meer stroom dan de XPS 13, Spectre x360 14 en MateBook X Pro, hoewel de laatste twee zijn uitgerust met dezelfde 11e generatie CPU en Iris Xe GPU. Het draaien van Witcher 3zou bijvoorbeeld 52 W verbruiken op de MSI, vergeleken met 32 W tot 43 W op de eerder genoemde alternatieven. De resultaten zijn misschien niet onverwacht aangezien de MSI ze allemaal overtreft in zowel CPU als GPU benchmarks om de krachtigste van het stel te zijn
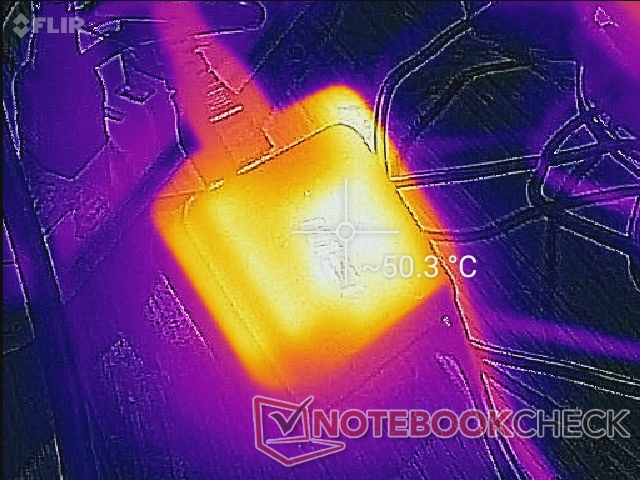
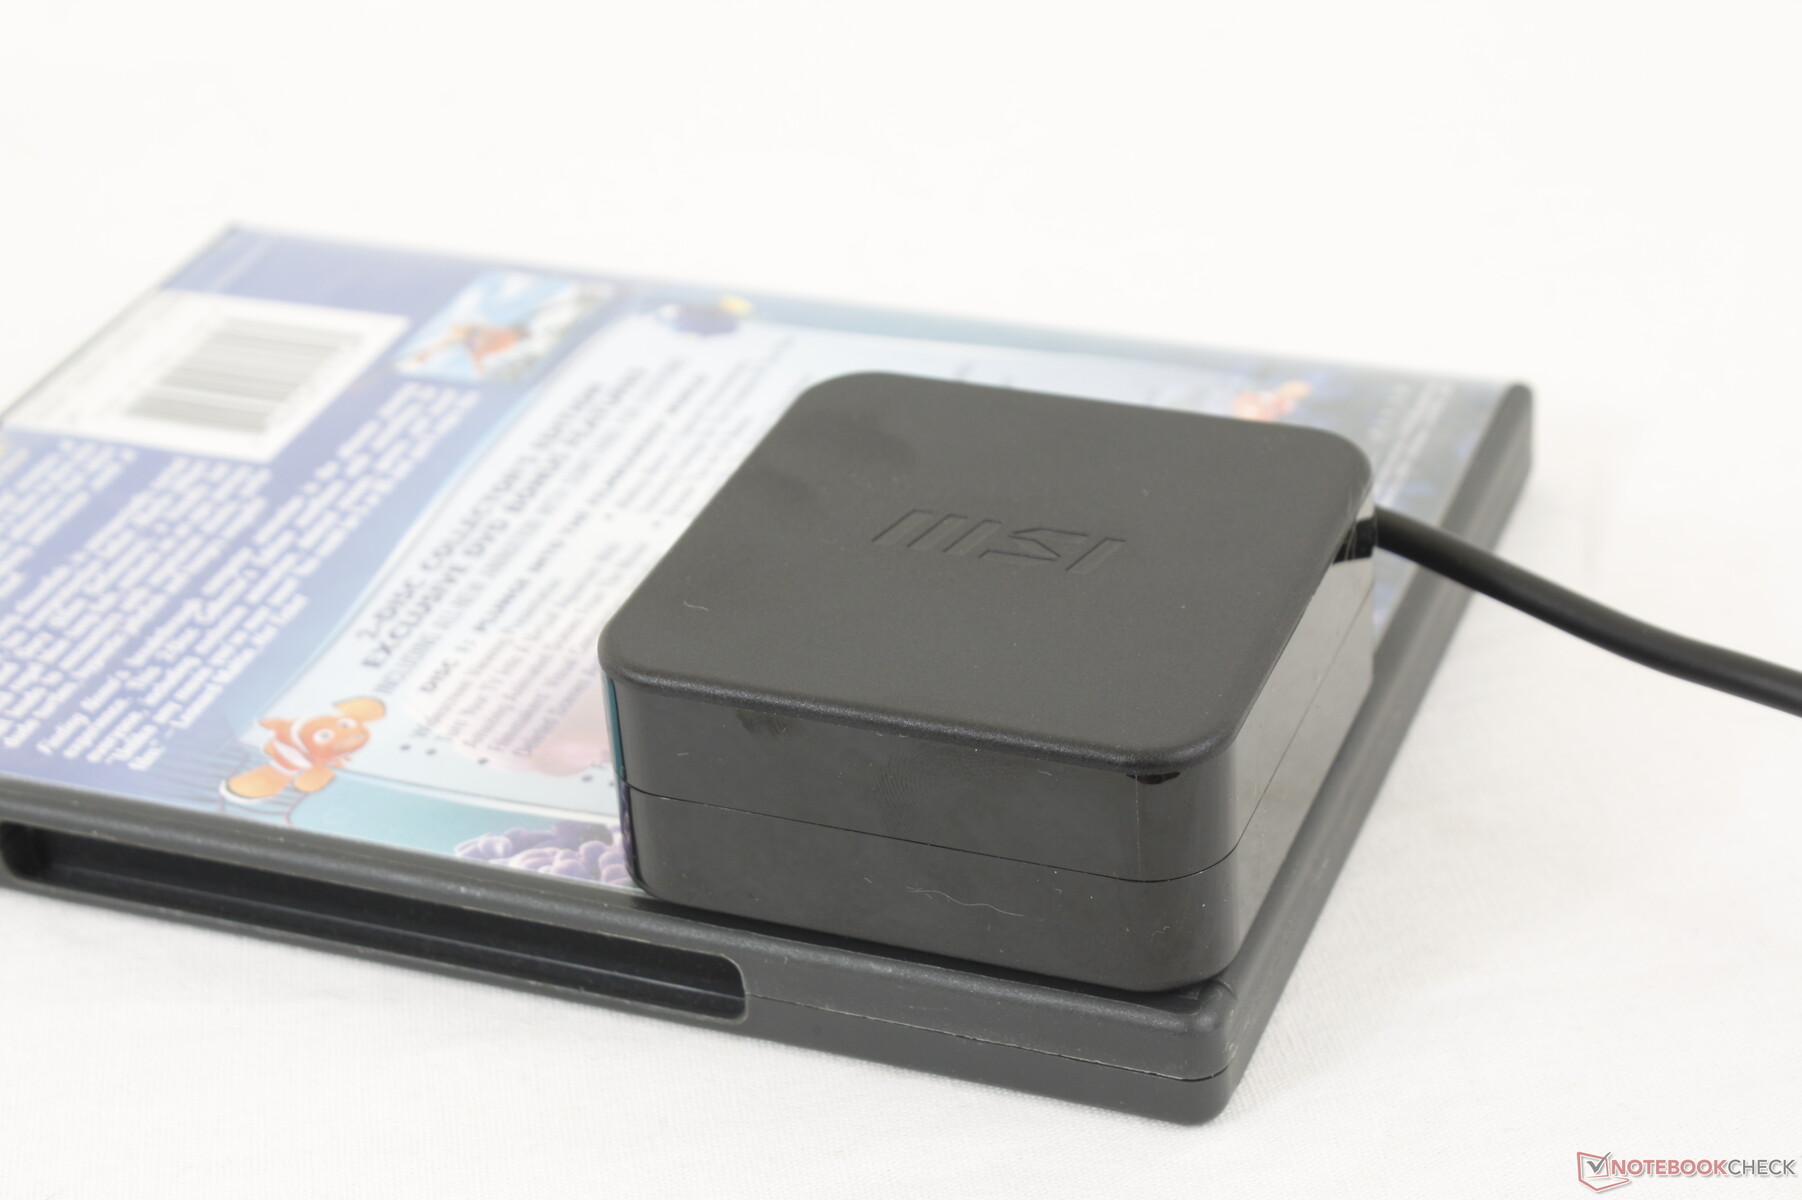
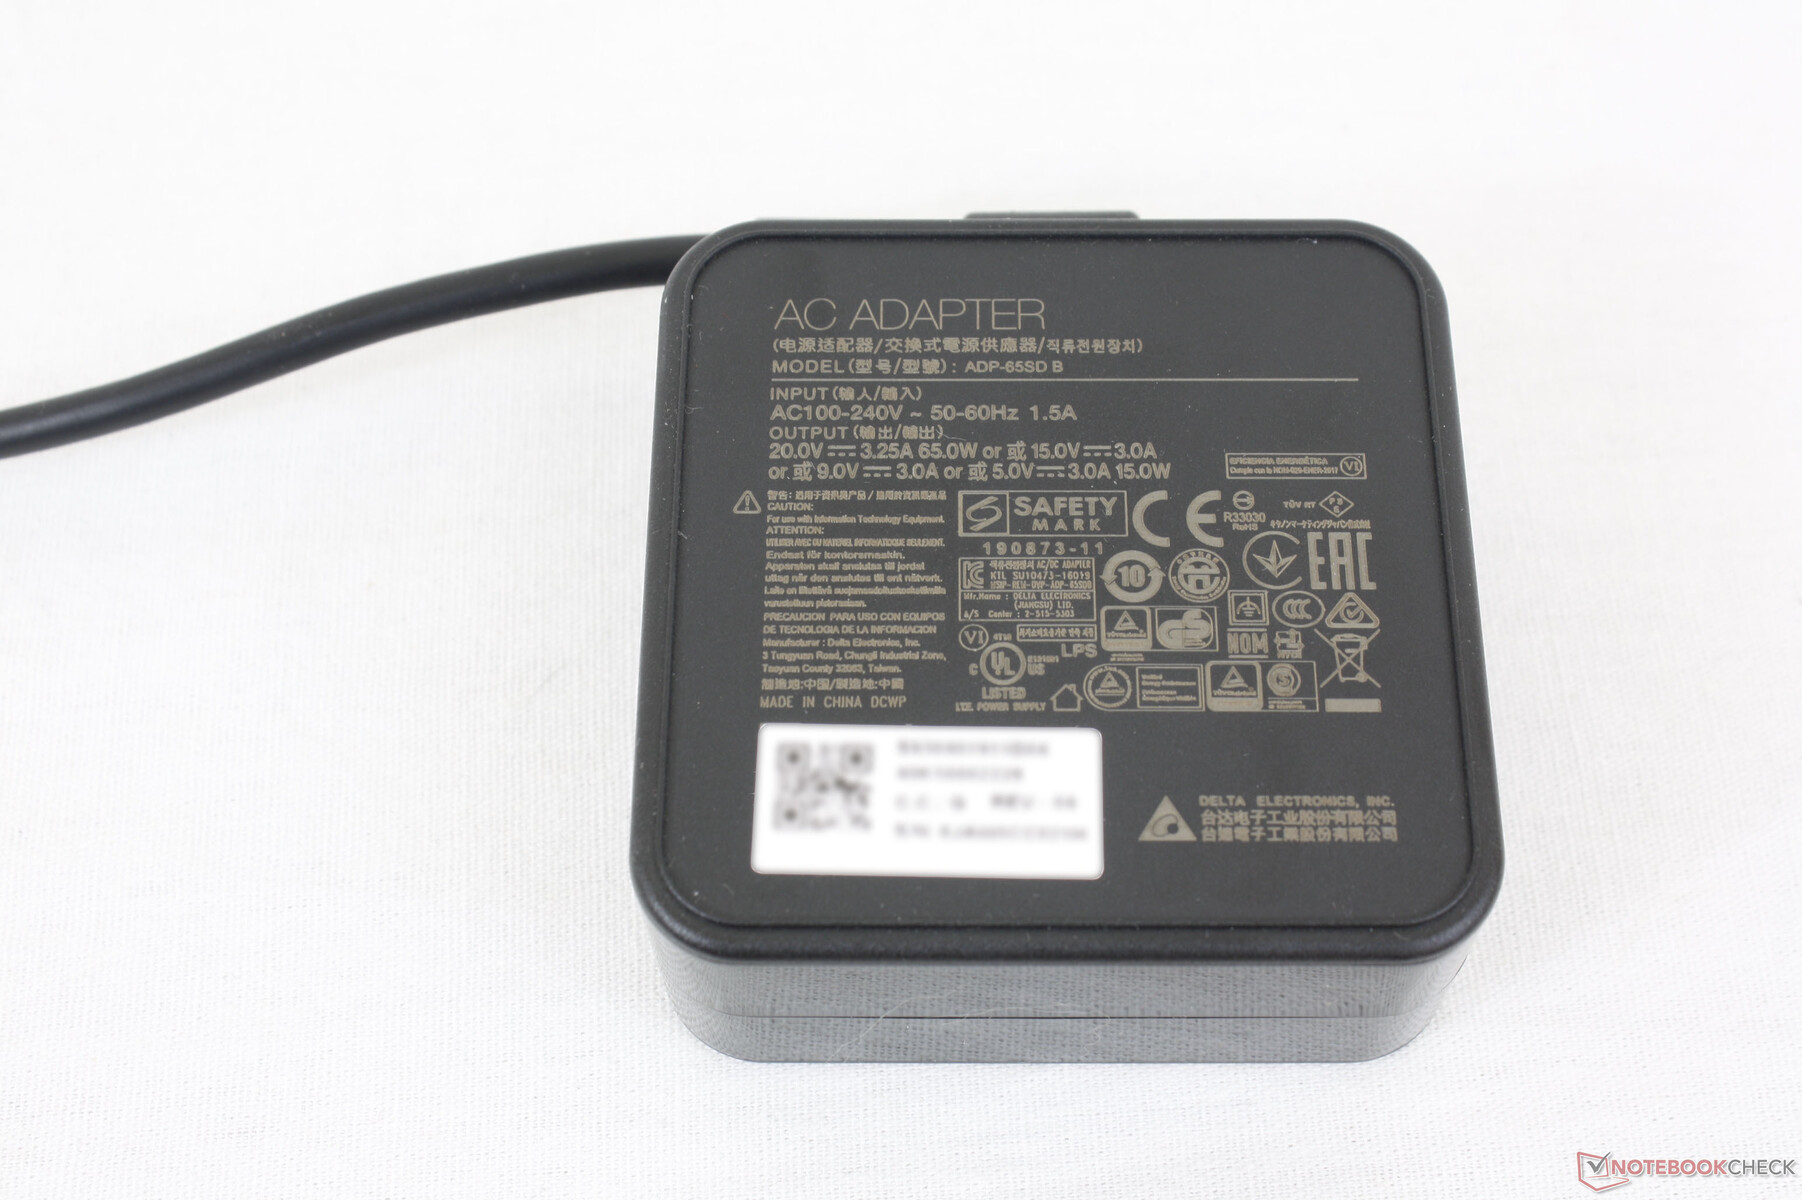
We zijn in staat om een maximale trek van 65,9 W te meten van de kleine (~6,5 x 6,5 x 2,8 cm) AC adapter bij het draaien van Prime95. Dit maximum duurt slechts enkele seconden, zoals blijkt uit de onderstaande grafieken, aangezien maximale Turbo Boost niet duurzaam is over lange perioden.
| Uit / Standby | |
| Inactief | |
| Belasting |
|
Key:
min: | |
| MSI Summit E13 Flip Evo A11MT i7-1185G7, Iris Xe G7 96EUs, Phison 1TB SM2801T24GKBB4S-E162, IPS, 1920x1200, 13.4" | Dell XPS 13 7390 2-in-1 Core i7 i7-1065G7, Iris Plus Graphics G7 (Ice Lake 64 EU), Toshiba BG4 KBG40ZPZ512G, IPS, 1920x1200, 13.4" | HP Spectre x360 14t-ea000 i7-1165G7, Iris Xe G7 96EUs, Samsung SSD PM981a MZVLB512HBJQ, IPS, 1920x1280, 13.5" | Huawei MateBook X Pro 2021 i7-1165G7, Iris Xe G7 96EUs, Samsung PM981a MZVLB1T0HBLR, IPS, 3000x2000, 13.9" | Lenovo ThinkPad X1 Titanium Yoga G1 20QA001RGE i7-1160G7, Iris Xe G7 96EUs, Toshiba BG4 KBG40ZNT512G, IPS, 2256x1504, 13.5" | Asus Zenbook 14 UX435EG i7-1165G7, GeForce MX450, Samsung PM981a MZVLB1T0HBLR, IPS, 1920x1080, 14" | |
|---|---|---|---|---|---|---|
| Power Consumption | 25% | 26% | -4% | 19% | 0% | |
| Idle Minimum * (Watt) | 4.8 | 2.6 46% | 3 37% | 6.7 -40% | 3.9 19% | 3.4 29% |
| Idle Average * (Watt) | 8.4 | 5.3 37% | 5.1 39% | 10 -19% | 7.3 13% | 7.6 10% |
| Idle Maximum * (Watt) | 8.6 | 7 19% | 6.4 26% | 10.3 -20% | 10.3 -20% | 14.2 -65% |
| Load Average * (Watt) | 47.1 | 43.1 8% | 39.6 16% | 35.7 24% | 30.6 35% | 56 -19% |
| Witcher 3 ultra * (Watt) | 51.6 | 43.1 16% | 39.6 23% | 32.7 37% | 25.5 51% | 41 21% |
| Load Maximum * (Watt) | 65.9 | 49 26% | 56.2 15% | 67.6 -3% | 57.1 13% | 50.4 24% |
* ... kleiner is beter
Levensduur batterij
De relatief grote batterij van 70 Wh biedt bijna 11,5 uur WLAN-gebruik in de echte wereld. Het opladen van leeg naar vol duurt ongeveer 1,5 tot 2 uur met de meegeleverde USB-C AC-adapter. We ondervonden in het begin wat laadafwijkingen, maar dit ging op mysterieuze wijze weg na de batterij een paar keer volledig te hebben ontladen en opgeladen.
| MSI Summit E13 Flip Evo A11MT i7-1185G7, Iris Xe G7 96EUs, 70 Wh | Dell XPS 13 7390 2-in-1 Core i7 i7-1065G7, Iris Plus Graphics G7 (Ice Lake 64 EU), 51 Wh | HP Spectre x360 14t-ea000 i7-1165G7, Iris Xe G7 96EUs, 66 Wh | Huawei MateBook X Pro 2021 i7-1165G7, Iris Xe G7 96EUs, 56 Wh | Lenovo ThinkPad X1 Titanium Yoga G1 20QA001RGE i7-1160G7, Iris Xe G7 96EUs, 44.5 Wh | Asus Zenbook 14 UX435EG i7-1165G7, GeForce MX450, 63 Wh | |
|---|---|---|---|---|---|---|
| Batterijduur | -20% | 37% | 18% | -10% | -23% | |
| Reader / Idle (h) | 21.1 | 36.4 73% | 19.5 -8% | 18.5 -12% | ||
| WiFi v1.3 (h) | 11.2 | 9 -20% | 11.8 5% | 10.5 -6% | 8.4 -25% | 8.5 -24% |
| Load (h) | 1.8 | 2.4 33% | 3 67% | 1.9 6% | 1.2 -33% |
Pro
Contra
Uitspraak

MSI wil bewijzen dat het meer kan dan alleen gaming laptops en de Summit E13 Flip is een goed voorbeeld van waar de fabrikant toe in staat is, vooral op het gebied van esthetiek en prestaties. Normaal gesproken voor subnotebooks of convertibles zijn TDP en prestaties vaak onder het gemiddelde omdat makers willen voldoen aan slankere ontwerpen en lagere gewicht doelen. De Summit slaagt erin om anderen in zijn grootteklasse en categorie te overtreffen, terwijl hij er toch slank en draagbaar uitziet. Als u een convertible wilt die niet significant gas geeft bij belasting, dan is deze MSI een van de betere opties die u kunt vinden.
De Summit E13 Flip heeft de prestaties om zijn aantrekkelijke ontwerp te ondersteunen. Er is echter nog ruimte voor verbetering met betrekking tot de beeldscherm ghosting en de gemiddelde stijfheid van de 360-graden scharnieren.
De nadelen zijn over het algemeen klein, maar ze tellen wel vrij snel op. De scharnieren, bijvoorbeeld, zouden stijver kunnen zijn en de HP Spectre x360 14 voelt nog steeds aan als het sterker gebouwde chassis. Ghosting is merkbaar ondanks de boterzachte 120 Hz verversingssnelheid, terwijl de kleine pijltjestoetsen, Ctrl-toets, en smartphone-stijl MicroSD-lade zijn allemaal onhandig te gebruiken. De totale voetafdruk en het gewicht zijn ook iets groter en zwaarder, respectievelijk, dan de XPS 13 2-in-1 of de eerder genoemde Spectre en zowel de kerntemperaturen als het ventilatorgeluid zijn ook hoger. Dus, hoewel het MSI systeem zeker sneller is en langer meegaat, is de winst niet gratis.
Prijs en beschikbaarheid
Onze exacte configuratie wordt nu verscheept bij Xotic PC voor $1900 USD. Een alternatieve SKU met half zoveel RAM en opslagruimte is ook verkrijgbaar voor $1600 USD. Het systeem is ook op grote schaal verkrijgbaar bij andere grote retailers voor ongeveer dezelfde prijsklasse van $1600 tot $1900 USD van Walmart, Newegg, Best Buyen Amazon
MSI Summit E13 Flip Evo A11MT
- 28-04-2021 v7 (old)
Allen Ngo
Price comparison

