MSI GP66 Leopard 10UG Laptop Review: Een complete serie revisie
Eerder dit jaar onthuld op de GP66, die eerder dit jaar samen met de mobiele Nvidia Ampere-serie werd onthuld, introduceert een geheel nieuw ontwerp ten opzichte van de oudere GP65. Bijna alles is veranderd, van het toetsenbord tot de koeloplossing, om het begin van een nieuwe generatie voor de GP-familie te vertegenwoordigen. Voor degenen die niet bekend zijn, de GP-serie is de thuisbasis van MSI's mid-range gaming laptops boven de goedkopere GL en GF series en onder de prijzigere GE en GT series.
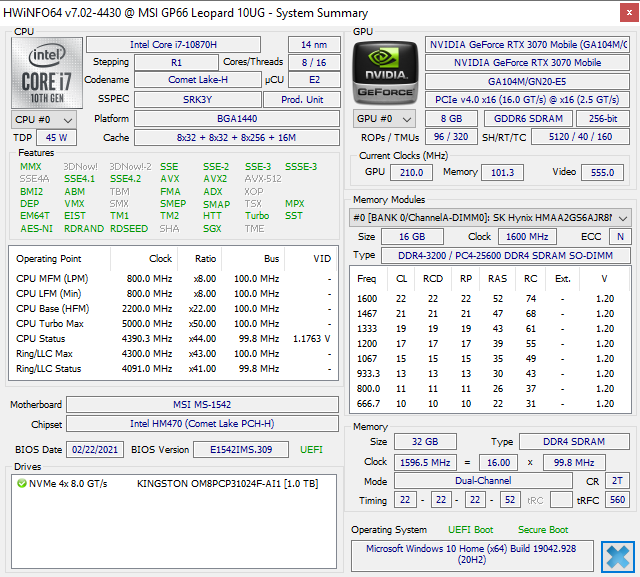
SKU's variëren van een Intel 10th gen Core-i7 10870H CPU met GeForce RTX 3060 graphics tot de Core i7-10875H met RTX 3080. Onze review configuratie is een midden configuratie met de i7-10870H en RTX 3070 voor rond de $2500 USD afhankelijk van het RAM en opslag.
Concurrerende modellen zijn andere 15.6-inch gaming laptops uit het hogere middensegment, zoals de Gigabyte Aorus 15P, Asus ROG Zephyrus G15, of Lenovo Legion 7.
Meer MSI reviews:
potential competitors in comparison
Evaluatie | Datum | Model | Gewicht | Hoogte | Formaat | Resolutie | Beste prijs |
|---|---|---|---|---|---|---|---|
| 84.2 % v7 (old) | 04-2021 | MSI GP66 Leopard 10UG i7-10870H, GeForce RTX 3070 Laptop GPU | 2.3 kg | 23.4 mm | 15.60" | 1920x1080 | |
| 83.2 % v7 (old) | 06-2020 | MSI GP65 10SFK-047US i7-10750H, GeForce RTX 2070 Mobile | 2.3 kg | 27.5 mm | 15.60" | 1920x1080 | |
| 85.4 % v7 (old) | 04-2021 | Alienware m15 R4 i9-10980HK, GeForce RTX 3070 Laptop GPU | 2.3 kg | 20 mm | 15.60" | 1920x1080 | |
| 86.1 % v7 (old) | 02-2021 | Aorus 15P XC i7-10870H, GeForce RTX 3070 Laptop GPU | 2.2 kg | 27 mm | 15.60" | 1920x1080 | |
| 83.8 % v7 (old) | 02-2021 | Asus ROG Zephyrus G15 GA503Q R9 5900HS, GeForce RTX 3080 Laptop GPU | 2 kg | 20 mm | 15.60" | 2560x1440 | |
| 80.4 % v7 (old) | 03-2021 | MSI GF65 Thin 10UE i7-10750H, GeForce RTX 3060 Laptop GPU | 1.9 kg | 21.7 mm | 15.60" | 1920x1080 |
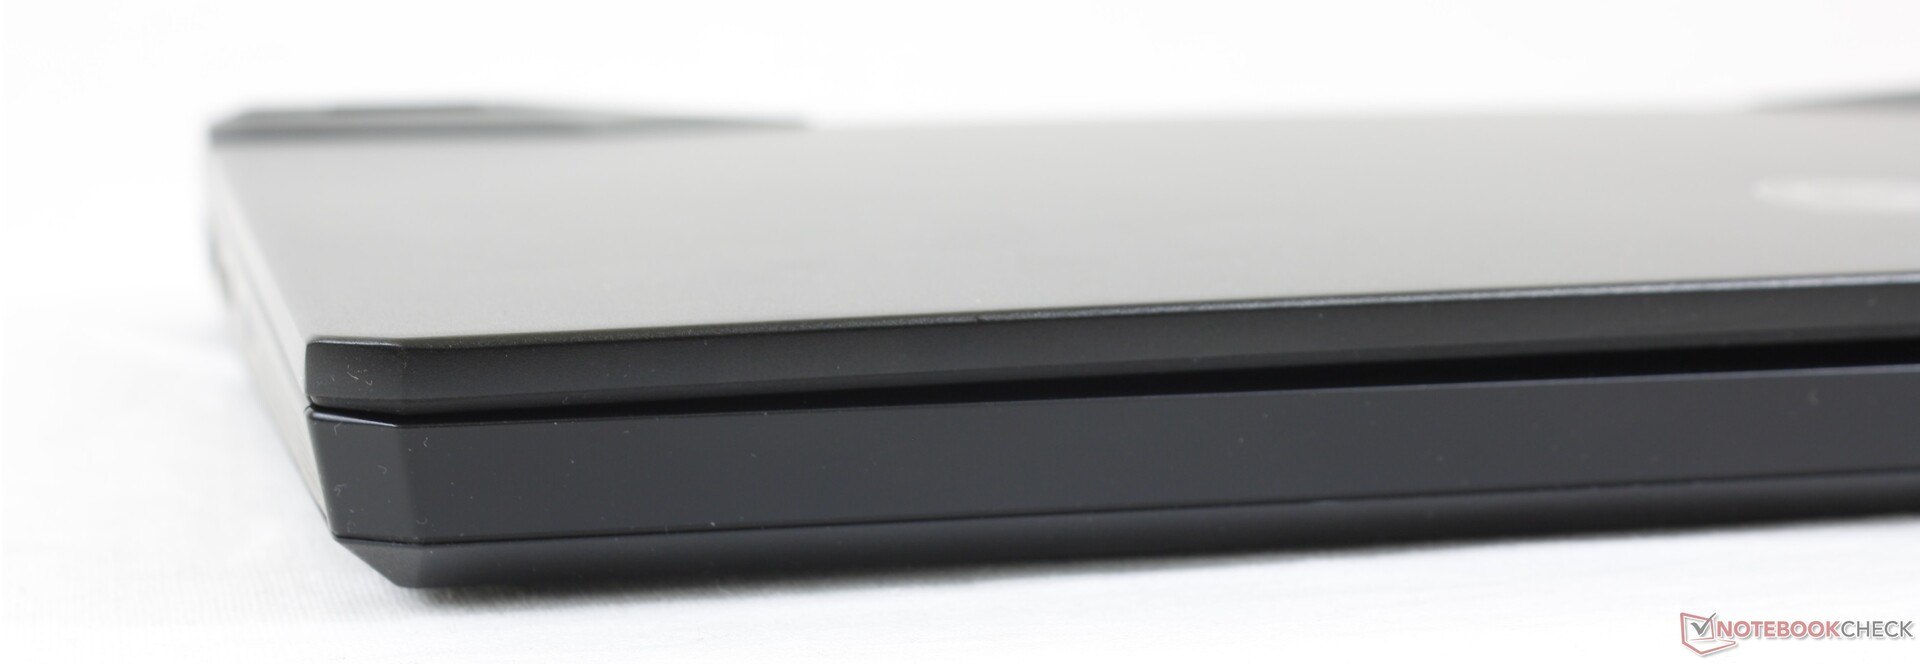
Zaak
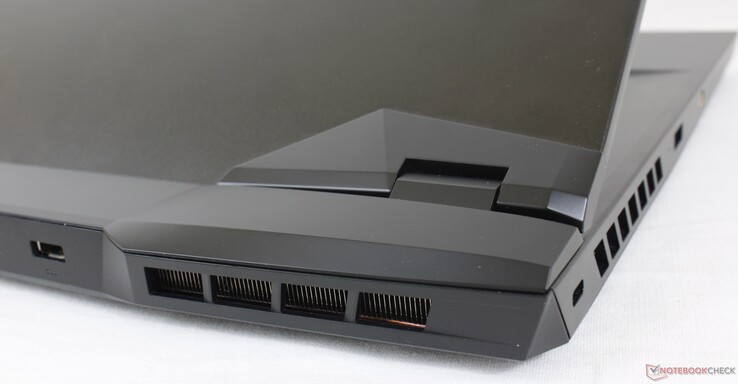
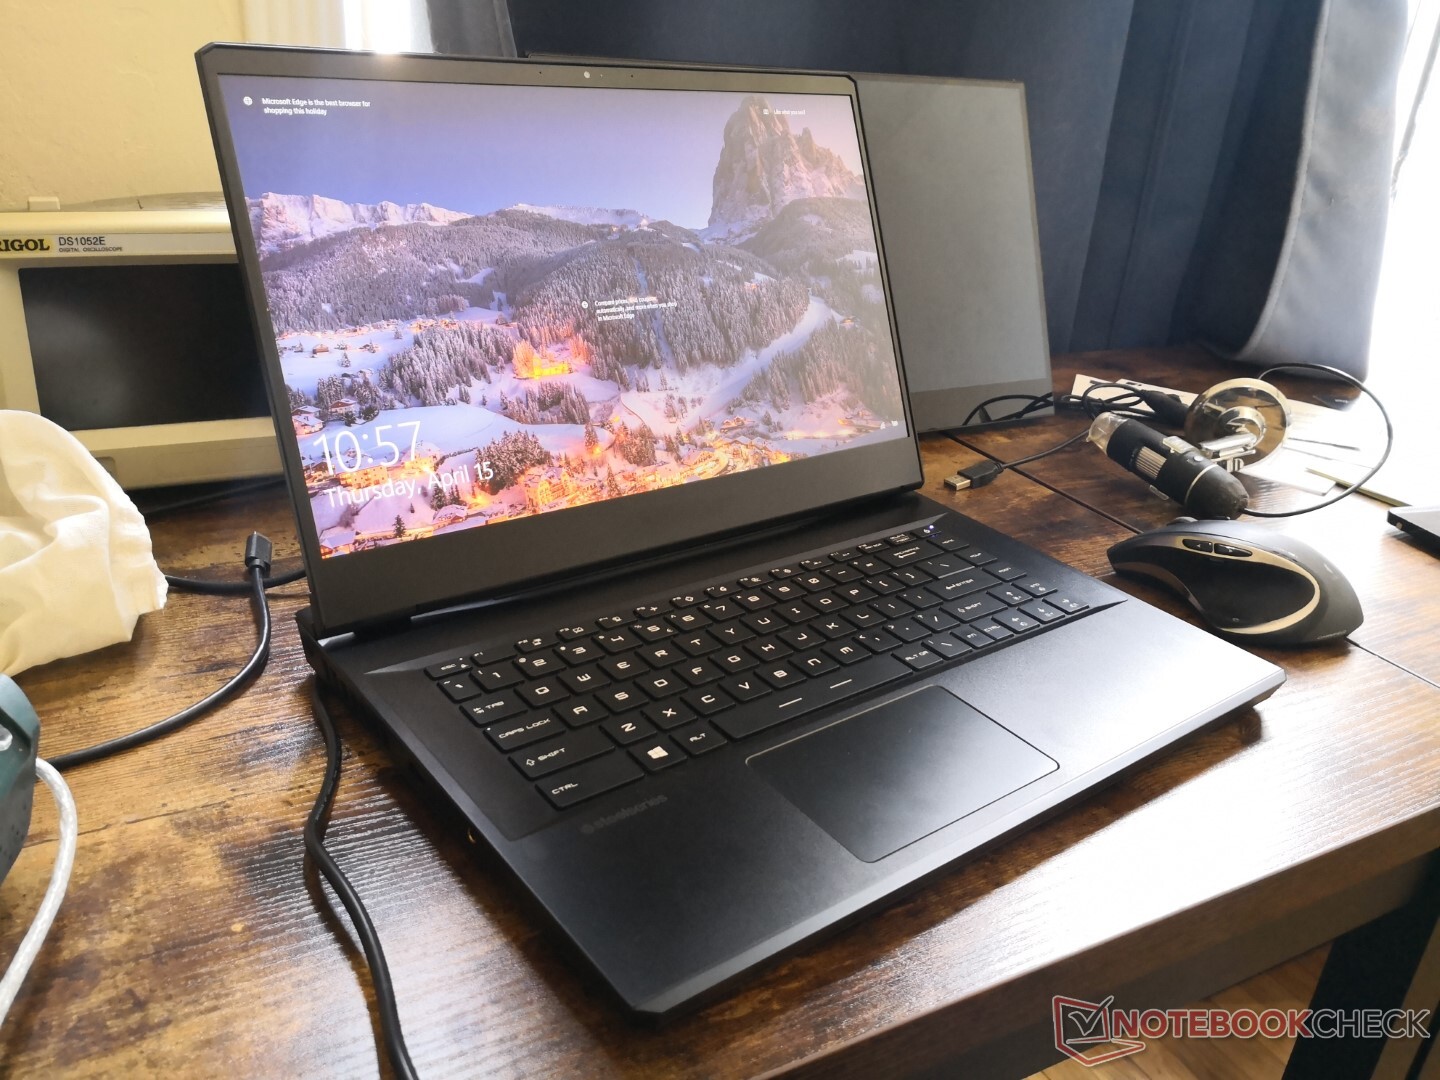
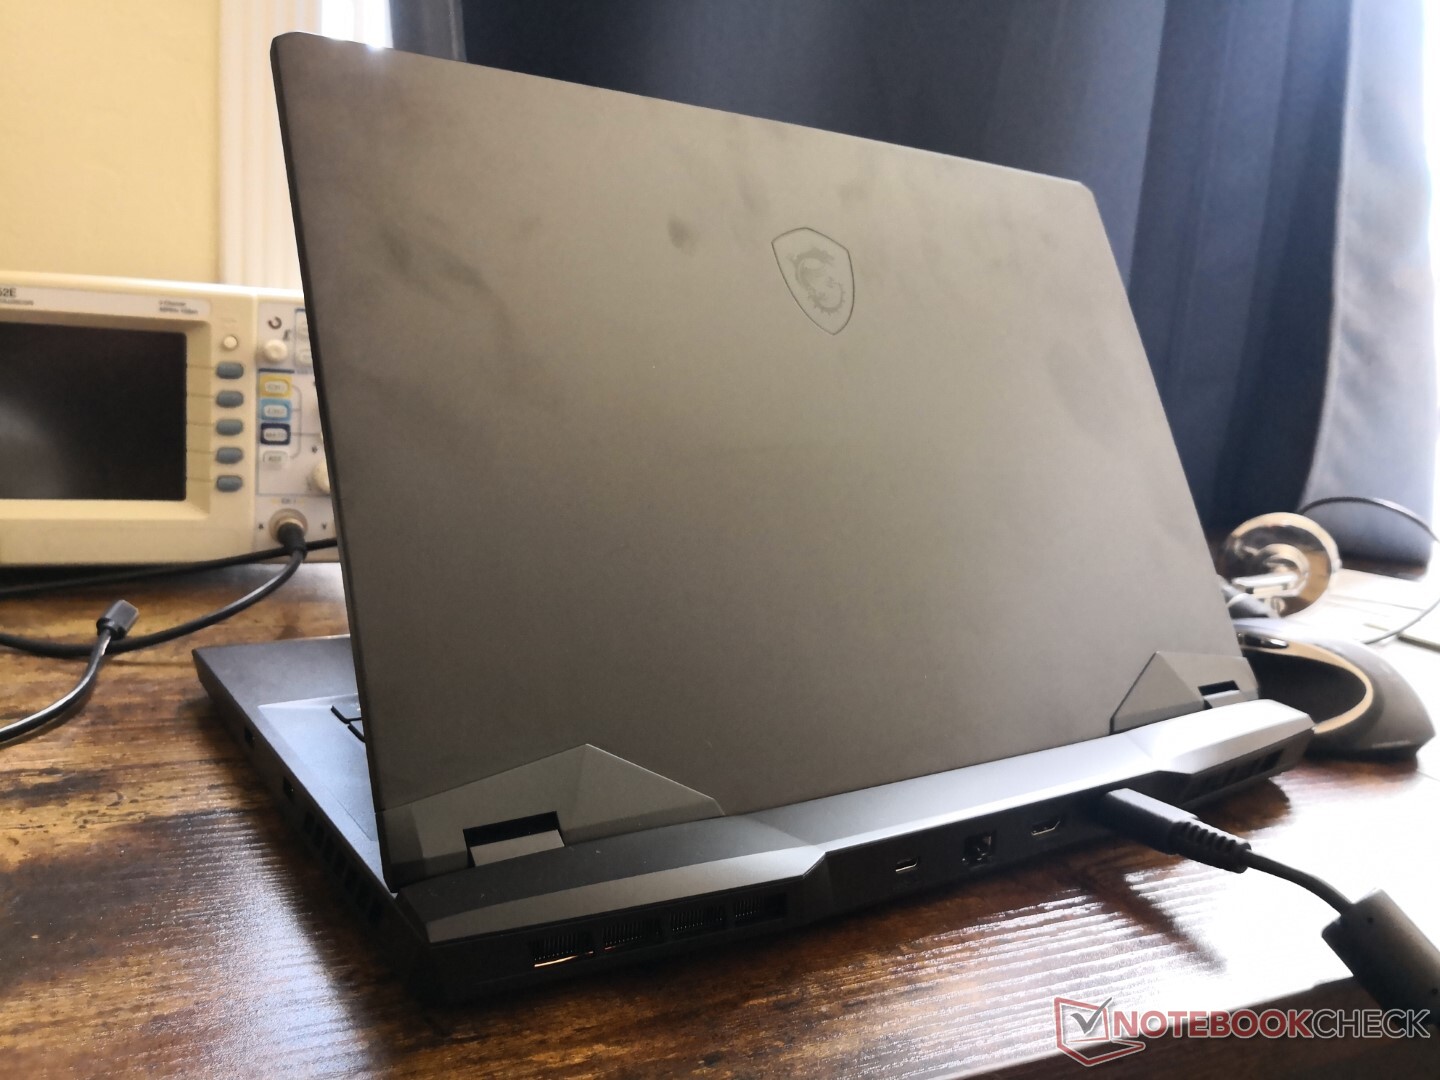
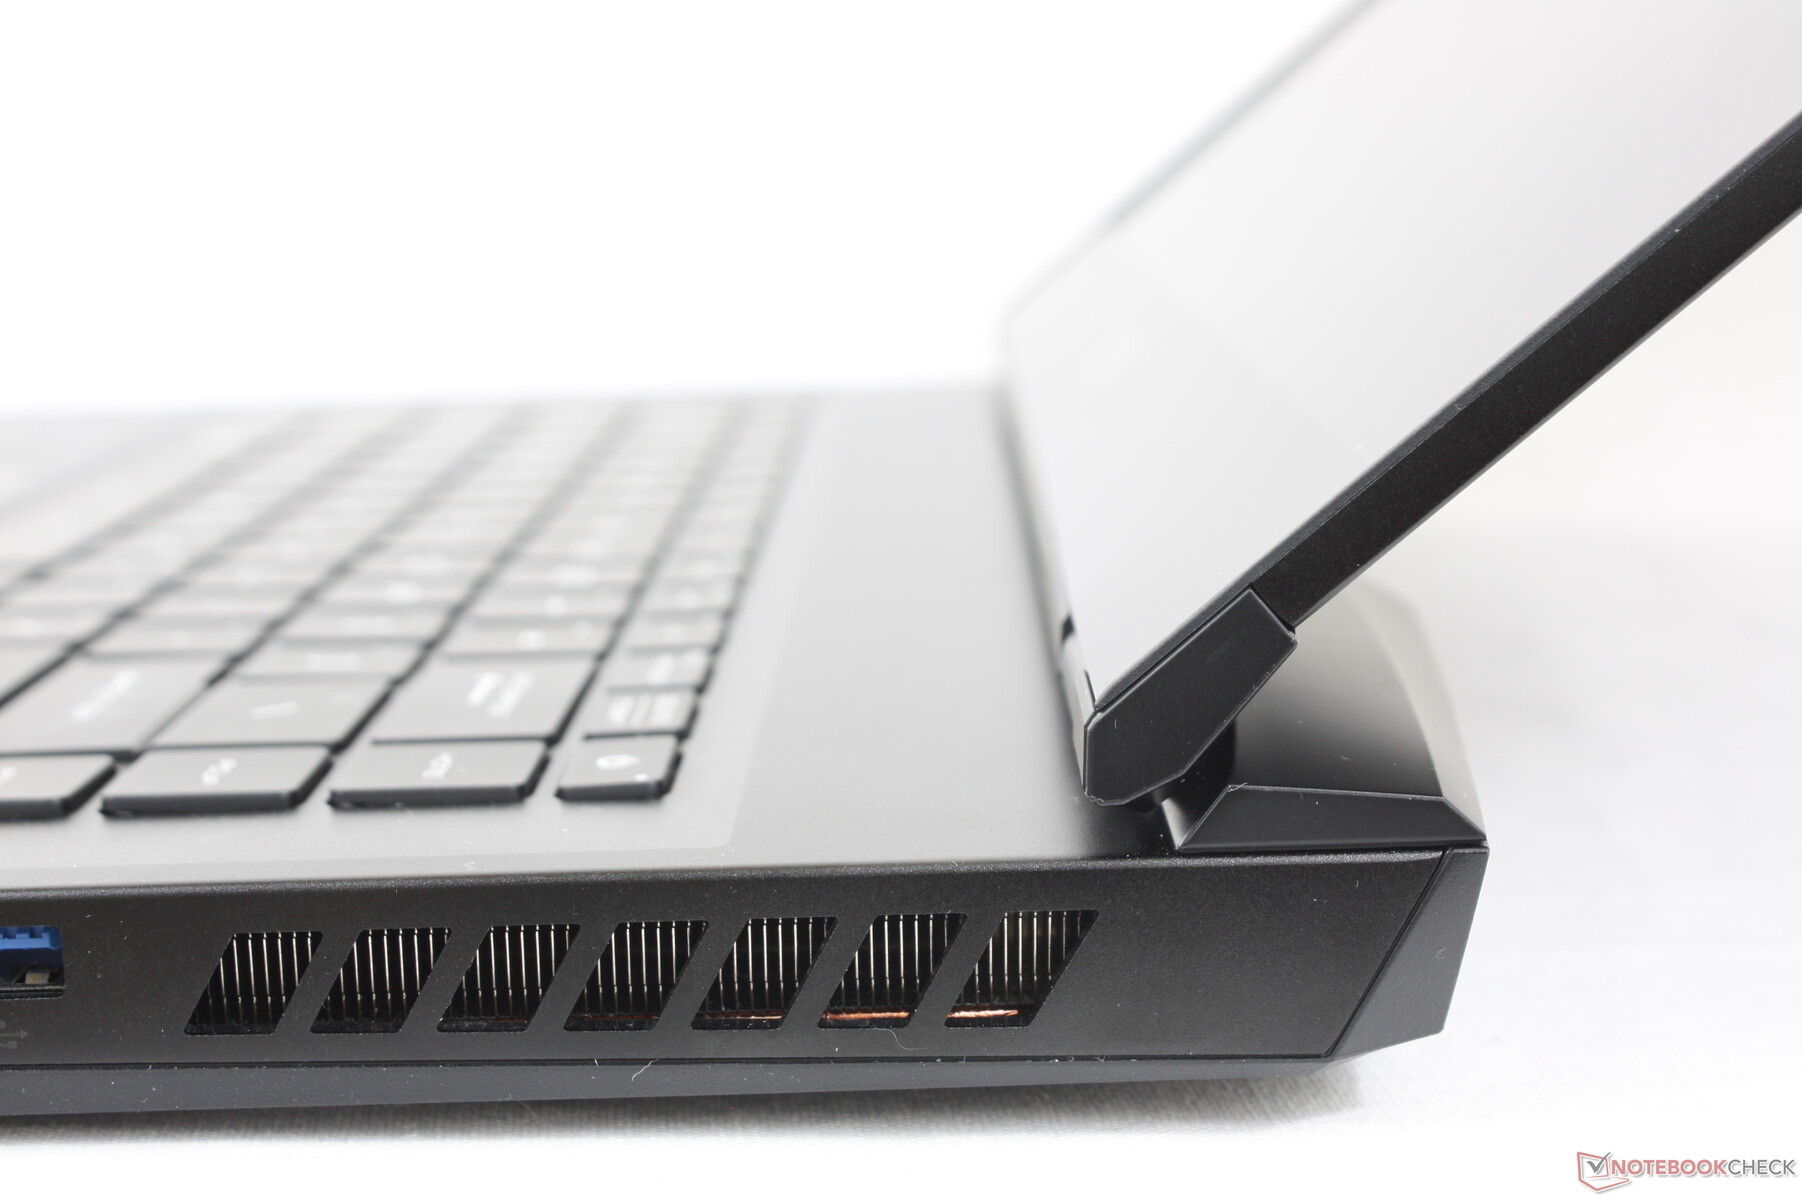
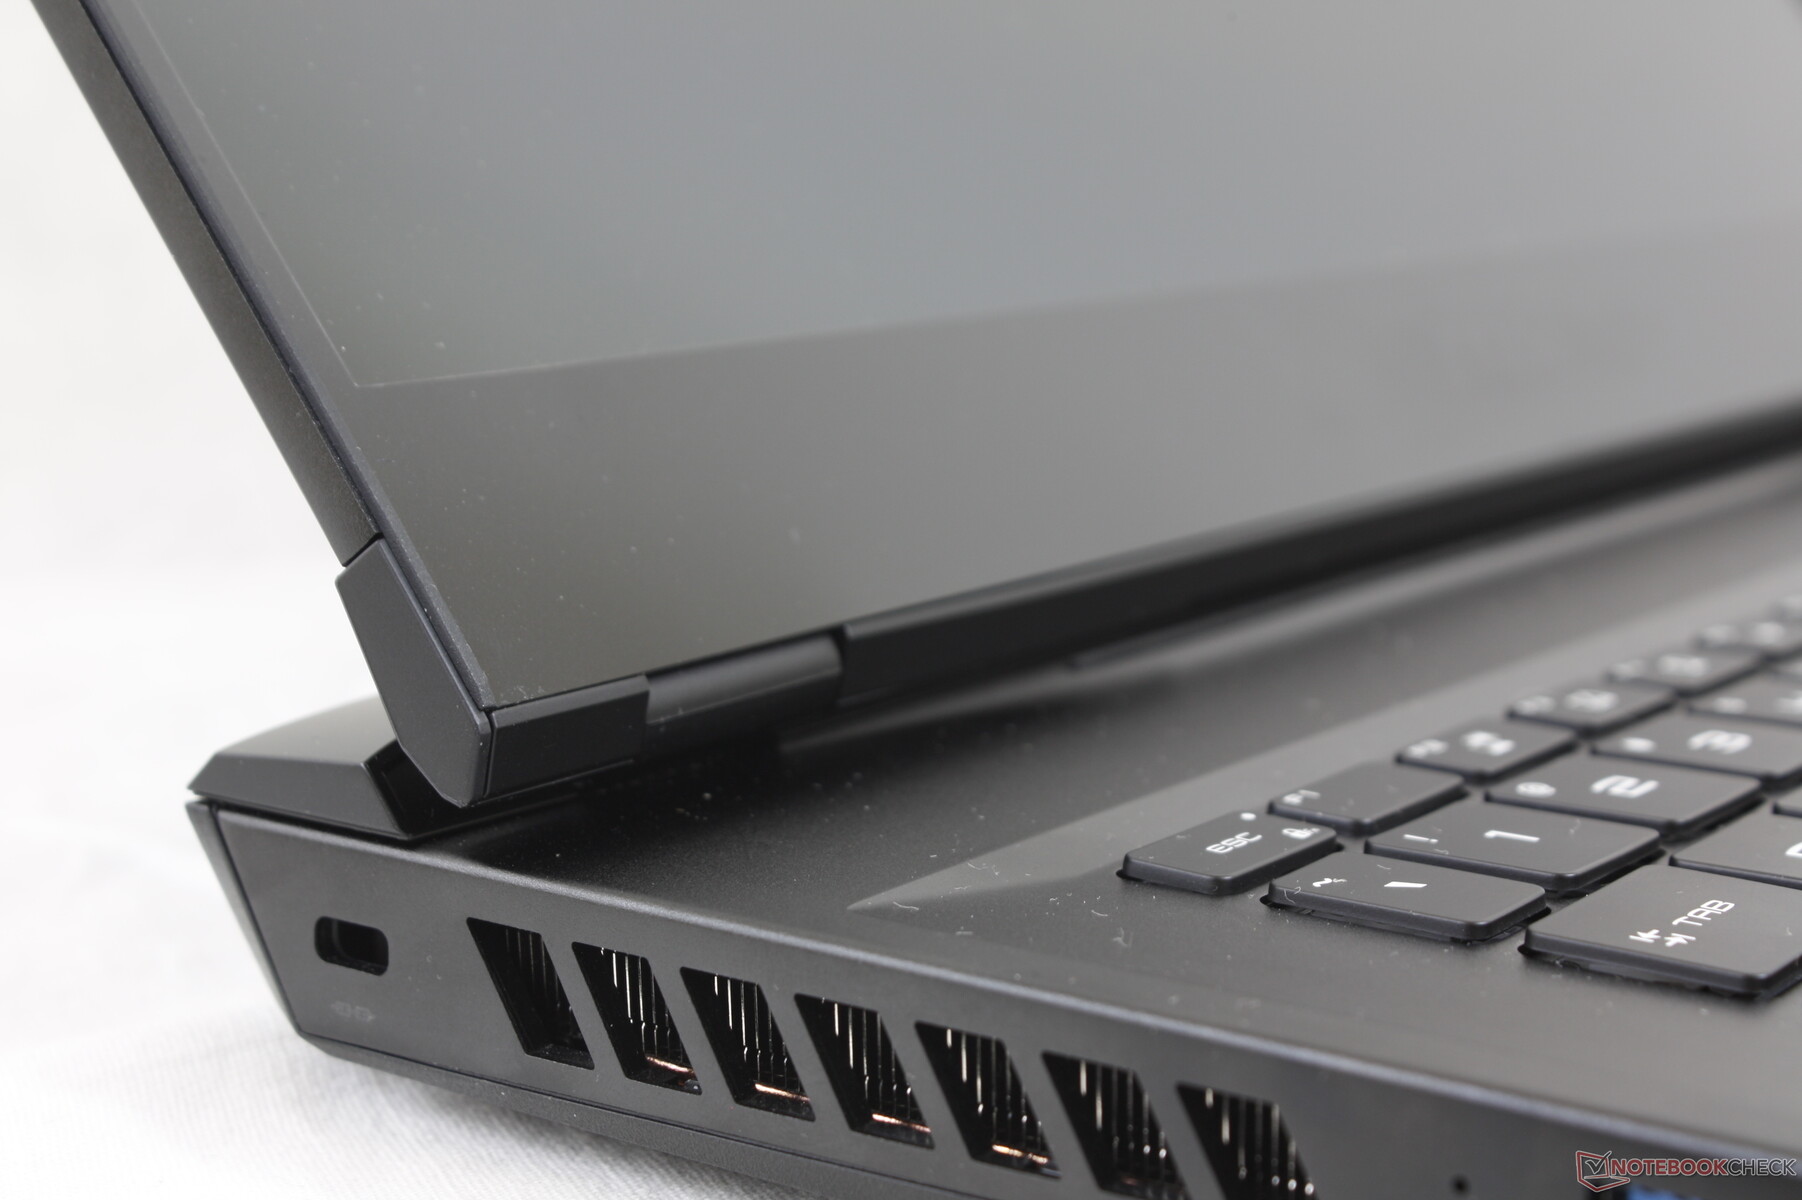
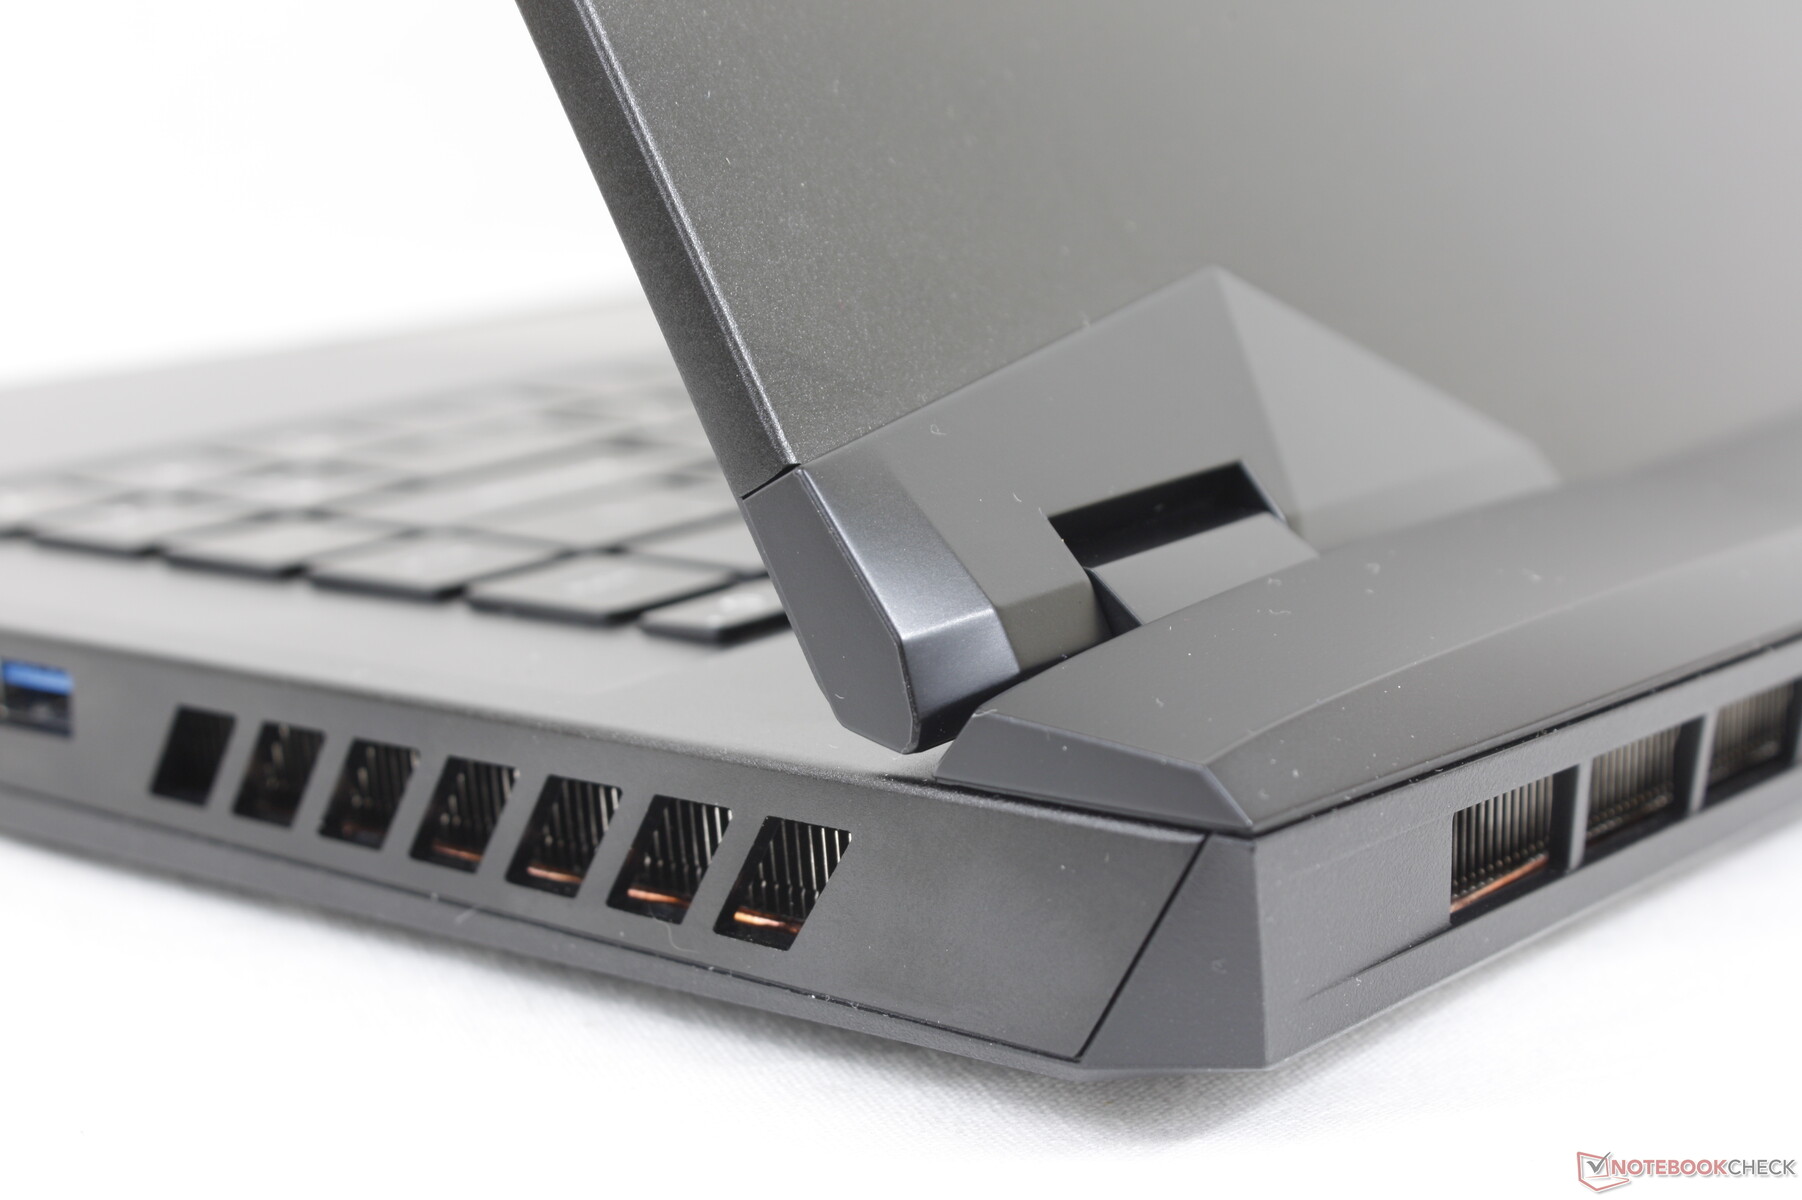
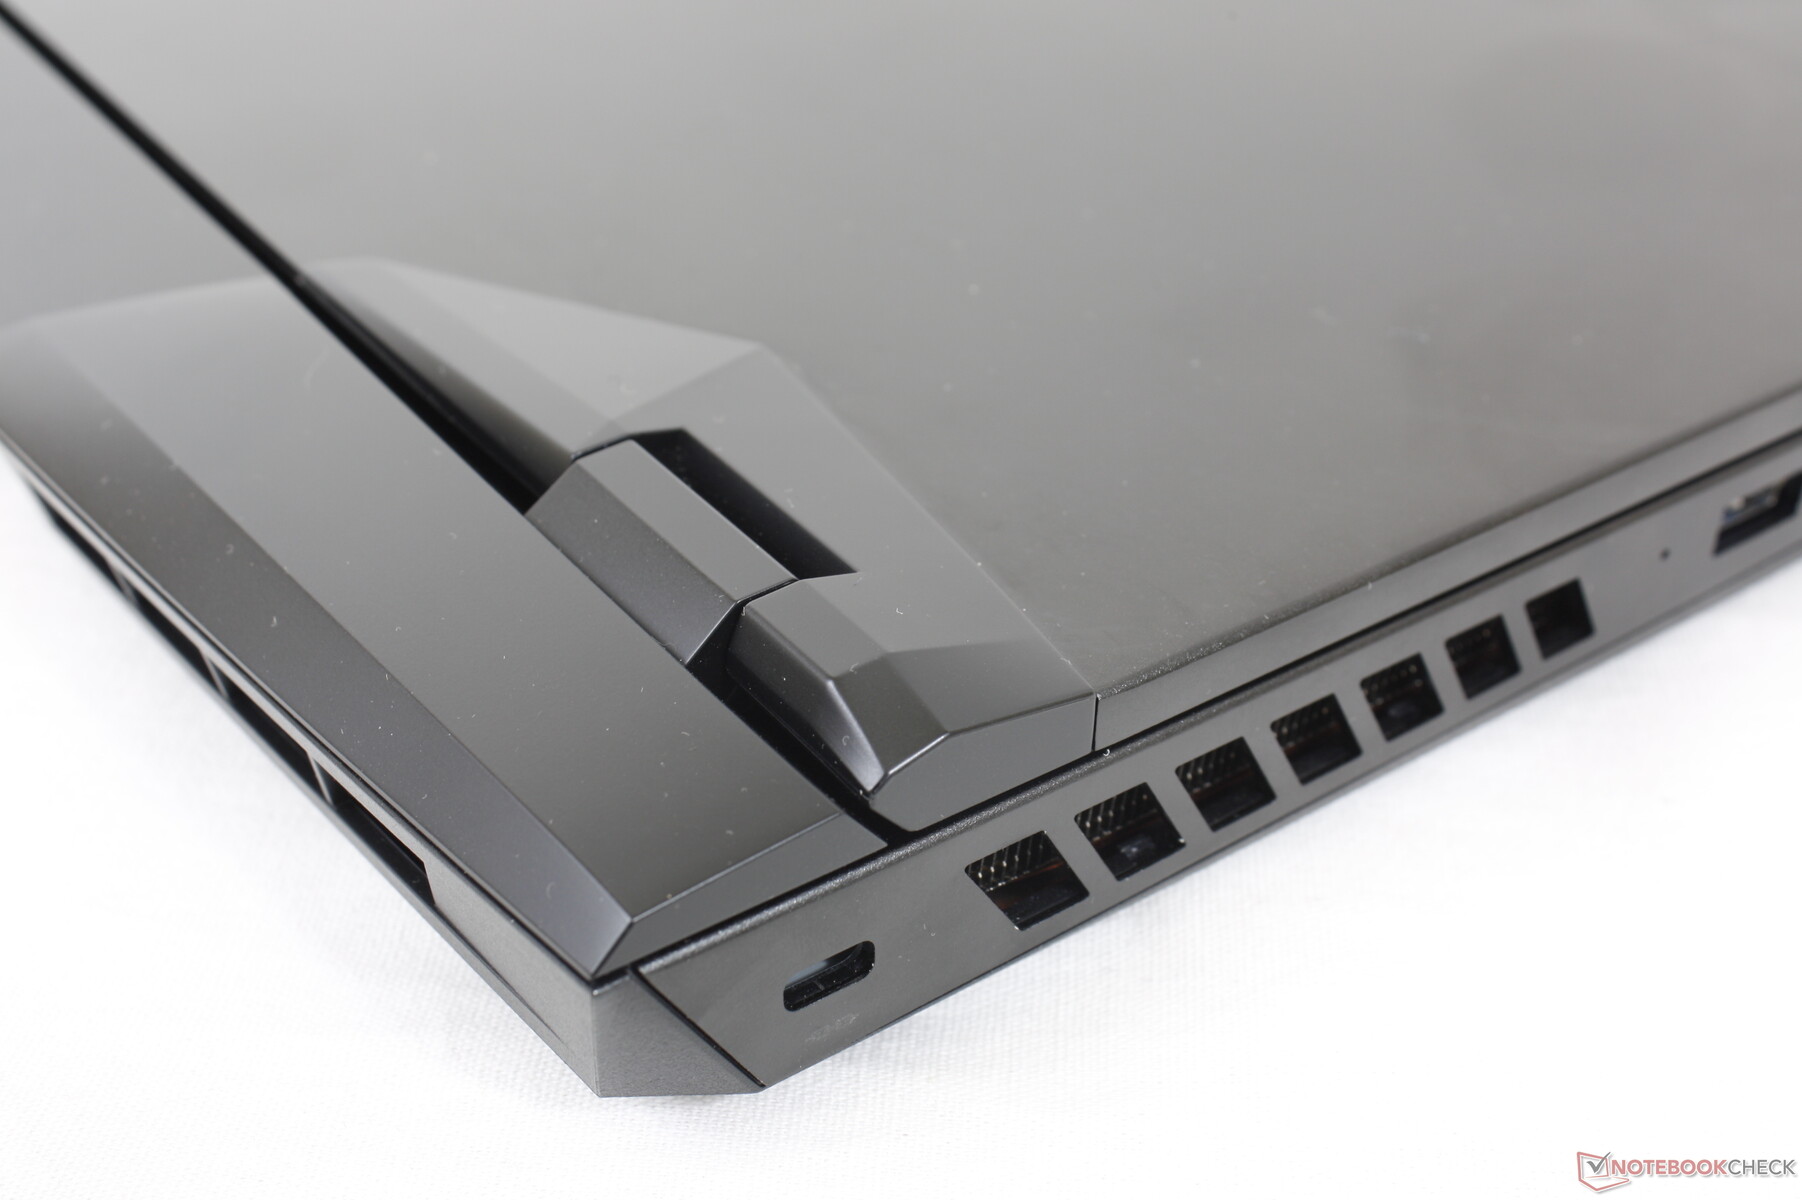
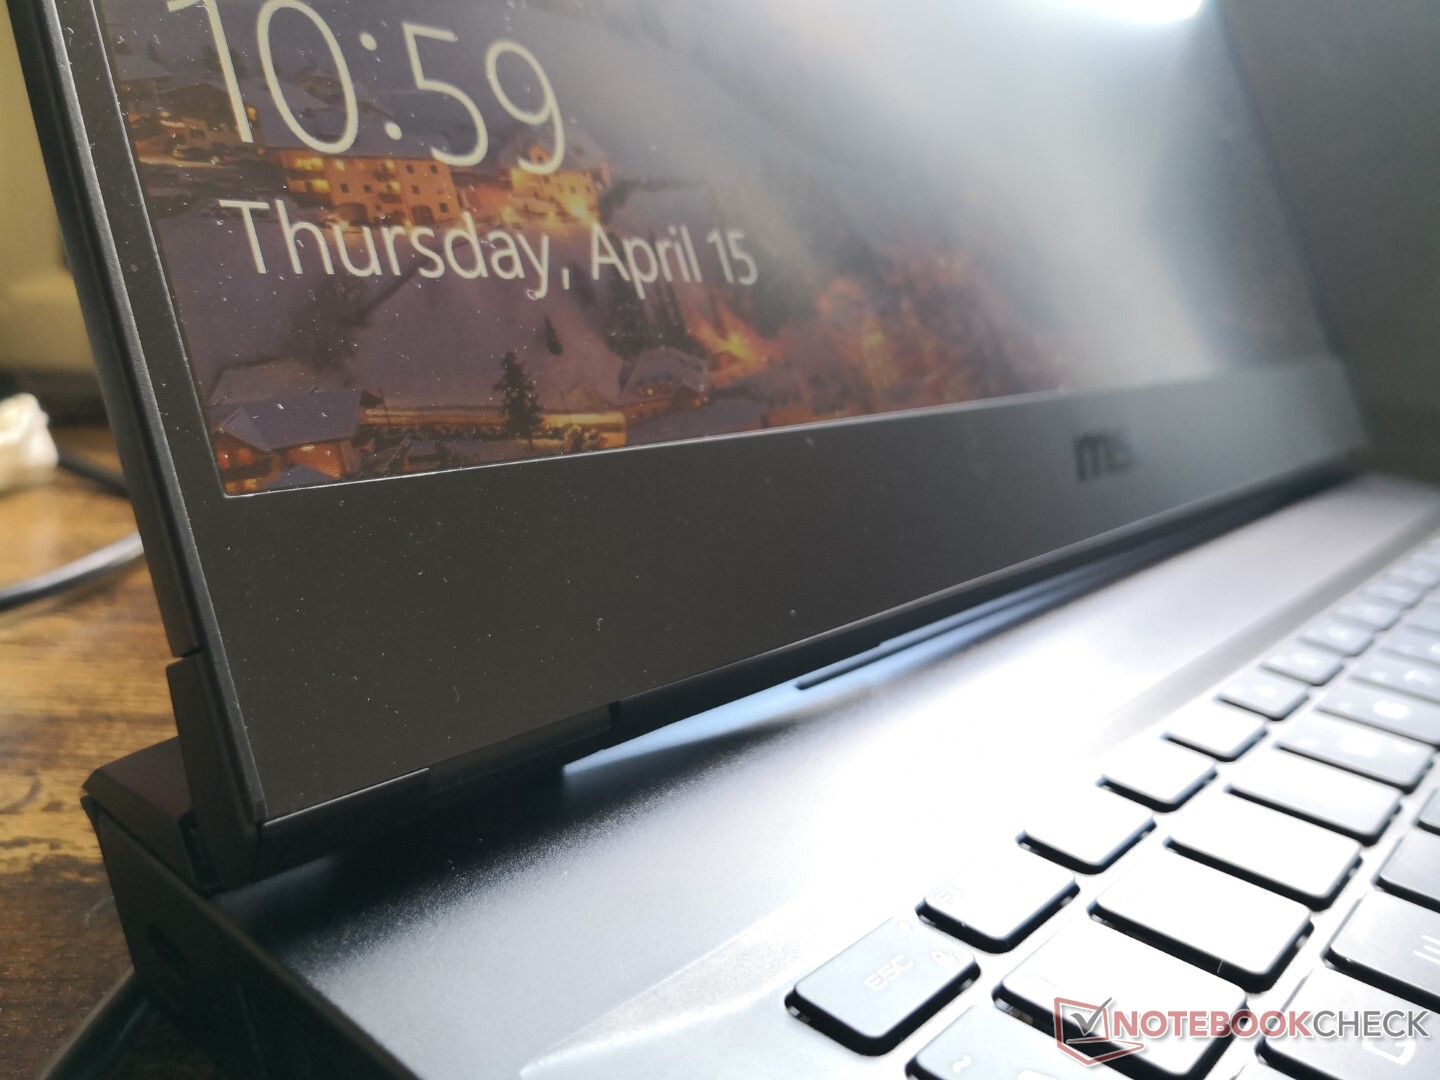
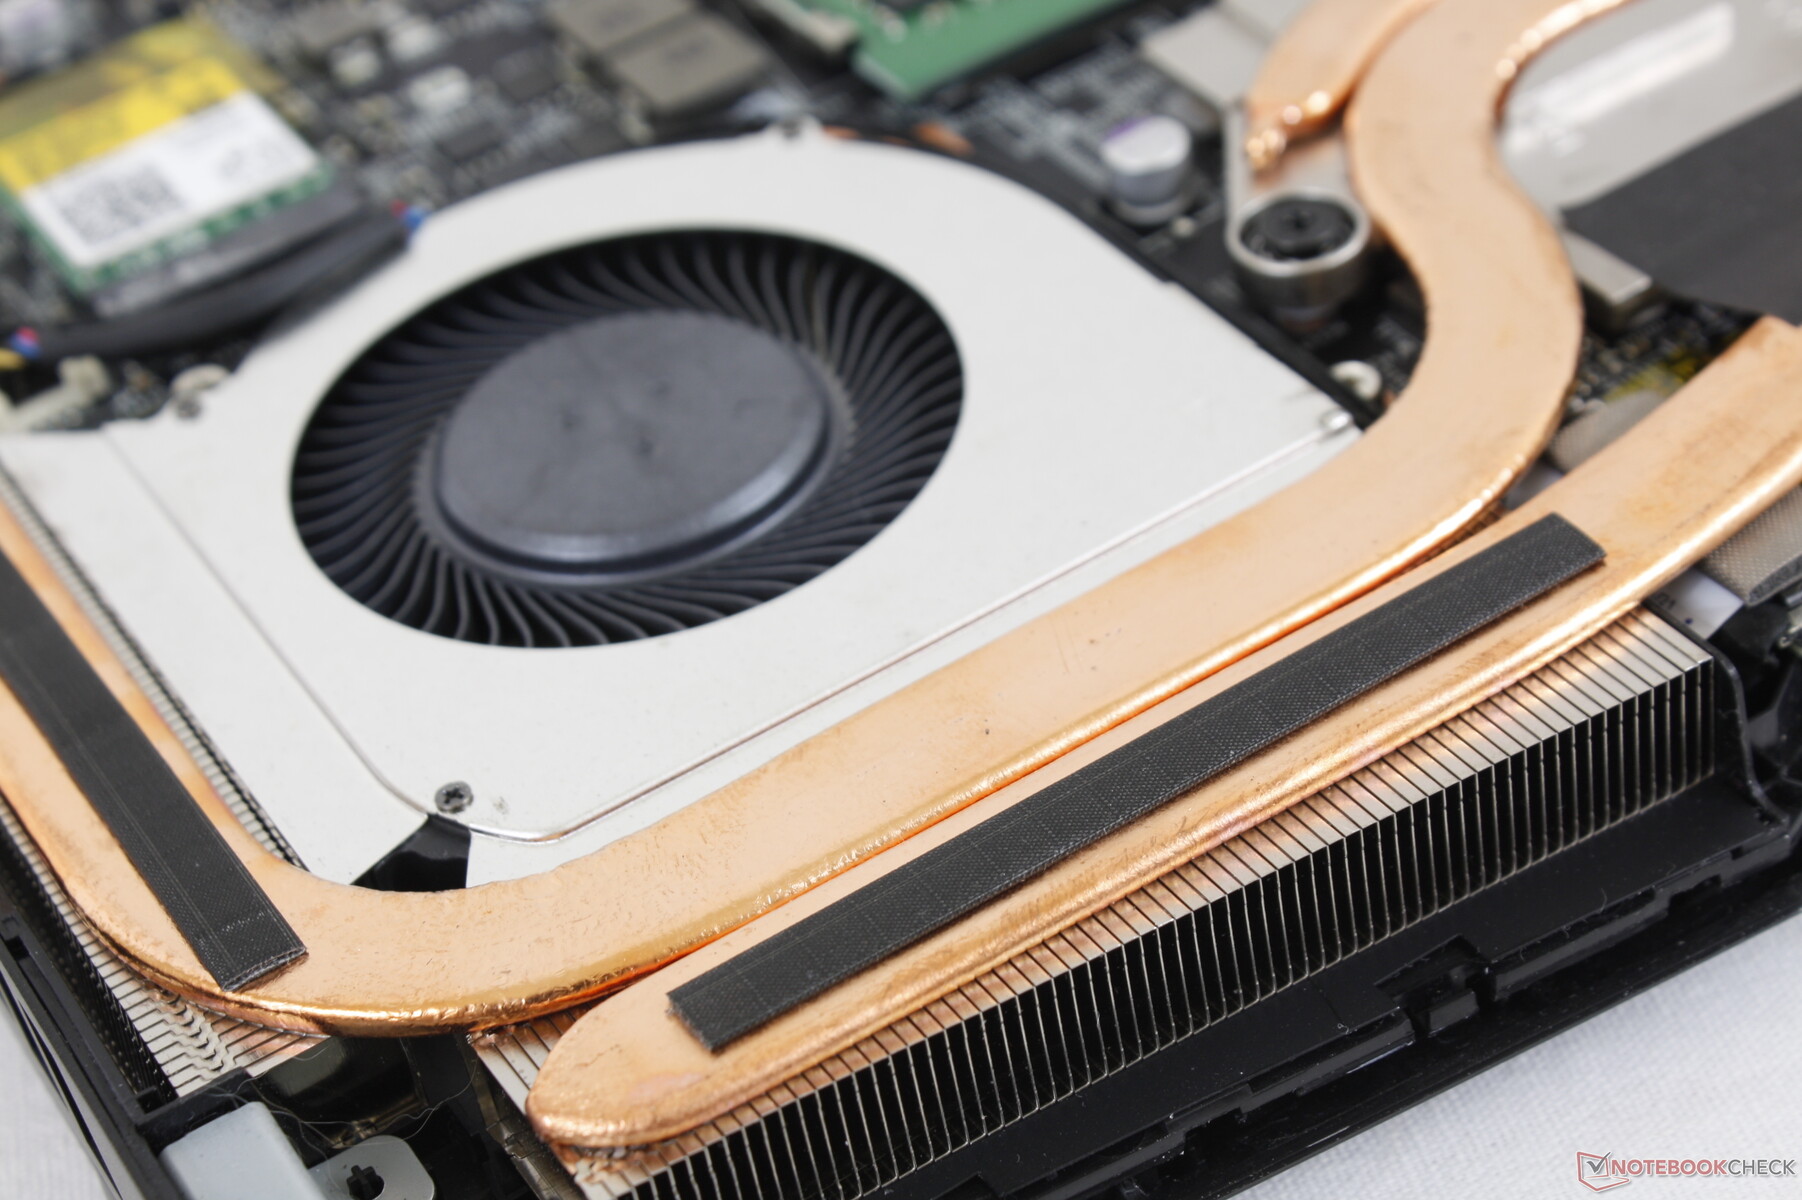
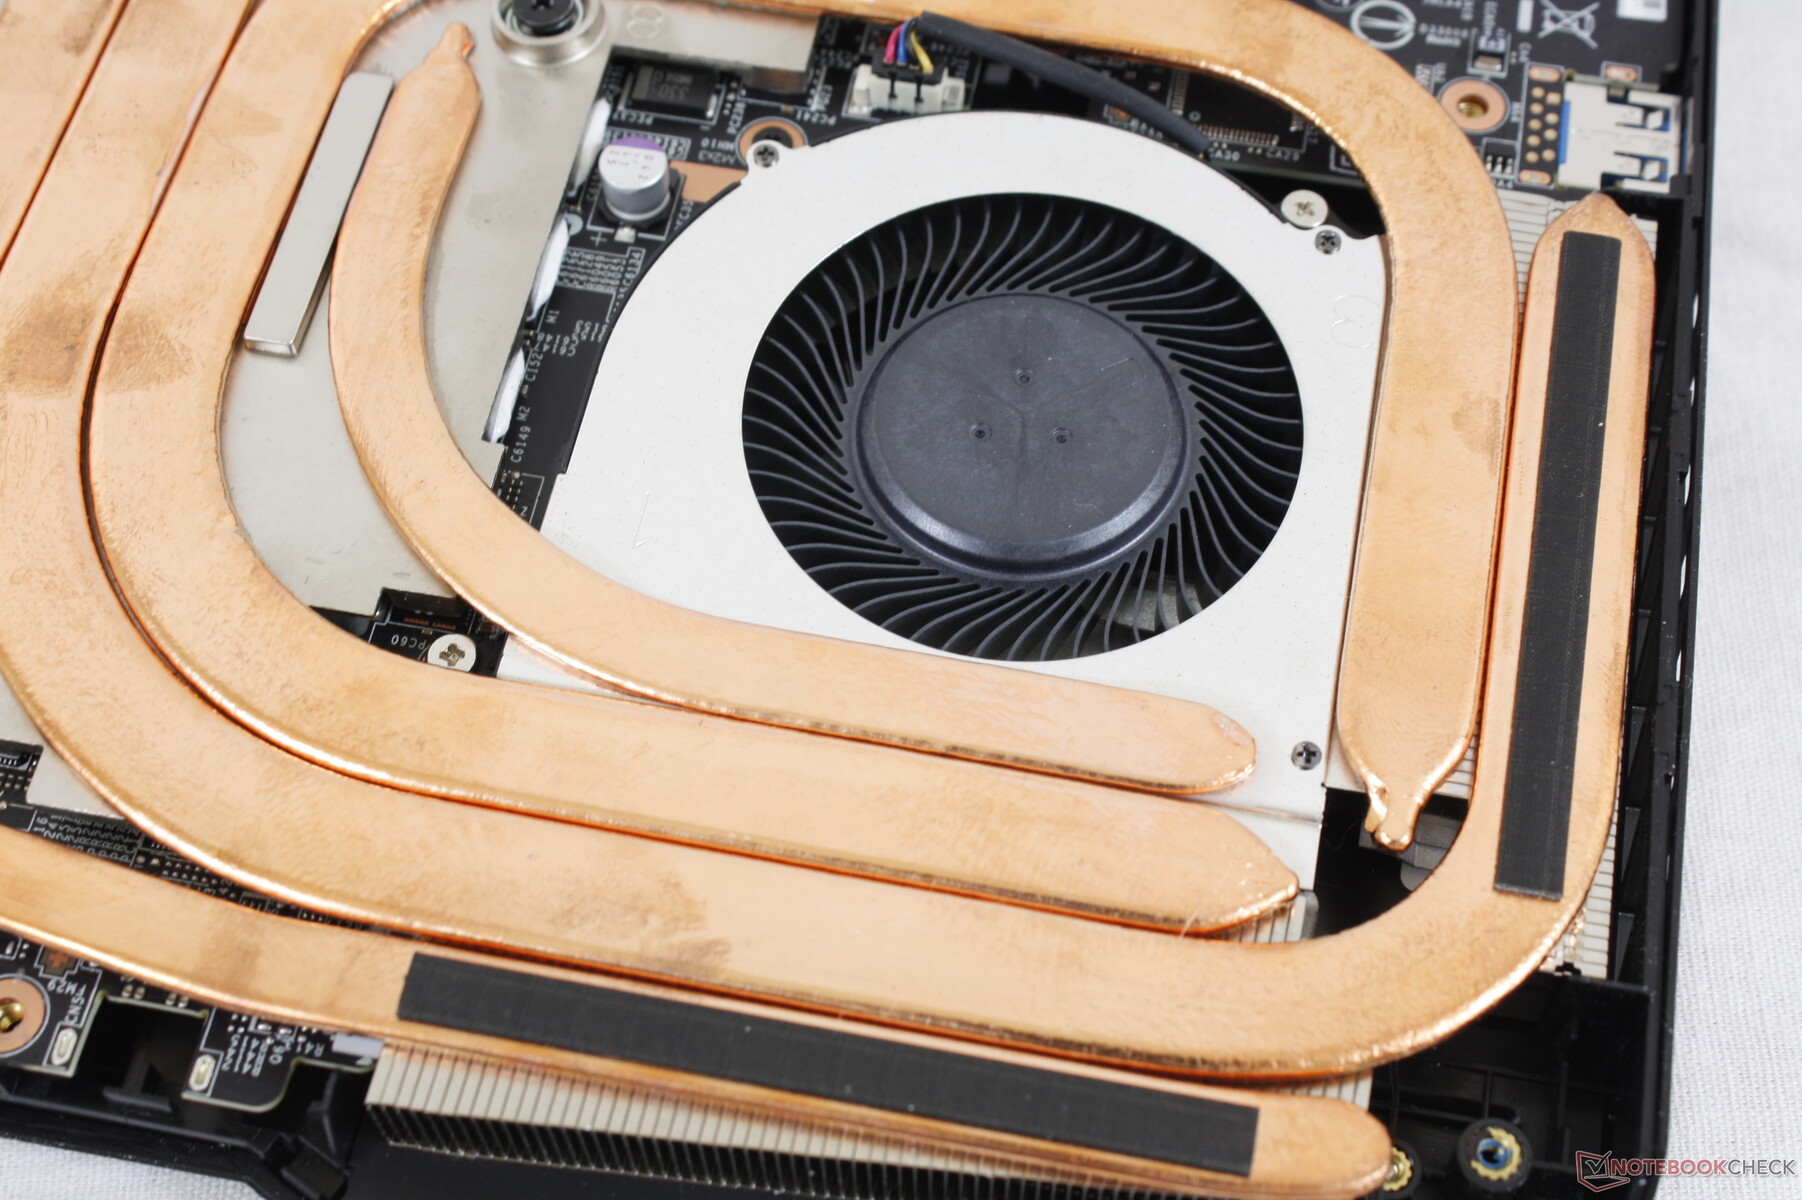
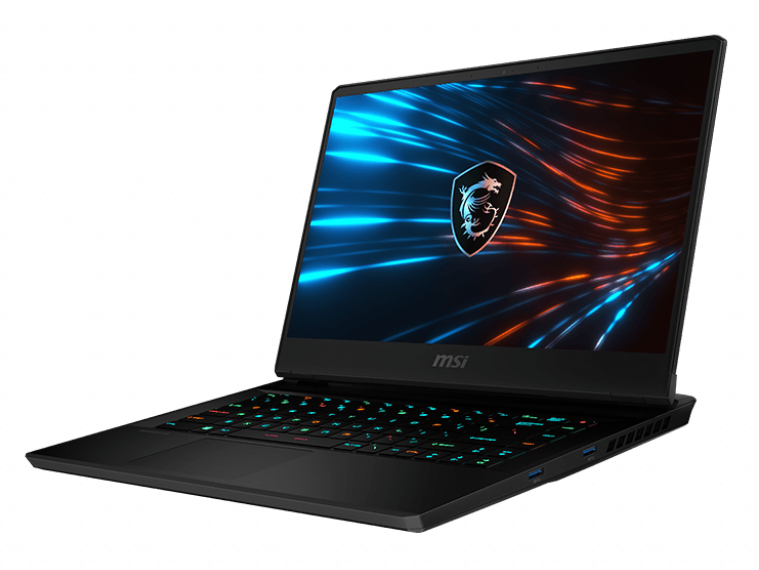
De grootste fysieke verandering van de GP65 naar de GP66 is de grotere achterkant om plaats te bieden aan een krachtigere koeloplossing. Het algemene visuele ontwerp kan verder het best worden omschreven als een afgezwakte GE66 met hun vergelijkbare gladde metalen buitendeksels maar een donkerder zwart kleurenschema. De RGB-lichtbalk langs de voorste rand van de GE66 is niet aanwezig op de GP66, terwijl de per-toets RGB-toetsenbordverlichting blijft.
De bouwkwaliteit is uitstekend, vooral voor de basis. Het toetsenbord vertoont slechts minimale buiging en kraken bij het buigen of draaien van de voorste hoeken. Het deksel had echter stijver kunnen zijn omdat de scharnieren de neiging hebben te wankelen bij het aanpassen van de hoeken. De buitenste klep buigt ook gemakkelijker dan bij de Asus ROG Strix G15 wanneer druk wordt uitgeoefend in het midden.
Het nieuwe ontwerp is merkbaar langer dan de oudere GP65 vanwege de nieuwe "straalmotor"-achterkant. Voor het overige blijft het gewicht met 2,3 kg vrijwel gelijk en is het systeem deze keer ongeveer 4 mm dunner. De concurrerende Alienware m15 R4 is nog groter, terwijl de Asus Zephyrus G15 GA503Q zowel lichter als kleiner is.
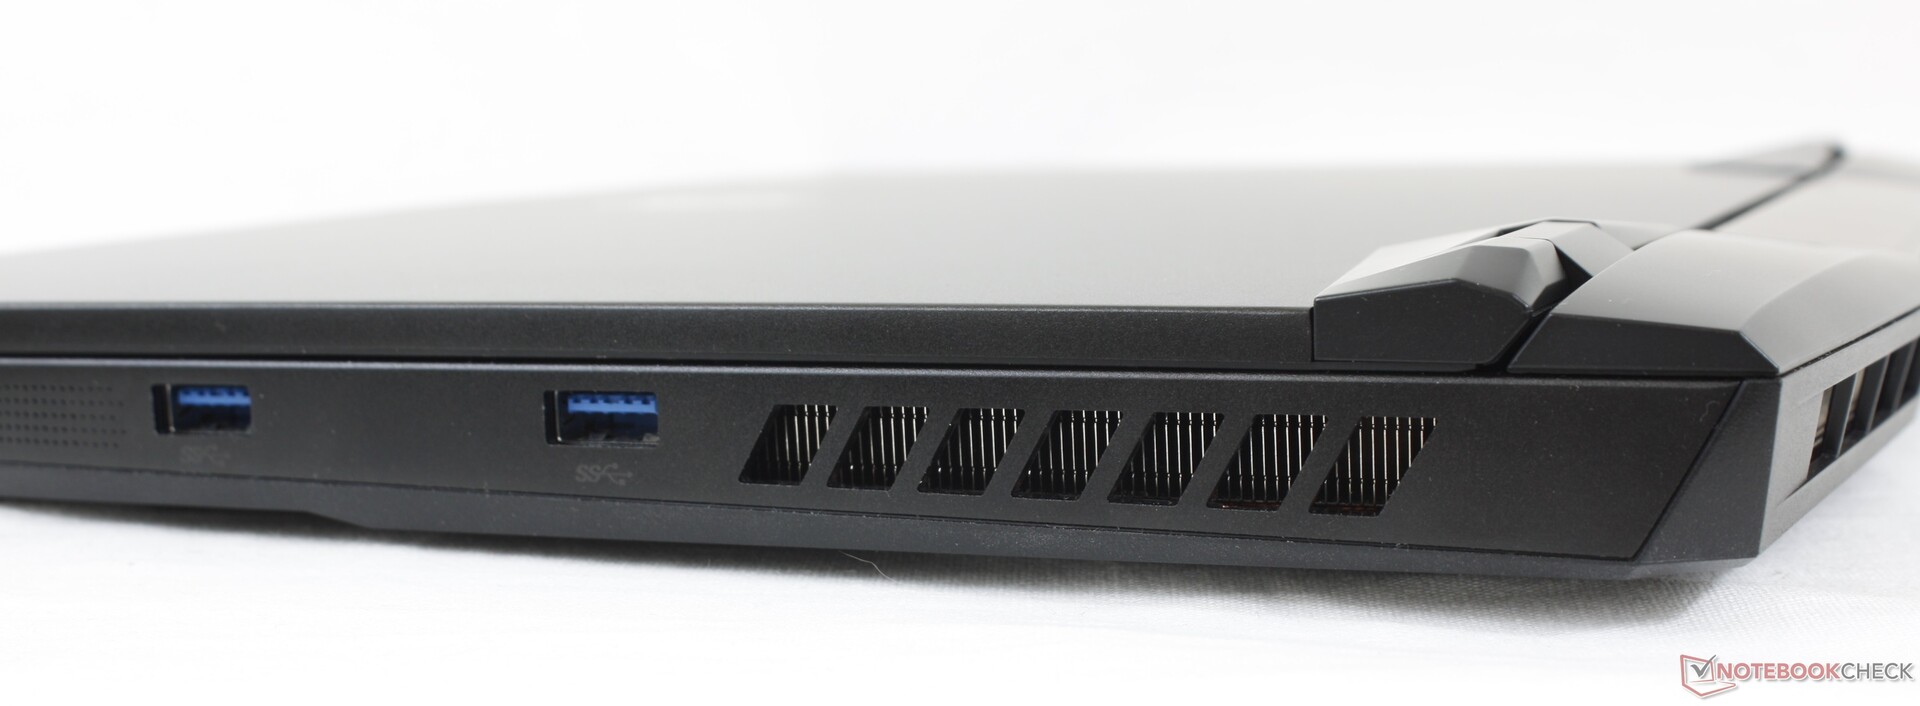
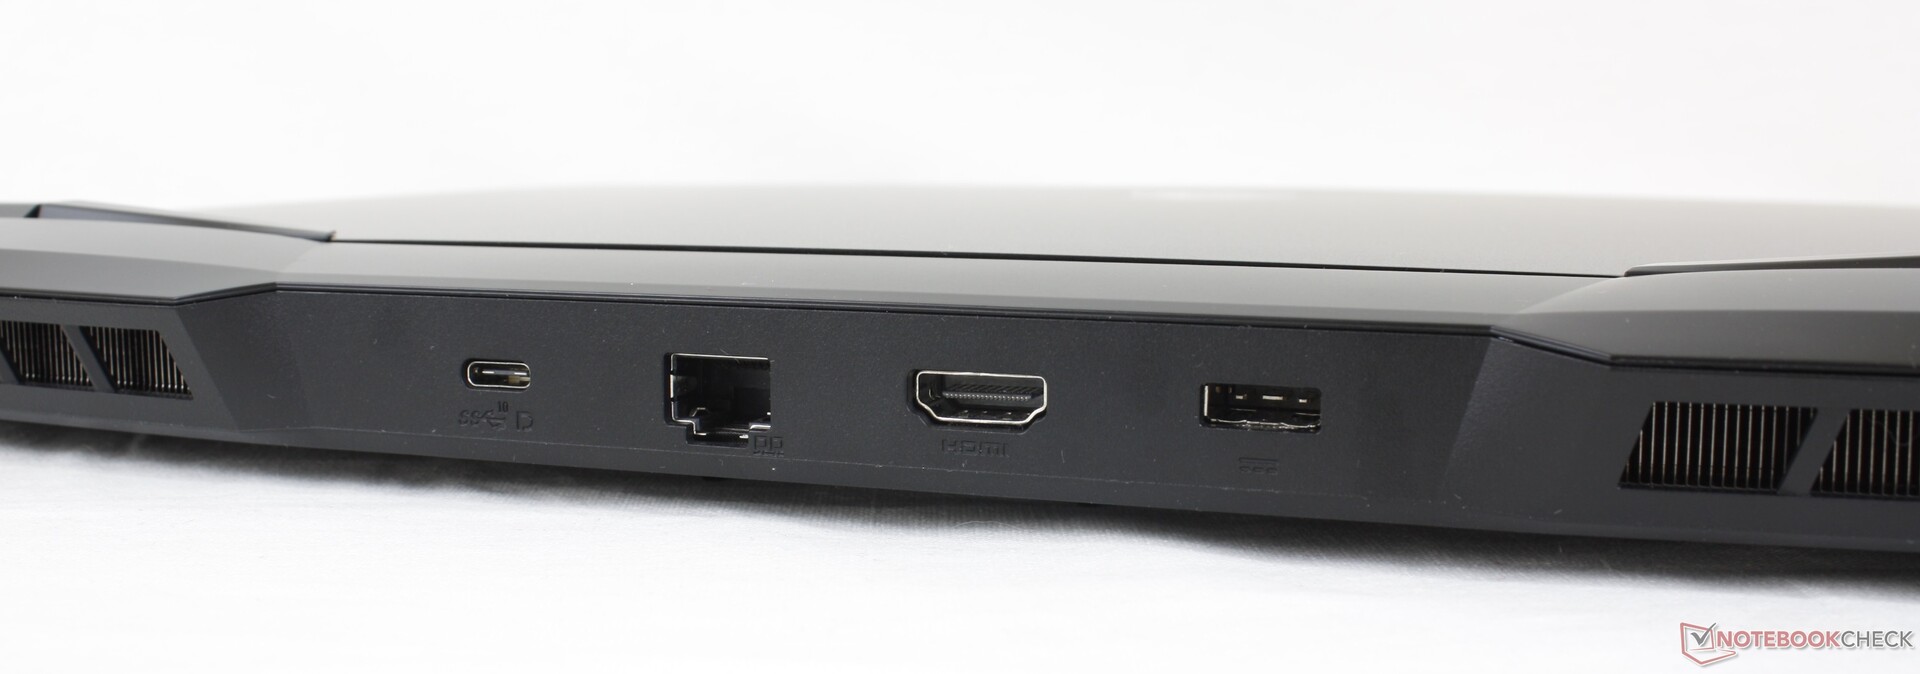
Connectiviteit
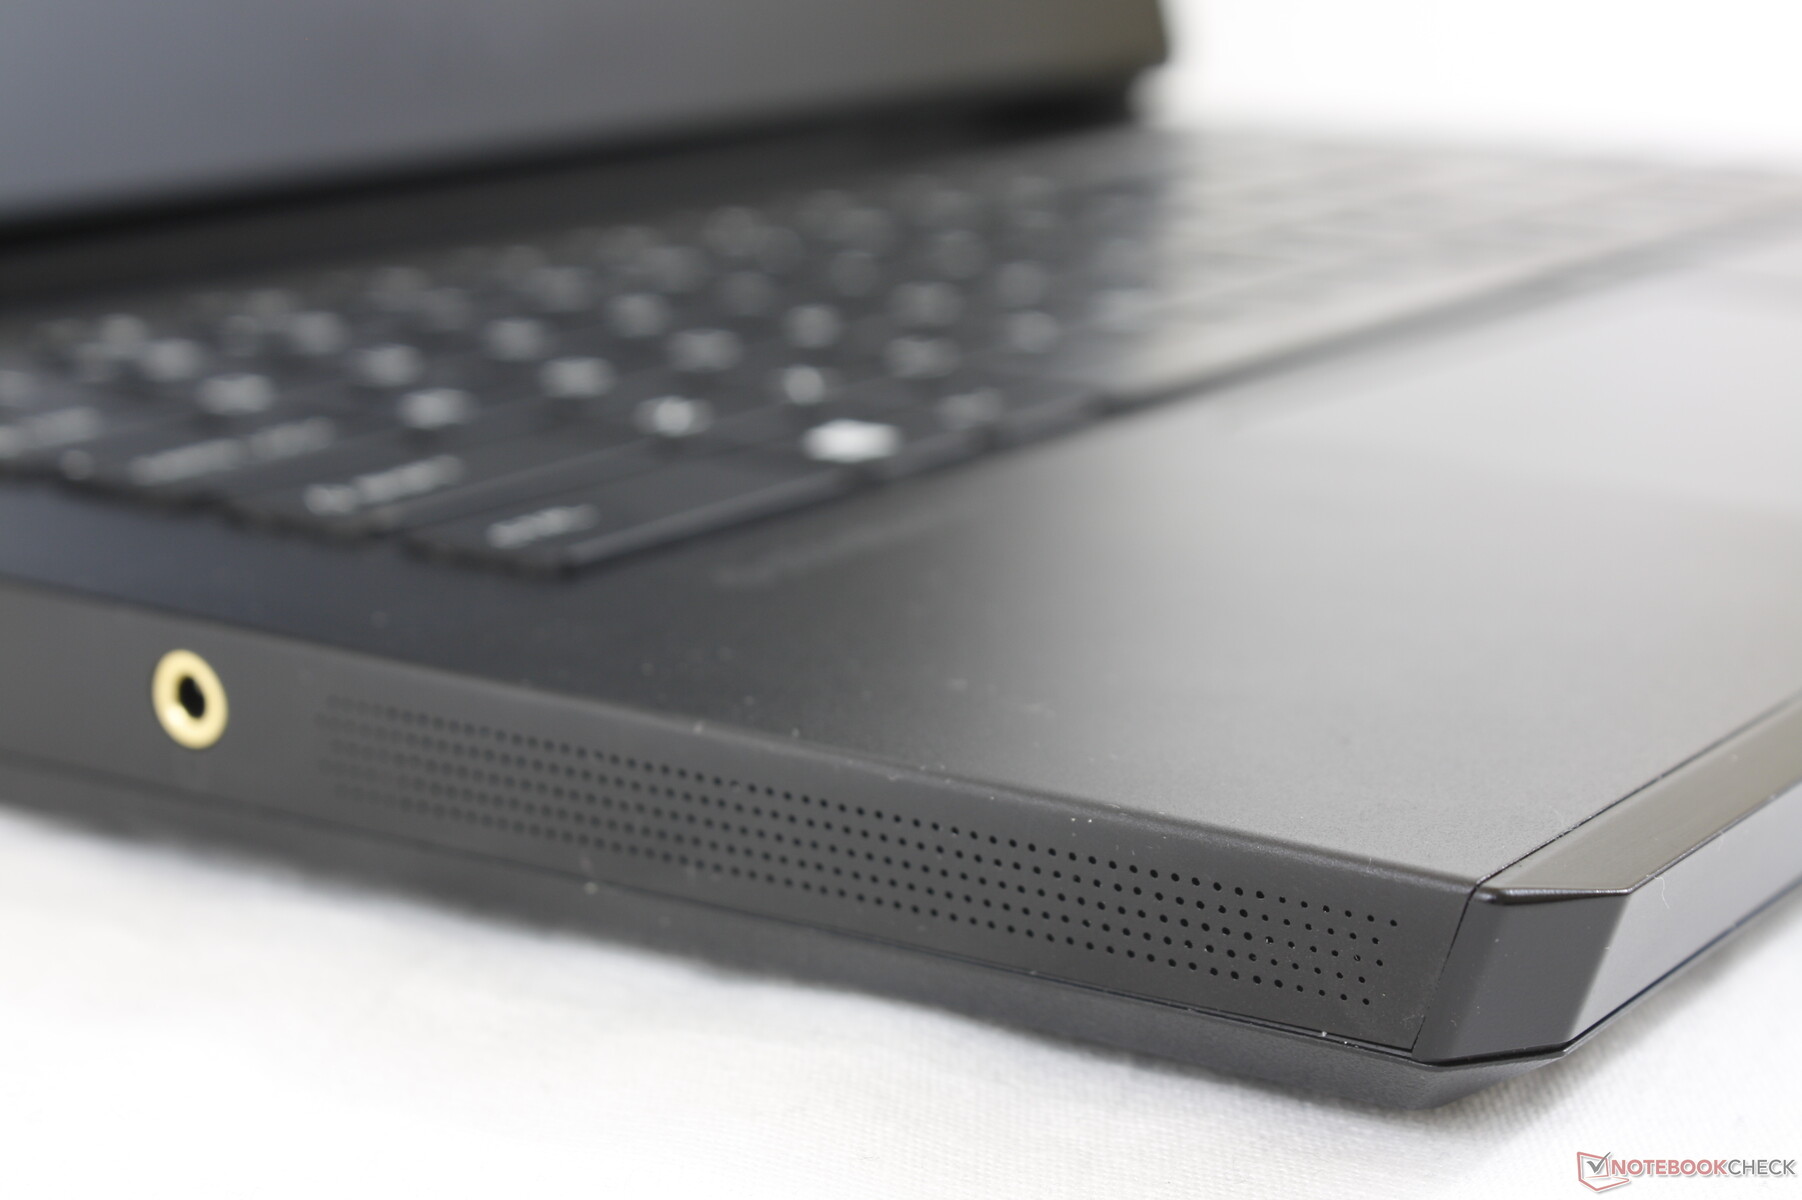
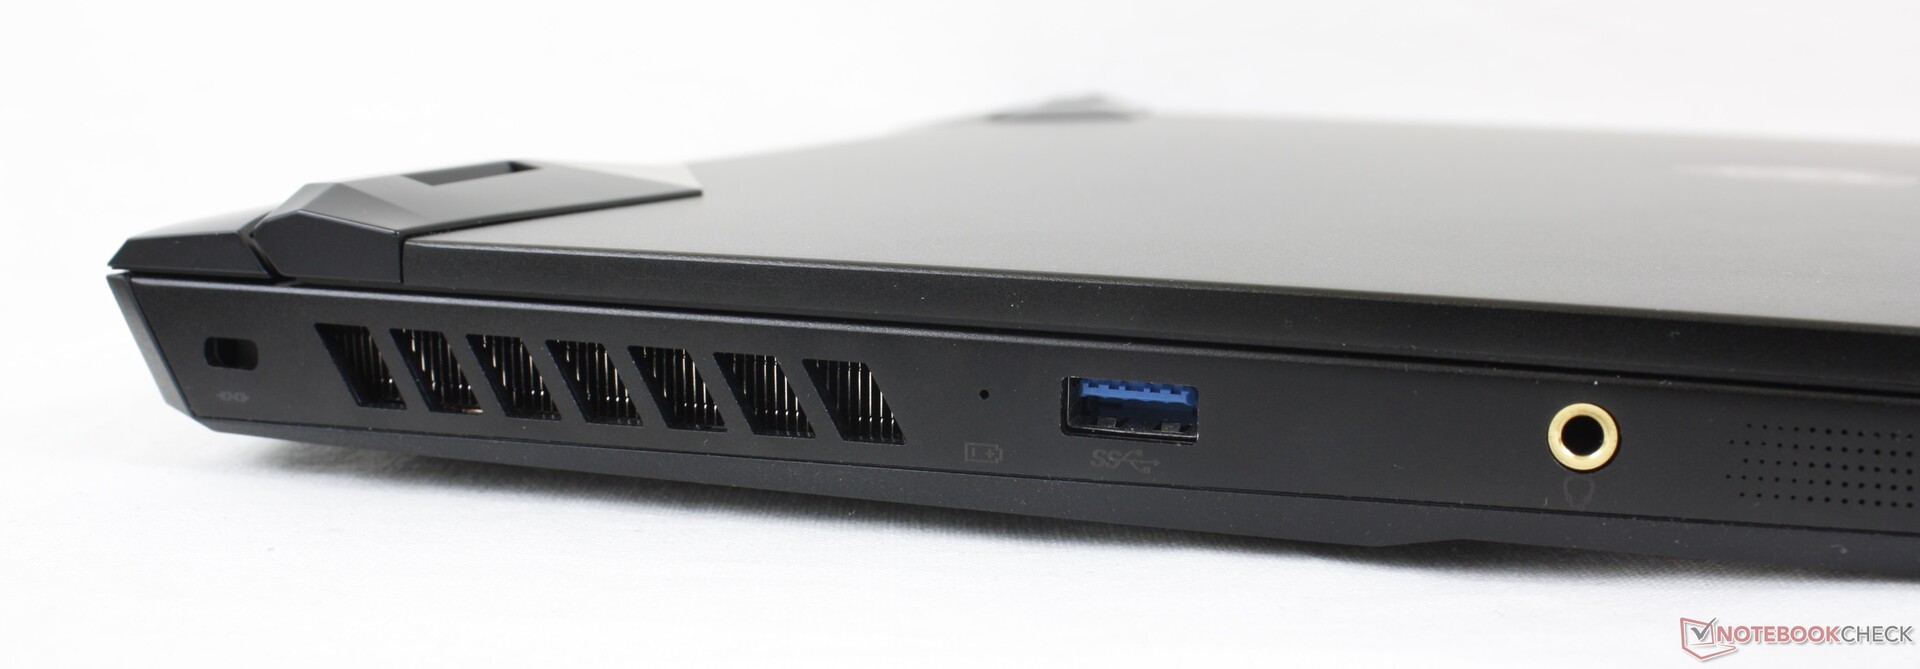
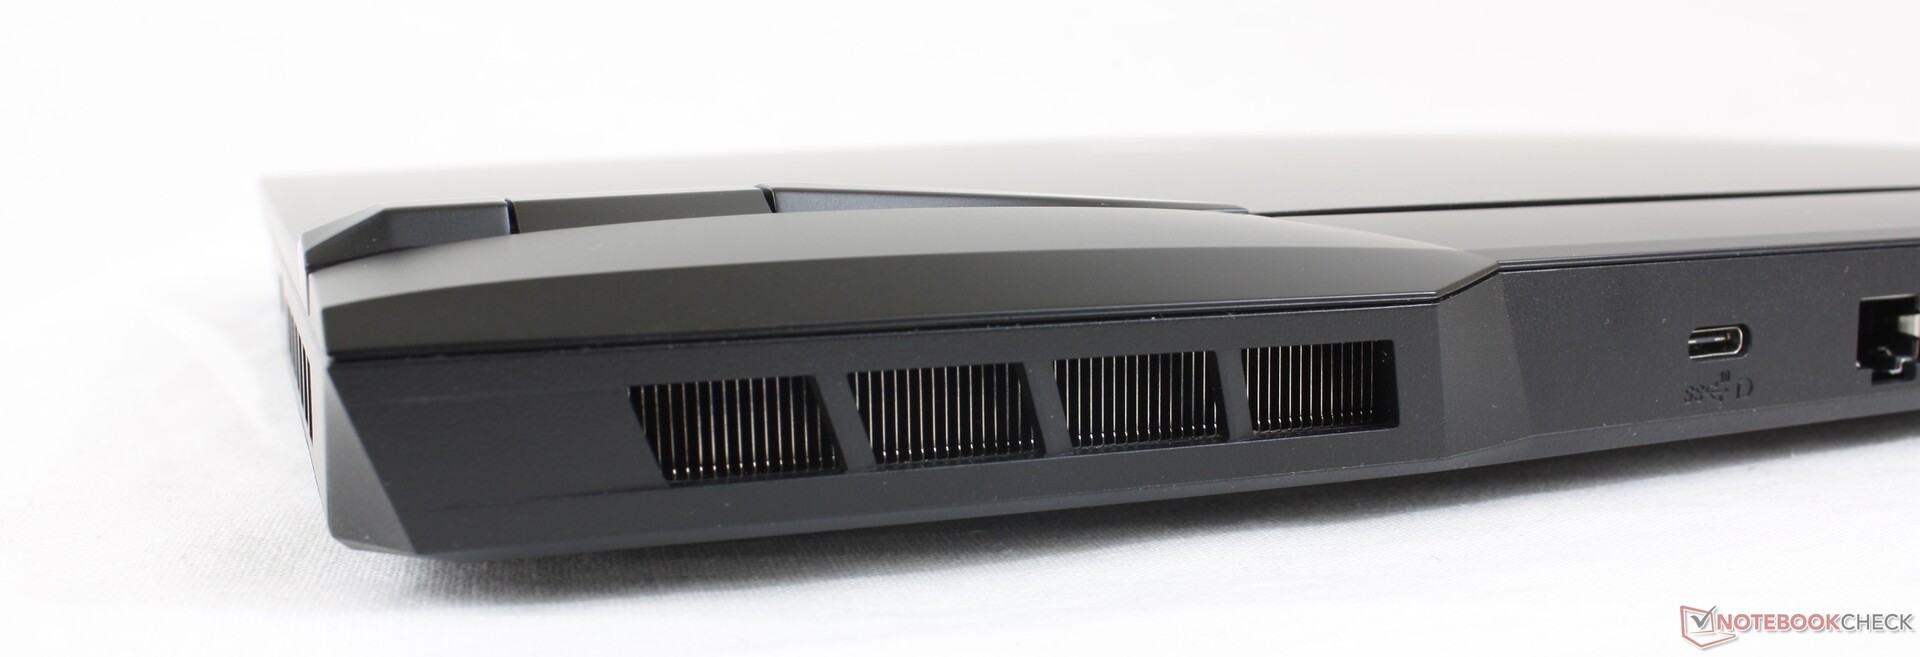
De poortopties en -positionering zijn aanzienlijk veranderd ten opzichte van de GP65. Ten eerste zijn de poorten nu gelijkmatiger verdeeld over de linker-, rechter- en achterrand, terwijl ze bij de GP65 allemaal op een hoopje zaten. Ten tweede zijn zowel de 3,5 mm microfoon als de mini-DisplayPort-poorten nu verdwenen ten gunste van DisplayPort-over-USB-C. HDMI is geüpgraded van 1.4 naar 2.0 voor 4K60 ondersteuning en er is een extra USB-A poort voor drie in totaal.
Houd er rekening mee dat Thunderbolt en USB-C Power Delivery niet worden ondersteund. Gebruikers kunnen de GP66 dus niet opladen met USB-C adapters in tegenstelling tot de Razer Blade 15 of Alienware m15.
Communicatie
Webcam


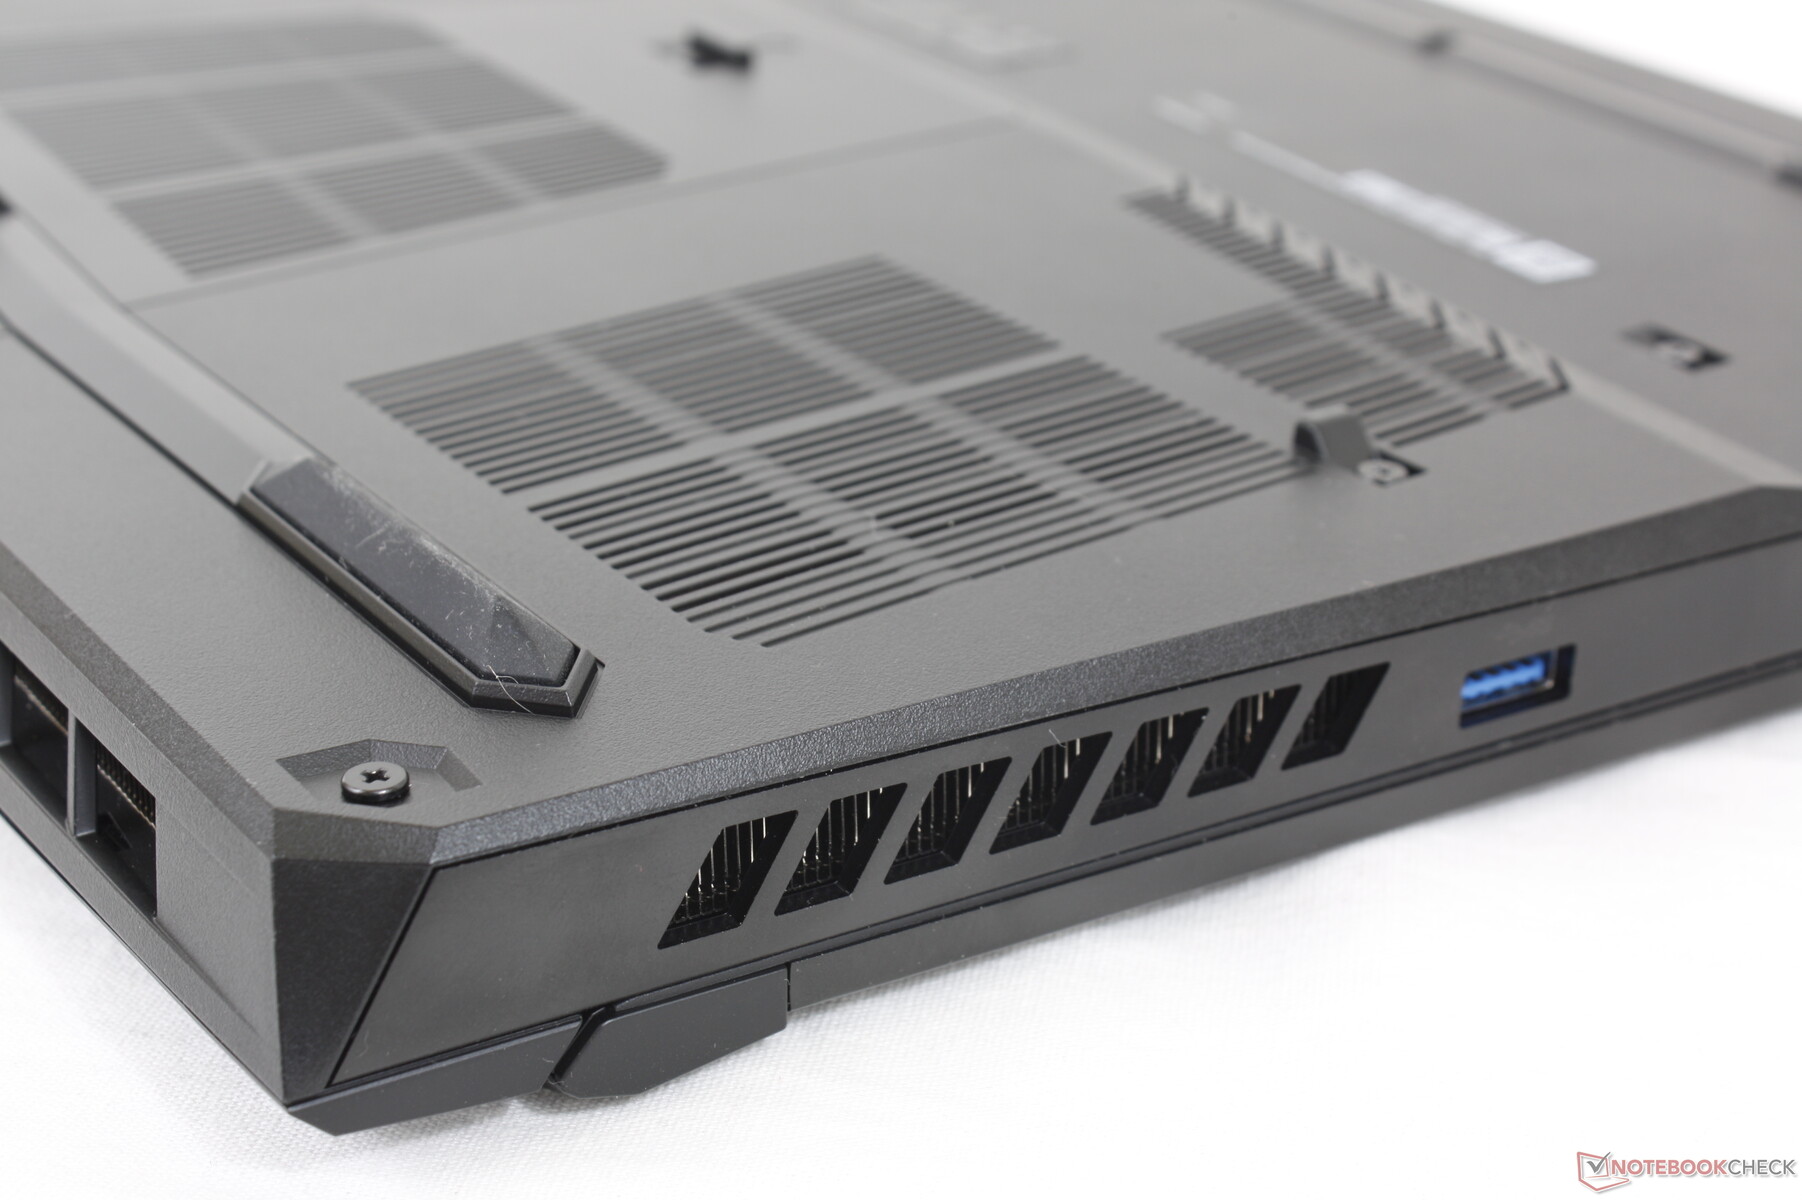
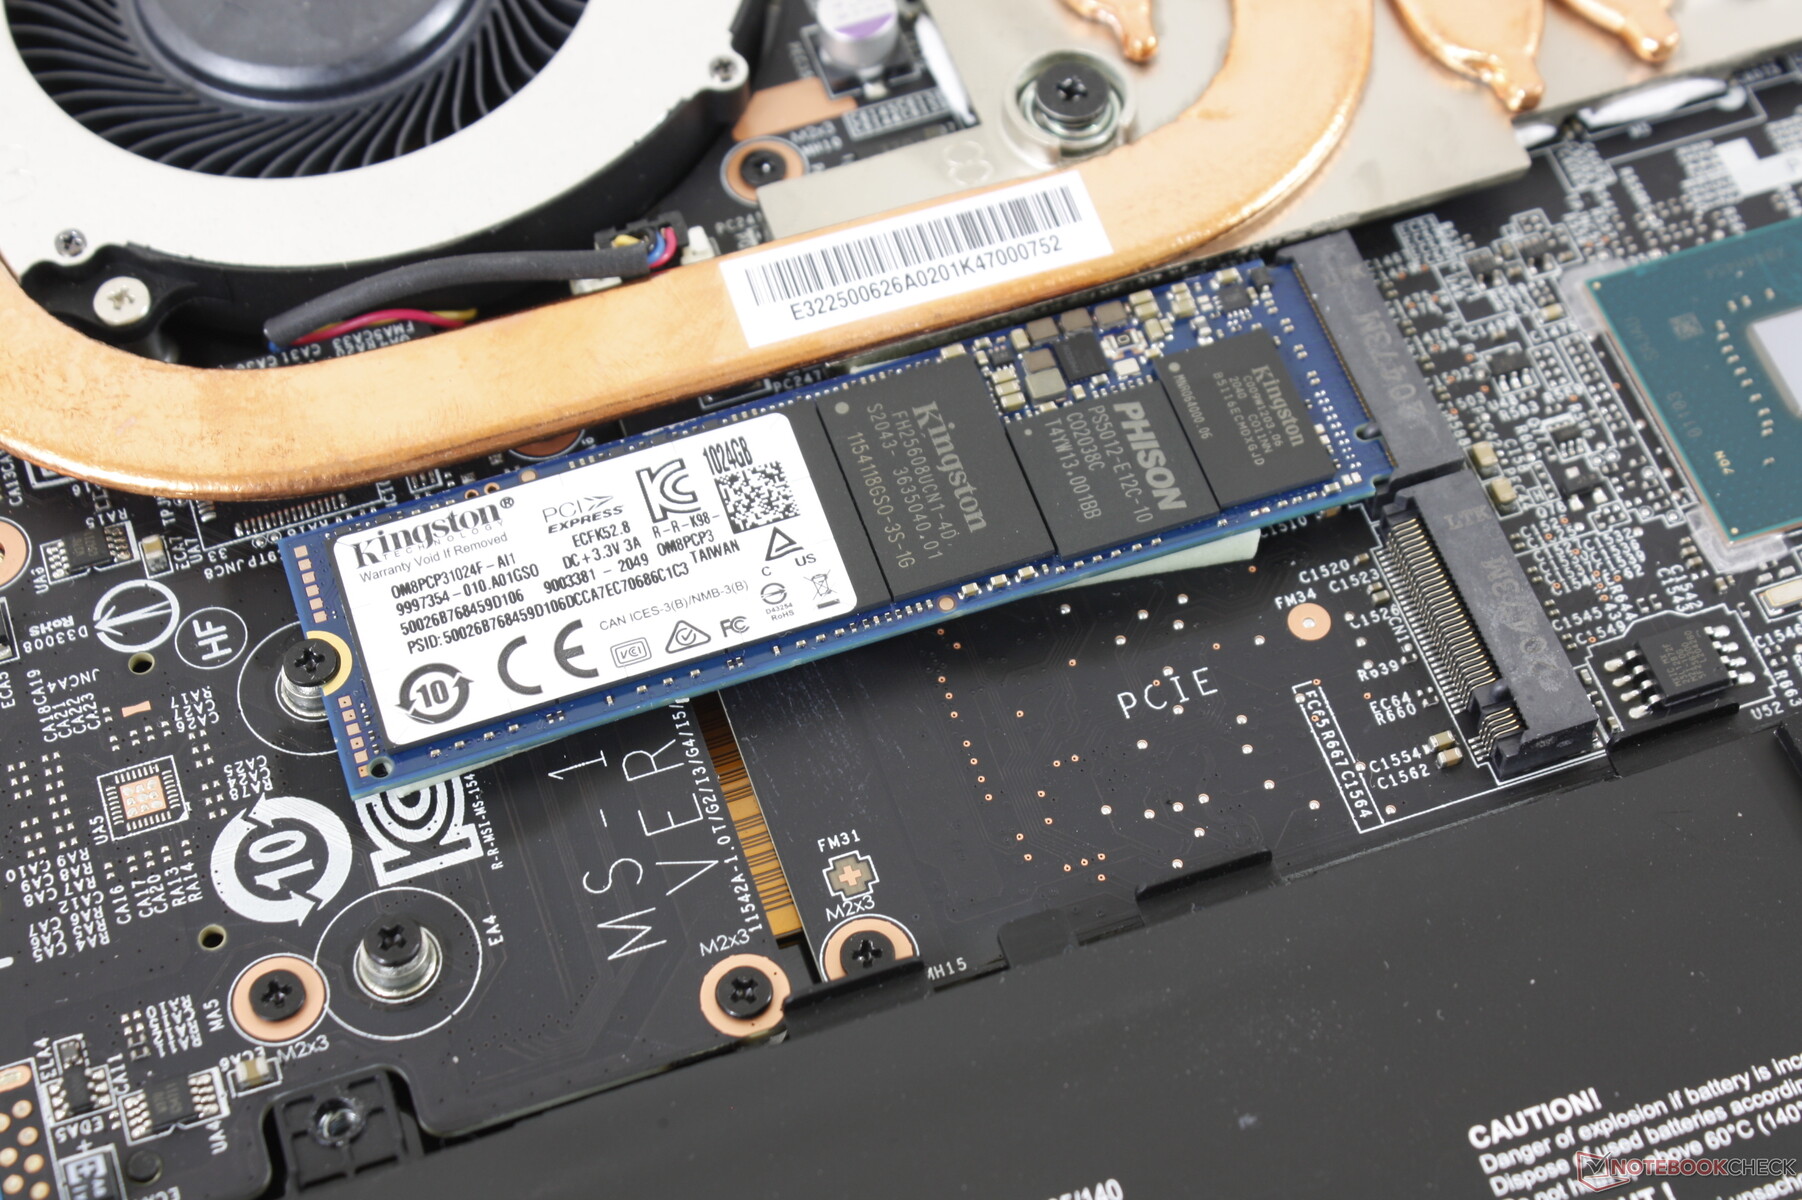
Onderhoud
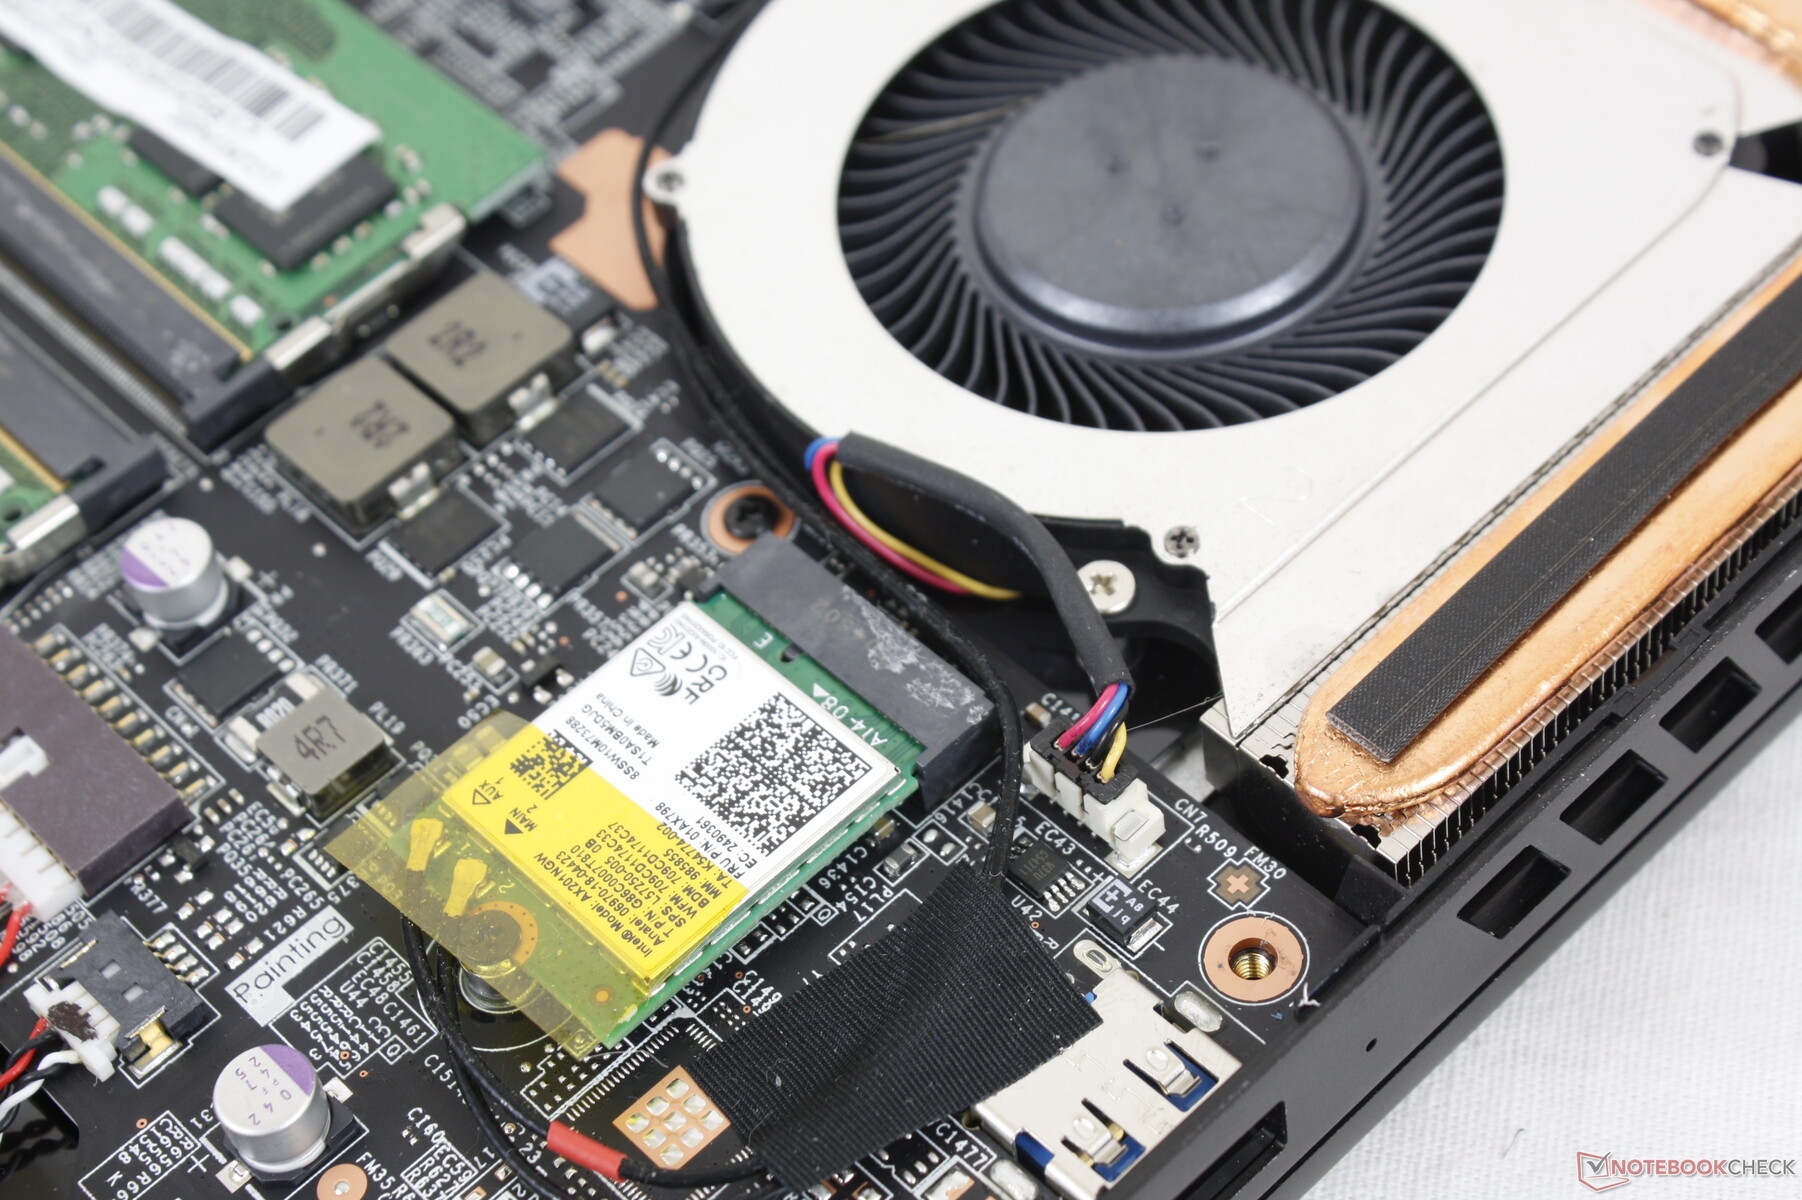
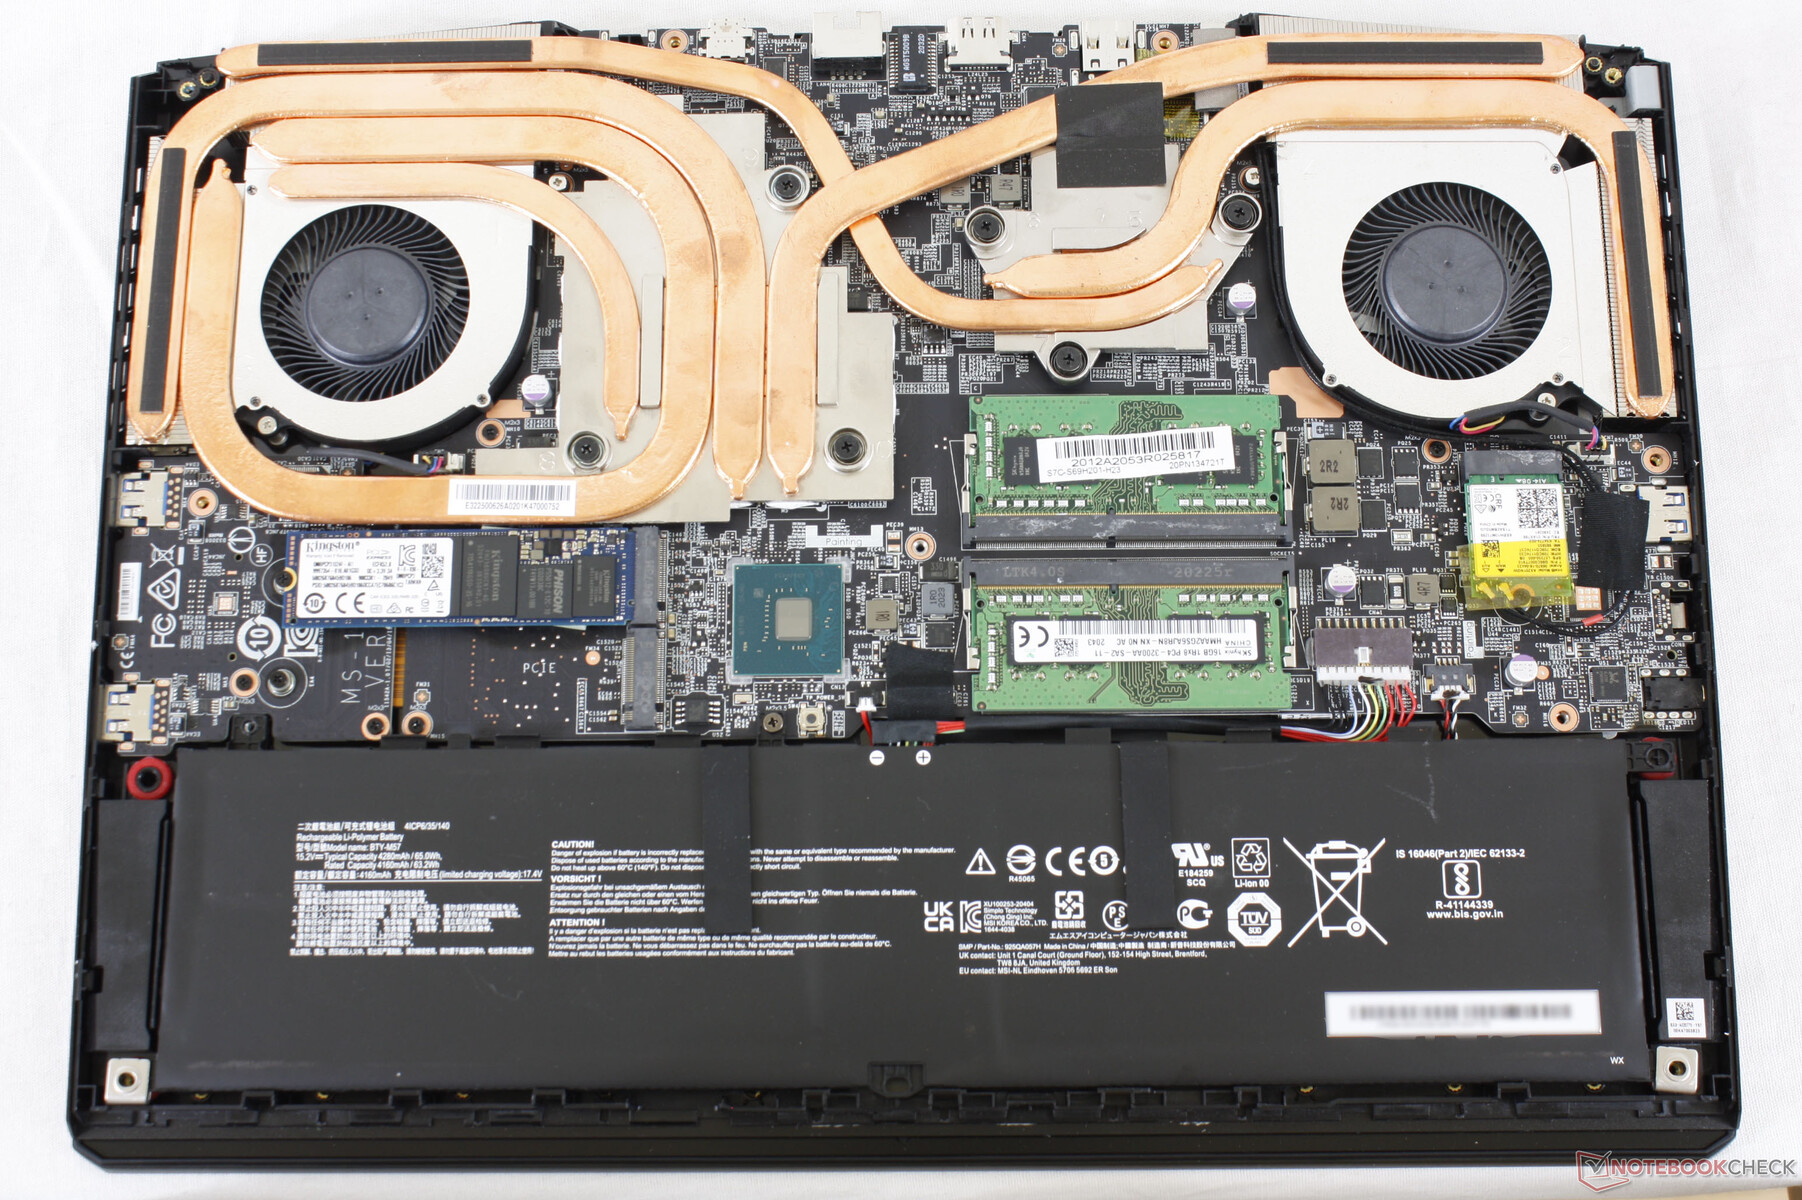
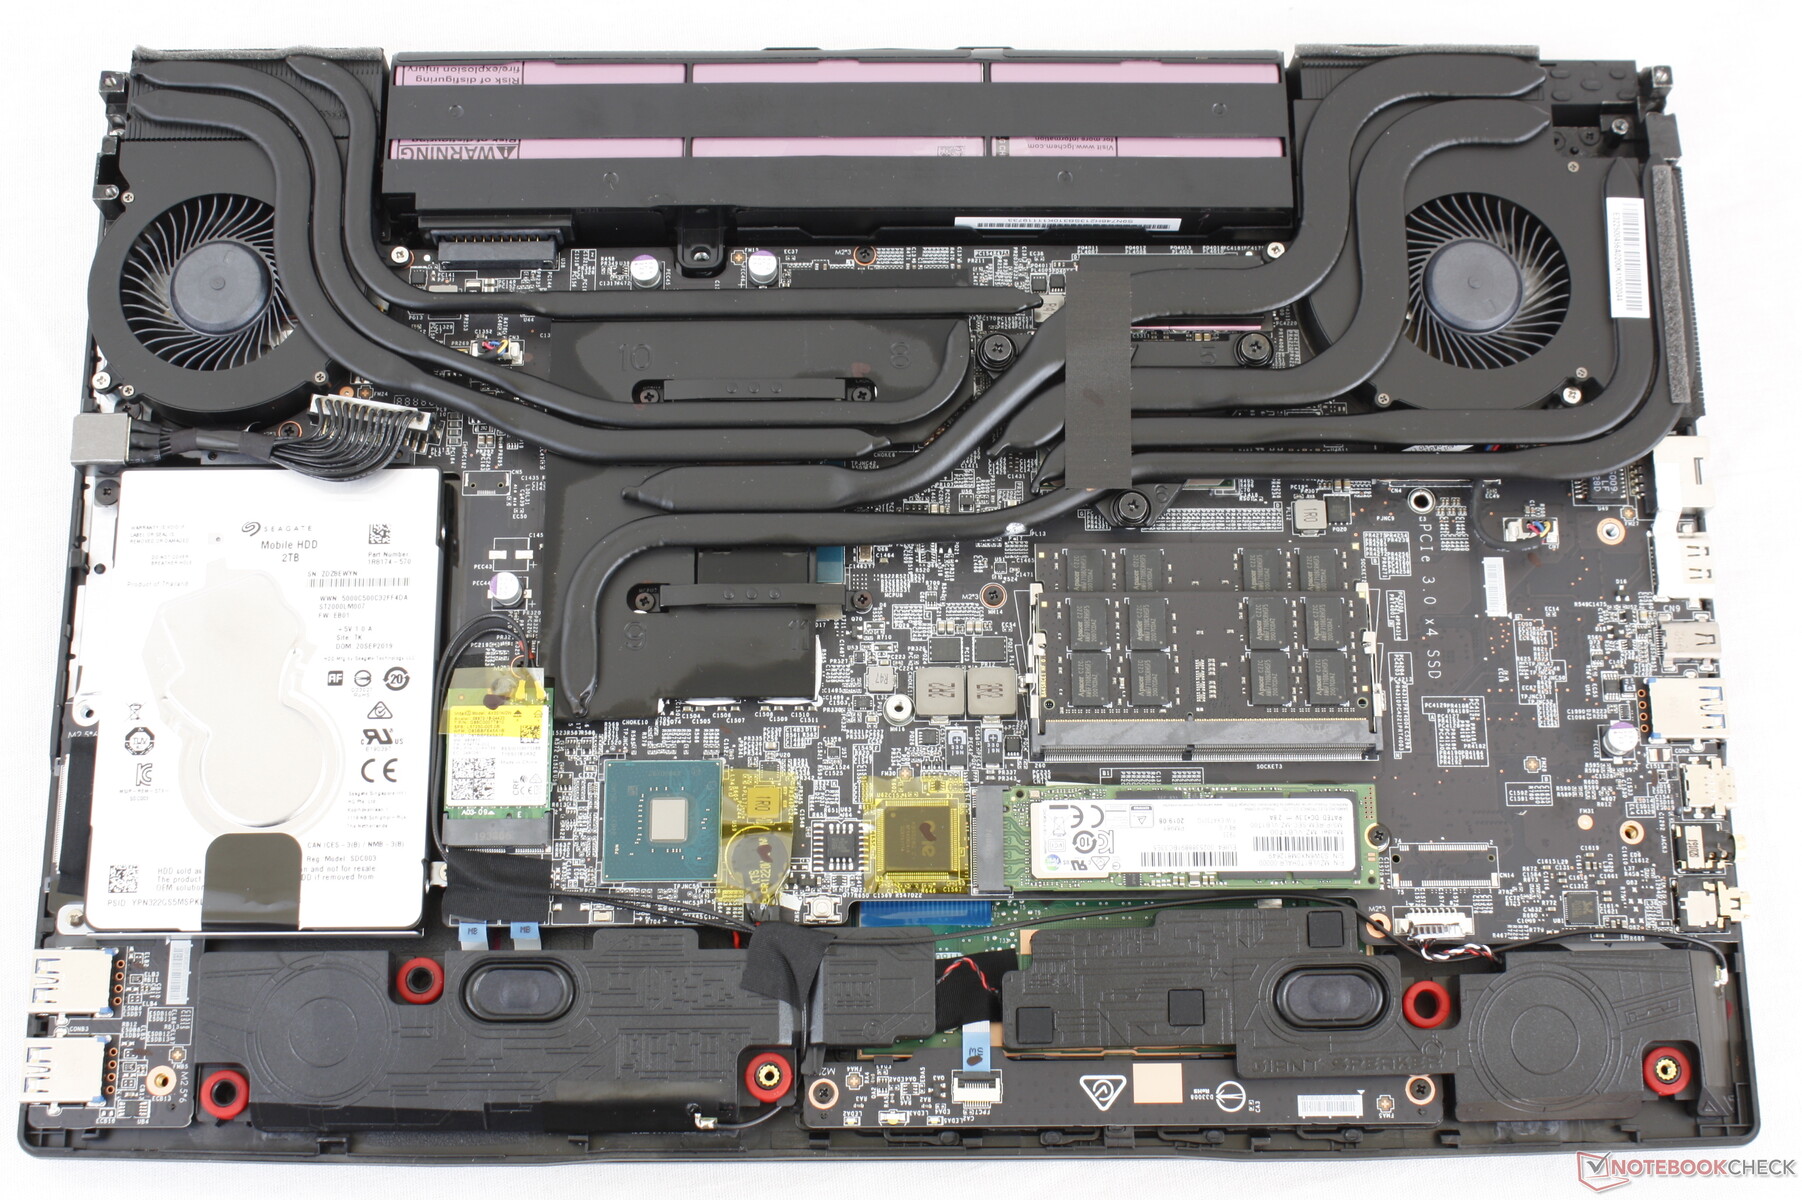
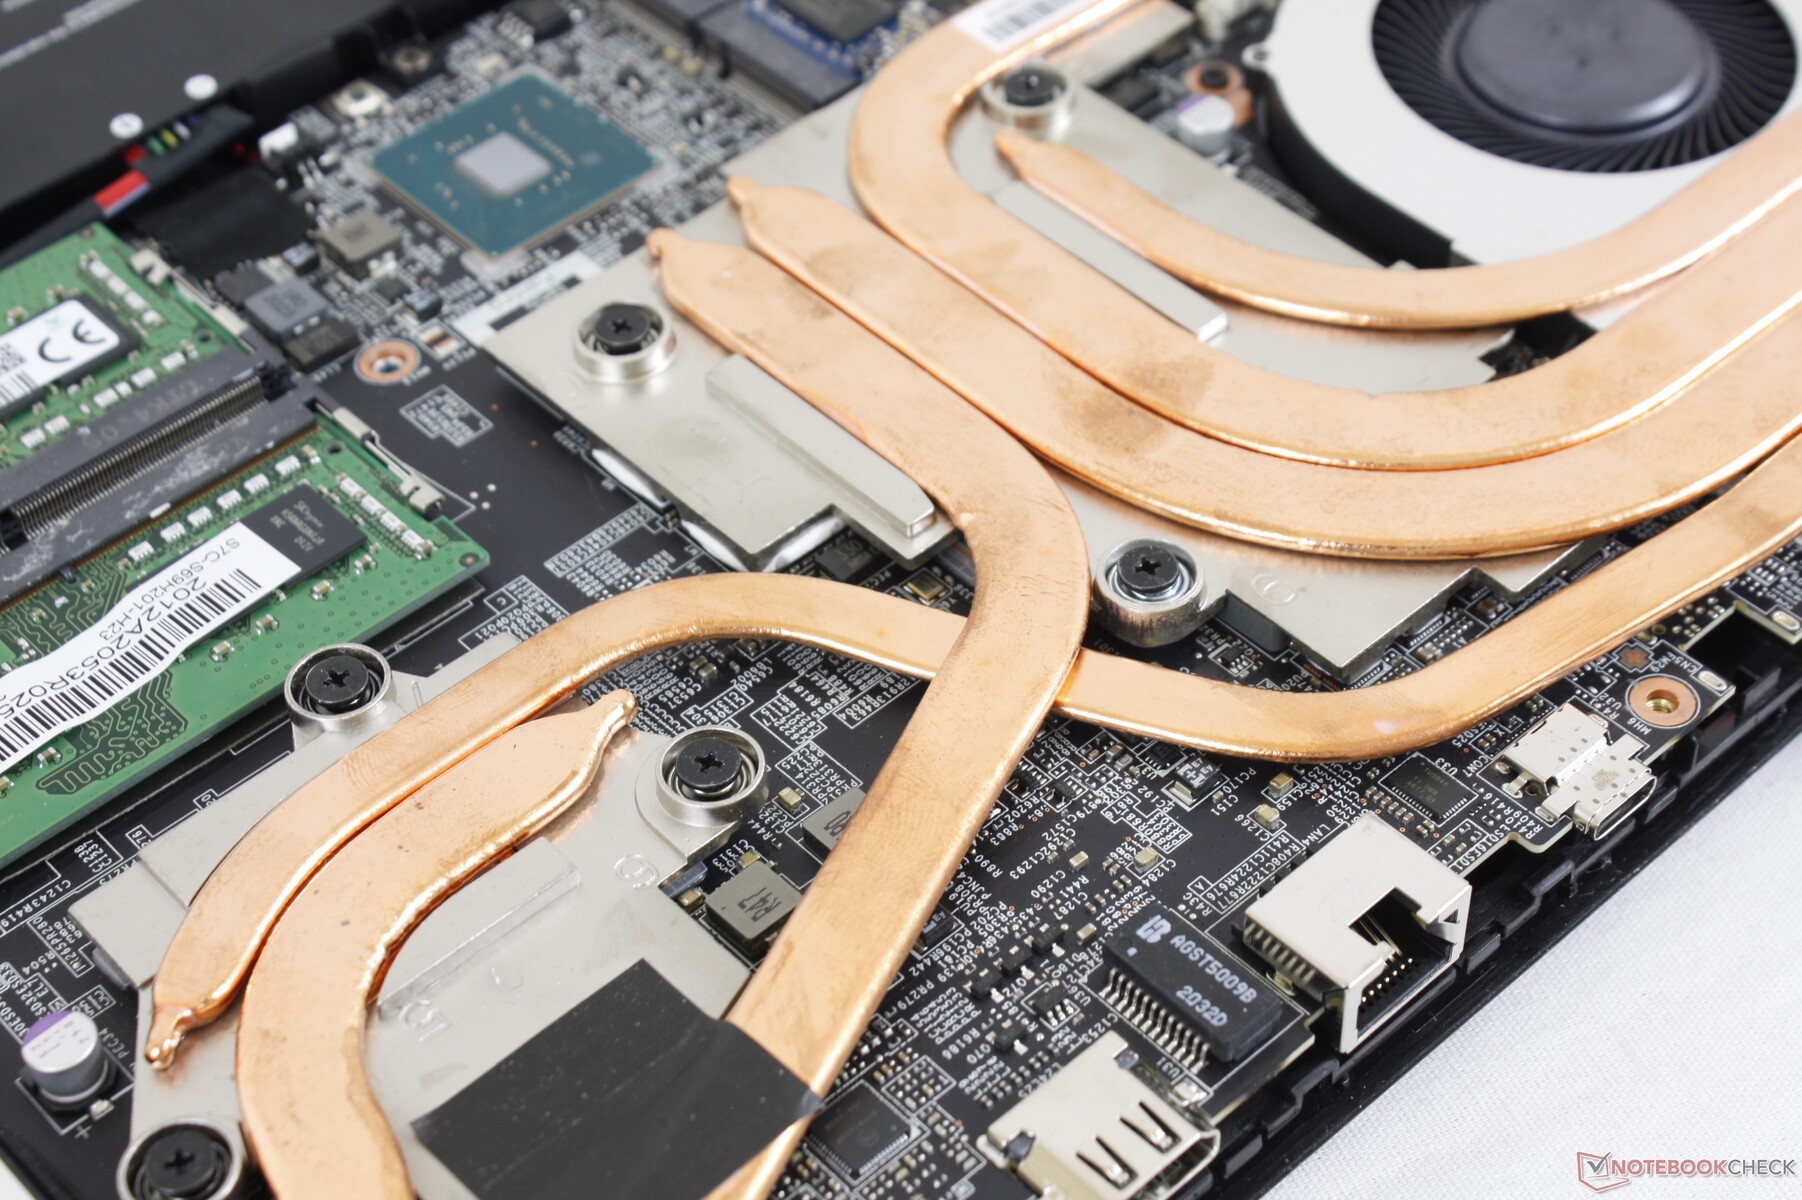
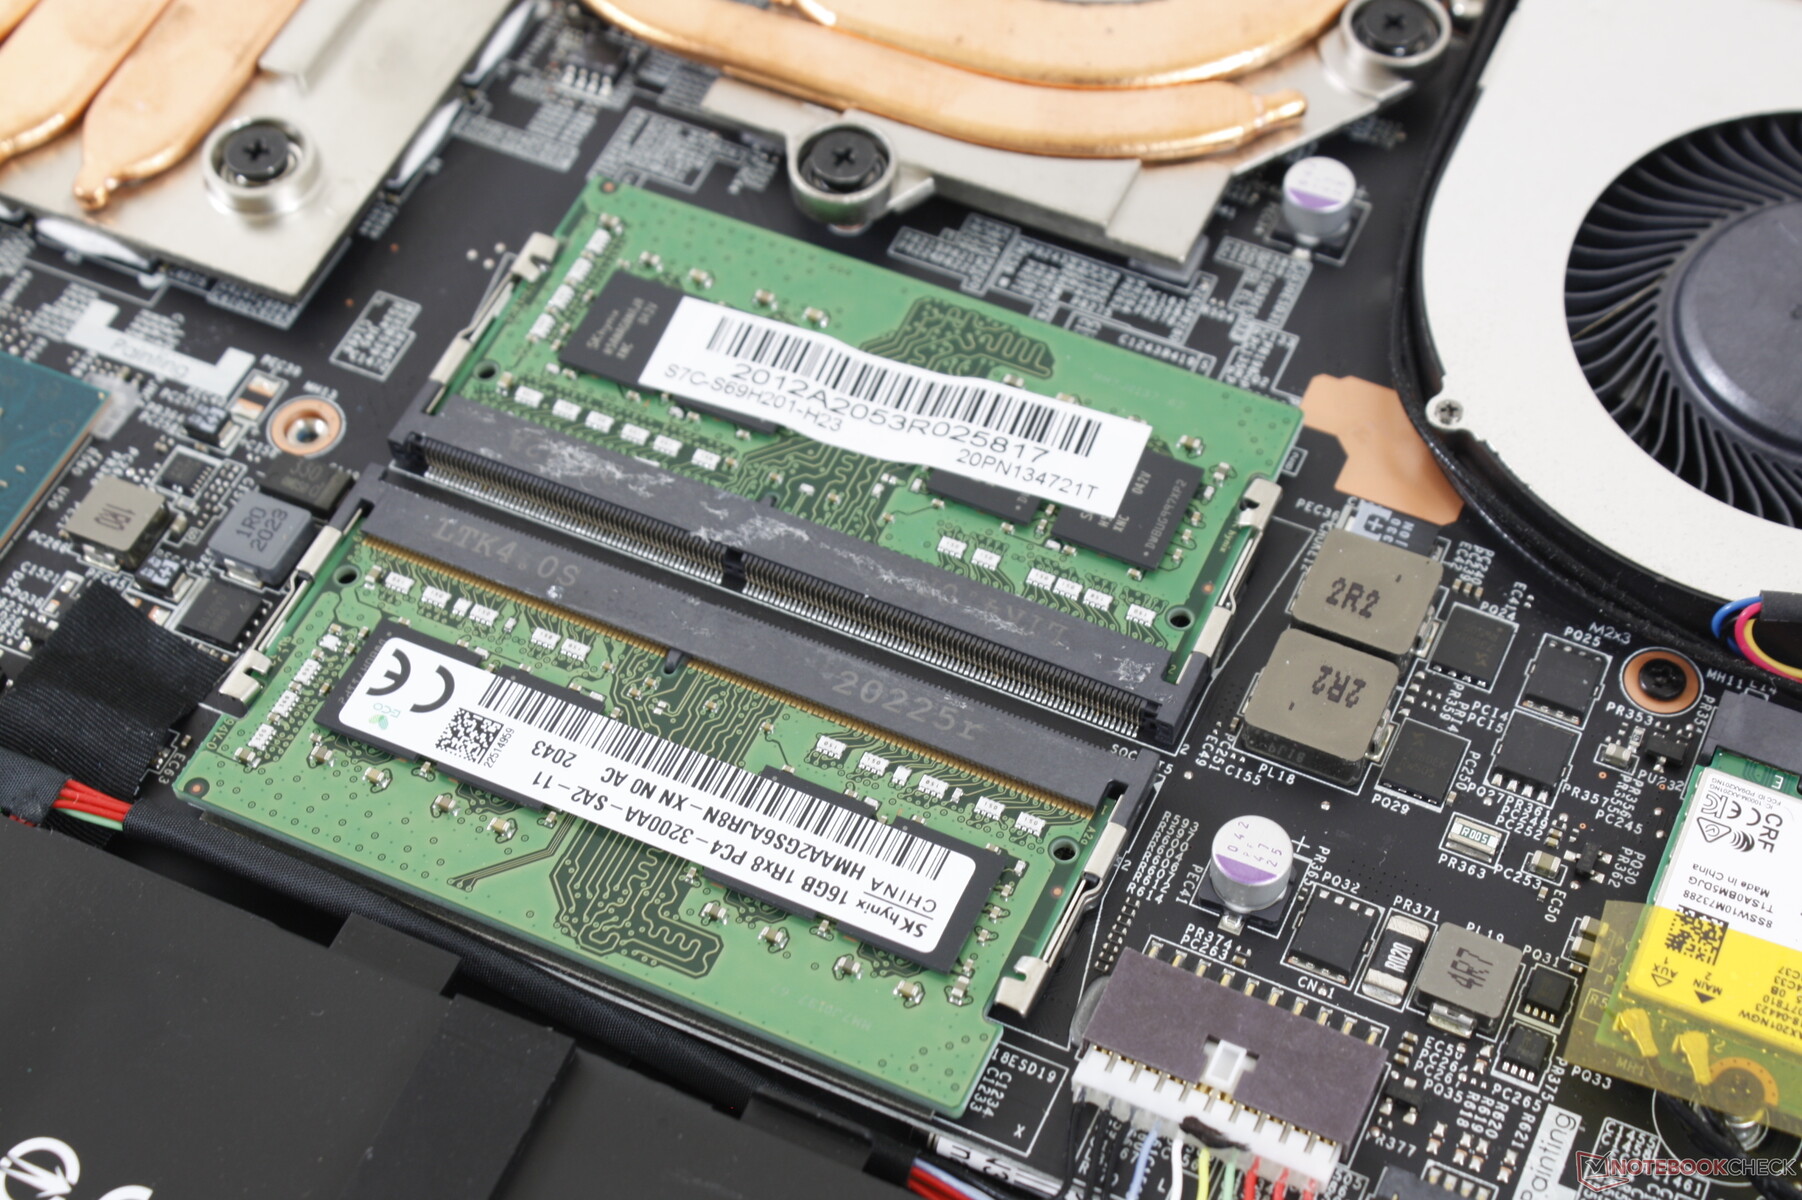
Het onderhoud is moeilijker dan bij de GP65 omdat het bodempaneel van de GP66 veel strakker is aan de randen en in de hoeken. Een scherpe rand en een voorzichtige hand zijn nodig om het paneel veilig te verwijderen. Eenmaal binnen hebben gebruikers direct toegang tot 2x M.2 2280 slots, 2x SODIMM, batterij, en de WLAN module.
Accessoires en garantie
Er zitten geen extra's in de doos, behalve de netstroomadapter en het papierwerk. Het fluwelen schoonmaakdoekje dat bij laptops uit de GS- en GT-serie wordt geleverd, is hier niet bij inbegrepen.
De standaard beperkte fabrieksgarantie van één jaar is van toepassing.
Invoerapparaten
Toetsenbord
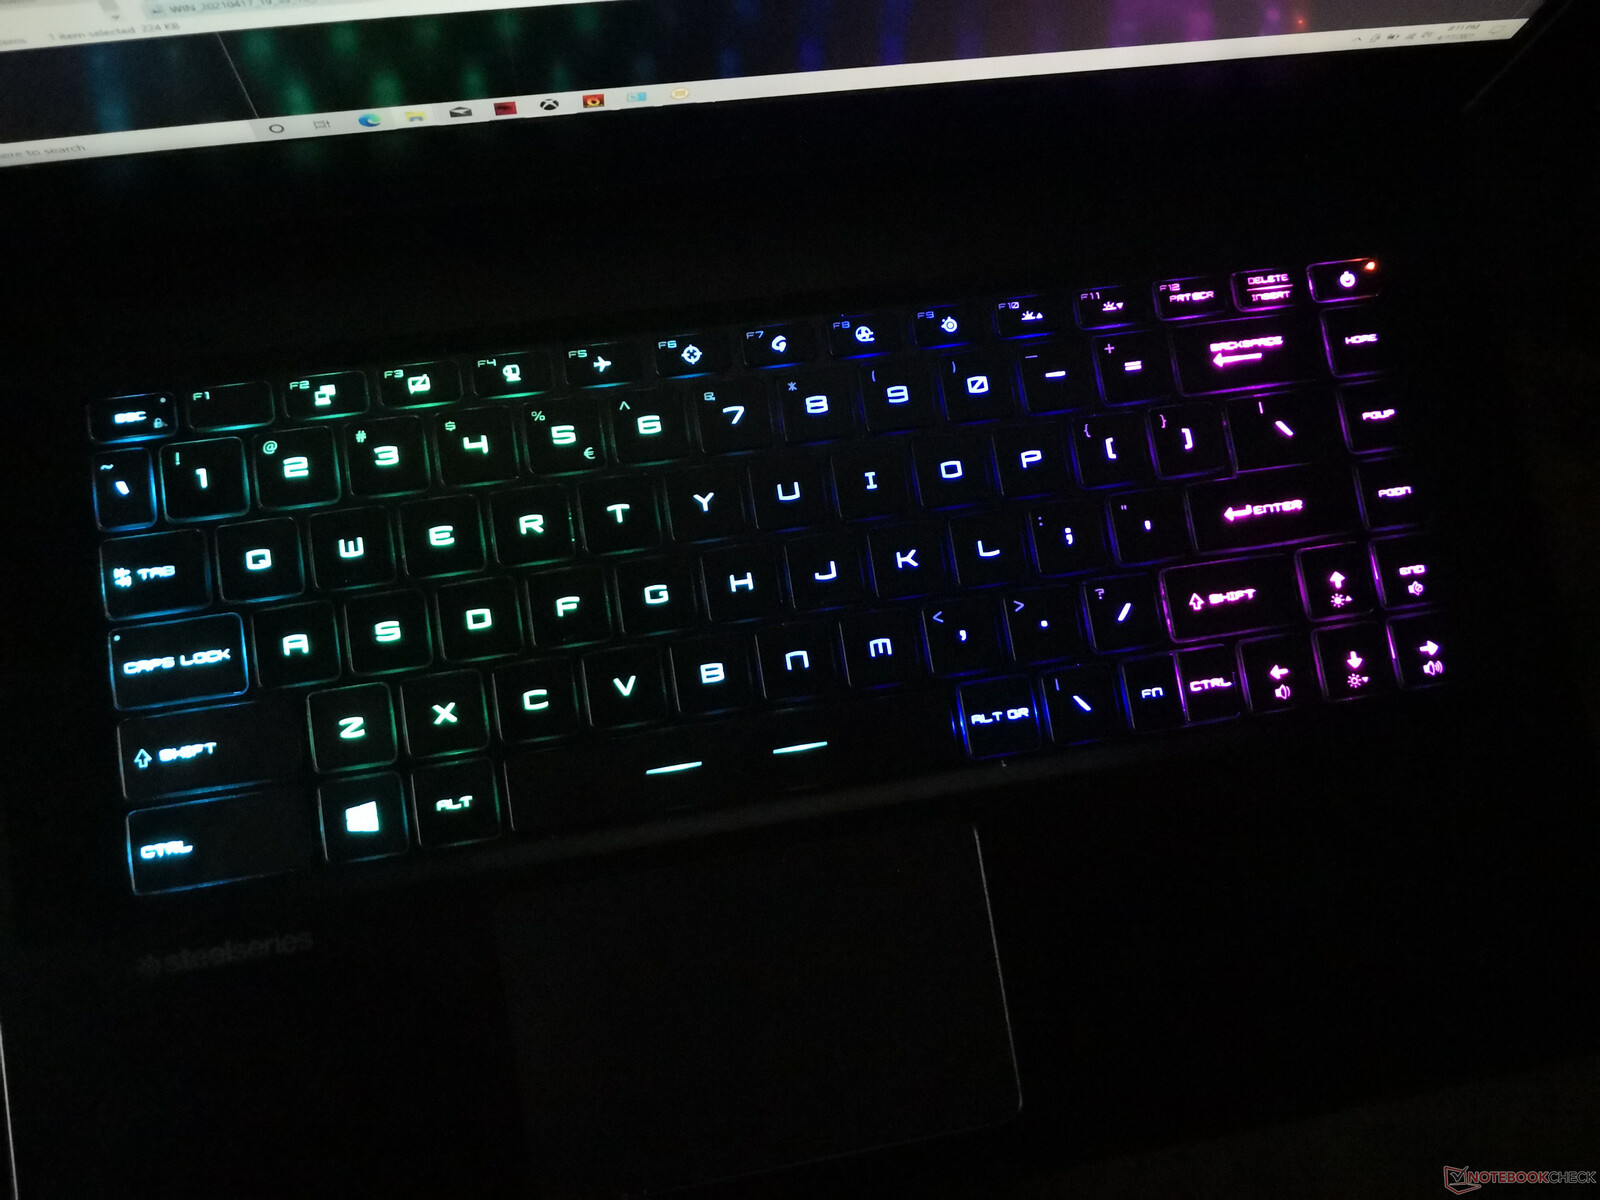
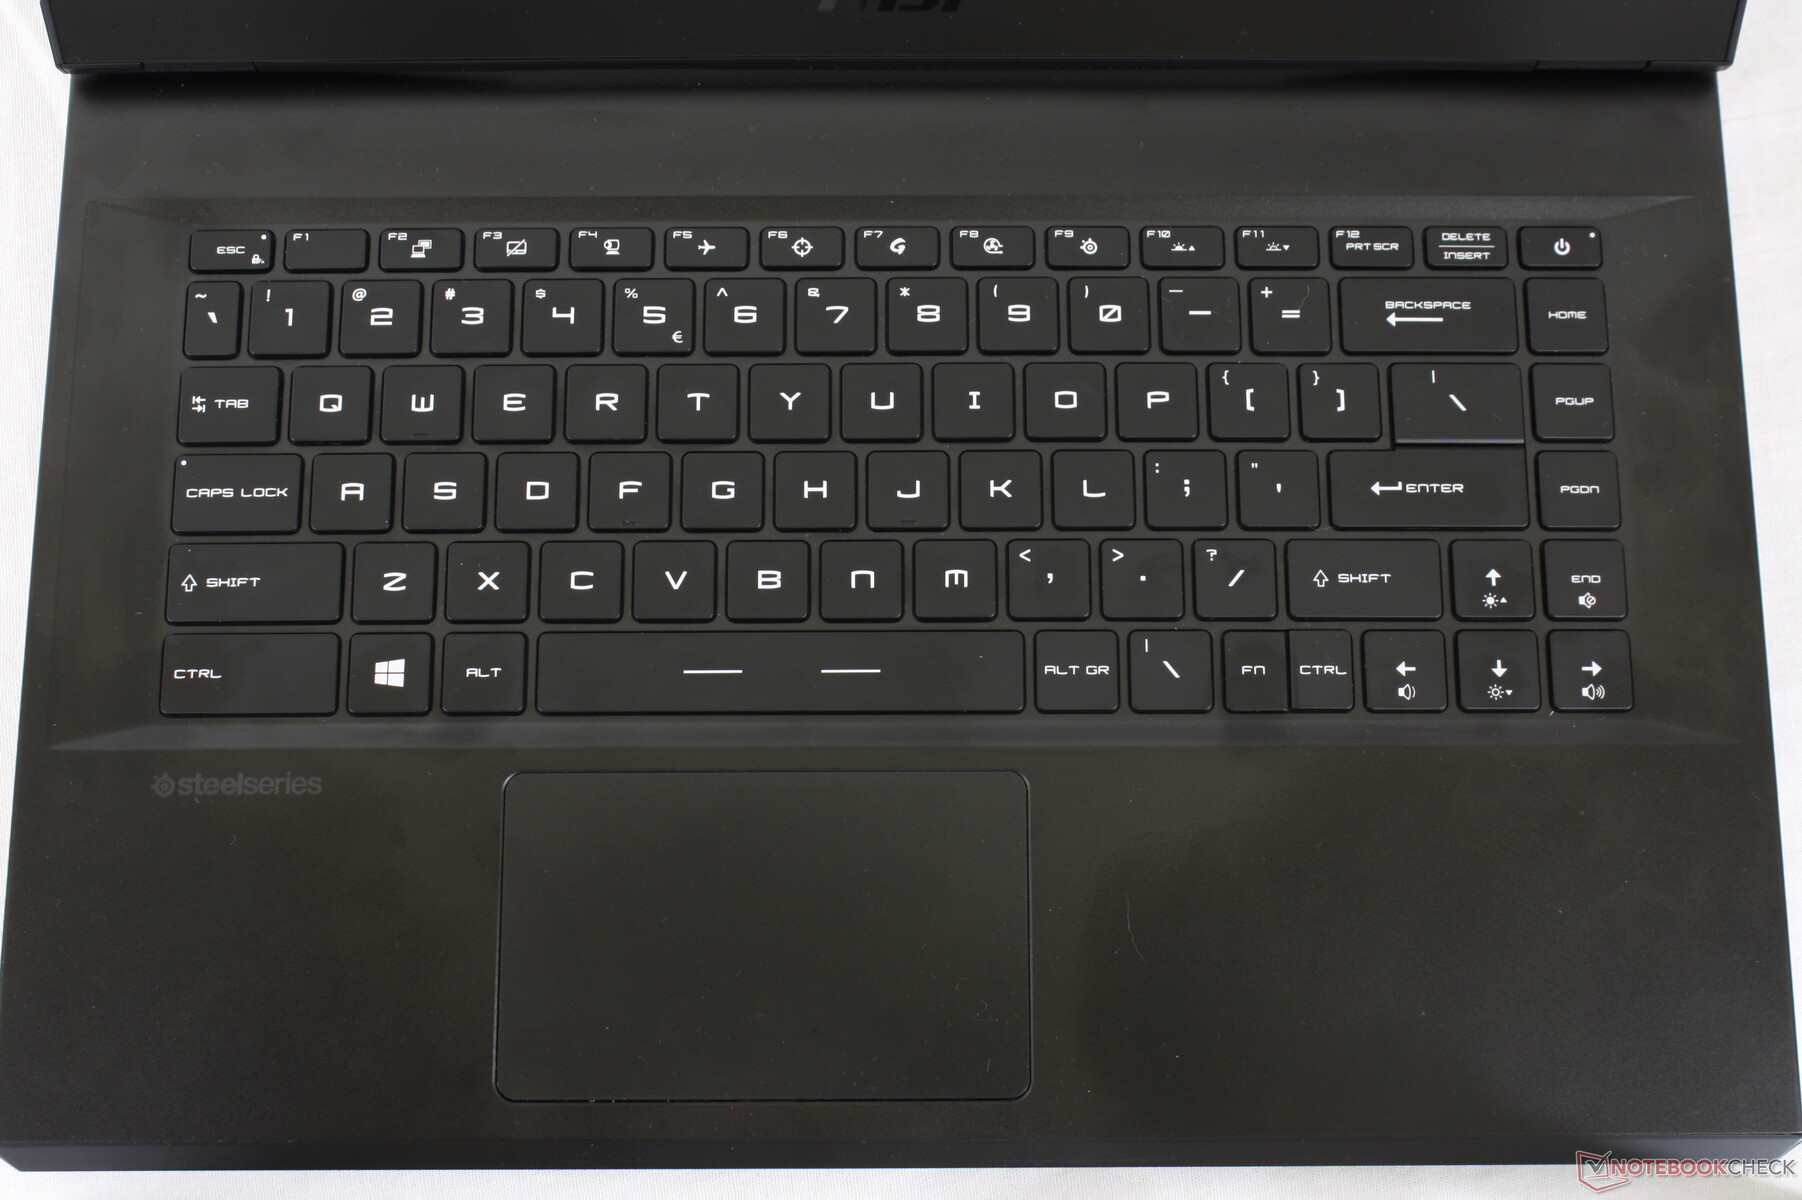
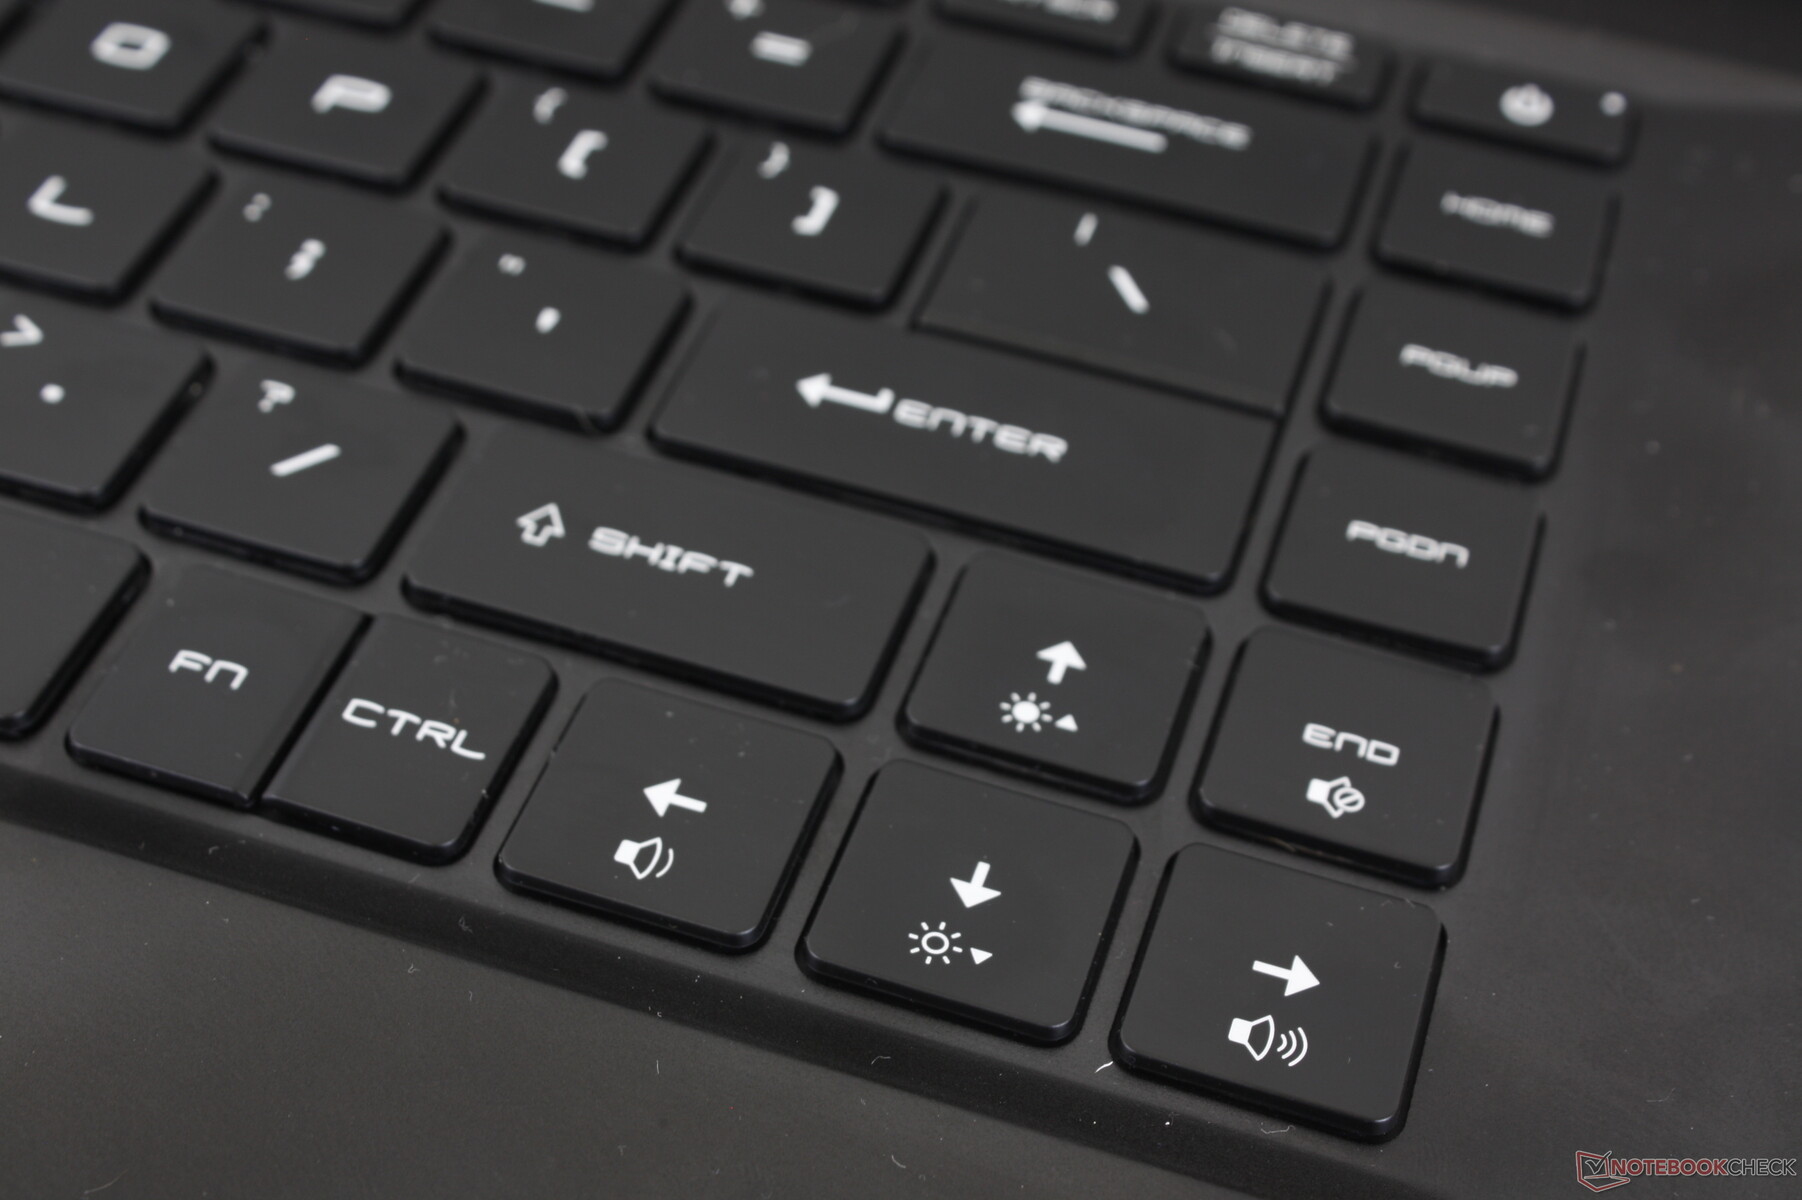
Het toetsenbord is identiek aan het toetsenbord van de GE66 en een grote verandering ten opzichte van de GP65. Het NumPad, bijvoorbeeld, is nu verdwenen en de aanslag voelt korter aan met in ruil daarvoor een scherpere feedback. Het gekletter is ook iets luider en hoger dan voorheen, vooral bij de spatiebalk en de Enter-toets
De RGB-verlichting per toets is terug. De verlichting zou echter uniformer kunnen zijn, aangezien de secundaire toetssymbolen (zoals !, @, #, enzovoort) niet zo helder oplichten als de hoofdsymbolen (1, 2, 3, enzovoort).
Touchpad
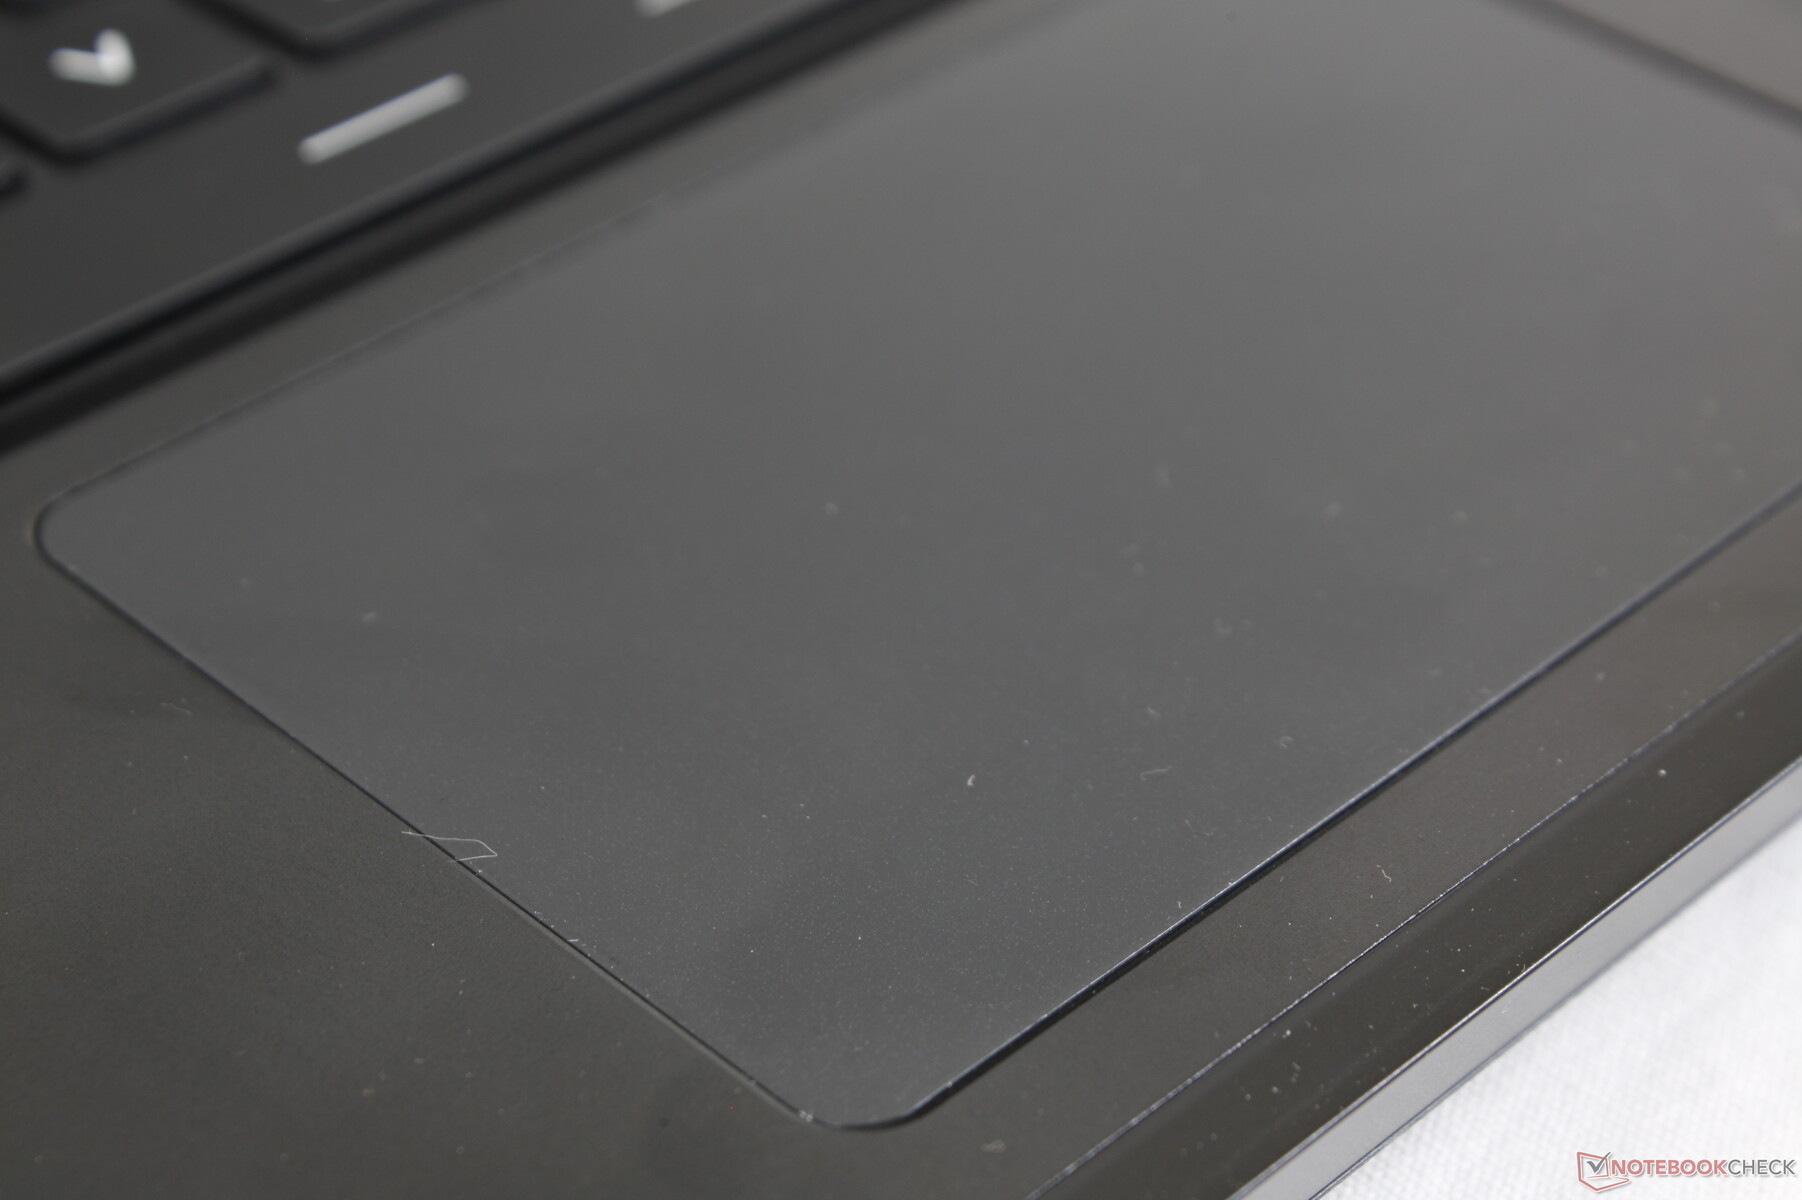
Het plastic clickpad is relatief klein (10,5 x 6,5 cm), glijdt soepel bij gemiddelde snelheden en blijft een beetje hangen bij lagere snelhedenvoor nauwkeurigere klikken. De geïntegreerde kliktoetsen zijn sponsachtig en ze vereisen meer kracht dan normaal om te registreren, wat vermoeiend kan worden als je geen externe muis hebt. Hoewel het nieuwe clickpad bruikbaar is, missen we de speciale muisknoppen en het stevigere clickpad van de oudere GP65.

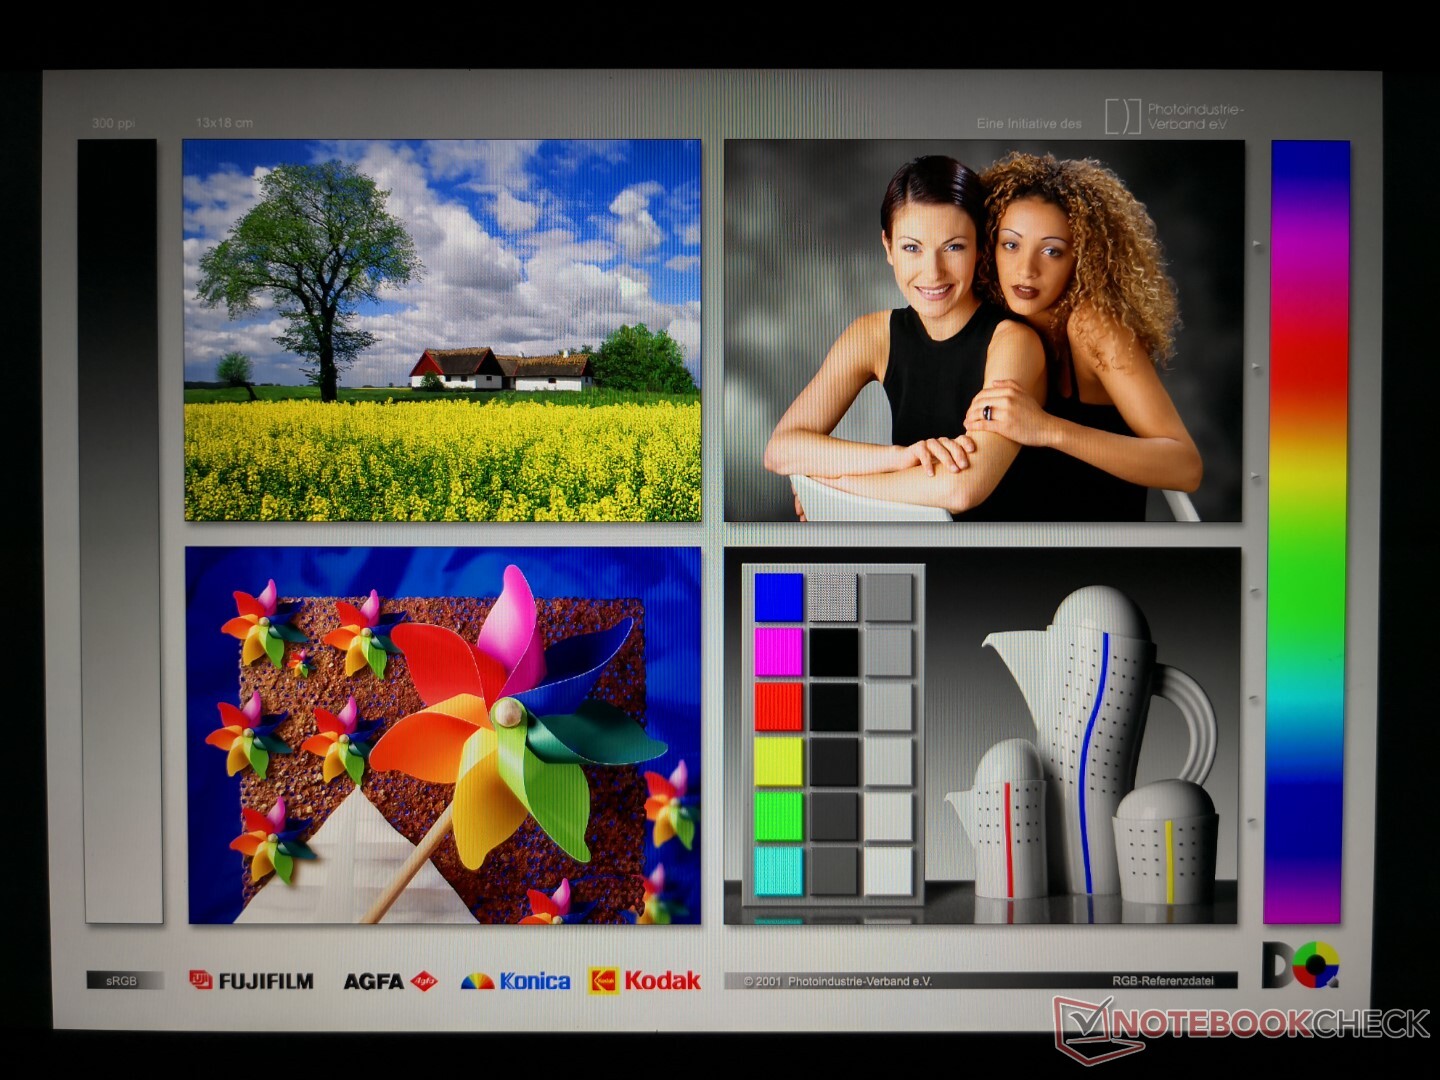
Weergave
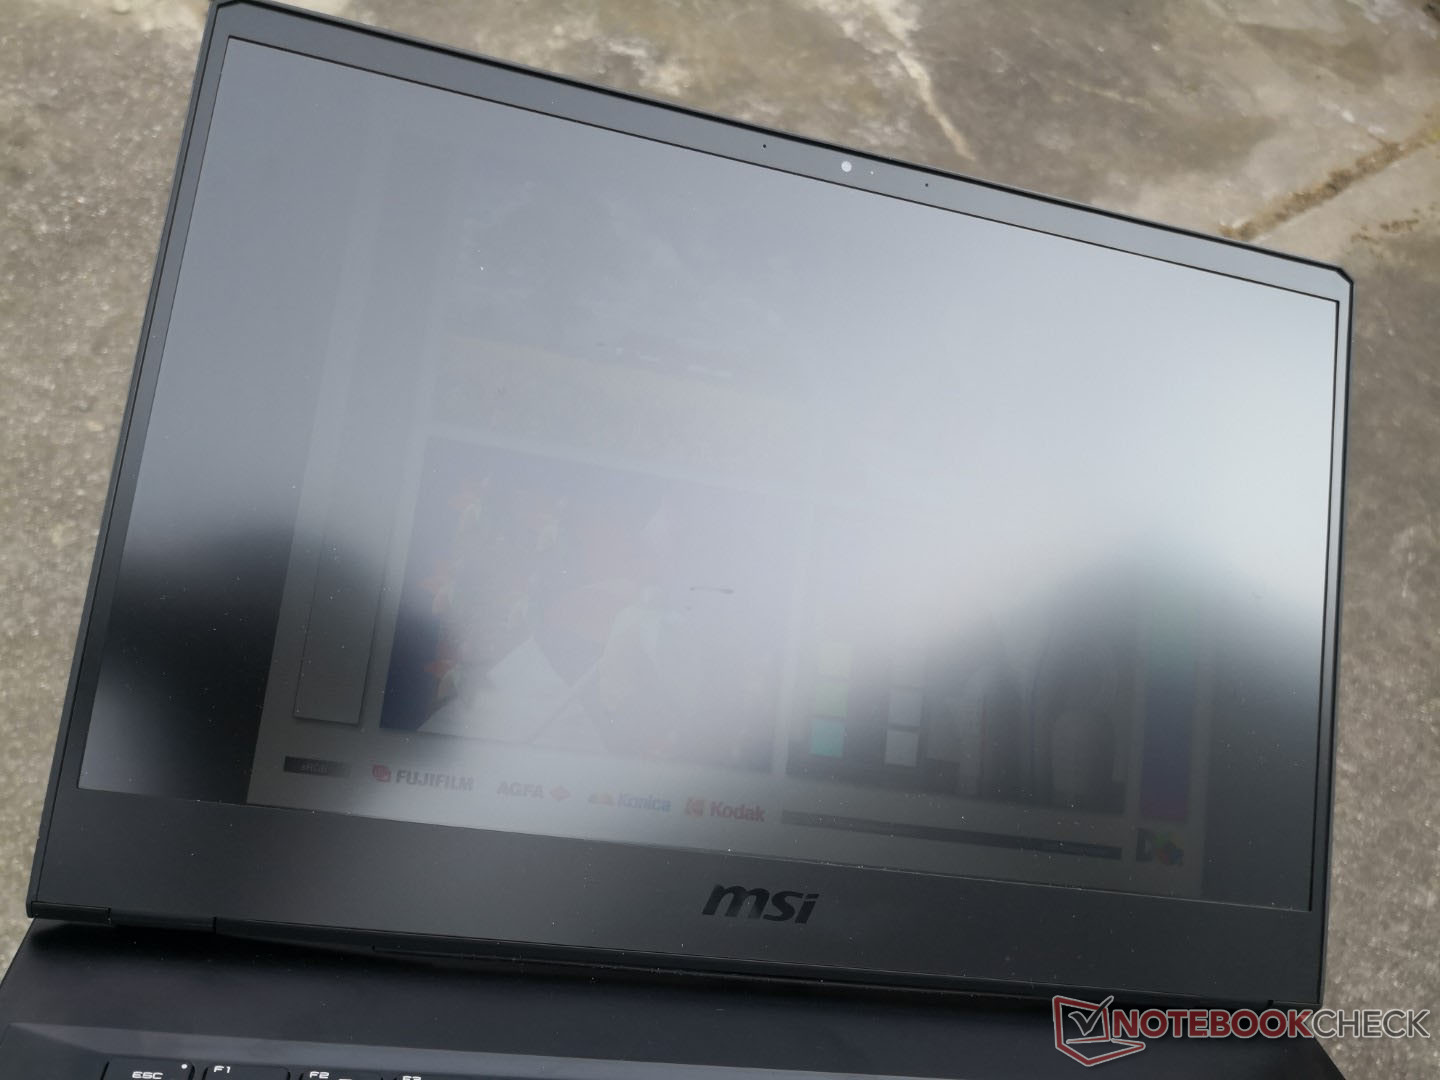
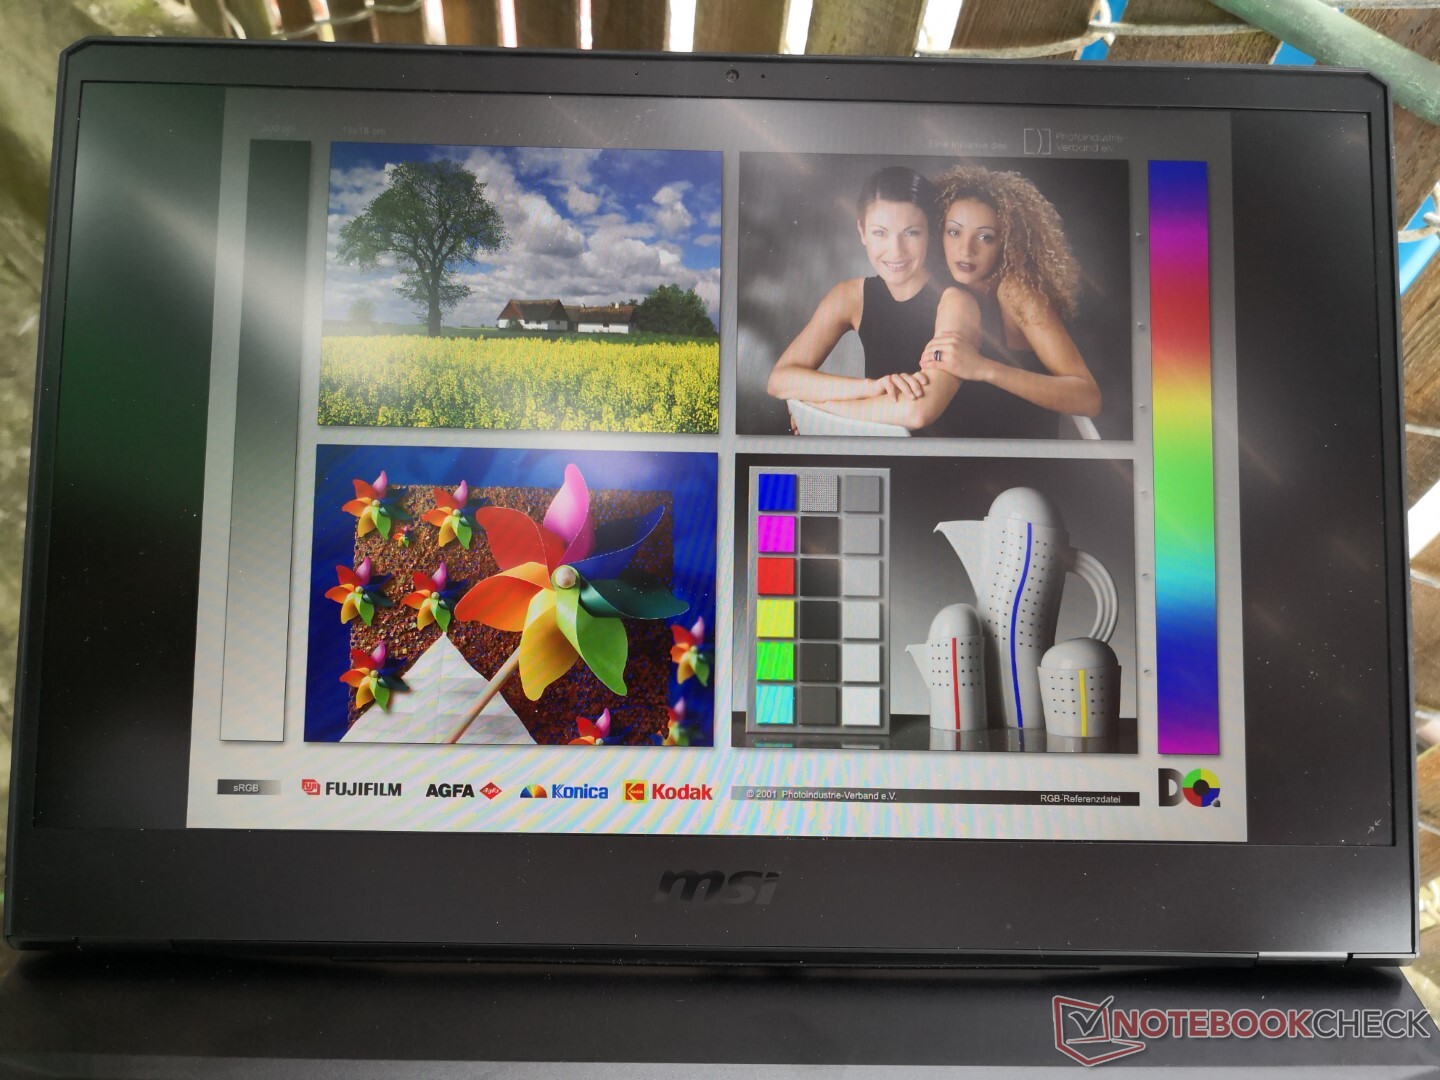
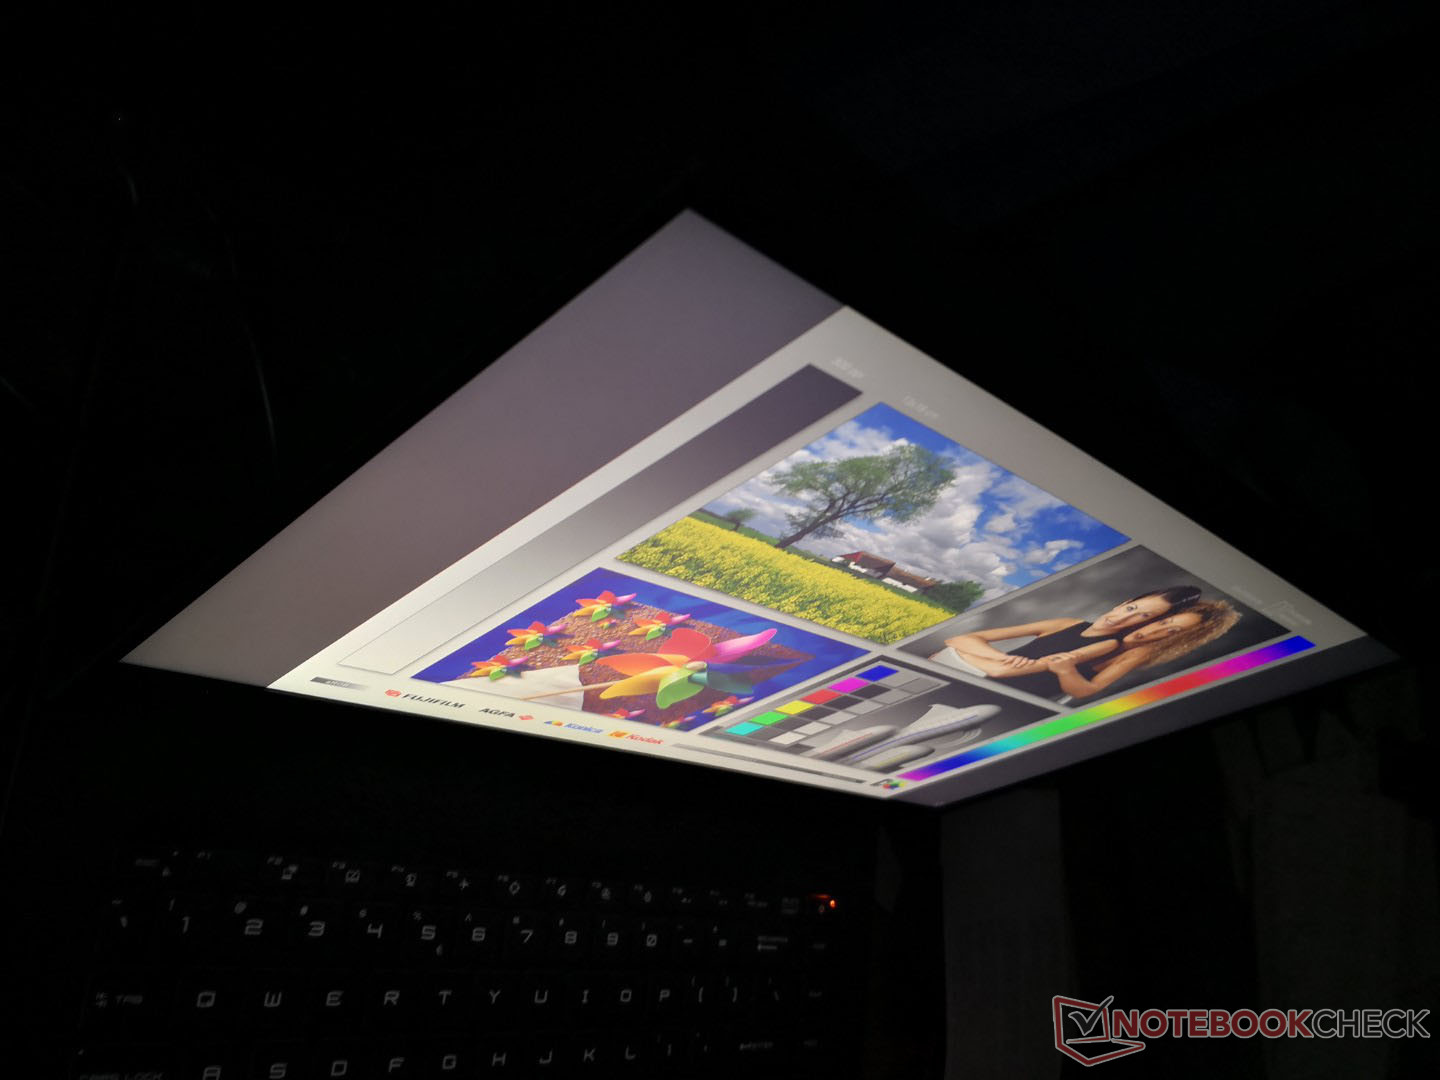
Onze GP66 10UG configuratie maakt gebruik van hetzelfde 240 Hz Sharp LQ156M1JW03 paneel dat ook in de GE66 10SFS zit, GS65 Stealth 9SG, Razer Blade 15, en Aorus 15P XC. Kleuren, contrast en responstijden zijn dus vergelijkbaar tussen al deze laptops, wat een goede zaak is aangezien veel van deze modellen high-end gaming systemen zijn.
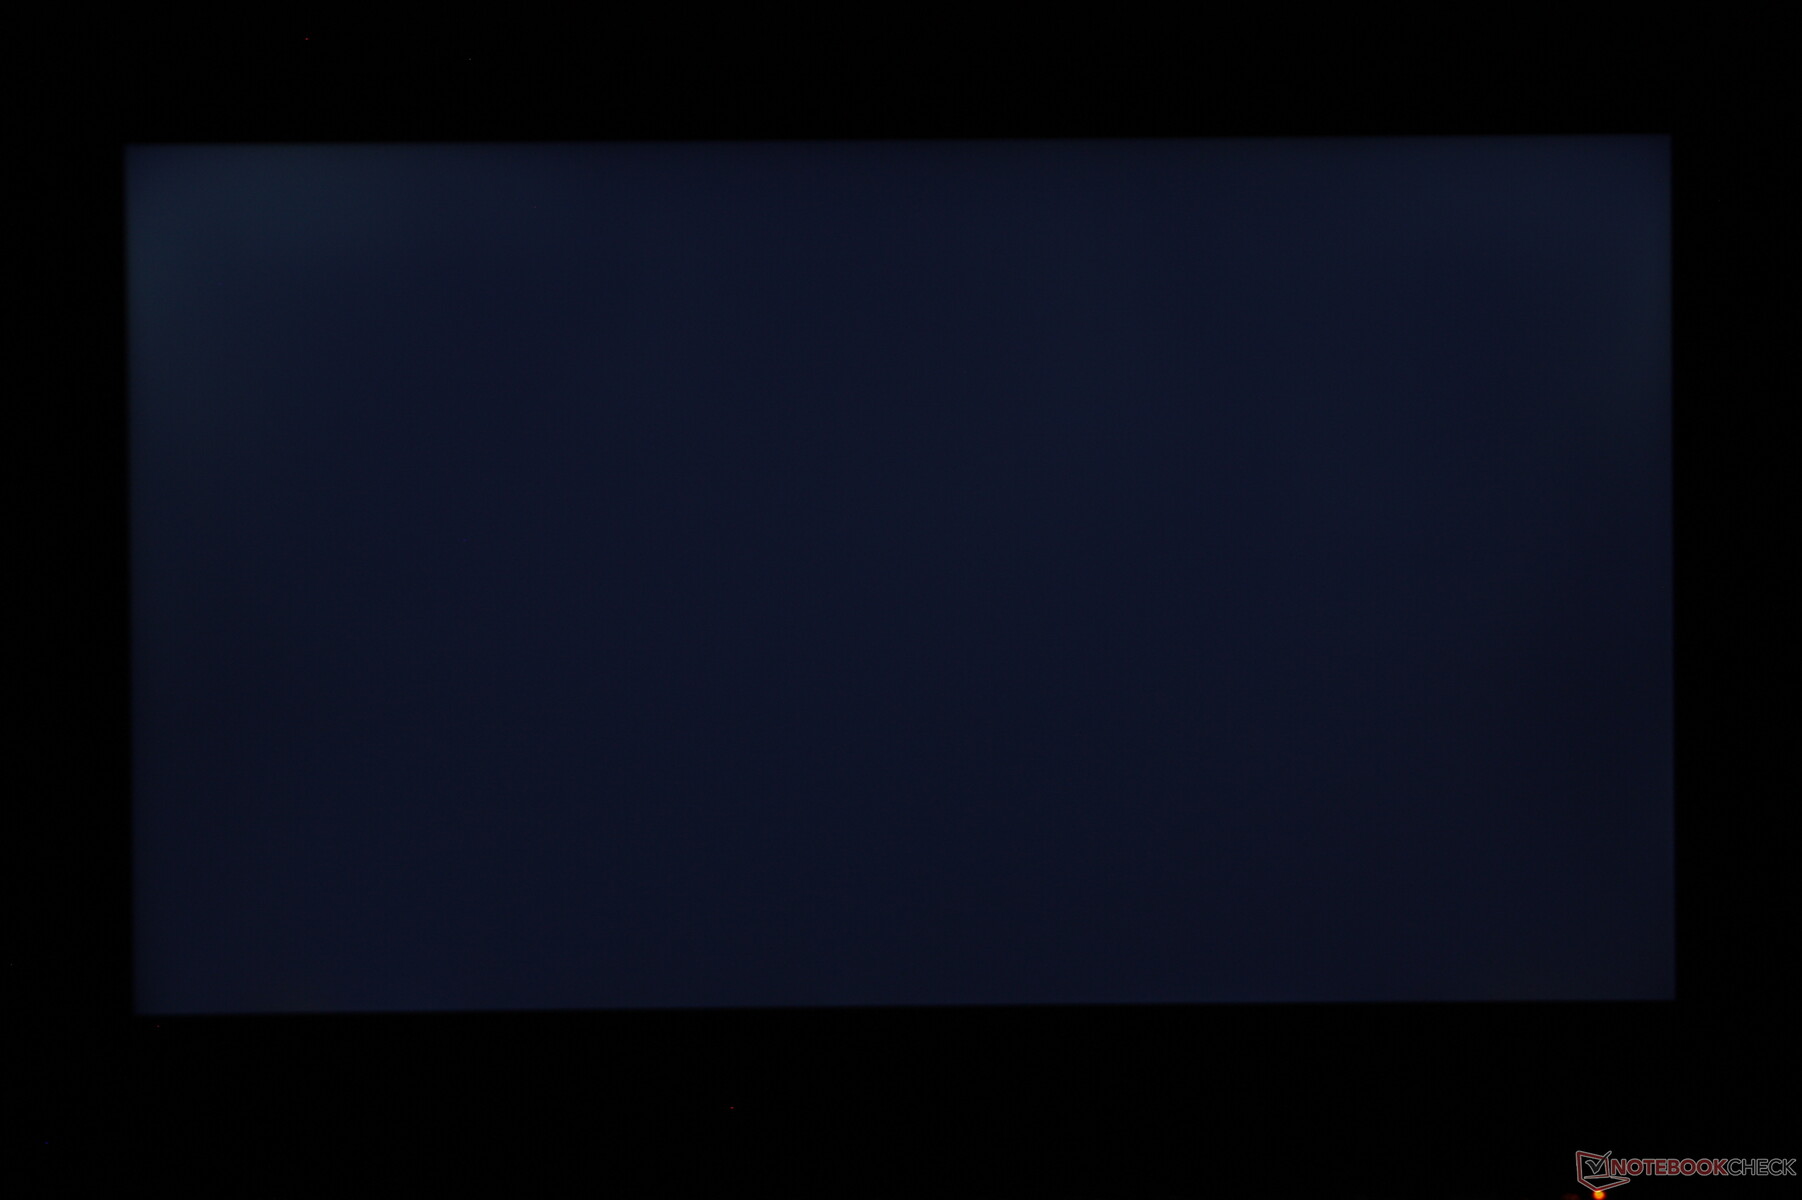
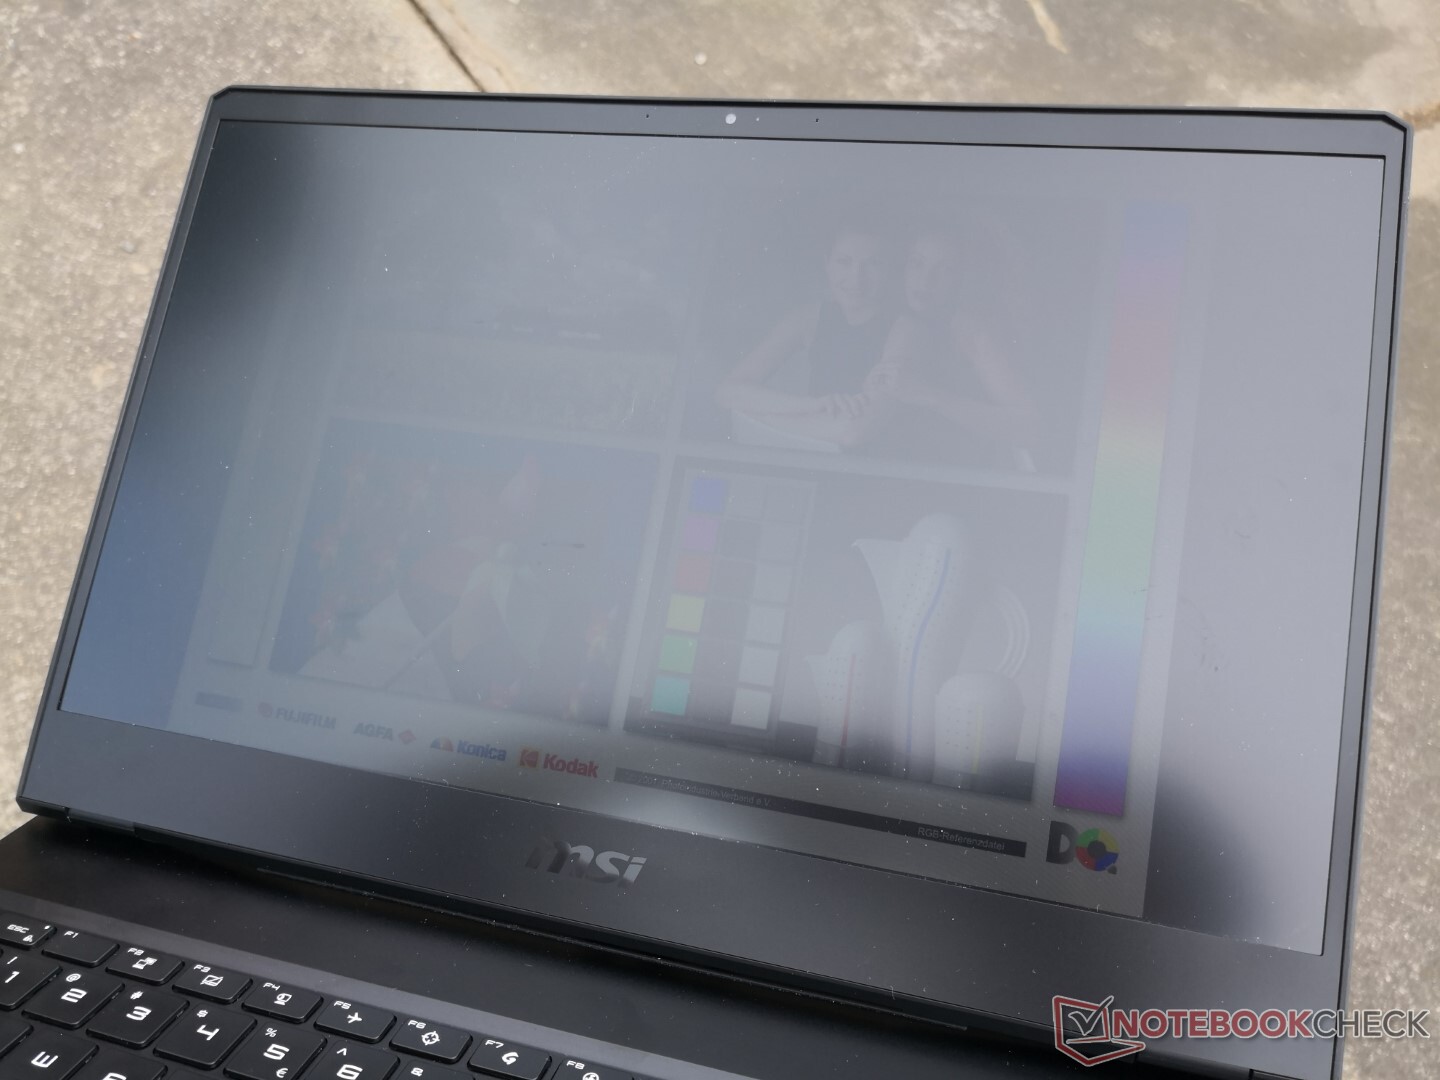
Een belangrijk verschil tussen het GP66-scherm en de eerder genoemde laptops is dat het merkbaar lichter is. De maximale helderheid komt uit op ongeveer 210 nits, terwijl de meeste andere gaming laptops 300 nits of meer hebben.
| |||||||||||||||||||||||||
Helderheidsverdeling: 83 %
Helderheid in Batterij-modus: 225.9 cd/m²
Contrast: 982:1 (Zwart: 0.23 cd/m²)
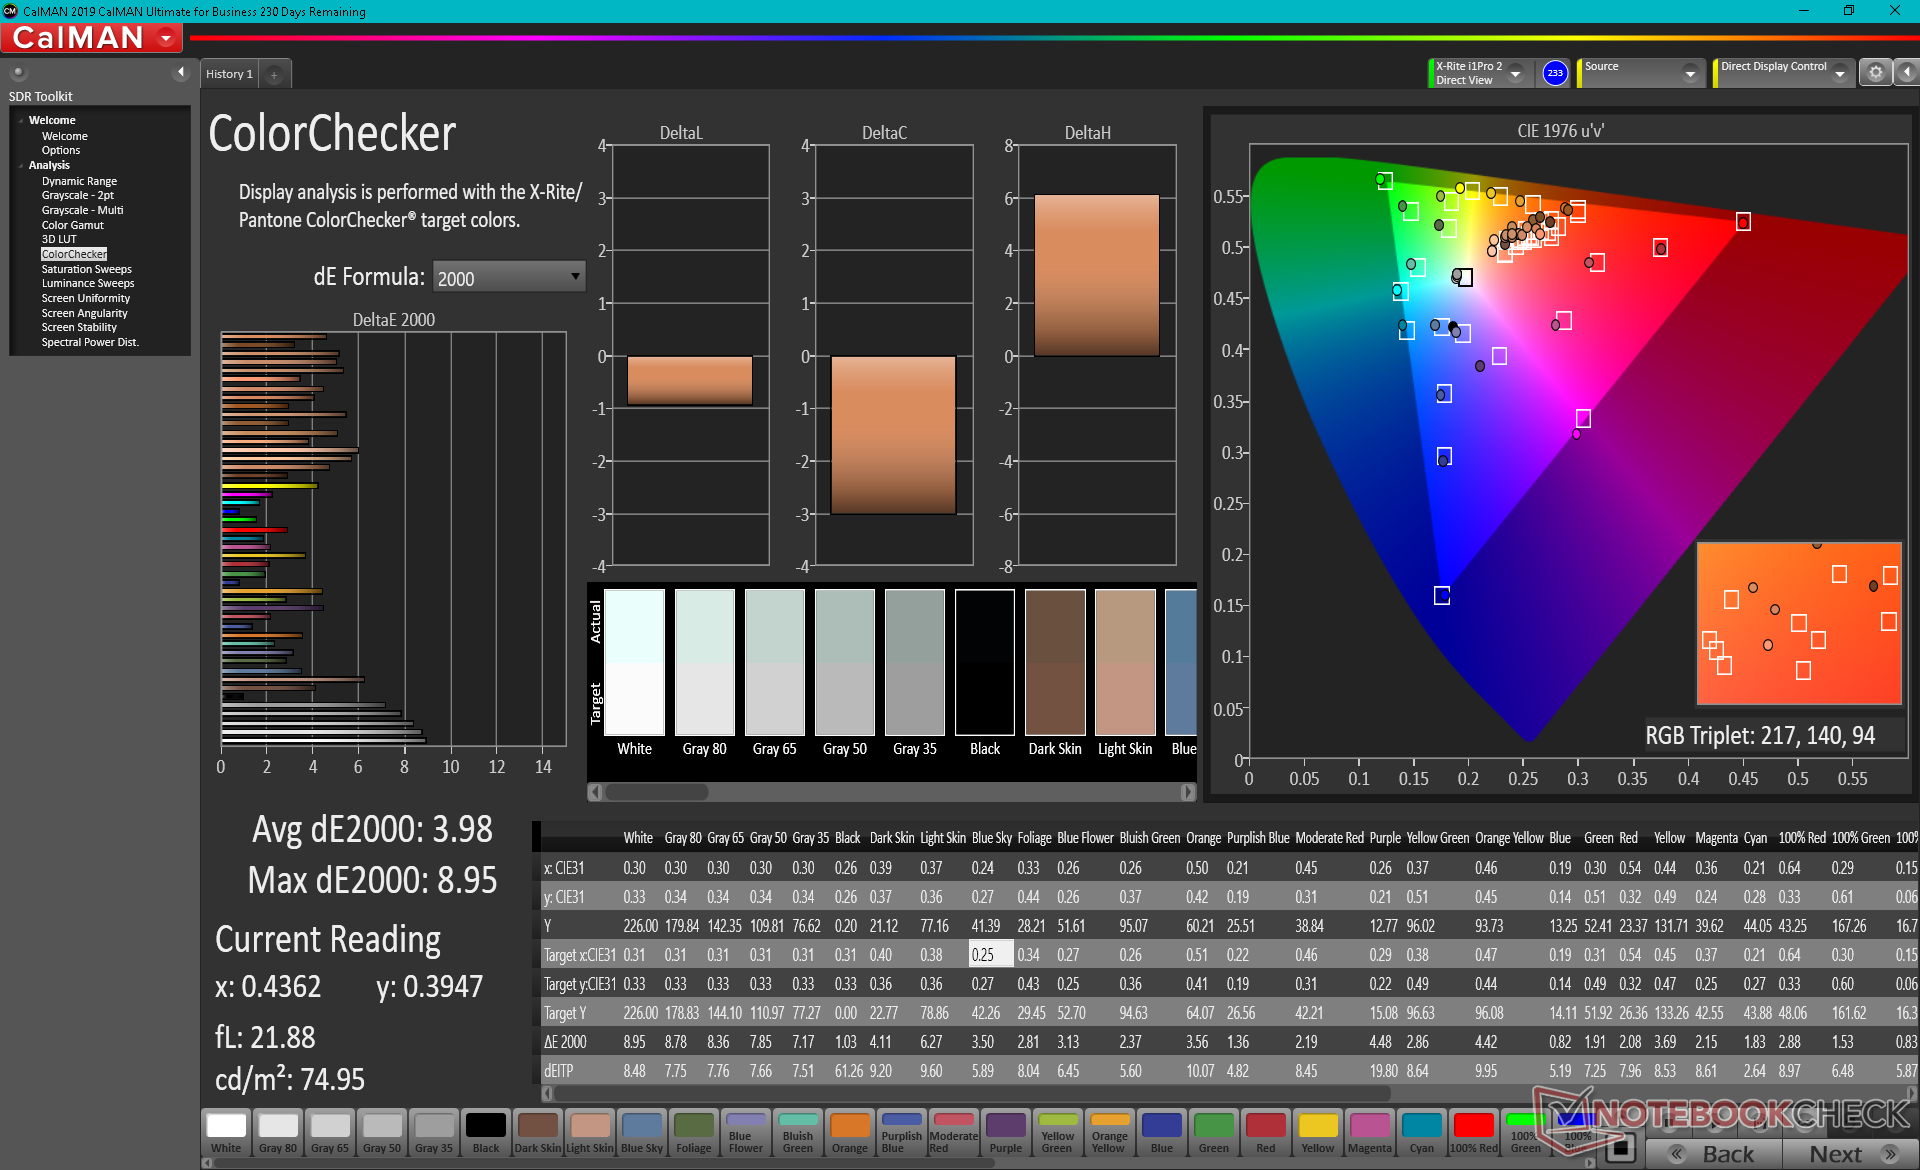
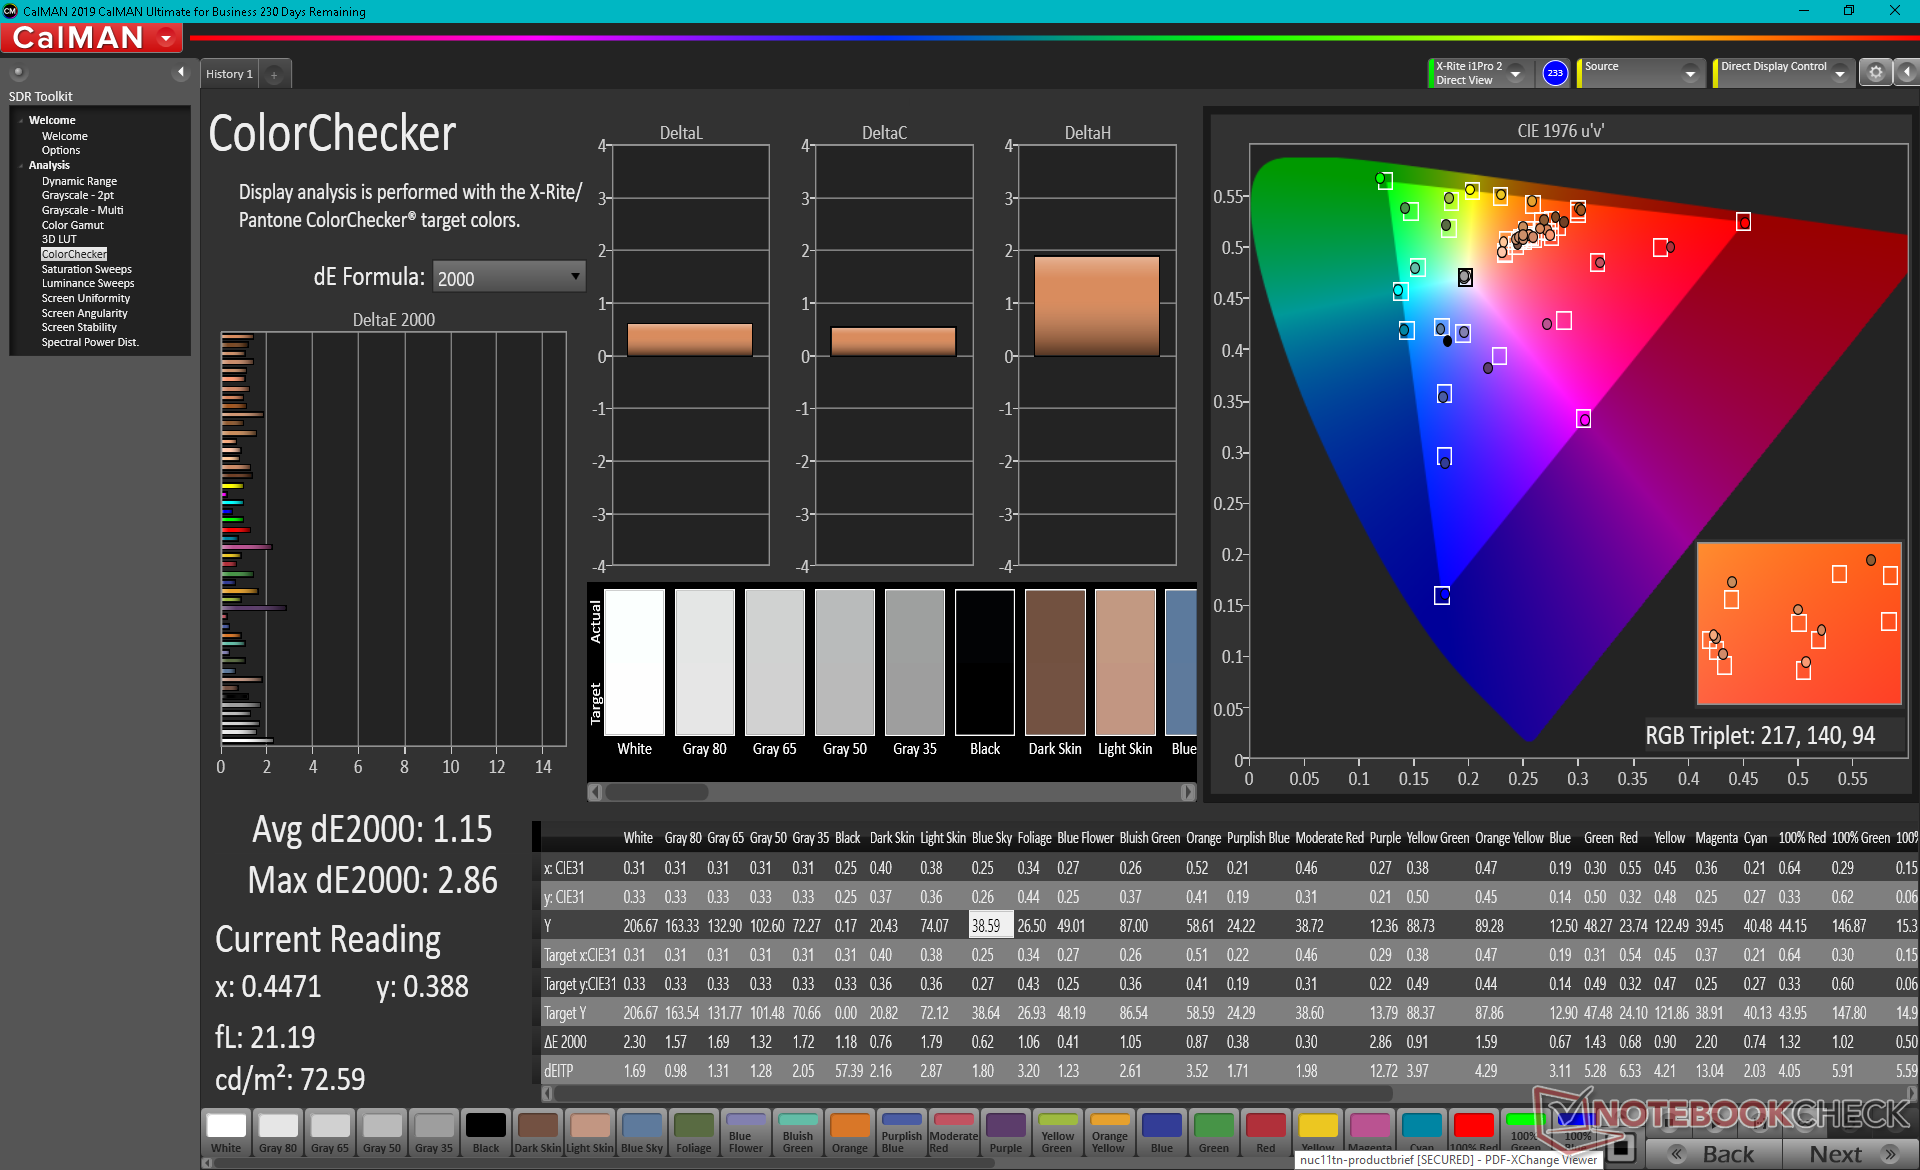
ΔE ColorChecker Calman: 3.98 | ∀{0.5-29.43 Ø4.71}
calibrated: 1.15
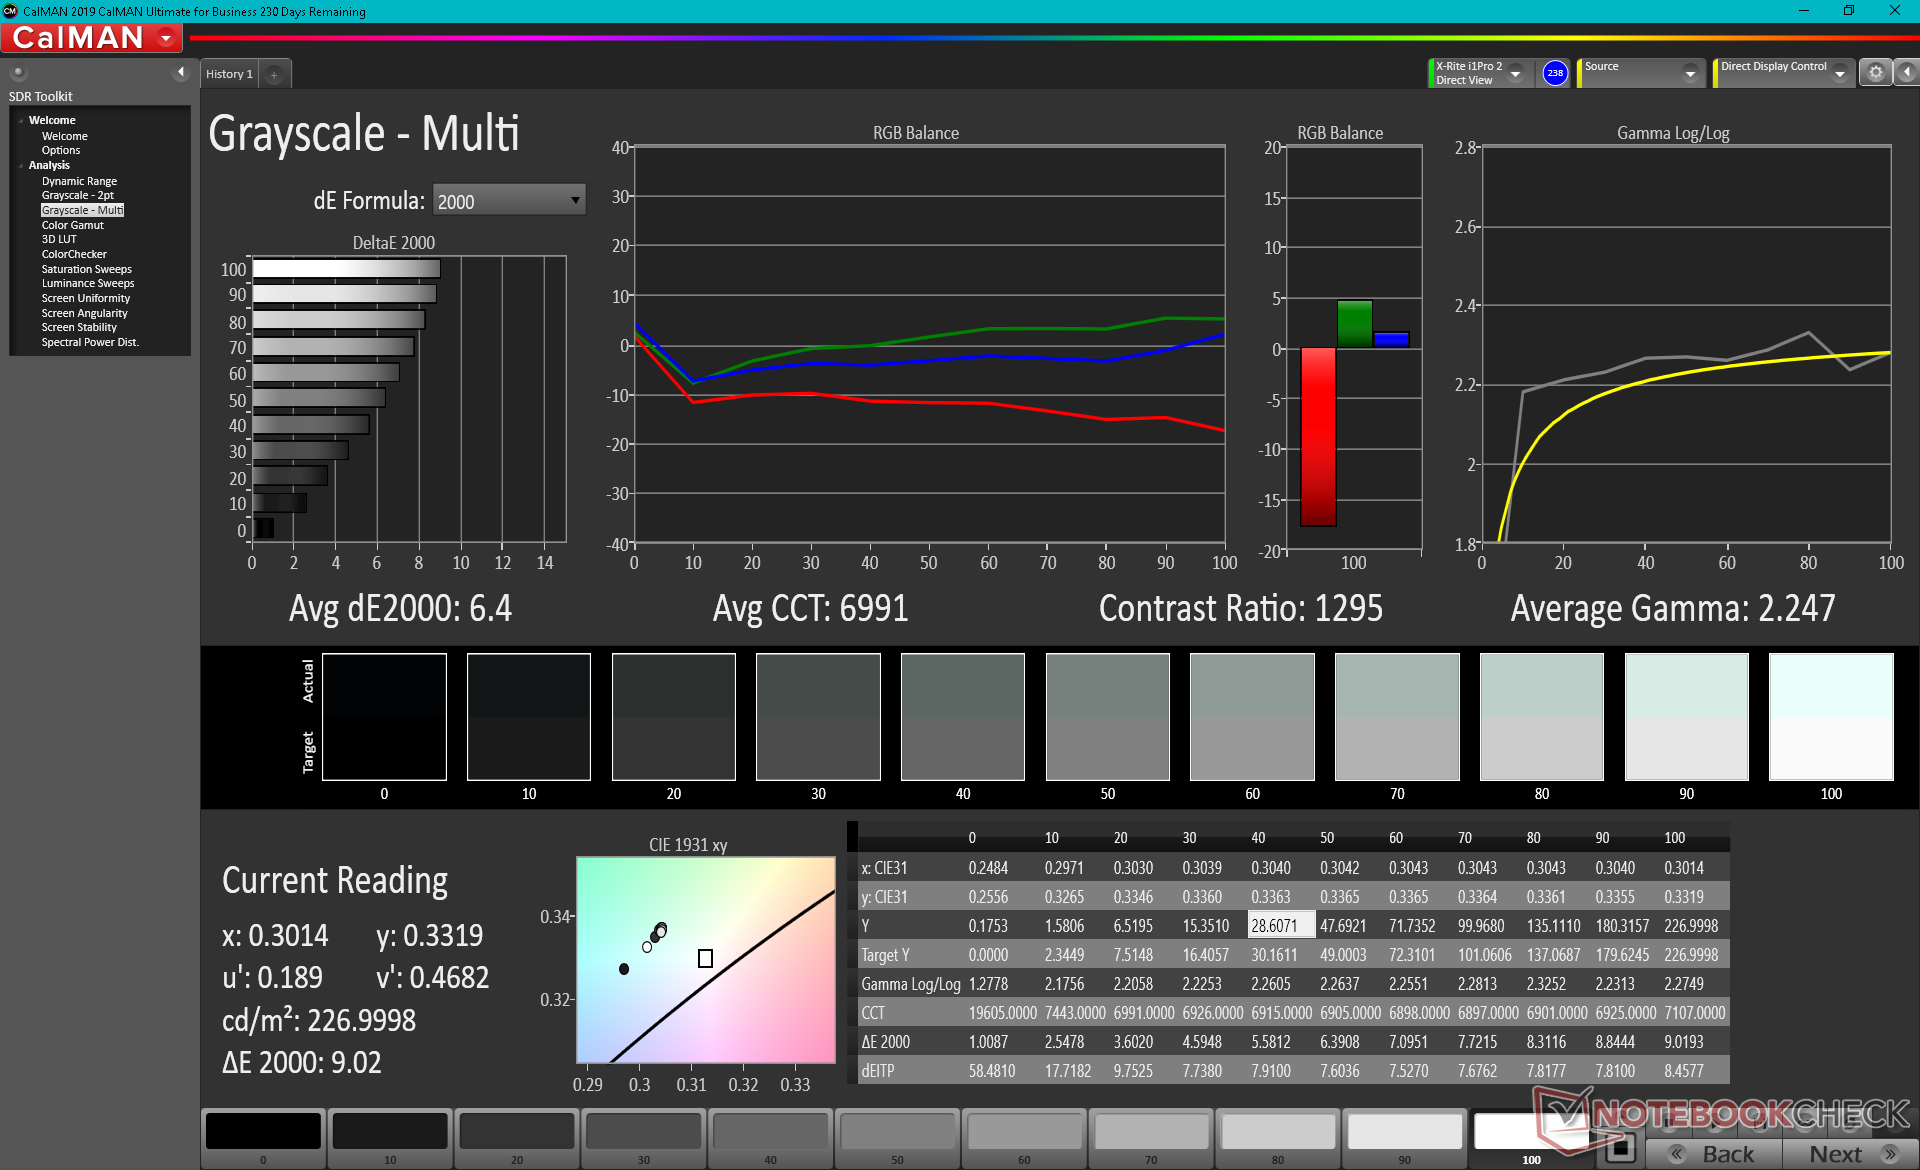
ΔE Greyscale Calman: 6.4 | ∀{0.09-98 Ø4.96}
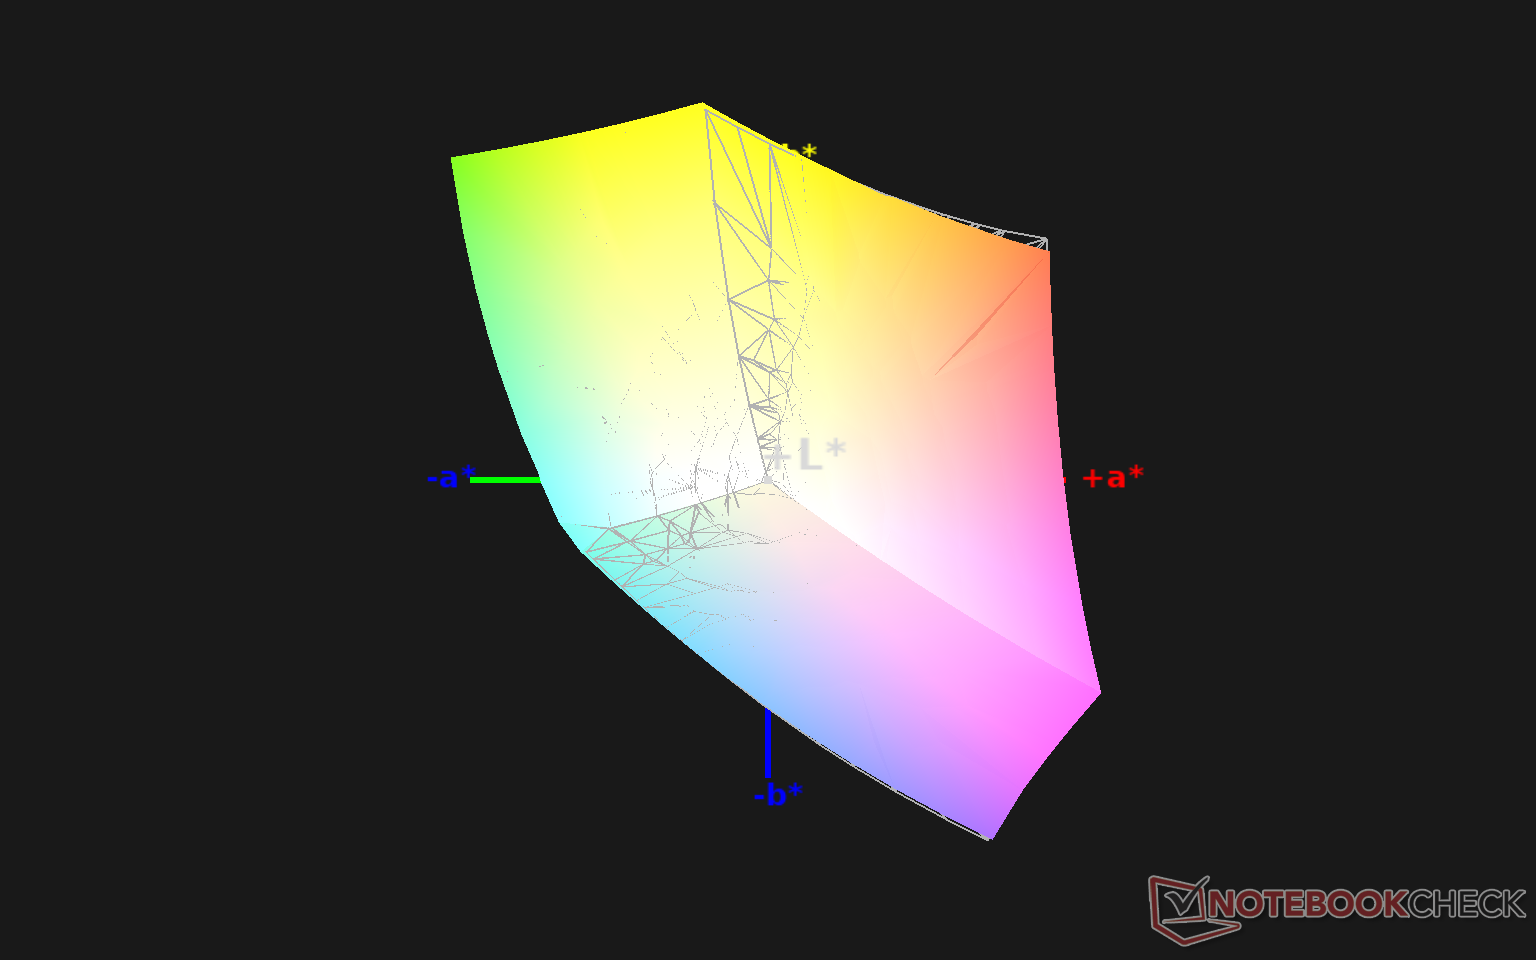
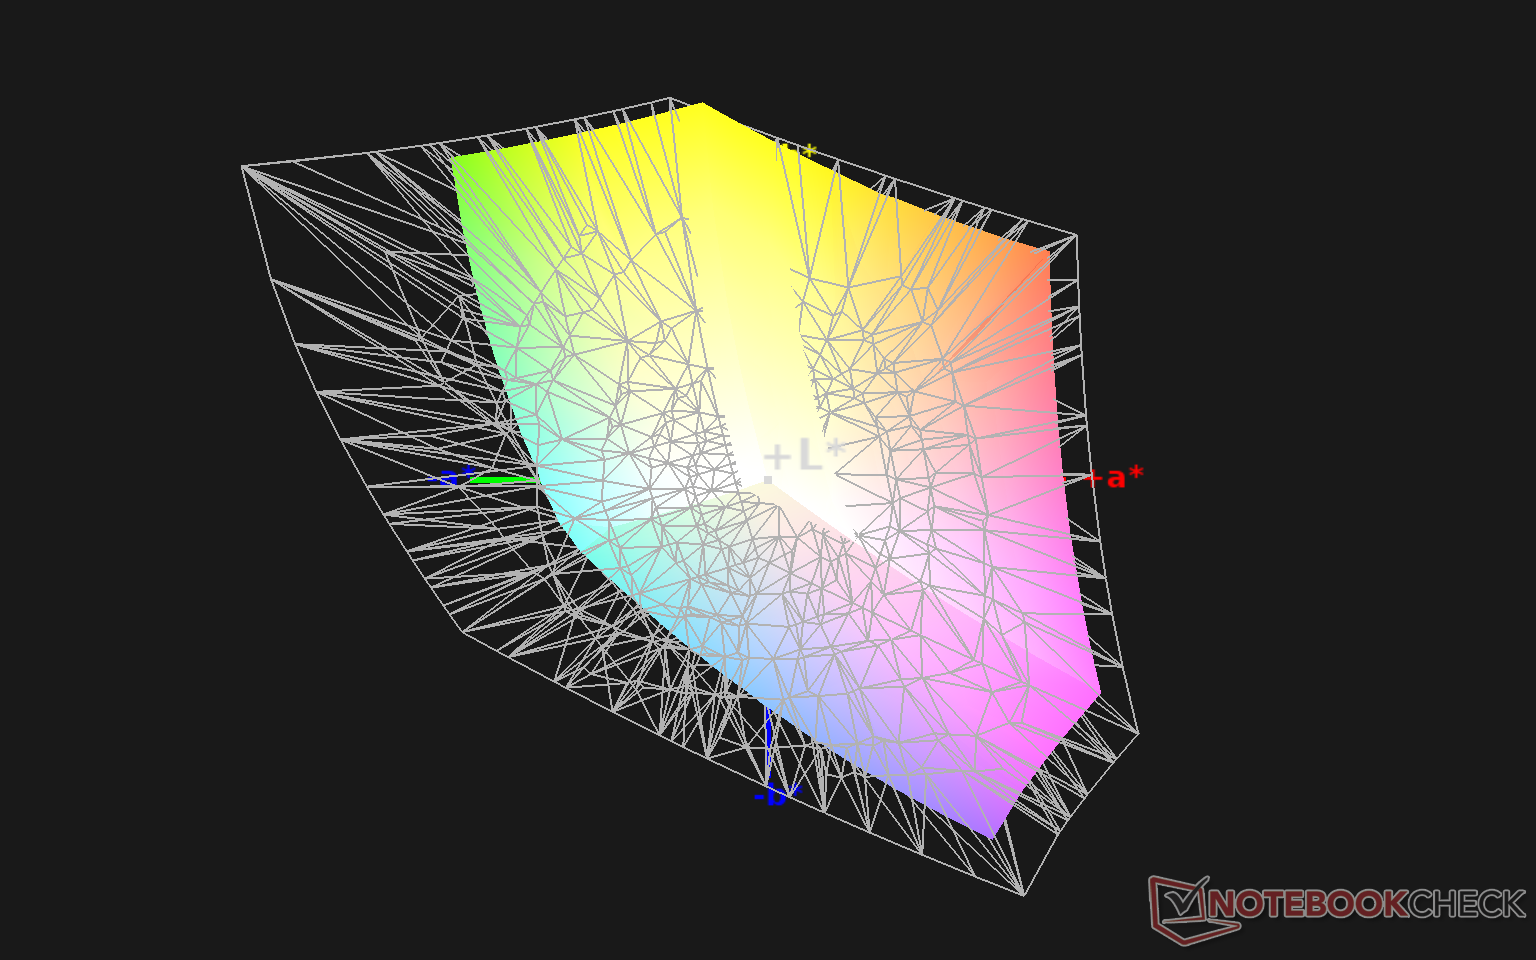
99.3% sRGB (Argyll 1.6.3 3D)
64.5% AdobeRGB 1998 (Argyll 1.6.3 3D)
70.4% AdobeRGB 1998 (Argyll 3D)
99.2% sRGB (Argyll 3D)
68.3% Display P3 (Argyll 3D)
Gamma: 2.25
CCT: 6991 K
| MSI GP66 Leopard 10UG Sharp LQ156M1JW03, IPS, 15.6", 1920x1080 | MSI GP65 10SFK-047US LG Philips LP156WFG-SPB3, IPS, 15.6", 1920x1080 | Alienware m15 R4 LG Philips LGD066E, IPS, 15.6", 1920x1080 | Aorus 15P XC Sharp LQ156M1JW03, IPS, 15.6", 1920x1080 | Asus ROG Zephyrus G15 GA503Q CMN N156KME-GNA (CMN152A), IPS-Level, 15.6", 2560x1440 | MSI GF65 Thin 10UE AU Optronics B156HAN08.4, IPS, 15.6", 1920x1080 | |
|---|---|---|---|---|---|---|
| Display | -7% | 1% | -2% | 22% | -44% | |
| Display P3 Coverage (%) | 68.3 | 63.5 -7% | 69.4 2% | 67.2 -2% | 97.3 42% | 37.65 -45% |
| sRGB Coverage (%) | 99.2 | 94.4 -5% | 99 0% | 98.7 -1% | 99.9 1% | 56.3 -43% |
| AdobeRGB 1998 Coverage (%) | 70.4 | 65.1 -8% | 70.5 0% | 68.6 -3% | 86.2 22% | 38.9 -45% |
| Response Times | -1% | 21% | 9% | 9% | -200% | |
| Response Time Grey 50% / Grey 80% * (ms) | 13.6 ? | 10.4 ? 24% | 7.4 ? 46% | 11.2 ? 18% | 8.8 ? 35% | 36.8 ? -171% |
| Response Time Black / White * (ms) | 9.6 ? | 12 ? -25% | 10 ? -4% | 9.6 ? -0% | 11.2 ? -17% | 31.6 ? -229% |
| PWM Frequency (Hz) | 23580 ? | 24040 ? | ||||
| Screen | -3% | 24% | 27% | 2% | -32% | |
| Brightness middle (cd/m²) | 225.9 | 384.9 70% | 333 47% | 298 32% | 327 45% | 266.5 18% |
| Brightness (cd/m²) | 211 | 358 70% | 303 44% | 278 32% | 309 46% | 262 24% |
| Brightness Distribution (%) | 83 | 87 5% | 86 4% | 88 6% | 89 7% | 91 10% |
| Black Level * (cd/m²) | 0.23 | 0.67 -191% | 0.29 -26% | 0.29 -26% | 0.33 -43% | 0.18 22% |
| Contrast (:1) | 982 | 574 -42% | 1148 17% | 1028 5% | 991 1% | 1481 51% |
| Colorchecker dE 2000 * | 3.98 | 2.43 39% | 1.8 55% | 0.96 76% | 4.49 -13% | 5.33 -34% |
| Colorchecker dE 2000 max. * | 8.95 | 4.58 49% | 4.49 50% | 3.22 64% | 8.42 6% | 18.28 -104% |
| Colorchecker dE 2000 calibrated * | 1.15 | 2.03 -77% | 1.13 2% | 0.83 28% | 2.27 -97% | 4.36 -279% |
| Greyscale dE 2000 * | 6.4 | 2.6 59% | 1.9 70% | 1.3 80% | 4.2 34% | 4.5 30% |
| Gamma | 2.25 98% | 2.2 100% | 2.265 97% | 2.242 98% | 2.173 101% | 2.35 94% |
| CCT | 6991 93% | 6981 93% | 6840 95% | 6519 100% | 7014 93% | 6289 103% |
| Color Space (Percent of AdobeRGB 1998) (%) | 64.5 | 59.7 -7% | 71 10% | 69 7% | 86 33% | 35.6 -45% |
| Color Space (Percent of sRGB) (%) | 99.3 | 93.9 -5% | 93 -6% | 91 -8% | 99 0% | 55.8 -44% |
| Totaal Gemiddelde (Programma / Instellingen) | -4% /
-3% | 15% /
19% | 11% /
19% | 11% /
6% | -92% /
-55% |
* ... kleiner is beter
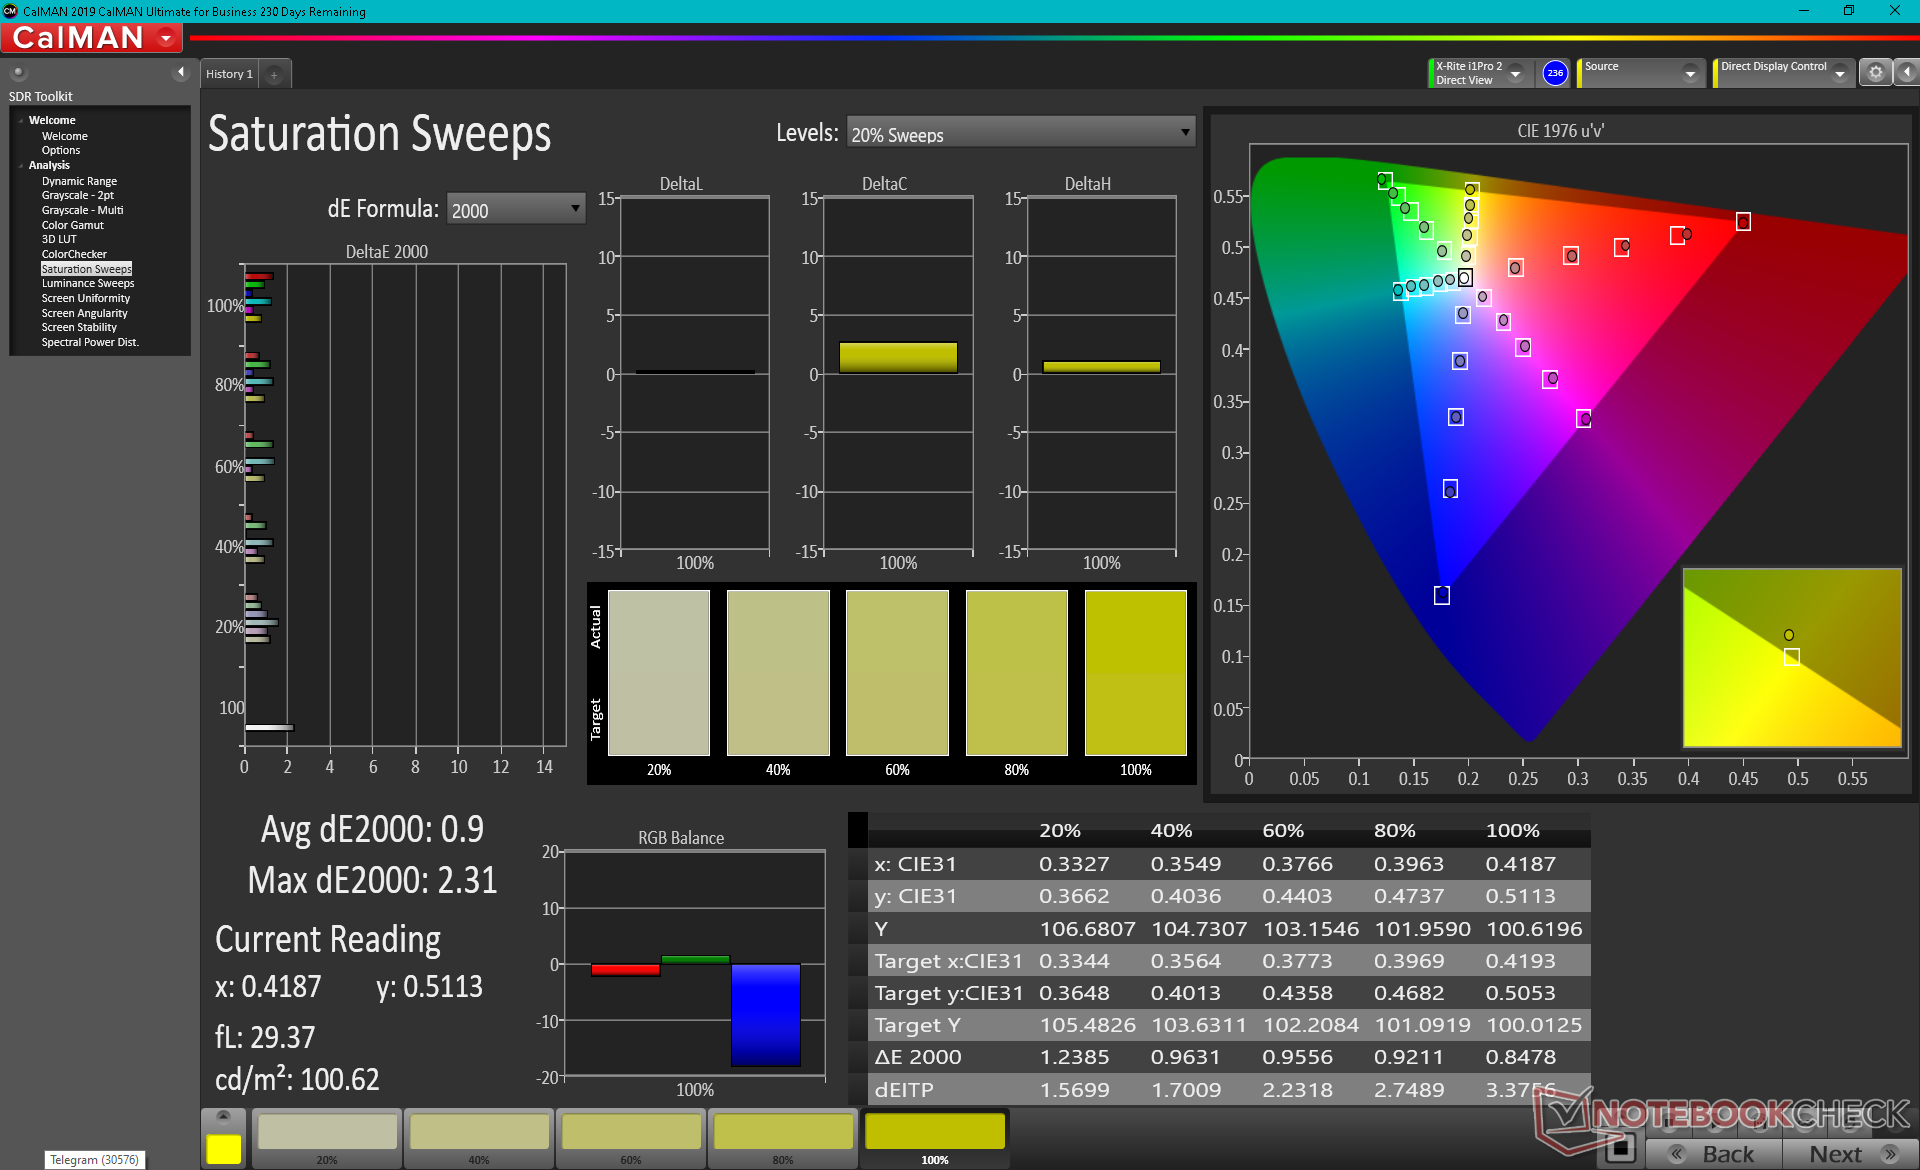
De kleurruimte dekt alle sRGB om vergelijkbaar te zijn met de meeste high-end gaming laptops. We zijn blij dat MSI niet een van die goedkope Panda panelen die meestal veel slechtere kleuren hebben.
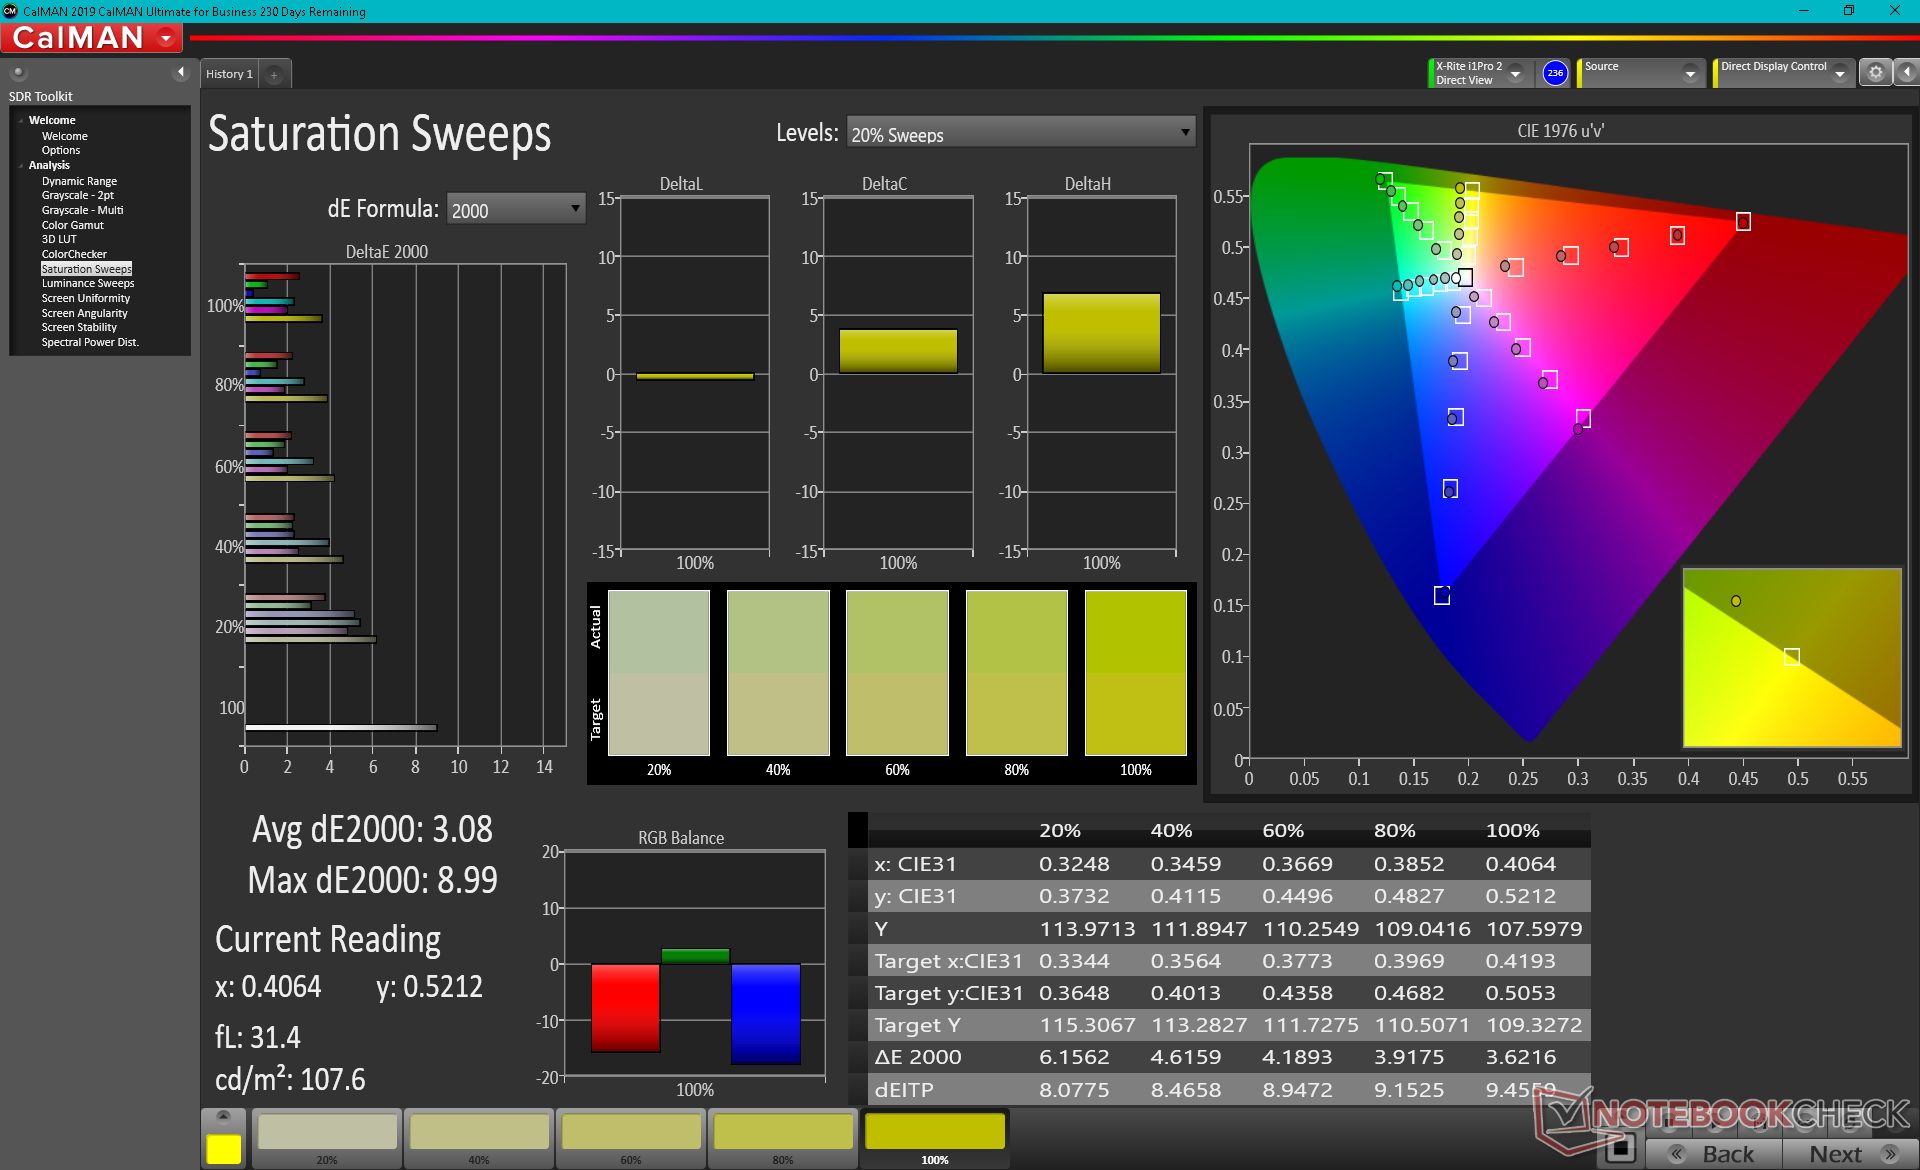
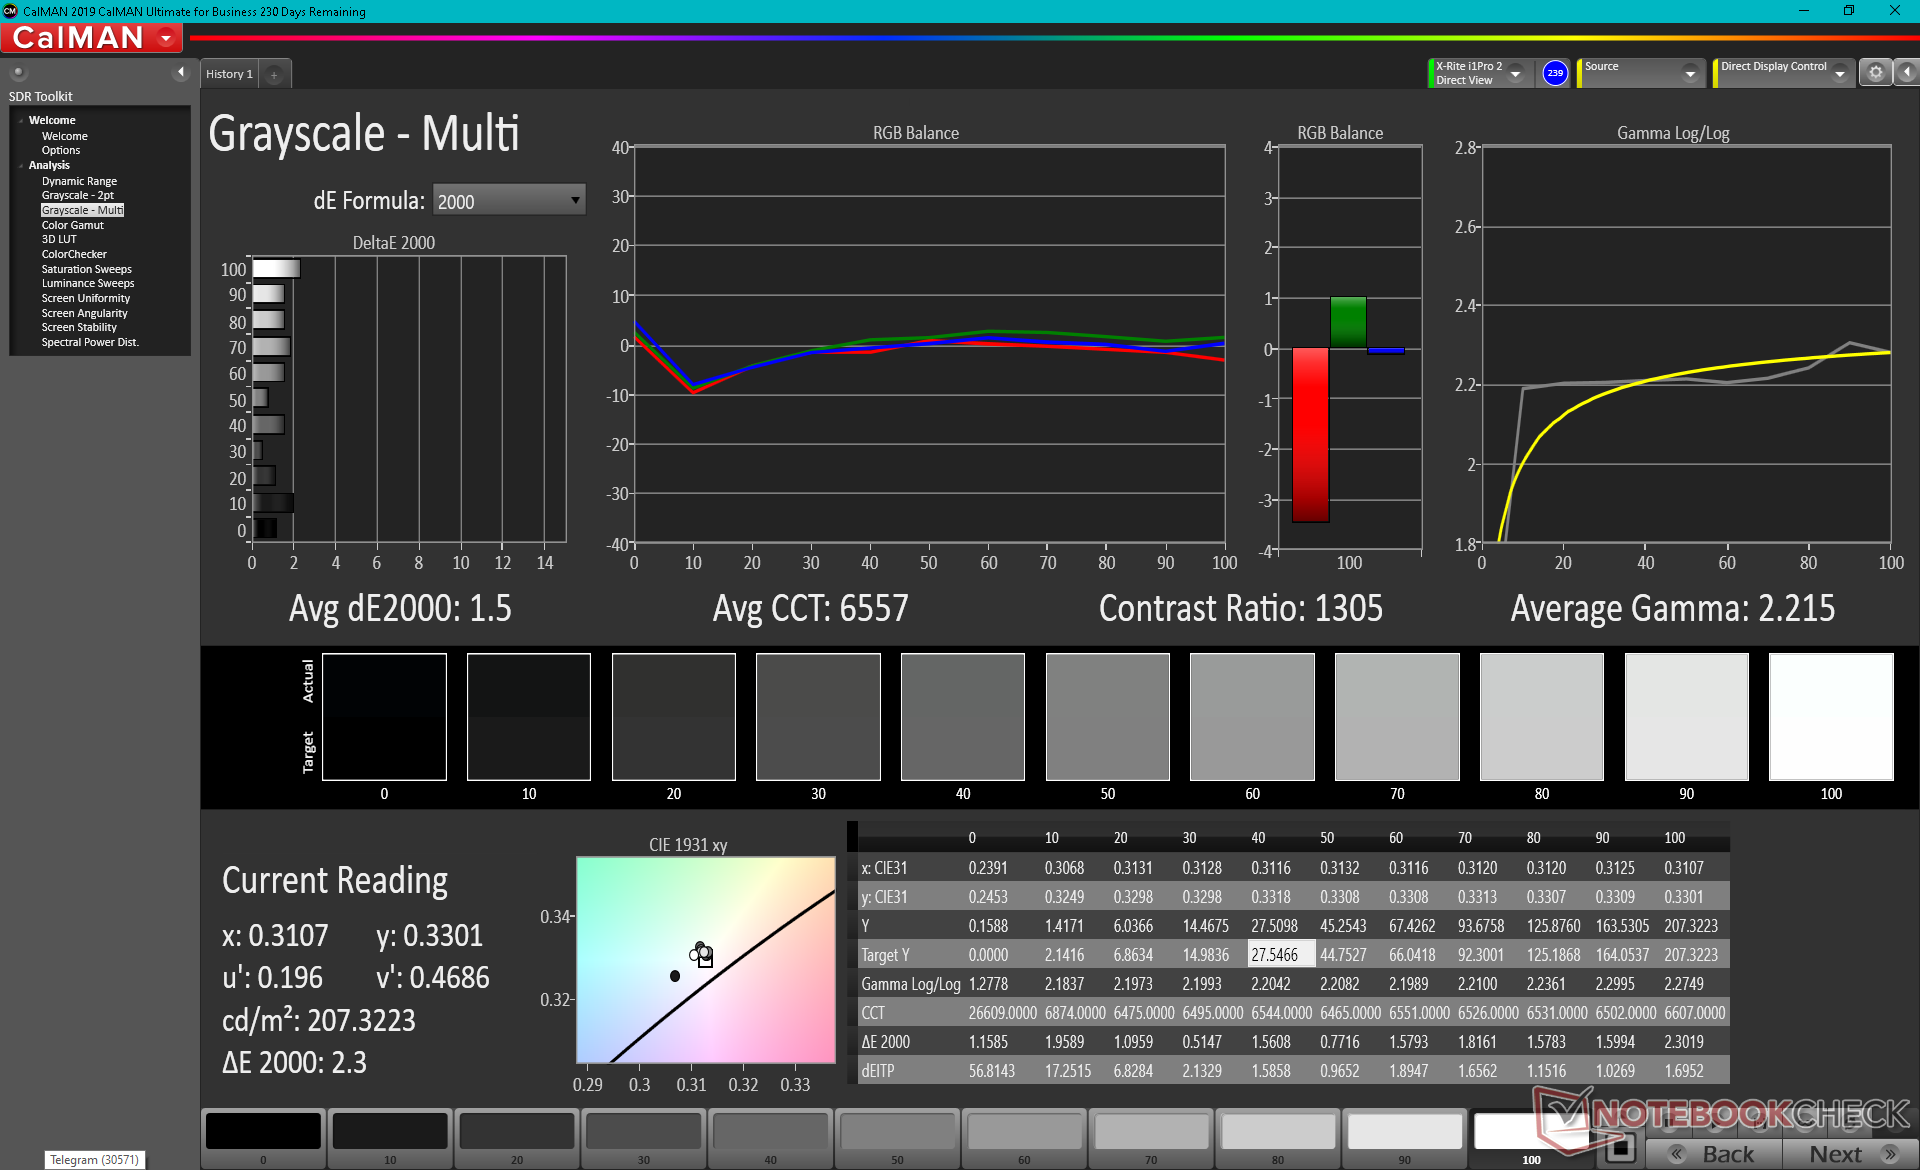
X-Rite colorimetermetingen tonen een ongecalibreerd beeldscherm uit de doos, wat te verwachten is aangezien de GP66 geen gaminglaptop is met Pantone-calibratie. De kleurtemperatuur is te koel en de kleurnauwkeurigheid lijdt daaronder. Kleuren verbeteren aanzienlijk wanneer ze eenmaal goed gekalibreerd zijn, met uiteindelijke grijswaarden en kleur deltaE waarden van slechts 1,5 en 1,15, respectievelijk. We raden aan ons ICM profiel hierboven toe te passen om het meeste uit het scherm te halen als je geen toegang hebt tot een colorimeter.
Responstijd Scherm
| ↔ Responstijd Zwart naar Wit | ||
|---|---|---|
| 9.6 ms ... stijging ↗ en daling ↘ gecombineerd | ↗ 5.2 ms stijging | 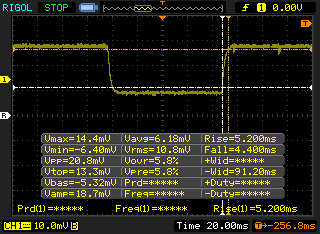 |
| ↘ 4.4 ms daling | ||
| Het scherm vertoonde snelle responstijden in onze tests en zou geschikt moeten zijn voor games. Ter vergelijking: alle testtoestellen variëren van 0.1 (minimum) tot 240 (maximum) ms. » 26 % van alle toestellen zijn beter. Dit betekent dat de gemeten responstijd beter is dan het gemiddelde (19.8 ms) van alle geteste toestellen. | ||
| ↔ Responstijd 50% Grijs naar 80% Grijs | ||
| 13.6 ms ... stijging ↗ en daling ↘ gecombineerd | ↗ 7.6 ms stijging | 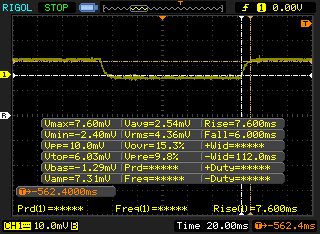 |
| ↘ 6 ms daling | ||
| Het scherm vertoonde prima responstijden in onze tests maar is misschien wat te traag voor competitieve games. Ter vergelijking: alle testtoestellen variëren van 0.165 (minimum) tot 636 (maximum) ms. » 27 % van alle toestellen zijn beter. Dit betekent dat de gemeten responstijd beter is dan het gemiddelde (30.9 ms) van alle geteste toestellen. | ||
Screen Flickering / PWM (Pulse-Width Modulation)
| Screen flickering / PWM waargenomen | 23580 Hz | ≤ 34 % helderheid instelling | 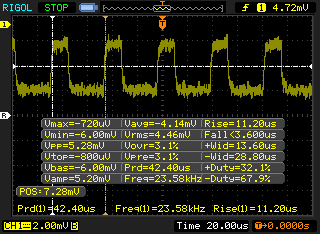 |
De achtergrondverlichting van het scherm flikkert op 23580 Hz (in het slechtste geval, bijvoorbeeld bij gebruik van PWM) aan een helderheid van 34 % en lager. Boven deze helderheid zou er geen flickering / PWM mogen optreden. De frequentie van 23580 Hz is redelijk hoog en de meeste mensen die gevoelig zijn aan flickering zouden dit dus niet mogen waarnemen of geïrriteerde ogen krijgen. Ter vergelijking: 52 % van alle geteste toestellen maakten geen gebruik van PWM om de schermhelderheid te verlagen. Als het wel werd gebruikt, werd een gemiddelde van 7741 (minimum: 5 - maximum: 343500) Hz waargenomen. | |||
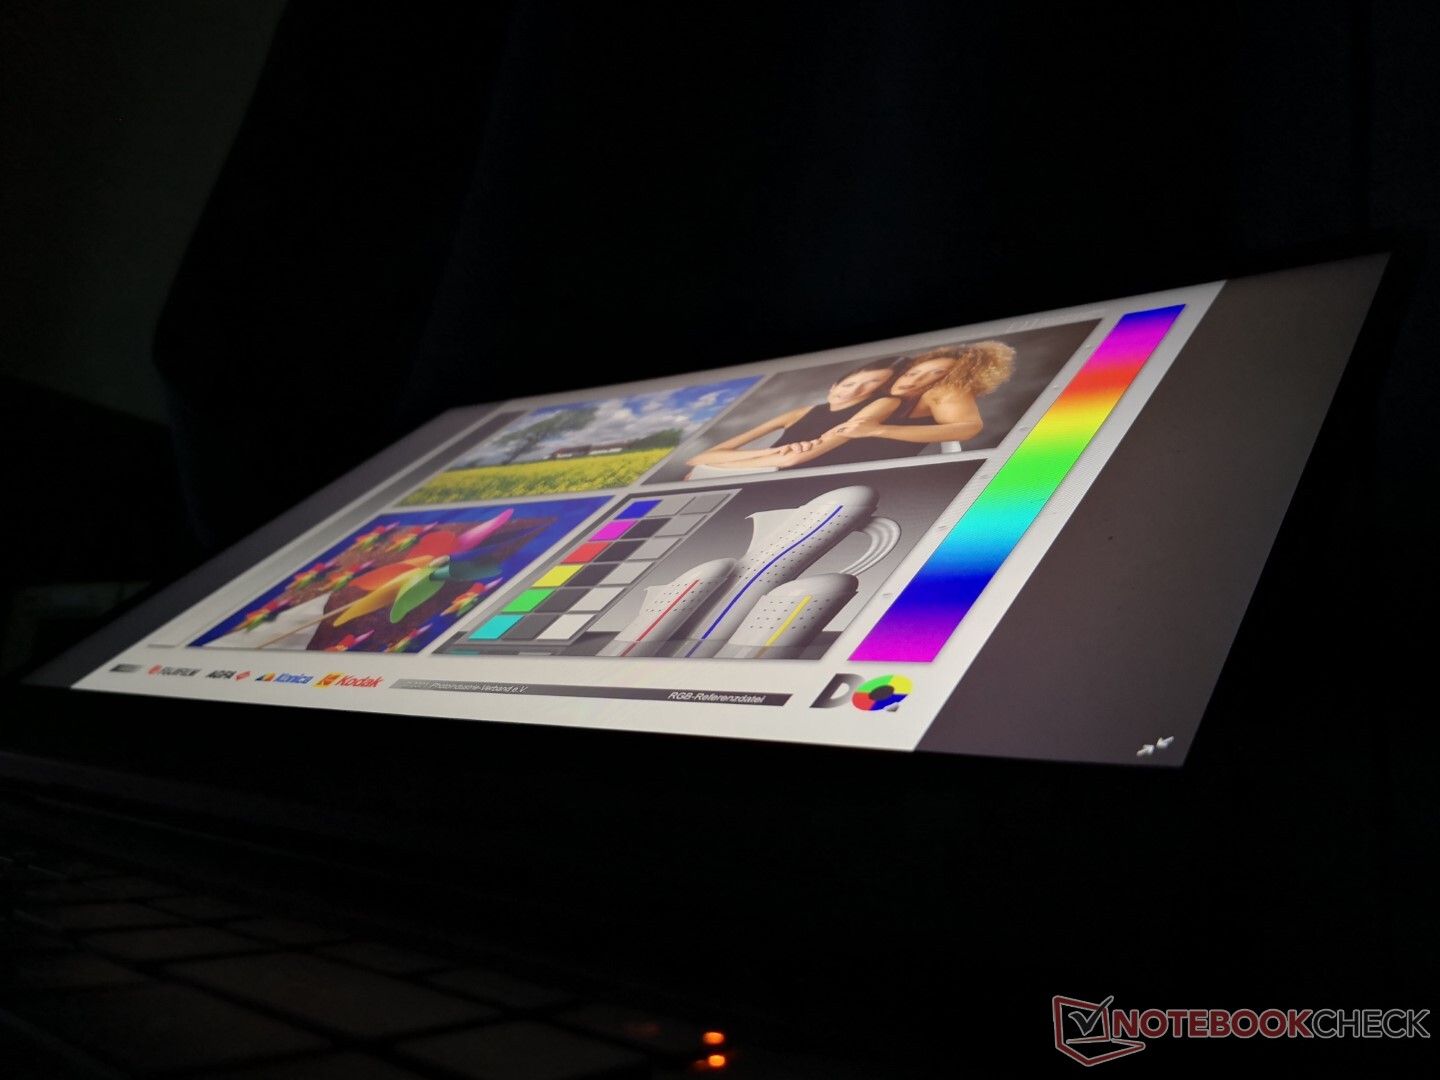
De zichtbaarheid buitenshuis is slecht, omdat het scherm niet zo helder is. De schittering is onder de meeste omstandigheden merkbaar en zelfs als deze zou kunnen worden verminderd, zal de inhoud op het scherm er toch uitgebleekt uitzien.
Prestaties
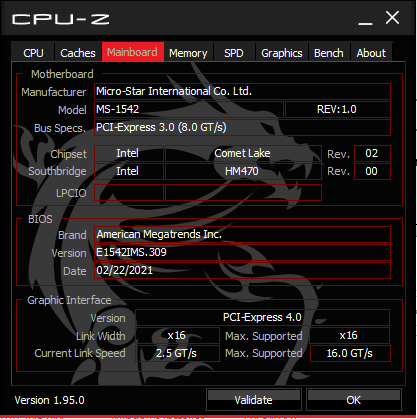
MSI biedt op dit moment alleen 10e generatie Comet Lake-H Core i7-10870H en Core i7-10875H opties aan, verder niets. We zouden het echter prima hebben gevonden met slechts een van deze opties, aangezien de verschillen tussen de i7-10870H en i7-10875H ongelooflijk klein zijn. Gebruikers zullen moeten kijken naar de goedkopere Bravo of Alpha serie voor AMD opties.
Grafische voorzieningen variëren van de GeForce RTX 3060 tot 3080 bij 130 W TGP elk. Via de Dragon Center-software kan zowel automatisch als handmatig van grafische weergave worden gewisseld. We raden gebruikers aan om vertrouwd te raken met Dragon Center, omdat belangrijke functies hier kunnen worden omgeschakeld.
We hadden onze unit ingesteld op Extreme Performance mode met de Nvidia GPU actief voordat we onderstaande prestatie benchmarks uitvoerden.
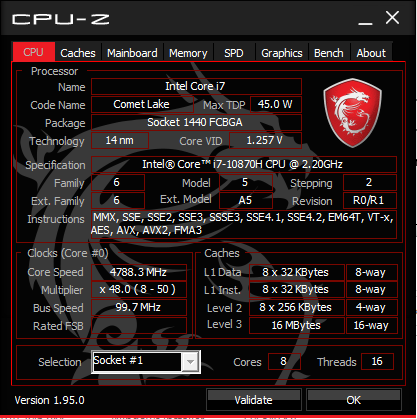
Processor
CPU prestaties zijn uitstekend met fatsoenlijke Turbo Boost duurzaamheid, zoals blijkt uit onze CineBench R15 xT loop resultaten hieronder. De prestaties zijn zelfs zo snel als de duurdere Core i9-10980HK in de Alienware m15 R4. Verschillen tussen de Core i7-10875H en Core i7-10870H zijn binnen slechts een paar procentpunten.
Cinebench R15: CPU Multi 64Bit | CPU Single 64Bit
Blender: v2.79 BMW27 CPU
7-Zip 18.03: 7z b 4 -mmt1 | 7z b 4
Geekbench 5.5: Single-Core | Multi-Core
HWBOT x265 Benchmark v2.2: 4k Preset
LibreOffice : 20 Documents To PDF
R Benchmark 2.5: Overall mean
| LibreOffice / 20 Documents To PDF | |
| HP Pavilion Gaming 15-ec1206ng | |
| Schenker XMG Core 15 Ampere | |
| Gemiddeld Intel Core i7-10870H (46 - 64.4, n=12) | |
| Alienware m15 R4 | |
| MSI GP66 Leopard 10UG | |
| Razer Blade 15 Base Edition 2021, i7-10750H RTX 3060 | |
| Asus Zephyrus S15 GX502L | |
| MSI GT76 Titan DT 10SGS | |
| Asus ROG Zephyrus Duo 15 SE GX551QS | |
* ... kleiner is beter
Systeemprestaties
PCMark resultaten zijn waar we ze verwachten ten opzichte van andere laptops met dezelfde CPU en GPU. De scores zijn consistent hoger dan de GP65 behalve in de Essentials benchmark, waarschijnlijk als gevolg van de langzamere NVMe SSD in onze GP66 testeenheid.
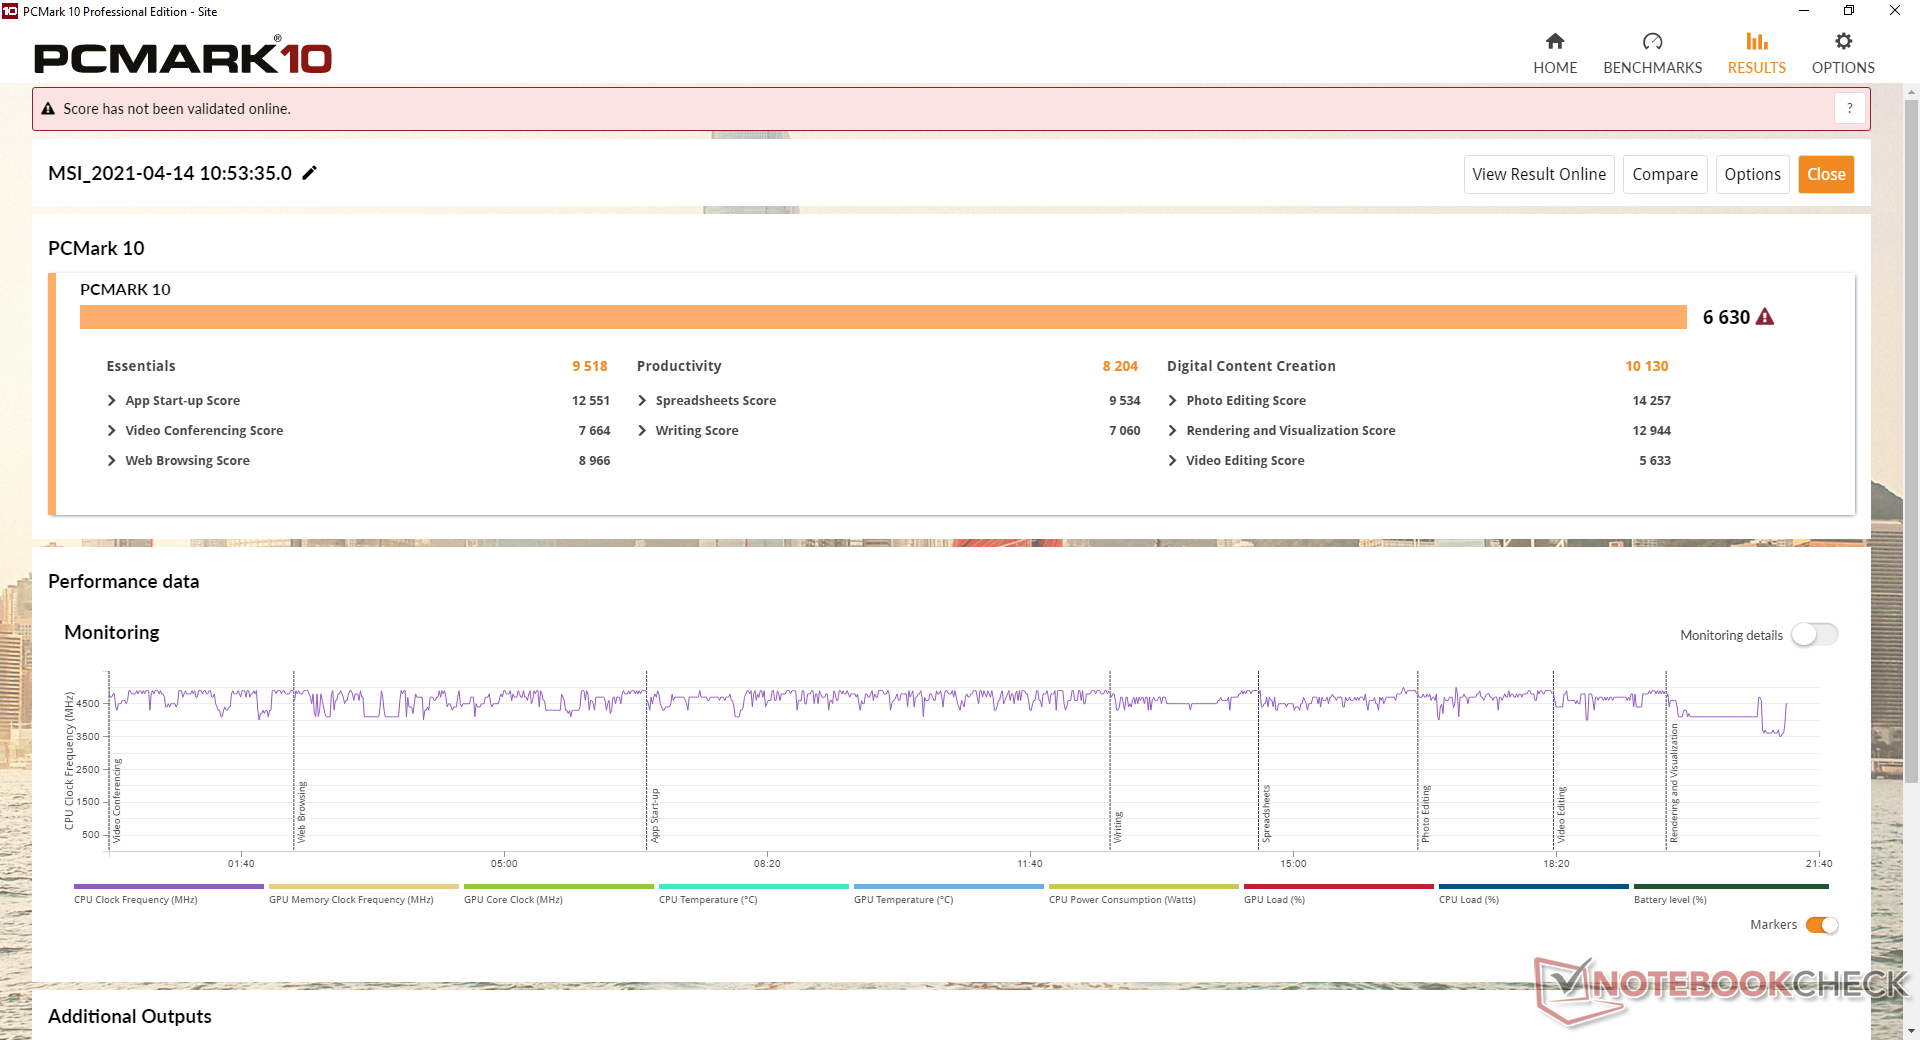
| PCMark 10 Score | 6630 punten | |
Help | ||
DPC latentie
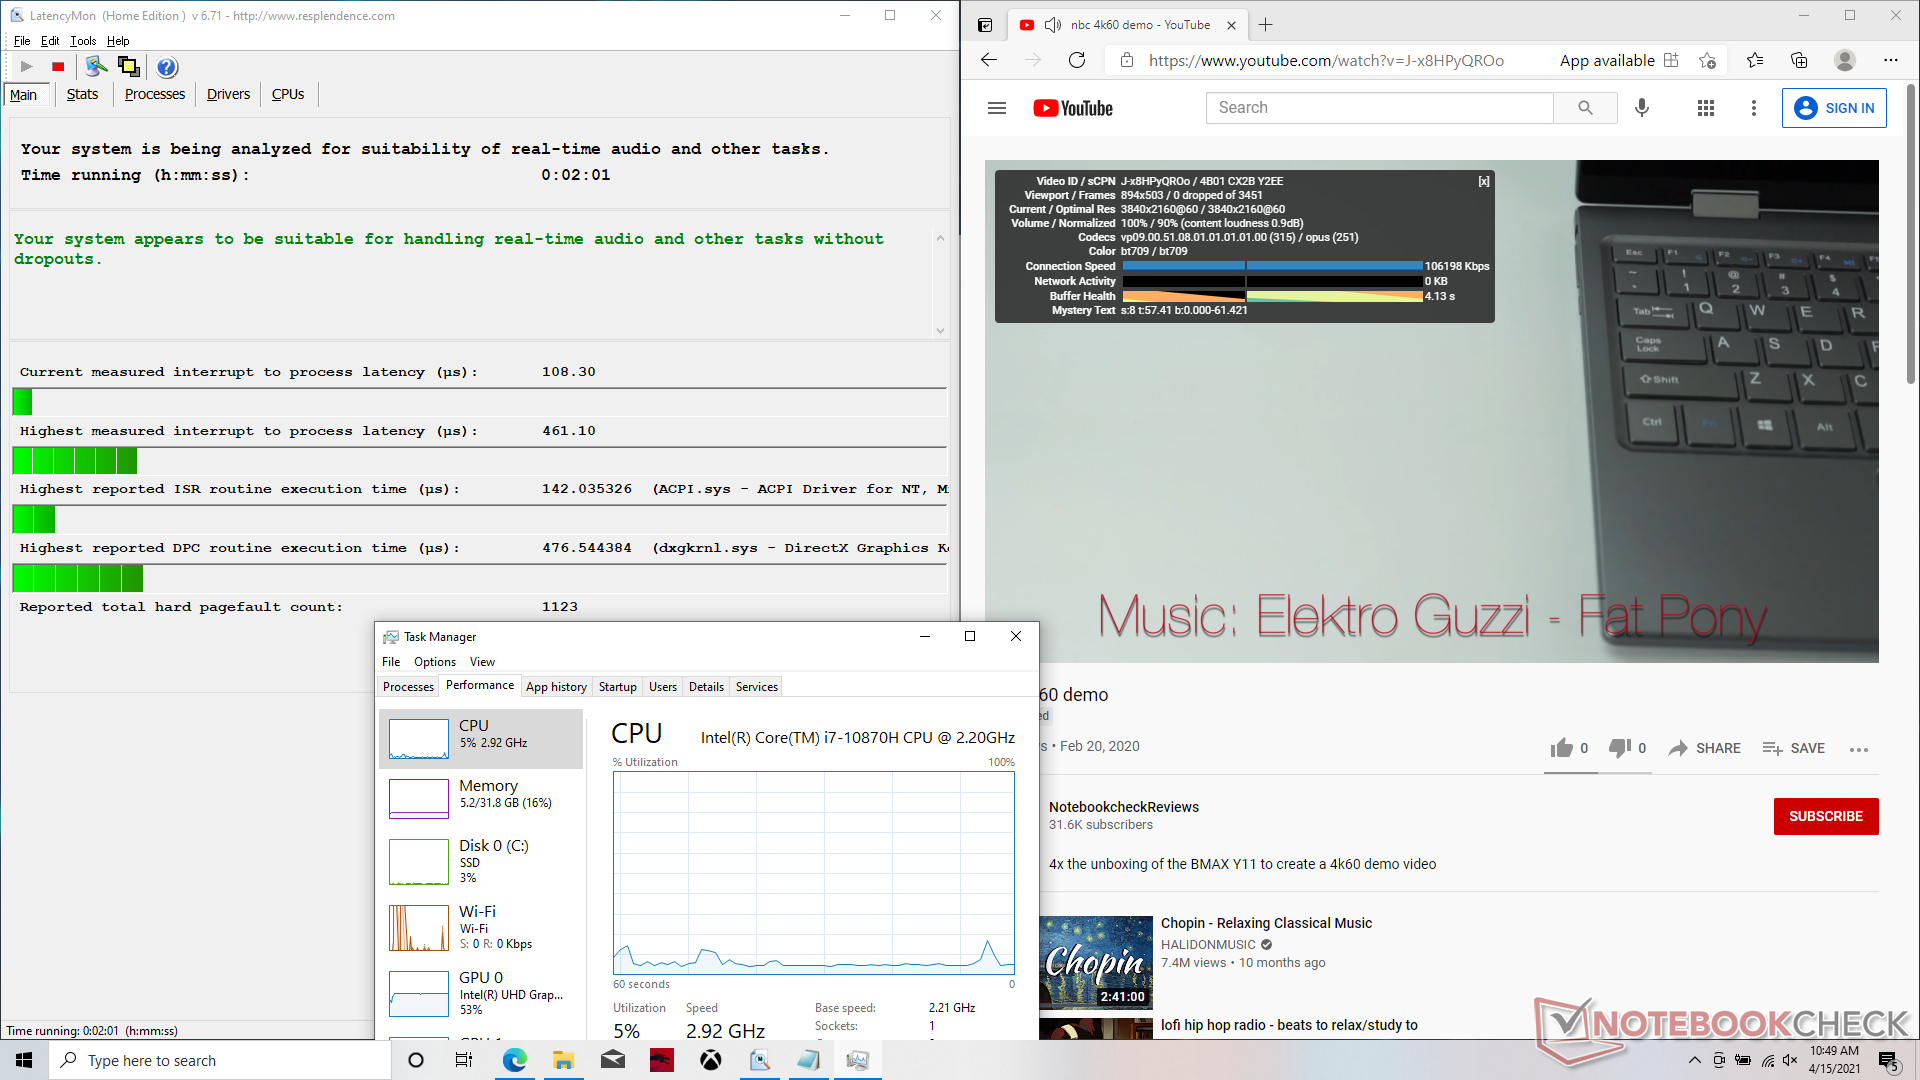
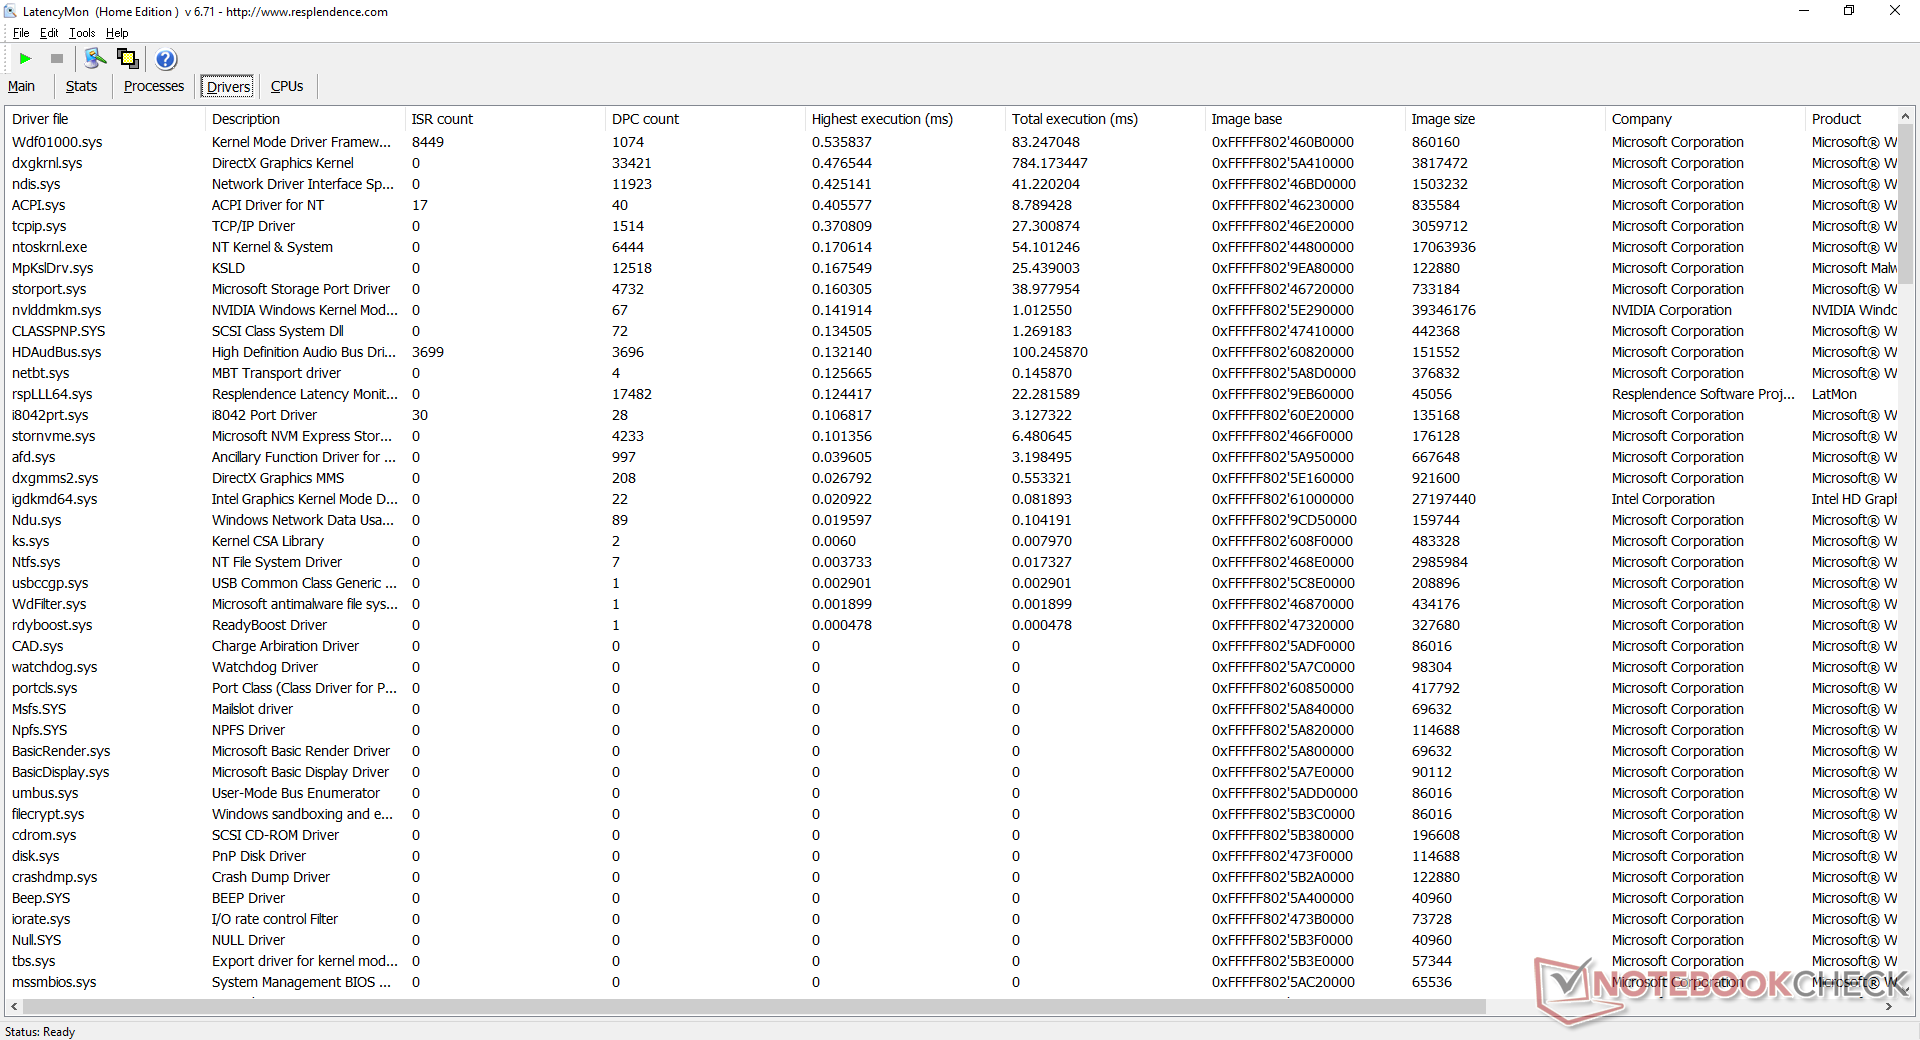
LatencyMon laat geen DPC latency problemen zien bij het openen van meerdere browser tabs op onze homepage. Het afspelen van 4K-video's met 60 FPS verloopt vloeiend en zonder wegvallende frames, zoals verwacht mag worden van een gaminglaptop.
| DPC Latencies / LatencyMon - interrupt to process latency (max), Web, Youtube, Prime95 | |
| Alienware m15 R4 | |
| Aorus 15P XC | |
| MSI GP65 10SFK-047US | |
| MSI GF65 Thin 10UE | |
| MSI GP66 Leopard 10UG | |
| Asus ROG Zephyrus G15 GA503Q | |
* ... kleiner is beter
Opslagapparaten
Terwijl de GP65 tot drie interne schijven kon ondersteunen (2x M.2, 1x 2,5-inch SATA III), kan de GP66 alleen tot 2x M.2-schijven ondersteunen. De 1 TB Kingston OM8PCP31024F in ons apparaat is een middenklasse NVMe-schijf die langzamer is dan zowel de Samsung PM981 als de Micron 2300
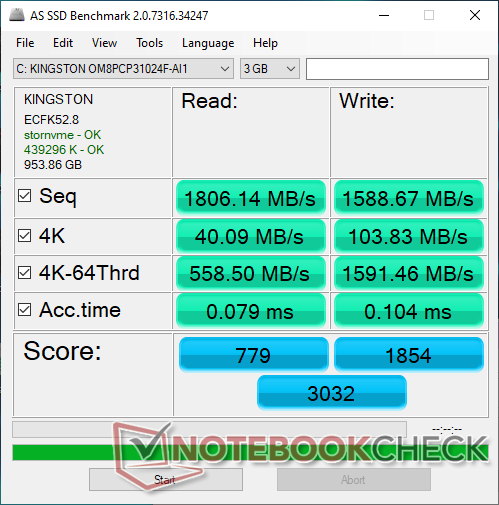
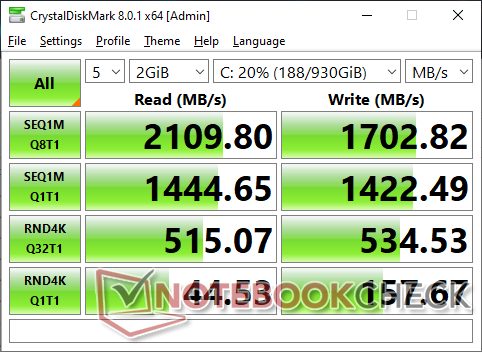
| MSI GP66 Leopard 10UG Kingston OM8PCP31024F | MSI GP65 10SFK-047US Samsung SSD PM981 MZVLB1T0HALR | Alienware m15 R4 Micron 2300 1TB MTFDHBA1T0TDV | Aorus 15P XC ESR512GTLCG-EAC-4 | Asus ROG Zephyrus G15 GA503Q SK Hynix HFM001TD3JX013N | MSI GF65 Thin 10UE Samsung SSD PM981 MZVLB1T0HALR | |
|---|---|---|---|---|---|---|
| AS SSD | 50% | 38% | 45% | 58% | 50% | |
| Seq Read (MB/s) | 1806 | 2066 14% | 2658 47% | 2694 49% | 2950 63% | 3002 66% |
| Seq Write (MB/s) | 1589 | 2418 52% | 2769 74% | 2327 46% | 1600 1% | 2420 52% |
| 4K Read (MB/s) | 40.09 | 54.2 35% | 46.07 15% | 47.77 19% | 53.6 34% | 48.46 21% |
| 4K Write (MB/s) | 103.8 | 129 24% | 87.2 -16% | 98.8 -5% | 126.8 22% | 114.3 10% |
| 4K-64 Read (MB/s) | 559 | 1865 234% | 1372 145% | 1746 212% | 1429 156% | 1873 235% |
| 4K-64 Write (MB/s) | 1591 | 1878 18% | 1247 -22% | 2267 42% | 2177 37% | 1882 18% |
| Access Time Read * (ms) | 0.079 | 0.042 47% | 0.052 34% | 0.079 -0% | 0.064 19% | 0.045 43% |
| Access Time Write * (ms) | 0.104 | 0.091 12% | 0.098 6% | 0.039 62% | 0.029 72% | 0.101 3% |
| Score Read (Points) | 779 | 2126 173% | 1684 116% | 2063 165% | 1778 128% | 2221 185% |
| Score Write (Points) | 1854 | 2249 21% | 1611 -13% | 2598 40% | 2464 33% | 2238 21% |
| Score Total (Points) | 3032 | 5482 81% | 4166 37% | 5698 88% | 5090 68% | 5565 84% |
| Copy ISO MB/s (MB/s) | 2674 | 2927 9% | 1877 -30% | 2421 -9% | ||
| Copy Program MB/s (MB/s) | 895 | 728 -19% | 555 -38% | 705 -21% | ||
| Copy Game MB/s (MB/s) | 1596 | 1614 1% | 1201 -25% | 1490 -7% | ||
| CrystalDiskMark 5.2 / 6 | 31% | 41% | 28% | 42% | 30% | |
| Write 4K (MB/s) | 153.2 | 145 -5% | 93.7 -39% | 130.2 -15% | 156.4 2% | 157.3 3% |
| Read 4K (MB/s) | 43.98 | 46.84 7% | 48.1 9% | 45.47 3% | 66.7 52% | 46.69 6% |
| Write Seq (MB/s) | 1527 | 2377 56% | 2785 82% | 2269 49% | 2318 52% | 2389 56% |
| Read Seq (MB/s) | 1112 | 2185 96% | 2598 134% | 1643 48% | 2151 93% | 2196 97% |
| Write 4K Q32T1 (MB/s) | 520 | 463.5 -11% | 481.9 -7% | 547 5% | 525 1% | 407.6 -22% |
| Read 4K Q32T1 (MB/s) | 516 | 527 2% | 521 1% | 654 27% | 452.1 -12% | 519 1% |
| Write Seq Q32T1 (MB/s) | 1697 | 2395 41% | 3362 98% | 2512 48% | 3055 80% | 2401 41% |
| Read Seq Q32T1 (MB/s) | 2110 | 3470 64% | 3200 52% | 3382 60% | 3607 71% | 3344 58% |
| Totaal Gemiddelde (Programma / Instellingen) | 41% /
43% | 40% /
40% | 37% /
39% | 50% /
51% | 40% /
43% |
* ... kleiner is beter

Disk Throttling: DiskSpd Read Loop, Queue Depth 8
GPU prestatie
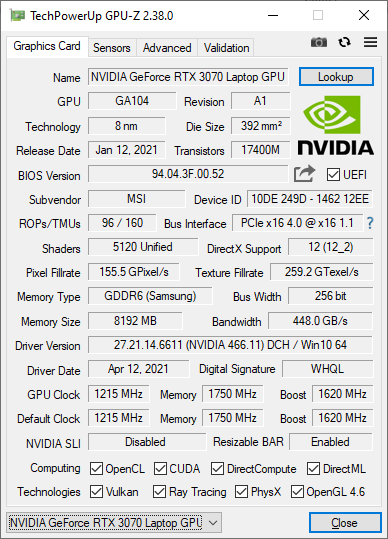
De ruwe grafische prestaties zijn slechts 6 tot 9 procent langzamer dan de 130 W GeForce RTX 3080 in de Asus Zephyrus Duo 15 SE volgens 3DMark benchmarks. Gebruikers die upgraden van een oudere RTX 2070 laptop zullen een opmerkelijke winst zien van maximaal 35 tot 40 procent. Desalniettemin zal een desktop PC met een "echte" GeForce RTX 3070 grafische kaart is nog steeds ongeveer 20 procent sneller dan onze RTX 3070 mobiele versie.
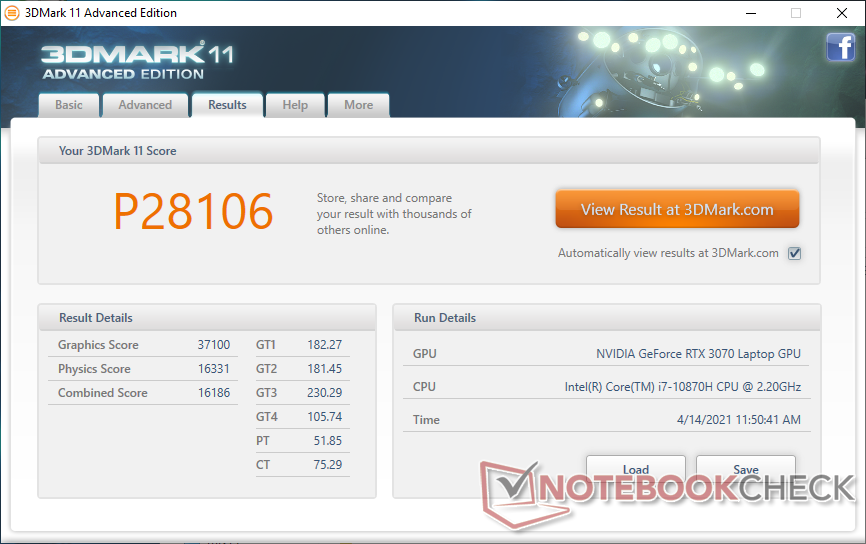
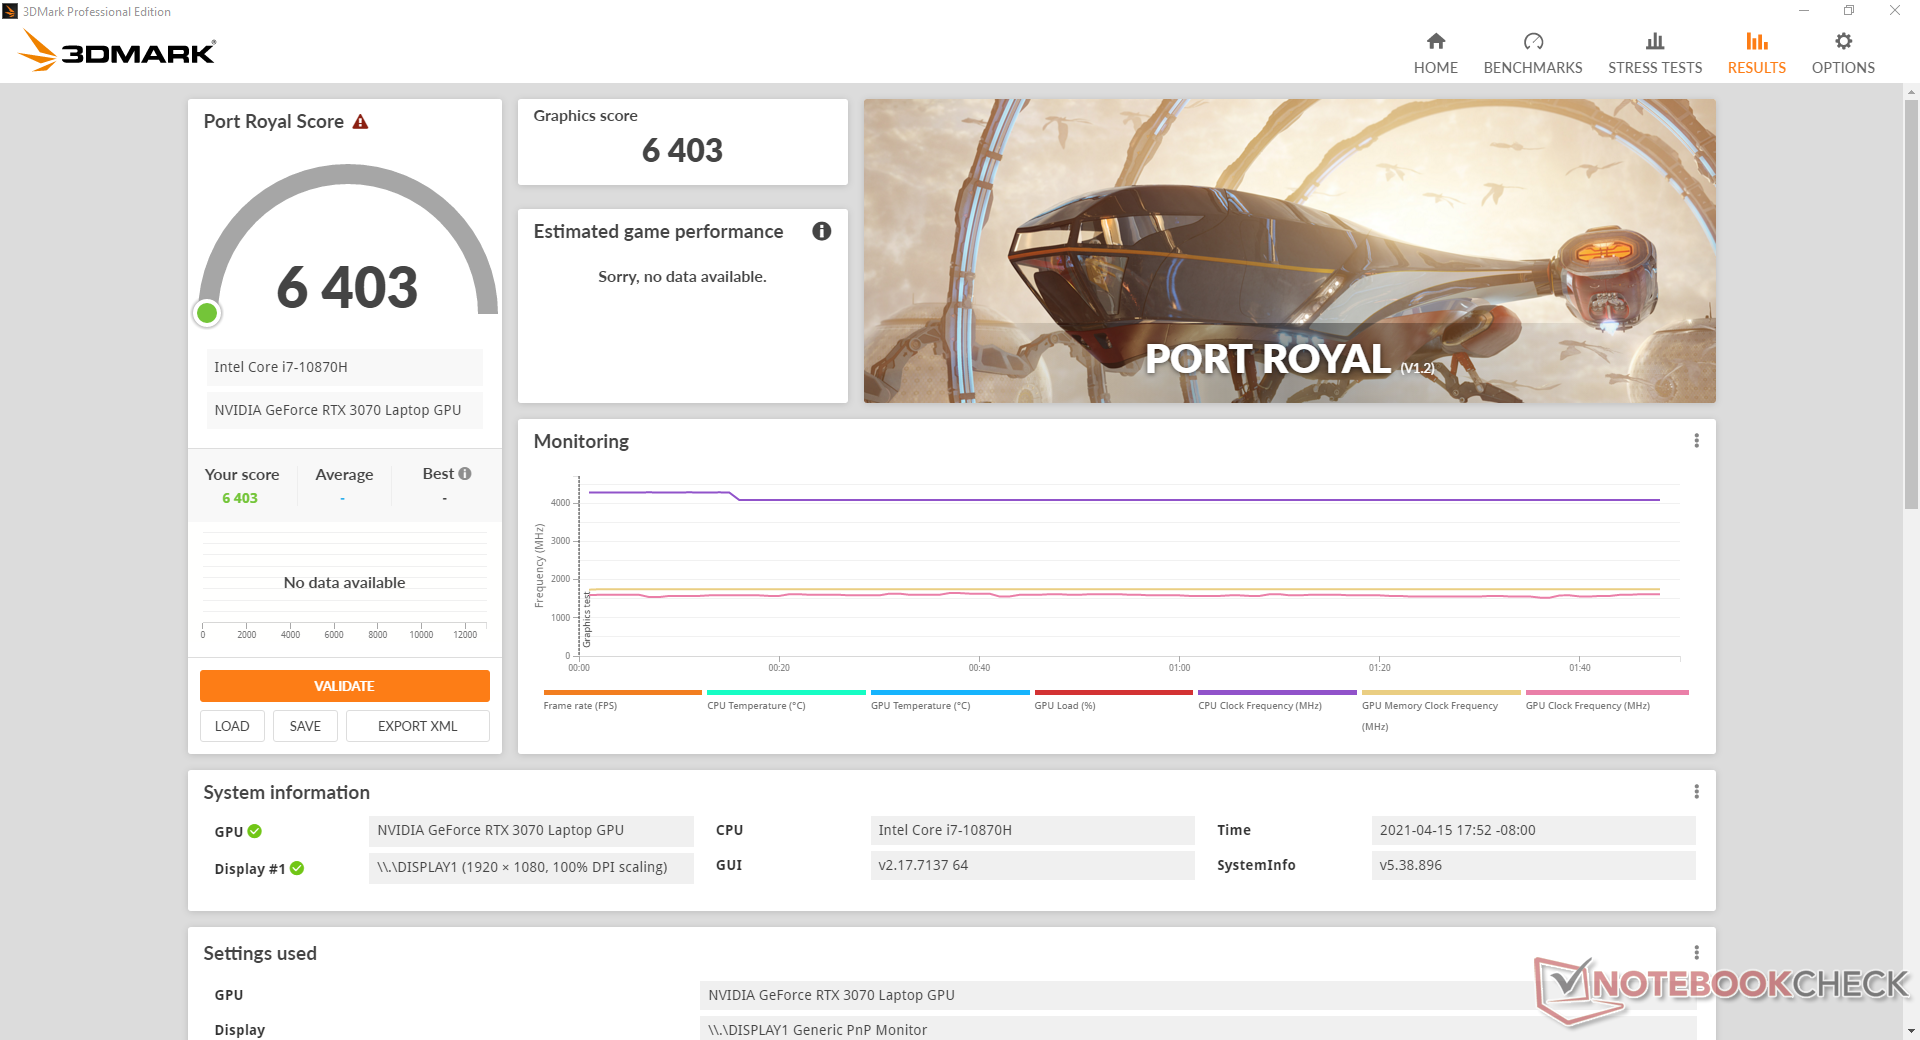
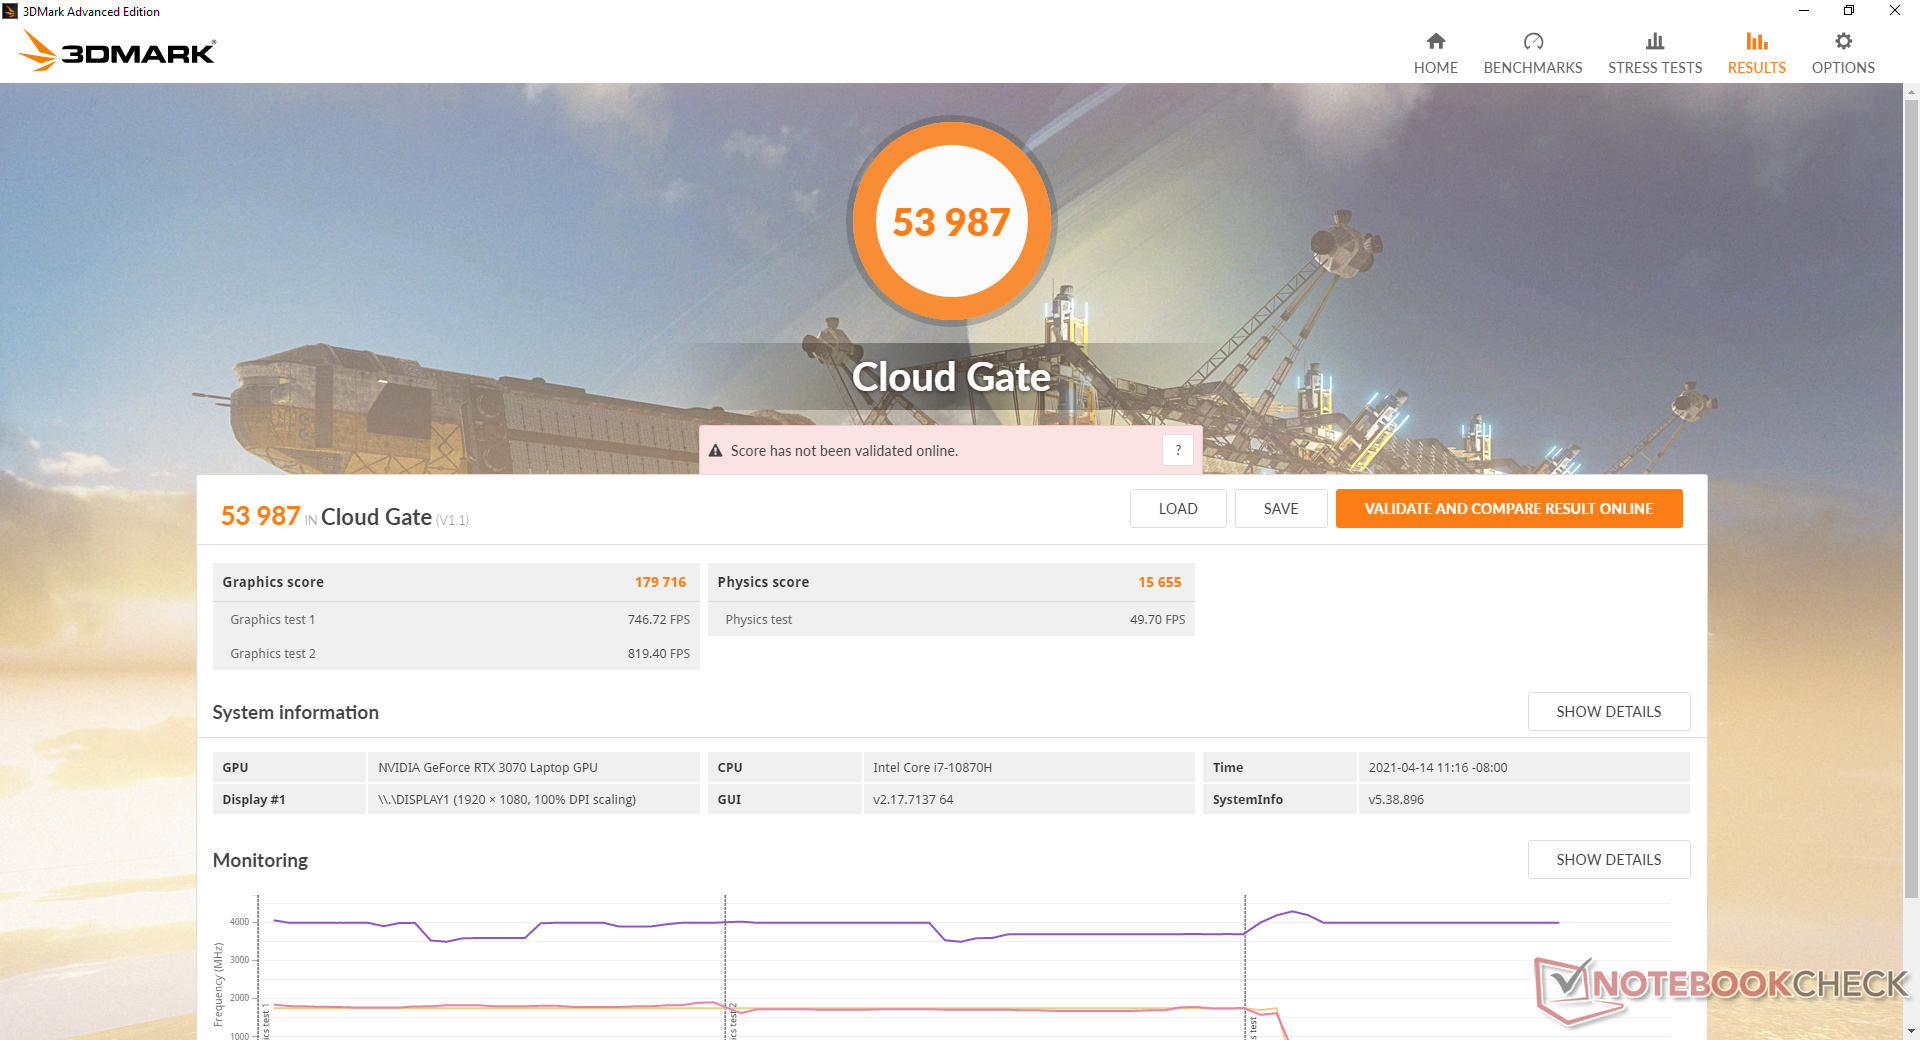
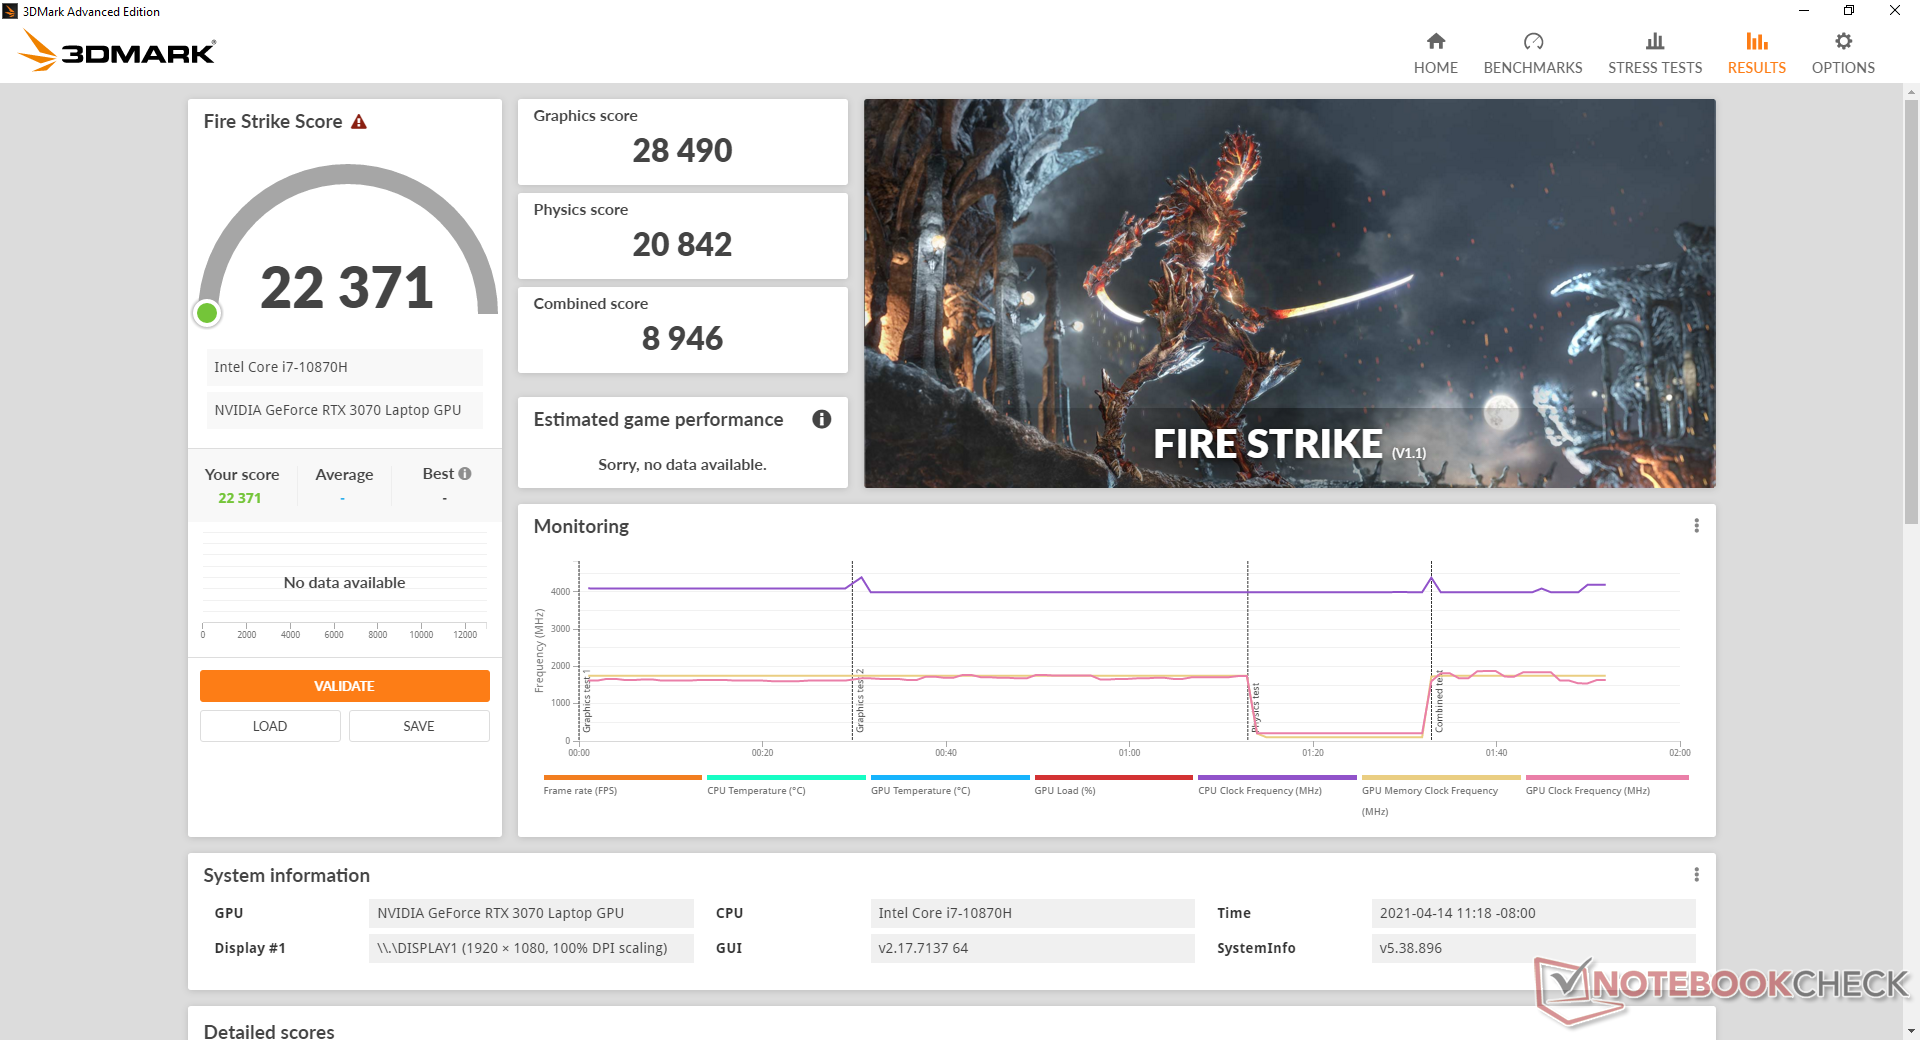
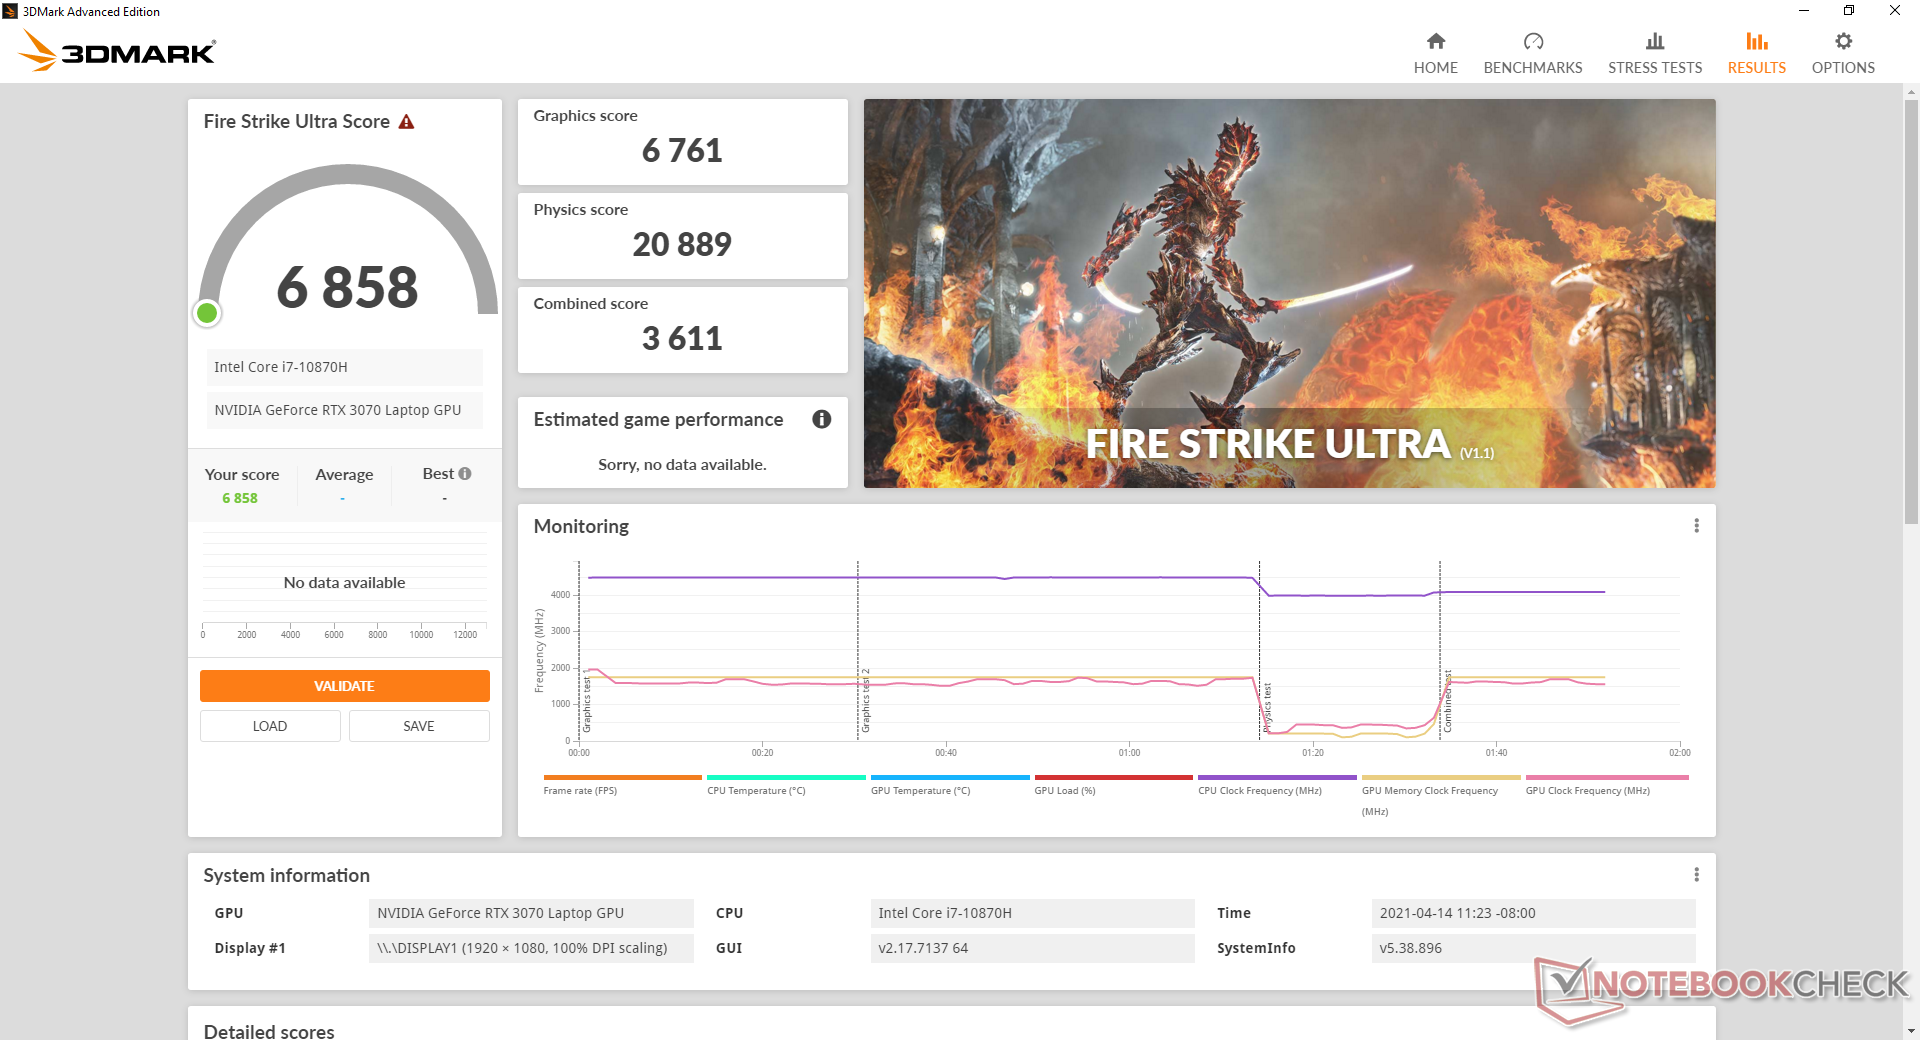
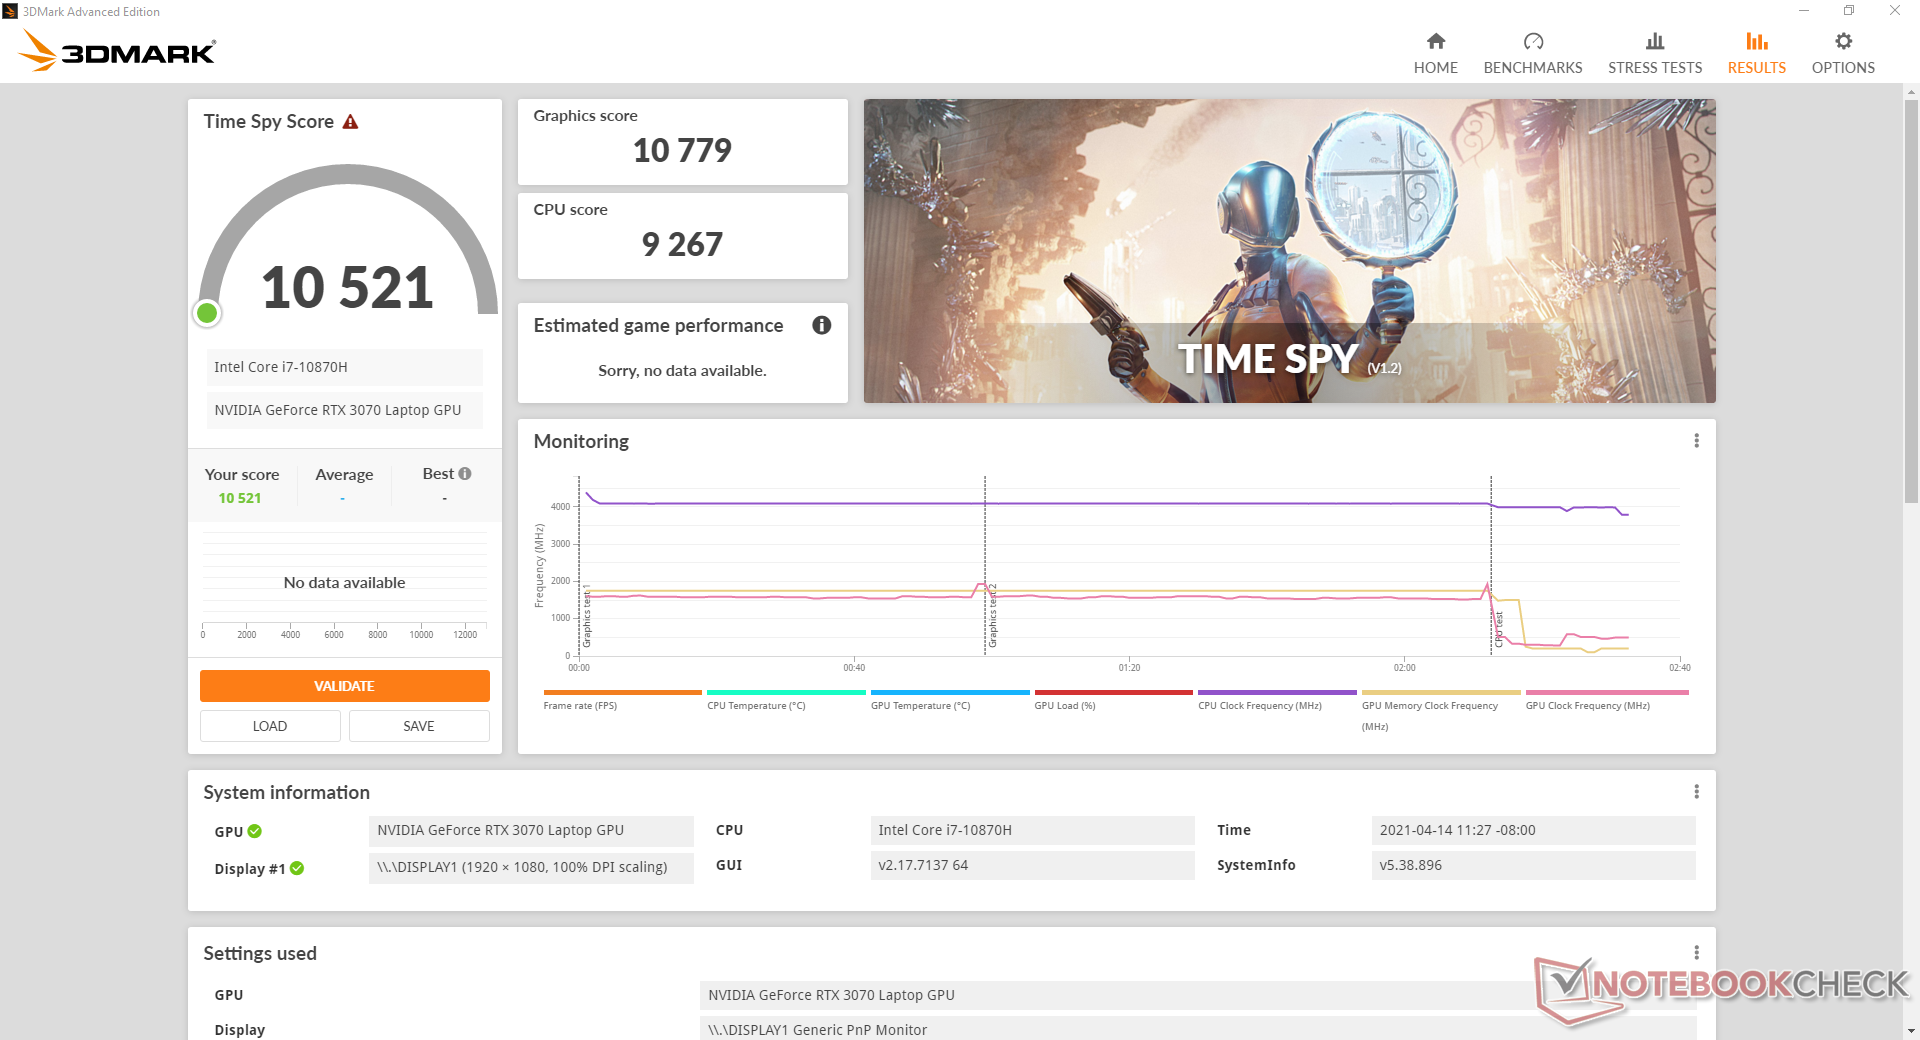
| 3DMark 11 Performance | 28106 punten | |
| 3DMark Cloud Gate Standard Score | 53987 punten | |
| 3DMark Fire Strike Score | 22371 punten | |
| 3DMark Time Spy Score | 10521 punten | |
Help | ||
| lage | gem. | hoge | ultra | |
|---|---|---|---|---|
| GTA V (2015) | 181 | 166 | 96.6 | |
| The Witcher 3 (2015) | 362.7 | 298.1 | 206.9 | 107.9 |
| Dota 2 Reborn (2015) | 156 | 141 | 141 | 135 |
| Final Fantasy XV Benchmark (2018) | 175 | 142 | 103 | |
| X-Plane 11.11 (2018) | 116 | 104 | 85.7 | |
| Strange Brigade (2018) | 399 | 279 | 225 | 194 |
Emissions
Systeemgeluid
De ventilatoren draaien stationair wanneer de laptop stationair draait op het bureaublad zonder andere actieve programma's. Echter, zelfs een lichte toename in CPU gebruik zal de CPU ventilator doen starten en dus zal de laptop niet echt stil zijn onder de meeste real-world scenario's. We registreren een geluid van 32,8 dB(A) tijdens het surfen op het web of het streamen van video tegen een stille achtergrond van 24,7 dB(A). Het is genoeg om merkbaar te zijn, maar niet bijzonder storend.
Het ventilatorgeluid tijdens gamen schommelt rond de 48,8 dB(A) zonder pulserend of onregelmatig toerentalgedrag. Dit is stiller dan wat we registreerden op de oudere GP65, terwijl het op gelijke voet staat met de nieuwste Alienware m15 R4, Aorus 15P, en Asus ROG Zephyrus G15, elk met RTX 30 graphics.
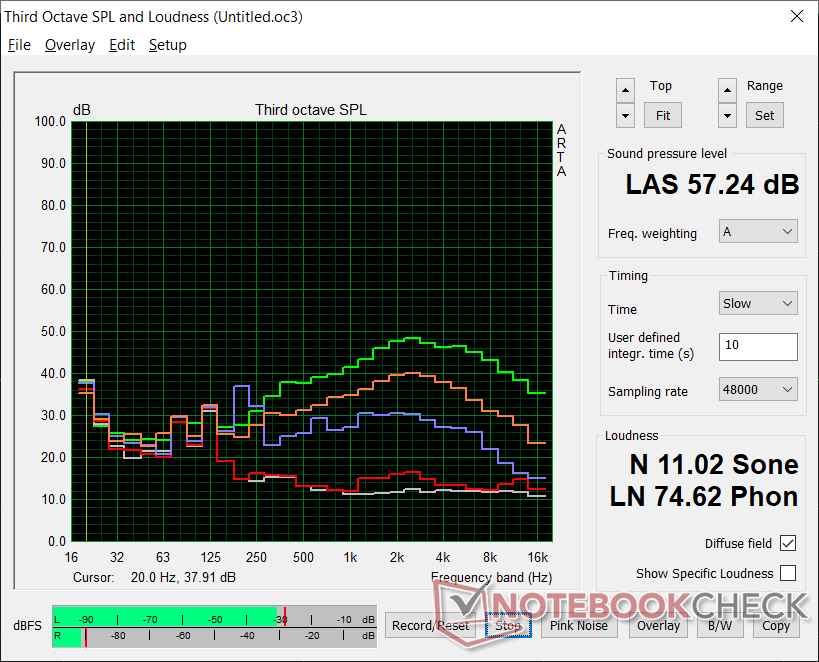
Als Cooler Boost (d.w.z. de maximale ventilatormodus) is ingeschakeld, springt het ventilatorgeluid onmiddellijk naar 57,2 dB(A), ongeacht de belasting van het scherm. Dit is een enorme toename in ventilatorgeluid voor niet al te veel prestatiewinst, zoals onze stresstest hieronder in detail zal beschrijven.
Ons testexemplaar vertoont een licht spoelgejank van 26,8 dB(A) tegen een achtergrond van 24,7 dB(A).
| MSI GP66 Leopard 10UG GeForce RTX 3070 Laptop GPU, i7-10870H, Kingston OM8PCP31024F | MSI GP65 10SFK-047US GeForce RTX 2070 Mobile, i7-10750H, Samsung SSD PM981 MZVLB1T0HALR | Alienware m15 R4 GeForce RTX 3070 Laptop GPU, i9-10980HK, Micron 2300 1TB MTFDHBA1T0TDV | Aorus 15P XC GeForce RTX 3070 Laptop GPU, i7-10870H, ESR512GTLCG-EAC-4 | Asus ROG Zephyrus G15 GA503Q GeForce RTX 3080 Laptop GPU, R9 5900HS, SK Hynix HFM001TD3JX013N | MSI GF65 Thin 10UE GeForce RTX 3060 Laptop GPU, i7-10750H, Samsung SSD PM981 MZVLB1T0HALR | |
|---|---|---|---|---|---|---|
| Noise | -15% | -4% | -4% | -4% | -9% | |
| uit / omgeving * (dB) | 24.7 | 29.3 -19% | 24 3% | 24 3% | 25 -1% | 24.7 -0% |
| Idle Minimum * (dB) | 26.8 | 31.9 -19% | 25 7% | 25 7% | 26 3% | 33.1 -24% |
| Idle Average * (dB) | 26.8 | 31.9 -19% | 26 3% | 29 -8% | 27 -1% | 33.1 -24% |
| Idle Maximum * (dB) | 26.8 | 33.5 -25% | 37 -38% | 34 -27% | 31 -16% | 33.1 -24% |
| Load Average * (dB) | 40.4 | 47 -16% | 48 -19% | 44 -9% | 49 -21% | 42.7 -6% |
| Witcher 3 ultra * (dB) | 48.8 | 53.8 -10% | 47 4% | 49 -0% | 49 -0% | 40.6 17% |
| Load Maximum * (dB) | 57.2 | 56.7 1% | 49 14% | 53 7% | 51 11% | 59.4 -4% |
* ... kleiner is beter
Geluidsniveau
| Onbelast |
| 26.8 / 26.8 / 26.8 dB (A) |
| Belasting |
| 40.4 / 57.2 dB (A) |
 | ||
30 dB stil 40 dB(A) hoorbaar 50 dB(A) luid |
||
min: | ||
Temperatuur
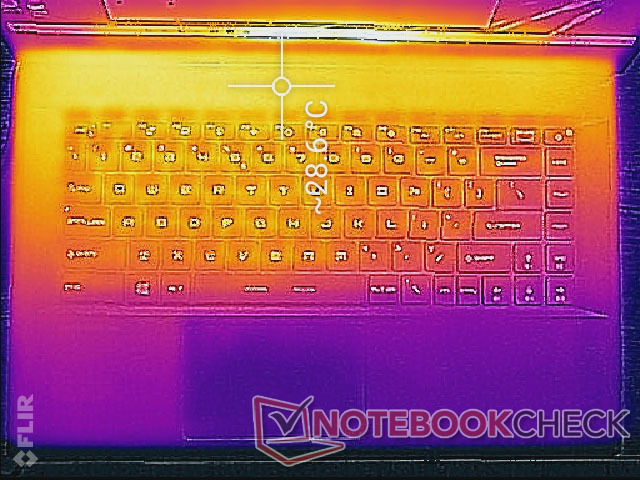
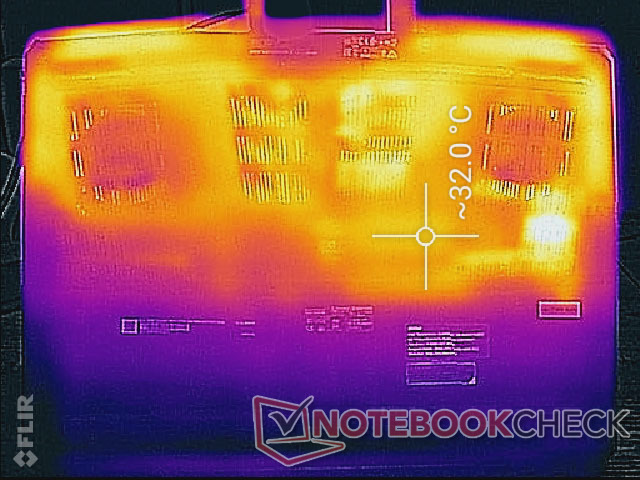
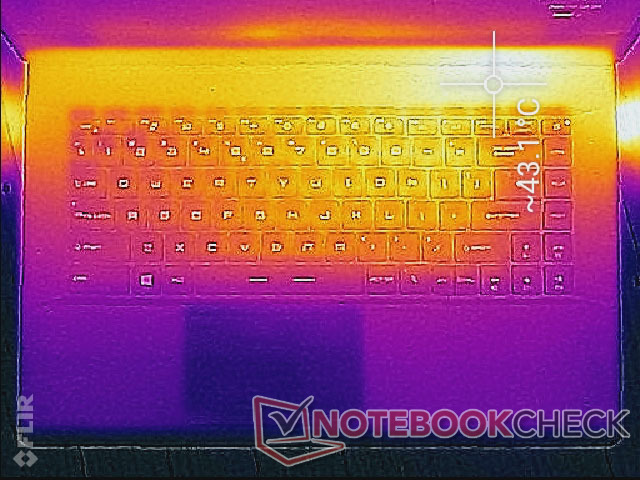
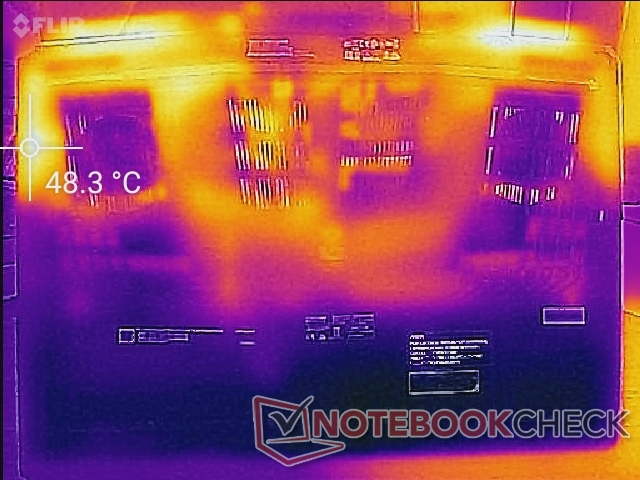
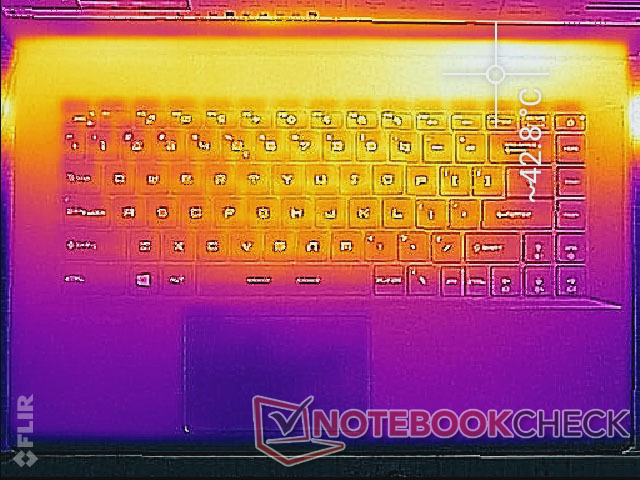
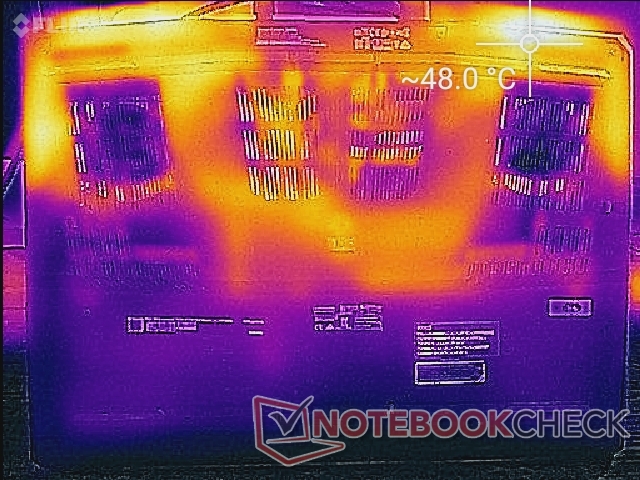
De oppervlaktetemperaturen zijn iets koeler dan op de GP65. Tijdens het gamen bereiken de hotspots op de GP66 een temperatuur van 43 C en 48 C aan respectievelijk de boven- en onderkant van de voet, vergeleken met 46 C tot 50 C op de GP65. Bovendien bevinden de hotspots zich nu boven de eerste rij toetsen van het toetsenbord voor een koelere type-ervaring, terwijl de hotspots op de GP65 en zelfs GS66 zich dichter bij het midden van de toetsen bevinden.
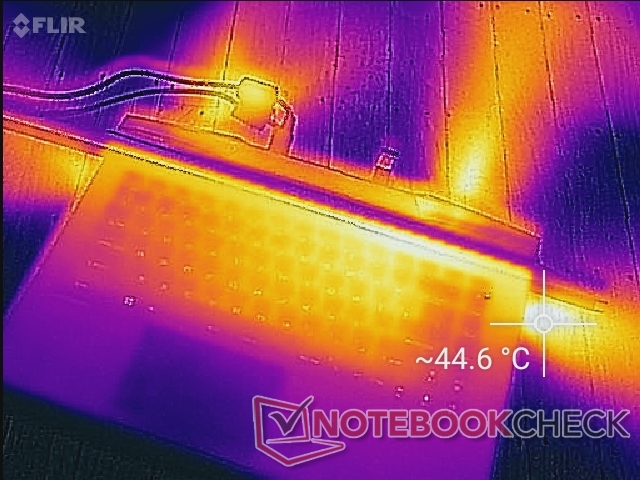
(±) De maximumtemperatuur aan de bovenzijde bedraagt 42.8 °C / 109 F, vergeleken met het gemiddelde van 40.4 °C / 105 F, variërend van 21.2 tot 68.8 °C voor de klasse Gaming.
(-) De bodem warmt op tot een maximum van 50 °C / 122 F, vergeleken met een gemiddelde van 43.2 °C / 110 F
(+) Bij onbelast gebruik bedraagt de gemiddelde temperatuur voor de bovenzijde 29.4 °C / 85 F, vergeleken met het apparaatgemiddelde van 33.9 °C / 93 F.
(±) Bij het spelen van The Witcher 3 is de gemiddelde temperatuur voor de bovenzijde 33.4 °C / 92 F, vergeleken met het apparaatgemiddelde van 33.9 °C / 93 F.
(+) De palmsteunen en het touchpad zijn met een maximum van ###max## °C / 78.4 F koeler dan de huidtemperatuur en voelen daarom koel aan.
(+) De gemiddelde temperatuur van de handpalmsteun van soortgelijke toestellen bedroeg 28.8 °C / 83.8 F (+3 °C / 5.4 F).
Stresstest
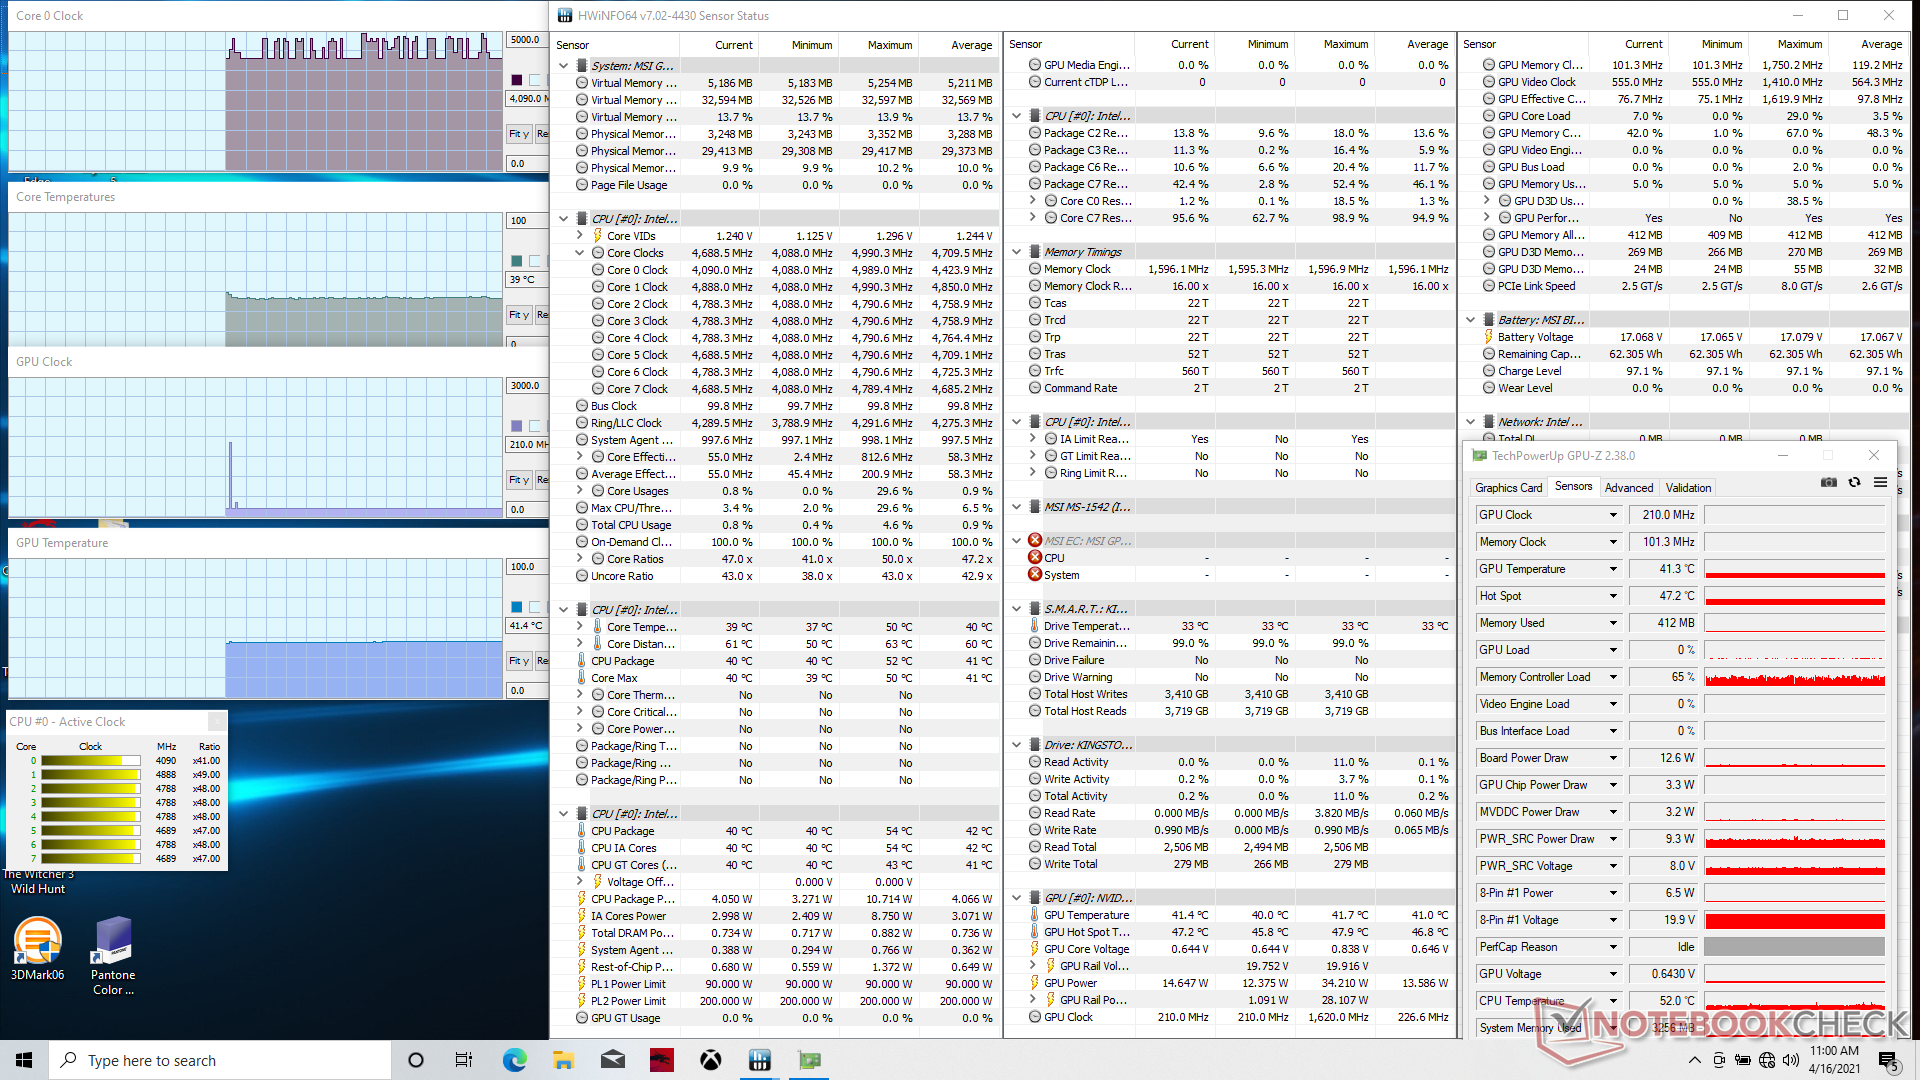
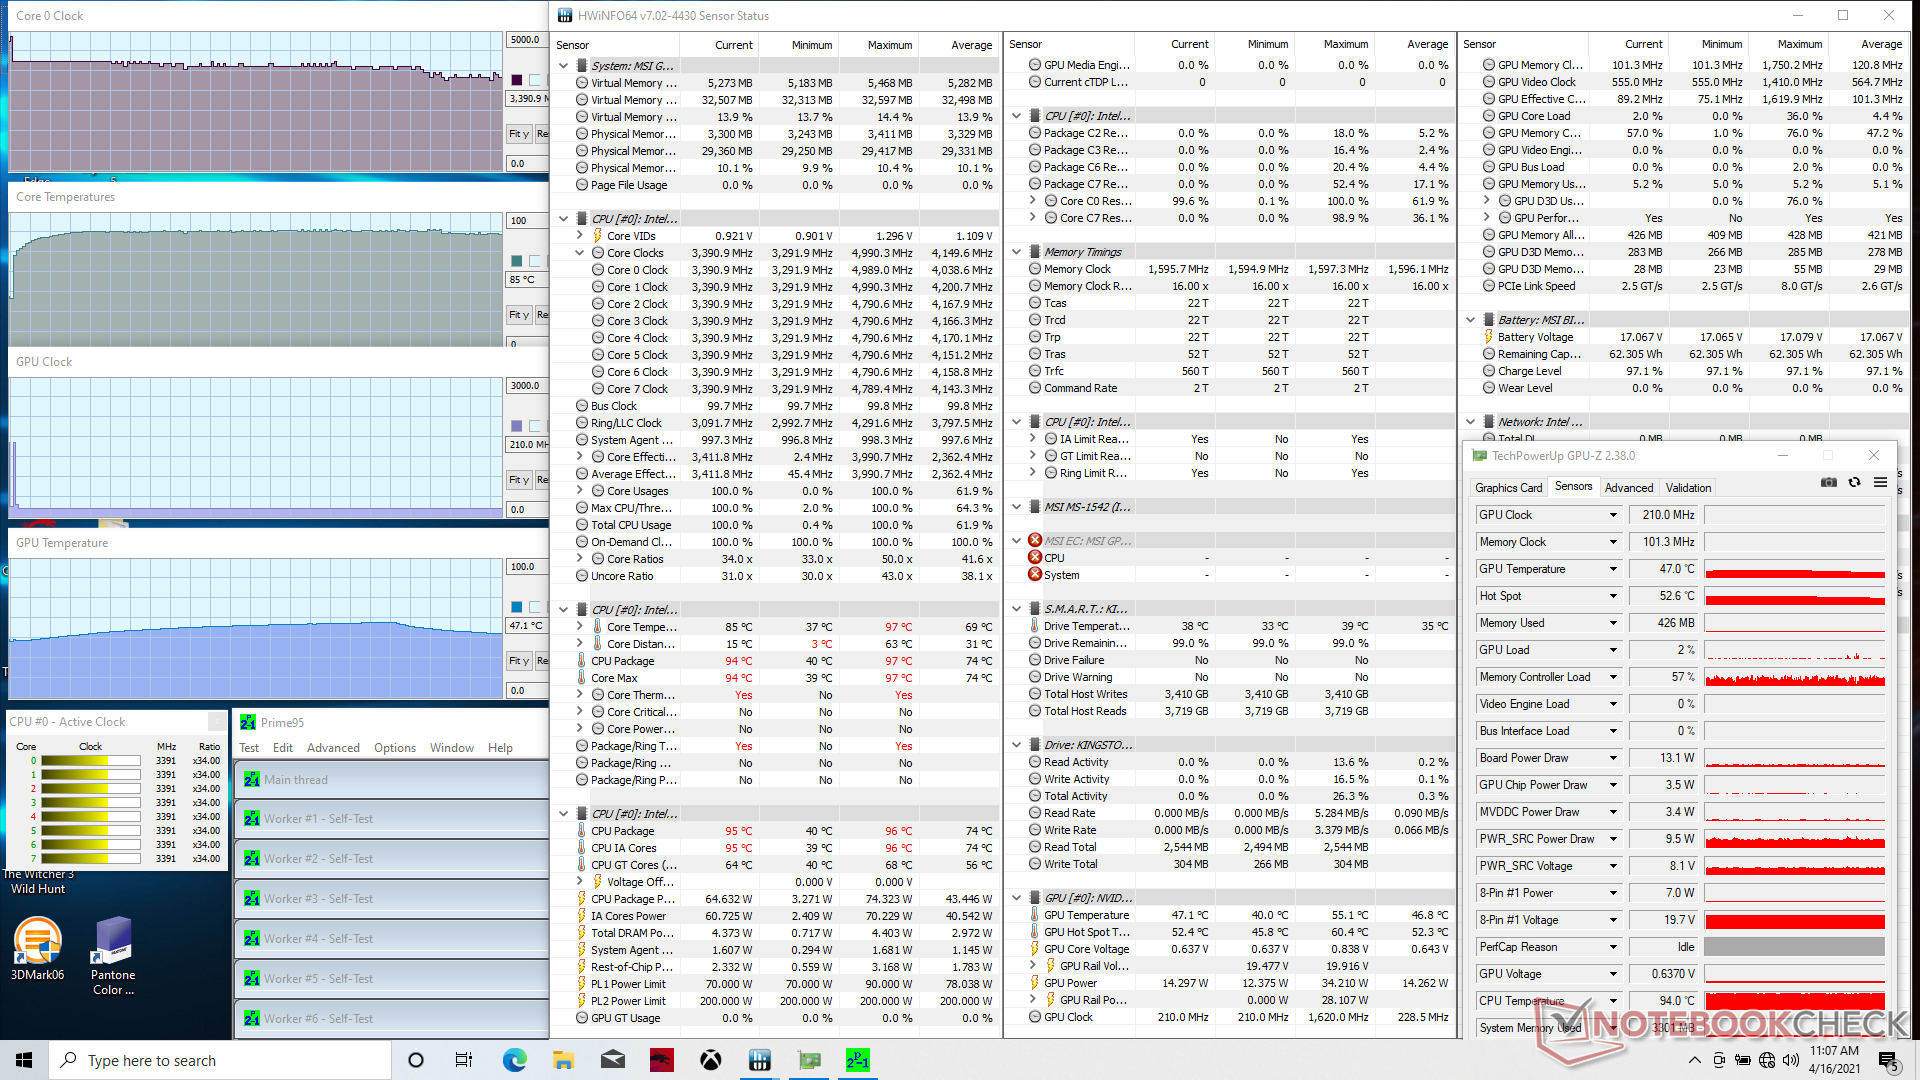
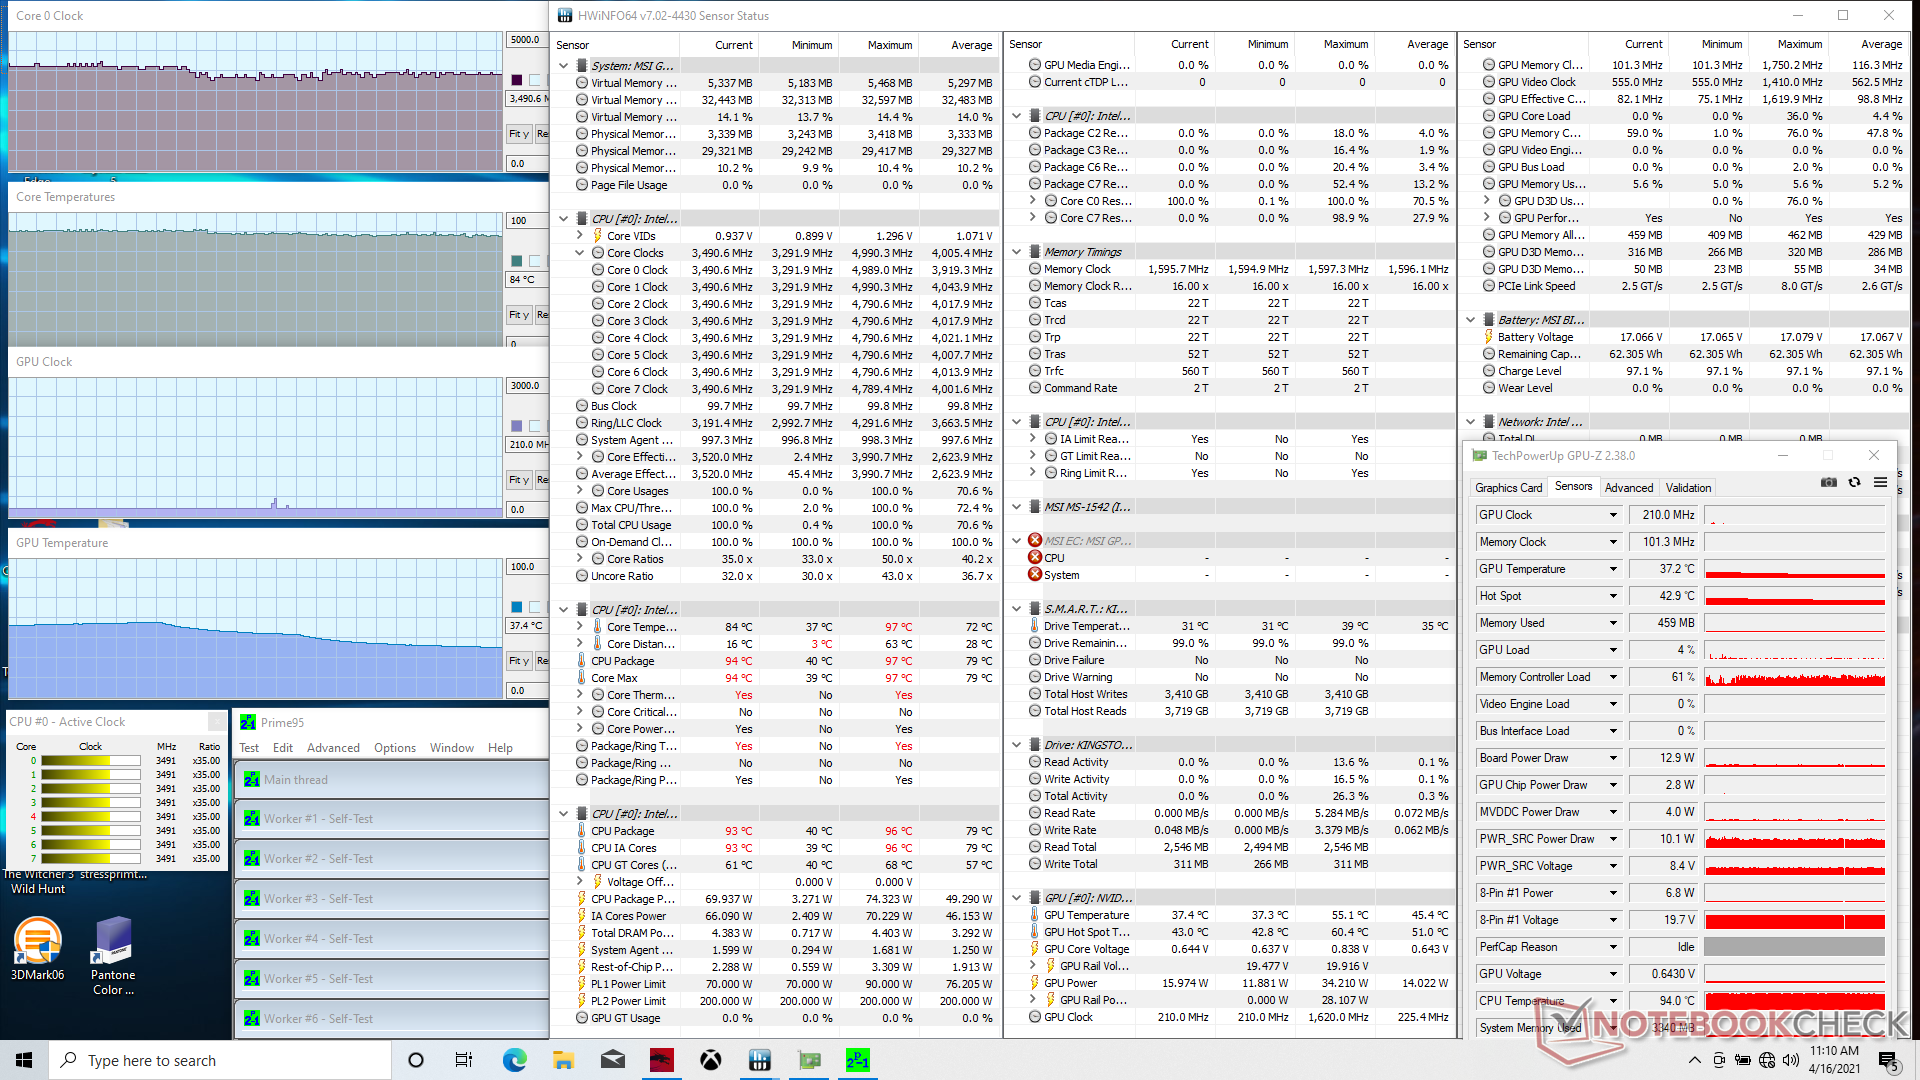
Bij het draaien van Prime95 om de processor te belasten, werd de CPU kloksnelheid opgevoerd tot 4 GHz totdat ongeveer 20 seconden later een kerntemperatuur van 88 C werd bereikt. Daarna daalde de kloksnelheid gestaag en stabiliseerde op 3,2 tot 3,4 GHz om een iets koelere kerntemperatuur van 85 C te handhaven. Het inschakelen van de Cooler Boost modus resulteerde in slechts zeer kleine veranderingen in de CPU kloksnelheid en temperatuur.
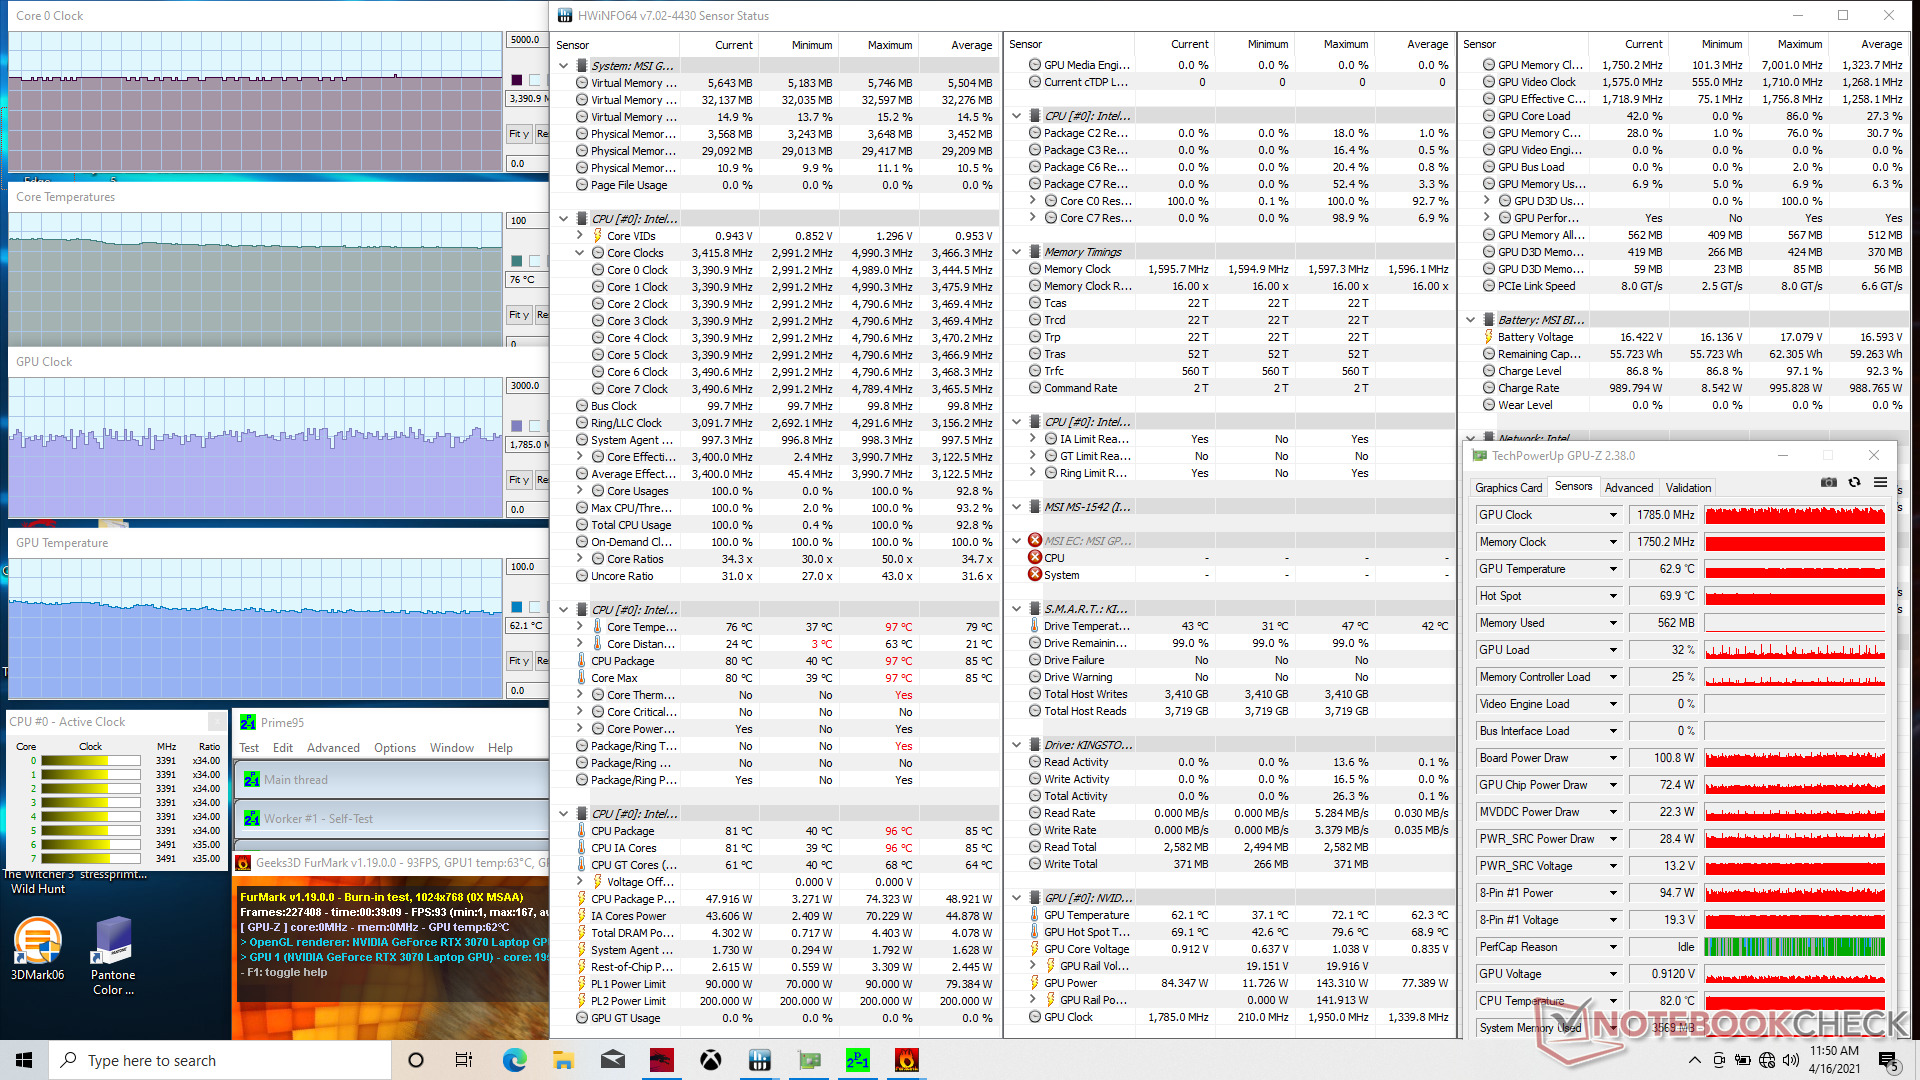
Het gelijktijdig draaien van Prime95 en FurMark zou resulteren in stabiele CPU en GPU temperaturen van respectievelijk 82 C en 70 C. Als Cooler Boost is ingeschakeld, zouden de kerntemperaturen elk met ongeveer 8 C dalen.
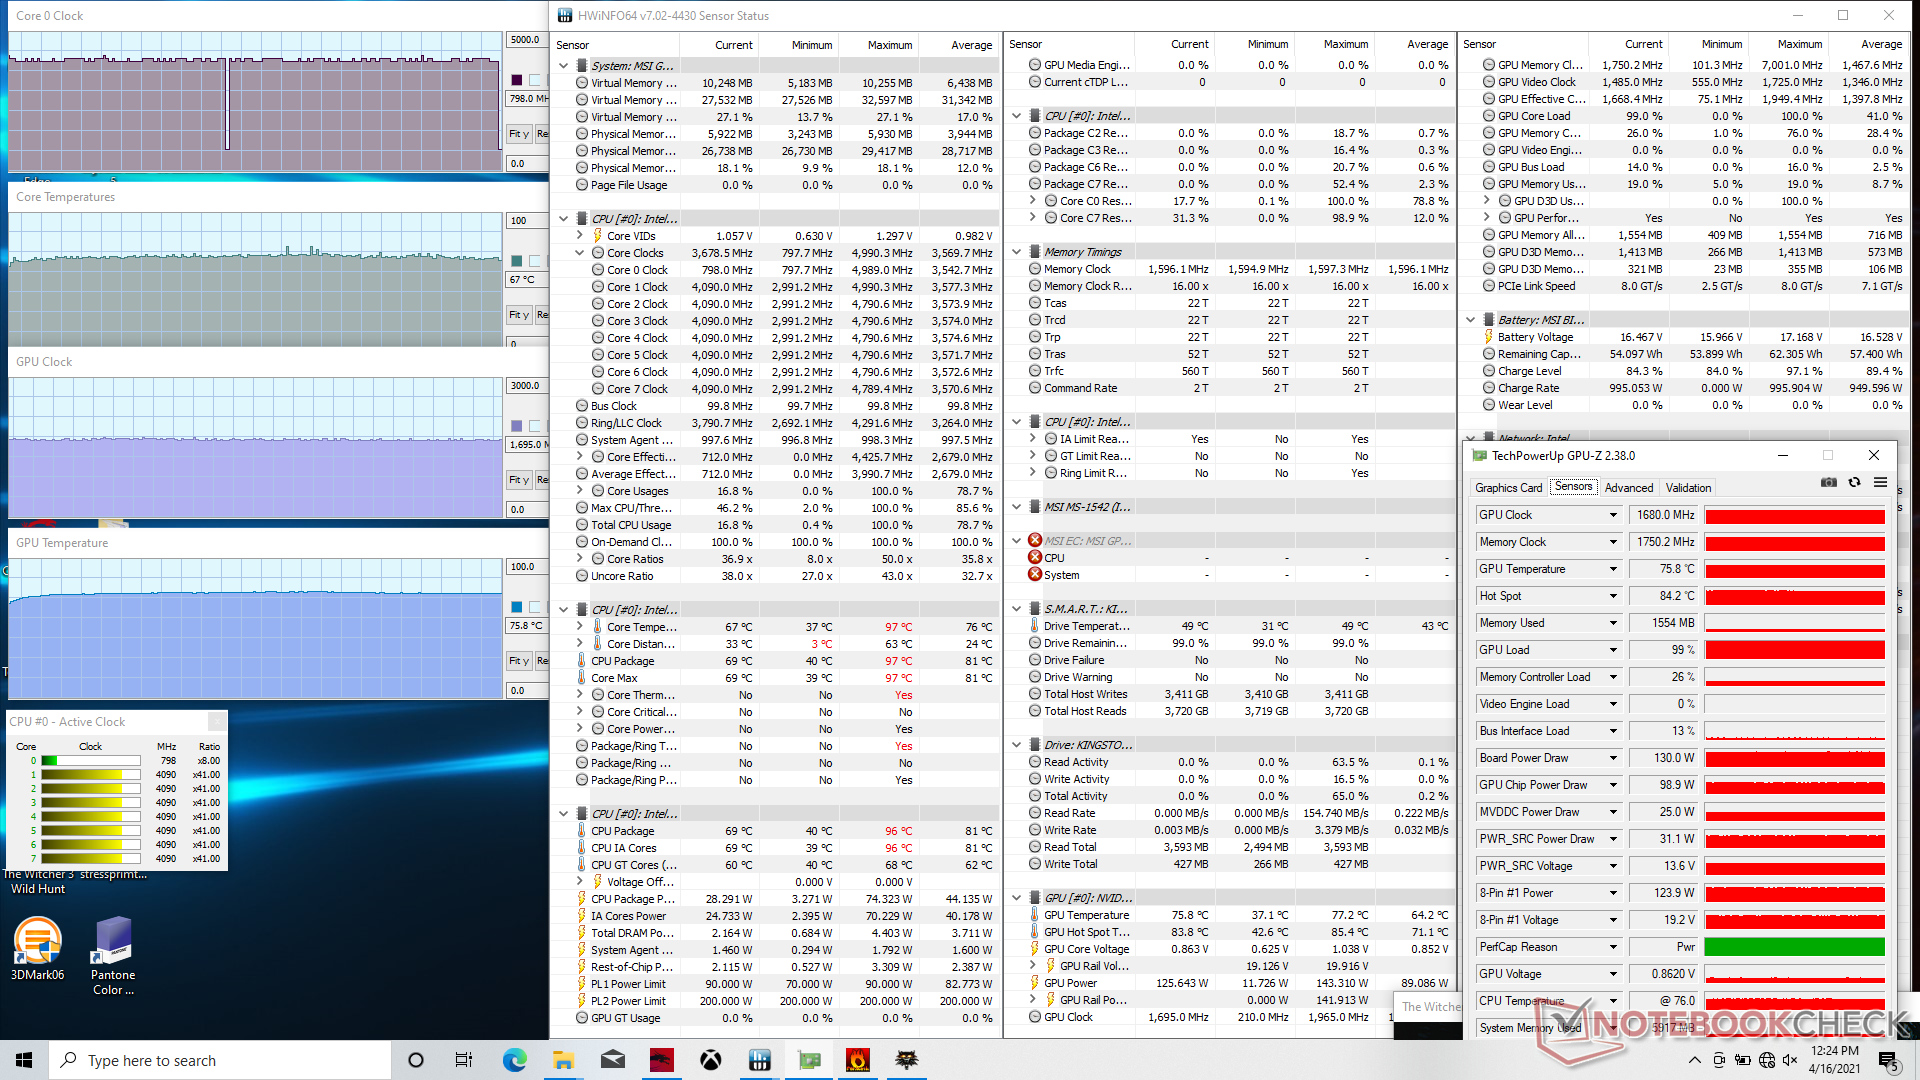
Wanneer Witcher 3 wordt uitgevoerd om echte gaming stress weer te geven, zouden de kerntemperaturen stabiliseren in het 67 C tot 76 C bereik als Cooler Boost is uitgeschakeld en 63 tot 69 C bereik als Cooler Boost is ingeschakeld. GPU kloksnelheden zouden ook licht toenemen van 1680 MHz tot 1755 MHz met een bord stroomverbruik van 120 W tot 130 W zoals geadverteerd door de fabrikant. Het uitvoeren van dezelfde test op de GP65 zou resulteren in warmere CPU en GPU temperaturen van 96 C en 79 C.
Het werken op batterijen zal de prestaties beperken. Een Fire Strike test op batterijvoeding leverde Natuurkunde en Grafische scores op van respectievelijk 12004 en 6385 punten, vergeleken met 20842 en 28490 punten op netstroom.


| CPUklok (GHz) GPUklok (MHz) GemiddeldeCPU temperatuur (°C) GemiddeldeGPU temperatuur (°C) |
| Systeem in ruststand |
| Prime95 Stress (Cooler Boost uit) |
| Prime95 Stress (Cooler Boost aan) |
| Prime95 + FurMark Stress (Cooler Boost uit) |
| Prime95 + FurMark Stress (Cooler Boost aan) |
| Witcher 3 Stress (Cooler Boost uit) |
| Witcher 3 Stress (Cooler Boost aan) |
Sprekers


MSI GP66 Leopard 10UG audioanalyse
(±) | luidspreker luidheid is gemiddeld maar goed (81.3 dB)
Bas 100 - 315 Hz
(-) | bijna geen lage tonen - gemiddeld 18.4% lager dan de mediaan
(±) | lineariteit van de lage tonen is gemiddeld (11% delta ten opzichte van de vorige frequentie)
Midden 400 - 2000 Hz
(±) | hogere middens - gemiddeld 5.1% hoger dan de mediaan
(+) | de middentonen zijn lineair (4.6% delta ten opzichte van de vorige frequentie)
Hoog 2 - 16 kHz
(±) | higher highs - on average 5.9% higher than median
(±) | lineariteit van de hoogtepunten is gemiddeld (9.2% delta ten opzichte van de vorige frequentie)
Algemeen 100 - 16.000 Hz
(±) | lineariteit van het totale geluid is gemiddeld (19.3% verschil met de mediaan)
Vergeleken met dezelfde klasse
» 65% van alle geteste apparaten in deze klasse waren beter, 8% vergelijkbaar, 27% slechter
» De beste had een delta van 6%, het gemiddelde was 18%, de slechtste was 132%
Vergeleken met alle geteste toestellen
» 47% van alle geteste apparaten waren beter, 8% gelijk, 46% slechter
» De beste had een delta van 4%, het gemiddelde was 23%, de slechtste was 134%
Apple MacBook 12 (Early 2016) 1.1 GHz audioanalyse
(+) | luidsprekers kunnen relatief luid spelen (83.6 dB)
Bas 100 - 315 Hz
(±) | verminderde zeebaars - gemiddeld 11.3% lager dan de mediaan
(±) | lineariteit van de lage tonen is gemiddeld (14.2% delta ten opzichte van de vorige frequentie)
Midden 400 - 2000 Hz
(+) | evenwichtige middens - slechts 2.4% verwijderd van de mediaan
(+) | de middentonen zijn lineair (5.5% delta ten opzichte van de vorige frequentie)
Hoog 2 - 16 kHz
(+) | evenwichtige hoogtepunten - slechts 2% verwijderd van de mediaan
(+) | de hoge tonen zijn lineair (4.5% delta naar de vorige frequentie)
Algemeen 100 - 16.000 Hz
(+) | het totale geluid is lineair (10.2% verschil met de mediaan)
Vergeleken met dezelfde klasse
» 7% van alle geteste apparaten in deze klasse waren beter, 2% vergelijkbaar, 90% slechter
» De beste had een delta van 5%, het gemiddelde was 18%, de slechtste was 53%
Vergeleken met alle geteste toestellen
» 5% van alle geteste apparaten waren beter, 1% gelijk, 94% slechter
» De beste had een delta van 4%, het gemiddelde was 23%, de slechtste was 134%
Energy Management
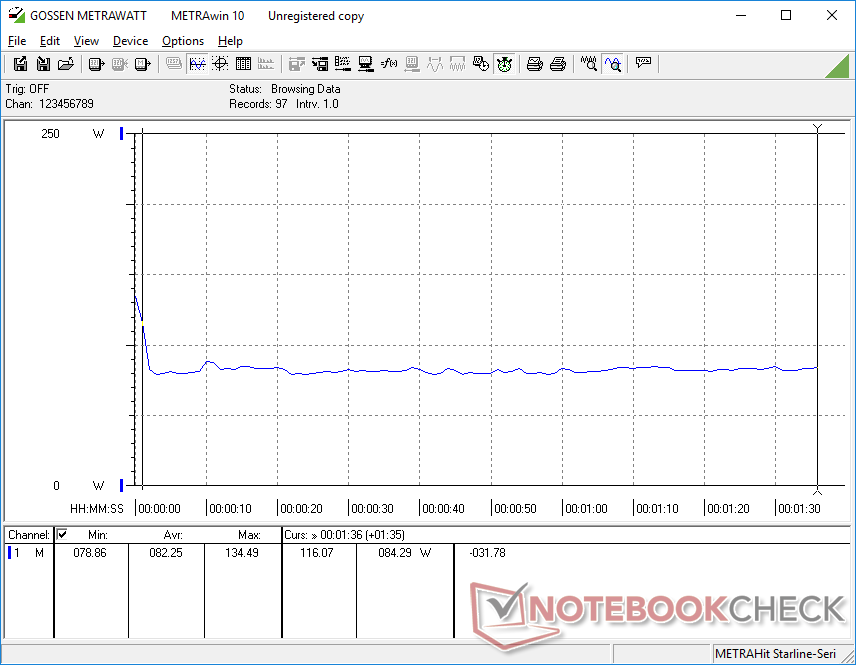
Stroomverbruik
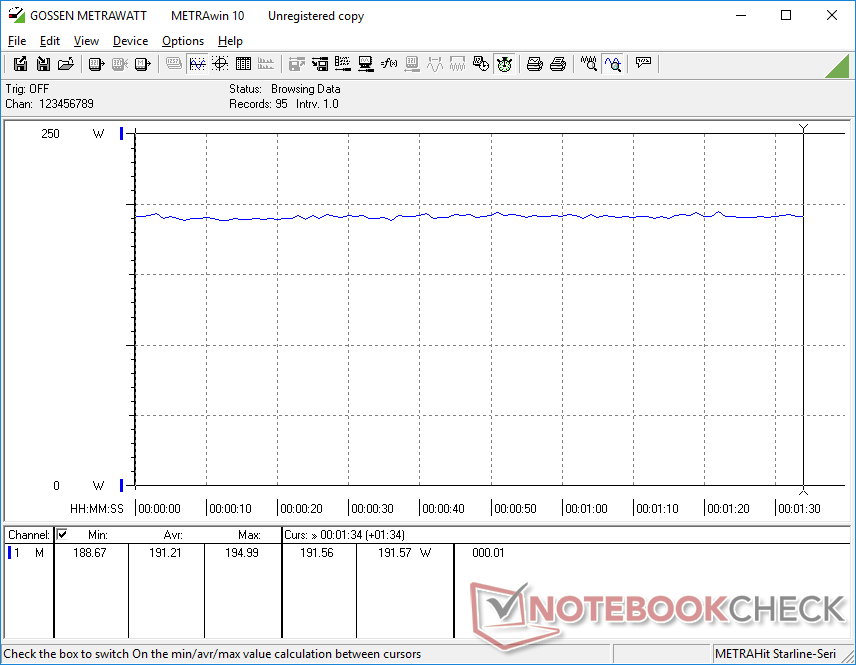
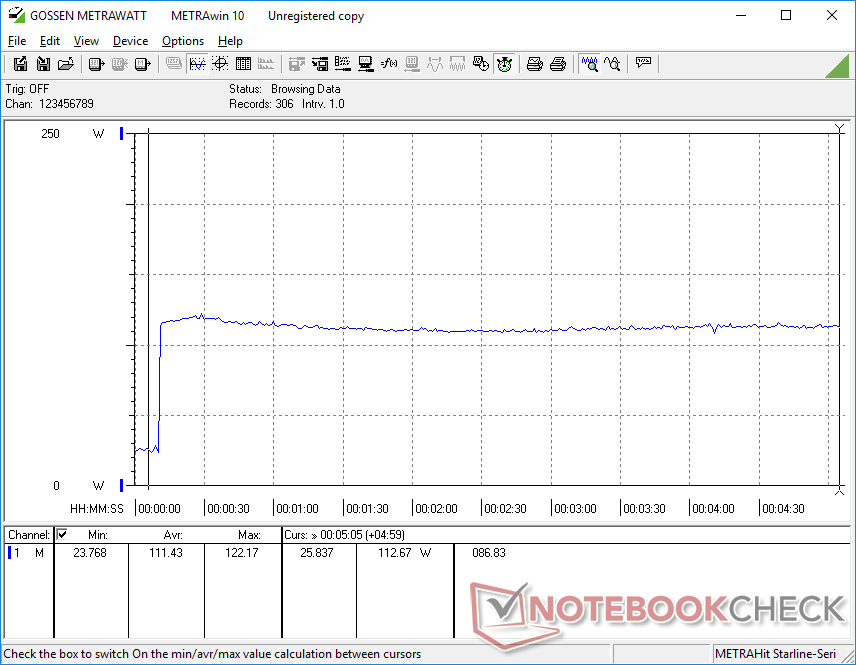
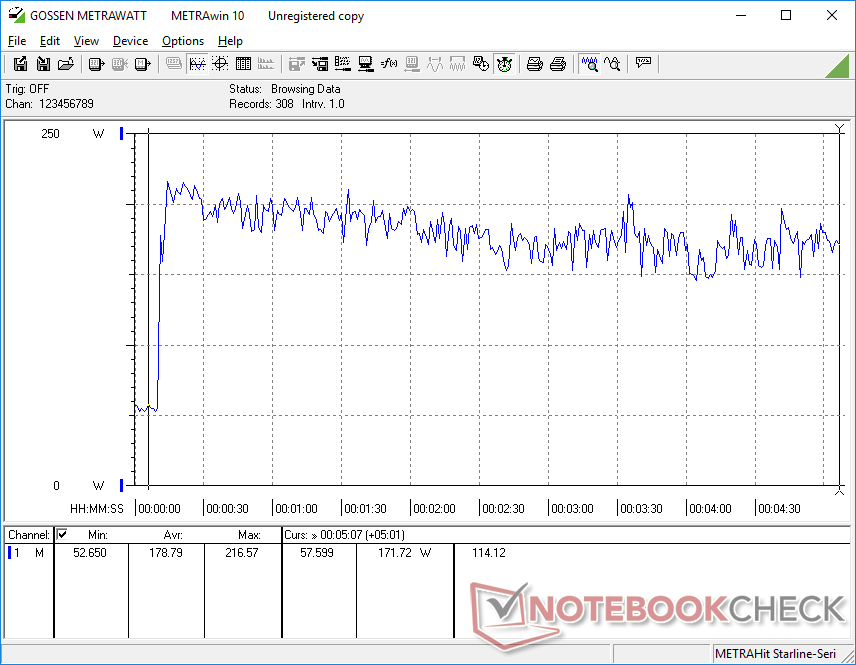
Het totale stroomverbruik ligt een stuk dichter bij de GP65 dan we hadden verwacht. Stationair draaien op de desktop verbruikt bijvoorbeeld tussen 13 W en 23 W, wat bijna overeenkomt met de GP65. Op Witcher 3 zou gemiddeld 191 W zijn, slechts 3 procent meer dan op de GP65, terwijl de grafische prestaties met 40 tot 45 procent toenemen. De gen-op-gen toename in prestaties-per-watt is in dit opzicht indrukwekkend
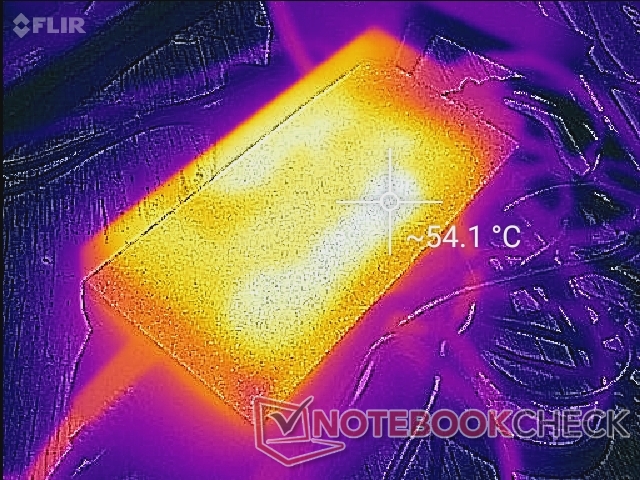
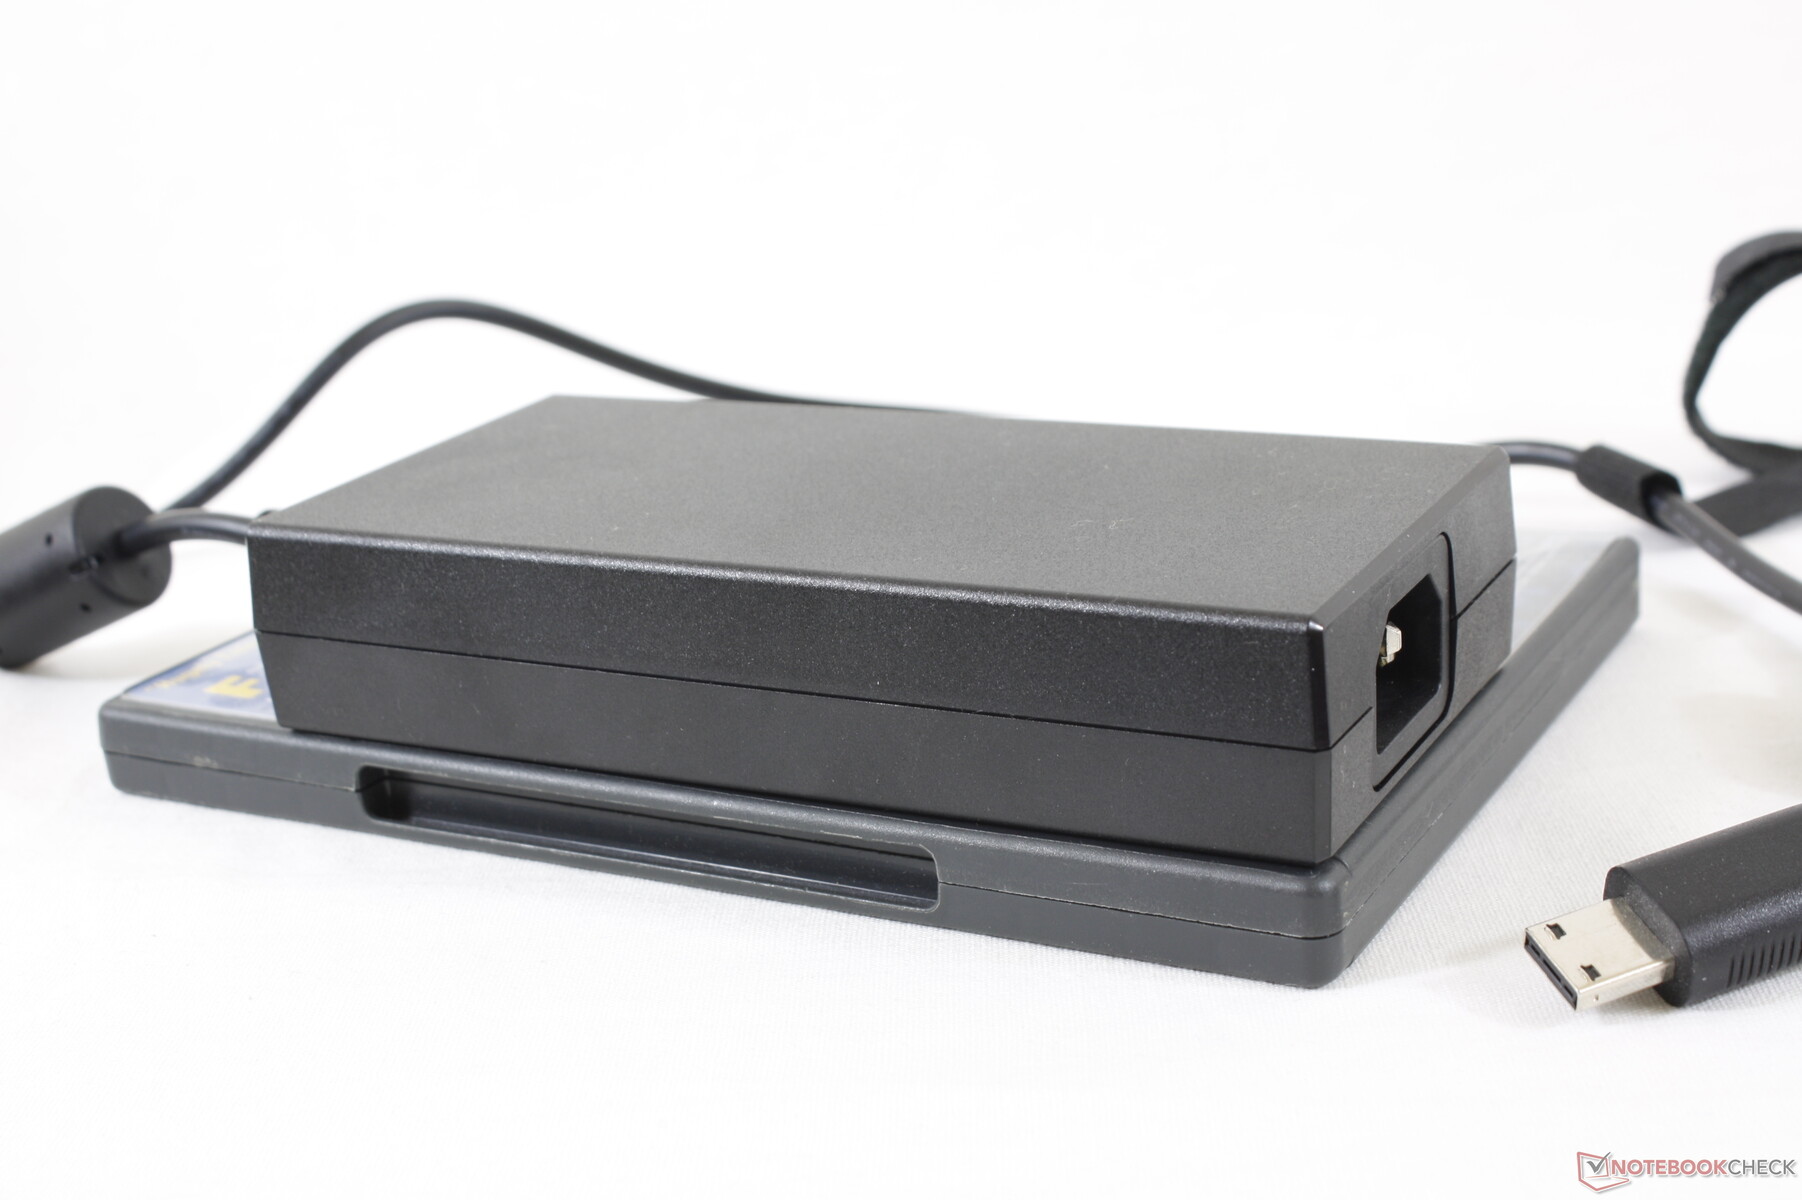
We zijn in staat om een maximale trek van 216 W van de middelgrote (~15,3 x 7,3 x 3,0 cm) 230 W AC-adapter te registreren.
| Uit / Standby | |
| Inactief | |
| Belasting |
|
Key:
min: | |
| MSI GP66 Leopard 10UG i7-10870H, GeForce RTX 3070 Laptop GPU, Kingston OM8PCP31024F, IPS, 1920x1080, 15.6" | MSI GP65 10SFK-047US i7-10750H, GeForce RTX 2070 Mobile, Samsung SSD PM981 MZVLB1T0HALR, IPS, 1920x1080, 15.6" | Alienware m15 R4 i9-10980HK, GeForce RTX 3070 Laptop GPU, Micron 2300 1TB MTFDHBA1T0TDV, IPS, 1920x1080, 15.6" | Aorus 15P XC i7-10870H, GeForce RTX 3070 Laptop GPU, ESR512GTLCG-EAC-4, IPS, 1920x1080, 15.6" | Asus ROG Zephyrus G15 GA503Q R9 5900HS, GeForce RTX 3080 Laptop GPU, SK Hynix HFM001TD3JX013N, IPS-Level, 2560x1440, 15.6" | MSI GF65 Thin 10UE i7-10750H, GeForce RTX 3060 Laptop GPU, Samsung SSD PM981 MZVLB1T0HALR, IPS, 1920x1080, 15.6" | |
|---|---|---|---|---|---|---|
| Power Consumption | -2% | -68% | -8% | 21% | 29% | |
| Idle Minimum * (Watt) | 15.3 | 14.2 7% | 35 -129% | 14 8% | 10 35% | 5.4 65% |
| Idle Average * (Watt) | 21.2 | 18.8 11% | 39 -84% | 17 20% | 12 43% | 12.8 40% |
| Idle Maximum * (Watt) | 22.3 | 23.9 -7% | 48 -115% | 33 -48% | 17 24% | 19.5 13% |
| Load Average * (Watt) | 82.3 | 96.9 -18% | 135 -64% | 96 -17% | 108 -31% | 86.6 -5% |
| Witcher 3 ultra * (Watt) | 191.2 | 185 3% | 194 -1% | 179 6% | 123 36% | 115.7 39% |
| Load Maximum * (Watt) | 216.6 | 233.4 -8% | 252 -16% | 256 -18% | 182 16% | 175.2 19% |
* ... kleiner is beter
Levensduur batterij
De batterijcapaciteit is toegenomen van 51 Wh bij de GP65 tot 65 Wh bij de GP66. De WLAN runtimes zijn nu ook veel langer met iets meer dan 5 uur om bijna 1,5 uur langer te zijn dan wat we registreerden op de GP65.
De maximale batterijduur had echter beter gekund. Het systeem instellen op de Super Battery mode met de helderheid op minimum en de iGPU actief zou resulteren in een totale runtime van slechts 6,5 uur, wat niet veel langer is dan onze WLAN instellingen.
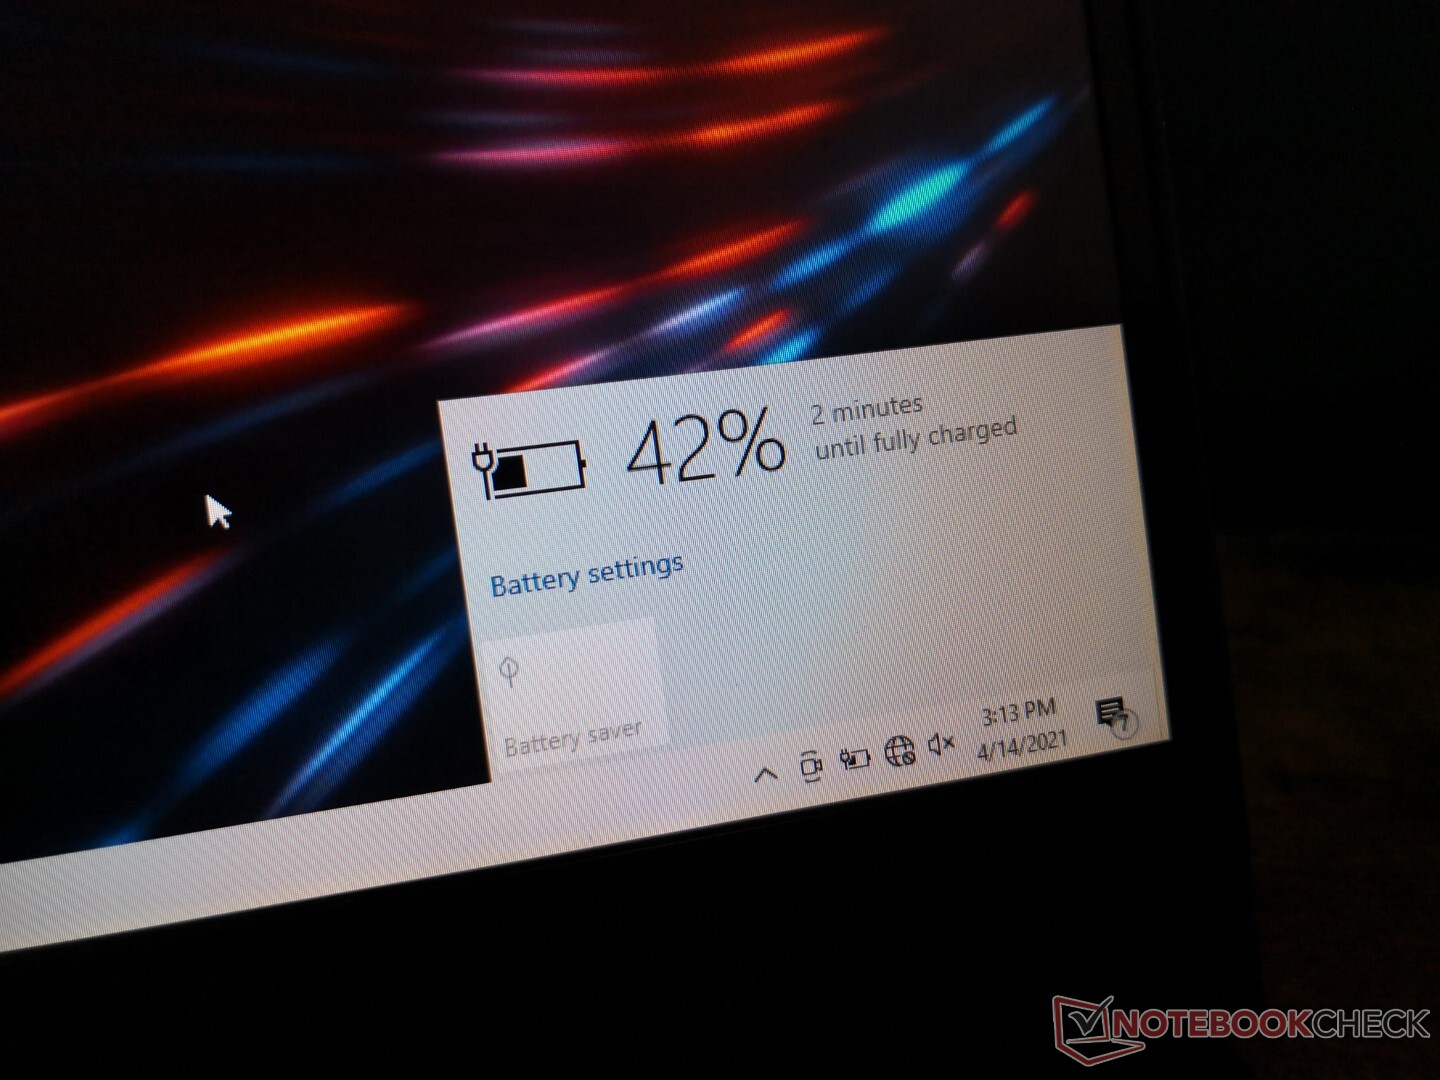
De oplaadsnelheid van leeg naar volledig is zeer traag met meer dan 4 uur met de meegeleverde AC adapter. We vermoeden dat er een fout in het opladen zit omdat de geschatte oplaadtijd soms ook onnauwkeurig is. De meeste andere laptops zijn in vergelijking in slechts 1,5 tot 2 uur volledig opgeladen.
De batterij laadt zelfs langzamer of helemaal niet op wanneer je games speelt. Bijvoorbeeld, spelen Witcher 3 op netstroom met een acculading van 20 procent gedurende een uur zou de accu slechts tot 23 procent worden opgeladen (of +3 procent in de loop van een uur).
| MSI GP66 Leopard 10UG i7-10870H, GeForce RTX 3070 Laptop GPU, 65 Wh | MSI GP65 10SFK-047US i7-10750H, GeForce RTX 2070 Mobile, 51 Wh | Alienware m15 R4 i9-10980HK, GeForce RTX 3070 Laptop GPU, 86 Wh | Aorus 15P XC i7-10870H, GeForce RTX 3070 Laptop GPU, 99 Wh | Asus ROG Zephyrus G15 GA503Q R9 5900HS, GeForce RTX 3080 Laptop GPU, 90 Wh | MSI GF65 Thin 10UE i7-10750H, GeForce RTX 3060 Laptop GPU, 51 Wh | |
|---|---|---|---|---|---|---|
| Batterijduur | -27% | -34% | 42% | 72% | 23% | |
| Reader / Idle (h) | 6.6 | 3.7 -44% | 9.5 44% | 12.1 83% | 11.1 68% | |
| WiFi v1.3 (h) | 5.1 | 3.7 -27% | 2.7 -47% | 6.7 31% | 9.4 84% | 4.6 -10% |
| Load (h) | 1 | 0.9 -10% | 1.5 50% | 1.5 50% | 1.1 10% |
Pro
Contra
Uitspraak
Na twee jaar met de GP65 ontwerp, is de GP66 volledig vernieuwd en over het geheel genomen een enorme verbetering. Hij is misschien een beetje groter geworden van gen tot gen, maar de toename in formaat voelt gerechtvaardigd gezien de sprong in grafische prestaties, verbeteringen in het ventilatorgeluid, koelere kerntemperaturen, een gestroomlijnder ontwerp en een langere batterijlevensduur. De algemene indrukken komen erg dicht in de buurt van de GE66, die het duurdere model zou moeten zijn.
De GP66 doet zijn naam eer aan in het middensegment en is even goed als veel modellen in het hogere segment.
Er staat echter een grote asterisk boven "middenklasse", want de GP66 is op dit moment niet goedkoop, ondanks zijn classificatie. De prijzen variëren wild van $2500 tot $3000 USD om in de high-end of liefhebber categorie te vallen. We hopen dat dit slechts een bevoorradingsprobleem is dat in korte tijd kan worden opgelost, want we zien de GP66 zeker een populair model worden vanwege zijn bovengemiddelde attributen over de hele linie.
Ongeacht zijn high-end prijs, is dit nog steeds een mid-range gaming laptop en dus moeten gebruikers zich bewust zijn van zijn tekortkomingen. Er is bijvoorbeeld geen Thunderbolt, IR-camera, of SD-kaartlezer, en het scherm is zwak in vergelijking met de meeste andere gaming laptops. De trage en inconsistente oplaadsnelheid van de batterij verdient zeker een nadere beschouwing. Verwacht tot die tijd niet dat de batterij tijdens het gamen tegen een redelijke snelheid wordt opgeladen.
Prijs en beschikbaarheid
MSI GP66 Leopard 10UG
- 18-04-2021 v7 (old)
Allen Ngo
Price comparison

