Kort testrapport Razer Blade 15 GeForce RTX 2070 Super Max-Q: Dezelfde laptop, maar sneller
Evaluatie | Datum | Model | Gewicht | Hoogte | Formaat | Resolutie | Beste prijs |
|---|---|---|---|---|---|---|---|
| 86.9 % v7 (old) | 08-2020 | Razer Blade 15 RTX 2070 Super Max-Q i7-10875H, GeForce RTX 2070 Super Max-Q | 2.1 kg | 17.8 mm | 15.60" | 1920x1080 | |
| 82.8 % v7 (old) | 05-2020 | MSI GS66 Stealth 10SFS i9-10980HK, GeForce RTX 2070 Super Max-Q | 2.2 kg | 20 mm | 15.60" | 1920x1080 | |
| 81.3 % v7 (old) | 05-2019 | Asus Zephyrus S GX502GW i7-9750H, GeForce RTX 2070 Mobile | 2.1 kg | 19 mm | 15.60" | 1920x1080 | |
| 84 % v7 (old) | 05-2019 | Gigabyte Aero 15 Classic-XA i7-9750H, GeForce RTX 2070 Max-Q | 2.1 kg | 19 mm | 15.60" | 1920x1080 | |
| 84.8 % v7 (old) | Lenovo Legion Y740-15ICHg i7-9750H, GeForce RTX 2070 Max-Q | 2.3 kg | 25 mm | 15.60" | 1920x1080 | ||
| 83 % v7 (old) | 08-2020 | HP Envy 15-ep0098nr i7-10750H, GeForce RTX 2060 Max-Q | 2 kg | 19 mm | 15.60" | 3840x2160 |
| SD Card Reader | |
| average JPG Copy Test (av. of 3 runs) | |
| Razer Blade 15 RTX 2070 Super Max-Q (Toshiba Exceria Pro SDXC 64 GB UHS-II) | |
| Gigabyte Aero 15 Classic-XA (Toshiba Exceria Pro SDXC 64 GB UHS-II) | |
| HP Envy 15-ep0098nr (Toshiba Exceria Pro M501 UHS-II) | |
| maximum AS SSD Seq Read Test (1GB) | |
| Gigabyte Aero 15 Classic-XA (Toshiba Exceria Pro SDXC 64 GB UHS-II) | |
| Razer Blade 15 RTX 2070 Super Max-Q (Toshiba Exceria Pro SDXC 64 GB UHS-II) | |
| HP Envy 15-ep0098nr (Toshiba Exceria Pro M501 UHS-II) | |
| Networking | |
| iperf3 transmit AX12 | |
| MSI GS66 Stealth 10SFS | |
| HP Envy 15-ep0098nr | |
| Razer Blade 15 RTX 2070 Super Max-Q | |
| iperf3 receive AX12 | |
| HP Envy 15-ep0098nr | |
| Razer Blade 15 RTX 2070 Super Max-Q | |
| MSI GS66 Stealth 10SFS | |


| |||||||||||||||||||||||||
Helderheidsverdeling: 90 %
Helderheid in Batterij-modus: 345.4 cd/m²
Contrast: 1016:1 (Zwart: 0.34 cd/m²)
ΔE ColorChecker Calman: 3.18 | ∀{0.5-29.43 Ø4.71}
calibrated: 1.77
ΔE Greyscale Calman: 3.8 | ∀{0.09-98 Ø4.96}
99% sRGB (Argyll 1.6.3 3D)
64.3% AdobeRGB 1998 (Argyll 1.6.3 3D)
70.5% AdobeRGB 1998 (Argyll 3D)
98.8% sRGB (Argyll 3D)
69.4% Display P3 (Argyll 3D)
Gamma: 2.15
CCT: 7109 K
| Razer Blade 15 RTX 2070 Super Max-Q AU Optronics B156HAN12.0, IPS, 15.6", 1920x1080 | MSI GS66 Stealth 10SFS AUO B156HAN12.0 (AUO328E), IPS, 15.6", 1920x1080 | Asus Zephyrus S GX502GW AU Optronics B156HAN08.2 (AUO82ED), IPS, 15.6", 1920x1080 | Gigabyte Aero 15 Classic-XA Sharp LQ156M1JW03 (SHP14C5), IGZO, 15.6", 1920x1080 | Lenovo Legion Y740-15ICHg BOE NV156FHM-N4J, IPS, 15.6", 1920x1080 | HP Envy 15-ep0098nr Samsung SDC4145, AMOLED, 15.6", 3840x2160 | |
|---|---|---|---|---|---|---|
| Display | 0% | -7% | -5% | -5% | 24% | |
| Display P3 Coverage (%) | 69.4 | 69.5 0% | 64.9 -6% | 65.3 -6% | 67.7 -2% | 88.5 28% |
| sRGB Coverage (%) | 98.8 | 99.6 1% | 91 -8% | 95.5 -3% | 91.6 -7% | 100 1% |
| AdobeRGB 1998 Coverage (%) | 70.5 | 70.8 0% | 65.9 -7% | 66.5 -6% | 67.1 -5% | 99.9 42% |
| Response Times | -179% | -68% | -208% | -260% | 71% | |
| Response Time Grey 50% / Grey 80% * (ms) | 3.2 ? | 14 ? -338% | 7.2 ? -125% | 15.2 ? -375% | 19 ? -494% | 0.8 ? 75% |
| Response Time Black / White * (ms) | 8 ? | 9.6 ? -20% | 8.8 ? -10% | 11.2 ? -40% | 10 ? -25% | 2.7 ? 66% |
| PWM Frequency (Hz) | 23580 ? | 242.7 ? | ||||
| Screen | 9% | -1% | 1% | 17% | -18% | |
| Brightness middle (cd/m²) | 345.4 | 316 -9% | 286 -17% | 266 -23% | 477 38% | 374.3 8% |
| Brightness (cd/m²) | 342 | 311 -9% | 275 -20% | 248 -27% | 431 26% | 379 11% |
| Brightness Distribution (%) | 90 | 92 2% | 90 0% | 89 -1% | 84 -7% | 91 1% |
| Black Level * (cd/m²) | 0.34 | 0.21 38% | 0.37 -9% | 0.31 9% | 0.175 49% | |
| Contrast (:1) | 1016 | 1505 48% | 773 -24% | 858 -16% | 2726 168% | |
| Colorchecker dE 2000 * | 3.18 | 3.03 5% | 2.19 31% | 2.78 13% | 4.17 -31% | 5.47 -72% |
| Colorchecker dE 2000 max. * | 6.57 | 7.32 -11% | 4.4 33% | 5.96 9% | 6.97 -6% | 8.22 -25% |
| Colorchecker dE 2000 calibrated * | 1.77 | 1.1 38% | 2.27 -28% | 0.91 49% | 2.51 -42% | 4.61 -160% |
| Greyscale dE 2000 * | 3.8 | 3.9 -3% | 2.2 42% | 3.58 6% | 3.49 8% | 2.3 39% |
| Gamma | 2.15 102% | 2.42 91% | 2.41 91% | 2.46 89% | 2.5 88% | 2.09 105% |
| CCT | 7109 91% | 7439 87% | 6405 101% | 7186 90% | 7076 92% | 6340 103% |
| Color Space (Percent of AdobeRGB 1998) (%) | 64.3 | 65 1% | 59 -8% | 62 -4% | 60 -7% | 87.8 37% |
| Color Space (Percent of sRGB) (%) | 99 | 100 1% | 91 -8% | 96 -3% | 91 -8% | 100 1% |
| Totaal Gemiddelde (Programma / Instellingen) | -57% /
-16% | -25% /
-10% | -71% /
-26% | -83% /
-22% | 26% /
4% |
* ... kleiner is beter
Responstijd Scherm
| ↔ Responstijd Zwart naar Wit | ||
|---|---|---|
| 8 ms ... stijging ↗ en daling ↘ gecombineerd | ↗ 4 ms stijging | 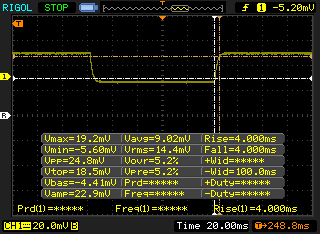 |
| ↘ 4 ms daling | ||
| Het scherm vertoonde snelle responstijden in onze tests en zou geschikt moeten zijn voor games. Ter vergelijking: alle testtoestellen variëren van 0.1 (minimum) tot 240 (maximum) ms. » 22 % van alle toestellen zijn beter. Dit betekent dat de gemeten responstijd beter is dan het gemiddelde (19.8 ms) van alle geteste toestellen. | ||
| ↔ Responstijd 50% Grijs naar 80% Grijs | ||
| 3.2 ms ... stijging ↗ en daling ↘ gecombineerd | ↗ 1.4 ms stijging | 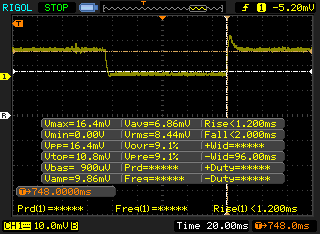 |
| ↘ 1.8 ms daling | ||
| Het scherm vertoonde erg snelle responstijden in onze tests en zou zeer geschikt moeten zijn voor snelle games. Ter vergelijking: alle testtoestellen variëren van 0.165 (minimum) tot 636 (maximum) ms. » 13 % van alle toestellen zijn beter. Dit betekent dat de gemeten responstijd beter is dan het gemiddelde (31 ms) van alle geteste toestellen. | ||
Screen Flickering / PWM (Pulse-Width Modulation)
| Screen flickering / PWM niet waargenomen | 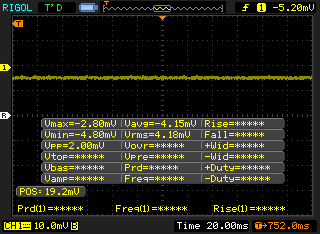 | ||
Ter vergelijking: 52 % van alle geteste toestellen maakten geen gebruik van PWM om de schermhelderheid te verlagen. Als het wel werd gebruikt, werd een gemiddelde van 7757 (minimum: 5 - maximum: 343500) Hz waargenomen. | |||
Cinebench R15: CPU Multi 64Bit | CPU Single 64Bit
Blender: v2.79 BMW27 CPU
7-Zip 18.03: 7z b 4 -mmt1 | 7z b 4
Geekbench 5.5: Single-Core | Multi-Core
HWBOT x265 Benchmark v2.2: 4k Preset
LibreOffice : 20 Documents To PDF
R Benchmark 2.5: Overall mean
| Cinebench R20 / CPU (Multi Core) | |
| MSI Bravo 15 A4DCR | |
| Asus ROG Strix Scar 15 G532LWS | |
| Eurocom Nightsky RX15 | |
| MSI GE65 Raider 9SF-049US | |
| Gemiddeld Intel Core i7-10875H (1986 - 4176, n=32) | |
| Alienware m15 R3 P87F | |
| Razer Blade 15 RTX 2070 Super Max-Q | |
| Maingear Vector 15 | |
| Dell G5 15 5590 | |
| Lenovo Legion 5 15IMH05H | |
| Cinebench R20 / CPU (Single Core) | |
| Asus ROG Strix Scar 15 G532LWS | |
| Razer Blade 15 RTX 2070 Super Max-Q | |
| Gemiddeld Intel Core i7-10875H (430 - 524, n=32) | |
| Eurocom Nightsky RX15 | |
| Alienware m15 R3 P87F | |
| MSI Bravo 15 A4DCR | |
| MSI GE65 Raider 9SF-049US | |
| Lenovo Legion 5 15IMH05H | |
| Maingear Vector 15 | |
| Dell G5 15 5590 | |
| Cinebench R15 / CPU Multi 64Bit | |
| Eurocom Nightsky RX15 | |
| MSI Bravo 15 A4DCR | |
| Asus ROG Strix Scar 15 G532LWS | |
| MSI GE65 Raider 9SF-049US | |
| Gemiddeld Intel Core i7-10875H (1003 - 1833, n=38) | |
| Razer Blade 15 RTX 2070 Super Max-Q | |
| Alienware m15 R3 P87F | |
| Maingear Vector 15 | |
| Dell G5 15 5590 | |
| Lenovo Legion 5 15IMH05H | |
| Cinebench R15 / CPU Single 64Bit | |
| Asus ROG Strix Scar 15 G532LWS | |
| Gemiddeld Intel Core i7-10875H (190 - 220, n=37) | |
| Eurocom Nightsky RX15 | |
| Razer Blade 15 RTX 2070 Super Max-Q | |
| Alienware m15 R3 P87F | |
| MSI GE65 Raider 9SF-049US | |
| Lenovo Legion 5 15IMH05H | |
| Maingear Vector 15 | |
| MSI Bravo 15 A4DCR | |
| Dell G5 15 5590 | |
| Blender / v2.79 BMW27 CPU | |
| Eurocom Nightsky RX15 | |
| Lenovo Legion 5 15IMH05H | |
| Razer Blade 15 RTX 2070 Super Max-Q | |
| Gemiddeld Intel Core i7-10875H (259 - 535, n=30) | |
| Alienware m15 R3 P87F | |
| MSI Bravo 15 A4DCR | |
| Asus ROG Strix Scar 15 G532LWS | |
| 7-Zip 18.03 / 7z b 4 -mmt1 | |
| Asus ROG Strix Scar 15 G532LWS | |
| Eurocom Nightsky RX15 | |
| Gemiddeld Intel Core i7-10875H (5071 - 5780, n=31) | |
| Razer Blade 15 RTX 2070 Super Max-Q | |
| Lenovo Legion 5 15IMH05H | |
| MSI Bravo 15 A4DCR | |
| Alienware m15 R3 P87F | |
| 7-Zip 18.03 / 7z b 4 | |
| Asus ROG Strix Scar 15 G532LWS | |
| MSI Bravo 15 A4DCR | |
| Eurocom Nightsky RX15 | |
| Gemiddeld Intel Core i7-10875H (29844 - 49562, n=31) | |
| Razer Blade 15 RTX 2070 Super Max-Q | |
| Alienware m15 R3 P87F | |
| Lenovo Legion 5 15IMH05H | |
| Geekbench 5.5 / Single-Core | |
| Asus ROG Strix Scar 15 G532LWS | |
| Gemiddeld Intel Core i7-10875H (1233 - 1371, n=29) | |
| Razer Blade 15 RTX 2070 Super Max-Q | |
| Alienware m15 R3 P87F | |
| Lenovo Legion 5 15IMH05H | |
| MSI Bravo 15 A4DCR | |
| Geekbench 5.5 / Multi-Core | |
| Asus ROG Strix Scar 15 G532LWS | |
| Gemiddeld Intel Core i7-10875H (5715 - 8620, n=29) | |
| MSI Bravo 15 A4DCR | |
| Razer Blade 15 RTX 2070 Super Max-Q | |
| Alienware m15 R3 P87F | |
| Lenovo Legion 5 15IMH05H | |
| HWBOT x265 Benchmark v2.2 / 4k Preset | |
| Asus ROG Strix Scar 15 G532LWS | |
| Eurocom Nightsky RX15 | |
| MSI Bravo 15 A4DCR | |
| Gemiddeld Intel Core i7-10875H (7.27 - 14.1, n=27) | |
| Alienware m15 R3 P87F | |
| Razer Blade 15 RTX 2070 Super Max-Q | |
| Lenovo Legion 5 15IMH05H | |
| LibreOffice / 20 Documents To PDF | |
| MSI Bravo 15 A4DCR | |
| Alienware m15 R3 P87F | |
| Lenovo Legion 5 15IMH05H | |
| Gemiddeld Intel Core i7-10875H (30.2 - 84.3, n=30) | |
| Asus ROG Strix Scar 15 G532LWS | |
| Razer Blade 15 RTX 2070 Super Max-Q | |
| R Benchmark 2.5 / Overall mean | |
| Alienware m15 R3 P87F | |
| Lenovo Legion 5 15IMH05H | |
| MSI Bravo 15 A4DCR | |
| Razer Blade 15 RTX 2070 Super Max-Q | |
| Gemiddeld Intel Core i7-10875H (0.546 - 0.662, n=29) | |
| Asus ROG Strix Scar 15 G532LWS | |
* ... kleiner is beter
| PCMark 8 | |
| Home Score Accelerated v2 | |
| Razer Blade 15 RTX 2070 Super Max-Q | |
| Lenovo Legion Y740-15ICHg | |
| Gemiddeld Intel Core i7-10875H, NVIDIA GeForce RTX 2070 Super Max-Q (4719 - 5840, n=2) | |
| Gigabyte Aero 15 Classic-XA | |
| HP Envy 15-ep0098nr | |
| Work Score Accelerated v2 | |
| Razer Blade 15 RTX 2070 Super Max-Q | |
| Gemiddeld Intel Core i7-10875H, NVIDIA GeForce RTX 2070 Super Max-Q (6081 - 6825, n=2) | |
| Gigabyte Aero 15 Classic-XA | |
| Lenovo Legion Y740-15ICHg | |
| HP Envy 15-ep0098nr | |
| PCMark 8 Home Score Accelerated v2 | 5840 punten | |
| PCMark 8 Work Score Accelerated v2 | 6825 punten | |
| PCMark 10 Score | 6739 punten | |
Help | ||
| DPC Latencies / LatencyMon - interrupt to process latency (max), Web, Youtube, Prime95 | |
| Aorus 15G XB | |
| MSI GS66 Stealth 10SFS | |
| Razer Blade 15 RTX 2070 Super Max-Q | |
| Asus ROG Strix Scar 15 G532LWS | |
| Alienware m15 R3 P87F | |
| Razer Blade 15 RTX 2080 Super Max-Q | |
| Lenovo Legion 5 15IMH05H | |
| Eluktronics RP-15 | |
* ... kleiner is beter
| Razer Blade 15 RTX 2070 Super Max-Q Samsung SSD PM981a MZVLB512HBJQ | MSI GS66 Stealth 10SFS Samsung SSD PM981 MZVLB1T0HALR | Asus Zephyrus S GX502GW 2x Intel SSD 660p SSDPEKNW512G8 (RAID 0) | Gigabyte Aero 15 Classic-XA Intel SSD 760p SSDPEKKW512G8 | Lenovo Legion Y740-15ICHg WDC PC SN520 SDAPMUW-128G | |
|---|---|---|---|---|---|
| AS SSD | 0% | -17% | -12% | -51% | |
| Seq Read (MB/s) | 1957 | 1065 -46% | 2506 28% | 2517 29% | 1372 -30% |
| Seq Write (MB/s) | 2092 | 2360 13% | 1712 -18% | 924 -56% | 746 -64% |
| 4K Read (MB/s) | 50.2 | 48.09 -4% | 48.32 -4% | 59.1 18% | 35.42 -29% |
| 4K Write (MB/s) | 96.5 | 110.7 15% | 103.6 7% | 126.5 31% | 99.9 4% |
| 4K-64 Read (MB/s) | 1594 | 1635 3% | 624 -61% | 876 -45% | 302.1 -81% |
| 4K-64 Write (MB/s) | 2005 | 1829 -9% | 1253 -38% | 922 -54% | 191.4 -90% |
| Access Time Read * (ms) | 0.057 | 0.071 -25% | 0.08 -40% | 0.042 26% | 0.132 -132% |
| Access Time Write * (ms) | 0.112 | 0.034 70% | 0.04 64% | 0.065 42% | 0.037 67% |
| Score Read (Points) | 1840 | 1790 -3% | 923 -50% | 1186 -36% | 475 -74% |
| Score Write (Points) | 2310 | 2176 -6% | 1528 -34% | 1141 -51% | 366 -84% |
| Score Total (Points) | 5103 | 4950 -3% | 2896 -43% | 2870 -44% | 1065 -79% |
| Copy ISO MB/s (MB/s) | 1793 | 2086 16% | 1062 -41% | ||
| Copy Program MB/s (MB/s) | 573 | 454.2 -21% | 426 -26% | ||
| Copy Game MB/s (MB/s) | 1418 | 1141 -20% | 650 -54% | ||
| CrystalDiskMark 5.2 / 6 | -7% | -19% | -14% | -47% | |
| Write 4K (MB/s) | 139.8 | 131.3 -6% | 97 -31% | 115.5 -17% | 134.2 -4% |
| Read 4K (MB/s) | 48.62 | 45.84 -6% | 49.58 2% | 58 19% | 37.72 -22% |
| Write Seq (MB/s) | 2260 | 2370 5% | 1838 -19% | 1555 -31% | 389.2 -83% |
| Read Seq (MB/s) | 2135 | 1509 -29% | 2421 13% | 2590 21% | 1030 -52% |
| Write 4K Q32T1 (MB/s) | 499.3 | 481.5 -4% | 326.9 -35% | 369.3 -26% | 238.9 -52% |
| Read 4K Q32T1 (MB/s) | 552 | 560 1% | 372.9 -32% | 441.7 -20% | 343.9 -38% |
| Write Seq Q32T1 (MB/s) | 2960 | 2392 -19% | 1894 -36% | 1547 -48% | 789 -73% |
| Read Seq Q32T1 (MB/s) | 3269 | 3232 -1% | 2828 -13% | 2969 -9% | 1502 -54% |
| Write 4K Q8T8 (MB/s) | 293.4 | ||||
| Read 4K Q8T8 (MB/s) | 405.8 | ||||
| Totaal Gemiddelde (Programma / Instellingen) | -4% /
-3% | -18% /
-18% | -13% /
-13% | -49% /
-50% |
* ... kleiner is beter

Disk Throttling: DiskSpd Read Loop, Queue Depth 8
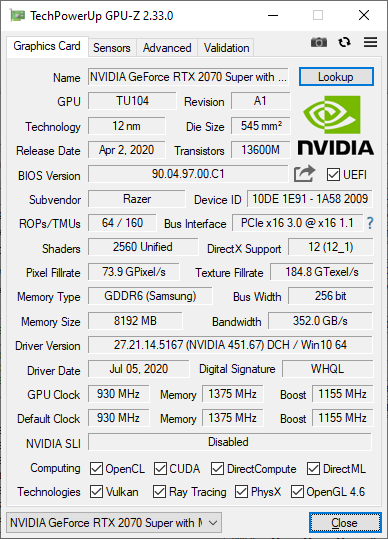
| 3DMark 11 Performance | 23678 punten | |
| 3DMark Cloud Gate Standard Score | 48815 punten | |
| 3DMark Fire Strike Score | 17915 punten | |
| 3DMark Time Spy Score | 8052 punten | |
Help | ||
| lage | gem. | hoge | ultra | |
|---|---|---|---|---|
| The Witcher 3 (2015) | 348.3 | 235.4 | 141.4 | 74 |
| Dota 2 Reborn (2015) | 144 | 132 | 127 | 120 |
| Final Fantasy XV Benchmark (2018) | 162 | 110 | 83.7 | |
| X-Plane 11.11 (2018) | 121 | 109 | 90 |
| Razer Blade 15 RTX 2070 Super Max-Q GeForce RTX 2070 Super Max-Q, i7-10875H, Samsung SSD PM981a MZVLB512HBJQ | MSI GS66 Stealth 10SFS GeForce RTX 2070 Super Max-Q, i9-10980HK, Samsung SSD PM981 MZVLB1T0HALR | Asus Zephyrus S GX502GW GeForce RTX 2070 Mobile, i7-9750H, 2x Intel SSD 660p SSDPEKNW512G8 (RAID 0) | Gigabyte Aero 15 Classic-XA GeForce RTX 2070 Max-Q, i7-9750H, Intel SSD 760p SSDPEKKW512G8 | Lenovo Legion Y740-15ICHg GeForce RTX 2070 Max-Q, i7-9750H, WDC PC SN520 SDAPMUW-128G | Razer Blade 15 RTX 2080 Super Max-Q GeForce RTX 2080 Super Max-Q, i7-10875H, Samsung PM981a MZVLB1T0HBLR | |
|---|---|---|---|---|---|---|
| Noise | -16% | -16% | -15% | -3% | -4% | |
| uit / omgeving * (dB) | 27 | 30 -11% | 30 -11% | 30 -11% | 30 -11% | 30.1 -11% |
| Idle Minimum * (dB) | 27 | 32 -19% | 31 -15% | 31 -15% | 31.3 -16% | 30.1 -11% |
| Idle Average * (dB) | 27 | 34 -26% | 33 -22% | 34 -26% | 31.3 -16% | 30.1 -11% |
| Idle Maximum * (dB) | 27 | 39 -44% | 38 -41% | 39 -44% | 31.3 -16% | 30.1 -11% |
| Load Average * (dB) | 44.7 | 53 -19% | 50 -12% | 46 -3% | 42 6% | 46.8 -5% |
| Witcher 3 ultra * (dB) | 51.2 | 48 6% | 53 -4% | 53 -4% | 42.1 18% | 48.4 5% |
| Load Maximum * (dB) | 54 | 53 2% | 56 -4% | 55 -2% | 46.5 14% | 46 15% |
* ... kleiner is beter
Geluidsniveau
| Onbelast |
| 27 / 27 / 27 dB (A) |
| Belasting |
| 44.7 / 54 dB (A) |
 | ||
30 dB stil 40 dB(A) hoorbaar 50 dB(A) luid |
||
min: | ||
(-) De maximumtemperatuur aan de bovenzijde bedraagt 50 °C / 122 F, vergeleken met het gemiddelde van 40.4 °C / 105 F, variërend van 21.2 tot 68.8 °C voor de klasse Gaming.
(-) De bodem warmt op tot een maximum van 52.2 °C / 126 F, vergeleken met een gemiddelde van 43.2 °C / 110 F
(±) Bij onbelast gebruik bedraagt de gemiddelde temperatuur voor de bovenzijde 33.3 °C / 92 F, vergeleken met het apparaatgemiddelde van 33.9 °C / 93 F.
(-) Bij het spelen van The Witcher 3 is de gemiddelde temperatuur voor de bovenzijde 40 °C / 104 F, vergeleken met het apparaatgemiddelde van 33.9 °C / 93 F.
(±) De palmsteunen en het touchpad kunnen zeer heet aanvoelen met een maximum van ###max## °C / 100.4 F.
(-) De gemiddelde temperatuur van de handpalmsteun van soortgelijke toestellen bedroeg 28.8 °C / 83.8 F (-9.2 °C / -16.6 F).
Razer Blade 15 RTX 2070 Super Max-Q audioanalyse
(+) | luidsprekers kunnen relatief luid spelen (87.1 dB)
Bas 100 - 315 Hz
(-) | bijna geen lage tonen - gemiddeld 16.2% lager dan de mediaan
(±) | lineariteit van de lage tonen is gemiddeld (9.4% delta ten opzichte van de vorige frequentie)
Midden 400 - 2000 Hz
(±) | hogere middens - gemiddeld 5.7% hoger dan de mediaan
(+) | de middentonen zijn lineair (4.8% delta ten opzichte van de vorige frequentie)
Hoog 2 - 16 kHz
(+) | evenwichtige hoogtepunten - slechts 3.6% verwijderd van de mediaan
(+) | de hoge tonen zijn lineair (3.2% delta naar de vorige frequentie)
Algemeen 100 - 16.000 Hz
(±) | lineariteit van het totale geluid is gemiddeld (15.5% verschil met de mediaan)
Vergeleken met dezelfde klasse
» 35% van alle geteste apparaten in deze klasse waren beter, 7% vergelijkbaar, 58% slechter
» De beste had een delta van 6%, het gemiddelde was 18%, de slechtste was 132%
Vergeleken met alle geteste toestellen
» 23% van alle geteste apparaten waren beter, 4% gelijk, 73% slechter
» De beste had een delta van 4%, het gemiddelde was 23%, de slechtste was 134%
Apple MacBook 12 (Early 2016) 1.1 GHz audioanalyse
(+) | luidsprekers kunnen relatief luid spelen (83.6 dB)
Bas 100 - 315 Hz
(±) | verminderde zeebaars - gemiddeld 11.3% lager dan de mediaan
(±) | lineariteit van de lage tonen is gemiddeld (14.2% delta ten opzichte van de vorige frequentie)
Midden 400 - 2000 Hz
(+) | evenwichtige middens - slechts 2.4% verwijderd van de mediaan
(+) | de middentonen zijn lineair (5.5% delta ten opzichte van de vorige frequentie)
Hoog 2 - 16 kHz
(+) | evenwichtige hoogtepunten - slechts 2% verwijderd van de mediaan
(+) | de hoge tonen zijn lineair (4.5% delta naar de vorige frequentie)
Algemeen 100 - 16.000 Hz
(+) | het totale geluid is lineair (10.2% verschil met de mediaan)
Vergeleken met dezelfde klasse
» 7% van alle geteste apparaten in deze klasse waren beter, 2% vergelijkbaar, 90% slechter
» De beste had een delta van 5%, het gemiddelde was 18%, de slechtste was 53%
Vergeleken met alle geteste toestellen
» 5% van alle geteste apparaten waren beter, 1% gelijk, 94% slechter
» De beste had een delta van 4%, het gemiddelde was 23%, de slechtste was 134%
| Uit / Standby | |
| Inactief | |
| Belasting |
|
Key:
min: | |
| Razer Blade 15 RTX 2070 Super Max-Q i7-10875H, GeForce RTX 2070 Super Max-Q, Samsung SSD PM981a MZVLB512HBJQ, IPS, 1920x1080, 15.6" | MSI GS66 Stealth 10SFS i9-10980HK, GeForce RTX 2070 Super Max-Q, Samsung SSD PM981 MZVLB1T0HALR, IPS, 1920x1080, 15.6" | Asus Zephyrus S GX502GW i7-9750H, GeForce RTX 2070 Mobile, 2x Intel SSD 660p SSDPEKNW512G8 (RAID 0), IPS, 1920x1080, 15.6" | Gigabyte Aero 15 Classic-XA i7-9750H, GeForce RTX 2070 Max-Q, Intel SSD 760p SSDPEKKW512G8, IGZO, 1920x1080, 15.6" | Lenovo Legion Y740-15ICHg i7-9750H, GeForce RTX 2070 Max-Q, WDC PC SN520 SDAPMUW-128G, IPS, 1920x1080, 15.6" | Razer Blade 15 RTX 2080 Super Max-Q i7-10875H, GeForce RTX 2080 Super Max-Q, Samsung PM981a MZVLB1T0HBLR, IPS, 1920x1080, 15.6" | |
|---|---|---|---|---|---|---|
| Power Consumption | 11% | -17% | -2% | -2% | 24% | |
| Idle Minimum * (Watt) | 14.3 | 13 9% | 24 -68% | 21 -47% | 22.2 -55% | 10.6 26% |
| Idle Average * (Watt) | 22.3 | 16 28% | 27 -21% | 23 -3% | 24.9 -12% | 13.1 41% |
| Idle Maximum * (Watt) | 36.9 | 27 27% | 33 11% | 32 13% | 30.6 17% | 15.8 57% |
| Load Average * (Watt) | 118.4 | 109 8% | 129 -9% | 97 18% | 101 15% | 131 -11% |
| Witcher 3 ultra * (Watt) | 153.7 | 155 -1% | 176 -15% | 148 4% | 143 7% | 146 5% |
| Load Maximum * (Watt) | 220.8 | 236 -7% | 216 2% | 213 4% | 186 16% | 169 23% |
* ... kleiner is beter
| Razer Blade 15 RTX 2070 Super Max-Q i7-10875H, GeForce RTX 2070 Super Max-Q, 80 Wh | MSI GS66 Stealth 10SFS i9-10980HK, GeForce RTX 2070 Super Max-Q, 99.99 Wh | Asus Zephyrus S GX502GW i7-9750H, GeForce RTX 2070 Mobile, 76 Wh | Gigabyte Aero 15 Classic-XA i7-9750H, GeForce RTX 2070 Max-Q, 94.24 Wh | Lenovo Legion Y740-15ICHg i7-9750H, GeForce RTX 2070 Max-Q, 57 Wh | HP Envy 15-ep0098nr i7-10750H, GeForce RTX 2060 Max-Q, 83 Wh | |
|---|---|---|---|---|---|---|
| Batterijduur | -3% | -41% | 11% | -52% | -5% | |
| WiFi v1.3 (h) | 6.3 | 6.1 -3% | 3.7 -41% | 7 11% | 3 -52% | 6 -5% |
| Reader / Idle (h) | 8.4 | 5.9 | 9.1 | 15 | ||
| Load (h) | 1.7 | 1 | 3 | 1.6 |
Pro
Contra

Dit is de verkorte versie van het originele artikel. Het volledige, Engelse testrapport vind je hier.
Upgraden van de GeForce RTX 2070 Super Max-Q-configuratie naar de GeForce RTX 2080 Super Max-Q-configuratie levert ongeveer 15 procent meer prestaties op zonder batterijduur, ventilatorgeluid, stroomverbruik of temperatuur op een negatieve manier te beïnvloeden. Het verschil tussen deze twee versies is echter 400 euro, dus gebruikers moeten zorgvuldig beslissen of ze denken dat de grafische boost de extra investering waard is ten opzichte van de goedkopere optie met GeForce RTX 2070 Super Max-Q.
Alles bij elkaar genomen presteert de GeForce RTX 2070 Super Max-Q het meest vergelijkbaar met een gewone GeForce RTX 2060 voor desktops, maar dan in een aantrekkelijke laptopvorm. Dit blijft een van de betere ultradunne gaming-laptops die je op dit moment kunt krijgen op het vlak van prestaties en visuele uitstraling, zelfs als we rekening houden met dezelfde nadelen die we in voorgaande jaren hebben gezien. Als je niet te veel wilt uitgeven aan de nieuwste Blade 15, is de GeForce RTX 2070 Super Max-Q niet erg verschillend van de oudere en goedkopere GeForce RTX 2070 Max-Q.
Razer Blade 15 RTX 2070 Super Max-Q
- 19-08-2020 v7 (old)
Allen Ngo
Price comparison
