Kort testrapport Razer Blade 15 Advanced Model (2020): Kleine verbeteringen tellen op
Evaluatie | Datum | Model | Gewicht | Hoogte | Formaat | Resolutie | Beste prijs |
|---|---|---|---|---|---|---|---|
| 85.9 % v7 (old) | 08-2020 | Razer Blade 15 RTX 2080 Super Max-Q i7-10875H, GeForce RTX 2080 Super Max-Q | 2.2 kg | 17.8 mm | 15.60" | 1920x1080 | |
| 81.5 % v7 (old) | 04-2019 | Asus Zephyrus S GX531GX i7-8750H, GeForce RTX 2080 Max-Q | 2.1 kg | 15.75 mm | 15.60" | 1920x1080 | |
| 85.8 % v7 (old) | 05-2020 | Gigabyte Aero 15 OLED XB-8DE51B0SP i7-10875H, GeForce RTX 2070 Super Max-Q | 2.2 kg | 20 mm | 15.60" | 3840x2160 | |
| 84.6 % v7 (old) | 07-2020 | MSI GE66 Raider 10SFS i9-10980HK, GeForce RTX 2070 Super Mobile | 2.4 kg | 23 mm | 15.60" | 1920x1080 | |
| 82.8 % v7 (old) | 12-2019 | Schenker XMG Neo 15 XNE15M19 i7-9750H, GeForce RTX 2070 Max-Q | 2.1 kg | 22 mm | 15.60" | 1920x1080 |

| SD Card Reader | |
| average JPG Copy Test (av. of 3 runs) | |
| Gigabyte Aero 15 OLED XB-8DE51B0SP (Toshiba Exceria Pro SDXC 64 GB UHS-II) | |
| Razer Blade 15 RTX 2080 Super Max-Q (Toshiba Exceria Pro SDXC 64 GB UHS-II) | |
| MSI GE66 Raider 10SFS (Toshiba Exceria Pro SDXC 64 GB UHS-II) | |
| Gemiddelde van klas Gaming (20.9 - 210, n=55, laatste 2 jaar) | |
| Schenker XMG Neo 15 XNE15M19 (Toshiba Exceria Pro SDXC 64 GB UHS-II) | |
| maximum AS SSD Seq Read Test (1GB) | |
| Gigabyte Aero 15 OLED XB-8DE51B0SP (Toshiba Exceria Pro SDXC 64 GB UHS-II) | |
| Razer Blade 15 RTX 2080 Super Max-Q (Toshiba Exceria Pro SDXC 64 GB UHS-II) | |
| MSI GE66 Raider 10SFS (Toshiba Exceria Pro SDXC 64 GB UHS-II) | |
| Gemiddelde van klas Gaming (25.5 - 261, n=52, laatste 2 jaar) | |
| Schenker XMG Neo 15 XNE15M19 (Toshiba Exceria Pro SDXC 64 GB UHS-II) | |


| |||||||||||||||||||||||||
Helderheidsverdeling: 89 %
Helderheid in Batterij-modus: 347 cd/m²
Contrast: 1218:1 (Zwart: 0.285 cd/m²)
ΔE ColorChecker Calman: 2.35 | ∀{0.5-29.43 Ø4.73}
calibrated: 1.16
ΔE Greyscale Calman: 3.04 | ∀{0.09-98 Ø4.97}
99% sRGB (Argyll 1.6.3 3D)
65% AdobeRGB 1998 (Argyll 1.6.3 3D)
71.4% AdobeRGB 1998 (Argyll 3D)
99% sRGB (Argyll 3D)
70.2% Display P3 (Argyll 3D)
Gamma: 2.35
CCT: 6658 K
| Razer Blade 15 RTX 2080 Super Max-Q AU Optronics B156HAN12.0, IPS, 1920x1080, 15.6" | Razer Blade 15 RTX 2080 Max-Q Sharp LQ156M1JW03 (SHP14C5), IPS, 1920x1080, 15.6" | Asus Zephyrus S GX531GX AU Optronics B156HAN08.2, IPS, 1920x1080, 15.6" | Gigabyte Aero 15 OLED XB-8DE51B0SP Samsung SDCA029, OLED, 3840x2160, 15.6" | MSI GE66 Raider 10SFS Sharp LQ156M1JW03 (SHP14C5), IPS-Level, 1920x1080, 15.6" | Schenker XMG Neo 15 XNE15M19 NV156FHM-N4G (BOE084D), IPS, 1920x1080, 15.6" | |
|---|---|---|---|---|---|---|
| Display | -3% | -7% | 27% | -2% | -9% | |
| Display P3 Coverage (%) | 70.2 | 66.9 -5% | 65.6 -7% | 99.9 42% | 68 -3% | 64 -9% |
| sRGB Coverage (%) | 99 | 98.1 -1% | 92.2 -7% | 100 1% | 99 0% | 90.3 -9% |
| AdobeRGB 1998 Coverage (%) | 71.4 | 68.5 -4% | 66.9 -6% | 98.2 38% | 69.8 -2% | 65.4 -8% |
| Response Times | -65% | -12% | 72% | -95% | -47% | |
| Response Time Grey 50% / Grey 80% * (ms) | 6 ? | 12.8 ? -113% | 7 ? -17% | 2.2 ? 63% | 16.4 ? -173% | 9.6 ? -60% |
| Response Time Black / White * (ms) | 9 ? | 10.4 ? -16% | 9.6 ? -7% | 1.8 ? 80% | 10.4 ? -16% | 12 ? -33% |
| PWM Frequency (Hz) | 23810 ? | 60 ? | 23580 ? | |||
| Screen | 0% | -22% | 2% | 9% | -19% | |
| Brightness middle (cd/m²) | 347 | 293 -16% | 323.6 -7% | 385 11% | 291 -16% | 313 -10% |
| Brightness (cd/m²) | 328 | 270 -18% | 315 -4% | 390 19% | 278 -15% | 295 -10% |
| Brightness Distribution (%) | 89 | 87 -2% | 91 2% | 93 4% | 91 2% | 89 0% |
| Black Level * (cd/m²) | 0.285 | 0.29 -2% | 0.29 -2% | 0.25 12% | 0.3 -5% | |
| Contrast (:1) | 1218 | 1010 -17% | 1116 -8% | 1164 -4% | 1043 -14% | |
| Colorchecker dE 2000 * | 2.35 | 1.69 28% | 3.31 -41% | 2.46 -5% | 1.19 49% | 3.33 -42% |
| Colorchecker dE 2000 max. * | 4.15 | 3.37 19% | 5.74 -38% | 4.01 3% | 3.04 27% | 6.25 -51% |
| Colorchecker dE 2000 calibrated * | 1.16 | 1.24 -7% | 2.73 -135% | 2.6 -124% | 1.77 -53% | |
| Greyscale dE 2000 * | 3.04 | 2.3 24% | 2.9 5% | 1.39 54% | 1.9 37% | 3.1 -2% |
| Gamma | 2.35 94% | 2.3 96% | 2.29 96% | 2.31 95% | 2.216 99% | 2.51 88% |
| CCT | 6658 98% | 6758 96% | 6765 96% | 6395 102% | 7018 93% | 6930 94% |
| Color Space (Percent of AdobeRGB 1998) (%) | 65 | 63 -3% | 59.7 -8% | 98 51% | 70 8% | 59 -9% |
| Color Space (Percent of sRGB) (%) | 99 | 98.5 -1% | 91.8 -7% | 100 1% | 92 -7% | 90 -9% |
| Totaal Gemiddelde (Programma / Instellingen) | -23% /
-8% | -14% /
-18% | 34% /
17% | -29% /
-7% | -25% /
-20% |
* ... kleiner is beter
Responstijd Scherm
| ↔ Responstijd Zwart naar Wit | ||
|---|---|---|
| 9 ms ... stijging ↗ en daling ↘ gecombineerd | ↗ 5 ms stijging | 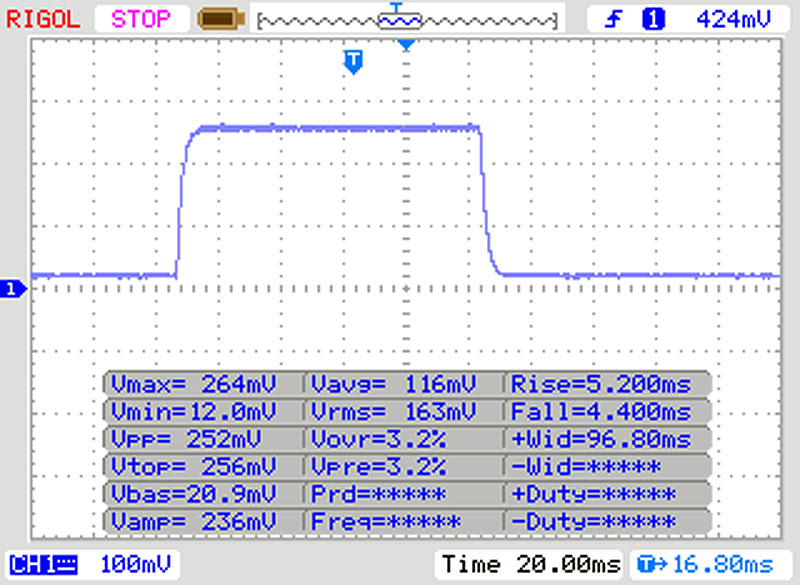 |
| ↘ 4 ms daling | ||
| Het scherm vertoonde snelle responstijden in onze tests en zou geschikt moeten zijn voor games. Ter vergelijking: alle testtoestellen variëren van 0.1 (minimum) tot 240 (maximum) ms. » 25 % van alle toestellen zijn beter. Dit betekent dat de gemeten responstijd beter is dan het gemiddelde (19.9 ms) van alle geteste toestellen. | ||
| ↔ Responstijd 50% Grijs naar 80% Grijs | ||
| 6 ms ... stijging ↗ en daling ↘ gecombineerd | ↗ 3 ms stijging | 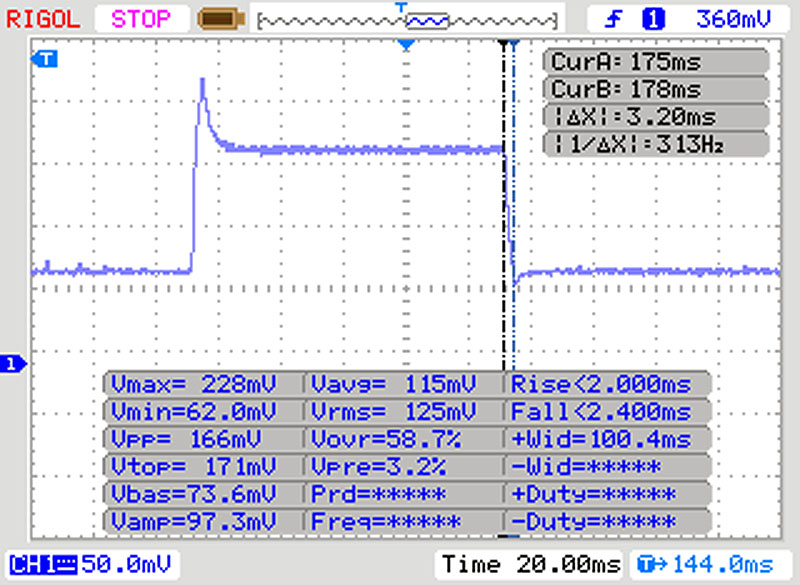 |
| ↘ 3 ms daling | ||
| Het scherm vertoonde erg snelle responstijden in onze tests en zou zeer geschikt moeten zijn voor snelle games. Ter vergelijking: alle testtoestellen variëren van 0.165 (minimum) tot 636 (maximum) ms. » 18 % van alle toestellen zijn beter. Dit betekent dat de gemeten responstijd beter is dan het gemiddelde (31.1 ms) van alle geteste toestellen. | ||
Screen Flickering / PWM (Pulse-Width Modulation)
| Screen flickering / PWM niet waargenomen | 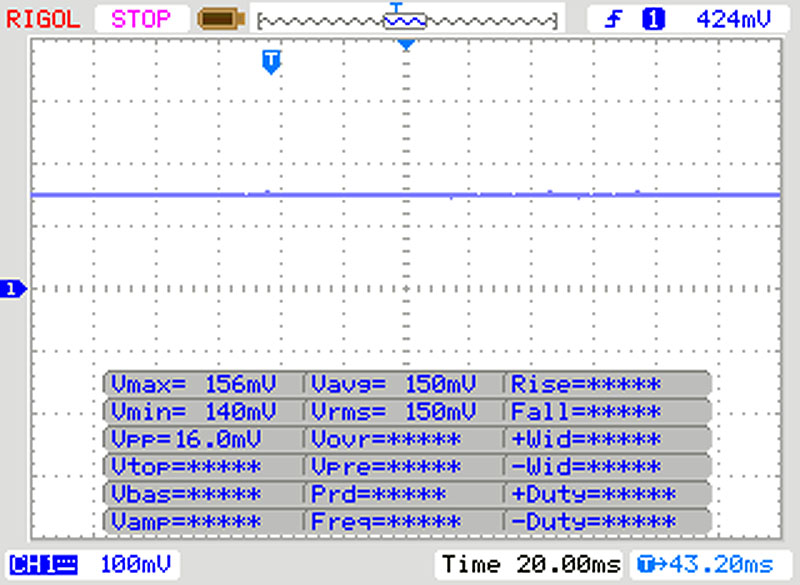 | ||
Ter vergelijking: 52 % van alle geteste toestellen maakten geen gebruik van PWM om de schermhelderheid te verlagen. Als het wel werd gebruikt, werd een gemiddelde van 7798 (minimum: 5 - maximum: 343500) Hz waargenomen. | |||

| Cinebench R15 | |
| CPU Single 64Bit | |
| Gemiddelde van klas Gaming (188.8 - 343, n=112, laatste 2 jaar) | |
| Gigabyte Aero 15 OLED XB-8DE51B0SP | |
| MSI GE66 Raider 10SFS | |
| Gemiddeld Intel Core i7-10875H (190 - 220, n=37) | |
| Razer Blade 15 RTX 2080 Super Max-Q (Boost) | |
| Razer Blade 15 RTX 2080 Super Max-Q (Hoch) | |
| Razer Blade 15 RTX 2080 Super Max-Q | |
| Razer Blade 15 RZ09-0328 | |
| Schenker XMG Neo 15 XNE15M19 | |
| Razer Blade 15 RTX 2080 Max-Q | |
| Asus Zephyrus S GX531GX | |
| CPU Multi 64Bit | |
| Gemiddelde van klas Gaming (1578 - 6271, n=113, laatste 2 jaar) | |
| Gigabyte Aero 15 OLED XB-8DE51B0SP | |
| MSI GE66 Raider 10SFS | |
| Gemiddeld Intel Core i7-10875H (1003 - 1833, n=38) | |
| Razer Blade 15 RTX 2080 Super Max-Q (Boost) | |
| Razer Blade 15 RTX 2080 Super Max-Q (Hoch) | |
| Razer Blade 15 RTX 2080 Super Max-Q | |
| Schenker XMG Neo 15 XNE15M19 | |
| Razer Blade 15 RTX 2080 Max-Q | |
| Razer Blade 15 RZ09-0328 | |
| Asus Zephyrus S GX531GX | |
* ... kleiner is beter
| PCMark 8 Home Score Accelerated v2 | 4665 punten | |
| PCMark 8 Creative Score Accelerated v2 | 4352 punten | |
| PCMark 8 Work Score Accelerated v2 | 6340 punten | |
| PCMark 10 Score | 5093 punten | |
Help | ||
| DPC Latencies / LatencyMon - interrupt to process latency (max), Web, Youtube, Prime95 | |
| Gigabyte Aero 15 OLED XB-8DE51B0SP | |
| MSI GE66 Raider 10SFS | |
| Razer Blade 15 RZ09-0328 | |
| Razer Blade 15 RTX 2080 Super Max-Q | |
* ... kleiner is beter

| Razer Blade 15 RTX 2080 Super Max-Q Samsung PM981a MZVLB1T0HBLR | Razer Blade 15 RTX 2080 Max-Q Samsung SSD PM981 MZVLB512HAJQ | Asus Zephyrus S GX531GX Intel SSD 660p SSDPEKNW512G8 | Gigabyte Aero 15 OLED XB-8DE51B0SP Intel Optane Memory H10 with Solid State Storage 32GB + 512GB HBRPEKNX0202A(L/H) | MSI GE66 Raider 10SFS WDC PC SN730 SDBPNTY-1T00 | Schenker XMG Neo 15 XNE15M19 Seagate FireCuda 510 SSD ZP1000GM30001 | Razer Blade 15 RZ09-0328 Lite-On CA5-8D512 | Gemiddeld Samsung PM981a MZVLB1T0HBLR | |
|---|---|---|---|---|---|---|---|---|
| CrystalDiskMark 5.2 / 6 | -13% | -41% | 0% | 6% | -18% | -1% | -2% | |
| Write 4K (MB/s) | 135.7 | 137.2 1% | 93.9 -31% | 127.4 -6% | 158.2 17% | 108.7 -20% | 118.7 -13% | 139.7 ? 3% |
| Read 4K (MB/s) | 46.98 | 46.82 0% | 46.29 -1% | 147.5 214% | 50.7 8% | 41.4 -12% | 52.4 12% | 49.9 ? 6% |
| Write Seq (MB/s) | 2180 | 1221 -44% | 974 -55% | 485.9 -78% | 1790 -18% | 1083 -50% | 2247 3% | 2036 ? -7% |
| Read Seq (MB/s) | 1949 | 1217 -38% | 1425 -27% | 1352 -31% | 2469 27% | 917 -53% | 2234 15% | 2014 ? 3% |
| Write 4K Q32T1 (MB/s) | 510 | 527 3% | 259.4 -49% | 476.5 -7% | 503 -1% | 468.5 -8% | 515 1% | 461 ? -10% |
| Read 4K Q32T1 (MB/s) | 569 | 614 8% | 296.5 -48% | 531 -7% | 579 2% | 530 -7% | 584 3% | 499 ? -12% |
| Write Seq Q32T1 (MB/s) | 2984 | 1986 -33% | 977 -67% | 1061 -64% | 3102 4% | 3057 2% | 2235 -25% | 2903 ? -3% |
| Read Seq Q32T1 (MB/s) | 3238 | 3234 0% | 1666 -49% | 2552 -21% | 3413 5% | 3422 6% | 3171 -2% | 3479 ? 7% |
| AS SSD | -4% | -37% | -37% | 21% | 14% | -24% | 5% | |
| Seq Read (MB/s) | 1950 | 1832 -6% | 1239 -36% | 1200 -38% | 2979 53% | 2341 20% | 2021 4% | 2553 ? 31% |
| Seq Write (MB/s) | 2322 | 1864 -20% | 920 -60% | 836 -64% | 2581 11% | 2575 11% | 2090 -10% | 2084 ? -10% |
| 4K Read (MB/s) | 45.48 | 52.1 15% | 45.74 1% | 65.8 45% | 47.33 4% | 51 12% | 47.71 5% | 53.1 ? 17% |
| 4K Write (MB/s) | 95.4 | 108.3 14% | 95.7 0% | 103.8 9% | 140 47% | 118.6 24% | 101.1 6% | 131.2 ? 38% |
| 4K-64 Read (MB/s) | 1484 | 1159 -22% | 322 -78% | 789 -47% | 1710 15% | 1637 10% | 856 -42% | 1477 ? 0% |
| 4K-64 Write (MB/s) | 1887 | 1807 -4% | 722 -62% | 929 -51% | 2188 16% | 2442 29% | 1041 -45% | 1805 ? -4% |
| Access Time Read * (ms) | 0.051 | 0.05 2% | 0.073 -43% | 0.103 -102% | 0.05 2% | 0.066 -29% | 0.052 -2% | 0.04983 ? 2% |
| Access Time Write * (ms) | 0.038 | 0.034 11% | 0.047 -24% | 0.045 -18% | 0.026 32% | 0.028 26% | 0.111 -192% | 0.04222 ? -11% |
| Score Read (Points) | 1725 | 1394 -19% | 492 -71% | 975 -43% | 2055 19% | 1922 11% | 1105 -36% | 1786 ? 4% |
| Score Write (Points) | 2215 | 2102 -5% | 910 -59% | 1117 -50% | 2586 17% | 2818 27% | 1351 -39% | 2144 ? -3% |
| Score Total (Points) | 4843 | 4221 -13% | 1654 -66% | 2594 -46% | 5673 17% | 5738 18% | 3037 -37% | 4826 ? 0% |
| Copy ISO MB/s (MB/s) | 1903 | 2083 9% | 1236 -35% | 2474 30% | 2098 ? 10% | |||
| Copy Program MB/s (MB/s) | 505 | 496.5 -2% | 703 39% | 679 34% | 500 ? -1% | |||
| Copy Game MB/s (MB/s) | 1113 | 977 -12% | 812 -27% | 1037 -7% | 1132 ? 2% | |||
| Totaal Gemiddelde (Programma / Instellingen) | -9% /
-7% | -39% /
-39% | -19% /
-21% | 14% /
15% | -2% /
1% | -13% /
-15% | 2% /
3% |
* ... kleiner is beter
Continuous load read: DiskSpd Read Loop, Queue Depth 8
| 3DMark 11 Performance | 20888 punten | |
| 3DMark Cloud Gate Standard Score | 32880 punten | |
| 3DMark Fire Strike Score | 17148 punten | |
| 3DMark Time Spy Score | 7683 punten | |
Help | ||
| The Witcher 3 - 1920x1080 Ultra Graphics & Postprocessing (HBAO+) | |
| Gemiddelde van klas Gaming (95 - 240, n=8, laatste 2 jaar) | |
| Razer Blade 15 RTX 2080 Super Max-Q (GPU: Hoch) | |
| Razer Blade 15 RTX 2080 Super Max-Q | |
| Gemiddeld NVIDIA GeForce RTX 2080 Super Max-Q (74.3 - 96, n=11) | |
| MSI GE66 Raider 10SFS | |
| Asus Zephyrus S GX531GX | |
| Gigabyte Aero 15 OLED XB-8DE51B0SP | |
| Razer Blade 15 RTX 2080 Max-Q | |
| Razer Blade 15 RZ09-0328 | |
| Schenker XMG Neo 15 XNE15M19 | |
| BioShock Infinite - 1920x1080 Ultra Preset, DX11 (DDOF) | |
| Gemiddeld NVIDIA GeForce RTX 2080 Super Max-Q (170.2 - 181.1, n=4) | |
| Razer Blade 15 RTX 2080 Super Max-Q | |
| Razer Blade 15 RTX 2080 Max-Q | |
| Asus Zephyrus S GX531GX | |
| Shadow of the Tomb Raider - 1920x1080 Highest Preset AA:T | |
| MSI GE66 Raider 10SFS | |
| Gemiddelde van klas Gaming (96 - 116, n=2, laatste 2 jaar) | |
| Gigabyte Aero 15 OLED XB-8DE51B0SP | |
| Gemiddeld NVIDIA GeForce RTX 2080 Super Max-Q (89 - 106, n=10) | |
| Razer Blade 15 RTX 2080 Super Max-Q | |
| Razer Blade 15 RTX 2080 Super Max-Q (GPU: Hoch) | |
| Razer Blade 15 RZ09-0328 | |
| Far Cry 5 - 1920x1080 Ultra Preset AA:T | |
| Gemiddelde van klas Gaming (70 - 151, n=10, laatste 2 jaar) | |
| Gemiddeld NVIDIA GeForce RTX 2080 Super Max-Q (91 - 110, n=4) | |
| Razer Blade 15 RTX 2080 Super Max-Q | |
| Battlefield V - 1920x1080 Ultra Preset | |
| MSI GE66 Raider 10SFS | |
| Gigabyte Aero 15 OLED XB-8DE51B0SP | |
| Gemiddeld NVIDIA GeForce RTX 2080 Super Max-Q (109.7 - 125, n=4) | |
| Razer Blade 15 RTX 2080 Super Max-Q | |
| Borderlands 3 - 1920x1080 Badass Overall Quality (DX11) | |
| MSI GE66 Raider 10SFS | |
| Gemiddeld NVIDIA GeForce RTX 2080 Super Max-Q (62.5 - 71.6, n=4) | |
| Gigabyte Aero 15 OLED XB-8DE51B0SP | |
| Razer Blade 15 RTX 2080 Super Max-Q | |
| Razer Blade 15 RZ09-0328 | |
| Schenker XMG Neo 15 XNE15M19 | |
| Red Dead Redemption 2 - 1920x1080 Maximum Settings | |
| MSI GE66 Raider 10SFS | |
| Gemiddeld NVIDIA GeForce RTX 2080 Super Max-Q (40.6 - 45, n=5) | |
| Gigabyte Aero 15 OLED XB-8DE51B0SP | |
| Razer Blade 15 RTX 2080 Super Max-Q | |
| Doom Eternal - 1920x1080 Ultra Preset | |
| MSI GE66 Raider 10SFS | |
| Gemiddeld NVIDIA GeForce RTX 2080 Super Max-Q (140 - 177.7, n=8) | |
| Razer Blade 15 RTX 2080 Super Max-Q | |
| lage | gem. | hoge | ultra | |
|---|---|---|---|---|
| BioShock Infinite (2013) | 347.4 | 330.2 | 300.5 | 173 |
| The Witcher 3 (2015) | 308.4 | 239.9 | 153.2 | 87.7 |
| Dota 2 Reborn (2015) | 134.3 | 128.7 | 117.4 | 115 |
| X-Plane 11.11 (2018) | 109 | 95.8 | 80.8 | |
| Far Cry 5 (2018) | 111 | 100 | 96 | 91 |
| Shadow of the Tomb Raider (2018) | 117 | 104 | 100 | 93 |
| Battlefield V (2018) | 154.3 | 124.7 | 116.2 | 109.7 |
| Metro Exodus (2019) | 131 | 93.2 | 70.3 | 57.2 |
| Total War: Three Kingdoms (2019) | 227.8 | 123.8 | 83.8 | 61 |
| Control (2019) | 221.7 | 96.6 | 71 | |
| Borderlands 3 (2019) | 128.3 | 101.6 | 78.2 | 62.5 |
| Ghost Recon Breakpoint (2019) | 130 | 95 | 88 | 66 |
| Call of Duty Modern Warfare 2019 (2019) | 165.5 | 114.1 | 96.4 | 93.8 |
| Star Wars Jedi Fallen Order (2019) | 99.5 | 94.1 | 88.7 | |
| Red Dead Redemption 2 (2019) | 113.3 | 96.5 | 62.7 | 40.6 |
| Doom Eternal (2020) | 212.2 | 165.1 | 147.9 | 144.4 |
| Gears Tactics (2020) | 188.8 | 171.6 | 122.2 | 82.9 |
| F1 2020 (2020) | 219 | 174 | 150 | 115 |
| Death Stranding (2020) | 139.8 | 118.7 | 108.6 | 104.5 |
Geluidsniveau
| Onbelast |
| 30.1 / 30.1 / 30.1 dB (A) |
| Belasting |
| 46.8 / 46 dB (A) |
 | ||
30 dB stil 40 dB(A) hoorbaar 50 dB(A) luid |
||
min: | ||
| Razer Blade 15 RTX 2080 Super Max-Q i7-10875H, GeForce RTX 2080 Super Max-Q | Razer Blade 15 RTX 2080 Max-Q i7-9750H, GeForce RTX 2080 Max-Q | Asus Zephyrus S GX531GX i7-8750H, GeForce RTX 2080 Max-Q | Gigabyte Aero 15 OLED XB-8DE51B0SP i7-10875H, GeForce RTX 2070 Super Max-Q | MSI GE66 Raider 10SFS i9-10980HK, GeForce RTX 2070 Super Mobile | Schenker XMG Neo 15 XNE15M19 i7-9750H, GeForce RTX 2070 Max-Q | Gemiddeld NVIDIA GeForce RTX 2080 Super Max-Q | Gemiddelde van klas Gaming | |
|---|---|---|---|---|---|---|---|---|
| Noise | 8% | -7% | -13% | -15% | -9% | -4% | 6% | |
| uit / omgeving * (dB) | 30.1 | 28.3 6% | 28.7 5% | 30 -0% | 30 -0% | 31 -3% | 27.9 ? 7% | 24.1 ? 20% |
| Idle Minimum * (dB) | 30.1 | 28.8 4% | 29.8 1% | 34 -13% | 30 -0% | 31 -3% | 29.7 ? 1% | 25.8 ? 14% |
| Idle Average * (dB) | 30.1 | 28.8 4% | 32.4 -8% | 36 -20% | 35 -16% | 34 -13% | 30.8 ? -2% | 27.5 ? 9% |
| Idle Maximum * (dB) | 30.1 | 29 4% | 38 -26% | 41 -36% | 44 -46% | 37 -23% | 35.4 ? -18% | 30 ? -0% |
| Load Average * (dB) | 46.8 | 33.5 28% | 38.2 18% | 48 -3% | 53 -13% | 47 -0% | 47.2 ? -1% | 43.1 ? 8% |
| Witcher 3 ultra * (dB) | 48.4 | 45 7% | 56.6 -17% | 48 1% | 53 -10% | 50 -3% | ||
| Load Maximum * (dB) | 46 | 45.2 2% | 56.6 -23% | 54 -17% | 55 -20% | 54 -17% | 49.6 ? -8% | 54 ? -17% |
* ... kleiner is beter
(-) De maximumtemperatuur aan de bovenzijde bedraagt 52 °C / 126 F, vergeleken met het gemiddelde van 40.4 °C / 105 F, variërend van 21.2 tot 68.8 °C voor de klasse Gaming.
(-) De bodem warmt op tot een maximum van 53 °C / 127 F, vergeleken met een gemiddelde van 43.2 °C / 110 F
(+) Bij onbelast gebruik bedraagt de gemiddelde temperatuur voor de bovenzijde 28.3 °C / 83 F, vergeleken met het apparaatgemiddelde van 33.9 °C / 93 F.
(-) Bij het spelen van The Witcher 3 is de gemiddelde temperatuur voor de bovenzijde 39.9 °C / 104 F, vergeleken met het apparaatgemiddelde van 33.9 °C / 93 F.
(-) De palmsteunen en het touchpad kunnen zeer heet aanvoelen met een maximum van ###max## °C / 106.2 F.
(-) De gemiddelde temperatuur van de handpalmsteun van soortgelijke toestellen bedroeg 28.8 °C / 83.8 F (-12.4 °C / -22.4 F).
| Razer Blade 15 RTX 2080 Super Max-Q i7-10875H, GeForce RTX 2080 Super Max-Q | Razer Blade 15 RTX 2080 Max-Q i7-9750H, GeForce RTX 2080 Max-Q | Asus Zephyrus S GX531GX i7-8750H, GeForce RTX 2080 Max-Q | Gigabyte Aero 15 OLED XB-8DE51B0SP i7-10875H, GeForce RTX 2070 Super Max-Q | MSI GE66 Raider 10SFS i9-10980HK, GeForce RTX 2070 Super Mobile | Schenker XMG Neo 15 XNE15M19 i7-9750H, GeForce RTX 2070 Max-Q | Gemiddeld NVIDIA GeForce RTX 2080 Super Max-Q | Gemiddelde van klas Gaming | |
|---|---|---|---|---|---|---|---|---|
| Heat | 4% | 3% | 1% | -2% | -12% | 1% | 1% | |
| Maximum Upper Side * (°C) | 52 | 47 10% | 47 10% | 49 6% | 49 6% | 60 -15% | 47.9 ? 8% | 45.2 ? 13% |
| Maximum Bottom * (°C) | 53 | 49.2 7% | 48.6 8% | 61 -15% | 52 2% | 66 -25% | 51.9 ? 2% | 48.2 ? 9% |
| Idle Upper Side * (°C) | 29.3 | 28.6 2% | 28.8 2% | 27 8% | 30 -2% | 30 -2% | 30 ? -2% | 31.1 ? -6% |
| Idle Bottom * (°C) | 30.2 | 31.4 -4% | 33.2 -10% | 29 4% | 34 -13% | 32 -6% | 31 ? -3% | 34.3 ? -14% |
* ... kleiner is beter
Razer Blade 15 RTX 2080 Super Max-Q audioanalyse
(±) | luidspreker luidheid is gemiddeld maar goed (74.9 dB)
Bas 100 - 315 Hz
(-) | bijna geen lage tonen - gemiddeld 15.1% lager dan de mediaan
(±) | lineariteit van de lage tonen is gemiddeld (10.9% delta ten opzichte van de vorige frequentie)
Midden 400 - 2000 Hz
(±) | hogere middens - gemiddeld 7.2% hoger dan de mediaan
(+) | de middentonen zijn lineair (6.9% delta ten opzichte van de vorige frequentie)
Hoog 2 - 16 kHz
(+) | evenwichtige hoogtepunten - slechts 2.4% verwijderd van de mediaan
(+) | de hoge tonen zijn lineair (5.1% delta naar de vorige frequentie)
Algemeen 100 - 16.000 Hz
(±) | lineariteit van het totale geluid is gemiddeld (19.5% verschil met de mediaan)
Vergeleken met dezelfde klasse
» 67% van alle geteste apparaten in deze klasse waren beter, 7% vergelijkbaar, 26% slechter
» De beste had een delta van 6%, het gemiddelde was 18%, de slechtste was 132%
Vergeleken met alle geteste toestellen
» 48% van alle geteste apparaten waren beter, 7% gelijk, 44% slechter
» De beste had een delta van 4%, het gemiddelde was 24%, de slechtste was 134%
| Uit / Standby | |
| Inactief | |
| Belasting |
|
Key:
min: | |
| Razer Blade 15 RTX 2080 Super Max-Q i7-10875H, GeForce RTX 2080 Super Max-Q | Razer Blade 15 RTX 2080 Max-Q i7-9750H, GeForce RTX 2080 Max-Q | Asus Zephyrus S GX531GX i7-8750H, GeForce RTX 2080 Max-Q | Gigabyte Aero 15 OLED XB-8DE51B0SP i7-10875H, GeForce RTX 2070 Super Max-Q | MSI GE66 Raider 10SFS i9-10980HK, GeForce RTX 2070 Super Mobile | Schenker XMG Neo 15 XNE15M19 i7-9750H, GeForce RTX 2070 Max-Q | Gemiddeld NVIDIA GeForce RTX 2080 Super Max-Q | Gemiddelde van klas Gaming | |
|---|---|---|---|---|---|---|---|---|
| Power Consumption | -12% | -33% | -52% | -17% | -4% | -28% | -32% | |
| Idle Minimum * (Watt) | 10.6 | 12.5 -18% | 16.1 -52% | 18 -70% | 6 43% | 11 -4% | 12.9 ? -22% | 13.3 ? -25% |
| Idle Average * (Watt) | 13.1 | 15.3 -17% | 20.9 -60% | 21 -60% | 14 -7% | 15 -15% | 17.3 ? -32% | 19 ? -45% |
| Idle Maximum * (Watt) | 15.8 | 20.7 -31% | 27 -71% | 38 -141% | 25 -58% | 21 -33% | 26.9 ? -70% | 24.5 ? -55% |
| Load Average * (Watt) | 131 | 90.2 31% | 93.4 29% | 113 14% | 108 18% | 94 28% | 123.9 ? 5% | 108.1 ? 17% |
| Witcher 3 ultra * (Watt) | 146 | 162 -11% | 168.2 -15% | 149 -2% | 195 -34% | 143 2% | ||
| Load Maximum * (Watt) | 169 | 209.3 -24% | 215.3 -27% | 256 -51% | 280 -66% | 173 -2% | 205 ? -21% | 254 ? -50% |
* ... kleiner is beter
| Razer Blade 15 RTX 2080 Super Max-Q i7-10875H, GeForce RTX 2080 Super Max-Q, 80 Wh | Razer Blade 15 RTX 2080 Max-Q i7-9750H, GeForce RTX 2080 Max-Q, 80 Wh | Asus Zephyrus S GX531GX i7-8750H, GeForce RTX 2080 Max-Q, 50 Wh | Gigabyte Aero 15 OLED XB-8DE51B0SP i7-10875H, GeForce RTX 2070 Super Max-Q, 94.2 Wh | MSI GE66 Raider 10SFS i9-10980HK, GeForce RTX 2070 Super Mobile, 99.99 Wh | Schenker XMG Neo 15 XNE15M19 i7-9750H, GeForce RTX 2070 Max-Q, 62 Wh | Razer Blade 15 RZ09-0328 i7-10750H, GeForce RTX 2070 Max-Q, 65 Wh | Gemiddelde van klas Gaming | |
|---|---|---|---|---|---|---|---|---|
| Batterijduur | 27% | -51% | 15% | -6% | -18% | -34% | 1% | |
| Reader / Idle (h) | 8.7 | 15.9 83% | 8.6 -1% | 7.6 -13% | 7.3 -16% | 8.71 ? 0% | ||
| H.264 (h) | 7.3 | 8.26 ? 13% | ||||||
| WiFi v1.3 (h) | 6.1 | 6.6 8% | 3 -51% | 6.1 0% | 6.1 0% | 5.7 -7% | 4 -34% | 7.01 ? 15% |
| Load (h) | 1.9 | 1.7 -11% | 2.8 47% | 1.8 -5% | 1.3 -32% | 1.47 ? -23% |
Pro
Contra
Dit is de verkorte versie van het originele artikel. Het volledige, Engelse testrapport vind je hier.
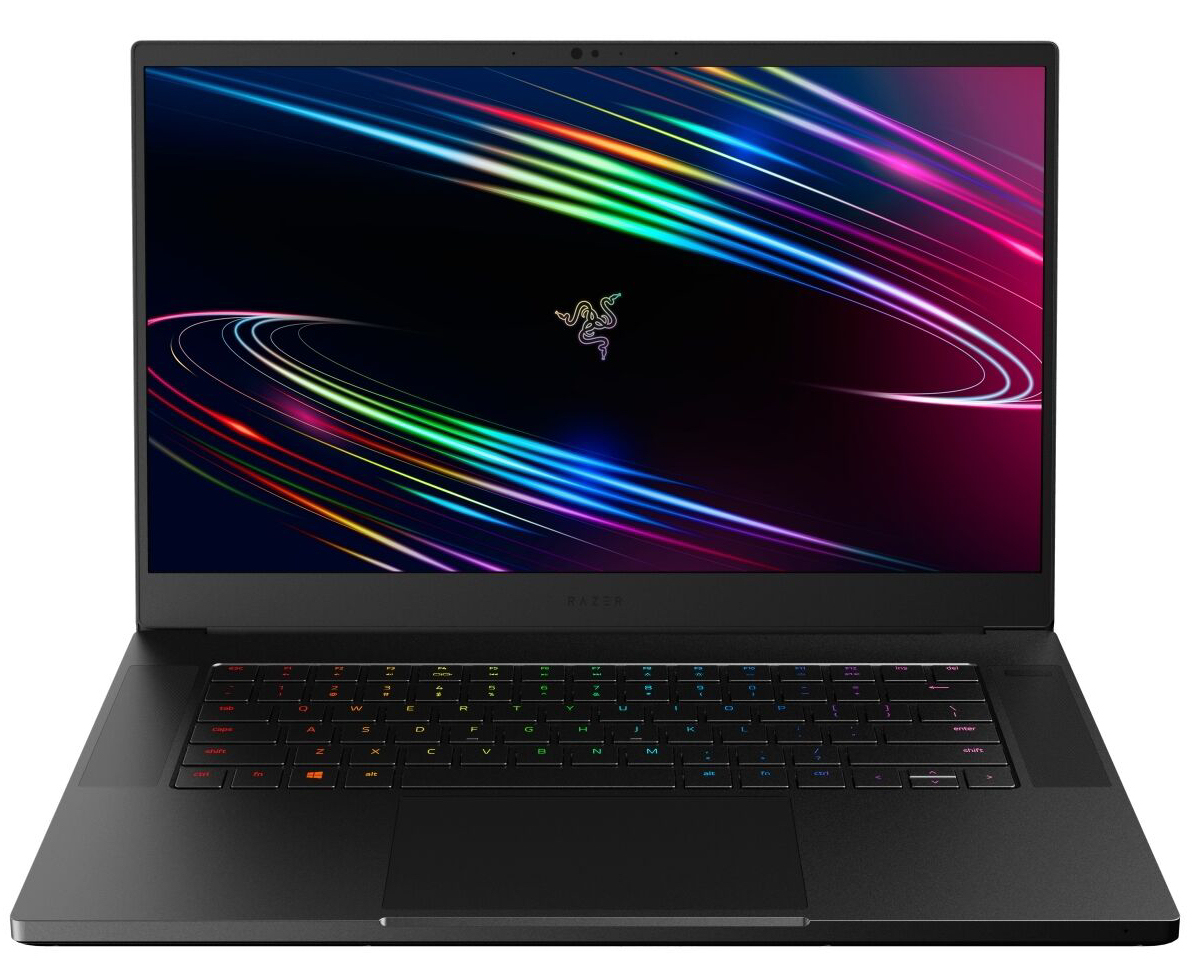
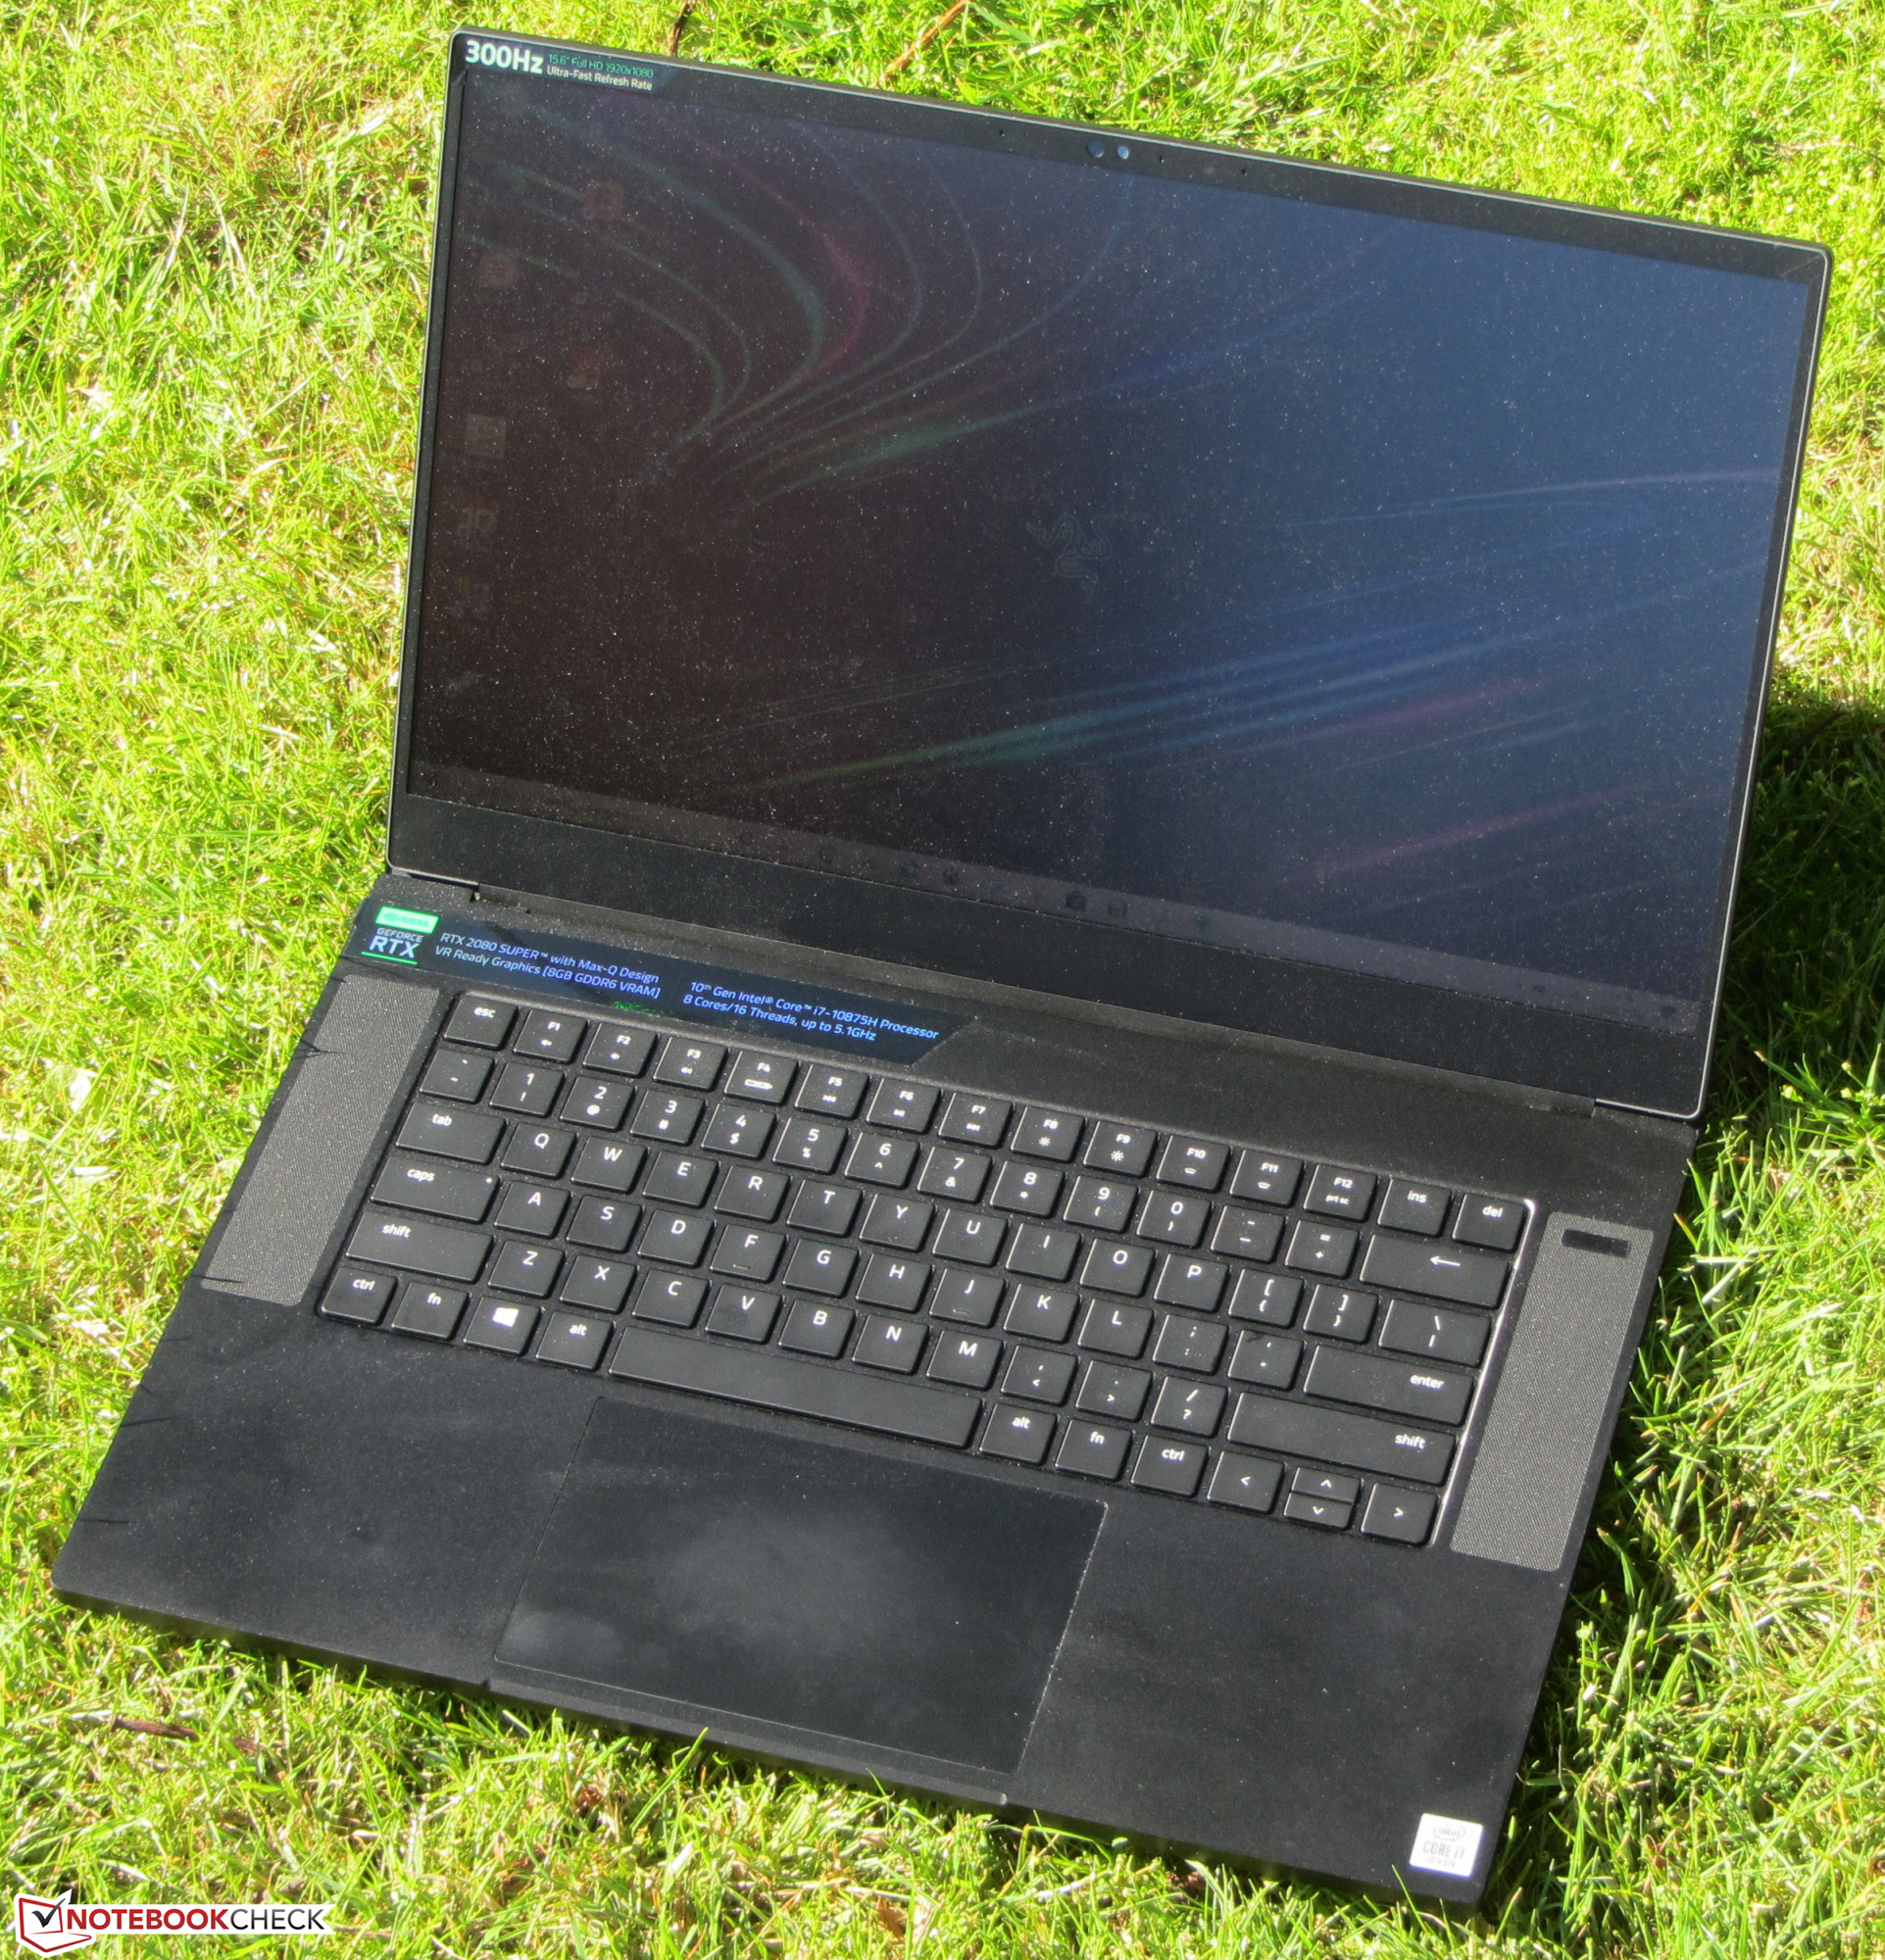
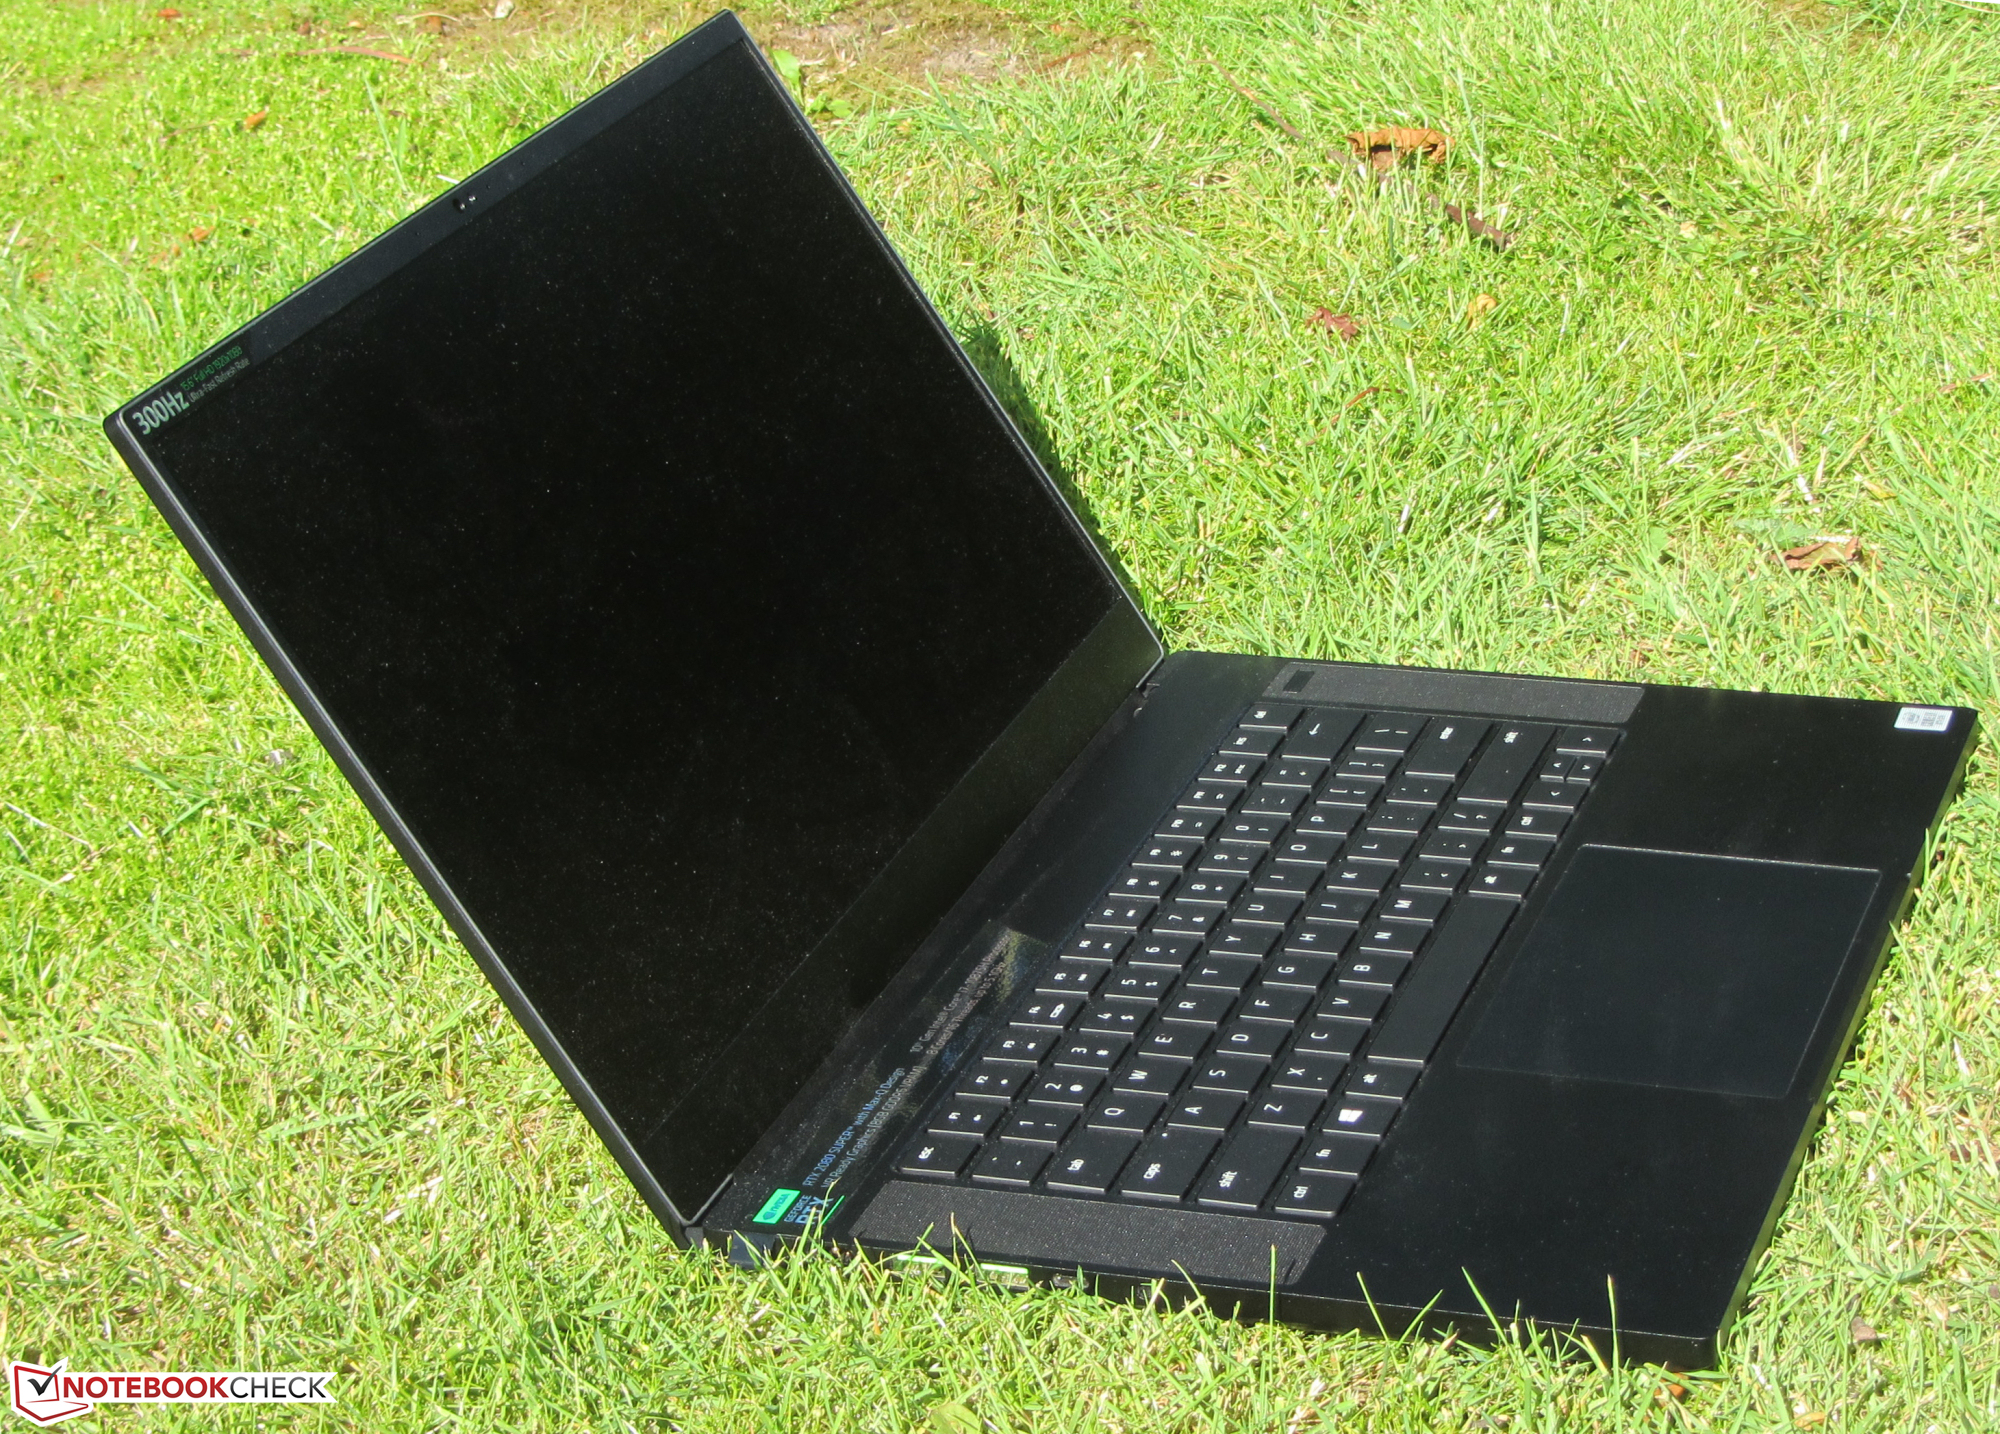
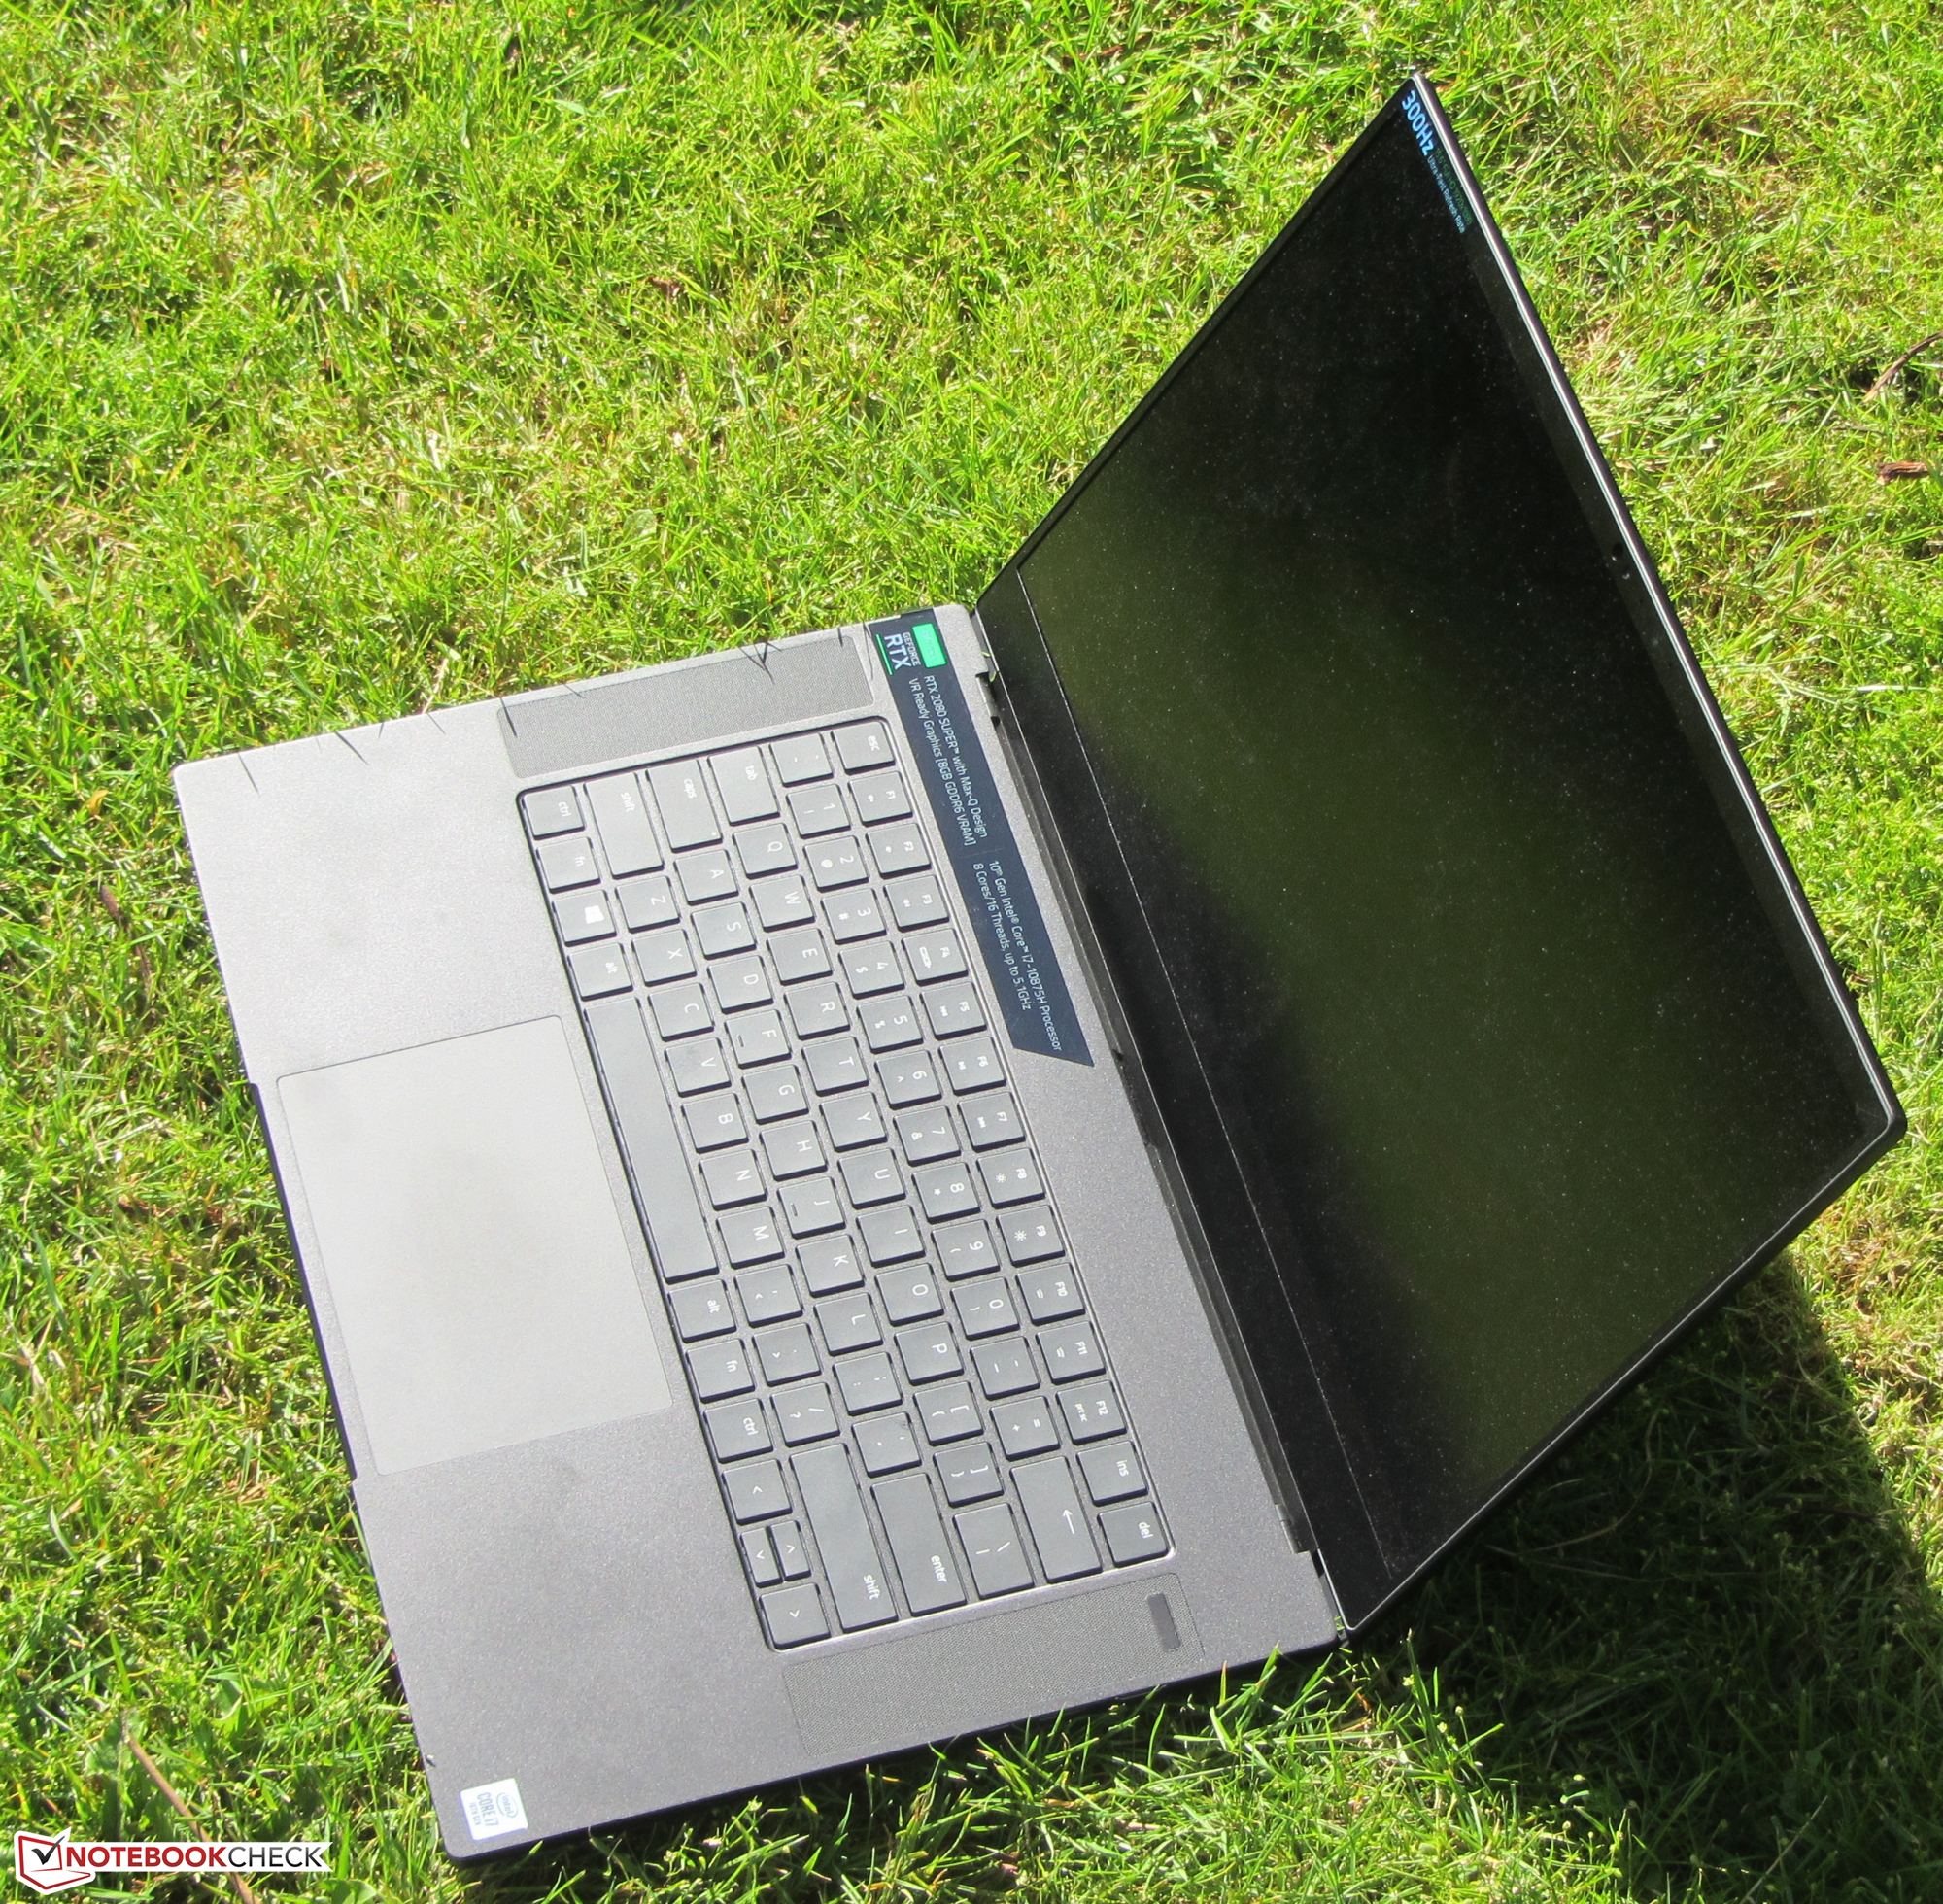
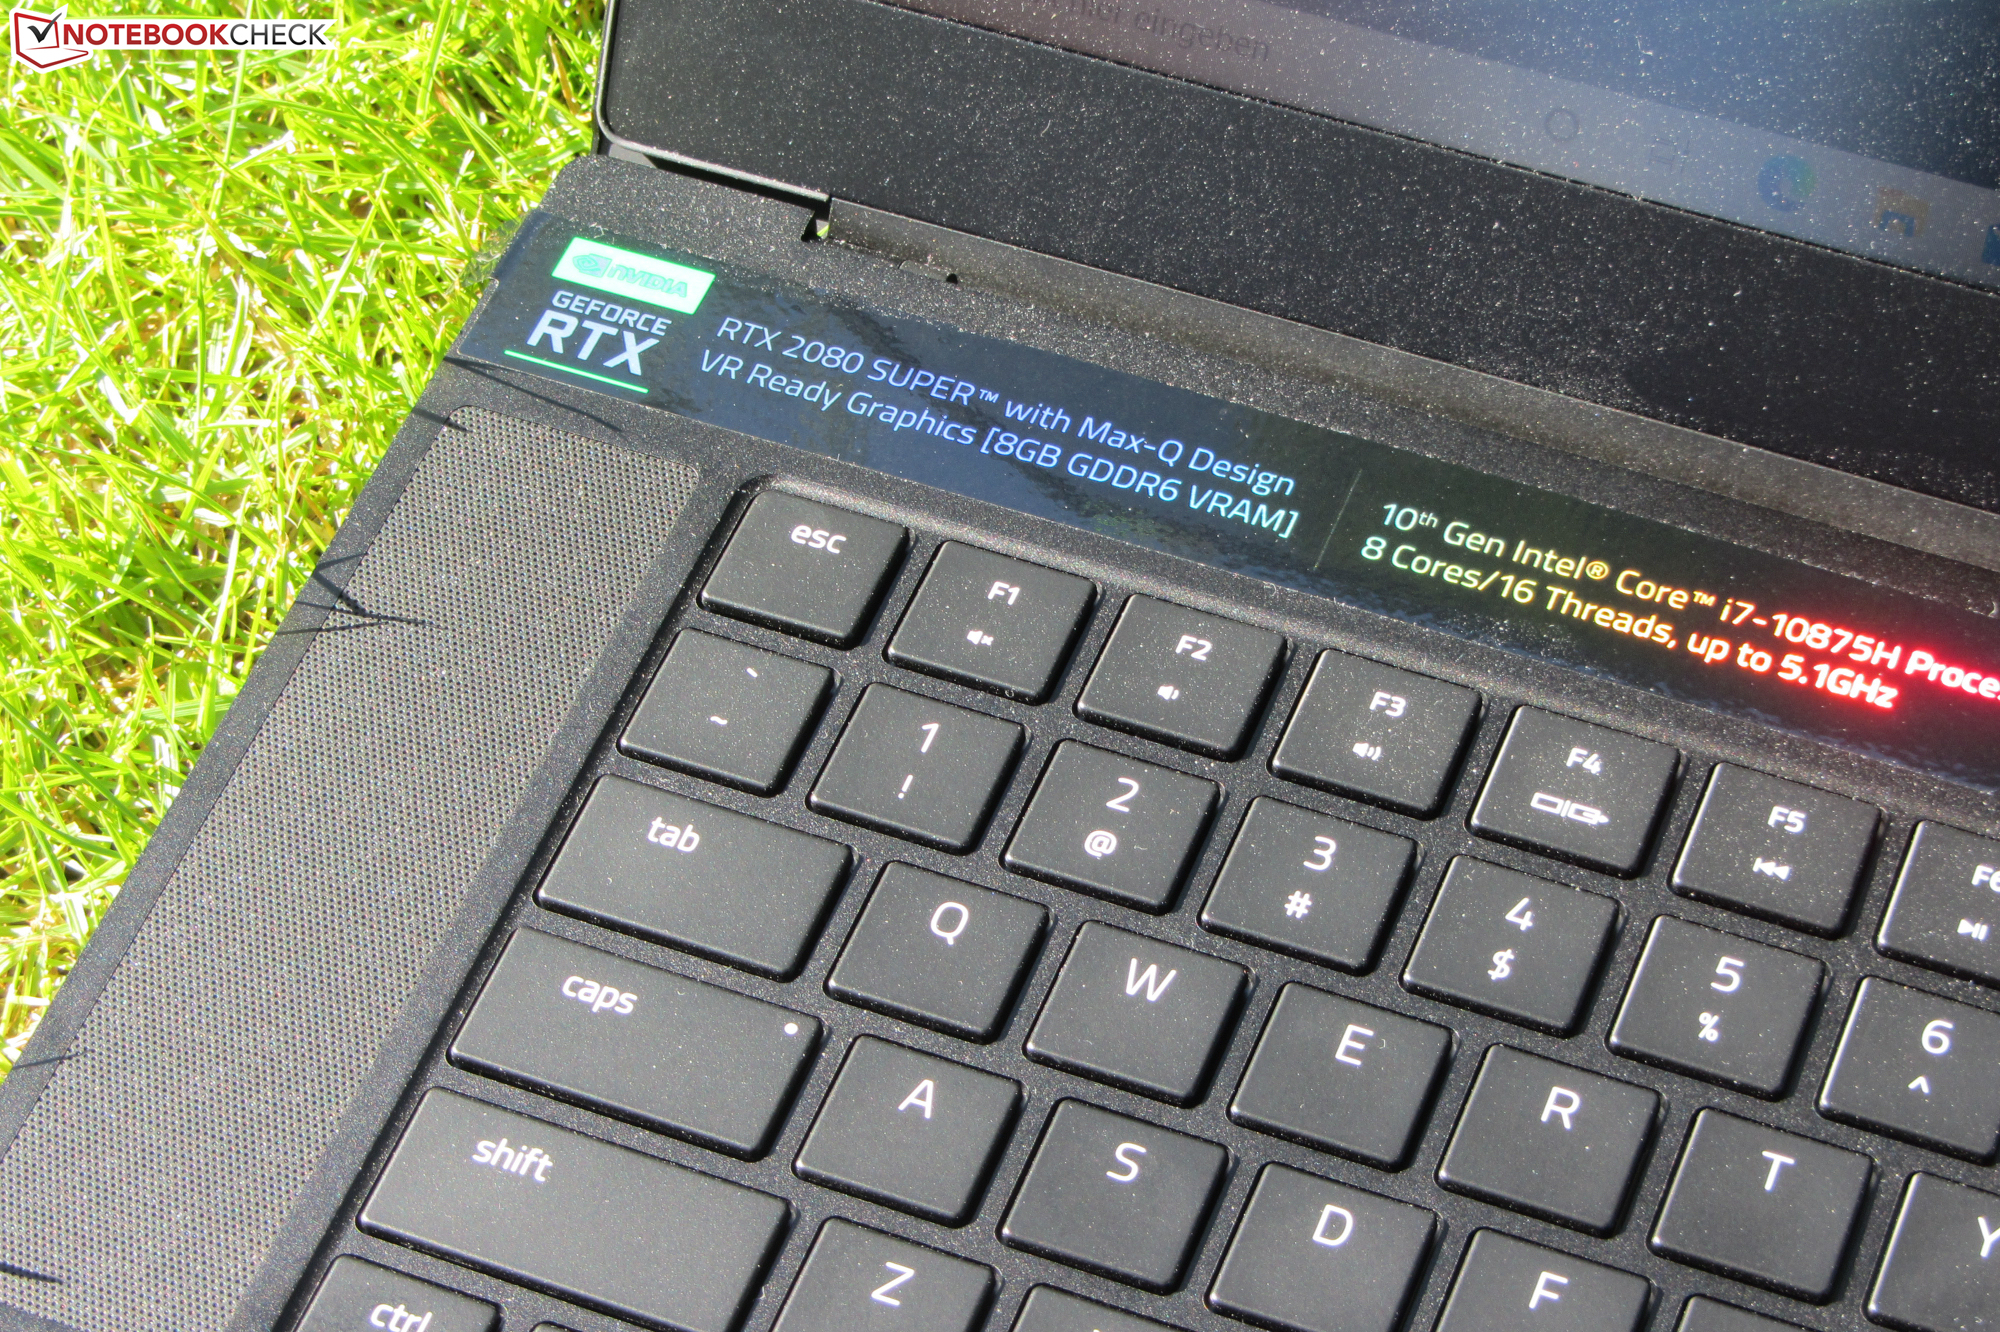
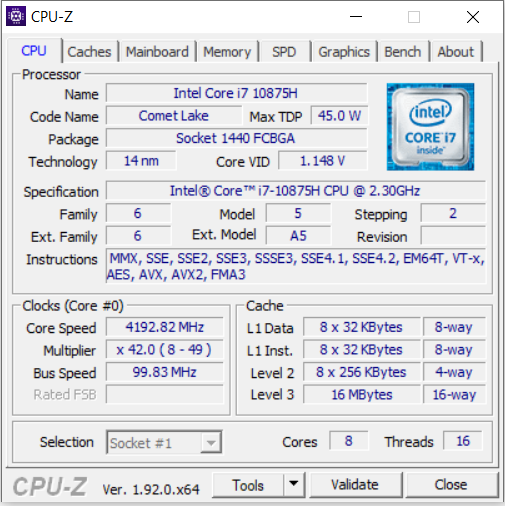
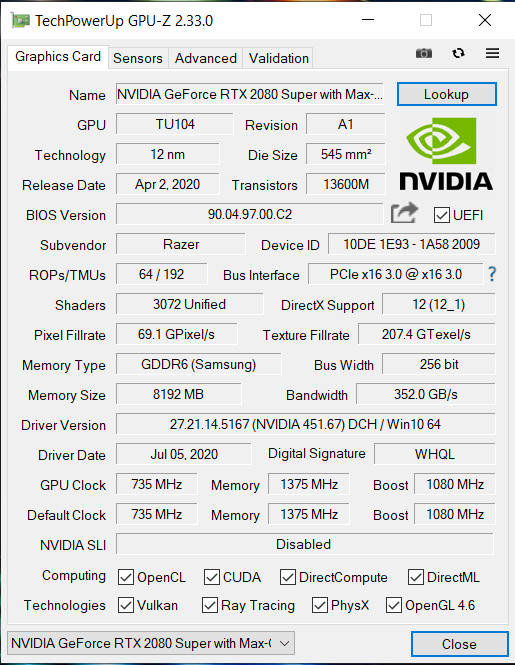
Razer heeft veel rekenkracht in een stijlvolle, slanke metalen behuizing. Dankzij de Core i7-10875H processor en de GeForce RTX 2080 Super Max-Q GPU kan de laptop de nieuwste games aan. Er hoeven geen compromissen te worden gesloten op het gebied van kwaliteitsinstellingen. Mocht de GPU op een bepaald moment niet meer aan uw eisen voldoen, dan kan er een externe GPU worden aangesloten via de Thunderbolt 3-poort.
Met de Blade 15 Advanced Model (2020) heeft Razer ervoor gekozen om detailverbeteringen door te voeren die duidelijk hun vruchten afwerpen.
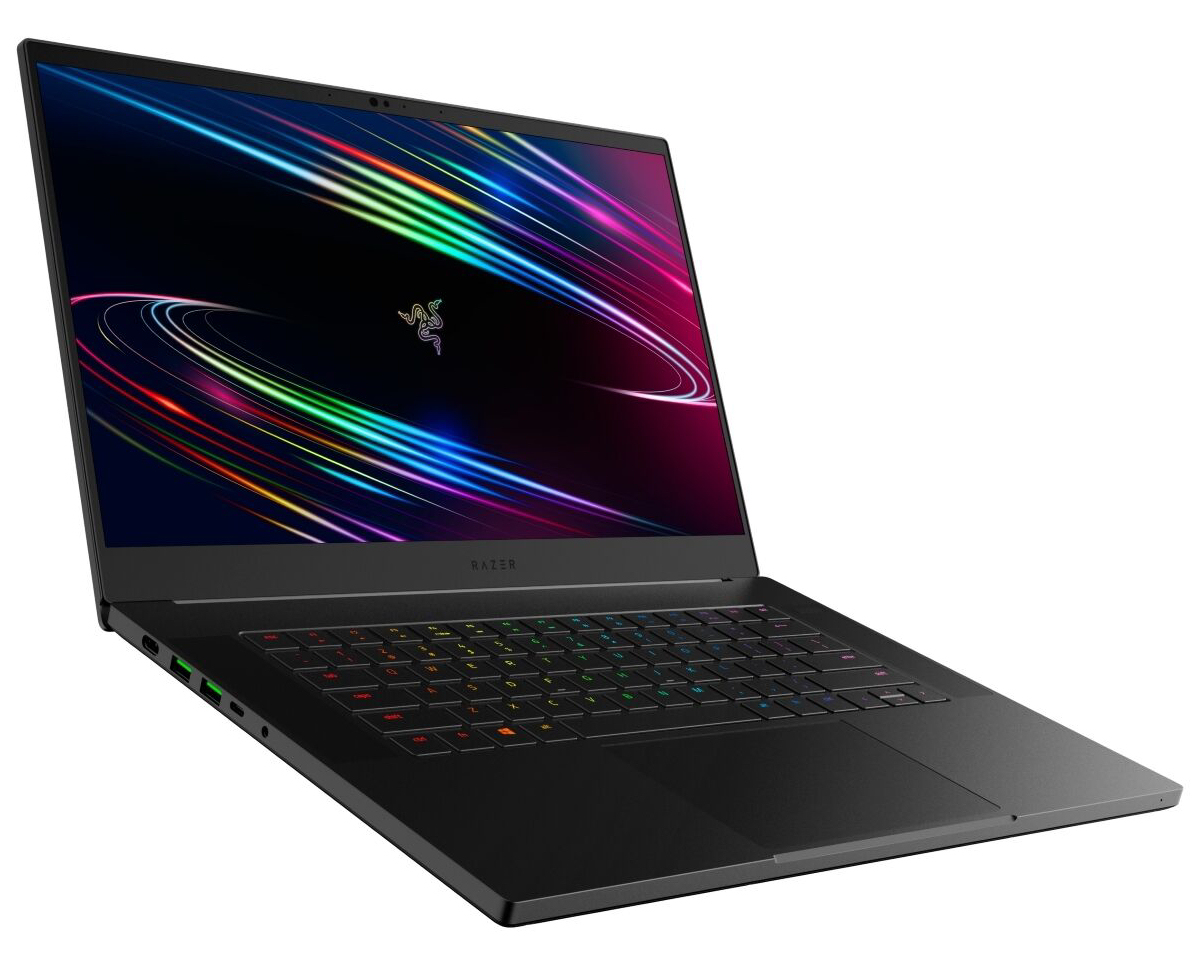
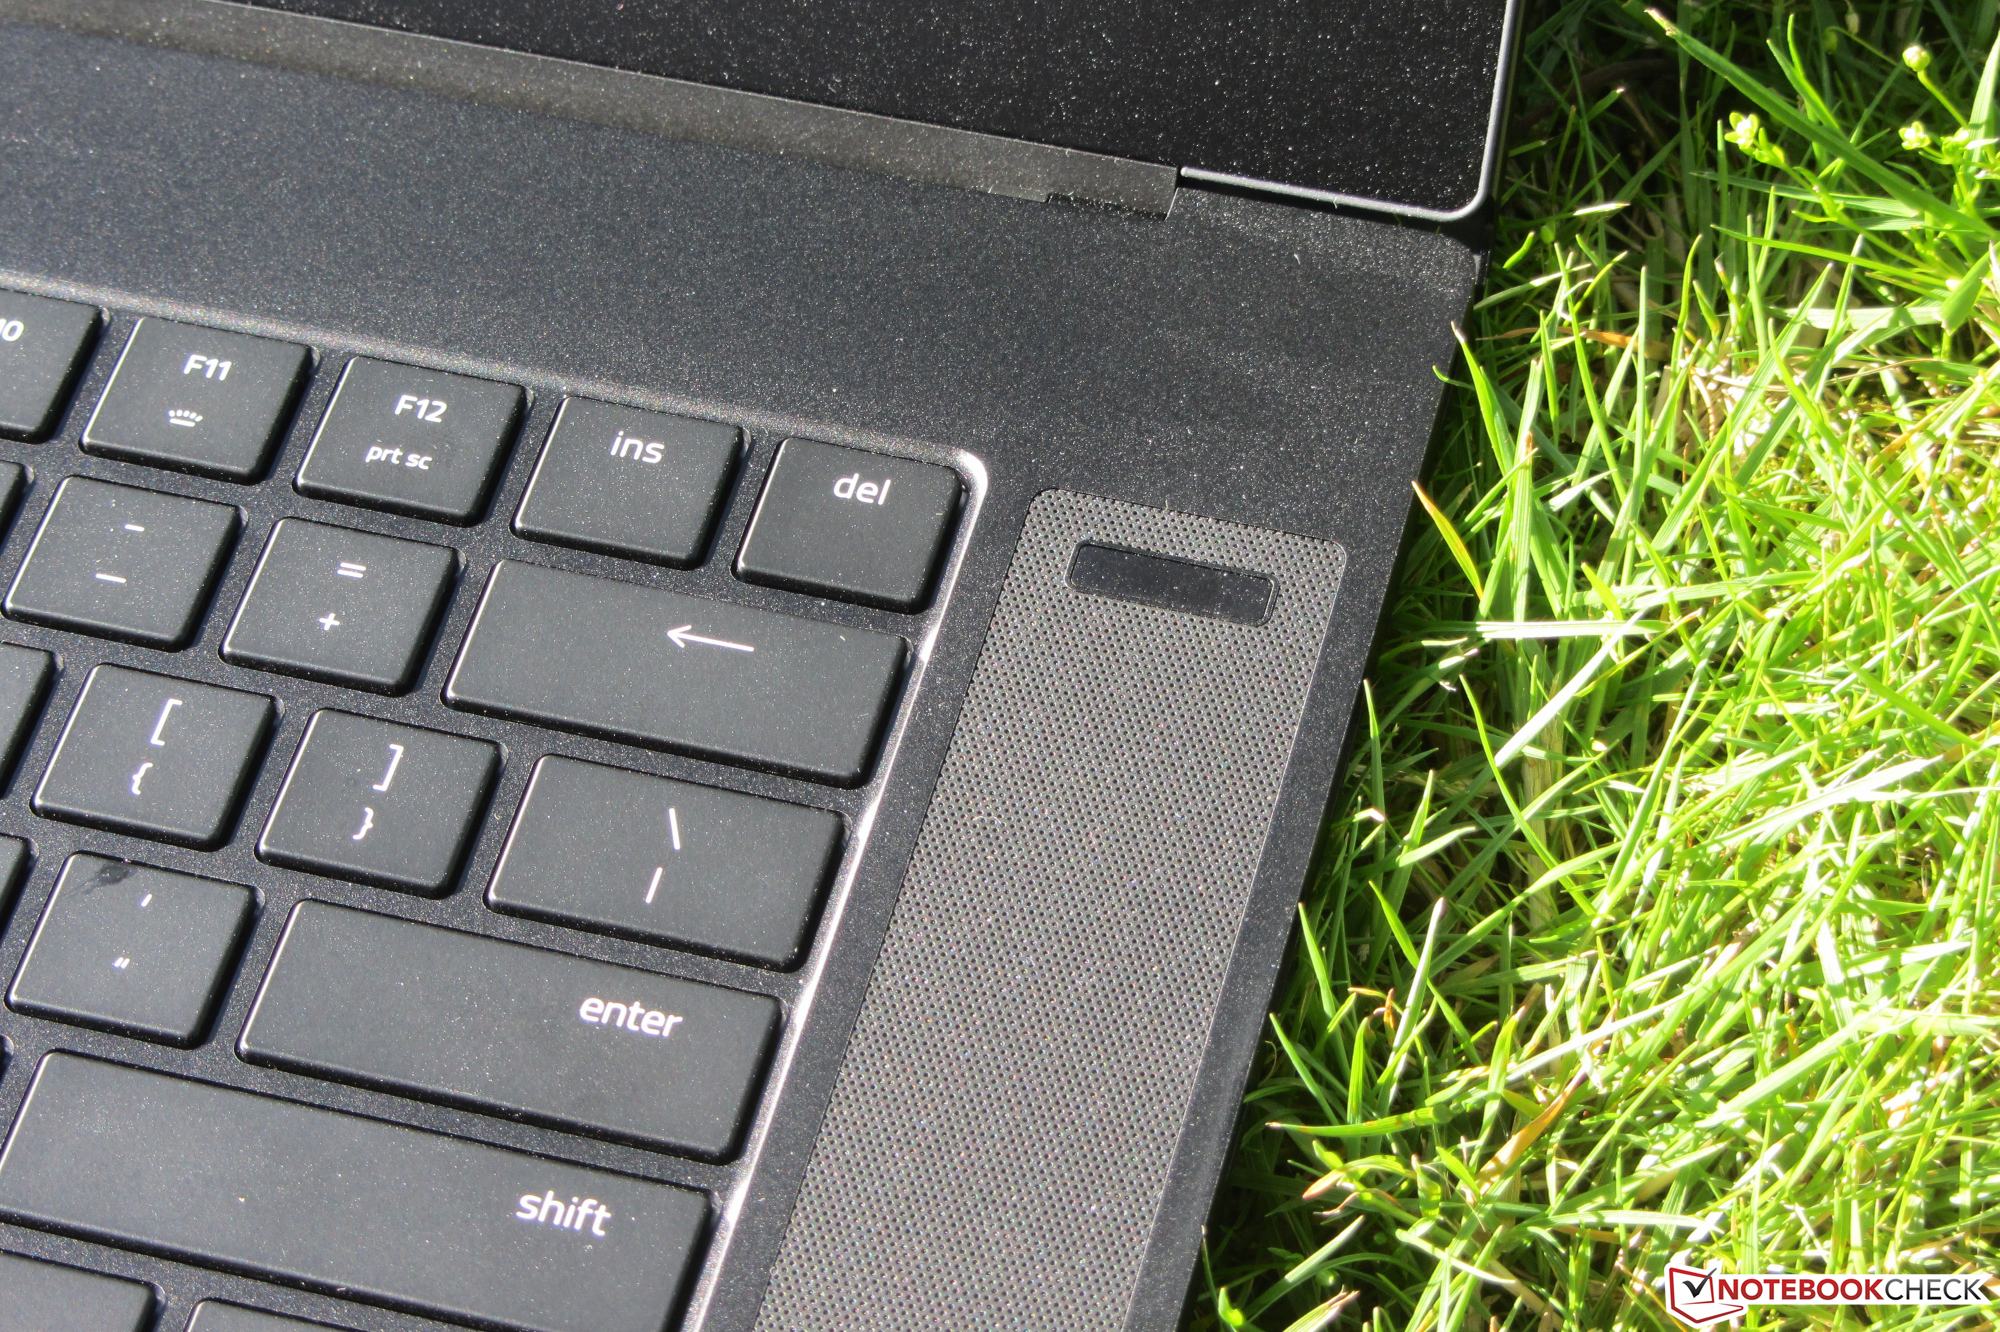
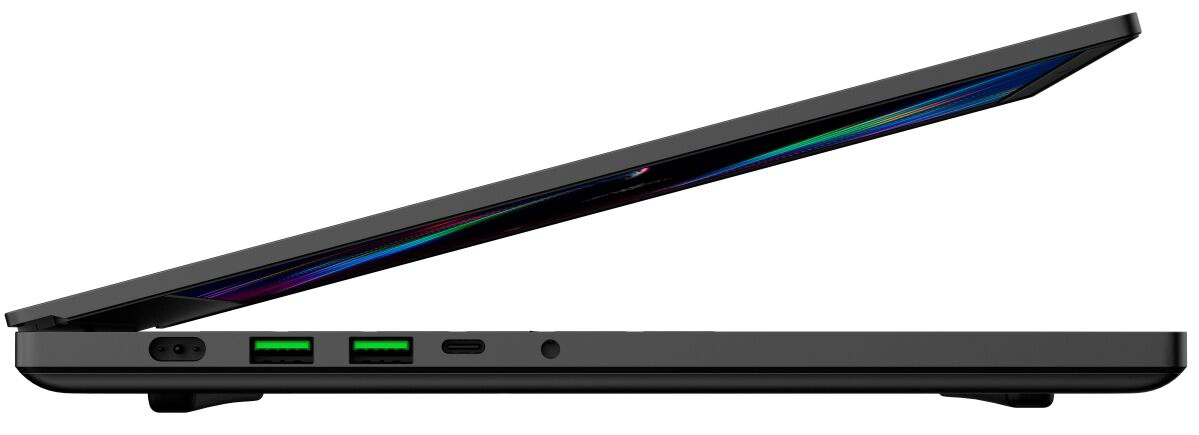
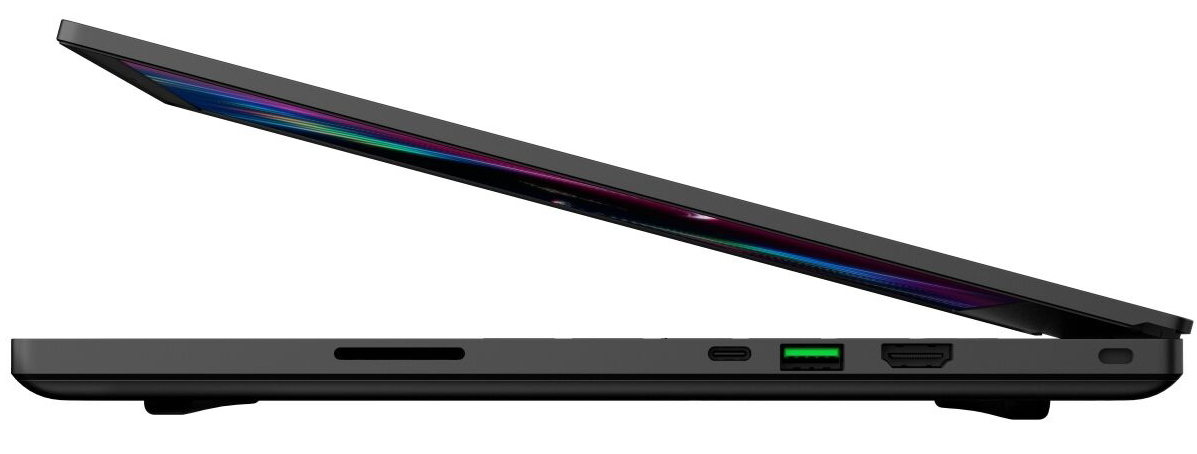
De 2020 Blade 15 is voorzien van USB 3.2 Gen 2-technologie en alle USB Type-A-poorten werken volgens deze standaard. Dit geldt ook voor de nieuw toegevoegde USB Type-C-poort (DisplayPort, Power Delivery). De laatste verving de oude Mini DisplayPort. Bovendien kan je met zowel de Thunderbolt 3-poort als de USB Type-C 3.2 Gen 2-poort de batterij opladen. We konden in elk geval een oplaadproces starten met een voedingsadapter van 45 Watt. Het gebruik van de twee poorten om de laptop volledig van energie te voorzien is niet mogelijk aangezien er maximaal 100 Watt aan vermogen kan worden overgedragen.
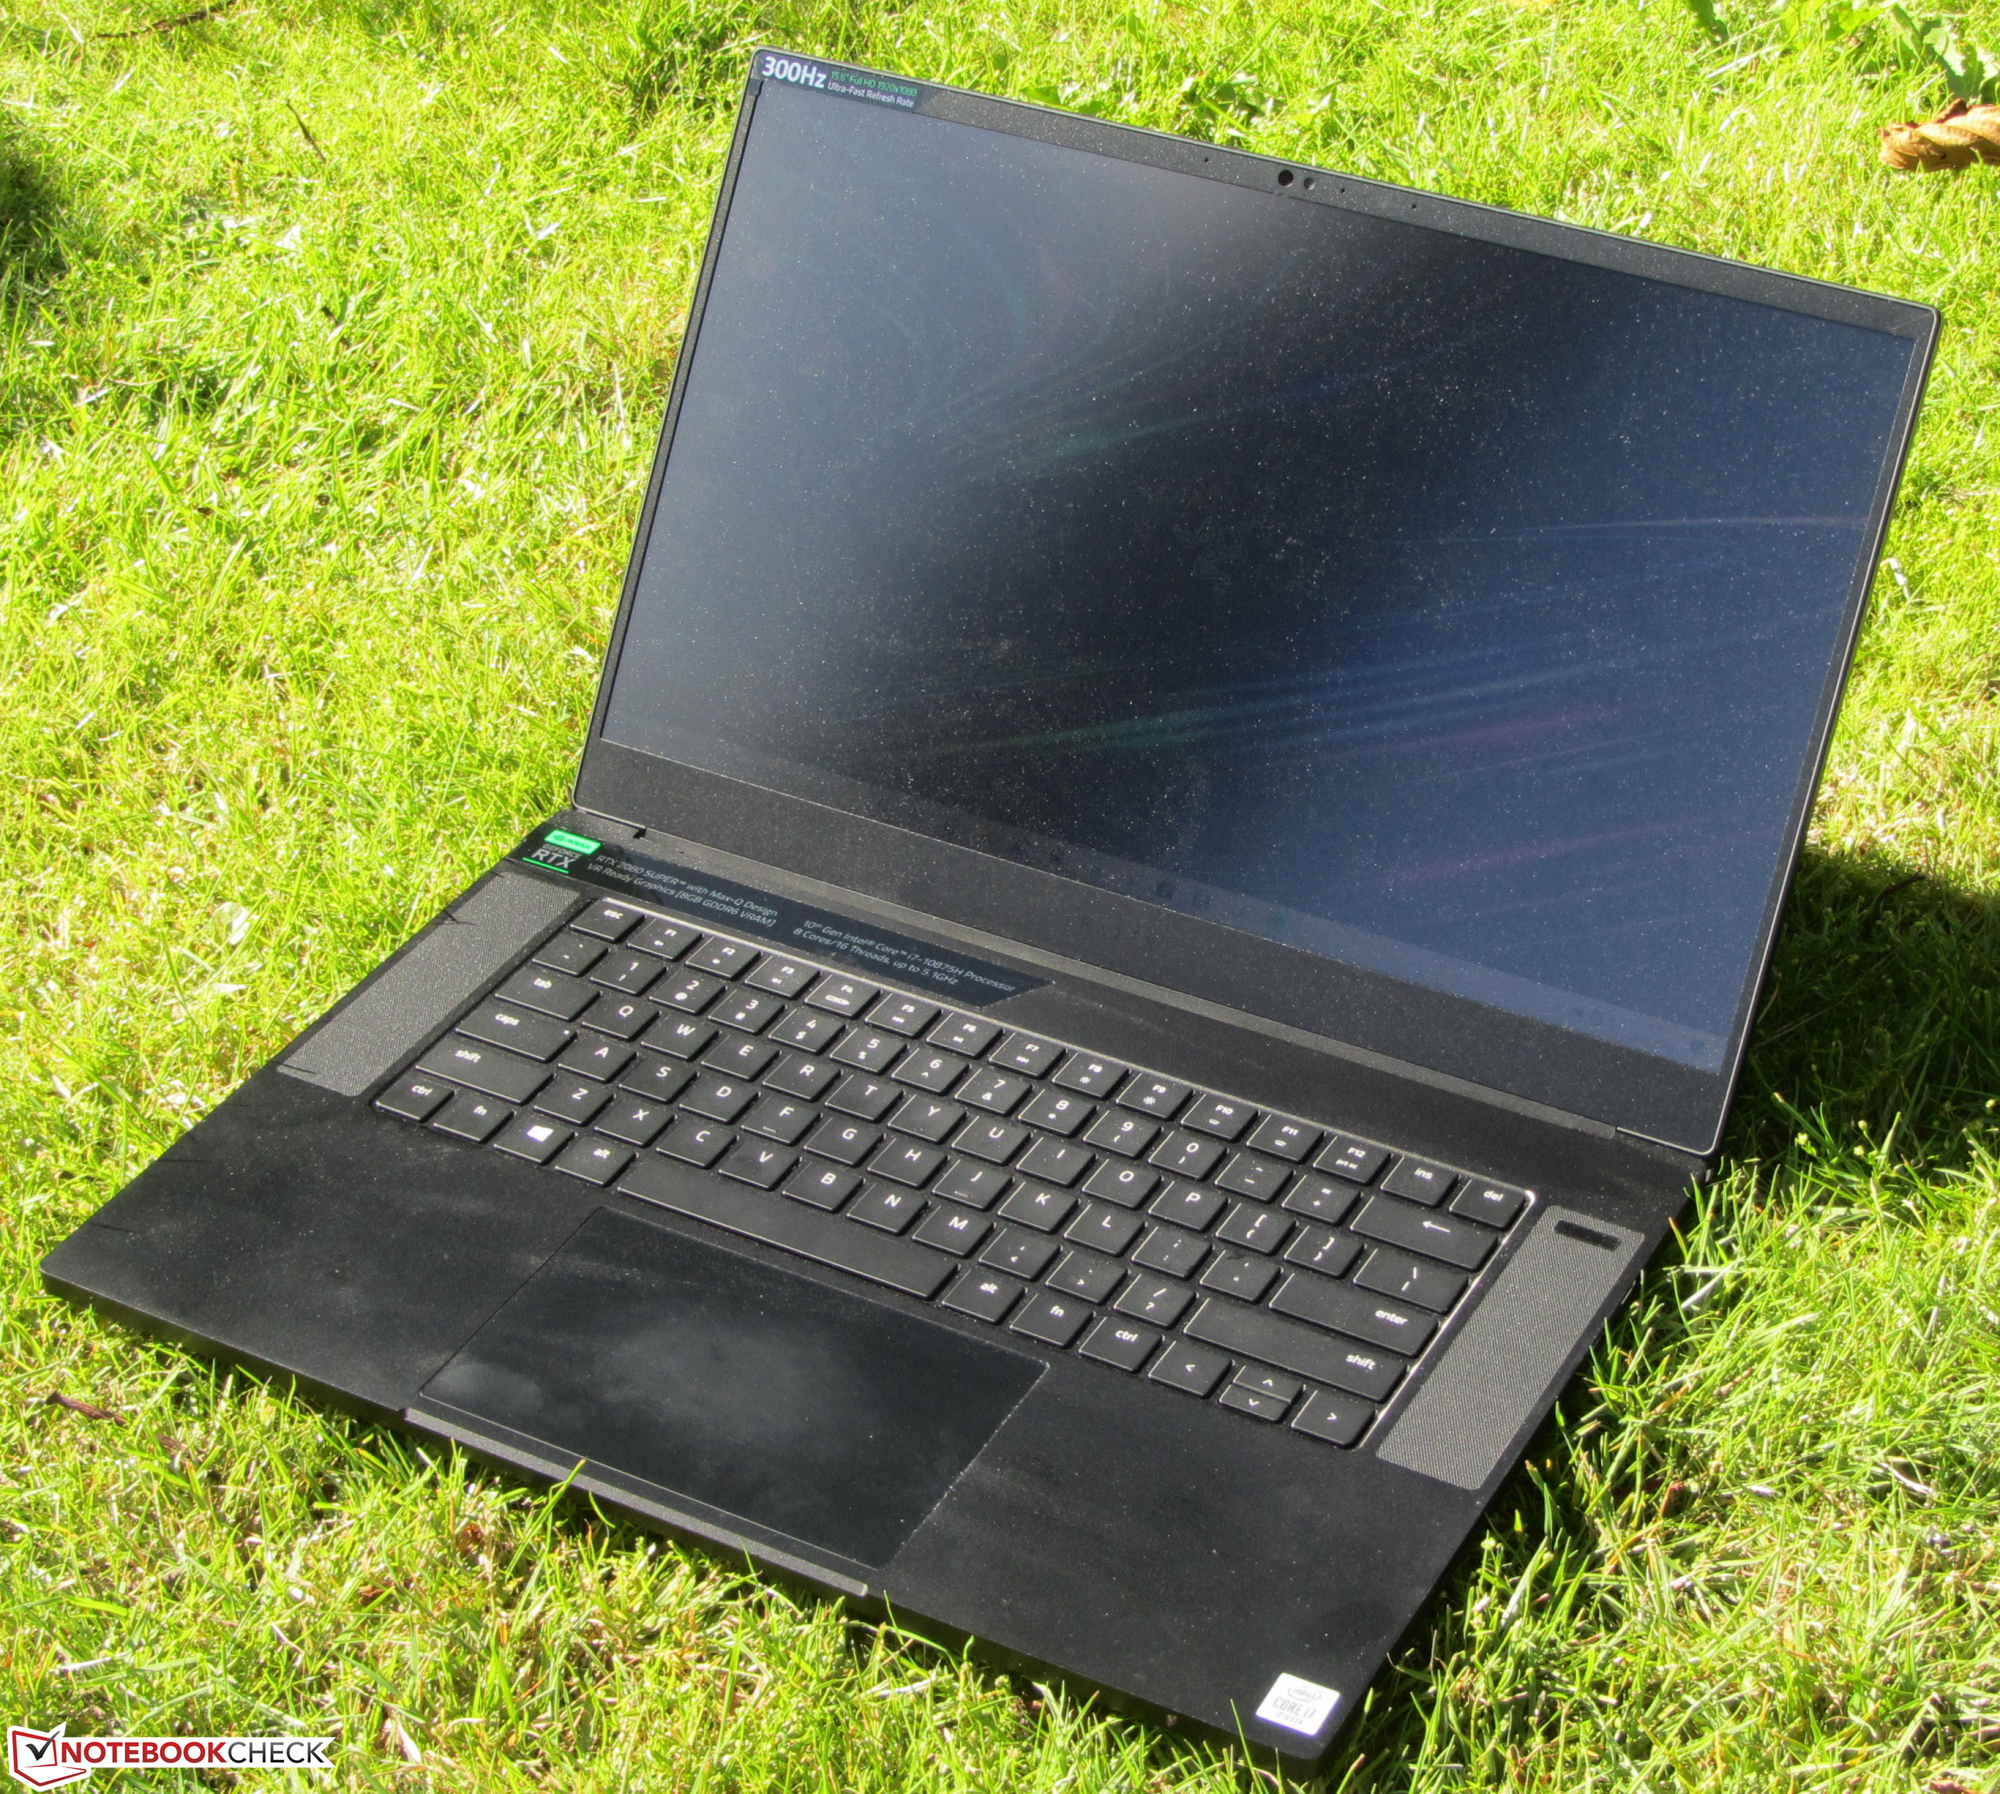
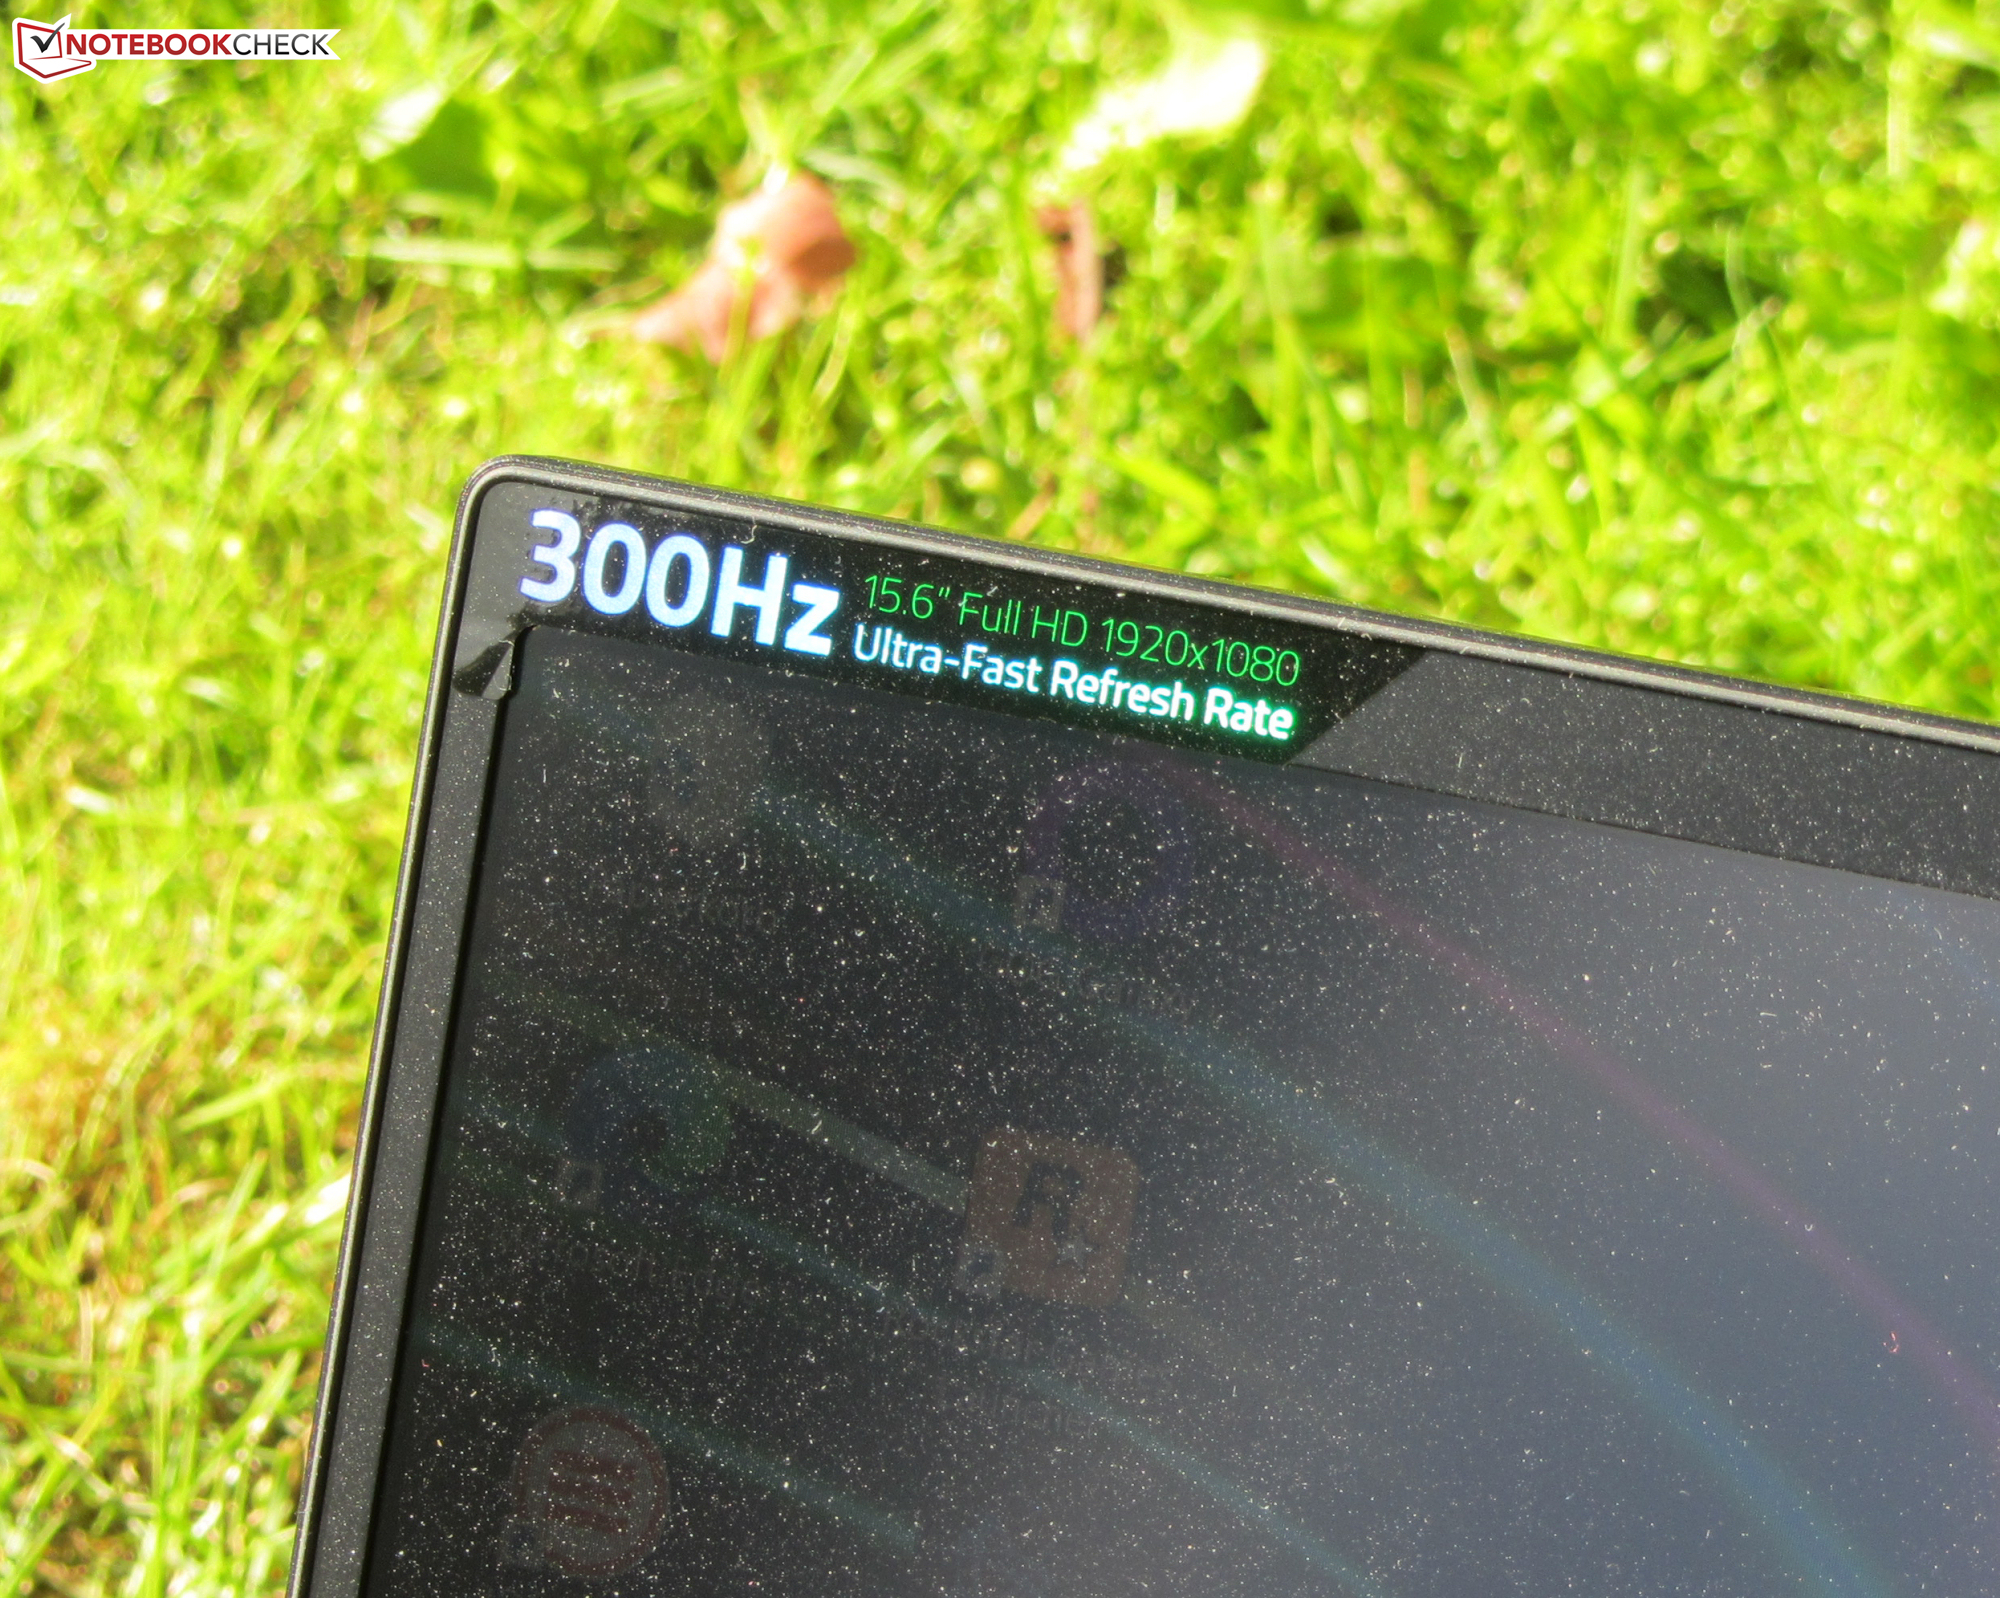
Ook het matte 300 Hz Full HD IPS-beeldscherm is een van de innovaties ten opzichte van het voorgangermodel. Het beeldscherm scoort met stabiele kijkhoeken, voldoende helderheid, goed contrast, snelle reactietijden en een geweldige kleurweergave. De dekking van de kleurruimte is ook prima.
Razer Blade 15 RTX 2080 Super Max-Q
- 10-08-2020 v7 (old)
Sascha Mölck
Price comparison
