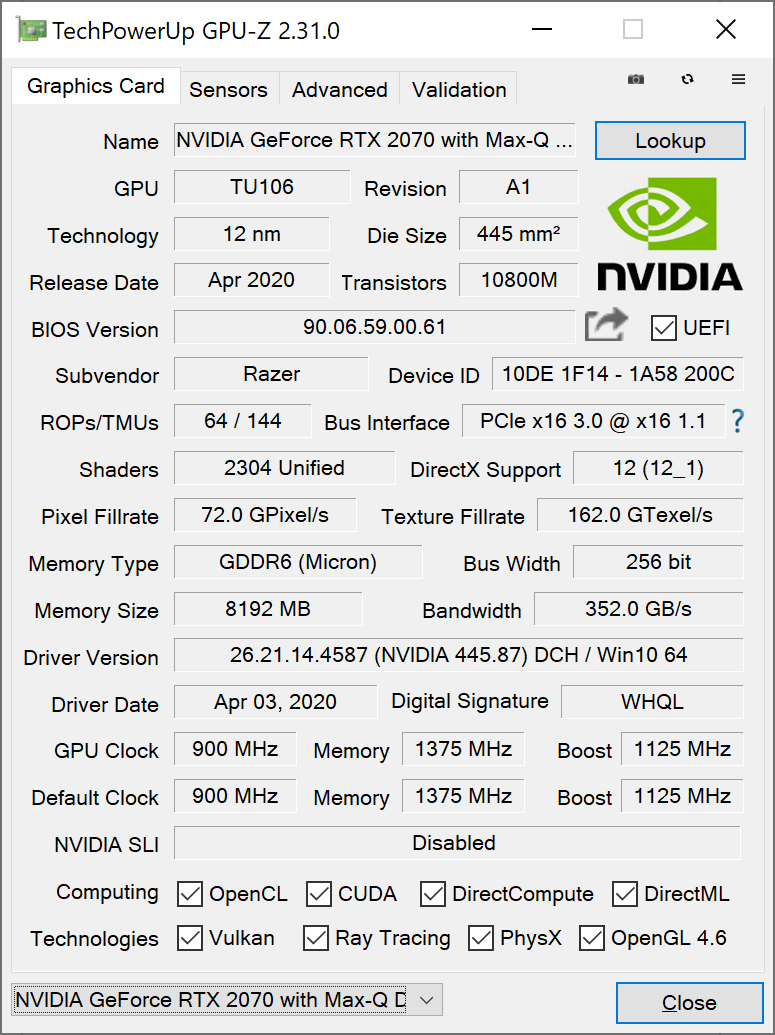
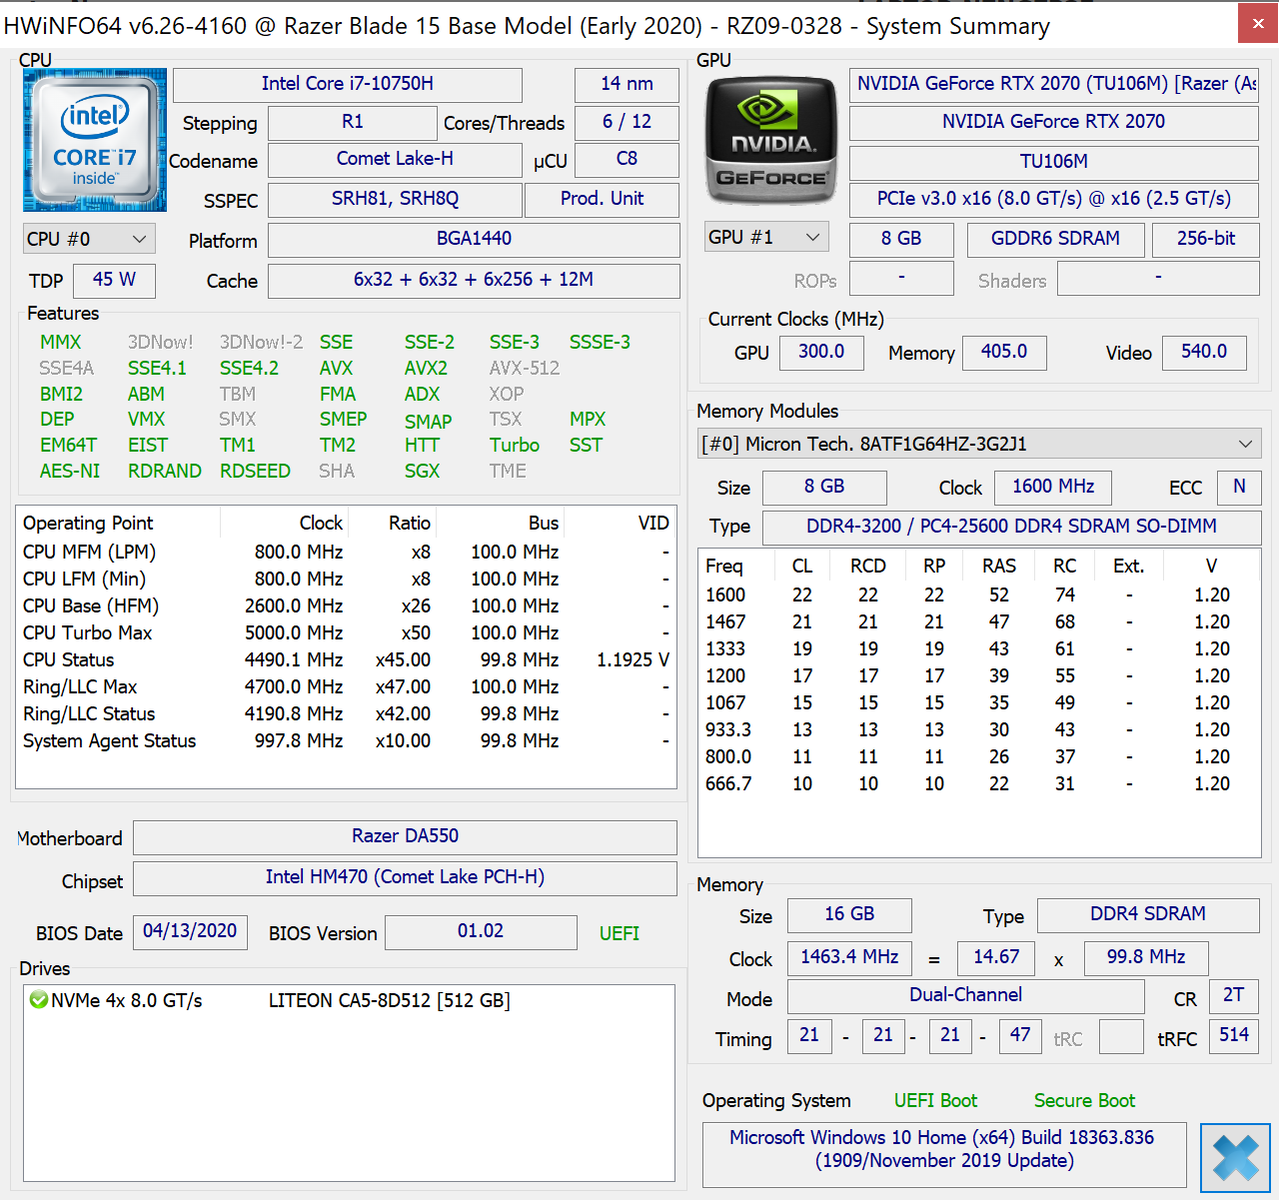
Kort testrapport 2020 Razer Blade 15 Base Model Laptop: de 10e Gen Intel Comet Lake-H Update
Evaluatie | Datum | Model | Gewicht | Hoogte | Formaat | Resolutie | Beste prijs |
|---|---|---|---|---|---|---|---|
| 86 % v7 (old) | 05-2020 | Razer Blade 15 RZ09-0328 i7-10750H, GeForce RTX 2070 Max-Q | 2.1 kg | 19.9 mm | 15.60" | 3840x2160 | |
| 84 % v7 (old) | 05-2020 | MSI GS66 10SGS i7-10750H, GeForce RTX 2080 Super Max-Q | 2.2 kg | 20 mm | 15.60" | 1920x1080 | |
| 81.5 % v7 (old) | 04-2019 | Asus Zephyrus S GX531GX i7-8750H, GeForce RTX 2080 Max-Q | 2.1 kg | 15.75 mm | 15.60" | 1920x1080 | |
| 85.8 % v7 (old) | 05-2020 | Gigabyte Aero 15 OLED XB-8DE51B0SP i7-10875H, GeForce RTX 2070 Super Max-Q | 2.2 kg | 20 mm | 15.60" | 3840x2160 | |
| 83 % v7 (old) | 09-2019 | Alienware m15 R2 P87F i7-9750H, GeForce RTX 2080 Max-Q | 2.2 kg | 18.3 mm | 15.60" | 1920x1080 | |
| 82.3 % v7 (old) | Xiaomi Mi Gaming Laptop 2019 i7-9750H, GeForce RTX 2060 Mobile | 2.6 kg | 21 mm | 15.60" | 1920x1080 |


| |||||||||||||||||||||||||
Helderheidsverdeling: 91 %
Helderheid in Batterij-modus: 366.7 cd/m²
Contrast: ∞:1 (Zwart: 0 cd/m²)
ΔE ColorChecker Calman: 5.21 | ∀{0.5-29.43 Ø4.71}
ΔE Greyscale Calman: 2 | ∀{0.09-98 Ø4.96}
100% sRGB (Argyll 1.6.3 3D)
86.6% AdobeRGB 1998 (Argyll 1.6.3 3D)
97.4% AdobeRGB 1998 (Argyll 3D)
100% sRGB (Argyll 3D)
99.9% Display P3 (Argyll 3D)
Gamma: 2.17
CCT: 6514 K
| Razer Blade 15 RZ09-0328 Samsung SDCA029, AMOLED, 15.6", 3840x2160 | MSI GS66 10SGS AU Optronics B156HAN12.0, IPS, 15.6", 1920x1080 | Razer Blade 15 RTX 2080 Max-Q Sharp LQ156M1JW03 (SHP14C5), IPS, 15.6", 1920x1080 | Asus Zephyrus S GX531GX AU Optronics B156HAN08.2, IPS, 15.6", 1920x1080 | Gigabyte Aero 15 OLED XB-8DE51B0SP Samsung SDCA029, OLED, 15.6", 3840x2160 | Alienware m15 R2 P87F Sharp LQ156M1, IPS, 15.6", 1920x1080 | |
|---|---|---|---|---|---|---|
| Display | -19% | -22% | -24% | 0% | -24% | |
| Display P3 Coverage (%) | 99.9 | 69.9 -30% | 66.9 -33% | 65.6 -34% | 99.9 0% | 65.3 -35% |
| sRGB Coverage (%) | 100 | 99.1 -1% | 98.1 -2% | 92.2 -8% | 100 0% | 95.1 -5% |
| AdobeRGB 1998 Coverage (%) | 97.4 | 71.1 -27% | 68.5 -30% | 66.9 -31% | 98.2 1% | 65.9 -32% |
| Response Times | -300% | -337% | -214% | 25% | -373% | |
| Response Time Grey 50% / Grey 80% * (ms) | 2.7 ? | 11.2 ? -315% | 12.8 ? -374% | 7 ? -159% | 2.2 ? 19% | 16.4 ? -507% |
| Response Time Black / White * (ms) | 2.6 ? | 10 ? -285% | 10.4 ? -300% | 9.6 ? -269% | 1.8 ? 31% | 8.8 ? -238% |
| PWM Frequency (Hz) | 59.5 ? | 23810 ? | 60 ? | 23810 ? | ||
| Screen | 8% | 4% | -6% | 20% | -52% | |
| Brightness middle (cd/m²) | 366.7 | 339.4 -7% | 293 -20% | 323.6 -12% | 385 5% | 324.2 -12% |
| Brightness (cd/m²) | 371 | 331 -11% | 270 -27% | 315 -15% | 390 5% | 304 -18% |
| Brightness Distribution (%) | 91 | 92 1% | 87 -4% | 91 0% | 93 2% | 90 -1% |
| Black Level * (cd/m²) | 0.24 | 0.29 | 0.29 | 0.38 | ||
| Colorchecker dE 2000 * | 5.21 | 1.58 70% | 1.69 68% | 3.31 36% | 2.46 53% | 5.01 4% |
| Colorchecker dE 2000 max. * | 7.92 | 3.8 52% | 3.37 57% | 5.74 28% | 4.01 49% | 12.7 -60% |
| Greyscale dE 2000 * | 2 | 2.3 -15% | 2.3 -15% | 2.9 -45% | 1.39 30% | 7.9 -295% |
| Gamma | 2.17 101% | 2.24 98% | 2.3 96% | 2.29 96% | 2.31 95% | 2.35 94% |
| CCT | 6514 100% | 6952 93% | 6758 96% | 6765 96% | 6395 102% | 8455 77% |
| Color Space (Percent of AdobeRGB 1998) (%) | 86.6 | 64.8 -25% | 63 -27% | 59.7 -31% | 98 13% | 60.8 -30% |
| Color Space (Percent of sRGB) (%) | 100 | 99.4 -1% | 98.5 -1% | 91.8 -8% | 100 0% | 95.5 -4% |
| Contrast (:1) | 1414 | 1010 | 1116 | 853 | ||
| Colorchecker dE 2000 calibrated * | 1.47 | 1.24 | 2.73 | 2.6 | 1.64 | |
| Totaal Gemiddelde (Programma / Instellingen) | -104% /
-46% | -118% /
-54% | -81% /
-42% | 15% /
16% | -150% /
-95% |
* ... kleiner is beter
Responstijd Scherm
| ↔ Responstijd Zwart naar Wit | ||
|---|---|---|
| 2.6 ms ... stijging ↗ en daling ↘ gecombineerd | ↗ 1.1 ms stijging | 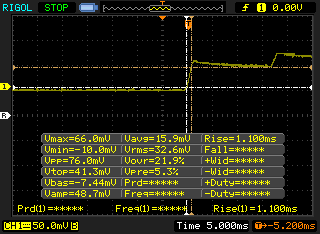 |
| ↘ 1.5 ms daling | ||
| Het scherm vertoonde erg snelle responstijden in onze tests en zou zeer geschikt moeten zijn voor snelle games. Ter vergelijking: alle testtoestellen variëren van 0.1 (minimum) tot 240 (maximum) ms. » 14 % van alle toestellen zijn beter. Dit betekent dat de gemeten responstijd beter is dan het gemiddelde (19.8 ms) van alle geteste toestellen. | ||
| ↔ Responstijd 50% Grijs naar 80% Grijs | ||
| 2.7 ms ... stijging ↗ en daling ↘ gecombineerd | ↗ 1.2 ms stijging | 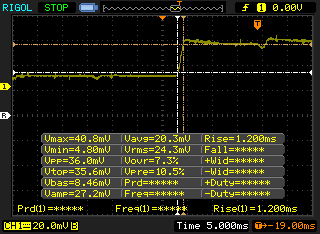 |
| ↘ 1.5 ms daling | ||
| Het scherm vertoonde erg snelle responstijden in onze tests en zou zeer geschikt moeten zijn voor snelle games. Ter vergelijking: alle testtoestellen variëren van 0.165 (minimum) tot 636 (maximum) ms. » 12 % van alle toestellen zijn beter. Dit betekent dat de gemeten responstijd beter is dan het gemiddelde (30.9 ms) van alle geteste toestellen. | ||
Screen Flickering / PWM (Pulse-Width Modulation)
| Screen flickering / PWM waargenomen | 59.5 Hz | ≤ 100 % helderheid instelling | 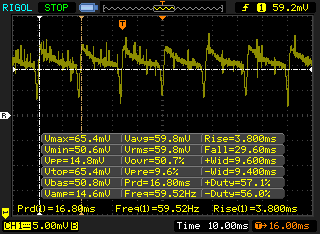 |
De achtergrondverlichting van het scherm flikkert op 59.5 Hz (in het slechtste geval, bijvoorbeeld bij gebruik van PWM) aan een helderheid van 100 % en lager. Boven deze helderheid zou er geen flickering / PWM mogen optreden. De frequentie van 59.5 Hz is erg laag en kan dus aanleiding geven tot geïrriteerde ogen en hoofdpijn bij langer gebruik. Ter vergelijking: 52 % van alle geteste toestellen maakten geen gebruik van PWM om de schermhelderheid te verlagen. Als het wel werd gebruikt, werd een gemiddelde van 7744 (minimum: 5 - maximum: 343500) Hz waargenomen. | |||
Cinebench R15: CPU Multi 64Bit | CPU Single 64Bit
Blender: v2.79 BMW27 CPU
7-Zip 18.03: 7z b 4 -mmt1 | 7z b 4
Geekbench 5.5: Single-Core | Multi-Core
HWBOT x265 Benchmark v2.2: 4k Preset
LibreOffice : 20 Documents To PDF
R Benchmark 2.5: Overall mean
| Cinebench R20 / CPU (Multi Core) | |
| Eurocom Sky X4C i9-9900KS | |
| Asus Zephyrus G14 GA401IV | |
| Asus TUF Gaming A15 FA506UI | |
| Gigabyte Aero 15 OLED XB-8DE51B0SP | |
| MSI GS66 Stealth 10SFS | |
| MSI GE65 Raider 9SF-049US | |
| Gemiddeld Intel Core i7-10750H (1749 - 3325, n=43) | |
| Razer Blade 15 RZ09-0328 | |
| Gemiddeld Intel Core i7-9750H (2017 - 3133, n=55) | |
| MSI GE63 Raider 8SG | |
| Razer Blade 15 GTX 1660 Ti | |
| MSI Alpha 15 A3DDK-034 | |
| Cinebench R20 / CPU (Single Core) | |
| Gigabyte Aero 15 OLED XB-8DE51B0SP | |
| Eurocom Sky X4C i9-9900KS | |
| Asus Zephyrus G14 GA401IV | |
| MSI GS66 Stealth 10SFS | |
| MSI GE65 Raider 9SF-049US | |
| Gemiddeld Intel Core i7-10750H (431 - 504, n=43) | |
| Razer Blade 15 RZ09-0328 | |
| Gemiddeld Intel Core i7-9750H (416 - 486, n=55) | |
| Razer Blade 15 GTX 1660 Ti | |
| MSI GE63 Raider 8SG | |
| MSI Alpha 15 A3DDK-034 | |
| Cinebench R15 / CPU Multi 64Bit | |
| Eurocom Sky X4C i9-9900KS | |
| Asus Zephyrus G14 GA401IV | |
| Asus TUF Gaming A15 FA506UI | |
| Gigabyte Aero 15 OLED XB-8DE51B0SP | |
| MSI GS66 Stealth 10SFS | |
| MSI GE65 Raider 9SF-049US | |
| Gemiddeld Intel Core i7-10750H (804 - 1418, n=50) | |
| Gemiddeld Intel Core i7-9750H (952 - 1306, n=85) | |
| Razer Blade 15 RZ09-0328 | |
| MSI GE63 Raider 8SG | |
| Razer Blade 15 GTX 1660 Ti | |
| MSI Alpha 15 A3DDK-034 | |
| Cinebench R15 / CPU Single 64Bit | |
| Eurocom Sky X4C i9-9900KS | |
| Gigabyte Aero 15 OLED XB-8DE51B0SP | |
| MSI GS66 Stealth 10SFS | |
| MSI GE65 Raider 9SF-049US | |
| Gemiddeld Intel Core i7-10750H (184 - 213, n=45) | |
| Asus Zephyrus G14 GA401IV | |
| Razer Blade 15 RZ09-0328 | |
| Gemiddeld Intel Core i7-9750H (170 - 194, n=82) | |
| Razer Blade 15 GTX 1660 Ti | |
| MSI GE63 Raider 8SG | |
| MSI Alpha 15 A3DDK-034 | |
| Blender / v2.79 BMW27 CPU | |
| Gemiddeld Intel Core i7-9750H (342 - 495, n=21) | |
| Razer Blade 15 RZ09-0328 | |
| Gemiddeld Intel Core i7-10750H (322 - 587, n=43) | |
| Asus Zephyrus G14 GA401IV | |
| MSI GS66 Stealth 10SFS | |
| Gigabyte Aero 15 OLED XB-8DE51B0SP | |
| Eurocom Sky X4C i9-9900KS | |
| 7-Zip 18.03 / 7z b 4 -mmt1 | |
| Eurocom Sky X4C i9-9900KS | |
| Gigabyte Aero 15 OLED XB-8DE51B0SP | |
| MSI GS66 Stealth 10SFS | |
| Gemiddeld Intel Core i7-10750H (4504 - 5470, n=43) | |
| Razer Blade 15 RZ09-0328 | |
| Gemiddeld Intel Core i7-9750H (4580 - 5090, n=21) | |
| Asus Zephyrus G14 GA401IV | |
| 7-Zip 18.03 / 7z b 4 | |
| Eurocom Sky X4C i9-9900KS | |
| Asus Zephyrus G14 GA401IV | |
| Gigabyte Aero 15 OLED XB-8DE51B0SP | |
| MSI GS66 Stealth 10SFS | |
| Gemiddeld Intel Core i7-10750H (26040 - 37345, n=43) | |
| Gemiddeld Intel Core i7-9750H (28512 - 35174, n=21) | |
| Razer Blade 15 RZ09-0328 | |
| Geekbench 5.5 / Single-Core | |
| Eurocom Sky X4C i9-9900KS | |
| Gigabyte Aero 15 OLED XB-8DE51B0SP | |
| MSI GS66 Stealth 10SFS | |
| Gemiddeld Intel Core i7-10750H (1114 - 1333, n=43) | |
| Asus Zephyrus G14 GA401IV | |
| Gemiddeld Intel Core i7-9750H (1117 - 1251, n=13) | |
| Razer Blade 15 RZ09-0328 | |
| MSI Alpha 15 A3DDK-034 | |
| Geekbench 5.5 / Multi-Core | |
| Eurocom Sky X4C i9-9900KS | |
| Gigabyte Aero 15 OLED XB-8DE51B0SP | |
| Asus Zephyrus G14 GA401IV | |
| MSI GS66 Stealth 10SFS | |
| Gemiddeld Intel Core i7-10750H (4443 - 6674, n=43) | |
| Gemiddeld Intel Core i7-9750H (4859 - 6262, n=13) | |
| Razer Blade 15 RZ09-0328 | |
| MSI Alpha 15 A3DDK-034 | |
| HWBOT x265 Benchmark v2.2 / 4k Preset | |
| Eurocom Sky X4C i9-9900KS | |
| Gigabyte Aero 15 OLED XB-8DE51B0SP | |
| MSI GS66 Stealth 10SFS | |
| Asus Zephyrus G14 GA401IV | |
| Gemiddeld Intel Core i7-10750H (5.54 - 11.6, n=43) | |
| Gemiddeld Intel Core i7-9750H (7.1 - 10.7, n=21) | |
| Razer Blade 15 RZ09-0328 | |
| LibreOffice / 20 Documents To PDF | |
| Gemiddeld Intel Core i7-9750H (54.5 - 64.7, n=9) | |
| Gemiddeld Intel Core i7-10750H (43.1 - 99.2, n=43) | |
| Razer Blade 15 RZ09-0328 | |
| MSI GS66 Stealth 10SFS | |
| Gigabyte Aero 15 OLED XB-8DE51B0SP | |
| R Benchmark 2.5 / Overall mean | |
| Gemiddeld Intel Core i7-9750H (0.608 - 0.695, n=14) | |
| Gemiddeld Intel Core i7-10750H (0.578 - 0.708, n=42) | |
| MSI GS66 Stealth 10SFS | |
| Gigabyte Aero 15 OLED XB-8DE51B0SP | |
* ... kleiner is beter
| PCMark 8 | |
| Home Score Accelerated v2 | |
| MSI GS66 10SGS | |
| Razer Blade 15 RTX 2080 Max-Q | |
| Alienware m15 R2 P87F | |
| Asus Zephyrus S GX531GX | |
| Razer Blade 15 RZ09-0328 | |
| Work Score Accelerated v2 | |
| MSI GS66 10SGS | |
| Razer Blade 15 RTX 2080 Max-Q | |
| Alienware m15 R2 P87F | |
| Asus Zephyrus S GX531GX | |
| Razer Blade 15 RZ09-0328 | |
| PCMark 8 Home Score Accelerated v2 | 3696 punten | |
| PCMark 8 Work Score Accelerated v2 | 4705 punten | |
| PCMark 10 Score | 5244 punten | |
Help | ||
| DPC Latencies / LatencyMon - interrupt to process latency (max), Web, Youtube, Prime95 | |
| Apple MacBook Air 2020 i5 | |
| Gigabyte Aero 15 OLED XB-8DE51B0SP | |
| MSI GS66 10SGS | |
| Schenker XMG Apex 15 NH57AF1 | |
| Razer Blade 15 RZ09-0328 | |
* ... kleiner is beter
| Razer Blade 15 RZ09-0328 Lite-On CA5-8D512 | Razer Blade 15 RTX 2080 Max-Q Samsung SSD PM981 MZVLB512HAJQ | MSI GS66 10SGS Samsung SSD PM981 MZVLB512HAJQ | Asus Zephyrus S GX531GX Intel SSD 660p SSDPEKNW512G8 | Gigabyte Aero 15 OLED XB-8DE51B0SP Intel Optane Memory H10 with Solid State Storage 32GB + 512GB HBRPEKNX0202A(L/H) | Alienware m15 R2 P87F 2x Toshiba XG6 KXG60ZNV512G (RAID 0) | |
|---|---|---|---|---|---|---|
| AS SSD | 18% | 21% | -27% | -15% | 6% | |
| Seq Read (MB/s) | 2021 | 1832 -9% | 1086 -46% | 1239 -39% | 1200 -41% | 1925 -5% |
| Seq Write (MB/s) | 2090 | 1864 -11% | 1901 -9% | 920 -56% | 836 -60% | 2371 13% |
| 4K Read (MB/s) | 47.71 | 52.1 9% | 51 7% | 45.74 -4% | 65.8 38% | 37.2 -22% |
| 4K Write (MB/s) | 101.1 | 108.3 7% | 117.3 16% | 95.7 -5% | 103.8 3% | 108.9 8% |
| 4K-64 Read (MB/s) | 856 | 1159 35% | 1503 76% | 322 -62% | 789 -8% | 1177 38% |
| 4K-64 Write (MB/s) | 1041 | 1807 74% | 1721 65% | 722 -31% | 929 -11% | 1135 9% |
| Access Time Read * (ms) | 0.052 | 0.05 4% | 0.059 -13% | 0.073 -40% | 0.103 -98% | 0.065 -25% |
| Access Time Write * (ms) | 0.111 | 0.034 69% | 0.1 10% | 0.047 58% | 0.045 59% | 0.108 3% |
| Score Read (Points) | 1105 | 1394 26% | 1662 50% | 492 -55% | 975 -12% | 1407 27% |
| Score Write (Points) | 1351 | 2102 56% | 2029 50% | 910 -33% | 1117 -17% | 1481 10% |
| Score Total (Points) | 3037 | 4221 39% | 4588 51% | 1654 -46% | 2594 -15% | 3633 20% |
| Copy ISO MB/s (MB/s) | 2474 | 2083 -16% | 2155 -13% | 1236 -50% | 2073 -16% | |
| Copy Program MB/s (MB/s) | 679 | 496.5 -27% | 715 5% | 703 4% | 576 -15% | |
| Copy Game MB/s (MB/s) | 1037 | 977 -6% | 1506 45% | 812 -22% | 1426 38% | |
| CrystalDiskMark 5.2 / 6 | -11% | -9% | -41% | -2% | 4% | |
| Write 4K (MB/s) | 118.7 | 137.2 16% | 132.5 12% | 93.9 -21% | 127.4 7% | 108.8 -8% |
| Read 4K (MB/s) | 52.4 | 46.82 -11% | 45.03 -14% | 46.29 -12% | 147.5 181% | 45.41 -13% |
| Write Seq (MB/s) | 2247 | 1221 -46% | 1987 -12% | 974 -57% | 485.9 -78% | 2467 10% |
| Read Seq (MB/s) | 2234 | 1217 -46% | 1434 -36% | 1425 -36% | 1352 -39% | 2456 10% |
| Write 4K Q32T1 (MB/s) | 515 | 527 2% | 467.5 -9% | 259.4 -50% | 476.5 -7% | 532 3% |
| Read 4K Q32T1 (MB/s) | 584 | 614 5% | 536 -8% | 296.5 -49% | 531 -9% | 590 1% |
| Write Seq Q32T1 (MB/s) | 2235 | 1986 -11% | 2003 -10% | 977 -56% | 1061 -53% | 2801 25% |
| Read Seq Q32T1 (MB/s) | 3171 | 3234 2% | 3306 4% | 1666 -47% | 2552 -20% | 3172 0% |
| Totaal Gemiddelde (Programma / Instellingen) | 4% /
7% | 6% /
10% | -34% /
-32% | -9% /
-9% | 5% /
5% |
* ... kleiner is beter

Disk Throttling: DiskSpd Read Loop, Queue Depth 8
| 3DMark 11 Performance | 18964 punten | |
| 3DMark Cloud Gate Standard Score | 26823 punten | |
| 3DMark Fire Strike Score | 15800 punten | |
| 3DMark Time Spy Score | 6527 punten | |
Help | ||
| Shadow of the Tomb Raider | |
| 1920x1080 Highest Preset AA:T | |
| Razer Blade Pro 17 4K UHD 120 Hz | |
| Asus ROG Strix RTX 2070 OC | |
| Razer Blade 15 RZ09-0328 | |
| Walmart EVOO Gaming 17 | |
| Asus Strix Scar III G531GW-AZ062T | |
| Gemiddeld NVIDIA GeForce RTX 2070 Max-Q (57 - 89, n=12) | |
| Asus Zephyrus G14 GA401IV | |
| Razer Blade 15 GTX 1660 Ti | |
| HP Omen 15-dc0015ng | |
| Asus TUF FX705GM | |
| 1920x1080 High Preset AA:SM | |
| Razer Blade Pro 17 4K UHD 120 Hz | |
| Asus ROG Strix RTX 2070 OC | |
| Walmart EVOO Gaming 17 | |
| Razer Blade 15 RZ09-0328 | |
| Asus Strix Scar III G531GW-AZ062T | |
| Gemiddeld NVIDIA GeForce RTX 2070 Max-Q (62 - 98, n=12) | |
| Asus Zephyrus G14 GA401IV | |
| Razer Blade 15 GTX 1660 Ti | |
| HP Omen 15-dc0015ng | |
| Asus TUF FX705GM | |
| lage | gem. | hoge | ultra | 4K | |
|---|---|---|---|---|---|
| The Witcher 3 (2015) | 289.6 | 203.3 | 118.8 | 61.9 | 43.5 |
| Dota 2 Reborn (2015) | 143 | 132 | 124 | 116 | 90.8 |
| X-Plane 11.11 (2018) | 94.1 | 88.5 | 79.5 | 51.4 | |
| Shadow of the Tomb Raider (2018) | 129 | 100 | 94 | 85 | 30 |
| Borderlands 3 (2019) | 135.6 | 103.2 | 74.4 | 57.3 | 21.5 |
| Razer Blade 15 RZ09-0328 GeForce RTX 2070 Max-Q, i7-10750H, Lite-On CA5-8D512 | MSI GS66 10SGS GeForce RTX 2080 Super Max-Q, i7-10750H, Samsung SSD PM981 MZVLB512HAJQ | Razer Blade 15 RTX 2080 Max-Q GeForce RTX 2080 Max-Q, i7-9750H, Samsung SSD PM981 MZVLB512HAJQ | Asus Zephyrus S GX531GX GeForce RTX 2080 Max-Q, i7-8750H, Intel SSD 660p SSDPEKNW512G8 | Gigabyte Aero 15 OLED XB-8DE51B0SP GeForce RTX 2070 Super Max-Q, i7-10875H, Intel Optane Memory H10 with Solid State Storage 32GB + 512GB HBRPEKNX0202A(L/H) | Alienware m15 R2 P87F GeForce RTX 2080 Max-Q, i7-9750H, 2x Toshiba XG6 KXG60ZNV512G (RAID 0) | |
|---|---|---|---|---|---|---|
| Noise | -2% | 7% | -8% | -13% | -10% | |
| uit / omgeving * (dB) | 28.4 | 28.5 -0% | 28.3 -0% | 28.7 -1% | 30 -6% | 28.3 -0% |
| Idle Minimum * (dB) | 28.4 | 30 -6% | 28.8 -1% | 29.8 -5% | 34 -20% | 28.5 -0% |
| Idle Average * (dB) | 28.4 | 30 -6% | 28.8 -1% | 32.4 -14% | 36 -27% | 28.5 -0% |
| Idle Maximum * (dB) | 31.7 | 30.9 3% | 29 9% | 38 -20% | 41 -29% | 49 -55% |
| Load Average * (dB) | 47.7 | 39.5 17% | 33.5 30% | 38.2 20% | 48 -1% | 49 -3% |
| Witcher 3 ultra * (dB) | 47.5 | 48 -1% | 45 5% | 56.6 -19% | 48 -1% | 49 -3% |
| Load Maximum * (dB) | 49.5 | 59.4 -20% | 45.2 9% | 56.6 -14% | 54 -9% | 55 -11% |
* ... kleiner is beter
Geluidsniveau
| Onbelast |
| 28.4 / 28.4 / 31.7 dB (A) |
| Belasting |
| 47.7 / 49.5 dB (A) |
 | ||
30 dB stil 40 dB(A) hoorbaar 50 dB(A) luid |
||
min: | ||
(-) De maximumtemperatuur aan de bovenzijde bedraagt 49.6 °C / 121 F, vergeleken met het gemiddelde van 40.4 °C / 105 F, variërend van 21.2 tot 68.8 °C voor de klasse Gaming.
(-) De bodem warmt op tot een maximum van 50.2 °C / 122 F, vergeleken met een gemiddelde van 43.2 °C / 110 F
(+) Bij onbelast gebruik bedraagt de gemiddelde temperatuur voor de bovenzijde 30.3 °C / 87 F, vergeleken met het apparaatgemiddelde van 33.9 °C / 93 F.
(-) Bij het spelen van The Witcher 3 is de gemiddelde temperatuur voor de bovenzijde 40.6 °C / 105 F, vergeleken met het apparaatgemiddelde van 33.9 °C / 93 F.
(±) De palmsteunen en het touchpad kunnen zeer heet aanvoelen met een maximum van ###max## °C / 103.3 F.
(-) De gemiddelde temperatuur van de handpalmsteun van soortgelijke toestellen bedroeg 28.8 °C / 83.8 F (-10.8 °C / -19.5 F).
Razer Blade 15 RZ09-0328 audioanalyse
(±) | luidspreker luidheid is gemiddeld maar goed (79.2 dB)
Bas 100 - 315 Hz
(±) | verminderde zeebaars - gemiddeld 12.3% lager dan de mediaan
(±) | lineariteit van de lage tonen is gemiddeld (12.7% delta ten opzichte van de vorige frequentie)
Midden 400 - 2000 Hz
(±) | hogere middens - gemiddeld 8.4% hoger dan de mediaan
(+) | de middentonen zijn lineair (5.9% delta ten opzichte van de vorige frequentie)
Hoog 2 - 16 kHz
(±) | lagere maxima - gemiddeld 7.3% lager dan de mediaan
(±) | lineariteit van de hoogtepunten is gemiddeld (7.5% delta ten opzichte van de vorige frequentie)
Algemeen 100 - 16.000 Hz
(±) | lineariteit van het totale geluid is gemiddeld (27.7% verschil met de mediaan)
Vergeleken met dezelfde klasse
» 93% van alle geteste apparaten in deze klasse waren beter, 1% vergelijkbaar, 5% slechter
» De beste had een delta van 6%, het gemiddelde was 18%, de slechtste was 132%
Vergeleken met alle geteste toestellen
» 84% van alle geteste apparaten waren beter, 3% gelijk, 13% slechter
» De beste had een delta van 4%, het gemiddelde was 23%, de slechtste was 134%
Apple MacBook 12 (Early 2016) 1.1 GHz audioanalyse
(+) | luidsprekers kunnen relatief luid spelen (83.6 dB)
Bas 100 - 315 Hz
(±) | verminderde zeebaars - gemiddeld 11.3% lager dan de mediaan
(±) | lineariteit van de lage tonen is gemiddeld (14.2% delta ten opzichte van de vorige frequentie)
Midden 400 - 2000 Hz
(+) | evenwichtige middens - slechts 2.4% verwijderd van de mediaan
(+) | de middentonen zijn lineair (5.5% delta ten opzichte van de vorige frequentie)
Hoog 2 - 16 kHz
(+) | evenwichtige hoogtepunten - slechts 2% verwijderd van de mediaan
(+) | de hoge tonen zijn lineair (4.5% delta naar de vorige frequentie)
Algemeen 100 - 16.000 Hz
(+) | het totale geluid is lineair (10.2% verschil met de mediaan)
Vergeleken met dezelfde klasse
» 7% van alle geteste apparaten in deze klasse waren beter, 2% vergelijkbaar, 90% slechter
» De beste had een delta van 5%, het gemiddelde was 18%, de slechtste was 53%
Vergeleken met alle geteste toestellen
» 5% van alle geteste apparaten waren beter, 1% gelijk, 94% slechter
» De beste had een delta van 4%, het gemiddelde was 23%, de slechtste was 134%
| Uit / Standby | |
| Inactief | |
| Belasting |
|
Key:
min: | |
| Razer Blade 15 RZ09-0328 i7-10750H, GeForce RTX 2070 Max-Q, Lite-On CA5-8D512, AMOLED, 3840x2160, 15.6" | MSI GS66 10SGS i7-10750H, GeForce RTX 2080 Super Max-Q, Samsung SSD PM981 MZVLB512HAJQ, IPS, 1920x1080, 15.6" | Razer Blade 15 RTX 2080 Max-Q i7-9750H, GeForce RTX 2080 Max-Q, Samsung SSD PM981 MZVLB512HAJQ, IPS, 1920x1080, 15.6" | Gigabyte Aero 15 OLED XB-8DE51B0SP i7-10875H, GeForce RTX 2070 Super Max-Q, Intel Optane Memory H10 with Solid State Storage 32GB + 512GB HBRPEKNX0202A(L/H), OLED, 3840x2160, 15.6" | Alienware m15 R2 P87F i7-9750H, GeForce RTX 2080 Max-Q, 2x Toshiba XG6 KXG60ZNV512G (RAID 0), IPS, 1920x1080, 15.6" | Xiaomi Mi Gaming Laptop 2019 i7-9750H, GeForce RTX 2060 Mobile, Toshiba XG6 KXG60ZNV512G, IPS, 1920x1080, 15.6" | |
|---|---|---|---|---|---|---|
| Power Consumption | -6% | 4% | -26% | -62% | 11% | |
| Idle Minimum * (Watt) | 11.1 | 14.9 -34% | 12.5 -13% | 18 -62% | 19 -71% | 10 10% |
| Idle Average * (Watt) | 13.7 | 17.5 -28% | 15.3 -12% | 21 -53% | 40.5 -196% | 13 5% |
| Idle Maximum * (Watt) | 33.4 | 29.5 12% | 20.7 38% | 38 -14% | 52 -56% | 20 40% |
| Load Average * (Watt) | 104.4 | 94.8 9% | 90.2 14% | 113 -8% | 132.3 -27% | 100 4% |
| Witcher 3 ultra * (Watt) | 159.9 | 146.1 9% | 162 -1% | 149 7% | 183.3 -15% | 159 1% |
| Load Maximum * (Watt) | 203.8 | 210.9 -3% | 209.3 -3% | 256 -26% | 217.2 -7% | 196 4% |
* ... kleiner is beter
| Razer Blade 15 RZ09-0328 i7-10750H, GeForce RTX 2070 Max-Q, 65 Wh | MSI GS66 10SGS i7-10750H, GeForce RTX 2080 Super Max-Q, 99.99 Wh | Razer Blade 15 RTX 2080 Max-Q i7-9750H, GeForce RTX 2080 Max-Q, 80 Wh | Asus Zephyrus S GX531GX i7-8750H, GeForce RTX 2080 Max-Q, 50 Wh | Gigabyte Aero 15 OLED XB-8DE51B0SP i7-10875H, GeForce RTX 2070 Super Max-Q, 94.2 Wh | Alienware m15 R2 P87F i7-9750H, GeForce RTX 2080 Max-Q, 76 Wh | |
|---|---|---|---|---|---|---|
| Batterijduur | 73% | 65% | -25% | 53% | 38% | |
| WiFi v1.3 (h) | 4 | 6.9 73% | 6.6 65% | 3 -25% | 6.1 53% | 5.5 38% |
| Reader / Idle (h) | 10.2 | 15.9 | 8.6 | 9.2 | ||
| Load (h) | 1.6 | 1.7 | 2.8 | 0.7 |
Pro
Contra
Dit is de verkorte versie van het originele artikel. Het volledige, Engelse testrapport vind je hier.
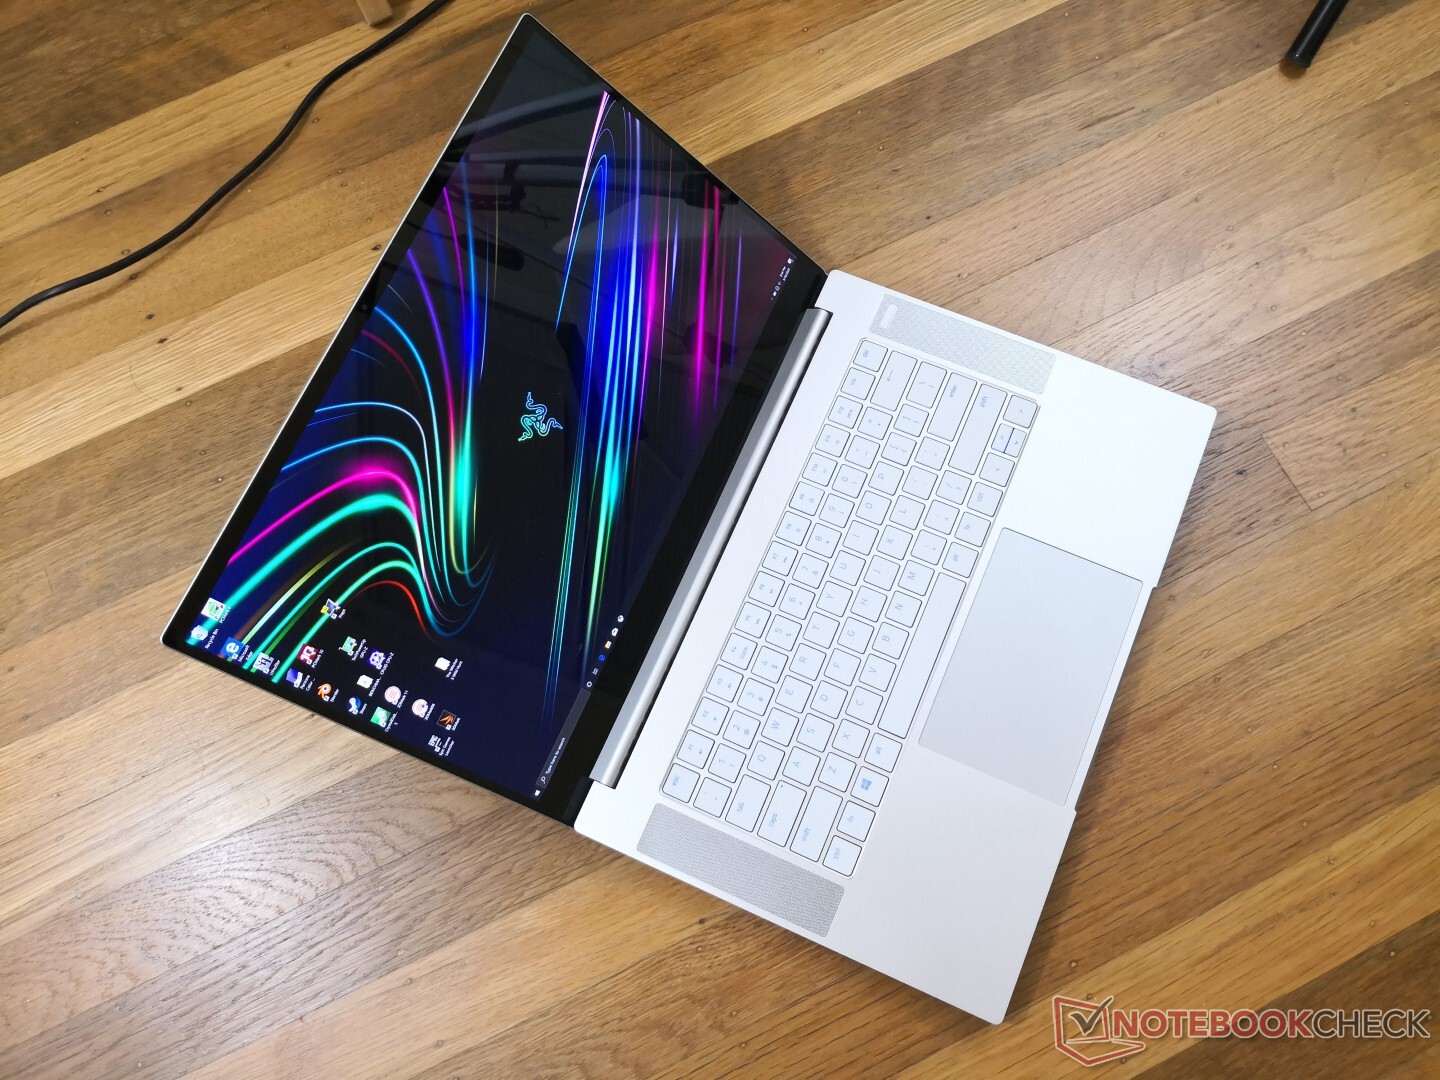
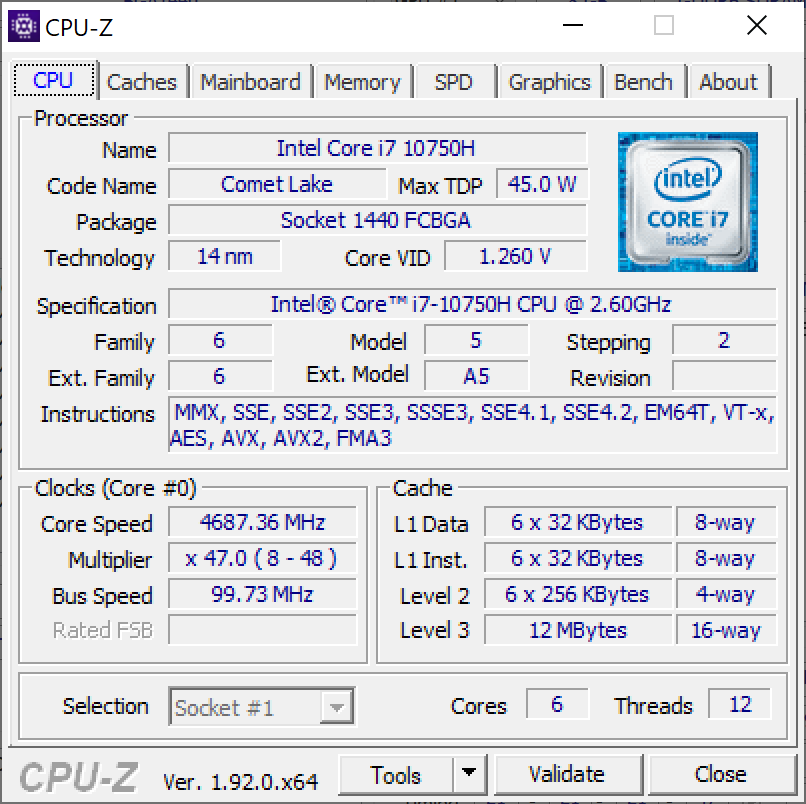
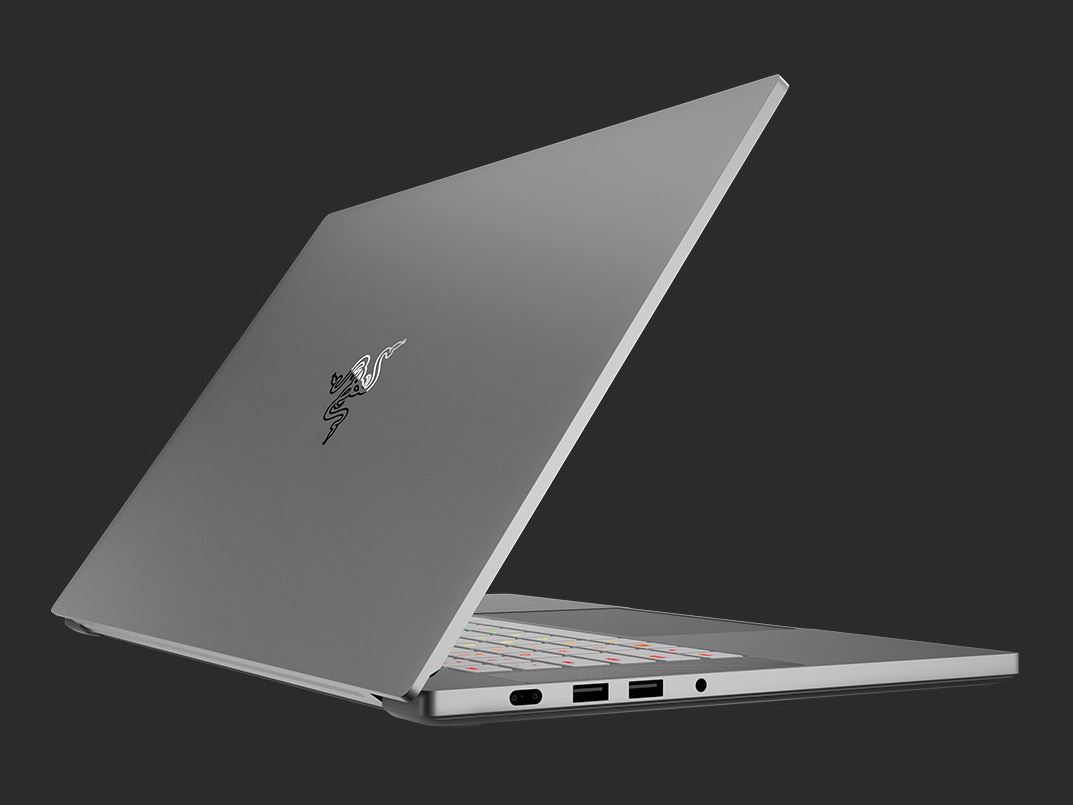
Vroeger had Intel een "tick-tock"-processorcyclus waarbij de "tick" een aanzienlijke verandering aan de architectuur vertegenwoordigt, en de "tock" een meer verfijnde versie van de "tick". De analogie is hier van toepassing op de 2020 Razer Blade 15, aangezien de nieuwe 10e generatie Core i7-10750H CPU en GeForce RTX Super Max-Q GPU relatief kleine updates zijn voor respectievelijk de 9e generatie Core i7-9750H en GeForce RTX Max-Q. De behuizing heeft hier en daar een paar kleine aanpassingen gekregen, maar het is nog steeds grotendeels dezelfde behuizing die we allemaal kennen. Alle voordelen op het vlak van gaming-prestaties ten opzichte van het model van vorig jaar zouden beperkt moeten blijven tot enkele procentpunten.
Als je op zoek bent naar een Blade 15, is het de moeite waard om een 2019-model te overwegen, vooral nu dit goedkoper is geworden. Je zou echt weinig missen door de 2020 Base Model-serie over te slaan. We hopen dat de modellen van volgend jaar meer tastbare upgrades zullen brengen, zoals stillere ventilatoren en Ampere-GPU's.
Een verfijning van de toch al uitstekende 2019-serie. Er zijn een aantal nieuwe opties en features, maar ze zijn meestal klein en niets om over naar huis te schrijven.
Razer Blade 15 RZ09-0328
- 31-08-2022 v7 (old)
Allen Ngo
Price comparison
