Kort testrapport Razer Blade 15 Studio Edition (2020) Laptop: Kleine veranderingen, beter totaalpakket
Evaluatie | Datum | Model | Gewicht | Hoogte | Formaat | Resolutie | Beste prijs |
|---|---|---|---|---|---|---|---|
| 87 % v7 (old) | 08-2020 | Razer Blade 15 Studio Edition 2020 i7-10875H, Quadro RTX 5000 Max-Q | 2.2 kg | 13.98 mm | 15.60" | 3840x2160 | |
| 86.6 % v7 (old) | 12-2019 | Razer Blade 15 Studio Edition i7-9750H, Quadro RTX 5000 Max-Q | 2.2 kg | 17.8 mm | 15.60" | 3840x2160 | |
| 89.8 % v7 (old) | 11-2019 | Lenovo ThinkPad P53-20QN000YGE i7-9850H, Quadro RTX 5000 Max-Q | 2.7 kg | 29.4 mm | 15.60" | 1920x1080 | |
| 85 % v7 (old) | 06-2019 | MSI P65 Creator 9SF-657 i9-9880H, GeForce RTX 2070 Max-Q | 1.9 kg | 18 mm | 15.60" | 3840x2160 | |
| 86.9 % v7 (old) | 12-2019 | Dell Precision 5540 i9-9980HK, Quadro T2000 Max-Q | 2 kg | 17 mm | 15.60" | 3840x2160 |

| SD Card Reader | |
| average JPG Copy Test (av. of 3 runs) | |
| Lenovo ThinkPad P53-20QN000YGE (Toshiba Exceria Pro SDXC 64 GB UHS-II) | |
| Dell Precision 5540 (Toshiba Exceria Pro SDXC 64 GB UHS-II) | |
| Gemiddelde van klas Workstation (49.6 - 681, n=14, laatste 2 jaar) | |
| Razer Blade 15 Studio Edition (Toshiba Exceria Pro SDXC 64 GB UHS-II) | |
| Razer Blade 15 Studio Edition 2020 (Toshiba Exceria Pro SDXC 64 GB UHS-II) | |
| maximum AS SSD Seq Read Test (1GB) | |
| Gemiddelde van klas Workstation (87.6 - 1455, n=14, laatste 2 jaar) | |
| Lenovo ThinkPad P53-20QN000YGE (Toshiba Exceria Pro SDXC 64 GB UHS-II) | |
| Dell Precision 5540 (Toshiba Exceria Pro SDXC 64 GB UHS-II) | |


| |||||||||||||||||||||||||
Helderheidsverdeling: 93 %
Helderheid in Batterij-modus: 380 cd/m²
Contrast: 21111:1 (Zwart: 0.018 cd/m²)
ΔE ColorChecker Calman: 5.47 | ∀{0.5-29.43 Ø4.72}
calibrated: 3.04
ΔE Greyscale Calman: 5.3 | ∀{0.09-98 Ø4.97}
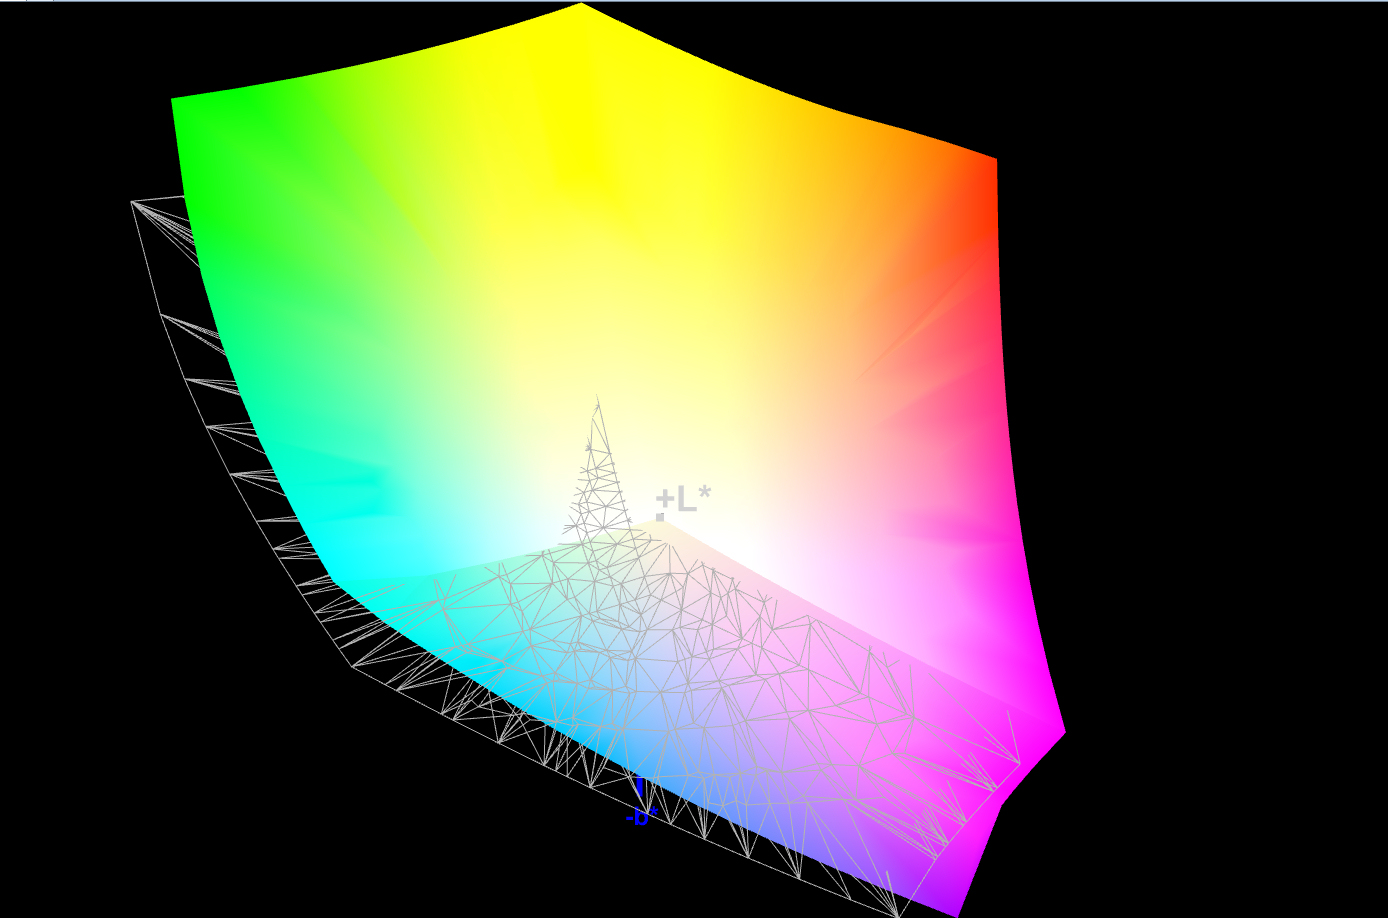
100% sRGB (Argyll 1.6.3 3D)
86% AdobeRGB 1998 (Argyll 1.6.3 3D)
97.3% AdobeRGB 1998 (Argyll 3D)
100% sRGB (Argyll 3D)
99.9% Display P3 (Argyll 3D)
Gamma: 2.15
CCT: 6128 K
| Razer Blade 15 Studio Edition 2020 Samsung SDCA029, OLED, 3840x2160, 15.6" | Razer Blade 15 Studio Edition Samsung SDCA029, OLED, 3840x2160, 15.6" | Lenovo ThinkPad P53-20QN000YGE N156HCE-GN1, IPS, 1920x1080, 15.6" | MSI P65 Creator 9SF-657 AU Optronics AUO41EB, IPS, 3840x2160, 15.6" | Dell Precision 5540 SDCA029, OLED, 3840x2160, 15.6" | |
|---|---|---|---|---|---|
| Display | -0% | -26% | -5% | 0% | |
| Display P3 Coverage (%) | 99.9 | 99.9 0% | 63.2 -37% | 84.4 -16% | 99.9 0% |
| sRGB Coverage (%) | 100 | 100 0% | 92.9 -7% | 100 0% | 100 0% |
| AdobeRGB 1998 Coverage (%) | 97.3 | 96.4 -1% | 64.3 -34% | 98.5 1% | 97.3 0% |
| Response Times | 13% | -695% | -925% | 25% | |
| Response Time Grey 50% / Grey 80% * (ms) | 4 ? | 3 ? 25% | 38.4 ? -860% | 51 ? -1175% | 2.8 ? 30% |
| Response Time Black / White * (ms) | 4 ? | 4 ? -0% | 25.2 ? -530% | 31 ? -675% | 3.2 ? 20% |
| PWM Frequency (Hz) | 26040 ? | 240.9 ? | |||
| Screen | -2% | -163% | -272% | 14% | |
| Brightness middle (cd/m²) | 380 | 361 -5% | 510 34% | 445 17% | 427 12% |
| Brightness (cd/m²) | 388 | 357 -8% | 468 21% | 462 19% | 411 6% |
| Brightness Distribution (%) | 93 | 89 -4% | 89 -4% | 83 -11% | 89 -4% |
| Black Level * (cd/m²) | 0.018 | 0.015 17% | 0.36 -1900% | 0.5 -2678% | |
| Contrast (:1) | 21111 | 24067 14% | 1417 -93% | 890 -96% | |
| Colorchecker dE 2000 * | 5.47 | 5.3 3% | 2.3 58% | 4.75 13% | 3.2 41% |
| Colorchecker dE 2000 max. * | 8.19 | 11.5 -40% | 5.5 33% | 7.79 5% | 8.4 -3% |
| Colorchecker dE 2000 calibrated * | 3.04 | 4.7 -55% | 1.2 61% | 2.8 8% | |
| Greyscale dE 2000 * | 5.3 | 2.1 60% | 3.2 40% | 4.49 15% | 1.8 66% |
| Gamma | 2.15 102% | 2.14 103% | 2.34 94% | 2.49 88% | 2.15 102% |
| CCT | 6128 106% | 6149 106% | 7036 92% | 7374 88% | 6176 105% |
| Color Space (Percent of AdobeRGB 1998) (%) | 86 | 86 0% | 59.4 -31% | 87 1% | 86.8 1% |
| Color Space (Percent of sRGB) (%) | 100 | 100 0% | 93.1 -7% | 100 0% | 100 0% |
| Totaal Gemiddelde (Programma / Instellingen) | 4% /
0% | -295% /
-204% | -401% /
-305% | 13% /
13% |
* ... kleiner is beter
Responstijd Scherm
| ↔ Responstijd Zwart naar Wit | ||
|---|---|---|
| 4 ms ... stijging ↗ en daling ↘ gecombineerd | ↗ 2 ms stijging | 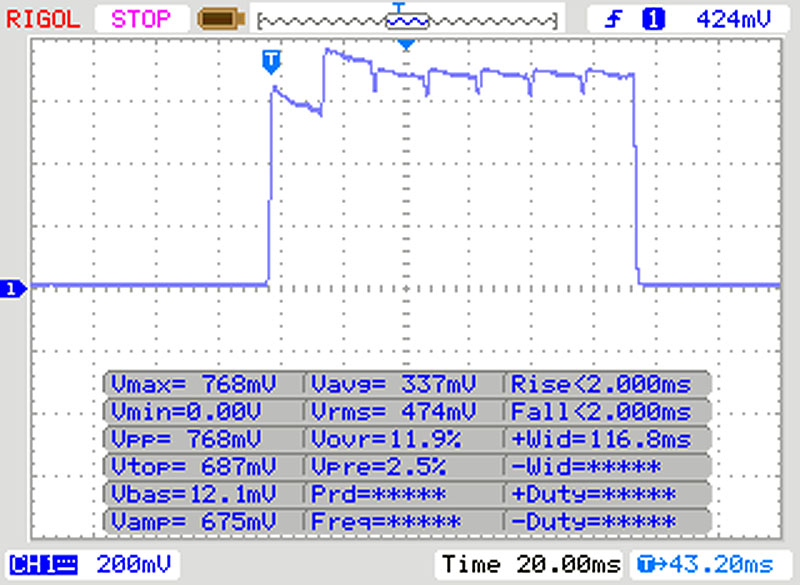 |
| ↘ 2 ms daling | ||
| Het scherm vertoonde erg snelle responstijden in onze tests en zou zeer geschikt moeten zijn voor snelle games. Ter vergelijking: alle testtoestellen variëren van 0.1 (minimum) tot 240 (maximum) ms. » 16 % van alle toestellen zijn beter. Dit betekent dat de gemeten responstijd beter is dan het gemiddelde (19.8 ms) van alle geteste toestellen. | ||
| ↔ Responstijd 50% Grijs naar 80% Grijs | ||
| 4 ms ... stijging ↗ en daling ↘ gecombineerd | ↗ 2 ms stijging | 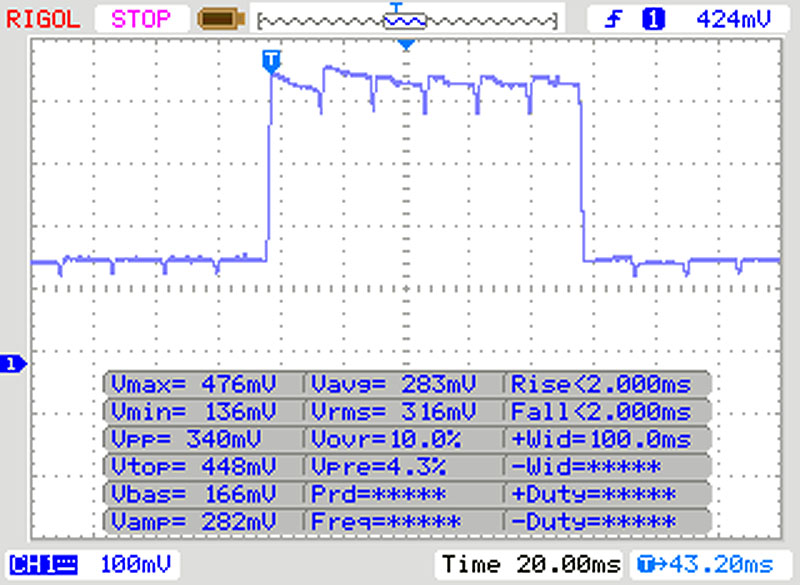 |
| ↘ 2 ms daling | ||
| Het scherm vertoonde erg snelle responstijden in onze tests en zou zeer geschikt moeten zijn voor snelle games. Ter vergelijking: alle testtoestellen variëren van 0.165 (minimum) tot 636 (maximum) ms. » 15 % van alle toestellen zijn beter. Dit betekent dat de gemeten responstijd beter is dan het gemiddelde (31 ms) van alle geteste toestellen. | ||
Screen Flickering / PWM (Pulse-Width Modulation)
| Screen flickering / PWM niet waargenomen | 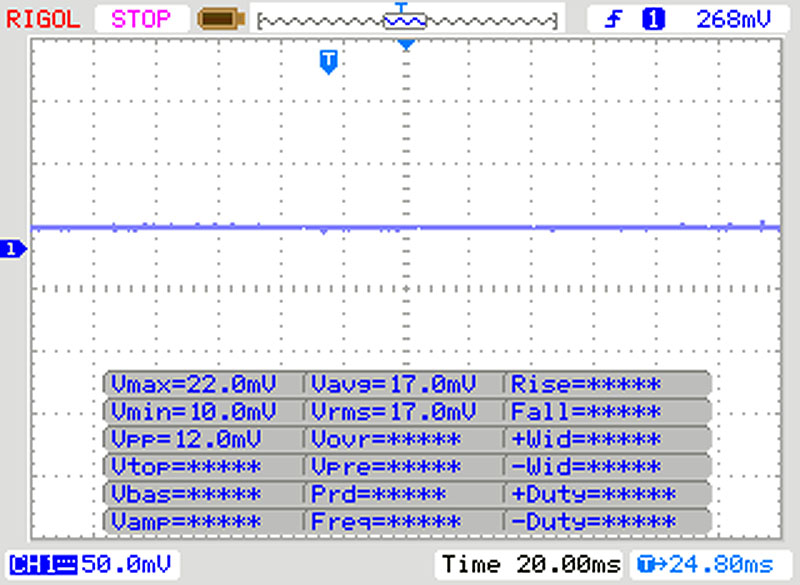 | ||
Ter vergelijking: 52 % van alle geteste toestellen maakten geen gebruik van PWM om de schermhelderheid te verlagen. Als het wel werd gebruikt, werd een gemiddelde van 7769 (minimum: 5 - maximum: 343500) Hz waargenomen. | |||
| Cinebench R15 | |
| CPU Single 64Bit | |
| Gemiddelde van klas Workstation (191.4 - 328, n=24, laatste 2 jaar) | |
| Gemiddeld Intel Core i7-10875H (190 - 220, n=37) | |
| Razer Blade 15 Studio Edition 2020 (Max. CPU, max. GPU) | |
| Lenovo ThinkPad P53-20QN000YGE | |
| MSI P65 Creator 9SF-657 | |
| Dell Precision 5540 | |
| Razer Blade 15 Studio Edition 2020 | |
| Razer Blade 15 Studio Edition | |
| CPU Multi 64Bit | |
| Gemiddelde van klas Workstation (2489 - 5810, n=24, laatste 2 jaar) | |
| Gemiddeld Intel Core i7-10875H (1003 - 1833, n=38) | |
| MSI P65 Creator 9SF-657 | |
| Dell Precision 5540 | |
| Razer Blade 15 Studio Edition 2020 (Max. CPU, max. GPU) | |
| Lenovo ThinkPad P53-20QN000YGE | |
| Razer Blade 15 Studio Edition 2020 | |
| Razer Blade 15 Studio Edition | |
| LibreOffice - 20 Documents To PDF | |
| Gemiddeld Intel Core i7-10875H (30.2 - 84.3, n=30) | |
| Gemiddelde van klas Workstation (37.1 - 74.7, n=24, laatste 2 jaar) | |
| Razer Blade 15 Studio Edition 2020 | |
| R Benchmark 2.5 - Overall mean | |
| Razer Blade 15 Studio Edition 2020 | |
| Gemiddeld Intel Core i7-10875H (0.546 - 0.662, n=29) | |
| Gemiddelde van klas Workstation (0.3825 - 0.603, n=24, laatste 2 jaar) | |
* ... kleiner is beter
| PCMark 8 Home Score Accelerated v2 | 3654 punten | |
| PCMark 8 Creative Score Accelerated v2 | 3874 punten | |
| PCMark 8 Work Score Accelerated v2 | 4638 punten | |
| PCMark 10 Score | 4884 punten | |
Help | ||
| DPC Latencies / LatencyMon - interrupt to process latency (max), Web, Youtube, Prime95 | |
| Razer Blade 15 Studio Edition 2020 | |
* ... kleiner is beter

| Razer Blade 15 Studio Edition 2020 Samsung PM981a MZVLB1T0HBLR | Razer Blade 15 Studio Edition Samsung SSD PM981 MZVLB1T0HALR | Lenovo ThinkPad P53-20QN000YGE Samsung PM981a MZVLB1T0HBLR | MSI P65 Creator 9SF-657 2x Samsung SSD PM981 MZVLB512HAJQ (RAID 0) | Dell Precision 5540 SK hynix PC400 512 GB | Gemiddeld Samsung PM981a MZVLB1T0HBLR | |
|---|---|---|---|---|---|---|
| CrystalDiskMark 5.2 / 6 | -23% | -4% | 12% | -29% | -0% | |
| Write 4K (MB/s) | 132.9 | 100.4 -24% | 147 11% | 105.6 -21% | 98 -26% | 139.7 ? 5% |
| Read 4K (MB/s) | 46.73 | 42.03 -10% | 48.3 3% | 46.32 -1% | 41.25 -12% | 49.9 ? 7% |
| Write Seq (MB/s) | 2214 | 1185 -46% | 1402 -37% | 2910 31% | 1295 -42% | 2036 ? -8% |
| Read Seq (MB/s) | 2018 | 1132 -44% | 1503 -26% | 2820 40% | 1441 -29% | 2014 ? 0% |
| Write 4K Q32T1 (MB/s) | 478.9 | 371.4 -22% | 475.2 -1% | 545 14% | 429.2 -10% | 461 ? -4% |
| Read 4K Q32T1 (MB/s) | 540 | 422.6 -22% | 581 8% | 632 17% | 400.1 -26% | 499 ? -8% |
| Write Seq Q32T1 (MB/s) | 2975 | 2379 -20% | 2936 -1% | 3349 13% | 1366 -54% | 2903 ? -2% |
| Read Seq Q32T1 (MB/s) | 3195 | 3222 1% | 3539 11% | 3333 4% | 2201 -31% | 3479 ? 9% |
| AS SSD | -12% | 27% | 6% | -29% | 9% | |
| Seq Read (MB/s) | 1982 | 2328 17% | 2655 34% | 2860 44% | 1743 -12% | 2553 ? 29% |
| Seq Write (MB/s) | 2252 | 2344 4% | 2454 9% | 2604 16% | 930 -59% | 2084 ? -7% |
| 4K Read (MB/s) | 47.13 | 43.68 -7% | 59.1 25% | 45.15 -4% | 39.1 -17% | 53.1 ? 13% |
| 4K Write (MB/s) | 88.2 | 10.28 -88% | 138.1 57% | 100.2 14% | 92.1 4% | 131.2 ? 49% |
| 4K-64 Read (MB/s) | 1481 | 1469 -1% | 2009 36% | 1428 -4% | 956 -35% | 1477 ? 0% |
| 4K-64 Write (MB/s) | 1842 | 992 -46% | 1907 4% | 1401 -24% | 863 -53% | 1805 ? -2% |
| Access Time Read * (ms) | 0.087 | 0.067 23% | 0.054 38% | 0.049 44% | 0.074 15% | 0.04983 ? 43% |
| Access Time Write * (ms) | 0.04 | 0.035 12% | 0.028 30% | 0.037 7% | 0.053 -33% | 0.04222 ? -6% |
| Score Read (Points) | 1726 | 1745 1% | 2333 35% | 1759 2% | 1170 -32% | 1786 ? 3% |
| Score Write (Points) | 2155 | 1328 -38% | 2291 6% | 1762 -18% | 1048 -51% | 2144 ? -1% |
| Score Total (Points) | 4781 | 3968 -17% | 5810 22% | 4411 -8% | 2781 -42% | 4826 ? 1% |
| Copy ISO MB/s (MB/s) | 1982 | 1609 -19% | 2098 ? 6% | |||
| Copy Program MB/s (MB/s) | 501 | 445.1 -11% | 500 ? 0% | |||
| Copy Game MB/s (MB/s) | 1140 | 1089 -4% | 1132 ? -1% | |||
| Totaal Gemiddelde (Programma / Instellingen) | -18% /
-16% | 12% /
14% | 9% /
9% | -29% /
-29% | 5% /
6% |
* ... kleiner is beter
Dauerleistung Lesen: DiskSpd Read Loop, Queue Depth 8
| 3DMark 11 Performance | 20883 punten | |
| 3DMark Cloud Gate Standard Score | 32096 punten | |
| 3DMark Fire Strike Score | 16179 punten | |
| 3DMark Time Spy Score | 7326 punten | |
Help | ||
| 3DMark 11 - 1280x720 Performance GPU | |
| Gemiddelde van klas Workstation (12535 - 69594, n=24, laatste 2 jaar) | |
| Razer Blade 15 Studio Edition 2020 (Max. CPU, max. GPU) | |
| Razer Blade 15 Studio Edition 2020 | |
| Gemiddeld NVIDIA Quadro RTX 5000 Max-Q (24156 - 28524, n=9) | |
| Razer Blade 15 Studio Edition | |
| Lenovo ThinkPad P53-20QN000YGE | |
| MSI P65 Creator 9SF-657 | |
| Dell Precision 5540 | |
| 3DMark | |
| 1280x720 Cloud Gate Standard Graphics | |
| Lenovo ThinkPad P53-20QN000YGE | |
| Gemiddelde van klas Workstation (58392 - 152418, n=14, laatste 2 jaar) | |
| Gemiddeld NVIDIA Quadro RTX 5000 Max-Q (50993 - 126073, n=7) | |
| Razer Blade 15 Studio Edition 2020 | |
| MSI P65 Creator 9SF-657 | |
| Razer Blade 15 Studio Edition | |
| Dell Precision 5540 | |
| 1920x1080 Fire Strike Graphics | |
| Gemiddelde van klas Workstation (8293 - 52560, n=24, laatste 2 jaar) | |
| Razer Blade 15 Studio Edition 2020 (Max. CPU, max. GPU) | |
| Razer Blade 15 Studio Edition 2020 | |
| Gemiddeld NVIDIA Quadro RTX 5000 Max-Q (18247 - 21115, n=10) | |
| Razer Blade 15 Studio Edition | |
| Lenovo ThinkPad P53-20QN000YGE | |
| MSI P65 Creator 9SF-657 | |
| Dell Precision 5540 | |
| 2560x1440 Time Spy Graphics | |
| Gemiddelde van klas Workstation (2725 - 24806, n=24, laatste 2 jaar) | |
| Razer Blade 15 Studio Edition 2020 (Max. CPU, max. GPU) | |
| Razer Blade 15 Studio Edition 2020 | |
| Gemiddeld NVIDIA Quadro RTX 5000 Max-Q (6999 - 7977, n=10) | |
| Razer Blade 15 Studio Edition | |
| Lenovo ThinkPad P53-20QN000YGE | |
| Dell Precision 5540 | |
| The Witcher 3 - 1920x1080 Ultra Graphics & Postprocessing (HBAO+) | |
| Razer Blade 15 Studio Edition 2020 (Max. CPU, Max. GPU) | |
| Razer Blade 15 Studio Edition 2020 | |
| Razer Blade 15 Studio Edition | |
| Gemiddeld NVIDIA Quadro RTX 5000 Max-Q (71 - 88.5, n=10) | |
| MSI P65 Creator 9SF-657 | |
| Gemiddelde van klas Workstation (51 - 91.7, n=2, laatste 2 jaar) | |
| Lenovo ThinkPad P53-20QN000YGE | |
| Dell Precision 5540 | |
| BioShock Infinite - 1920x1080 Ultra Preset, DX11 (DDOF) | |
| Razer Blade 15 Studio Edition 2020 (Max. CPU, max. GPU) | |
| Gemiddeld NVIDIA Quadro RTX 5000 Max-Q (167.2 - 174.3, n=3) | |
| Razer Blade 15 Studio Edition 2020 | |
| Razer Blade 15 Studio Edition | |
| MSI P65 Creator 9SF-657 | |
| Dell Precision 5540 | |
| Shadow of the Tomb Raider - 1920x1080 Highest Preset AA:T | |
| Razer Blade 15 Studio Edition 2020 (Max. CPU, max. GPU) | |
| Gemiddeld NVIDIA Quadro RTX 5000 Max-Q (85 - 90, n=3) | |
| Lenovo ThinkPad P53-20QN000YGE | |
| Razer Blade 15 Studio Edition 2020 | |
| Metro Exodus - 1920x1080 Ultra Quality AF:16x | |
| Razer Blade 15 Studio Edition 2020 | |
| Gemiddeld NVIDIA Quadro RTX 5000 Max-Q (55.4 - 59.2, n=2) | |
| Razer Blade 15 Studio Edition | |
| Control - 1920x1080 High Quality Preset | |
| Razer Blade 15 Studio Edition 2020 | |
| Gemiddeld NVIDIA Quadro RTX 5000 Max-Q (66.5 - 69.9, n=2) | |
| Razer Blade 15 Studio Edition | |
| Total War: Three Kingdoms - 1920x1080 Ultra (incl textures) | |
| Razer Blade 15 Studio Edition | |
| Gemiddeld NVIDIA Quadro RTX 5000 Max-Q (57.5 - 64.9, n=2) | |
| Razer Blade 15 Studio Edition 2020 | |
| Red Dead Redemption 2 - 1920x1080 High Settings | |
| Gemiddeld NVIDIA Quadro RTX 5000 Max-Q (54.8 - 63.9, n=2) | |
| Razer Blade 15 Studio Edition 2020 | |
| Doom Eternal - 1920x1080 Ultra Preset | |
| Gemiddeld NVIDIA Quadro RTX 5000 Max-Q (137.8 - 145.3, n=3) | |
| Razer Blade 15 Studio Edition 2020 | |
| lage | gem. | hoge | ultra | QHD | 4K | |
|---|---|---|---|---|---|---|
| BioShock Infinite (2013) | 365.3 | 321.5 | 296.5 | 168.5 | ||
| The Witcher 3 (2015) | 323.2 | 238.8 | 125.4 | 83.6 | 47.5 | |
| Dota 2 Reborn (2015) | 138.4 | 130.1 | 124.5 | 122.3 | ||
| X-Plane 11.11 (2018) | 109 | 94.9 | 78.7 | |||
| Far Cry 5 (2018) | 128 | 106 | 101 | 96 | 74 | 40 |
| Shadow of the Tomb Raider (2018) | 105 | 94 | 91 | 85 | 62 | 33 |
| Assassin´s Creed Odyssey (2018) | 107 | 91 | 80 | 57 | 48 | 31 |
| Battlefield V (2018) | 156.6 | 130.7 | 124.5 | 114.7 | 90.8 | 53.4 |
| Metro Exodus (2019) | 145.6 | 96.3 | 72.8 | 59.2 | 45.6 | 27 |
| Total War: Three Kingdoms (2019) | 243.7 | 129 | 80.9 | 57.5 | 34.1 | 18.5 |
| Control (2019) | 228.8 | 96.7 | 69.9 | 43 | 20 | |
| Call of Duty Modern Warfare 2019 (2019) | 156.5 | 111.2 | 99 | 86.7 | 62.2 | 34 |
| Star Wars Jedi Fallen Order (2019) | 105 | 99.5 | 89.7 | 66.3 | 34 | |
| Red Dead Redemption 2 (2019) | 124.2 | 84.8 | 54.8 | 39.7 | 32 | 19.8 |
| Doom Eternal (2020) | 216.7 | 161.9 | 145 | 140.6 | 92.5 | 47.1 |
| Gears Tactics (2020) | 177.7 | 126.6 | 90.7 | 73.6 | 50 | 24 |
| F1 2020 (2020) | 214 | 166 | 143 | 107 | 82.8 | 44.4 |
| Death Stranding (2020) | 127.2 | 112.6 | 103.8 | 101.5 | 73.7 | 41.1 |
Geluidsniveau
| Onbelast |
| 30.1 / 30.1 / 30.1 dB (A) |
| Belasting |
| 42.3 / 42.1 dB (A) |
 | ||
30 dB stil 40 dB(A) hoorbaar 50 dB(A) luid |
||
min: | ||
| Razer Blade 15 Studio Edition 2020 i7-10875H, Quadro RTX 5000 Max-Q | Razer Blade 15 Studio Edition i7-9750H, Quadro RTX 5000 Max-Q | Lenovo ThinkPad P53-20QN000YGE i7-9850H, Quadro RTX 5000 Max-Q | MSI P65 Creator 9SF-657 i9-9880H, GeForce RTX 2070 Max-Q | Dell Precision 5540 i9-9980HK, Quadro T2000 Max-Q | Gemiddeld NVIDIA Quadro RTX 5000 Max-Q | Gemiddelde van klas Workstation | |
|---|---|---|---|---|---|---|---|
| Noise | -1% | 12% | -5% | 11% | 3% | 9% | |
| uit / omgeving * (dB) | 30.1 | 30.6 -2% | 28.3 6% | 30.2 -0% | 28.6 5% | 27.5 ? 9% | 24.1 ? 20% |
| Idle Minimum * (dB) | 30.1 | 30.6 -2% | 28.3 6% | 32.8 -9% | 28.6 5% | 28.7 ? 5% | 24.8 ? 18% |
| Idle Average * (dB) | 30.1 | 30.6 -2% | 28.3 6% | 32.8 -9% | 28.6 5% | 28.7 ? 5% | 25.4 ? 16% |
| Idle Maximum * (dB) | 30.1 | 30.6 -2% | 28.3 6% | 33.6 -12% | 28.6 5% | 28.7 ? 5% | 26.7 ? 11% |
| Load Average * (dB) | 42.3 | 43 -2% | 29.8 30% | 40.9 3% | 33.3 21% | 41 ? 3% | 39.2 ? 7% |
| Witcher 3 ultra * (dB) | 48.2 | 38.3 21% | 34.7 28% | ||||
| Load Maximum * (dB) | 42.1 | 41 3% | 38.3 9% | 42.7 -1% | 38 10% | 46.7 ? -11% | 50.6 ? -20% |
* ... kleiner is beter
(-) De maximumtemperatuur aan de bovenzijde bedraagt 54.1 °C / 129 F, vergeleken met het gemiddelde van 38.2 °C / 101 F, variërend van 22.2 tot 69.8 °C voor de klasse Workstation.
(-) De bodem warmt op tot een maximum van 54 °C / 129 F, vergeleken met een gemiddelde van 41.1 °C / 106 F
(+) Bij onbelast gebruik bedraagt de gemiddelde temperatuur voor de bovenzijde 28.2 °C / 83 F, vergeleken met het apparaatgemiddelde van 32 °C / 90 F.
(-) Bij het spelen van The Witcher 3 is de gemiddelde temperatuur voor de bovenzijde 39.1 °C / 102 F, vergeleken met het apparaatgemiddelde van 32 °C / 90 F.
(-) De palmsteunen en het touchpad kunnen zeer heet aanvoelen met een maximum van ###max## °C / 104 F.
(-) De gemiddelde temperatuur van de handpalmsteun van soortgelijke toestellen bedroeg 27.8 °C / 82 F (-12.2 °C / -22 F).
| Razer Blade 15 Studio Edition 2020 i7-10875H, Quadro RTX 5000 Max-Q | Razer Blade 15 Studio Edition i7-9750H, Quadro RTX 5000 Max-Q | Lenovo ThinkPad P53-20QN000YGE i7-9850H, Quadro RTX 5000 Max-Q | MSI P65 Creator 9SF-657 i9-9880H, GeForce RTX 2070 Max-Q | Dell Precision 5540 i9-9980HK, Quadro T2000 Max-Q | Gemiddeld NVIDIA Quadro RTX 5000 Max-Q | Gemiddelde van klas Workstation | |
|---|---|---|---|---|---|---|---|
| Heat | 8% | 21% | 0% | 10% | 2% | 6% | |
| Maximum Upper Side * (°C) | 54.1 | 46.1 15% | 41.8 23% | 49.7 8% | 46.2 15% | 49.4 ? 9% | 43.8 ? 19% |
| Maximum Bottom * (°C) | 54 | 45.2 16% | 46.1 15% | 60.4 -12% | 45.7 15% | 53 ? 2% | 45.1 ? 16% |
| Idle Upper Side * (°C) | 28.9 | 28.9 -0% | 22.2 23% | 28.4 2% | 27.4 5% | 28.6 ? 1% | 30.6 ? -6% |
| Idle Bottom * (°C) | 29.7 | 29.6 -0% | 23 23% | 29.2 2% | 27.8 6% | 30.5 ? -3% | 31.6 ? -6% |
* ... kleiner is beter
Razer Blade 15 Studio Edition 2020 audioanalyse
(±) | luidspreker luidheid is gemiddeld maar goed (75.1 dB)
Bas 100 - 315 Hz
(-) | bijna geen lage tonen - gemiddeld 18.3% lager dan de mediaan
(±) | lineariteit van de lage tonen is gemiddeld (10.1% delta ten opzichte van de vorige frequentie)
Midden 400 - 2000 Hz
(+) | evenwichtige middens - slechts 4.6% verwijderd van de mediaan
(+) | de middentonen zijn lineair (5.9% delta ten opzichte van de vorige frequentie)
Hoog 2 - 16 kHz
(+) | evenwichtige hoogtepunten - slechts 3.4% verwijderd van de mediaan
(+) | de hoge tonen zijn lineair (3.8% delta naar de vorige frequentie)
Algemeen 100 - 16.000 Hz
(±) | lineariteit van het totale geluid is gemiddeld (19.1% verschil met de mediaan)
Vergeleken met dezelfde klasse
» 67% van alle geteste apparaten in deze klasse waren beter, 6% vergelijkbaar, 28% slechter
» De beste had een delta van 7%, het gemiddelde was 17%, de slechtste was 35%
Vergeleken met alle geteste toestellen
» 46% van alle geteste apparaten waren beter, 7% gelijk, 47% slechter
» De beste had een delta van 4%, het gemiddelde was 24%, de slechtste was 134%
| Uit / Standby | |
| Inactief | |
| Belasting |
|
Key:
min: | |
| Razer Blade 15 Studio Edition 2020 i7-10875H, Quadro RTX 5000 Max-Q | Razer Blade 15 Studio Edition i7-9750H, Quadro RTX 5000 Max-Q | Lenovo ThinkPad P53-20QN000YGE i7-9850H, Quadro RTX 5000 Max-Q | MSI P65 Creator 9SF-657 i9-9880H, GeForce RTX 2070 Max-Q | Dell Precision 5540 i9-9980HK, Quadro T2000 Max-Q | Gemiddeld NVIDIA Quadro RTX 5000 Max-Q | Gemiddelde van klas Workstation | |
|---|---|---|---|---|---|---|---|
| Power Consumption | 15% | 18% | 7% | 33% | 6% | 19% | |
| Idle Minimum * (Watt) | 13.4 | 13.2 1% | 7.9 41% | 9.4 30% | 7.4 45% | 10.4 ? 22% | 9.04 ? 33% |
| Idle Average * (Watt) | 18 | 15 17% | 11.8 34% | 17.4 3% | 12.1 33% | 16.1 ? 11% | 13.8 ? 23% |
| Idle Maximum * (Watt) | 26.1 | 17.4 33% | 14.9 43% | 19.6 25% | 12.7 51% | 23.8 ? 9% | 17.7 ? 32% |
| Load Average * (Watt) | 115 | 99 14% | 96 17% | 103 10% | 98 15% | 109.5 ? 5% | 96.2 ? 16% |
| Witcher 3 ultra * (Watt) | 145 | 149 -3% | 89.9 38% | ||||
| Load Maximum * (Watt) | 165 | 148 10% | 207.8 -26% | 216 -31% | 135.1 18% | 189.5 ? -15% | 178.5 ? -8% |
* ... kleiner is beter
| Razer Blade 15 Studio Edition 2020 i7-10875H, Quadro RTX 5000 Max-Q, 80 Wh | Razer Blade 15 Studio Edition i7-9750H, Quadro RTX 5000 Max-Q, 80 Wh | Lenovo ThinkPad P53-20QN000YGE i7-9850H, Quadro RTX 5000 Max-Q, 90 Wh | MSI P65 Creator 9SF-657 i9-9880H, GeForce RTX 2070 Max-Q, 82 Wh | Dell Precision 5540 i9-9980HK, Quadro T2000 Max-Q, 97 Wh | Gemiddelde van klas Workstation | |
|---|---|---|---|---|---|---|
| Batterijduur | 5% | 49% | -10% | 39% | 67% | |
| Reader / Idle (h) | 8.8 | 9.6 9% | 9.6 9% | 15 70% | 26.1 ? 197% | |
| H.264 (h) | 6.4 | 7.6 19% | 9.8 53% | 10.6 66% | 9.51 ? 49% | |
| WiFi v1.3 (h) | 5.7 | 5.5 -4% | 11.1 95% | 6 5% | 7.7 35% | 8.52 ? 49% |
| Load (h) | 2 | 1.9 -5% | 2 0% | 1.1 -45% | 1.7 -15% | 1.429 ? -29% |
Pro
Contra
Dit is de verkorte versie van het originele artikel. Het volledige, Engelse testrapport vind je hier.
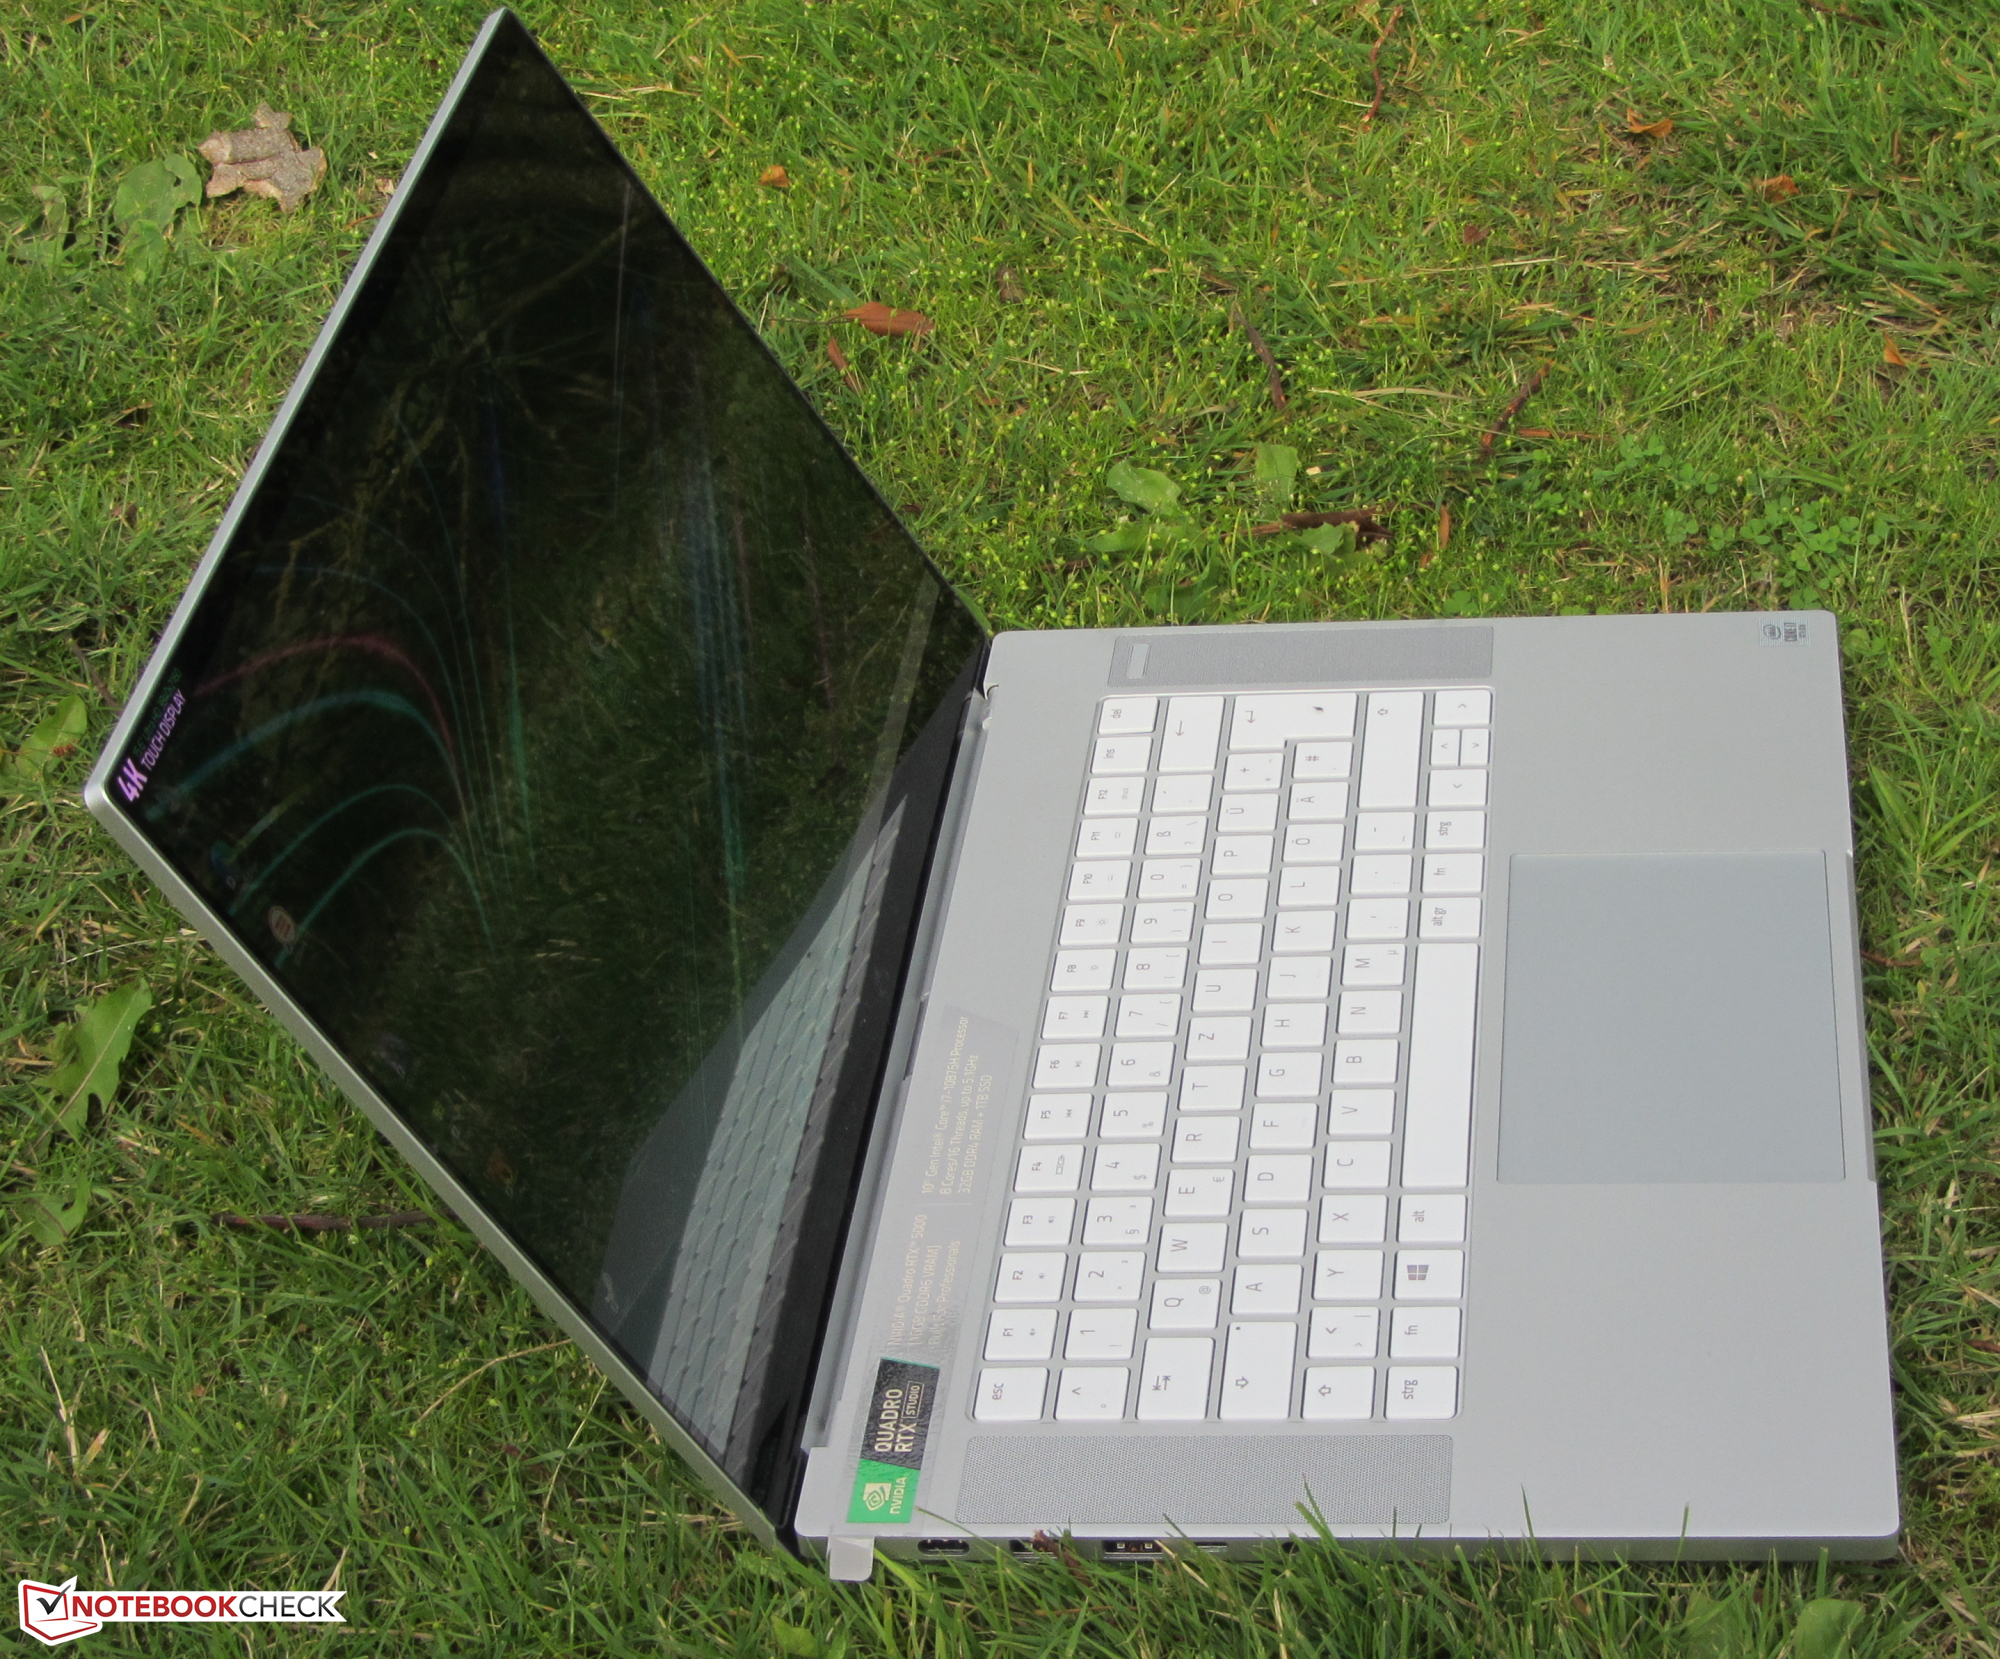
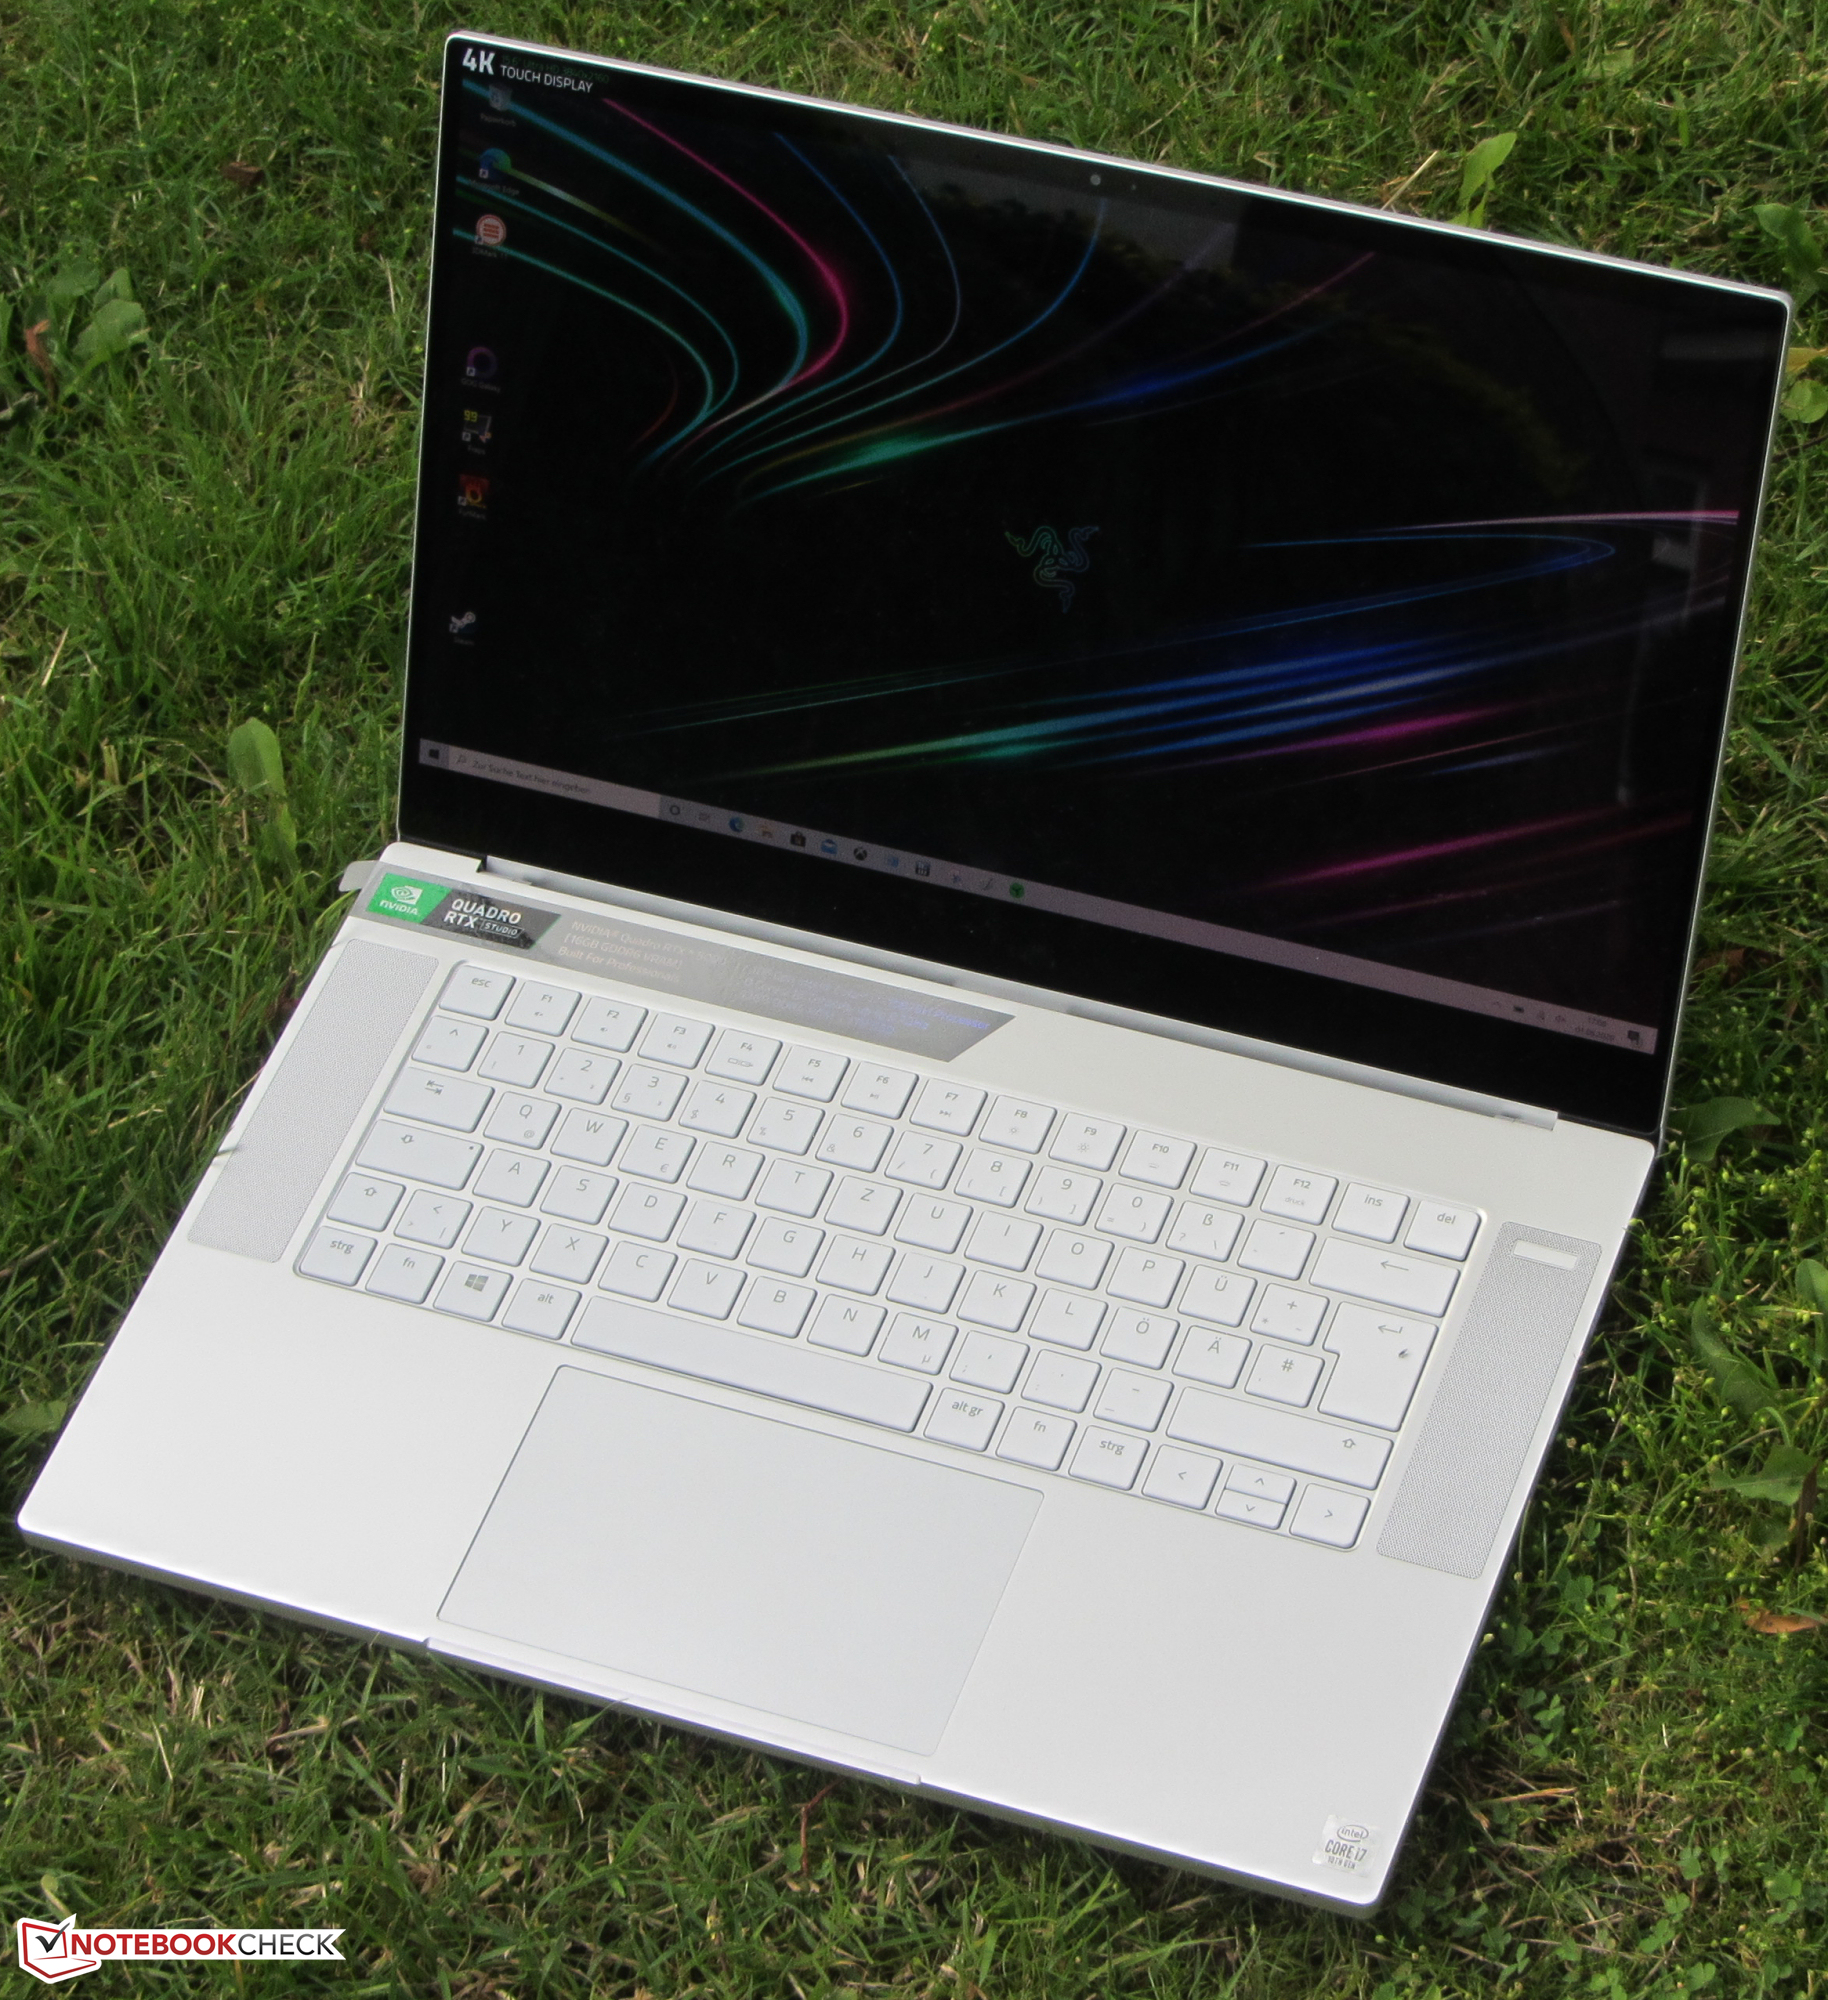
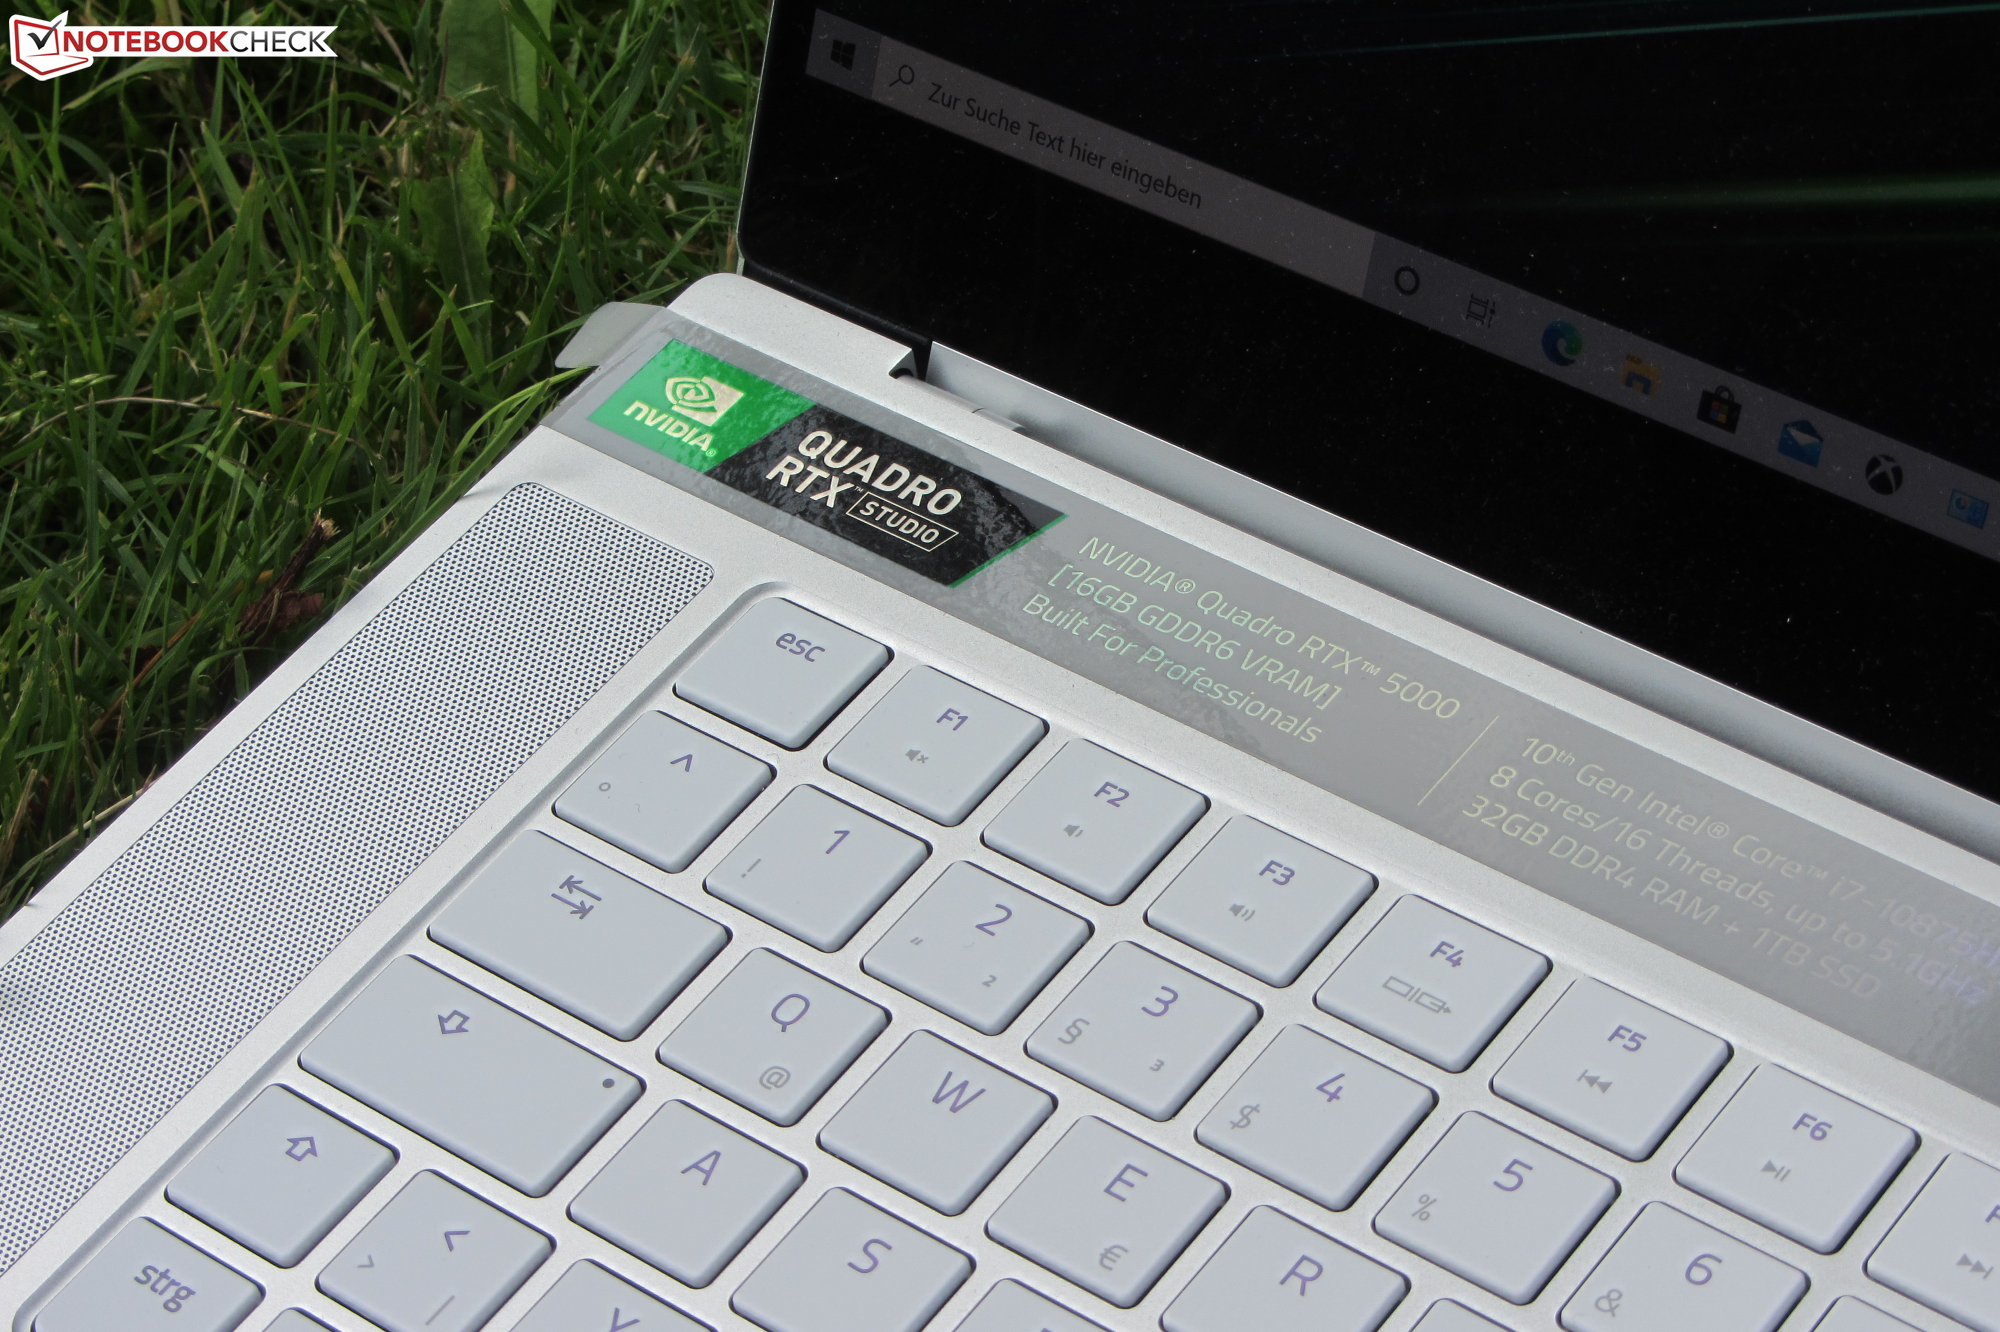
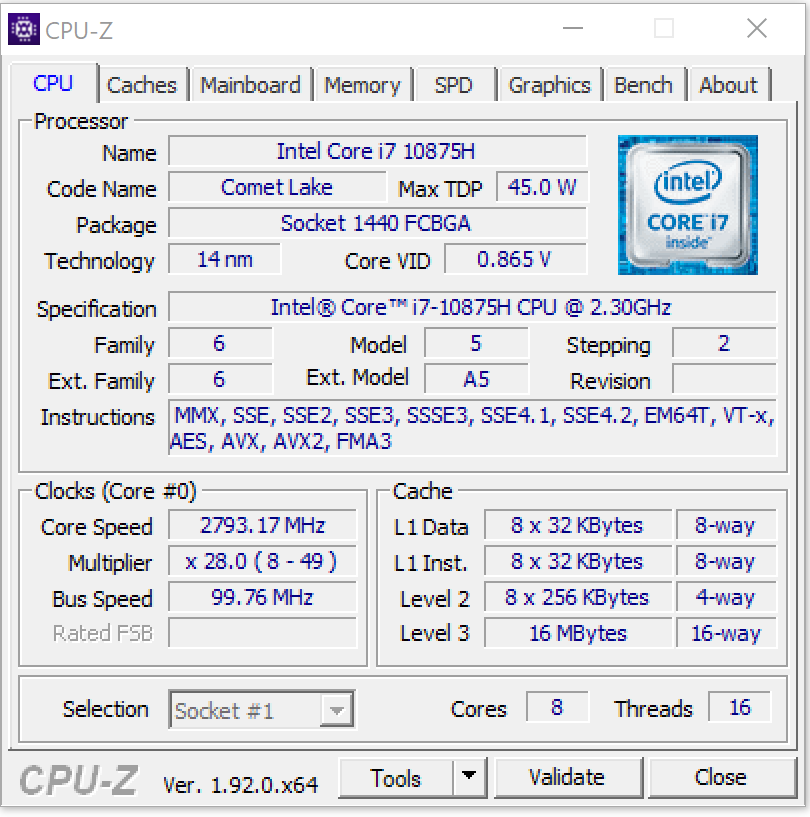
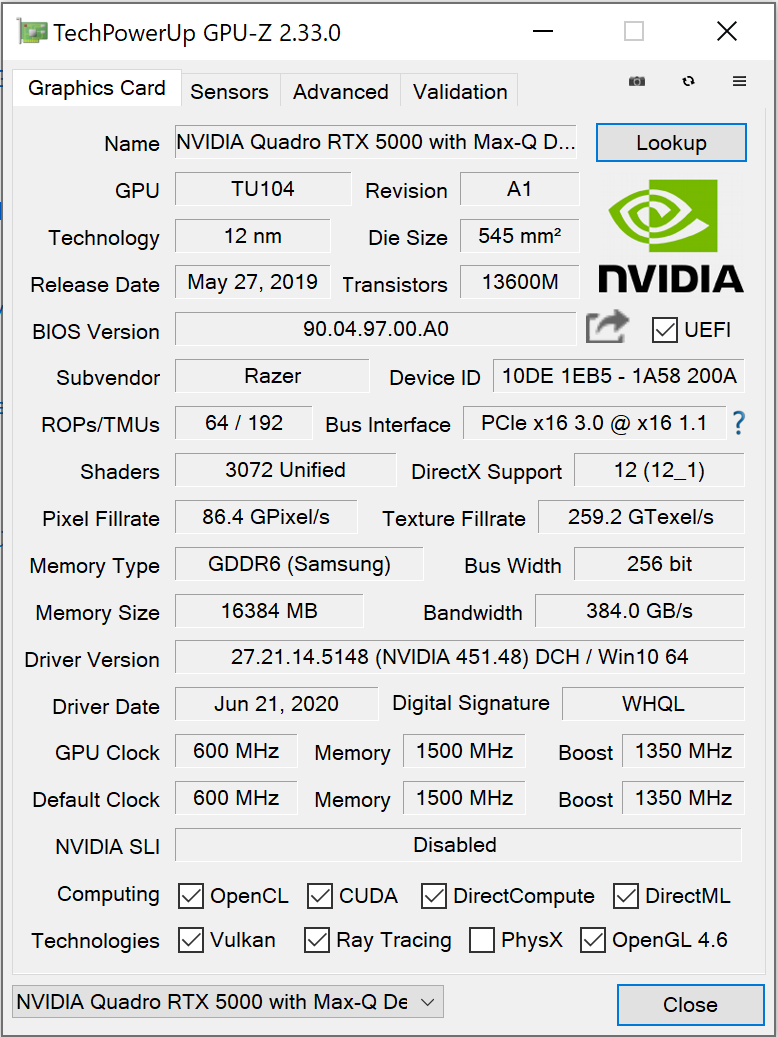
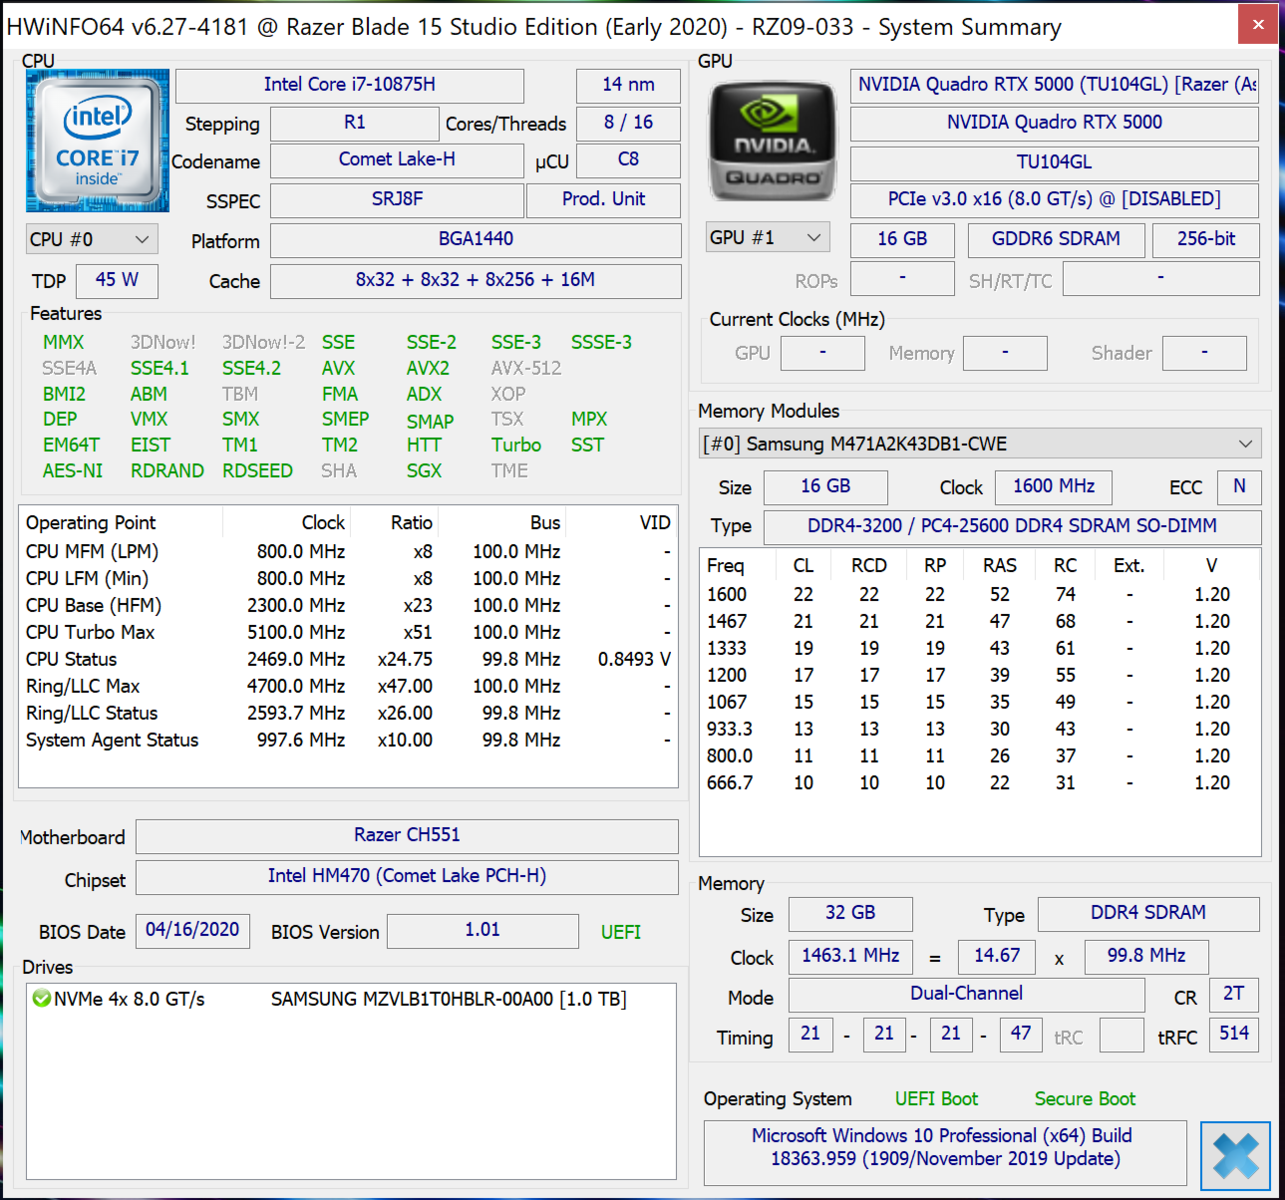
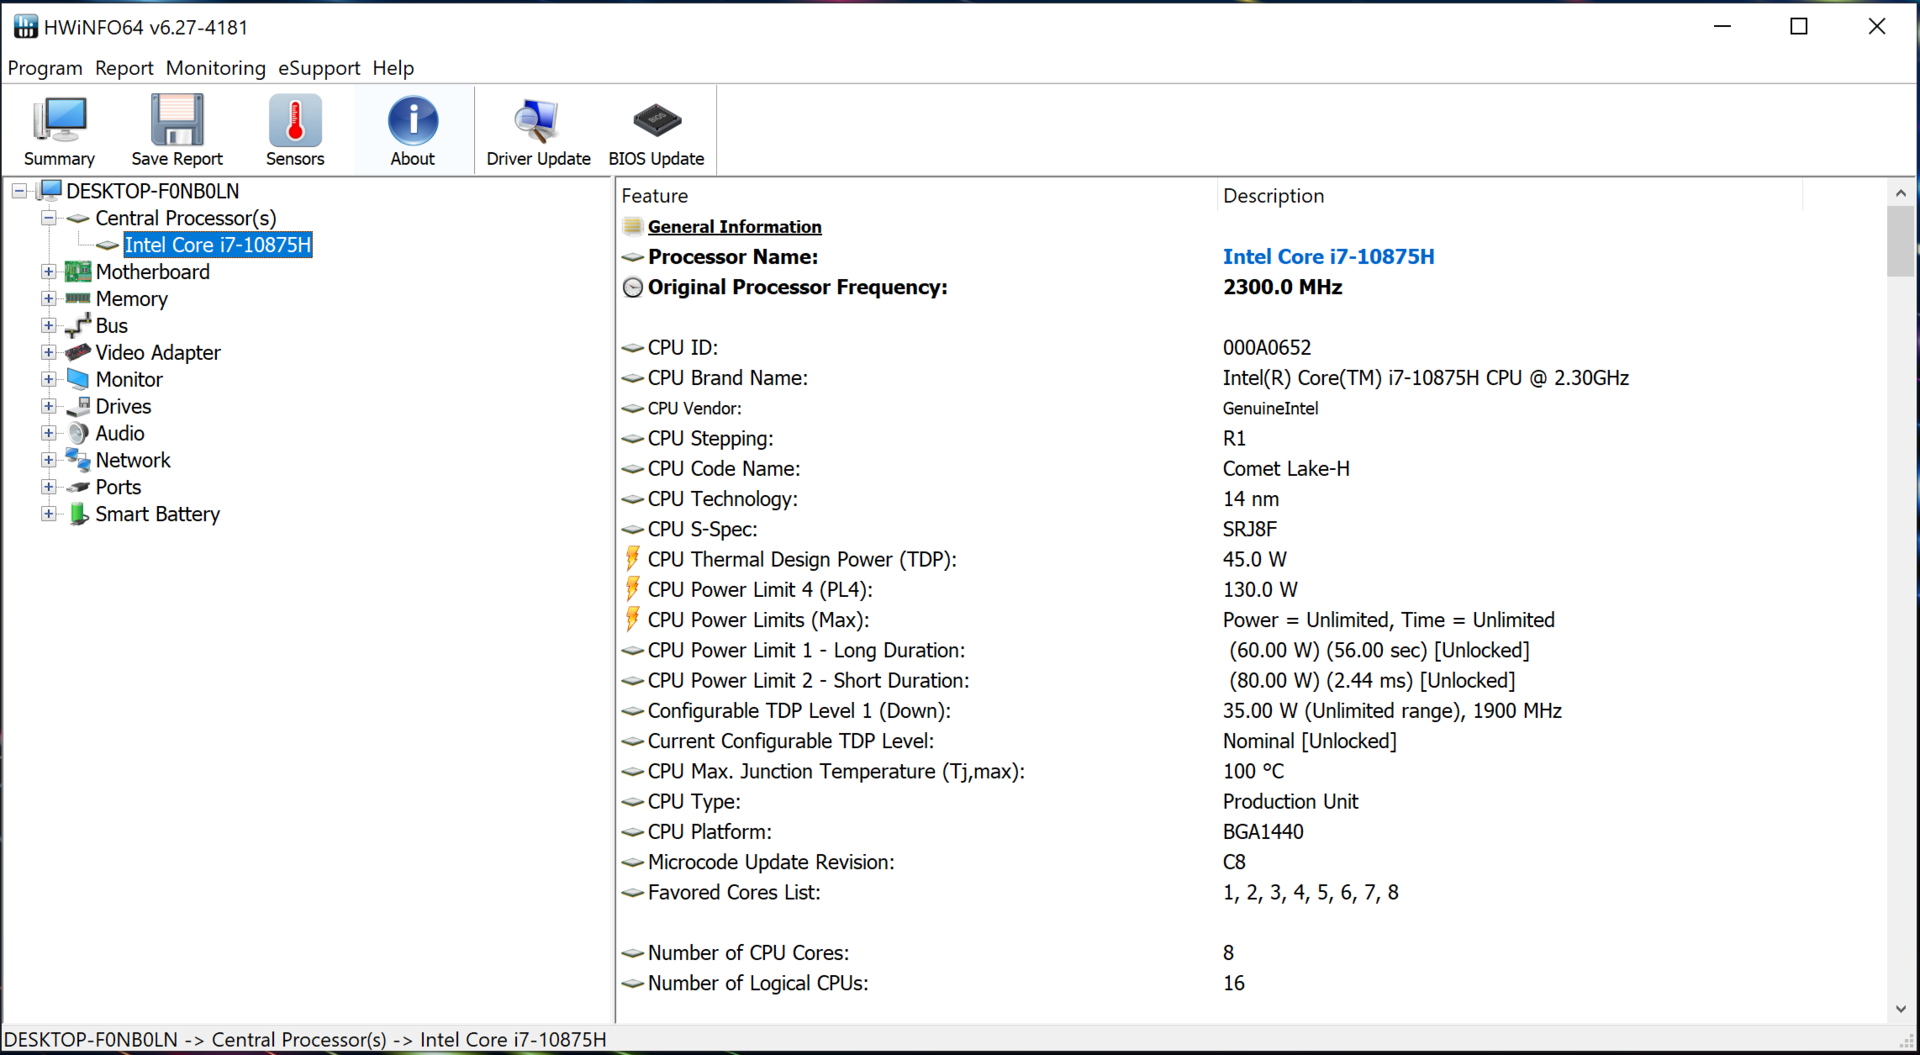
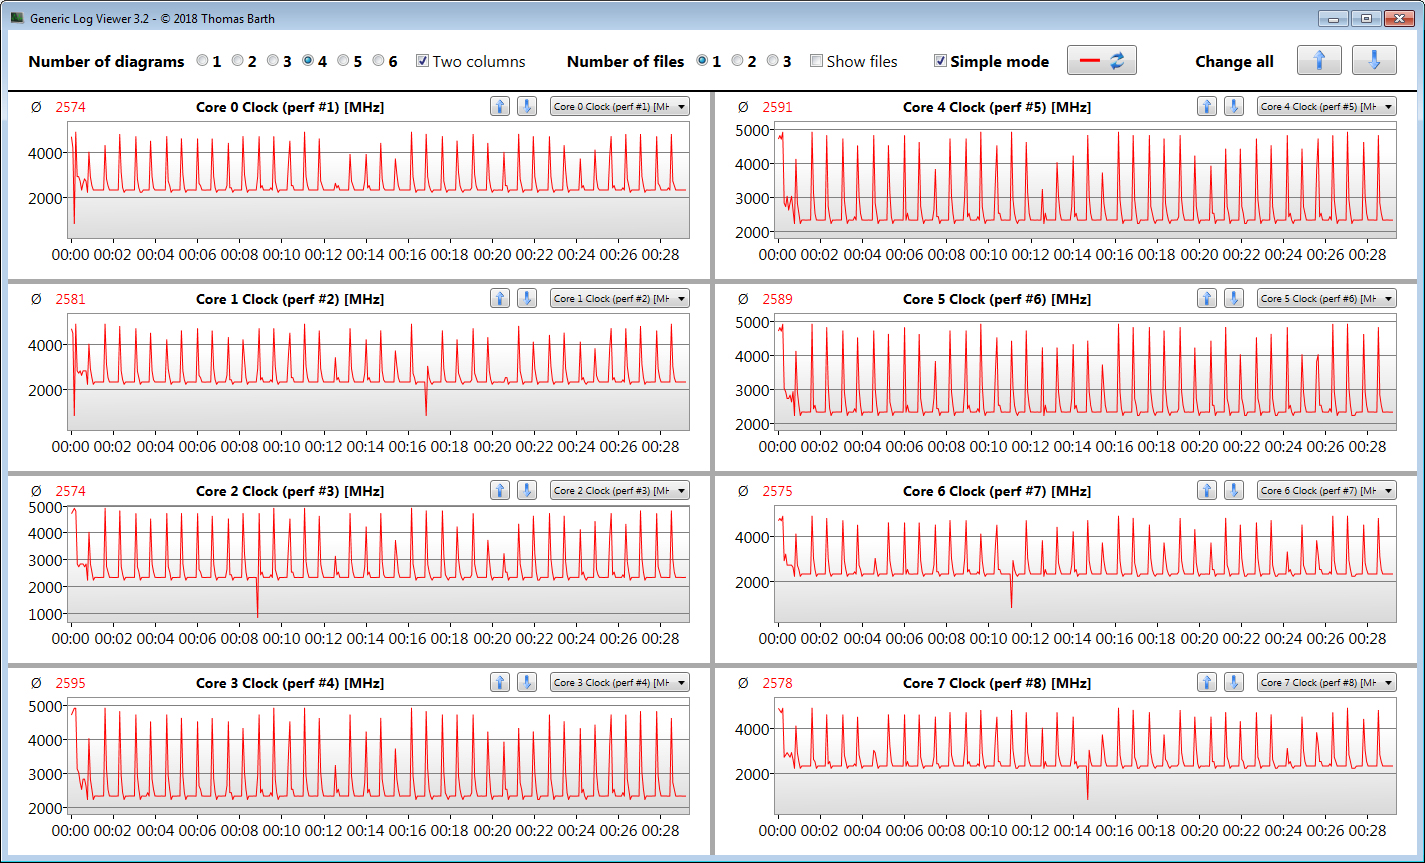
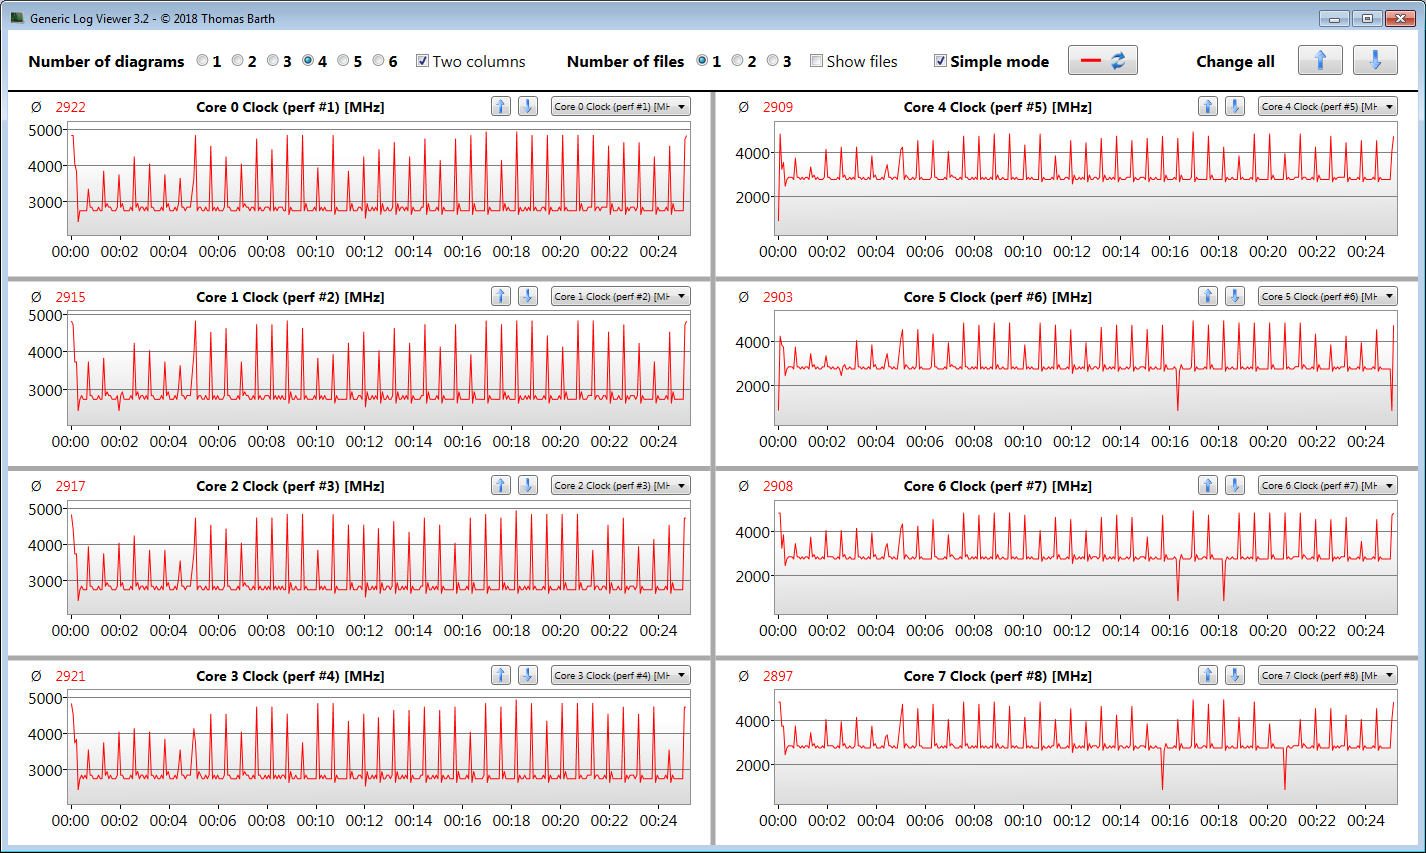
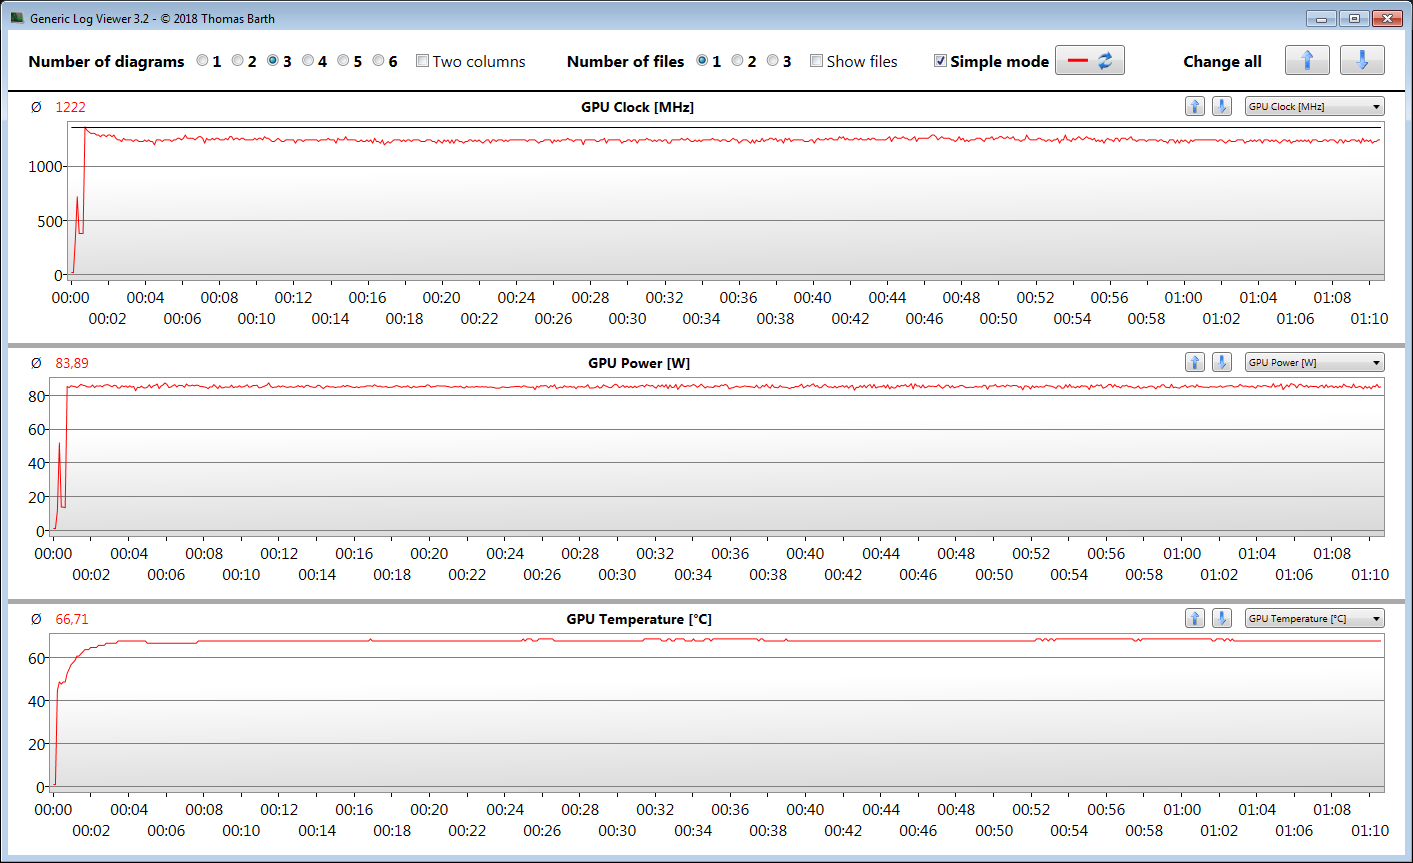
De Razer Blade 15 wordt geleverd met een NVIDIA Quadro RTX 5000 Max-Q en een Intel Core i7-10875H. Dankzij twee extra cores biedt de Core i7-10875H meer prestaties dan de hexa-core Coffee Lake-chip in het vorige model. Ook al is dit geen gaming-notebook, de Blade 15 Studio Edition kan toch alle huidige titels soepel draaien.
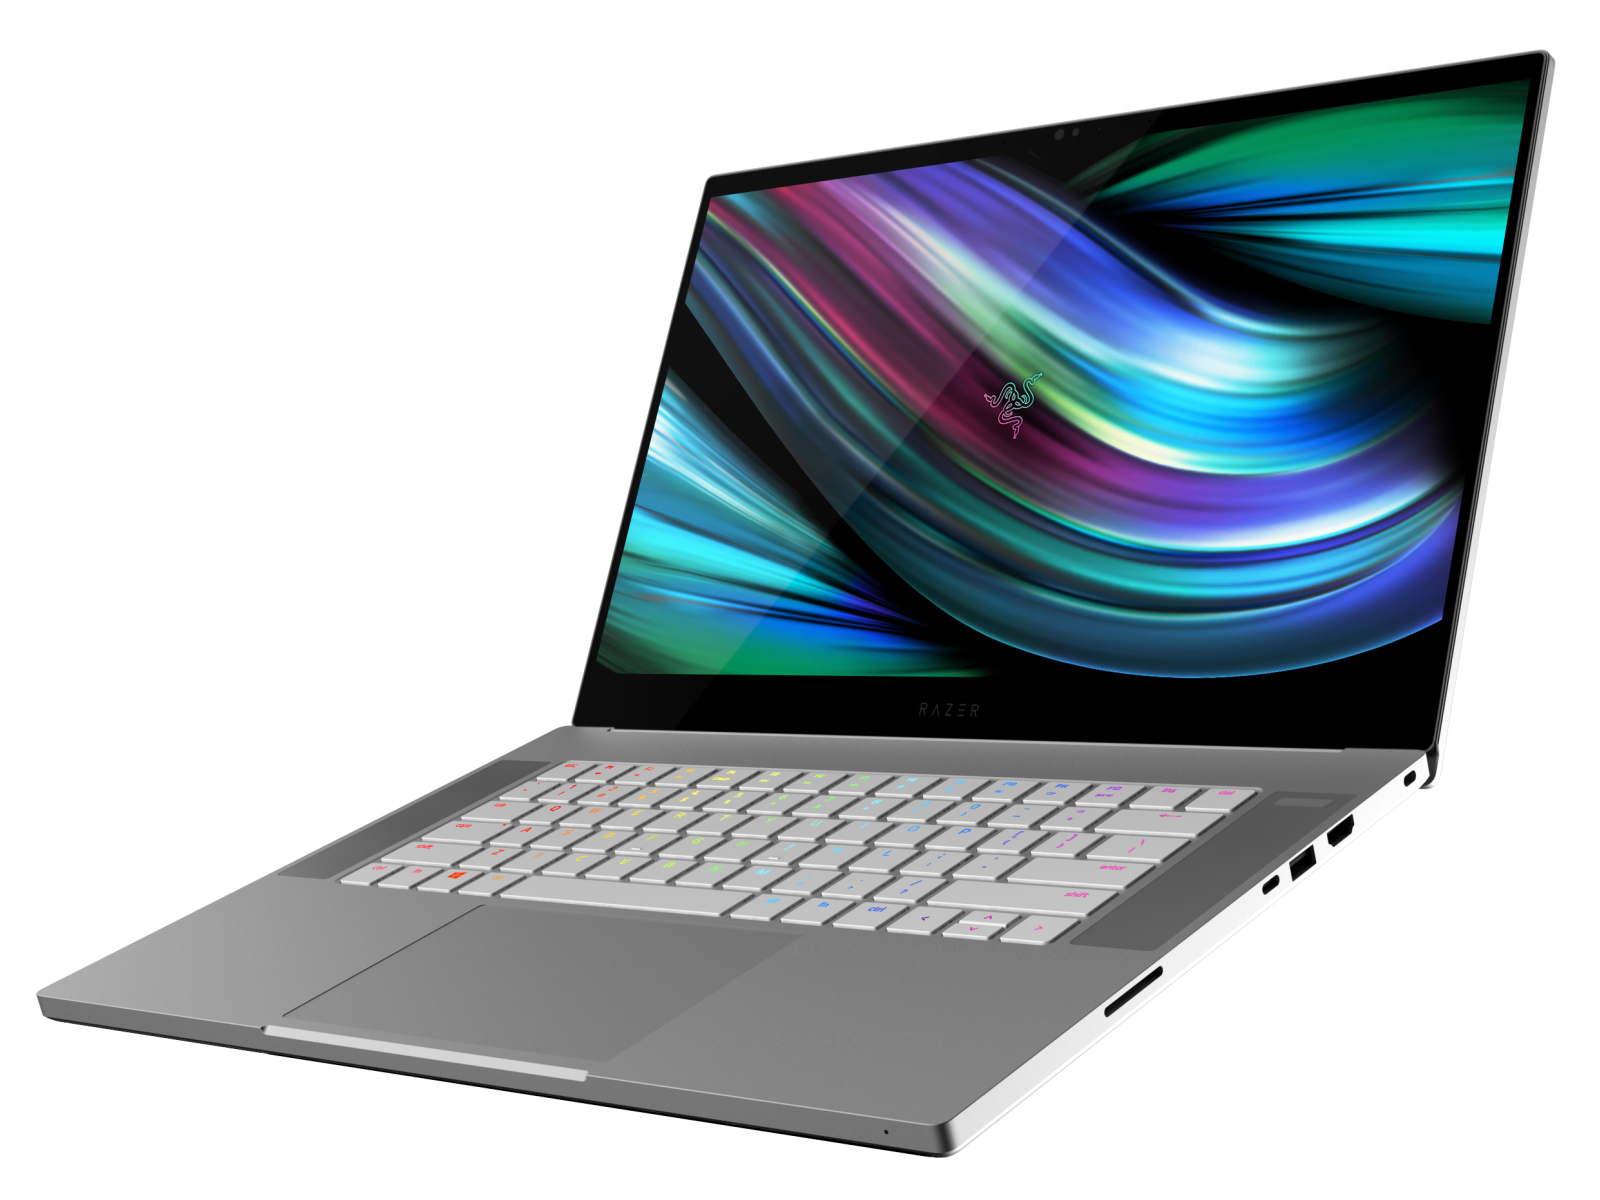
Razer gaf de Blade 15 Studio Edition (2020) een facelift. Een nieuwe CPU-architectuur zorgt voor een prestatieverbetering en de selectie van poorten is beter.
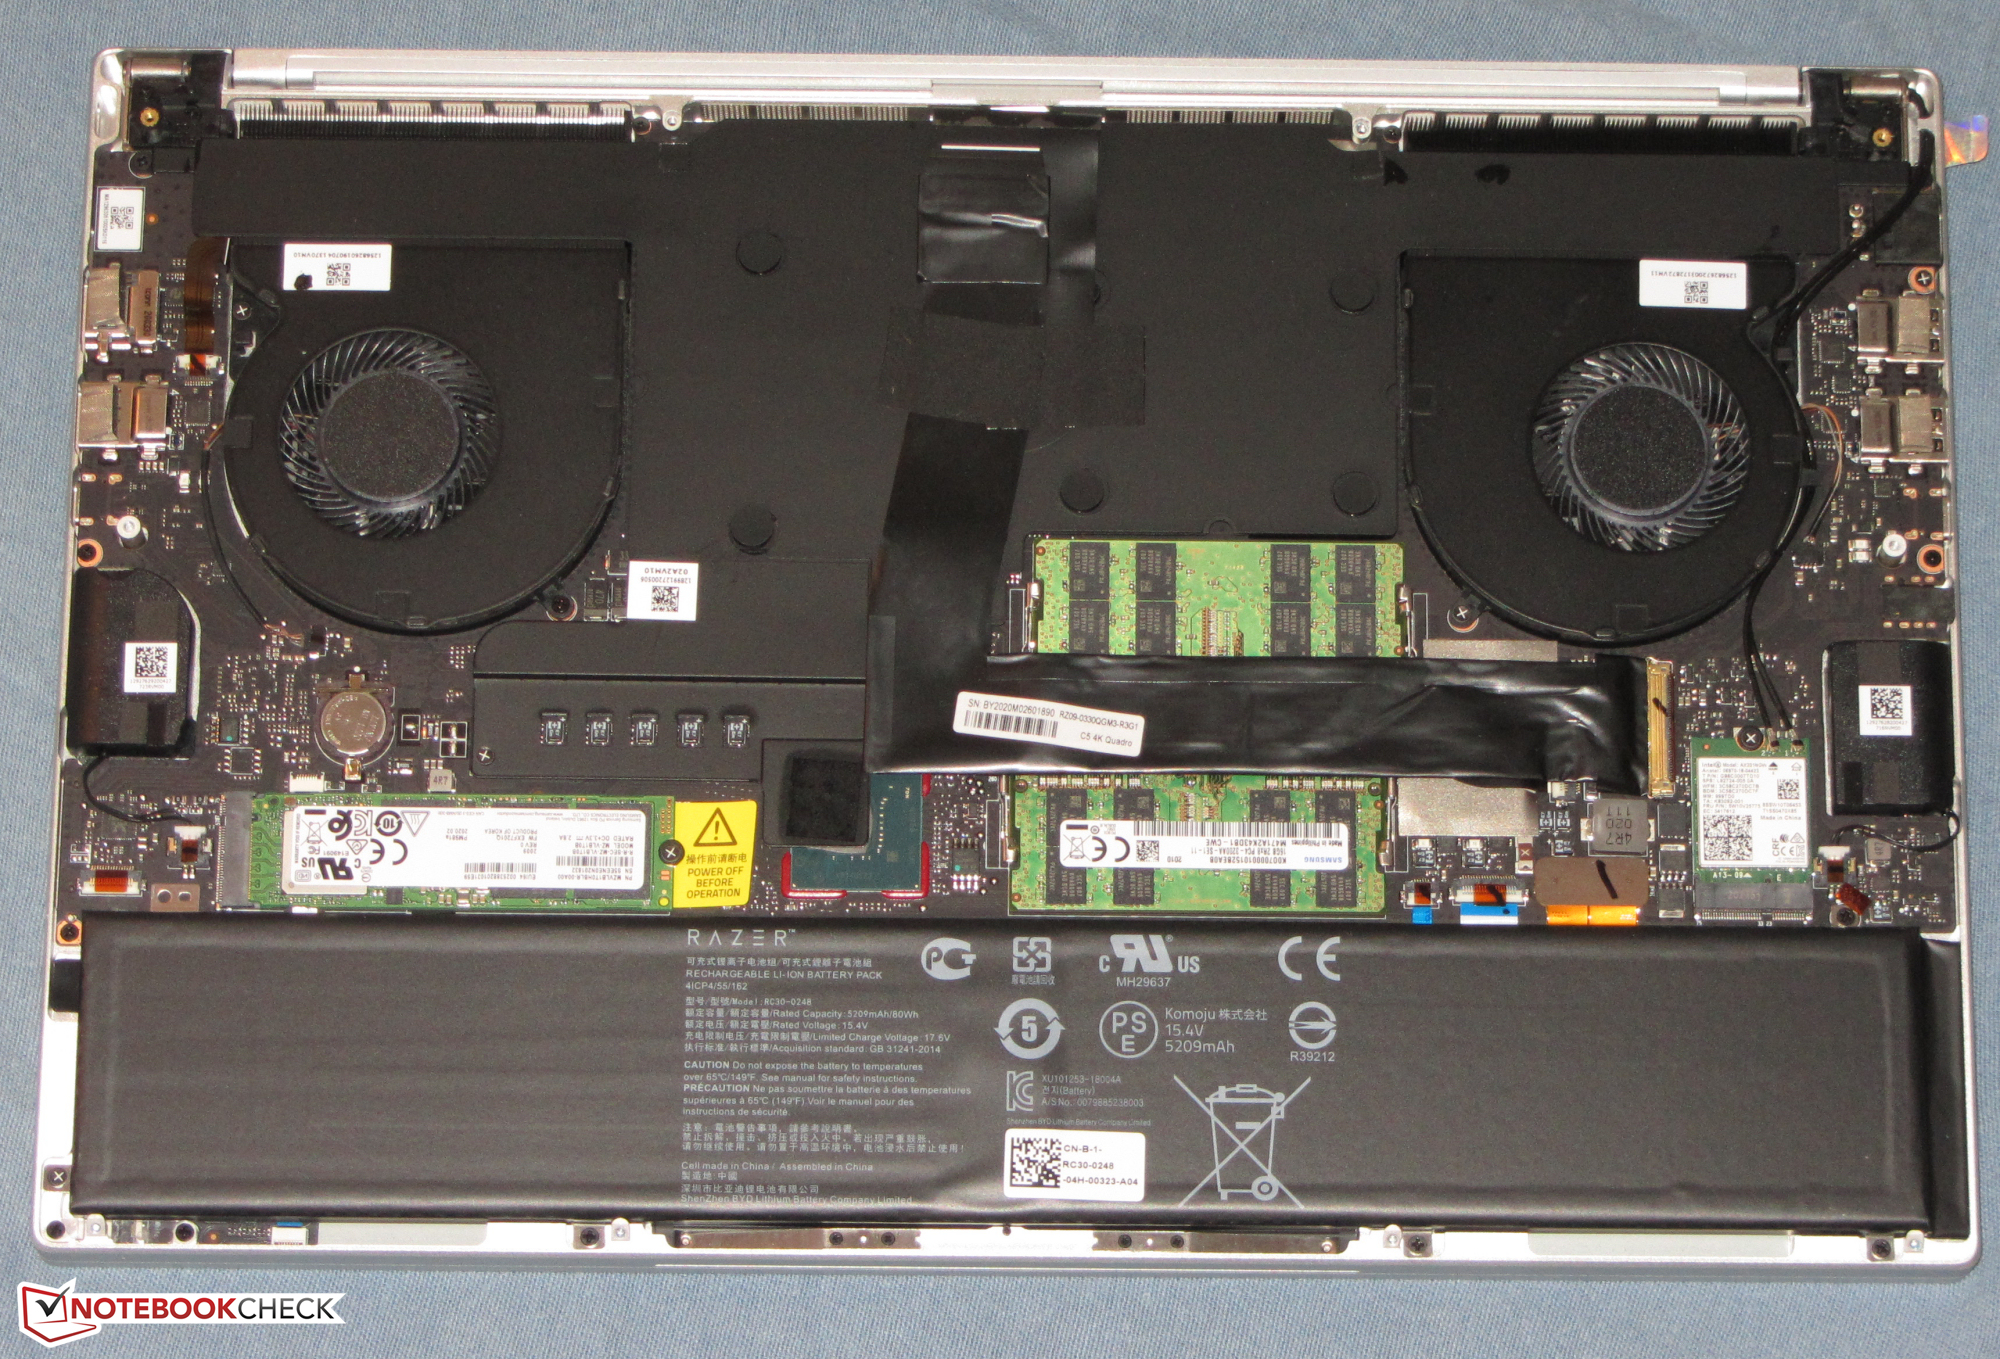
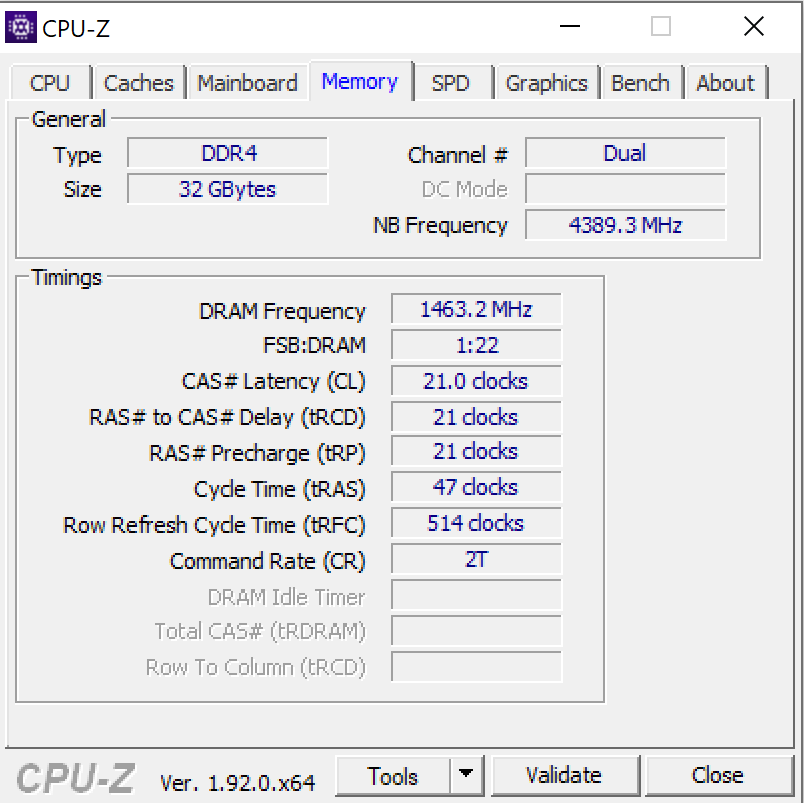
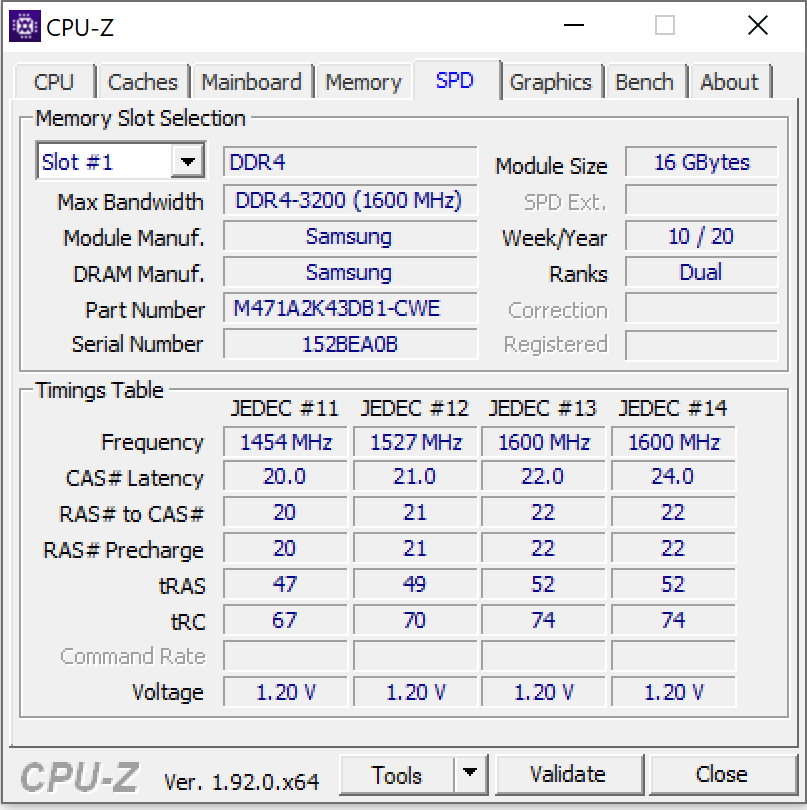
Het systeem beschikt over 32 GB RAM (in dual-channel-modus). De hoeveelheid RAM kan worden uitgebreid tot 64 GB. De zeer snelle SSD van 1 TB is ook te upgraden. Beide upgrades zijn eenvoudig uit te voeren, omdat de onderhoudsklep zonder problemen kan worden verwijderd.
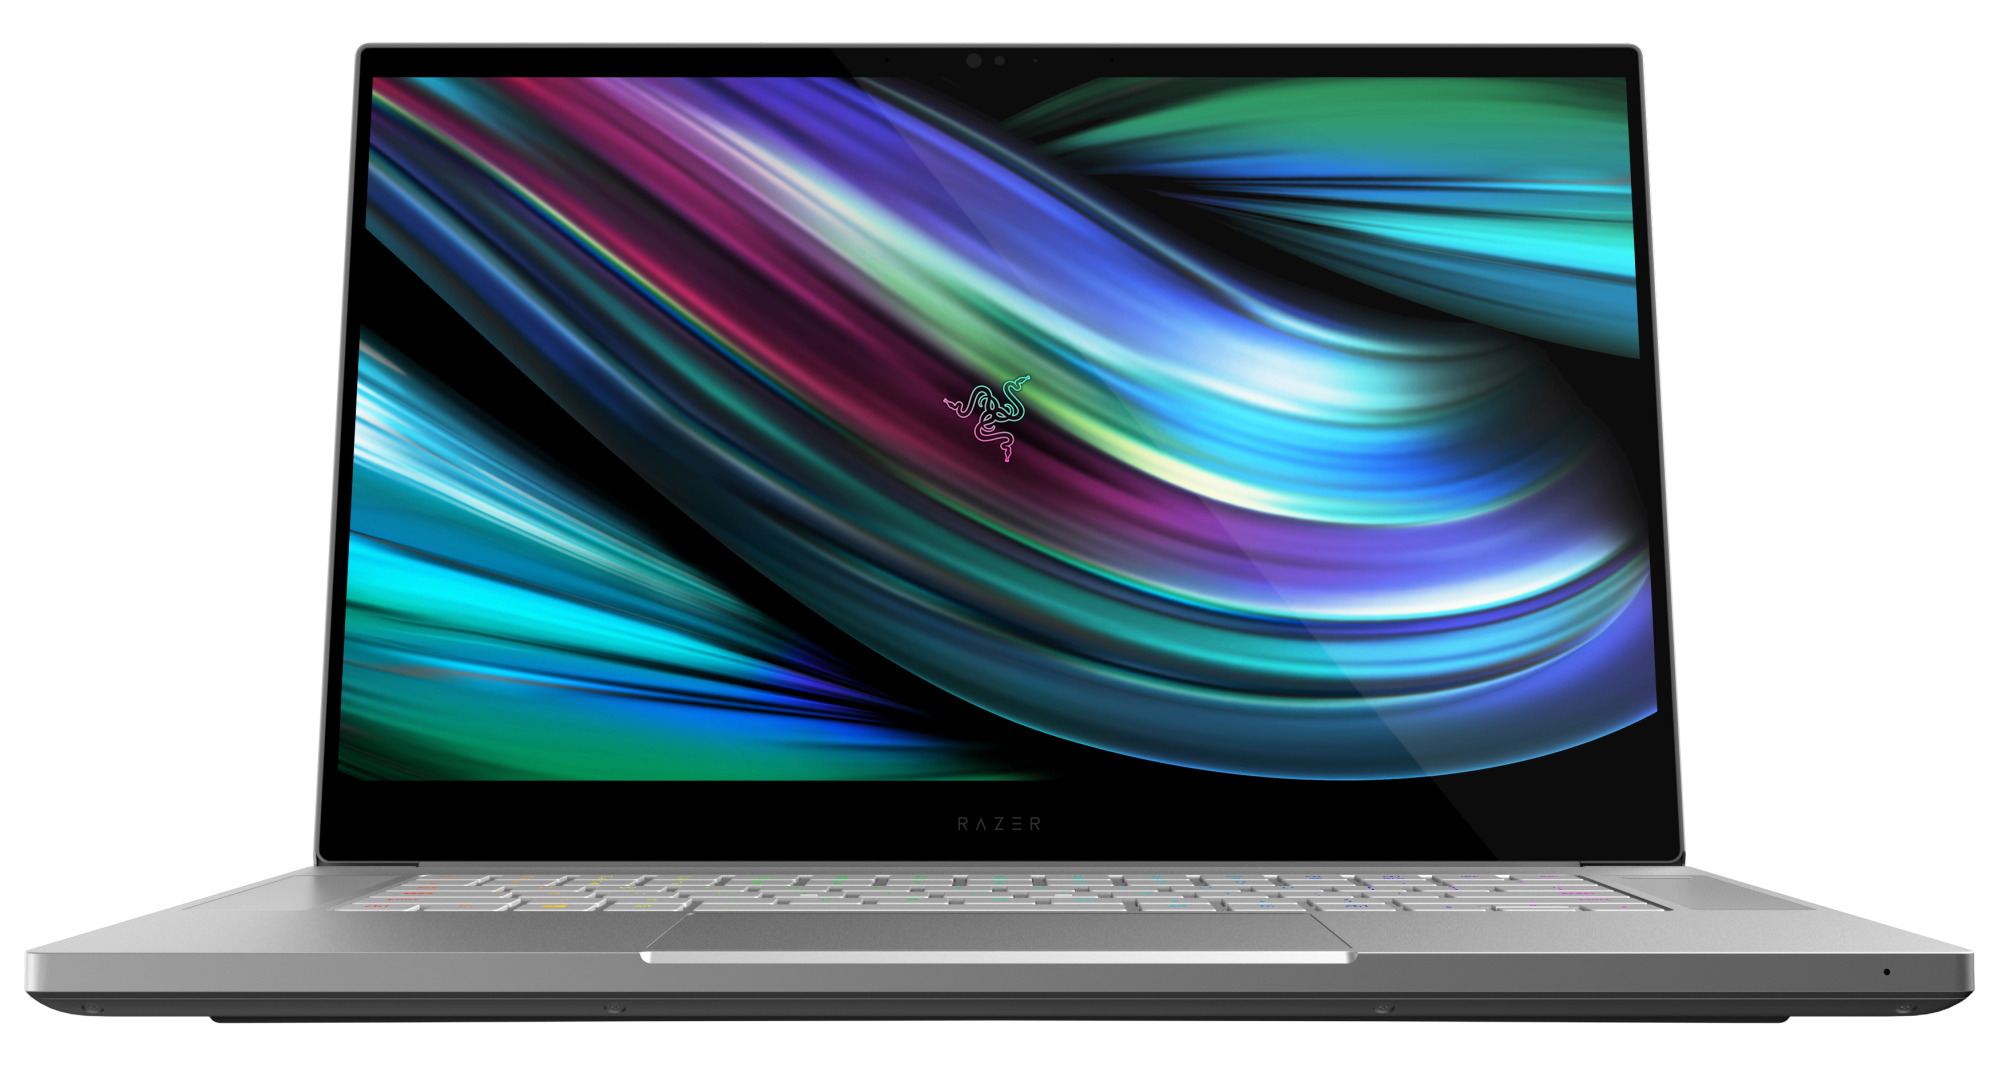
Het 4K OLED-touchscreen maakt indruk met een geweldige zwartwaarde, goede helderheid, stabiele kijkhoeken, snelle reactietijden en een goede kleurruimtedekking. Het dekt 100% van de sRGB-kleurruimte. De kleurweergave is ook redelijk goed.
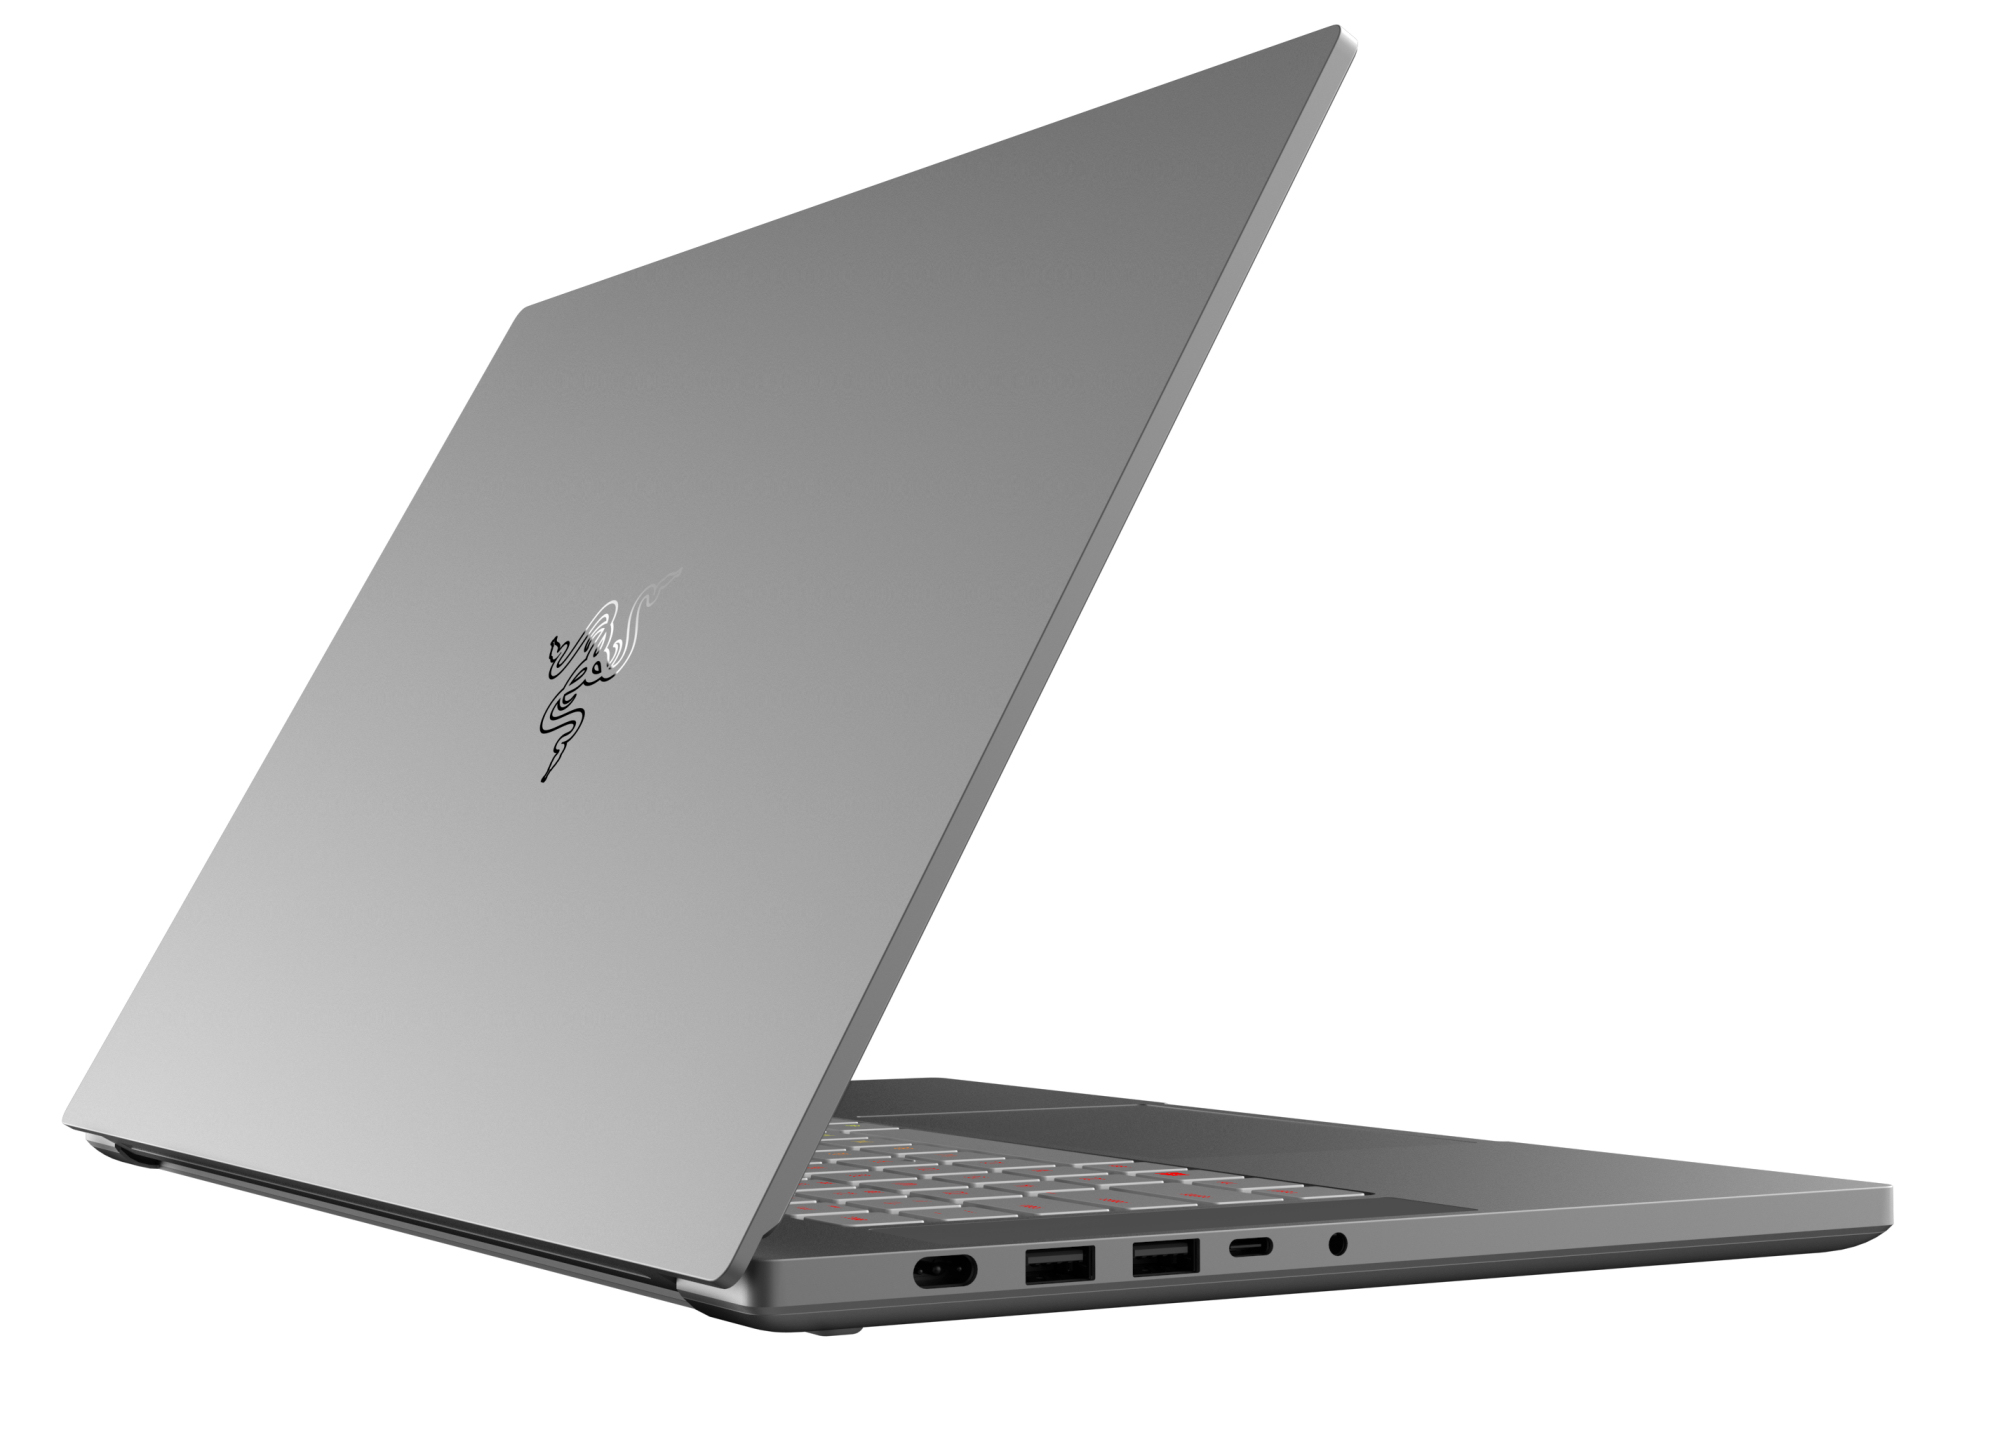
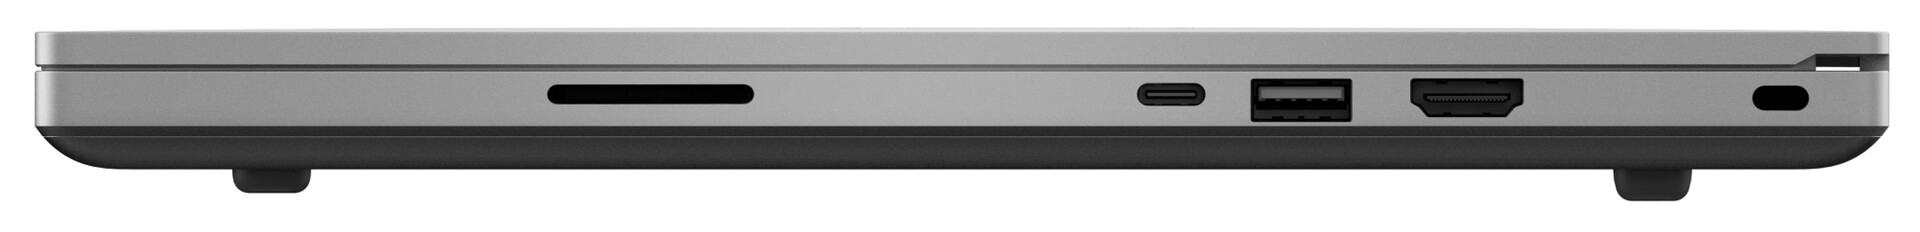
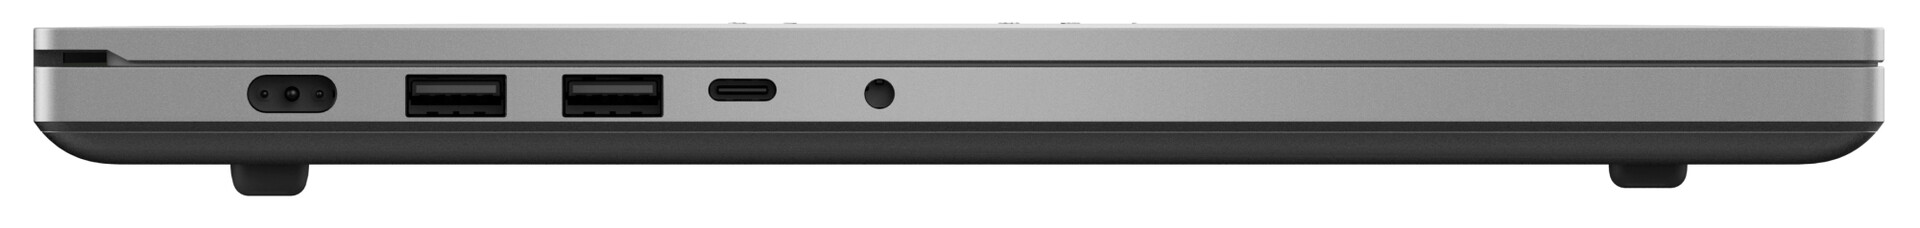
De miniDP-poort is vervangen door een USB 3.2 Gen 2 Type-C-poort, die een DisplayPort-signaal kan uitvoeren. De Type-A-poorten werken nu ook op USB 3.2 Gen 2-snelheden. De Thunderbolt 3-poort is nog steeds aanwezig. Het kan worden gebruikt om docking-stations of externe GPU's op het apparaat aan te sluiten. De batterij van de Blade 15 is op te laden via de Thunderbolt 3 poort. We konden het apparaat opladen met een voedingsadapter van 45 watt.
Razer Blade 15 Studio Edition 2020
- 03-08-2020 v7 (old)
Sascha Mölck