Notebookcheck Logo

Kort testrapport Razer Blade 15 Studio Edition: Degelijk Werkstation met Veel Rekenkracht

Geslepen mes. De Blade 15 Studio Edition is het beste 15,6-inch werkstation van Razer. De laptop biedt een hoog prestatieniveau, een 4K OLED-touchscreen en een Thunderbolt 3-poort. De geheugenconfiguratie is ook goed: 32 GB RAM, 16 GB VRAM en een NVMe-SSD (1 TB).
Razer Blade 15 Studio Edition (Blade 15 Serie)
Processor
Intel Core i7-9750H 6 x 2.6 - 4.5 GHz, Coffee Lake-H
Grafische kaart
NVIDIA Quadro RTX 5000 Max-Q - 16 GB VRAM, Core: 1350 MHz, Geheugen: 1500 MHz, GDDR6, 256-bit interface, Nvidia 441.28, Optimus
Geheugen
32 GB 
, DDR4-2666, dual-channel, twee geheugen slots (beide bezet), tot 64 GB
Beeldscherm
15.60 inch 16:9, 3840 x 2160 pixel 282 PPI, capacitief, 10-punts multitouch, Samsung SDCA029, OLED, glimmend: ja
Moederbord
Intel Cannon Lake HM370
Opslag
Samsung SSD PM981 MZVLB1T0HALR, 1024 GB 
, 887 GB beschikbaar
Verbindingen
3 USB 3.0, 1 USB 3.1 Gen2, 1 Thunderbolt, 1 HDMI, 2 DisplayPort, 1 Kensington Lock, Audio Verbindingen: gecombineerde audiopoort, Card Reader: SD, SDHC, SDXC, TV Card: HD, TPM 2.0
Netwerkmogelijkheden
Intel Wi-Fi 6 AX200 (a/b/g/n = Wi-Fi 4/ac = Wi-Fi 5/ax = Wi-Fi 6/), Bluetooth 5
Afmetingen
hoogte x breedte x diepte (in mm): 17.8 x 355 x 235
Batterij
80 Wh, 5209 mAh Lithium-Ion, 15.4 V
Besturingssysteem
Microsoft Windows 10 Pro 64 Bit
Camera
Webcam: 0.9
Bijkomende functionaliteiten
Luidsprekers: Stereo, Toetsenbord: Chiclet, Toetsenbordverlichting: ja, schoonmaakdoek, MS Office 365 (testversie), Razer Synapse, 12 Maanden Garantie
Gewicht
2.21 kg, Voeding: 755 g
Prijs
4400 Euro
Opmerking: De fabrikant kan onderdelen van verschillende leveranciers gebruiken, waaronder beeldschermen, schijven of geheugensticks met vergelijkbare specificaties.


Evaluatie
Datum
Model
Gewicht
Hoogte
Formaat
Resolutie
Beste prijs
86.6 %
12-2019
Razer Blade 15 Studio Edition
i7-9750H, Quadro RTX 5000 Max-Q
2.2 kg17.8 mm15.60"3840x2160
88.8 %
05-2019
Razer Blade 15 RTX 2080 Max-Q
i7-9750H, GeForce RTX 2080 Max-Q
2.2 kg17.8 mm15.60"1920x1080
89.8 %
11-2019
Lenovo ThinkPad P53-20QN000YGE
i7-9850H, Quadro RTX 5000 Max-Q
2.7 kg29.4 mm15.60"1920x1080
85 %
06-2019
MSI P65 Creator 9SF-657
i9-9880H, GeForce RTX 2070 Max-Q
1.9 kg18 mm15.60"3840x2160
86.9 %
12-2019
Dell Precision 5540
i9-9980HK, Quadro T2000 Max-Q
2 kg17 mm15.60"3840x2160
85.6 %
Fujitsu Celsius H780
i7-8850H, Quadro P2000
2.8 kg31.9 mm15.60"1920x1080
84.4 %
11-2018
HP ZBook Studio G5-4QH10EA
i7-8750H, Quadro P1000
2.1 kg18.9 mm15.60"3840x2160

Size Comparison

380 mm 258 mm 31.9 mm 2.8 kg377.4 mm 252.3 mm 29.4 mm 2.7 kg360 mm 254 mm 18.9 mm 2.1 kg357 mm 247 mm 18 mm 1.9 kg357 mm 236 mm 17 mm 2 kg355 mm 235 mm 17.8 mm 2.2 kg355 mm 235 mm 17.8 mm 2.2 kg297 mm 210 mm 1 mm 5.7 g
Linkerkant: stroomadapter, 2x USB 3.2 Gen 1 (Type-A), gecombineerde audiopoort
Rechterkant: kaartlezer (SD), Thunderbolt 3, USB 3.2 Gen 1 (Type-A), HDMI, MiniDisplayPort, kabelslot
SD Card Reader
average JPG Copy Test (av. of 3 runs)
Lenovo ThinkPad P53-20QN000YGE
  (Toshiba Exceria Pro SDXC 64 GB UHS-II)
185 MB/s +136%
HP ZBook Studio G5-4QH10EA
  (Toshiba Exceria Pro SDXC 64 GB UHS-II)
174 MB/s +122%
Dell Precision 5540
  (Toshiba Exceria Pro SDXC 64 GB UHS-II)
173 MB/s +121%
Fujitsu Celsius H780
  (Toshiba Exceria Pro SDXC 64 GB UHS-II)
146 MB/s +86%
Gemiddelde van klas Workstation
  (54.8 - 200, n=16, laatste 2 jaar)
95.8 MB/s +22%
Razer Blade 15 Studio Edition
  (Toshiba Exceria Pro SDXC 64 GB UHS-II)
78.3 MB/s
maximum AS SSD Seq Read Test (1GB)
HP ZBook Studio G5-4QH10EA
  (Toshiba Exceria Pro SDXC 64 GB UHS-II)
211.6 MB/s
Lenovo ThinkPad P53-20QN000YGE
  (Toshiba Exceria Pro SDXC 64 GB UHS-II)
202.4 MB/s
Dell Precision 5540
  (Toshiba Exceria Pro SDXC 64 GB UHS-II)
188.7 MB/s
Fujitsu Celsius H780
  (Toshiba Exceria Pro SDXC 64 GB UHS-II)
174.4 MB/s
Gemiddelde van klas Workstation
  (78.6 - 226, n=16, laatste 2 jaar)
125.6 MB/s
Networking
iperf3 transmit AX12
Razer Blade 15 Studio Edition
Intel Wi-Fi 6 AX200 (iperf 3.1.3)
1642 (1543min - 1735max) MBit/s
Lenovo ThinkPad P53-20QN000YGE
Intel Wi-Fi 6 AX200 (Intel X550-T2)
1470 (1418min - 1509max) MBit/s -10%
Lenovo ThinkPad P53-20QN000YGE
Intel Wi-Fi 6 AX200 (Killer E2500)
675 MBit/s -59%
Razer Blade 15 RTX 2080 Max-Q
Intel Wi-Fi 6 AX200
718 MBit/s -56%
Fujitsu Celsius H780
Intel Wireless-AC 9560 (iperf 3.1.3)
659 (649min - 666max) MBit/s -60%
MSI P65 Creator 9SF-657
Intel Cannon Lake-H/S CNVi: WiFi
650 (629min - 713max) MBit/s -60%
HP ZBook Studio G5-4QH10EA
Intel Wireless-AC 9560 (iperf 3.1.3)
633 (606min - 660max) MBit/s -61%
Dell Precision 5540
Intel Wi-Fi 6 AX200 (Killer E2500)
592 MBit/s -64%
iperf3 receive AX12
Lenovo ThinkPad P53-20QN000YGE
Intel Wi-Fi 6 AX200 (Intel X550-T2)
1485 (1319min - 1589max) MBit/s +8%
Lenovo ThinkPad P53-20QN000YGE
Intel Wi-Fi 6 AX200 (Killer E2500)
622 MBit/s -55%
Razer Blade 15 Studio Edition
Intel Wi-Fi 6 AX200 (iperf 3.1.3)
1375 (1256min - 1426max) MBit/s
Razer Blade 15 RTX 2080 Max-Q
Intel Wi-Fi 6 AX200
688 MBit/s -50%
HP ZBook Studio G5-4QH10EA
Intel Wireless-AC 9560 (iperf 3.1.3)
666 (328min - 700max) MBit/s -52%
Fujitsu Celsius H780
Intel Wireless-AC 9560 (iperf 3.1.3)
636 (613min - 655max) MBit/s -54%
Dell Precision 5540
Intel Wi-Fi 6 AX200 (Killer E2500)
628 MBit/s -54%
MSI P65 Creator 9SF-657
Intel Cannon Lake-H/S CNVi: WiFi (iperf 3.1.3)
490 (376min - 596max) MBit/s -64%
09018027036045054063072081090099010801170126013501440153016201710Tooltip
Razer Blade 15 Studio Edition Intel Wi-Fi 6 AX200; iperf3 receive AX12; iperf 3.1.3: Ø1375 (1256-1426)
Lenovo ThinkPad P53-20QN000YGE Intel Wi-Fi 6 AX200; iperf3 receive AX12; Intel X550-T2: Ø1485 (1319-1589)
MSI P65 Creator 9SF-657 Intel Cannon Lake-H/S CNVi: WiFi; iperf3 receive AX12; iperf 3.1.3: Ø489 (376-596)
Fujitsu Celsius H780 Intel Wireless-AC 9560; iperf3 receive AX12; iperf 3.1.3: Ø636 (613-655)
HP ZBook Studio G5-4QH10EA Intel Wireless-AC 9560; iperf3 receive AX12; iperf 3.1.3: Ø654 (328-700)
Razer Blade 15 Studio Edition Intel Wi-Fi 6 AX200; iperf3 transmit AX12; iperf 3.1.3: Ø1641 (1543-1735)
Lenovo ThinkPad P53-20QN000YGE Intel Wi-Fi 6 AX200; iperf3 transmit AX12; Intel X550-T2: Ø1469 (1418-1509)
MSI P65 Creator 9SF-657 Intel Cannon Lake-H/S CNVi: WiFi; iperf3 transmit AX12: Ø650 (629-713)
Fujitsu Celsius H780 Intel Wireless-AC 9560; iperf3 transmit AX12; iperf 3.1.3: Ø659 (649-666)
HP ZBook Studio G5-4QH10EA Intel Wireless-AC 9560; iperf3 transmit AX12; iperf 3.1.3: Ø633 (606-660)
357
cd/m²
370
cd/m²
372
cd/m²
346
cd/m²
361
cd/m²
361
cd/m²
332
cd/m²
364
cd/m²
347
cd/m²
Helderheidsverdeling
Samsung SDCA029 tested with X-Rite i1Pro 2
Maximum: 372 cd/m² (Nits) Gemiddelde: 356.7 cd/m² Minimum: 4.4 cd/m²
Helderheidsverdeling: 89 %
Helderheid in Batterij-modus: 361 cd/m²
Contrast: 24067:1 (Zwart: 0.015 cd/m²)
ΔE Color 5.3 | 0.5-29.43 Ø5, calibrated: 4.7
ΔE Greyscale 2.1 | 0.57-98 Ø5.3
100% sRGB (Argyll 1.6.3 3D)
86% AdobeRGB 1998 (Argyll 1.6.3 3D)
96.4% AdobeRGB 1998 (Argyll 2.2.0 3D)
100% sRGB (Argyll 2.2.0 3D)
99.9% Display P3 (Argyll 2.2.0 3D)
Gamma: 2.14
Razer Blade 15 Studio Edition
OLED, 3840x2160, 15.60
Razer Blade 15 RTX 2080 Max-Q
IPS, 1920x1080, 15.60
Lenovo ThinkPad P53-20QN000YGE
IPS, 1920x1080, 15.60
MSI P65 Creator 9SF-657
IPS, 3840x2160, 15.60
Dell Precision 5540
OLED, 3840x2160, 15.60
Fujitsu Celsius H780
IPS LED, 1920x1080, 15.60
HP ZBook Studio G5-4QH10EA
IPS LED, 3840x2160, 15.60
Display
-21%
-26%
-5%
0%
-28%
-22%
Display P3 Coverage
99.9
66.9
-33%
63.2
-37%
84.4
-16%
99.9
0%
66.3
-34%
68.2
-32%
sRGB Coverage
100
98.1
-2%
92.9
-7%
100
0%
100
0%
85.9
-14%
96.2
-4%
AdobeRGB 1998 Coverage
96.4
68.5
-29%
64.3
-33%
98.5
2%
97.3
1%
62.8
-35%
68.8
-29%
Response Times
-244%
-855%
-1138%
14%
-869%
-1324%
Response Time Grey 50% / Grey 80% *
3 ?(1, 2)
12.8 ?(6.8, 6)
-327%
38.4 ?(18.8, 19.6)
-1180%
51 ?(24, 27)
-1600%
2.8 ?(1.2, 1.6)
7%
38 ?(18.8, 19.2)
-1167%
60.8 ?(30, 30.8)
-1927%
Response Time Black / White *
4 ?(2, 2)
10.4 ?(6, 4.4)
-160%
25.2 ?(15.2, 10)
-530%
31 ?(18, 13)
-675%
3.2 ?(1.2, 2)
20%
26.8 ?(16.4, 10.4)
-570%
32.8 ?(16.4, 16.4)
-720%
PWM Frequency
23810 ?(10)
26040 ?(77)
240.9 ?(50)
20830 ?(60)
Screen
-164%
-203%
-336%
17%
-180%
-177%
Brightness middle
361
293
-19%
510
41%
445
23%
427
18%
271
-25%
417
16%
Brightness
357
270
-24%
468
31%
462
29%
411
15%
260
-27%
412
15%
Brightness Distribution
89
87
-2%
89
0%
83
-7%
89
0%
86
-3%
85
-4%
Black Level *
0.015
0.29
-1833%
0.36
-2300%
0.5
-3233%
0.29
-1833%
0.29
-1833%
Contrast
24067
1010
-96%
1417
-94%
890
-96%
934
-96%
1438
-94%
Colorchecker dE 2000 *
5.3
1.69
68%
2.3
57%
4.75
10%
3.2
40%
3.9
26%
4.4
17%
Colorchecker dE 2000 max. *
11.5
3.37
71%
5.5
52%
7.79
32%
8.4
27%
10.2
11%
6.7
42%
Colorchecker dE 2000 calibrated *
4.7
1.24
74%
1.2
74%
2.8
40%
2.9
38%
1.9
60%
Greyscale dE 2000 *
2.1
2.3
-10%
3.2
-52%
4.49
-114%
1.8
14%
2.6
-24%
5
-138%
Gamma
2.14 103%
2.3 96%
2.34 94%
2.49 88%
2.15 102%
2.29 96%
2.28 96%
CCT
6149 106%
6758 96%
7036 92%
7374 88%
6176 105%
6517 100%
7575 86%
Color Space (Percent of AdobeRGB 1998)
86
63
-27%
59.4
-31%
87
1%
86.8
1%
56.1
-35%
62.3
-28%
Color Space (Percent of sRGB)
100
98.5
-1%
93.1
-7%
100
0%
100
0%
85.8
-14%
96
-4%
Totaal Gemiddelde (Programma / Instellingen)
-143% / -147%
-361% / -251%
-493% / -376%
10% / 13%
-359% / -238%
-508% / -291%

* ... kleiner is beter

Responstijd Scherm

De responstijden van het scherm tonen hoe snel het scherm in staat is om van één kleur naar de andere te veranderen. Trage responstijden kunnen aanleiding geven tot 'nabeelden' rond bewegende objecten of het scherm wazig maken (blur). Vooral spelers van snelle 3D-games hebben baat bij een scherm met snelle responstijden.
       Responstijd Zwart naar Wit
4 ms ... stijging ↗ en daling ↘ gecombineerd↗ 2 ms stijging
↘ 2 ms daling
Het scherm vertoonde erg snelle responstijden in onze tests en zou zeer geschikt moeten zijn voor snelle games.
Ter vergelijking: alle testtoestellen variëren van 0.1 (minimum) tot 240 (maximum) ms. » 11 % van alle toestellen zijn beter.
Dit betekent dat de gemeten responstijd beter is dan het gemiddelde (21.5 ms) van alle geteste toestellen.
       Responstijd 50% Grijs naar 80% Grijs
3 ms ... stijging ↗ en daling ↘ gecombineerd↗ 1 ms stijging
↘ 2 ms daling
Het scherm vertoonde erg snelle responstijden in onze tests en zou zeer geschikt moeten zijn voor snelle games.
Ter vergelijking: alle testtoestellen variëren van 0.2 (minimum) tot 636 (maximum) ms. » 8 % van alle toestellen zijn beter.
Dit betekent dat de gemeten responstijd beter is dan het gemiddelde (33.7 ms) van alle geteste toestellen.

Screen Flickering / PWM (Pulse-Width Modulation)

Om de schermhelderheid te verlagen schakelen sommige laptops het backlight erg snel aan en uit. Dit gebeurt aan een dergelijk hoge frequentie dat het niet zichtbaar is voor het menselijk oog. Als de frequentie te laag is kunnen personen met gevoelige ogen geïrriteerd geraken, hoofdpijn krijgen en zelfs flickering waarnemen.
Screen flickering / PWM niet waargenomen

Ter vergelijking: 53 % van alle geteste toestellen maakten geen gebruik van PWM om de schermhelderheid te verlagen. Als het wel werd gebruikt, werd een gemiddelde van 17924 (minimum: 5 - maximum: 3846000) Hz waargenomen.

CPU-Z
CPU-Z
CPU-Z
CPU-Z
CPU-Z
GPU-Z
GPU-Z
HWInfo
LatencyMon
Intel XTU
0801602403204004805606407208008809601040112012001280136014401520Tooltip
Razer Blade 15 Studio Edition Intel Core i7-9750H, Intel Core i7-9750H: Ø899 (868.36-984.66)
Razer Blade 15 RTX 2080 Max-Q Intel Core i7-9750H, Intel Core i7-9750H: Ø1056 (1046.13-1175)
Lenovo ThinkPad P53-20QN000YGE Intel Core i7-9850H, Intel Core i7-9850H: Ø1114 (1097.03-1230.35)
MSI P65 Creator 9SF-657 Intel Core i9-9880H, Intel Core i9-9880H: Ø1439 (1417.84-1545.36)
Dell Precision 5540 Intel Core i9-9980HK, Intel Core i9-9980HK: Ø1288 (1207.8-1407.71)
Fujitsu Celsius H780 Intel Core i7-8850H, Intel Core i7-8850H: Ø1023 (1008-1102)
HP ZBook Studio G5-4QH10EA Intel Core i7-8750H, Intel Core i7-8750H: Ø1018 (1008.9-1100.84)
Razer Blade 15 Studio Edition Intel Core i7-9750H, Intel Core i7-9750H; Max. CPU-Leistung: Ø1044 (1037.21-1164.58)
CPU kloksnelheid tijdens de Cinebench R15 lus
CPU kloksnelheid tijdens de Cinebench R15 lus (maximale CPU prestaties)
Cinebench R10 Rendering Single 32Bit
6902
Cinebench R10 Rendering Multiple CPUs 32Bit
28251
Cinebench R10 Shading 32Bit
6814
Cinebench R15 CPU Single 64Bit
178 Points
Cinebench R15 CPU Multi 64Bit
985 Points
Cinebench R15 OpenGL 64Bit
176 fps
Cinebench R15 Ref. Match 64Bit
99.6 %
Help
Cinebench R15
CPU Single 64Bit
Gemiddelde van klas Workstation
  (166.2 - 301, n=27, laatste 2 jaar)
255 Points +43%
Lenovo ThinkPad P53-20QN000YGE
Intel Core i7-9850H
196.5 Points +10%
MSI P65 Creator 9SF-657
Intel Core i9-9880H
196 Points +10%
Dell Precision 5540
Intel Core i9-9980HK
193 Points +8%
Fujitsu Celsius H780
Intel Core i7-8850H
185 Points +4%
Gemiddeld Intel Core i7-9750H
  (170 - 194, n=82)
183.7 Points +3%
Razer Blade 15 Studio Edition
Intel Core i7-9750H (Max. CPU-Leistung)
183 Points +3%
Razer Blade 15 Studio Edition
Intel Core i7-9750H
178 Points
HP ZBook Studio G5-4QH10EA
Intel Core i7-8750H
175 Points -2%
Razer Blade 15 RTX 2080 Max-Q
Intel Core i7-9750H
175 Points -2%
CPU Multi 64Bit
Gemiddelde van klas Workstation
  (706 - 3625, n=27, laatste 2 jaar)
2369 Points +141%
MSI P65 Creator 9SF-657
Intel Core i9-9880H
1545 Points +57%
Dell Precision 5540
Intel Core i9-9980HK
1407 (1126.13min - 1407max) Points +43%
Lenovo ThinkPad P53-20QN000YGE
Intel Core i7-9850H
1230 (1097.03min - 1230.35max) Points +25%
Gemiddeld Intel Core i7-9750H
  (952 - 1306, n=85)
1182 Points +20%
Razer Blade 15 RTX 2080 Max-Q
Intel Core i7-9750H
1175 Points +19%
Razer Blade 15 Studio Edition
Intel Core i7-9750H (Max. CPU-Leistung)
1165 Points +18%
HP ZBook Studio G5-4QH10EA
Intel Core i7-8750H
1127 Points +14%
Fujitsu Celsius H780
Intel Core i7-8850H
1116 Points +13%
Razer Blade 15 Studio Edition
Intel Core i7-9750H
985 Points
Cinebench R10
Rendering Single 32Bit
Dell Precision 5540
Intel Core i9-9980HK
9734 Points +41%
Gemiddeld Intel Core i7-9750H
  (6659 - 7214, n=13)
6923 Points 0%
Razer Blade 15 Studio Edition
Intel Core i7-9750H
6902 Points
Gemiddelde van klas Workstation
  (laatste 2 jaar)
6888 Points 0%
Rendering Multiple CPUs 32Bit
Dell Precision 5540
Intel Core i9-9980HK
50439 Points +79%
Gemiddelde van klas Workstation
  (laatste 2 jaar)
39399 Points +39%
Gemiddeld Intel Core i7-9750H
  (28251 - 36304, n=13)
33539 Points +19%
Razer Blade 15 Studio Edition
Intel Core i7-9750H
28251 Points
Cinebench R20
CPU (Single Core)
Gemiddelde van klas Workstation
  (528 - 816, n=28, laatste 2 jaar)
684 Points +57%
Gemiddeld Intel Core i7-9750H
  (416 - 486, n=55)
443 Points +2%
Razer Blade 15 Studio Edition
Intel Core i7-9750H (Max. CPU-Leistung)
437 Points 0%
Razer Blade 15 Studio Edition
Intel Core i7-9750H
436 Points
CPU (Multi Core)
Gemiddelde van klas Workstation
  (1669 - 9329, n=28, laatste 2 jaar)
5803 Points +183%
Gemiddeld Intel Core i7-9750H
  (2017 - 3133, n=55)
2564 Points +25%
Razer Blade 15 Studio Edition
Intel Core i7-9750H (Max. CPU-Leistung)
2198 Points +7%
Razer Blade 15 Studio Edition
Intel Core i7-9750H
2051 Points
Geekbench 3
32 Bit Multi-Core Score
Gemiddeld Intel Core i7-9750H
  (21185 - 23587, n=8)
22450 Points +6%
Razer Blade 15 Studio Edition
Intel Core i7-9750H
21185 Points
32 Bit Single-Core Score
Razer Blade 15 Studio Edition
Intel Core i7-9750H
4269 Points
Gemiddeld Intel Core i7-9750H
  (4137 - 4428, n=8)
4243 Points -1%
Geekbench 4.4
64 Bit Multi-Core Score
Gemiddelde van klas Workstation
  (laatste 2 jaar)
34588 Points +66%
Dell Precision 5540
Intel Core i9-9980HK
28625 Points +37%
Lenovo ThinkPad P53-20QN000YGE
Intel Core i7-9850H
23715 Points +14%
Fujitsu Celsius H780
Intel Core i7-8850H
22348 Points +7%
Gemiddeld Intel Core i7-9750H
  (17054 - 25043, n=27)
22076 Points +6%
Razer Blade 15 Studio Edition
Intel Core i7-9750H
20857 Points
64 Bit Single-Core Score
Gemiddelde van klas Workstation
  (laatste 2 jaar)
7042 Points +32%
Dell Precision 5540
Intel Core i9-9980HK
5617 Points +5%
Lenovo ThinkPad P53-20QN000YGE
Intel Core i7-9850H
5594 Points +5%
Razer Blade 15 Studio Edition
Intel Core i7-9750H
5346 Points
Gemiddeld Intel Core i7-9750H
  (4440 - 5511, n=27)
5238 Points -2%
Fujitsu Celsius H780
Intel Core i7-8850H
5153 Points -4%
Geekbench 5.0
5.0 Multi-Core
Gemiddelde van klas Workstation
  (11363 - 16846, n=7, laatste 2 jaar)
13825 Points +164%
Dell Precision 5540
Intel Core i9-9980HK
7072 Points +35%
Lenovo ThinkPad P53-20QN000YGE
Intel Core i7-9850H
5886 Points +12%
Gemiddeld Intel Core i7-9750H
  (4812 - 6230, n=15)
5575 Points +6%
Razer Blade 15 Studio Edition
Intel Core i7-9750H
5245 Points
5.0 Single-Core
Gemiddelde van klas Workstation
  (1718 - 2019, n=7, laatste 2 jaar)
1850 Points +58%
Dell Precision 5540
Intel Core i9-9980HK
1243 Points +6%
Lenovo ThinkPad P53-20QN000YGE
Intel Core i7-9850H
1203 Points +3%
Gemiddeld Intel Core i7-9750H
  (1105 - 1248, n=15)
1179 Points +1%
Razer Blade 15 Studio Edition
Intel Core i7-9750H
1171 Points
Mozilla Kraken 1.1 - Total
HP ZBook Studio G5-4QH10EA
Intel Core i7-8750H (Edge)
1131 ms * -6%
Razer Blade 15 RTX 2080 Max-Q
Intel Core i7-9750H (Edge 44.17763.1.0)
1079 ms * -1%
Razer Blade 15 Studio Edition
Intel Core i7-9750H (Edge 44)
1067 ms *
Gemiddeld Intel Core i7-9750H
  (845 - 1713, n=54)
1048 ms * +2%
Lenovo ThinkPad P53-20QN000YGE
Intel Core i7-9850H (Edge 44.18362.387.0)
1015 ms * +5%
Dell Precision 5540
Intel Core i9-9980HK
705 ms * +34%
Gemiddelde van klas Workstation
  (451 - 612, n=28, laatste 2 jaar)
525 ms * +51%
Octane V2 - Total Score
Gemiddelde van klas Workstation
  (68050 - 100022, n=10, laatste 2 jaar)
85350 Points +145%
Dell Precision 5540
Intel Core i9-9980HK
44780 Points +28%
Lenovo ThinkPad P53-20QN000YGE
Intel Core i7-9850H (Edge 44.18362.387.0)
38630 Points +11%
Razer Blade 15 RTX 2080 Max-Q
Intel Core i7-9750H (Edge 44.17763.1.0)
36865 Points +6%
Gemiddeld Intel Core i7-9750H
  (22874 - 39708, n=47)
35814 Points +3%
Razer Blade 15 Studio Edition
Intel Core i7-9750H (Edge 44)
34861 Points
HP ZBook Studio G5-4QH10EA
Intel Core i7-8750H (Edge)
34667 Points -1%
JetStream 1.1 - Total Score
Lenovo ThinkPad P53-20QN000YGE
Intel Core i7-9850H (Edge 44.18362.387.0)
280.8 Points +9%
Razer Blade 15 RTX 2080 Max-Q
Intel Core i7-9750H (Edge 44.17763.1.0)
265.7 Points +4%
Fujitsu Celsius H780
Intel Core i7-8850H (Edge)
264.2 Points +3%
Gemiddeld Intel Core i7-9750H
  (212 - 280, n=47)
258 Points +1%
Dell Precision 5540
Intel Core i9-9980HK
256.7 Points 0%
Razer Blade 15 Studio Edition
Intel Core i7-9750H (Edge 44)
256.5 Points
HP ZBook Studio G5-4QH10EA
Intel Core i7-8750H (Edge)
250.4 Points -2%

* ... kleiner is beter

PCMark 8 Home Score Accelerated v2
3551 punten
PCMark 8 Creative Score Accelerated v2
3820 punten
PCMark 8 Work Score Accelerated v2
4454 punten
PCMark 10 Score
5317 punten
Help
PCMark 10
Score
Gemiddelde van klas Workstation
  (5488 - 8587, n=26, laatste 2 jaar)
6880 Points +29%
Razer Blade 15 RTX 2080 Max-Q
GeForce RTX 2080 Max-Q, i7-9750H, Samsung SSD PM981 MZVLB512HAJQ
5839 Points +10%
Lenovo ThinkPad P53-20QN000YGE
Quadro RTX 5000 Max-Q, i7-9850H, Samsung PM981a MZVLB1T0HBLR
5754 Points +8%
Razer Blade 15 Studio Edition
Quadro RTX 5000 Max-Q, i7-9750H, Samsung SSD PM981 MZVLB1T0HALR
5317 Points
Dell Precision 5540
Quadro T2000 Max-Q, i9-9980HK, SK hynix PC400 512 GB
5296 Points 0%
MSI P65 Creator 9SF-657
GeForce RTX 2070 Max-Q, i9-9880H, 2x Samsung SSD PM981 MZVLB512HAJQ (RAID 0)
5211 Points -2%
Fujitsu Celsius H780
Quadro P2000, i7-8850H, Samsung SSD PM981 MZVLB512HAJQ
5167 Points -3%
Gemiddeld Intel Core i7-9750H, NVIDIA Quadro RTX 5000 Max-Q
  (4877 - 5317, n=2)
5097 Points -4%
HP ZBook Studio G5-4QH10EA
Quadro P1000, i7-8750H, Samsung SSD PM981 MZVLB512HAJQ
4462 Points -16%
Essentials
Gemiddelde van klas Workstation
  (9151 - 12197, n=26, laatste 2 jaar)
10541 Points +18%
Lenovo ThinkPad P53-20QN000YGE
Quadro RTX 5000 Max-Q, i7-9850H, Samsung PM981a MZVLB1T0HBLR
9603 Points +7%
Dell Precision 5540
Quadro T2000 Max-Q, i9-9980HK, SK hynix PC400 512 GB
9580 Points +7%
Razer Blade 15 RTX 2080 Max-Q
GeForce RTX 2080 Max-Q, i7-9750H, Samsung SSD PM981 MZVLB512HAJQ
9109 Points +2%
Razer Blade 15 Studio Edition
Quadro RTX 5000 Max-Q, i7-9750H, Samsung SSD PM981 MZVLB1T0HALR
8970 Points
MSI P65 Creator 9SF-657
GeForce RTX 2070 Max-Q, i9-9880H, 2x Samsung SSD PM981 MZVLB512HAJQ (RAID 0)
8961 Points 0%
Gemiddeld Intel Core i7-9750H, NVIDIA Quadro RTX 5000 Max-Q
  (8809 - 8970, n=2)
8890 Points -1%
Fujitsu Celsius H780
Quadro P2000, i7-8850H, Samsung SSD PM981 MZVLB512HAJQ
8632 Points -4%
HP ZBook Studio G5-4QH10EA
Quadro P1000, i7-8750H, Samsung SSD PM981 MZVLB512HAJQ
7739 Points -14%
Productivity
Gemiddelde van klas Workstation
  (7846 - 10820, n=26, laatste 2 jaar)
9145 Points +33%
Razer Blade 15 RTX 2080 Max-Q
GeForce RTX 2080 Max-Q, i7-9750H, Samsung SSD PM981 MZVLB512HAJQ
8200 Points +19%
Lenovo ThinkPad P53-20QN000YGE
Quadro RTX 5000 Max-Q, i7-9850H, Samsung PM981a MZVLB1T0HBLR
7657 Points +11%
Fujitsu Celsius H780
Quadro P2000, i7-8850H, Samsung SSD PM981 MZVLB512HAJQ
7377 Points +7%
Dell Precision 5540
Quadro T2000 Max-Q, i9-9980HK, SK hynix PC400 512 GB
7060 Points +2%
Gemiddeld Intel Core i7-9750H, NVIDIA Quadro RTX 5000 Max-Q
  (6892 - 7205, n=2)
7049 Points +2%
Razer Blade 15 Studio Edition
Quadro RTX 5000 Max-Q, i7-9750H, Samsung SSD PM981 MZVLB1T0HALR
6892 Points
HP ZBook Studio G5-4QH10EA
Quadro P1000, i7-8750H, Samsung SSD PM981 MZVLB512HAJQ
6573 Points -5%
MSI P65 Creator 9SF-657
GeForce RTX 2070 Max-Q, i9-9880H, 2x Samsung SSD PM981 MZVLB512HAJQ (RAID 0)
5986 Points -13%
Digital Content Creation
Gemiddelde van klas Workstation
  (5399 - 13947, n=26, laatste 2 jaar)
9286 Points +41%
Razer Blade 15 RTX 2080 Max-Q
GeForce RTX 2080 Max-Q, i7-9750H, Samsung SSD PM981 MZVLB512HAJQ
7236 Points +10%
MSI P65 Creator 9SF-657
GeForce RTX 2070 Max-Q, i9-9880H, 2x Samsung SSD PM981 MZVLB512HAJQ (RAID 0)
7161 Points +8%
Lenovo ThinkPad P53-20QN000YGE
Quadro RTX 5000 Max-Q, i7-9850H, Samsung PM981a MZVLB1T0HBLR
7033 Points +7%
Razer Blade 15 Studio Edition
Quadro RTX 5000 Max-Q, i7-9750H, Samsung SSD PM981 MZVLB1T0HALR
6601 Points
Dell Precision 5540
Quadro T2000 Max-Q, i9-9980HK, SK hynix PC400 512 GB
5960 Points -10%
Fujitsu Celsius H780
Quadro P2000, i7-8850H, Samsung SSD PM981 MZVLB512HAJQ
5880 Points -11%
Gemiddeld Intel Core i7-9750H, NVIDIA Quadro RTX 5000 Max-Q
  (4962 - 6601, n=2)
5782 Points -12%
HP ZBook Studio G5-4QH10EA
Quadro P1000, i7-8750H, Samsung SSD PM981 MZVLB512HAJQ
4741 Points -28%
PCMark 8
Home Score Accelerated v2
Razer Blade 15 RTX 2080 Max-Q
GeForce RTX 2080 Max-Q, i7-9750H, Samsung SSD PM981 MZVLB512HAJQ
4380 Points +23%
Fujitsu Celsius H780
Quadro P2000, i7-8850H, Samsung SSD PM981 MZVLB512HAJQ
4230 Points +19%
Dell Precision 5540
Quadro T2000 Max-Q, i9-9980HK, SK hynix PC400 512 GB
3684 Points +4%
Razer Blade 15 Studio Edition
Quadro RTX 5000 Max-Q, i7-9750H, Samsung SSD PM981 MZVLB1T0HALR
3551 Points
Gemiddeld Intel Core i7-9750H, NVIDIA Quadro RTX 5000 Max-Q
  (3524 - 3551, n=2)
3538 Points 0%
MSI P65 Creator 9SF-657
GeForce RTX 2070 Max-Q, i9-9880H, 2x Samsung SSD PM981 MZVLB512HAJQ (RAID 0)
3505 Points -1%
HP ZBook Studio G5-4QH10EA
Quadro P1000, i7-8750H, Samsung SSD PM981 MZVLB512HAJQ
3433 Points -3%
Work Score Accelerated v2
Razer Blade 15 RTX 2080 Max-Q
GeForce RTX 2080 Max-Q, i7-9750H, Samsung SSD PM981 MZVLB512HAJQ
5749 Points +29%
Fujitsu Celsius H780
Quadro P2000, i7-8850H, Samsung SSD PM981 MZVLB512HAJQ
5256 Points +18%
Dell Precision 5540
Quadro T2000 Max-Q, i9-9980HK, SK hynix PC400 512 GB
4558 Points +2%
MSI P65 Creator 9SF-657
GeForce RTX 2070 Max-Q, i9-9880H, 2x Samsung SSD PM981 MZVLB512HAJQ (RAID 0)
4482 Points +1%
Razer Blade 15 Studio Edition
Quadro RTX 5000 Max-Q, i7-9750H, Samsung SSD PM981 MZVLB1T0HALR
4454 Points
HP ZBook Studio G5-4QH10EA
Quadro P1000, i7-8750H, Samsung SSD PM981 MZVLB512HAJQ
4453 Points 0%
Gemiddeld Intel Core i7-9750H, NVIDIA Quadro RTX 5000 Max-Q
  (4436 - 4454, n=2)
4445 Points 0%
Samsung SSD PM981 MZVLB1T0HALR
Sequential Read: 1308 MB/s
Sequential Write: 1586 MB/s
512K Read: 1039 MB/s
512K Write: 744 MB/s
4K Read: 60.1 MB/s
4K Write: 120.9 MB/s
4K QD32 Read: 605 MB/s
4K QD32 Write: 532 MB/s
Razer Blade 15 Studio Edition
Samsung SSD PM981 MZVLB1T0HALR
Razer Blade 15 RTX 2080 Max-Q
Samsung SSD PM981 MZVLB512HAJQ
Lenovo ThinkPad P53-20QN000YGE
Samsung PM981a MZVLB1T0HBLR
MSI P65 Creator 9SF-657
2x Samsung SSD PM981 MZVLB512HAJQ (RAID 0)
Dell Precision 5540
SK hynix PC400 512 GB
Fujitsu Celsius H780
Samsung SSD PM981 MZVLB512HAJQ
HP ZBook Studio G5-4QH10EA
Samsung SSD PM981 MZVLB512HAJQ
Gemiddeld Samsung SSD PM981 MZVLB1T0HALR
 
CrystalDiskMark 5.2 / 6
16%
26%
56%
-4%
-2%
-4%
25%
Write 4K
100.4
137.2
37%
147
46%
105.6
5%
98
-2%
98.3
-2%
102.7
2%
165.7 ?(92.4 - 1107, n=25)
65%
Read 4K
42.03
46.82
11%
48.3
15%
46.32
10%
41.25
-2%
40.18
-4%
38.32
-9%
Write Seq
1185
1221
3%
1402
18%
2910
146%
1295
9%
1777
50%
1417
20%
Read Seq
1132
1217
8%
1503
33%
2820
149%
1441
27%
1247
10%
1289
14%
Write 4K Q32T1
371.4
527
42%
475.2
28%
545
47%
429.2
16%
344.7
-7%
278.9
-25%
Read 4K Q32T1
422.6
614
45%
581
37%
632
50%
400.1
-5%
383.1
-9%
348.8
-17%
Write Seq Q32T1
2379
1986
-17%
2936
23%
3349
41%
1366
-43%
2019
-15%
1895
-20%
Read Seq Q32T1
3222
3234
0%
3539
10%
3333
3%
2201
-32%
2076
-36%
3352
4%
3DMark Vantage P Result
52289 punten
3DMark 11 Performance
19787 punten
3DMark Ice Storm Standard Score
66054 punten
3DMark Cloud Gate Standard Score
25769 punten
3DMark Fire Strike Score
16320 punten
3DMark Time Spy Score
6801 punten
Help
3DMark 11 - 1280x720 Performance GPU
Razer Blade 15 RTX 2080 Max-Q
NVIDIA GeForce RTX 2080 Max-Q, Intel Core i7-9750H
27762 Points +5%
Gemiddeld NVIDIA Quadro RTX 5000 Max-Q
  (24156 - 28524, n=9)
26602 Points +1%
Razer Blade 15 Studio Edition
NVIDIA Quadro RTX 5000 Max-Q, Intel Core i7-9750H
26465 Points
Lenovo ThinkPad P53-20QN000YGE
NVIDIA Quadro RTX 5000 Max-Q, Intel Core i7-9850H
24156 Points -9%
Gemiddelde van klas Workstation
  (7432 - 54334, n=27, laatste 2 jaar)
23492 Points -11%
MSI P65 Creator 9SF-657
NVIDIA GeForce RTX 2070 Max-Q, Intel Core i9-9880H
20837 Points -21%
Dell Precision 5540
NVIDIA Quadro T2000 Max-Q, Intel Core i9-9980HK
11468 Points -57%
Fujitsu Celsius H780
NVIDIA Quadro P2000, Intel Core i7-8850H
8573 Points -68%
HP ZBook Studio G5-4QH10EA
NVIDIA Quadro P1000, Intel Core i7-8750H
5982 Points -77%
3DMark
1280x720 Cloud Gate Standard Graphics
Lenovo ThinkPad P53-20QN000YGE
NVIDIA Quadro RTX 5000 Max-Q, Intel Core i7-9850H
116912 Points +81%
Razer Blade 15 RTX 2080 Max-Q
NVIDIA GeForce RTX 2080 Max-Q, Intel Core i7-9750H
115893 Points +79%
Gemiddeld NVIDIA Quadro RTX 5000 Max-Q
  (50993 - 126073, n=7)
78524 Points +21%
MSI P65 Creator 9SF-657
NVIDIA GeForce RTX 2070 Max-Q, Intel Core i9-9880H
65859 Points +2%
Razer Blade 15 Studio Edition
NVIDIA Quadro RTX 5000 Max-Q, Intel Core i7-9750H
64768 Points
Gemiddelde van klas Workstation
  (32743 - 133204, n=14, laatste 2 jaar)
63450 Points -2%
Fujitsu Celsius H780
NVIDIA Quadro P2000, Intel Core i7-8850H
44533 Points -31%
Dell Precision 5540
NVIDIA Quadro T2000 Max-Q, Intel Core i9-9980HK
42409 Points -35%
HP ZBook Studio G5-4QH10EA
NVIDIA Quadro P1000, Intel Core i7-8750H
21391 Points -67%
1920x1080 Fire Strike Graphics
Razer Blade 15 Studio Edition
NVIDIA Quadro RTX 5000 Max-Q, Intel Core i7-9750H (Max. GPU)
20913 Points +6%
Razer Blade 15 RTX 2080 Max-Q
NVIDIA GeForce RTX 2080 Max-Q, Intel Core i7-9750H
20718 Points +5%
Gemiddeld NVIDIA Quadro RTX 5000 Max-Q
  (18247 - 21115, n=10)
19825 Points 0%
Razer Blade 15 Studio Edition
NVIDIA Quadro RTX 5000 Max-Q, Intel Core i7-9750H
19821 Points
Lenovo ThinkPad P53-20QN000YGE
NVIDIA Quadro RTX 5000 Max-Q, Intel Core i7-9850H
18247 Points -8%
Gemiddelde van klas Workstation
  (4816 - 35868, n=27, laatste 2 jaar)
16582 Points -16%
MSI P65 Creator 9SF-657
NVIDIA GeForce RTX 2070 Max-Q, Intel Core i9-9880H
16100 Points -19%
Dell Precision 5540
NVIDIA Quadro T2000 Max-Q, Intel Core i9-9980HK
8107 Points -59%
Fujitsu Celsius H780
NVIDIA Quadro P2000, Intel Core i7-8850H
6953 Points -65%
HP ZBook Studio G5-4QH10EA
NVIDIA Quadro P1000, Intel Core i7-8750H
4756 Points -76%
2560x1440 Time Spy Graphics
Razer Blade 15 RTX 2080 Max-Q
NVIDIA GeForce RTX 2080 Max-Q, Intel Core i7-9750H
7840 Points +10%
Razer Blade 15 Studio Edition
NVIDIA Quadro RTX 5000 Max-Q, Intel Core i7-9750H (Max. GPU)
7734 Points +8%
Gemiddeld NVIDIA Quadro RTX 5000 Max-Q
  (6999 - 7977, n=10)
7432 Points +4%
Razer Blade 15 Studio Edition
NVIDIA Quadro RTX 5000 Max-Q, Intel Core i7-9750H
7153 Points
Lenovo ThinkPad P53-20QN000YGE
NVIDIA Quadro RTX 5000 Max-Q, Intel Core i7-9850H
6999 Points -2%
Gemiddelde van klas Workstation
  (1882 - 16218, n=27, laatste 2 jaar)
6506 Points -9%
Dell Precision 5540
NVIDIA Quadro T2000 Max-Q, Intel Core i9-9980HK
3066 Points -57%
HP ZBook Studio G5-4QH10EA
NVIDIA Quadro P1000, Intel Core i7-8750H
1395 Points -80%
SPECviewperf 12
1900x1060 Solidworks (sw-03)
Gemiddelde van klas Workstation
  (88.8 - 225, n=10, laatste 2 jaar)
162.2 fps +52%
Gemiddeld NVIDIA Quadro RTX 5000 Max-Q
  (106.8 - 156.9, n=8)
125.7 fps +18%
Lenovo ThinkPad P53-20QN000YGE
NVIDIA Quadro RTX 5000 Max-Q, Intel Core i7-9850H
112.5 fps +5%
Razer Blade 15 Studio Edition
NVIDIA Quadro RTX 5000 Max-Q, Intel Core i7-9750H (Max. CPU, max. GPU)
109.7 fps +3%
Razer Blade 15 Studio Edition
NVIDIA Quadro RTX 5000 Max-Q, Intel Core i7-9750H
106.8 fps
Fujitsu Celsius H780
NVIDIA Quadro P2000, Intel Core i7-8850H
104 fps -3%
Dell Precision 5540
NVIDIA Quadro T2000 Max-Q, Intel Core i9-9980HK
100.8 fps -6%
HP ZBook Studio G5-4QH10EA
NVIDIA Quadro P1000, Intel Core i7-8750H
75.2 fps -30%
1900x1060 Siemens NX (snx-02)
Gemiddelde van klas Workstation
  (27.2 - 309, n=10, laatste 2 jaar)
170 fps +14%
Razer Blade 15 Studio Edition
NVIDIA Quadro RTX 5000 Max-Q, Intel Core i7-9750H (Max. CPU, max. GPU)
151.3 fps +1%
Razer Blade 15 Studio Edition
NVIDIA Quadro RTX 5000 Max-Q, Intel Core i7-9750H
149.2 fps
Gemiddeld NVIDIA Quadro RTX 5000 Max-Q
  (120.7 - 165, n=8)
139.8 fps -6%
Lenovo ThinkPad P53-20QN000YGE
NVIDIA Quadro RTX 5000 Max-Q, Intel Core i7-9850H
127.2 fps -15%
Dell Precision 5540
NVIDIA Quadro T2000 Max-Q, Intel Core i9-9980HK
74.6 fps -50%
Fujitsu Celsius H780
NVIDIA Quadro P2000, Intel Core i7-8850H
67.6 fps -55%
HP ZBook Studio G5-4QH10EA
NVIDIA Quadro P1000, Intel Core i7-8750H
55.7 fps -63%
1900x1060 Showcase (showcase-01)
Gemiddelde van klas Workstation
  (30.5 - 172.5, n=10, laatste 2 jaar)
115.5 fps +22%
Razer Blade 15 Studio Edition
NVIDIA Quadro RTX 5000 Max-Q, Intel Core i7-9750H (Max. CPU, max. GPU)
98.1 fps +3%
Gemiddeld NVIDIA Quadro RTX 5000 Max-Q
  (89 - 100.3, n=8)
95.8 fps +1%
Razer Blade 15 Studio Edition
NVIDIA Quadro RTX 5000 Max-Q, Intel Core i7-9750H
94.9 fps
Lenovo ThinkPad P53-20QN000YGE
NVIDIA Quadro RTX 5000 Max-Q, Intel Core i7-9850H
92.6 fps -2%
Dell Precision 5540
NVIDIA Quadro T2000 Max-Q, Intel Core i9-9980HK
37.81 fps -60%
Fujitsu Celsius H780
NVIDIA Quadro P2000, Intel Core i7-8850H
30.42 fps -68%
HP ZBook Studio G5-4QH10EA
NVIDIA Quadro P1000, Intel Core i7-8750H
27.42 fps -71%
1900x1060 Medical (medical-01)
Gemiddelde van klas Workstation
  (29.5 - 136.7, n=9, laatste 2 jaar)
84.5 fps +36%
Razer Blade 15 Studio Edition
NVIDIA Quadro RTX 5000 Max-Q, Intel Core i7-9750H (Max. CPU, max. GPU)
65 fps +5%
Gemiddeld NVIDIA Quadro RTX 5000 Max-Q
  (57.8 - 66.4, n=8)
62.6 fps +1%
Razer Blade 15 Studio Edition
NVIDIA Quadro RTX 5000 Max-Q, Intel Core i7-9750H
62.1 fps
Lenovo ThinkPad P53-20QN000YGE
NVIDIA Quadro RTX 5000 Max-Q, Intel Core i7-9850H
58.4 fps -6%
Dell Precision 5540
NVIDIA Quadro T2000 Max-Q, Intel Core i9-9980HK
35.53 fps -43%
Fujitsu Celsius H780
NVIDIA Quadro P2000, Intel Core i7-8850H
23.11 fps -63%
HP ZBook Studio G5-4QH10EA
NVIDIA Quadro P1000, Intel Core i7-8750H
14.89 fps -76%
1900x1060 Maya (maya-04)
Gemiddelde van klas Workstation
  (62.9 - 232, n=10, laatste 2 jaar)
144.2 fps +66%
Razer Blade 15 Studio Edition
NVIDIA Quadro RTX 5000 Max-Q, Intel Core i7-9750H (Max. CPU, max. GPU)
87.2 fps 0%
Razer Blade 15 Studio Edition
NVIDIA Quadro RTX 5000 Max-Q, Intel Core i7-9750H
86.8 fps
Gemiddeld NVIDIA Quadro RTX 5000 Max-Q
  (70.3 - 105.4, n=8)
83.4 fps -4%
Lenovo ThinkPad P53-20QN000YGE
NVIDIA Quadro RTX 5000 Max-Q, Intel Core i7-9850H
74.8 fps -14%
Fujitsu Celsius H780
NVIDIA Quadro P2000, Intel Core i7-8850H
60.3 fps -31%
Dell Precision 5540
NVIDIA Quadro T2000 Max-Q, Intel Core i9-9980HK
51 fps -41%
HP ZBook Studio G5-4QH10EA
NVIDIA Quadro P1000, Intel Core i7-8750H
36.99 fps -57%
1900x1060 Energy (energy-01)
Gemiddelde van klas Workstation
  (8.45 - 31.5, n=8, laatste 2 jaar)
20.4 fps +43%
Razer Blade 15 Studio Edition
NVIDIA Quadro RTX 5000 Max-Q, Intel Core i7-9750H (Max. CPU, max. GPU)
16.1 fps +13%
Gemiddeld NVIDIA Quadro RTX 5000 Max-Q
  (13.3 - 16.1, n=8)
14.5 fps +2%
Razer Blade 15 Studio Edition
NVIDIA Quadro RTX 5000 Max-Q, Intel Core i7-9750H
14.23 fps
Lenovo ThinkPad P53-20QN000YGE
NVIDIA Quadro RTX 5000 Max-Q, Intel Core i7-9850H
13.3 fps -7%
Dell Precision 5540
NVIDIA Quadro T2000 Max-Q, Intel Core i9-9980HK
7.79 fps -45%
Fujitsu Celsius H780
NVIDIA Quadro P2000, Intel Core i7-8850H
5.62 fps -61%
HP ZBook Studio G5-4QH10EA
NVIDIA Quadro P1000, Intel Core i7-8750H
3.66 fps -74%
1900x1060 Creo (creo-01)
Gemiddelde van klas Workstation
  (86.9 - 204, n=9, laatste 2 jaar)
153.8 fps +30%
Lenovo ThinkPad P53-20QN000YGE
NVIDIA Quadro RTX 5000 Max-Q, Intel Core i7-9850H
127.7 fps +8%
Gemiddeld NVIDIA Quadro RTX 5000 Max-Q
  (114.1 - 145.1, n=8)
127 fps +7%
Razer Blade 15 Studio Edition
NVIDIA Quadro RTX 5000 Max-Q, Intel Core i7-9750H (Max. CPU, max. GPU)
120.6 fps +2%
Razer Blade 15 Studio Edition
NVIDIA Quadro RTX 5000 Max-Q, Intel Core i7-9750H
118.5 fps
Dell Precision 5540
NVIDIA Quadro T2000 Max-Q, Intel Core i9-9980HK
88.3 fps -25%
Fujitsu Celsius H780
NVIDIA Quadro P2000, Intel Core i7-8850H
65.2 fps -45%
HP ZBook Studio G5-4QH10EA
NVIDIA Quadro P1000, Intel Core i7-8750H
51.2 fps -57%
1900x1060 Catia (catia-04)
Gemiddelde van klas Workstation
  (73.8 - 268, n=10, laatste 2 jaar)
183.1 fps +49%
Gemiddeld NVIDIA Quadro RTX 5000 Max-Q
  (113.1 - 154.9, n=8)
126.4 fps +3%
Razer Blade 15 Studio Edition
NVIDIA Quadro RTX 5000 Max-Q, Intel Core i7-9750H (Max. CPU, max. GPU)
124.1 fps +1%
Razer Blade 15 Studio Edition
NVIDIA Quadro RTX 5000 Max-Q, Intel Core i7-9750H
123 fps
Lenovo ThinkPad P53-20QN000YGE
NVIDIA Quadro RTX 5000 Max-Q, Intel Core i7-9850H
118.4 fps -4%
Dell Precision 5540
NVIDIA Quadro T2000 Max-Q, Intel Core i9-9980HK
88.9 fps -28%
Fujitsu Celsius H780
NVIDIA Quadro P2000, Intel Core i7-8850H
70.8 fps -42%
HP ZBook Studio G5-4QH10EA
NVIDIA Quadro P1000, Intel Core i7-8750H
54 fps -56%
1900x1060 3ds Max (3dsmax-05)
Razer Blade 15 Studio Edition
NVIDIA Quadro RTX 5000 Max-Q, Intel Core i7-9750H (Max. CPU, max. GPU)
184.3 fps +4%
Razer Blade 15 Studio Edition
NVIDIA Quadro RTX 5000 Max-Q, Intel Core i7-9750H
177.6 fps
Gemiddeld NVIDIA Quadro RTX 5000 Max-Q
  (158.9 - 184.3, n=4)
176.3 fps -1%
Dell Precision 5540
NVIDIA Quadro T2000 Max-Q, Intel Core i9-9980HK
93.7 fps -47%
Gemiddelde van klas Workstation
  (laatste 2 jaar)
77.9 fps -56%
Fujitsu Celsius H780
NVIDIA Quadro P2000, Intel Core i7-8850H
71.9 fps -60%
HP ZBook Studio G5-4QH10EA
NVIDIA Quadro P1000, Intel Core i7-8750H
50.8 fps -71%
SPECviewperf 13
Solidworks (sw-04)
Gemiddelde van klas Workstation
  (91.8 - 227, n=26, laatste 2 jaar)
152.1 fps +26%
Gemiddeld NVIDIA Quadro RTX 5000 Max-Q
  (119.7 - 158.9, n=8)
135.3 fps +12%
Lenovo ThinkPad P53-20QN000YGE
NVIDIA Quadro RTX 5000 Max-Q, Intel Core i7-9850H
129.6 fps +7%
Razer Blade 15 Studio Edition
NVIDIA Quadro RTX 5000 Max-Q, Intel Core i7-9750H (Max. CPU, max. GPU)
122.2 fps +1%
Razer Blade 15 Studio Edition
NVIDIA Quadro RTX 5000 Max-Q, Intel Core i7-9750H
120.9 fps
Dell Precision 5540
NVIDIA Quadro T2000 Max-Q, Intel Core i9-9980HK
97.2 fps -20%
Fujitsu Celsius H780
NVIDIA Quadro P2000, Intel Core i7-8850H
96.1 fps -21%
HP ZBook Studio G5-4QH10EA
NVIDIA Quadro P1000, Intel Core i7-8750H
76.6 fps -37%
Siemens NX (snx-03)
Razer Blade 15 Studio Edition
NVIDIA Quadro RTX 5000 Max-Q, Intel Core i7-9750H (Max. CPU, max. GPU)
305.5 fps +9%
Gemiddeld NVIDIA Quadro RTX 5000 Max-Q
  (244 - 306, n=8)
287 fps +2%
Lenovo ThinkPad P53-20QN000YGE
NVIDIA Quadro RTX 5000 Max-Q, Intel Core i7-9850H
286.7 fps +2%
Razer Blade 15 Studio Edition
NVIDIA Quadro RTX 5000 Max-Q, Intel Core i7-9750H
280.2 fps
Gemiddelde van klas Workstation
  (48.9 - 551, n=26, laatste 2 jaar)
242 fps -14%
Dell Precision 5540
NVIDIA Quadro T2000 Max-Q, Intel Core i9-9980HK
143.8 fps -49%
Fujitsu Celsius H780
NVIDIA Quadro P2000, Intel Core i7-8850H
121.9 fps -56%
HP ZBook Studio G5-4QH10EA
NVIDIA Quadro P1000, Intel Core i7-8750H
102.6 fps -63%
Showcase (showcase-02)
Razer Blade 15 Studio Edition
NVIDIA Quadro RTX 5000 Max-Q, Intel Core i7-9750H (Max. CPU, max. GPU)
97.3 fps +3%
Gemiddeld NVIDIA Quadro RTX 5000 Max-Q
  (89.2 - 98.7, n=8)
95.2 fps +1%
Razer Blade 15 Studio Edition
NVIDIA Quadro RTX 5000 Max-Q, Intel Core i7-9750H
94.6 fps
Lenovo ThinkPad P53-20QN000YGE
NVIDIA Quadro RTX 5000 Max-Q, Intel Core i7-9850H
93.4 fps -1%
Gemiddelde van klas Workstation
  (24.8 - 190.3, n=26, laatste 2 jaar)
82.2 fps -13%
Dell Precision 5540
NVIDIA Quadro T2000 Max-Q, Intel Core i9-9980HK
37.56 fps -60%
Fujitsu Celsius H780
NVIDIA Quadro P2000, Intel Core i7-8850H
30.26 fps -68%
HP ZBook Studio G5-4QH10EA
NVIDIA Quadro P1000, Intel Core i7-8750H
27.23 fps -71%
Medical (medical-02)
Gemiddelde van klas Workstation
  (34.5 - 176.2, n=26, laatste 2 jaar)
91.1 fps +15%
Gemiddeld NVIDIA Quadro RTX 5000 Max-Q
  (79 - 102.5, n=8)
89.8 fps +13%
Razer Blade 15 Studio Edition
NVIDIA Quadro RTX 5000 Max-Q, Intel Core i7-9750H (Max. CPU, max. GPU)
81.3 fps +3%
Razer Blade 15 Studio Edition
NVIDIA Quadro RTX 5000 Max-Q, Intel Core i7-9750H
79.3 fps
Lenovo ThinkPad P53-20QN000YGE
NVIDIA Quadro RTX 5000 Max-Q, Intel Core i7-9850H
79 fps 0%
Dell Precision 5540
NVIDIA Quadro T2000 Max-Q, Intel Core i9-9980HK
41.71 fps -47%
Fujitsu Celsius H780
NVIDIA Quadro P2000, Intel Core i7-8850H
18.47 fps -77%
HP ZBook Studio G5-4QH10EA
NVIDIA Quadro P1000, Intel Core i7-8750H
13.58 fps -83%
Maya (maya-05)
Gemiddelde van klas Workstation
  (77.5 - 449, n=26, laatste 2 jaar)
220 fps +8%
Razer Blade 15 Studio Edition
NVIDIA Quadro RTX 5000 Max-Q, Intel Core i7-9750H (Max. CPU, max. GPU)
207.1 fps +2%
Gemiddeld NVIDIA Quadro RTX 5000 Max-Q
  (179.5 - 231, n=8)
206 fps +1%
Lenovo ThinkPad P53-20QN000YGE
NVIDIA Quadro RTX 5000 Max-Q, Intel Core i7-9850H
204.8 fps +1%
Razer Blade 15 Studio Edition
NVIDIA Quadro RTX 5000 Max-Q, Intel Core i7-9750H
203.6 fps
Dell Precision 5540
NVIDIA Quadro T2000 Max-Q, Intel Core i9-9980HK
105.7 fps -48%
Fujitsu Celsius H780
NVIDIA Quadro P2000, Intel Core i7-8850H
89.3 fps -56%
HP ZBook Studio G5-4QH10EA
NVIDIA Quadro P1000, Intel Core i7-8750H
71 fps -65%
Energy (energy-02)
Gemiddelde van klas Workstation
  (7.71 - 109.7, n=26, laatste 2 jaar)
41.3 fps +13%
Razer Blade 15 Studio Edition
NVIDIA Quadro RTX 5000 Max-Q, Intel Core i7-9750H (Max. CPU, max. GPU)
38 fps +4%
Gemiddeld NVIDIA Quadro RTX 5000 Max-Q
  (35.4 - 39.9, n=8)
37.3 fps +2%
Razer Blade 15 Studio Edition
NVIDIA Quadro RTX 5000 Max-Q, Intel Core i7-9750H
36.5 fps
Lenovo ThinkPad P53-20QN000YGE
NVIDIA Quadro RTX 5000 Max-Q, Intel Core i7-9850H
36.15 fps -1%
Dell Precision 5540
NVIDIA Quadro T2000 Max-Q, Intel Core i9-9980HK
14.87 fps -59%
Fujitsu Celsius H780
NVIDIA Quadro P2000, Intel Core i7-8850H
5.28 fps -86%
HP ZBook Studio G5-4QH10EA
NVIDIA Quadro P1000, Intel Core i7-8750H
3.28 fps -91%
Creo (creo-02)
Gemiddeld NVIDIA Quadro RTX 5000 Max-Q
  (181.9 - 238, n=8)
218 fps +3%
Razer Blade 15 Studio Edition
NVIDIA Quadro RTX 5000 Max-Q, Intel Core i7-9750H (Max. CPU, max. GPU)
217.9 fps +3%
Lenovo ThinkPad P53-20QN000YGE
NVIDIA Quadro RTX 5000 Max-Q, Intel Core i7-9850H
212.3 fps 0%
Razer Blade 15 Studio Edition
NVIDIA Quadro RTX 5000 Max-Q, Intel Core i7-9750H
211.4 fps
Gemiddelde van klas Workstation
  (76.8 - 398, n=25, laatste 2 jaar)
205 fps -3%
Dell Precision 5540
NVIDIA Quadro T2000 Max-Q, Intel Core i9-9980HK
109.6 fps -48%
Fujitsu Celsius H780
NVIDIA Quadro P2000, Intel Core i7-8850H
82.1 fps -61%
HP ZBook Studio G5-4QH10EA
NVIDIA Quadro P1000, Intel Core i7-8750H
66.9 fps -68%
Catia (catia-05)
Gemiddelde van klas Workstation
  (99.5 - 409, n=26, laatste 2 jaar)
231 fps +11%
Gemiddeld NVIDIA Quadro RTX 5000 Max-Q
  (186.9 - 260, n=8)
222 fps +7%
Lenovo ThinkPad P53-20QN000YGE
NVIDIA Quadro RTX 5000 Max-Q, Intel Core i7-9850H
215.7 fps +4%
Razer Blade 15 Studio Edition
NVIDIA Quadro RTX 5000 Max-Q, Intel Core i7-9750H (Max. CPU, max. GPU)
213.4 fps +3%
Razer Blade 15 Studio Edition
NVIDIA Quadro RTX 5000 Max-Q, Intel Core i7-9750H
207.8 fps
Dell Precision 5540
NVIDIA Quadro T2000 Max-Q, Intel Core i9-9980HK
134.6 fps -35%
Fujitsu Celsius H780
NVIDIA Quadro P2000, Intel Core i7-8850H
104 fps -50%
HP ZBook Studio G5-4QH10EA
NVIDIA Quadro P1000, Intel Core i7-8750H
78.1 fps -62%
3ds Max (3dsmax-06)
Razer Blade 15 Studio Edition
NVIDIA Quadro RTX 5000 Max-Q, Intel Core i7-9750H (Max. CPU, max. GPU)
181.8 fps +4%
Gemiddeld NVIDIA Quadro RTX 5000 Max-Q
  (157.3 - 181.8, n=8)
174.8 fps 0%
Razer Blade 15 Studio Edition
NVIDIA Quadro RTX 5000 Max-Q, Intel Core i7-9750H
174.2 fps
Lenovo ThinkPad P53-20QN000YGE
NVIDIA Quadro RTX 5000 Max-Q, Intel Core i7-9850H
172.7 fps -1%
Gemiddelde van klas Workstation
  (61.6 - 284, n=25, laatste 2 jaar)
155.6 fps -11%
Dell Precision 5540
NVIDIA Quadro T2000 Max-Q, Intel Core i9-9980HK
93.3 fps -46%
Fujitsu Celsius H780
NVIDIA Quadro P2000, Intel Core i7-8850H
71.7 fps -59%
HP ZBook Studio G5-4QH10EA
NVIDIA Quadro P1000, Intel Core i7-8750H
50.7 fps -71%
The Witcher 3 - 1920x1080 Ultra Graphics & Postprocessing (HBAO+)
Razer Blade 15 Studio Edition
Intel Core i7-9750H, NVIDIA Quadro RTX 5000 Max-Q (Max. CPU, max. GPU)
88.5 fps +6%
Razer Blade 15 Studio Edition
Intel Core i7-9750H, NVIDIA Quadro RTX 5000 Max-Q
83.3 fps
Gemiddeld NVIDIA Quadro RTX 5000 Max-Q
  (71 - 88.5, n=10)
81.9 fps -2%
MSI P65 Creator 9SF-657
Intel Core i9-9880H, NVIDIA GeForce RTX 2070 Max-Q
80.8 fps -3%
Razer Blade 15 RTX 2080 Max-Q
Intel Core i7-9750H, NVIDIA GeForce RTX 2080 Max-Q
78.3 fps -6%
Lenovo ThinkPad P53-20QN000YGE
Intel Core i7-9850H, NVIDIA Quadro RTX 5000 Max-Q
71 (67min, 67P1 - 74max) fps -15%
Gemiddelde van klas Workstation
  (19.6 - 156.5, n=28, laatste 2 jaar)
62.8 fps -25%
Dell Precision 5540
Intel Core i9-9980HK, NVIDIA Quadro T2000 Max-Q
32.4 (30min, 31P1 - 34max) fps -61%
Fujitsu Celsius H780
Intel Core i7-8850H, NVIDIA Quadro P2000
24.3 fps -71%
HP ZBook Studio G5-4QH10EA
Intel Core i7-8750H, NVIDIA Quadro P1000
16.1 fps -81%
BioShock Infinite - 1920x1080 Ultra Preset, DX11 (DDOF)
Razer Blade 15 RTX 2080 Max-Q
Intel Core i7-9750H, NVIDIA GeForce RTX 2080 Max-Q
170 fps +2%
Gemiddeld NVIDIA Quadro RTX 5000 Max-Q
  (167.2 - 174.3, n=3)
170 fps +2%
Razer Blade 15 Studio Edition
Intel Core i7-9750H, NVIDIA Quadro RTX 5000 Max-Q
167.2 fps
MSI P65 Creator 9SF-657
Intel Core i9-9880H, NVIDIA GeForce RTX 2070 Max-Q
148.8 fps -11%
Dell Precision 5540
Intel Core i9-9980HK, NVIDIA Quadro T2000 Max-Q
79.5 fps -52%
HP ZBook Studio G5-4QH10EA
Intel Core i7-8750H, NVIDIA Quadro P1000
51 fps -69%
Dirt Rally 2.0 - 1920x1080 Ultra Preset AA:T AF:16x
Razer Blade 15 Studio Edition
Intel Core i7-9750H, NVIDIA Quadro RTX 5000 Max-Q
90.7 fps
Gemiddeld NVIDIA Quadro RTX 5000 Max-Q
  (89.3 - 90.7, n=2)
90 fps -1%
Lenovo ThinkPad P53-20QN000YGE
Intel Core i7-9850H, NVIDIA Quadro RTX 5000 Max-Q
89.3 fps -2%
Total War: Three Kingdoms - 1920x1080 Ultra (incl textures)
Razer Blade 15 Studio Edition
Intel Core i7-9750H, NVIDIA Quadro RTX 5000 Max-Q
64.9 (57min - 77max) fps
Gemiddeld NVIDIA Quadro RTX 5000 Max-Q
  (57.5 - 64.9, n=2)
61.2 fps -6%
The Division 2 - 1920x1080 Ultra Preset
Razer Blade 15 Studio Edition
Intel Core i7-9750H, NVIDIA Quadro RTX 5000 Max-Q
56 fps
Gemiddeld NVIDIA Quadro RTX 5000 Max-Q
  ()
56 fps 0%
Anno 1800 - 1920x1080 Ultra Graphics Quality (DX11)
Lenovo ThinkPad P53-20QN000YGE
Intel Core i7-9850H, NVIDIA Quadro RTX 5000 Max-Q
38.9 fps +4%
Gemiddeld NVIDIA Quadro RTX 5000 Max-Q
  (37.4 - 38.9, n=2)
38.2 fps +2%
Razer Blade 15 Studio Edition
Intel Core i7-9750H, NVIDIA Quadro RTX 5000 Max-Q
37.4 fps
05101520253035404550556065707580Tooltip
Razer Blade 15 Studio Edition Quadro RTX 5000 Max-Q, i7-9750H, Samsung SSD PM981 MZVLB1T0HALR: Ø72.5 (67-79)
Razer Blade 15 RTX 2080 Max-Q GeForce RTX 2080 Max-Q, i7-9750H, Samsung SSD PM981 MZVLB512HAJQ: Ø72.8 (68-80)
Lenovo ThinkPad P53-20QN000YGE Quadro RTX 5000 Max-Q, i7-9850H, Samsung PM981a MZVLB1T0HBLR: Ø70.6 (67-74)
MSI P65 Creator 9SF-657 GeForce RTX 2070 Max-Q, i9-9880H, 2x Samsung SSD PM981 MZVLB512HAJQ (RAID 0): Ø76.3 (71-83)
Dell Precision 5540 Quadro T2000 Max-Q, i9-9980HK, SK hynix PC400 512 GB: Ø32.4 (30-34)
HP ZBook Studio G5-4QH10EA Quadro P1000, i7-8750H, Samsung SSD PM981 MZVLB512HAJQ: Ø16.1 (15-17)
Razer Blade 15 Studio Edition Quadro RTX 5000 Max-Q, i7-9750H; Max. CPU, max. GPU: Ø75.5 (66-83)
GPU measurements during our The Witcher 3 test
GPU measurements during our The Witcher 3 test (maximum CPU & GPU performance)
lage gem. hoge ultraQHD4K
BioShock Infinite (2013) 320.5 283.2 265 167.2
GTA V (2015) 169.1 163.4 132.3 72 89.1
The Witcher 3 (2015) 286.9 229.5 144.8 83.3 49.2
Rainbow Six Siege (2015) 254.8 226.7 191.8 183.4 86.9
Ashes of the Singularity (2016) 84.4 77.7 75.4 42.3
For Honor (2017) 246.1 162.1 156 123.2 48.1
Ghost Recon Wildlands (2017) 130.4 91.9 85.7 58.7 38.6
Middle-earth: Shadow of War (2017) 113 108 98 86 38
Final Fantasy XV Benchmark (2018) 87 82.3 65.8 30.6
X-Plane 11.11 (2018) 96.3 84.9 72.2 56.6
World of Tanks enCore (2018) 595 367.5 175.5 109.6 52.3
Assassin´s Creed Odyssey (2018) 95 80 75 54 47 30
Battlefield V (2018) 139.4 130.8 120.4 112.1 91.6 53.5
Apex Legends (2019) 144 144 144 142.8 104.9 53.4
Far Cry New Dawn (2019) 104 90 88 81 74 43
Metro Exodus (2019) 115.2 87.8 66.9 55.4 25.4 25.2
Dirt Rally 2.0 (2019) 241.2 169.4 153 90.7 70.2 39.8
The Division 2 (2019) 144 112 97 56 51 27
Anno 1800 (2019) 95.8 90.9 69.3 37.4 34.7 21.2
Rage 2 (2019) 224 114.8 96.4 94.3 59.4 28.7
Total War: Three Kingdoms (2019) 218.6 120.2 87.3 64.9 43.5 21.5
F1 2019 (2019) 192 165 131 118 86 56
Control (2019) 223.5 93.2 66.5 42.7 19.1
Borderlands 3 (2019) 118.8 99.9 78.4 62.5 42.9 22.8
Ghost Recon Breakpoint (2019) 117 96 92 68 49 28
GRID 2019 (2019) 131.5 107.8 96.2 87.2 62.7 38.6
Call of Duty Modern Warfare 2019 (2019) 185.2 130.6 103.6 91.8 65.2 35.2
Need for Speed Heat (2019) 92.3 84.4 77.5 72.1 65.4 36.9
Star Wars Jedi Fallen Order (2019) 88.5 83.1 80.4 64 33.5

Geluidsniveau

Onbelast
30.6 / 30.6 / 30.6 dB (A)
Belasting
43 / 41 dB (A)
  red to green bar
 
 
30 dB
stil
40 dB(A)
hoorbaar
50 dB(A)
luid
 
min: dark, med: mid, max: light   Audix TM1, Arta (15 cm afstand)   omgevingslawaai: 30.6 dB(A)
dB(A) 0102030405060708090Deep BassMiddle BassHigh BassLower RangeMidsHigher MidsLower HighsMid HighsUpper HighsSuper Highs2035.133.93129.635.12534.532.233.233.532.13131.534.633.935.435.84030.330.631.429.732.35030.429.228.530.733.96329.929.329.328.3348028.327.826.926.92810026.425.124.725.62912525.125.525.124.529.116026.127.724.423.927.120028.227.522.422.82825026.828.522.522.527.231528.730.721.621.928.940027.428.220.919.827.950026.427.52019.326.563025.426.319.118.425.980027.22918.619.127.4100028.830.518.418.329.1125029.83218.21830.5160030.933.41817.631.7200034.236.118.117.834.725003233.618.118.332.2315028.63218.218.128.9400025.628.718.518.326500024.126.618.718.524.9630021.122.918.818.622.7800019.920.618.818.521.11000019.219.618.718.720.11250018.918.918.618.519.41600018.718.718.618.519.2SPL4143.130.830.741.5N3.441.51.53.6median 26.4median 27.7median 18.7median 18.5median 27.4Delta2.73.71.71.83.1hearing rangehide median Fan NoiseRazer Blade 15 Studio Edition
Razer Blade 15 Studio Edition
i7-9750H, Quadro RTX 5000 Max-Q
Razer Blade 15 RTX 2080 Max-Q
i7-9750H, GeForce RTX 2080 Max-Q
Lenovo ThinkPad P53-20QN000YGE
i7-9850H, Quadro RTX 5000 Max-Q
MSI P65 Creator 9SF-657
i9-9880H, GeForce RTX 2070 Max-Q
Dell Precision 5540
i9-9980HK, Quadro T2000 Max-Q
Fujitsu Celsius H780
i7-8850H, Quadro P2000
HP ZBook Studio G5-4QH10EA
i7-8750H, Quadro P1000
Gemiddeld NVIDIA Quadro RTX 5000 Max-Q
 
Gemiddelde van klas Workstation
 
Noise
6%
12%
-4%
10%
-6%
5%
3%
12%
uit / omgeving *
30.6
28.3
8%
28.3
8%
30.2
1%
28.6
7%
29.6
3%
28.6
7%
Idle Minimum *
30.6
28.8
6%
28.3
8%
32.8
-7%
28.6
7%
29.6
3%
28.6
7%
28.7 ?(25.8 - 32, n=7)
6%
Idle Average *
30.6
28.8
6%
28.3
8%
32.8
-7%
28.6
7%
32.2
-5%
28.6
7%
28.7 ?(25.8 - 32, n=7)
6%
Idle Maximum *
30.6
29
5%
28.3
8%
33.6
-10%
28.6
7%
37
-21%
30
2%
28.7 ?(25.9 - 32, n=7)
6%
Load Average *
43
33.5
22%
29.8
31%
40.9
5%
33.3
23%
40.3
6%
38.1
11%
Load Maximum *
41
45.2
-10%
38.3
7%
42.7
-4%
38
7%
49.4
-20%
42.5
-4%
46.7 ?(38.3 - 59.7, n=7)
-14%
Witcher 3 ultra *
45
38.3
34.7
35

* ... kleiner is beter

Max. Belasting
 41 °C46.1 °C44 °C 
 35.7 °C41.6 °C38 °C 
 35.1 °C35.7 °C33.1 °C 
Maximum: 46.1 °C
Gemiddelde: 38.9 °C
37 °C45.2 °C38 °C
35.7 °C43.5 °C37.6 °C
34 °C39.6 °C37.2 °C
Maximum: 45.2 °C
Gemiddelde: 38.6 °C
Stroomadapter (max.)  38 °C | Kamertemperatuur 21.5 °C | FIRT 550-Pocket
(-) De gemiddelde temperatuur voor de bovenzijde bij maximale belasting bedraagt 38.9 °C / 102 F, vergeleken met het gemiddelde van 32 °C / ###class_avg_f## F voor de apparaten van de klasse Workstation.
(-) De maximumtemperatuur aan de bovenzijde bedraagt 46.1 °C / 115 F, vergeleken met het gemiddelde van 38.1 °C / 101 F, variërend van 22.2 tot 69.8 °C voor de klasse Workstation.
(-) De bodem warmt op tot een maximum van 45.2 °C / 113 F, vergeleken met een gemiddelde van 41.3 °C / 106 F
(+) Bij onbelast gebruik bedraagt de gemiddelde temperatuur voor de bovenzijde 27.9 °C / 82 F, vergeleken met het apparaatgemiddelde van 32 °C / 90 F.
(+) De handpalmsteunen en het touchpad bereiken maximaal de huidtemperatuur (35.7 °C / 96.3 F) en zijn dus niet heet.
(-) De gemiddelde temperatuur van de handpalmsteun van soortgelijke toestellen bedroeg 27.8 °C / 82 F (-7.9 °C / -14.3 F).
Razer Blade 15 Studio Edition
i7-9750H, Quadro RTX 5000 Max-Q
Razer Blade 15 RTX 2080 Max-Q
i7-9750H, GeForce RTX 2080 Max-Q
Lenovo ThinkPad P53-20QN000YGE
i7-9850H, Quadro RTX 5000 Max-Q
MSI P65 Creator 9SF-657
i9-9880H, GeForce RTX 2070 Max-Q
Dell Precision 5540
i9-9980HK, Quadro T2000 Max-Q
Fujitsu Celsius H780
i7-8850H, Quadro P2000
HP ZBook Studio G5-4QH10EA
i7-8750H, Quadro P1000
Gemiddeld NVIDIA Quadro RTX 5000 Max-Q
 
Gemiddelde van klas Workstation
 
Heat
-4%
13%
-10%
3%
8%
12%
-7%
-2%
Maximum Upper Side *
46.1
47
-2%
41.8
9%
49.7
-8%
46.2
-0%
43.7
5%
42.3
8%
Maximum Bottom *
45.2
49.2
-9%
46.1
-2%
60.4
-34%
45.7
-1%
45.3
-0%
43.1
5%
Idle Upper Side *
28.9
28.6
1%
22.2
23%
28.4
2%
27.4
5%
25.2
13%
24.2
16%
Idle Bottom *
29.6
31.4
-6%
23
22%
29.2
1%
27.8
6%
25.9
12%
24.7
17%
30.5 ?(23 - 34.8, n=7)
-3%

* ... kleiner is beter

dB(A) 0102030405060708090Deep BassMiddle BassHigh BassLower RangeMidsHigher MidsLower HighsMid HighsUpper HighsSuper Highs2036.729.636.72535.733.535.73131.635.431.64031.529.731.55031.330.731.36328.628.328.68027.226.927.210030.525.630.512534.724.534.716040.923.940.920040.422.840.425046.622.546.631554.621.954.640062.619.862.650061.119.361.16306218.46280065.319.165.3100067.518.367.5125065.31865.3160062.817.662.820006217.862250060.618.360.6315057.918.157.9400057.618.357.6500053.818.553.8630053.718.653.7800058.718.558.71000056.518.756.51250050.118.550.11600047.718.547.7SPL73.830.773.8N32.21.532.2median 57.6median 18.5median 57.6Delta81.8830.426.626.925.826.629.325.72524.425.32425.221.725.522.228.32230.522.640.521.451.720.254.92056.61961.218.459.117.758.717.263.51766.116.366.915.763.415.459.115.457.115.254.415.15415.251.515.453.215.352.715.249.715.142.114.93628.372.81.129.1median 16.3median 54.41.86.1hearing rangehide median Pink NoiseRazer Blade 15 Studio EditionLenovo ThinkPad P53-20QN000YGE
Frequentiediagram (selectievakjes kunnen worden aan- en uitgezet om toestellen te vergelijken)
Razer Blade 15 Studio Edition audioanalyse

(-) | niet erg luide luidsprekers (67.5 dB)
Bas 100 - 315 Hz
(-) | bijna geen lage tonen - gemiddeld 16.4% lager dan de mediaan
(±) | lineariteit van de lage tonen is gemiddeld (12.1% delta ten opzichte van de vorige frequentie)
Mids 400 - 2000 Hz
(±) | hogere middens - gemiddeld 5.9% hoger dan de mediaan
(+) | de middentonen zijn lineair (6.9% delta ten opzichte van de vorige frequentie)
Hoog 2 - 16 kHz
(+) | evenwichtige hoogtepunten - slechts 1.9% verwijderd van de mediaan
(+) | de hoge tonen zijn lineair (5.6% delta naar de vorige frequentie)
Algemeen 100 - 16.000 Hz
(±) | lineariteit van het totale geluid is gemiddeld (22.3% verschil met de mediaan)
Vergeleken met dezelfde klasse
» 77% van alle geteste apparaten in deze klasse waren beter, 3% vergelijkbaar, 20% slechter
» De beste had een delta van 7%, het gemiddelde was 18%, de slechtste was 35%
Vergeleken met alle geteste toestellen
» 60% van alle geteste apparaten waren beter, 7% gelijk, 34% slechter
» De beste had een delta van 4%, het gemiddelde was 25%, de slechtste was 134%

Lenovo ThinkPad P53-20QN000YGE audioanalyse

(±) | luidspreker luidheid is gemiddeld maar goed (72.8 dB)
Bas 100 - 315 Hz
(±) | verminderde zeebaars - gemiddeld 11.6% lager dan de mediaan
(±) | lineariteit van de lage tonen is gemiddeld (13.6% delta ten opzichte van de vorige frequentie)
Mids 400 - 2000 Hz
(±) | hogere middens - gemiddeld 7.8% hoger dan de mediaan
(±) | lineariteit van de middentonen is gemiddeld (7.5% delta ten opzichte van de vorige frequentie)
Hoog 2 - 16 kHz
(+) | evenwichtige hoogtepunten - slechts 1.9% verwijderd van de mediaan
(+) | de hoge tonen zijn lineair (4.8% delta naar de vorige frequentie)
Algemeen 100 - 16.000 Hz
(±) | lineariteit van het totale geluid is gemiddeld (23.1% verschil met de mediaan)
Vergeleken met dezelfde klasse
» 79% van alle geteste apparaten in deze klasse waren beter, 4% vergelijkbaar, 18% slechter
» De beste had een delta van 7%, het gemiddelde was 18%, de slechtste was 35%
Vergeleken met alle geteste toestellen
» 64% van alle geteste apparaten waren beter, 6% gelijk, 30% slechter
» De beste had een delta van 4%, het gemiddelde was 25%, de slechtste was 134%

Stroomgebruik
Uit / Standbydarklight 0.4 / 0.9 Watt
Inactiefdarkmidlight 13.2 / 15 / 17.4 Watt
Belasting midlight 99 / 148 Watt
 color bar
Key: min: dark, med: mid, max: light        Metrahit Energy
Currently we use the Metrahit Energy, a professional single phase power quality and energy measurement digital multimeter, for our measurements. Find out more about it here. All of our test methods can be found here.
Razer Blade 15 Studio Edition
i7-9750H, Quadro RTX 5000 Max-Q
Razer Blade 15 RTX 2080 Max-Q
i7-9750H, GeForce RTX 2080 Max-Q
Lenovo ThinkPad P53-20QN000YGE
i7-9850H, Quadro RTX 5000 Max-Q
MSI P65 Creator 9SF-657
i9-9880H, GeForce RTX 2070 Max-Q
Dell Precision 5540
i9-9980HK, Quadro T2000 Max-Q
Fujitsu Celsius H780
i7-8850H, Quadro P2000
HP ZBook Studio G5-4QH10EA
i7-8750H, Quadro P1000
Gemiddeld NVIDIA Quadro RTX 5000 Max-Q
 
Gemiddelde van klas Workstation
 
Power Consumption
-10%
8%
-10%
20%
13%
25%
-12%
9%
Idle Minimum *
13.2
12.5
5%
7.9
40%
9.4
29%
7.4
44%
9.1
31%
6.8
48%
10.4 ?(4.6 - 13.8, n=7)
21%
Idle Average *
15
15.3
-2%
11.8
21%
17.4
-16%
12.1
19%
13.2
12%
11.3
25%
16.1 ?(11.8 - 19, n=7)
-7%
Idle Maximum *
17.4
20.7
-19%
14.9
14%
19.6
-13%
12.7
27%
14.04
19%
14.3
18%
23.8 ?(14.9 - 41.5, n=7)
-37%
Load Average *
99
90.2
9%
96
3%
103
-4%
98
1%
78.8
20%
78
21%
109.5 ?(96 - 131, n=7)
-11%
Load Maximum *
148
209.3
-41%
207.8
-40%
216
-46%
135.1
9%
172.5
-17%
126
15%
189.5 ?(148 - 227, n=7)
-28%
Witcher 3 ultra *
162
149
89.9
64

* ... kleiner is beter

Batterijduur
Inactief (zonder WLAN, minimale helderheid)
9h 36min
WiFi Websurfing (Edge 44)
5h 31min
Big Buck Bunny H.264 1080p
7h 38min
Belast (maximale helderheid)
1h 51min
Razer Blade 15 Studio Edition
i7-9750H, Quadro RTX 5000 Max-Q, 80 Wh
Razer Blade 15 RTX 2080 Max-Q
i7-9750H, GeForce RTX 2080 Max-Q, 80 Wh
Lenovo ThinkPad P53-20QN000YGE
i7-9850H, Quadro RTX 5000 Max-Q, 90 Wh
MSI P65 Creator 9SF-657
i9-9880H, GeForce RTX 2070 Max-Q, 82 Wh
Dell Precision 5540
i9-9980HK, Quadro T2000 Max-Q, 97 Wh
Fujitsu Celsius H780
i7-8850H, Quadro P2000, 96 Wh
HP ZBook Studio G5-4QH10EA
i7-8750H, Quadro P1000, 97 Wh
Gemiddelde van klas Workstation
 
Batterijduur
25%
45%
-11%
31%
36%
48%
29%
Reader / Idle
576
953
65%
577
0%
897
56%
1036
80%
H.264
458
590
29%
634
38%
544
19%
WiFi v1.3
331
393
19%
664
101%
357
8%
461
39%
450
36%
582
76%
Load
111
102
-8%
117
5%
65
-41%
102
-8%
131
18%

Pro

+ 4K OLED-touchscreen
+ uitstekende zwartwaarde
+ snelle reactie in games
+ volledige sRGB-dekking
+ robuuste metalen behuizing
+ gematigde hitte en geluidsniveaus
+ tot 64 GB RAM
+ NVMe SSD
+ RGB-verlichting per toets
+ Wi-Fi 6
+ uitstekende Wi-Fi overdrachtssnelheden
+ goede batterijduur
+ Thunderbolt 3

Contra

- geen plek voor een extra opslagstation
- toetsenbord zou beter kunnen
De Razer Blade 15 Studio Edition, geleverd door Razer Germany

Voor het volledige, Engelse testrapport, klik hier.

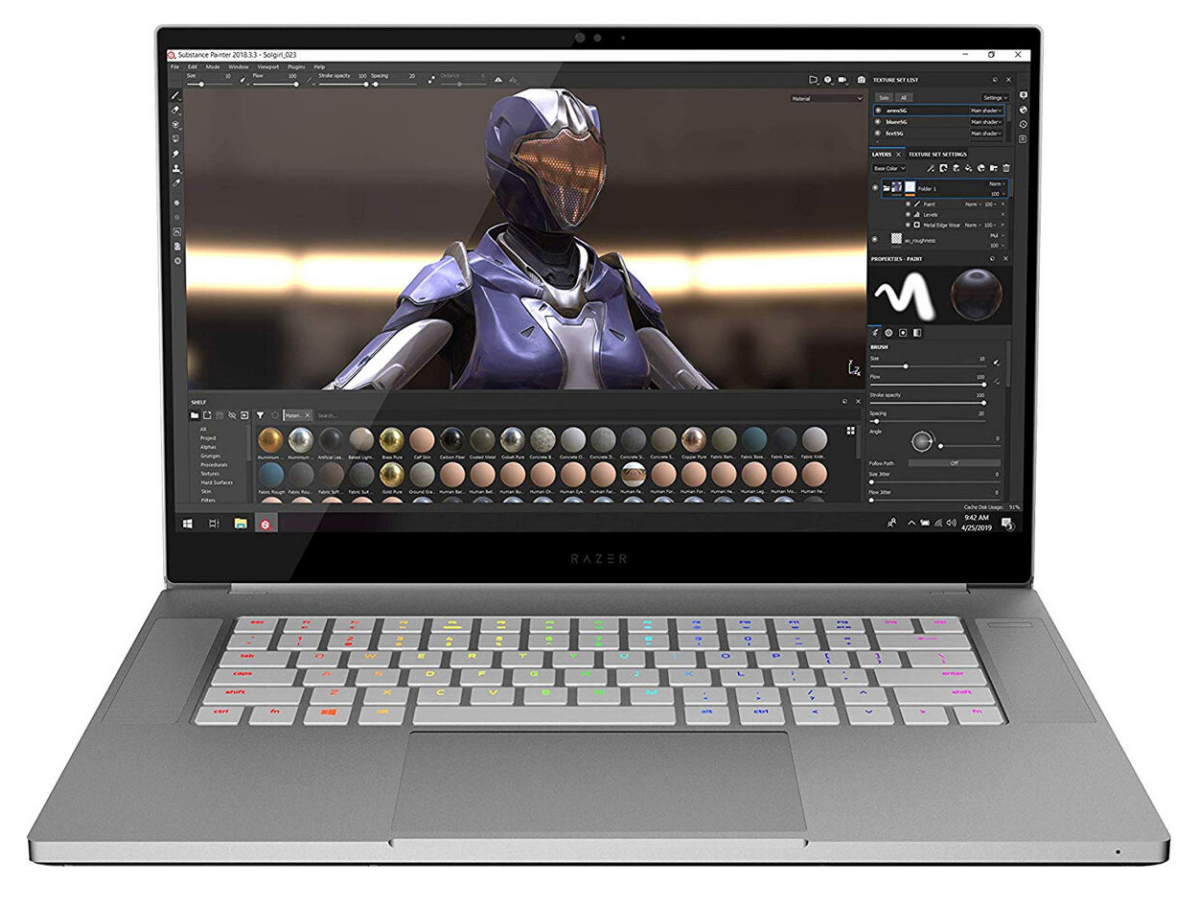
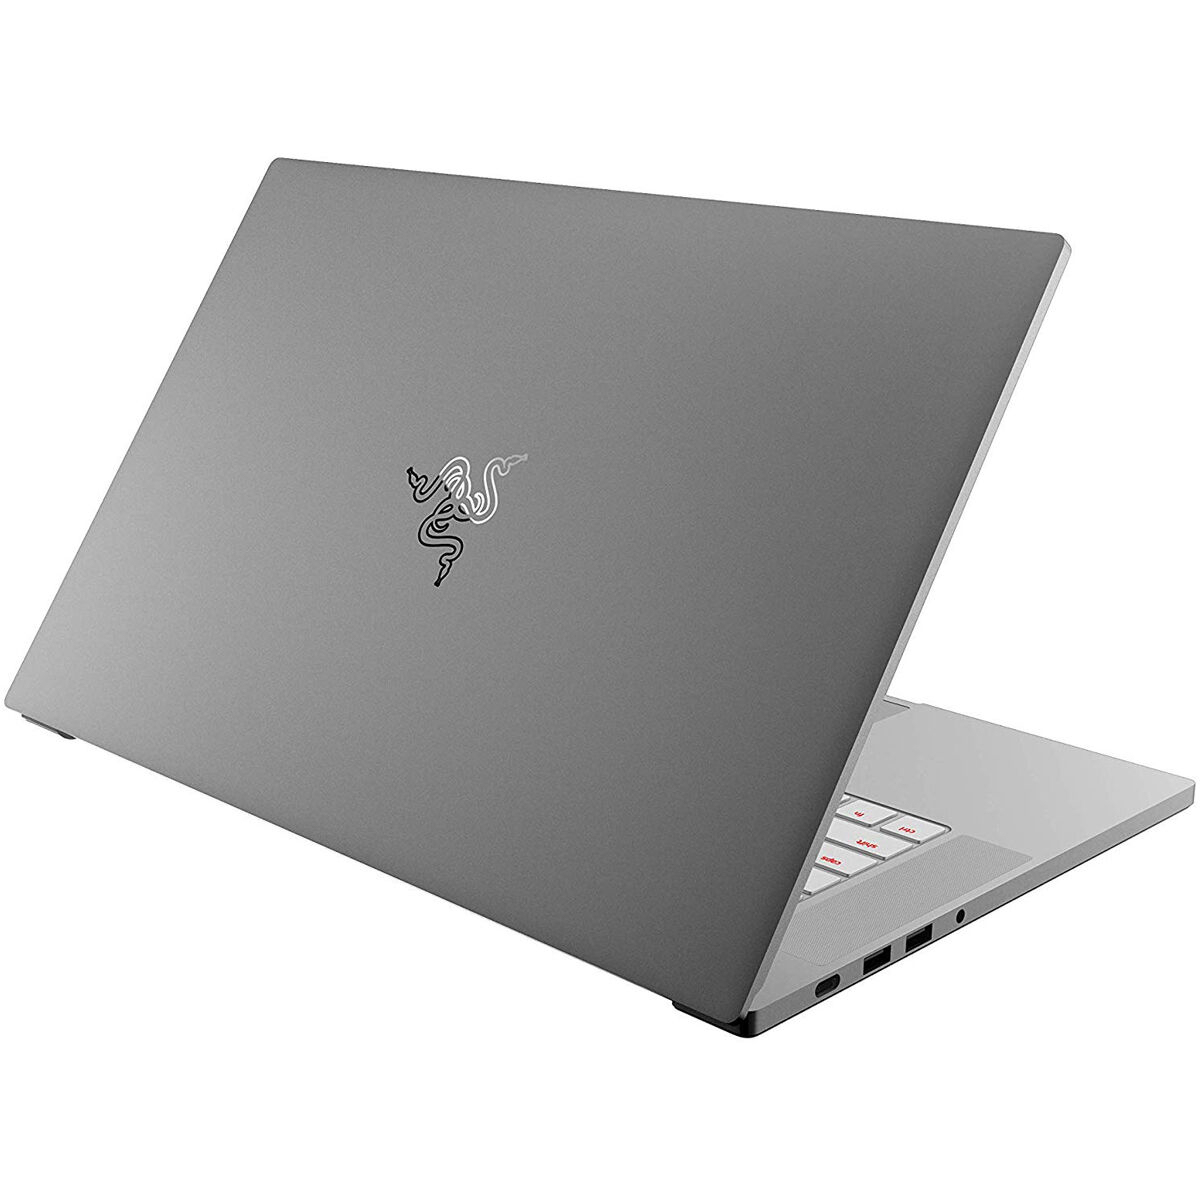
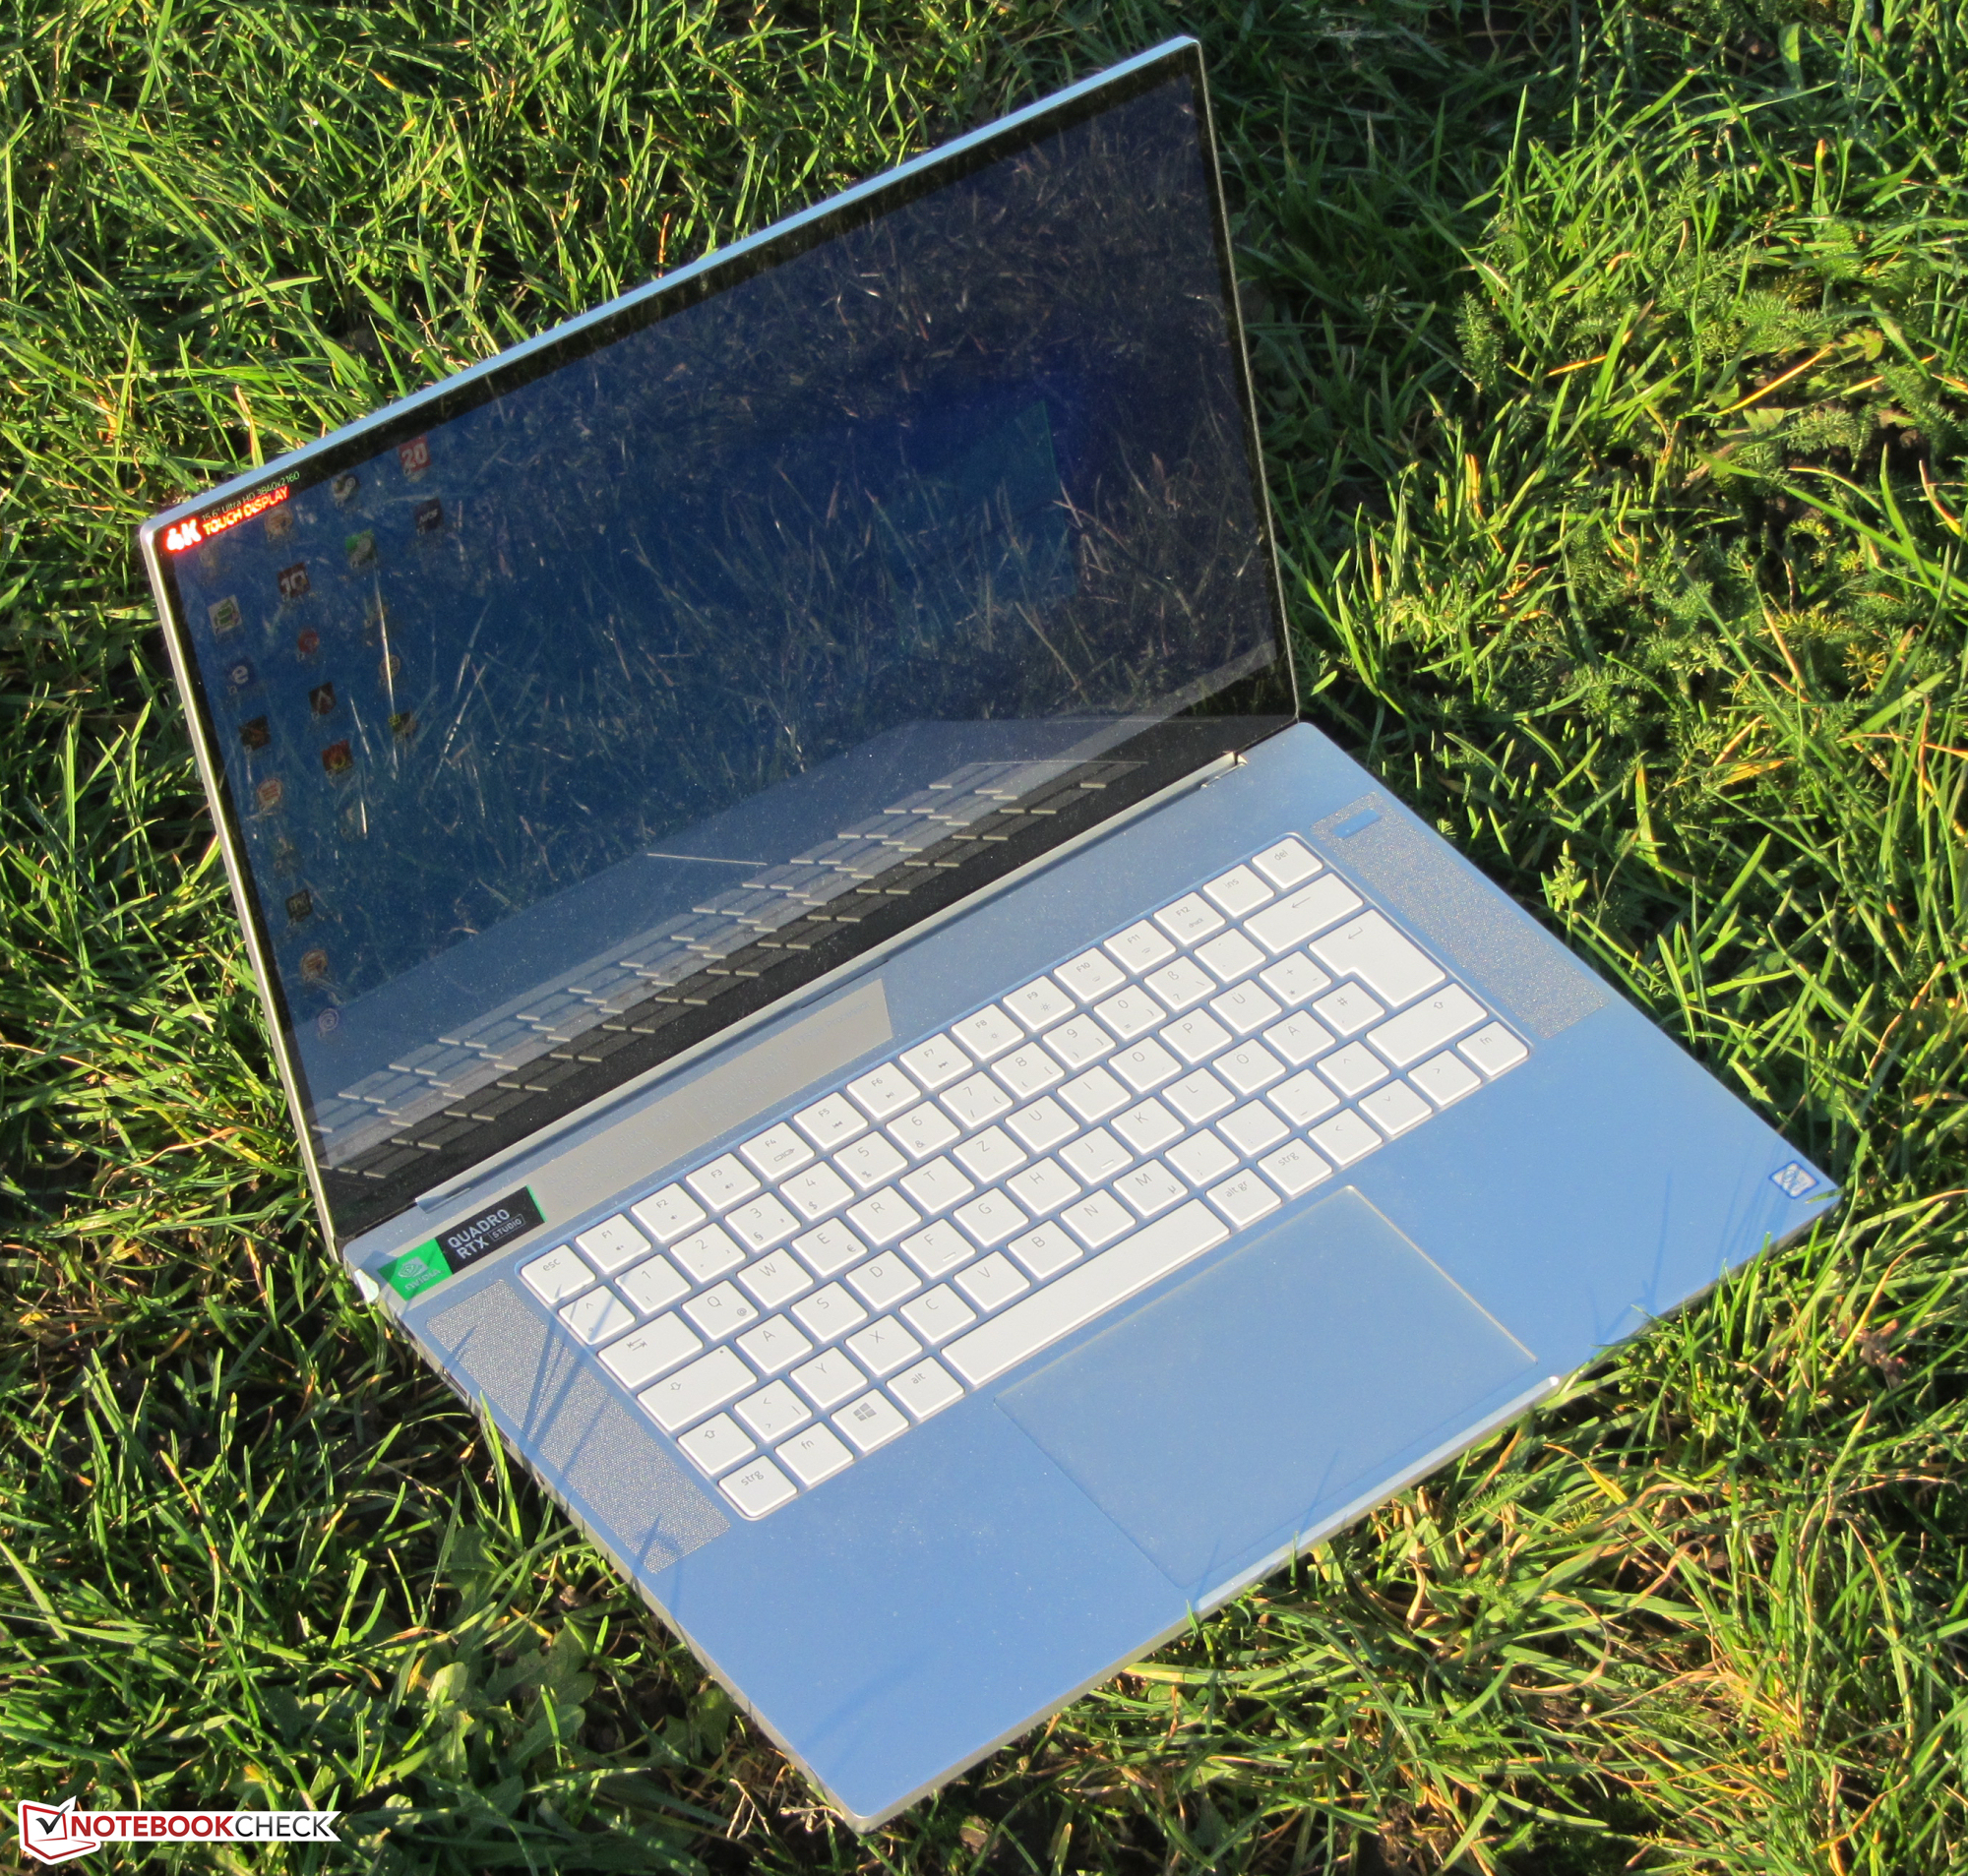
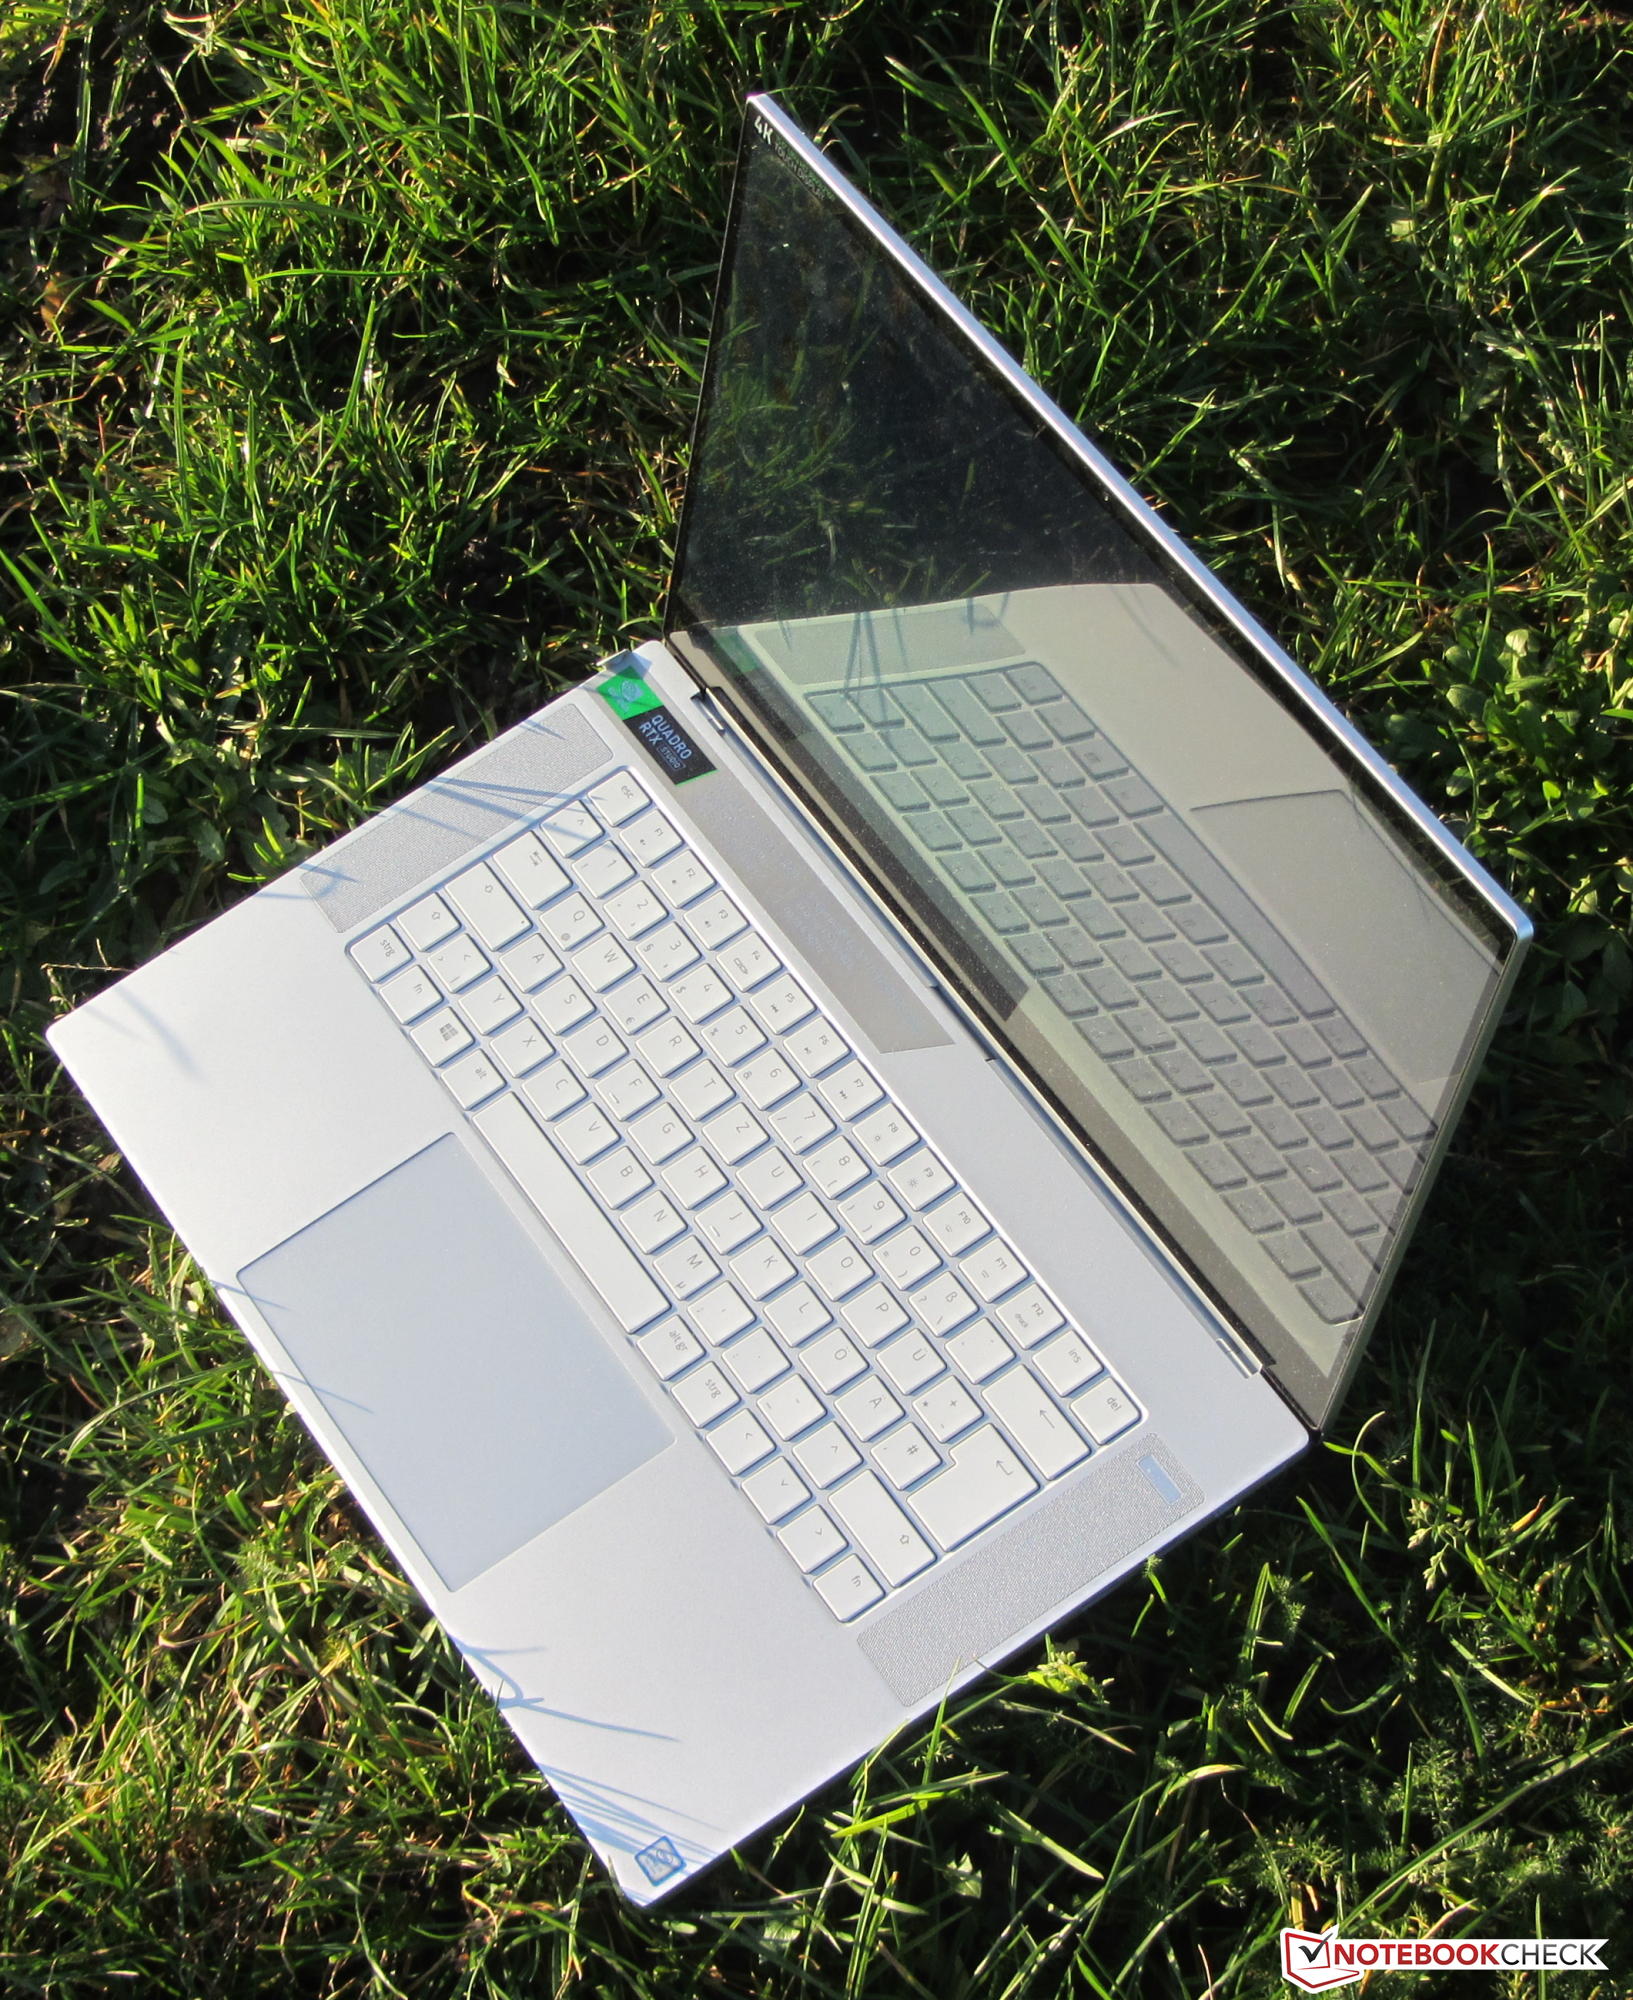
De Studio-editie van de Blade 15 is een mobiel 15,6-inch werkstation van Razer. Het is gebaseerd op het Blade 15 Advanced Model dat we al hebben getest en waarmee het zijn ontwerp deelt. Hierdoor heeft het dezelfde, robuuste metalen constructie.

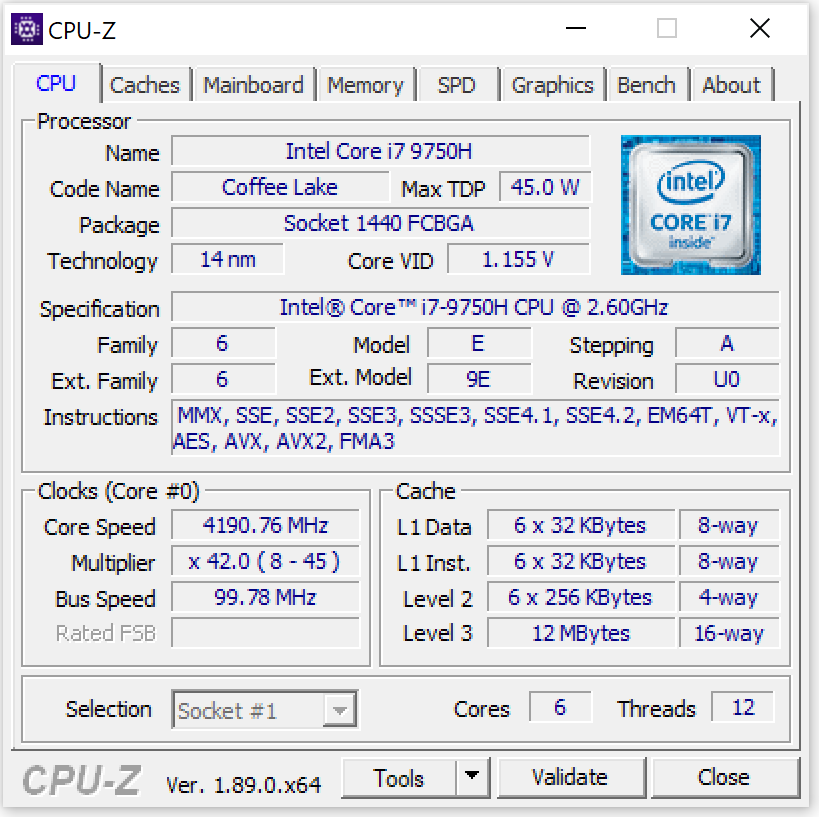
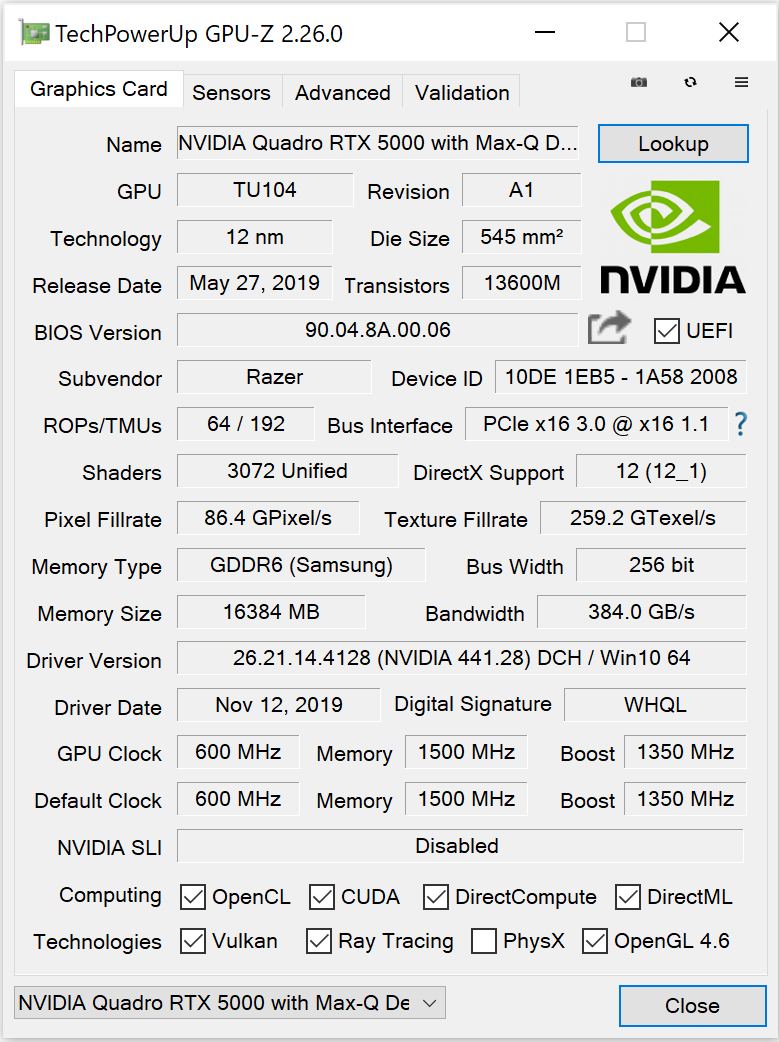
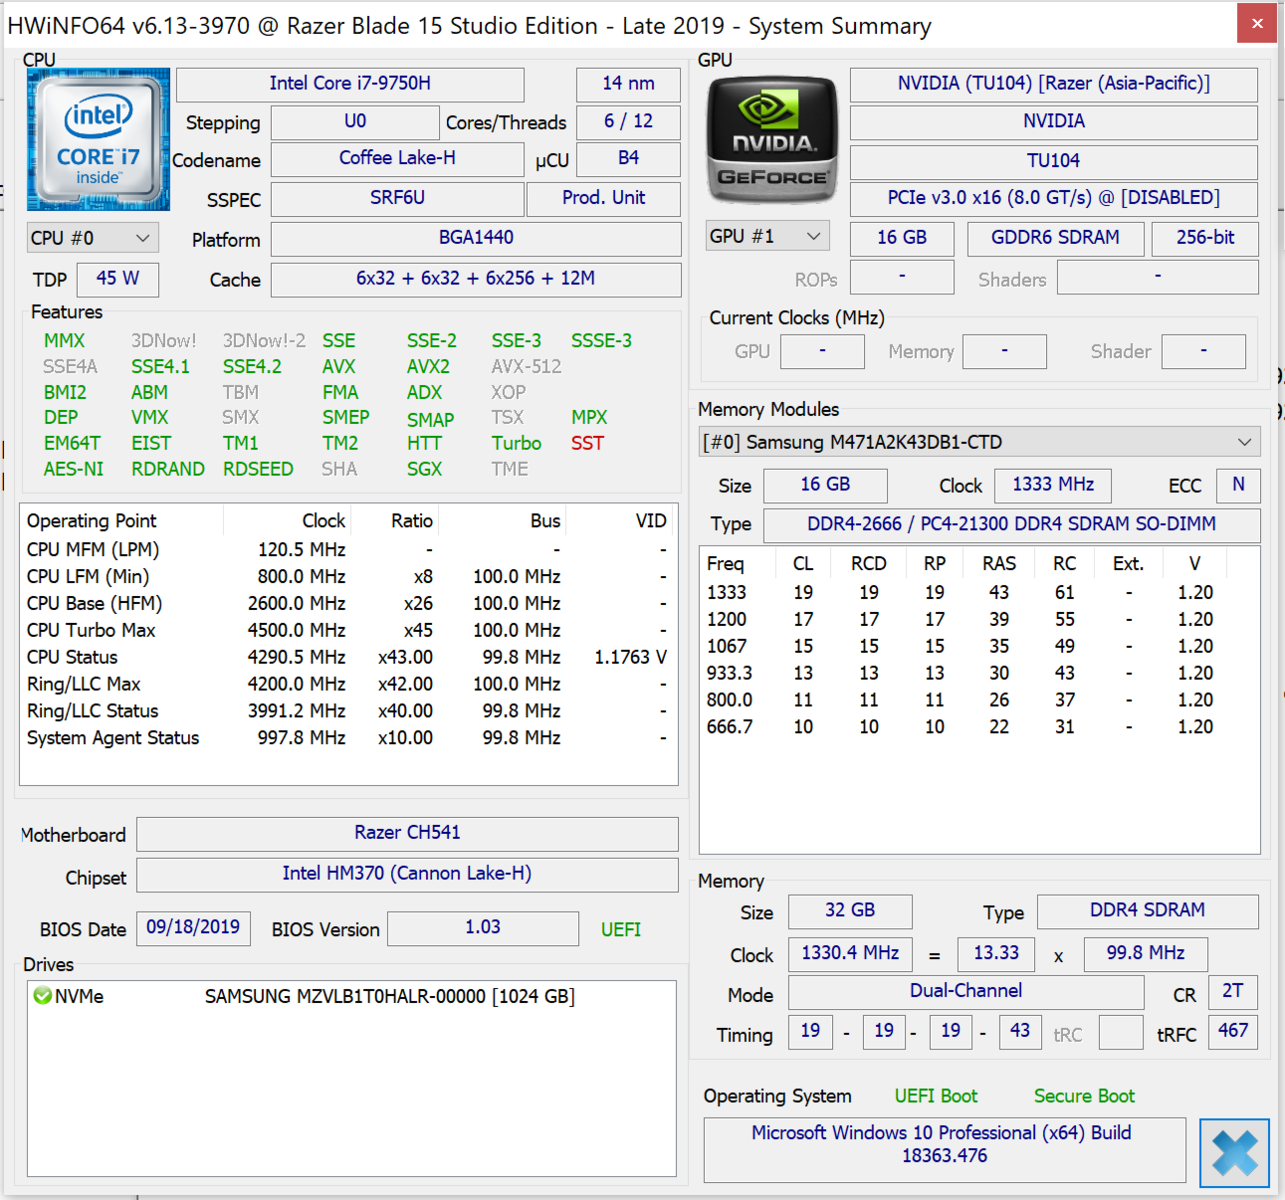
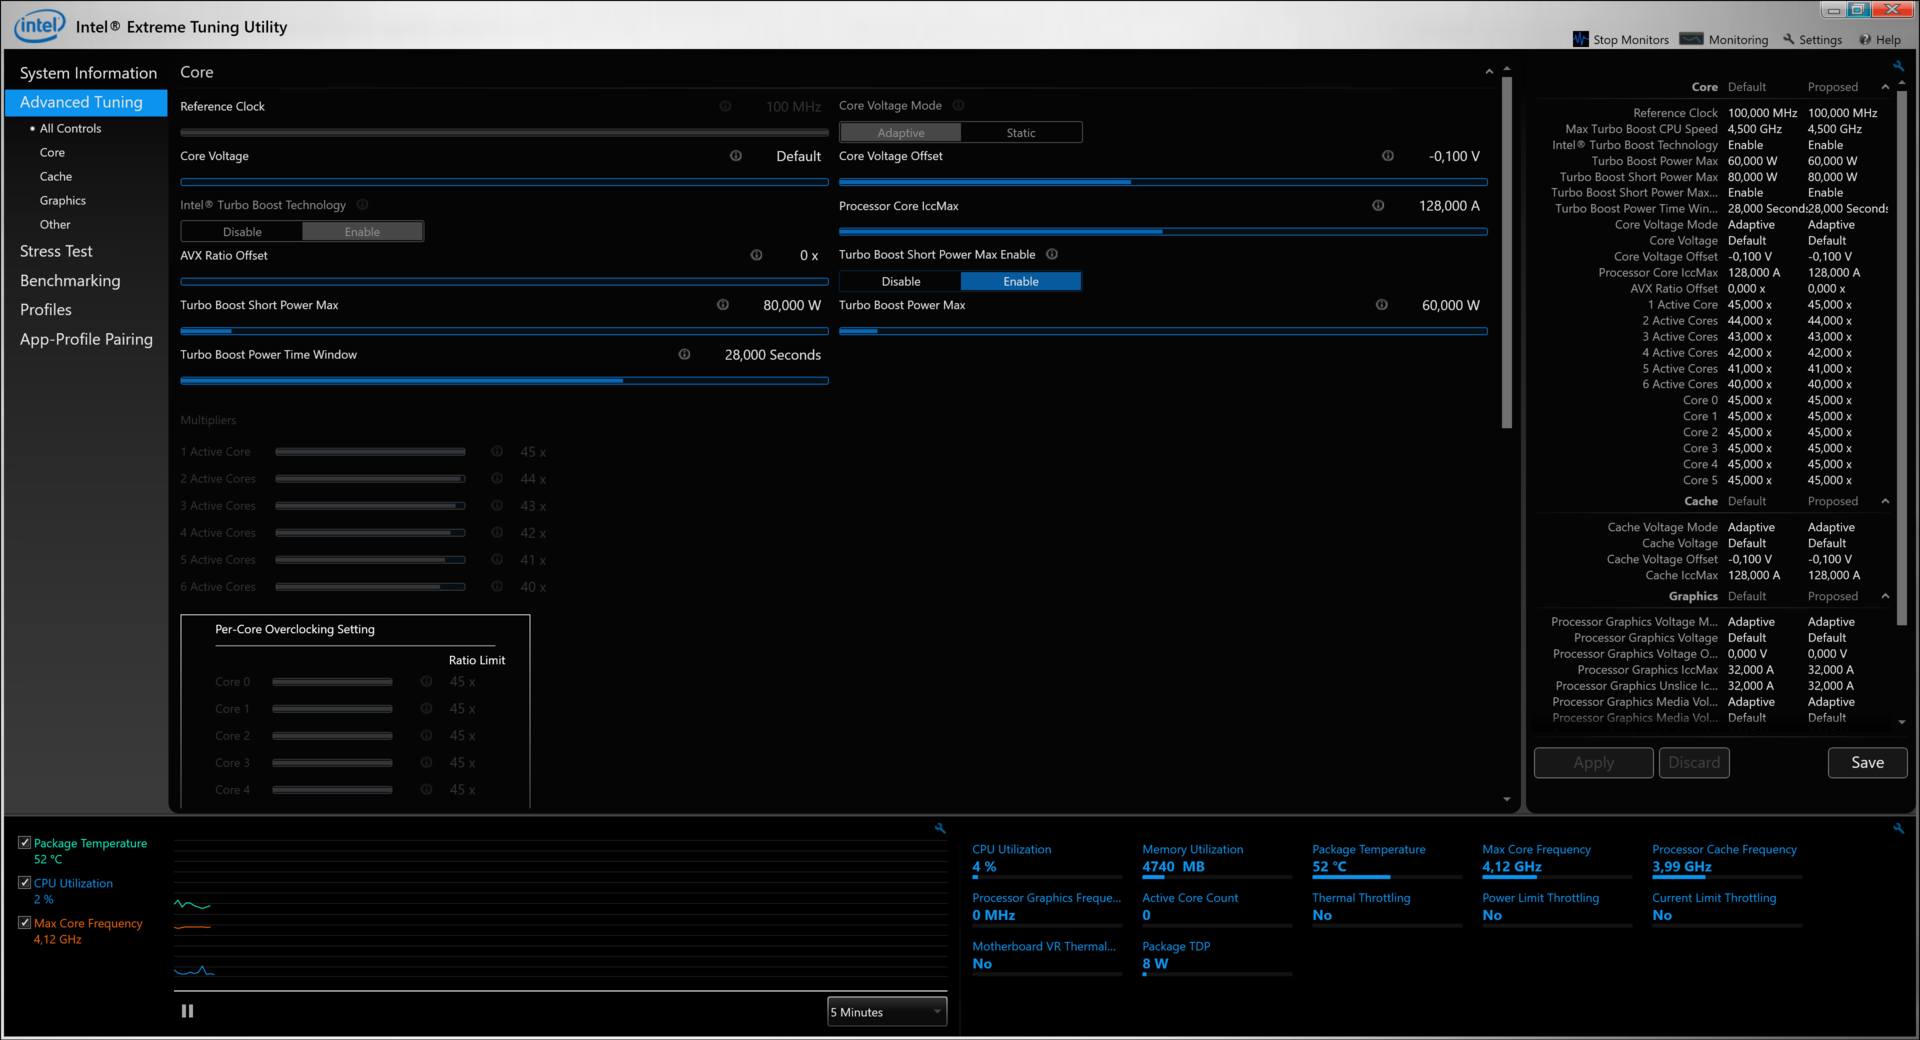
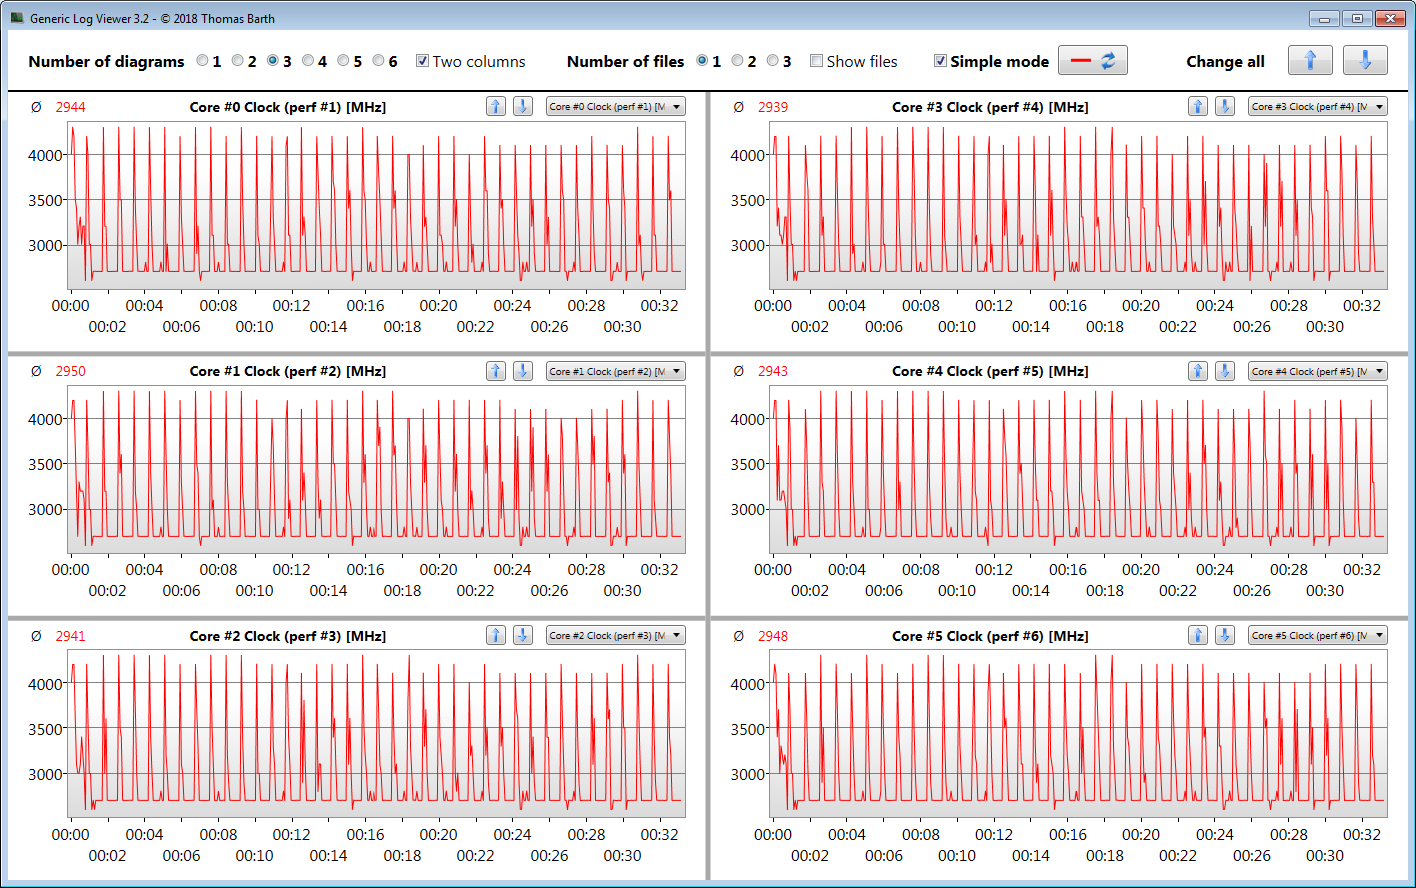
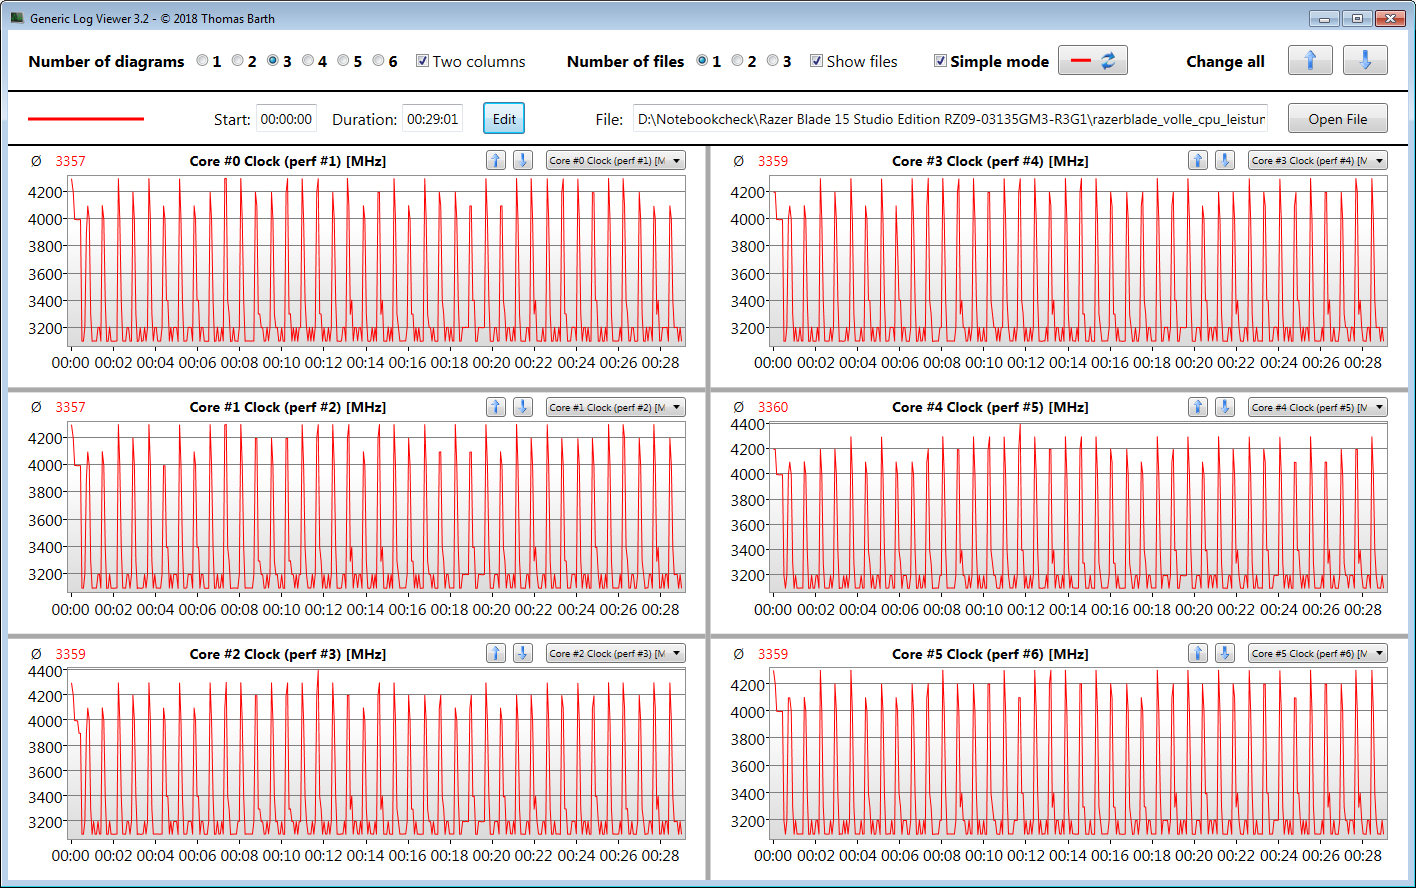
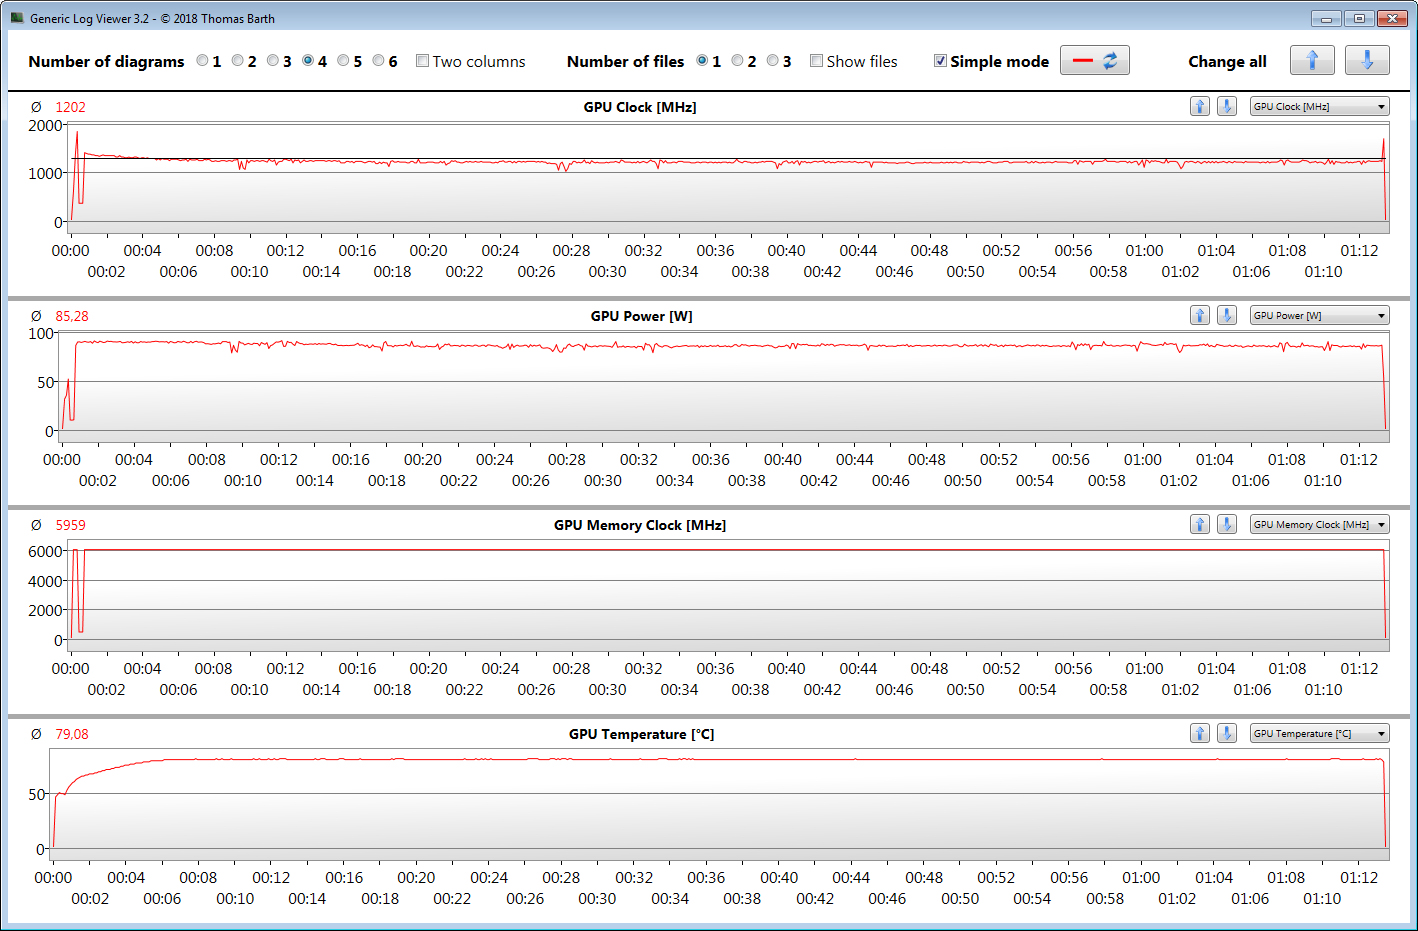
Qua hardware is de laptop uitgerust met de up-to-date Core i7-9750H-processor en GeForce RTX 5000 Max-Q GPU. Zonder instellingen te wijzigen bereikt geen van beide componenten zijn maximale prestaties. De volledige prestaties kunnen echter worden ontgrendeld vanuit de Razer Synapse-software. Positief: ondanks de krachtige hardware blijven het geluids- en temperatuurniveau redelijk.

Razer's Blade 15 Studio is een werkstation met uitstekende functies die een algehele goede indruk achterlaten in onze tests.

Een NVMe SSD zorgt voor een soepel en responsief systeem en biedt gebruikers ook veel opslagruimte. Er is echter geen ruimte voor extra opslagstations in de laptop. Als er meer opslagruimte nodig is, moet de geïnstalleerde SSD worden verwisseld.

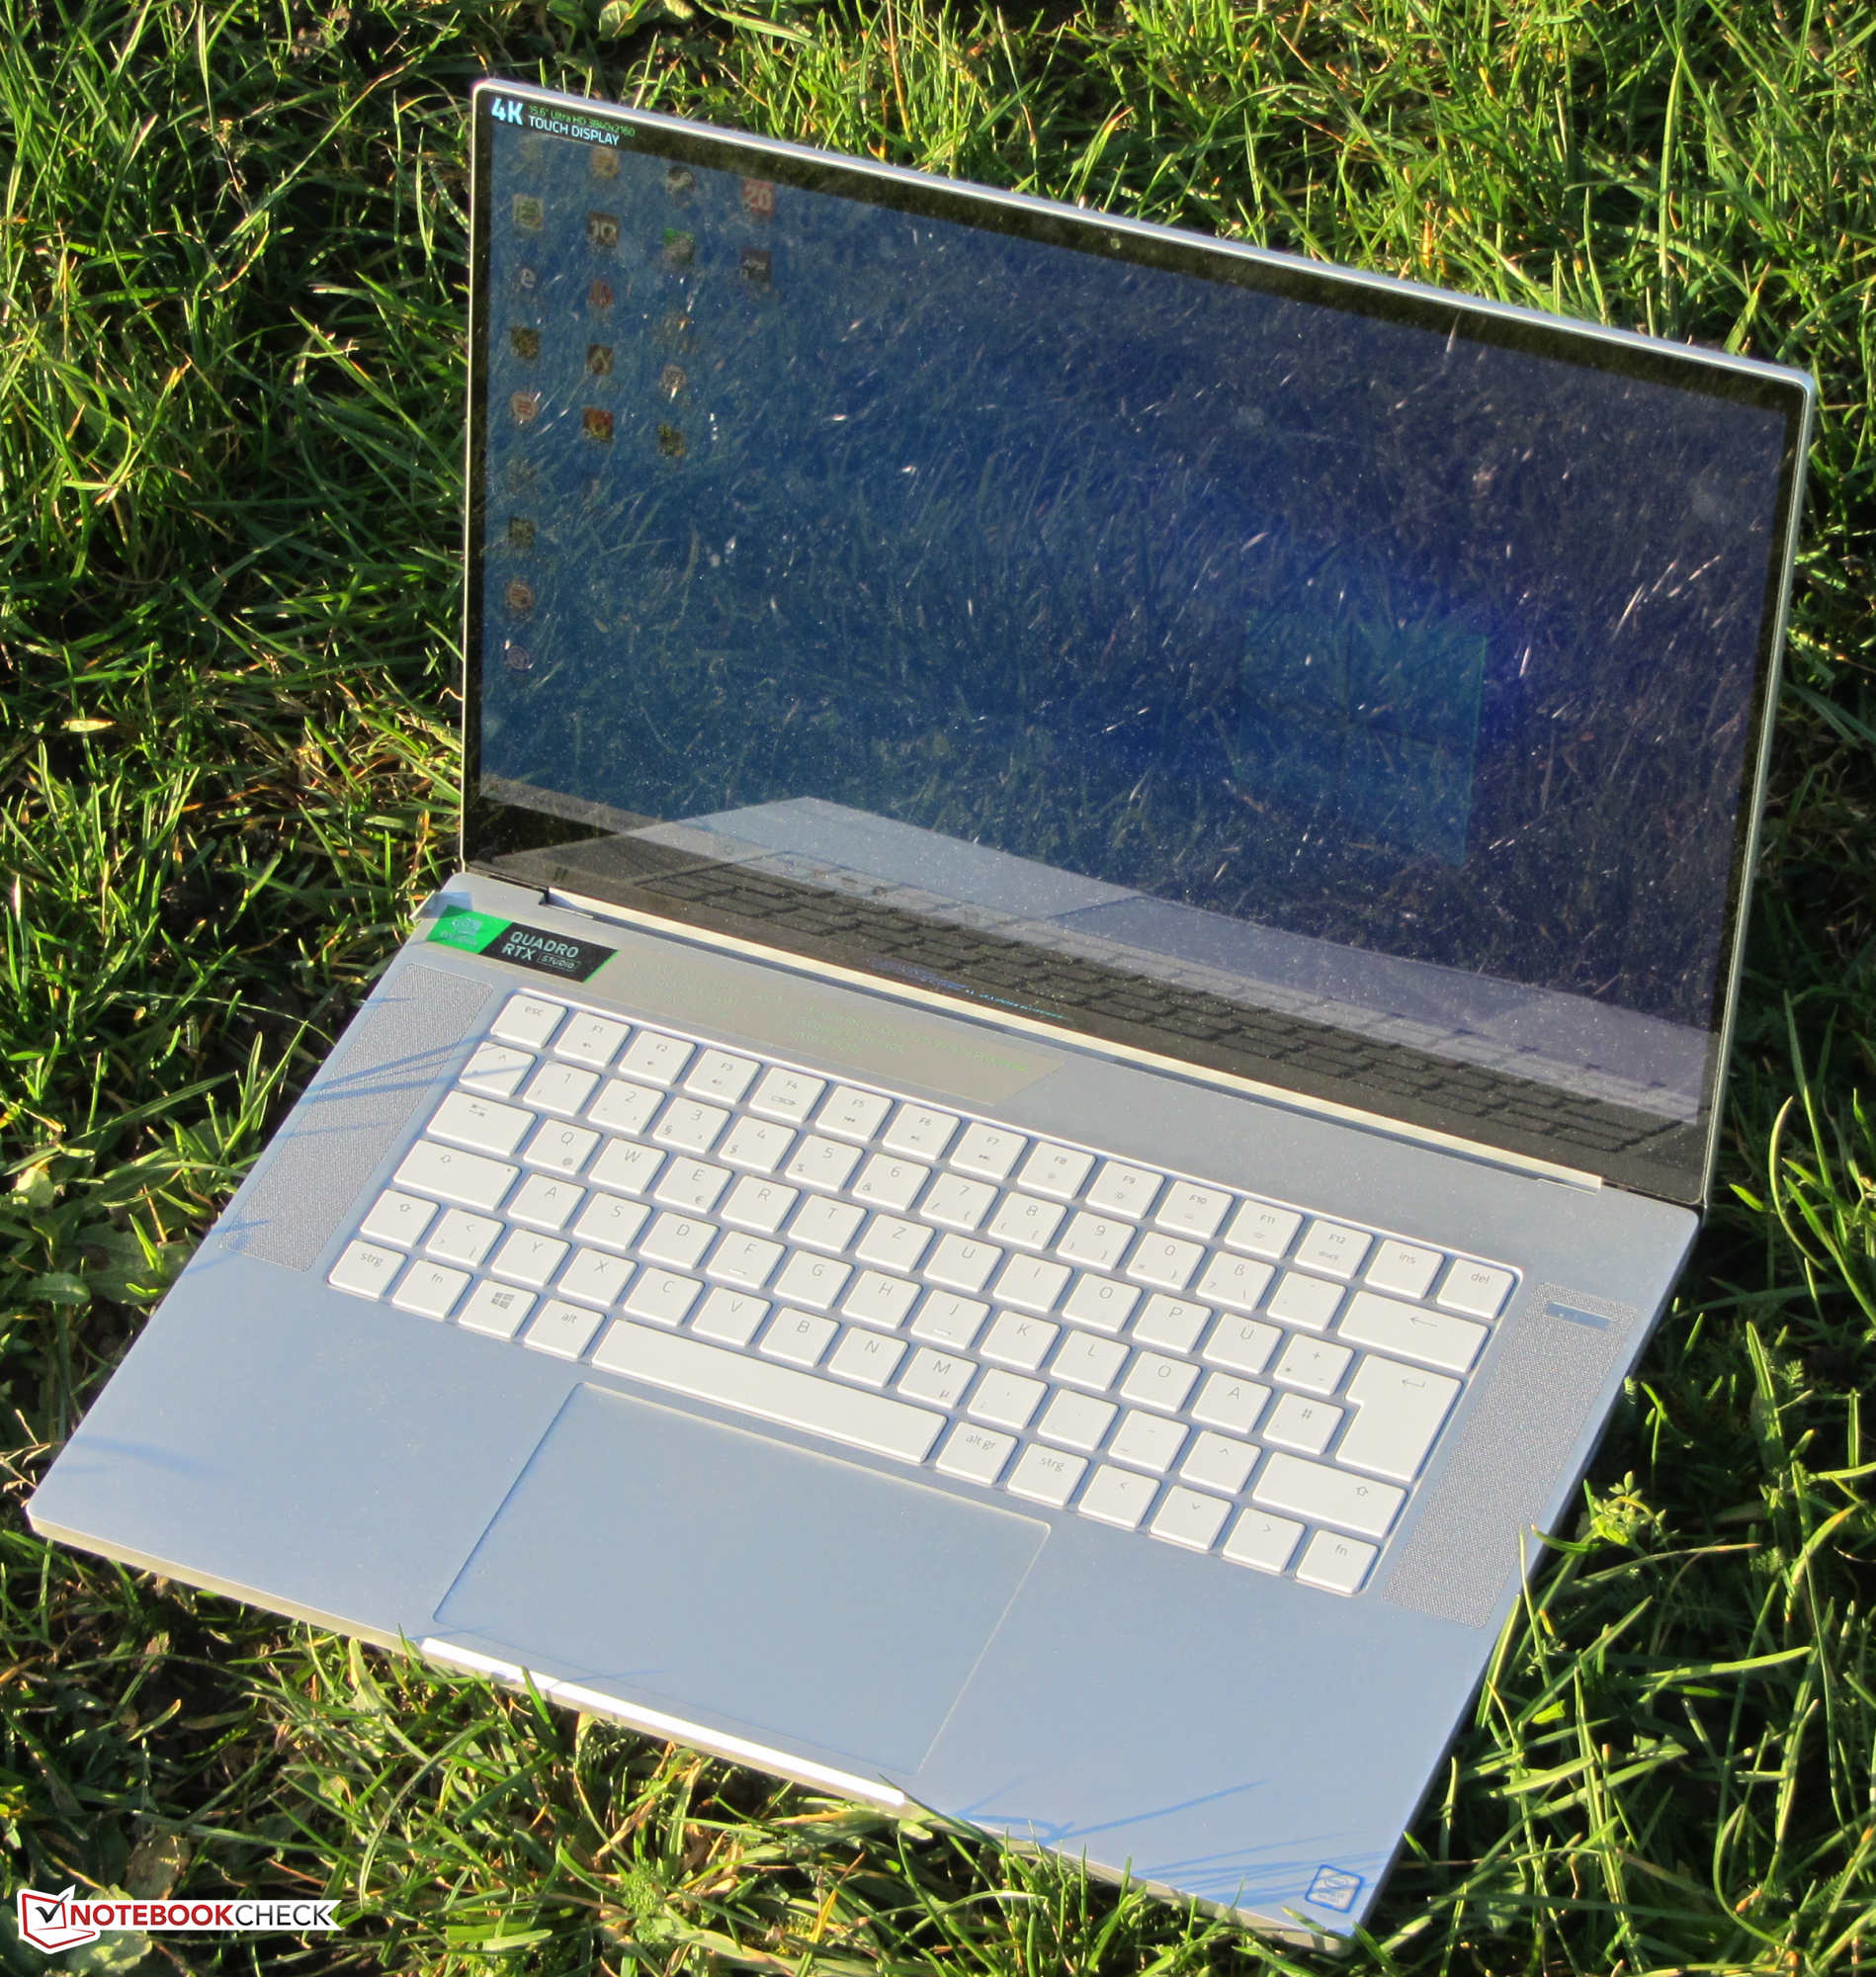
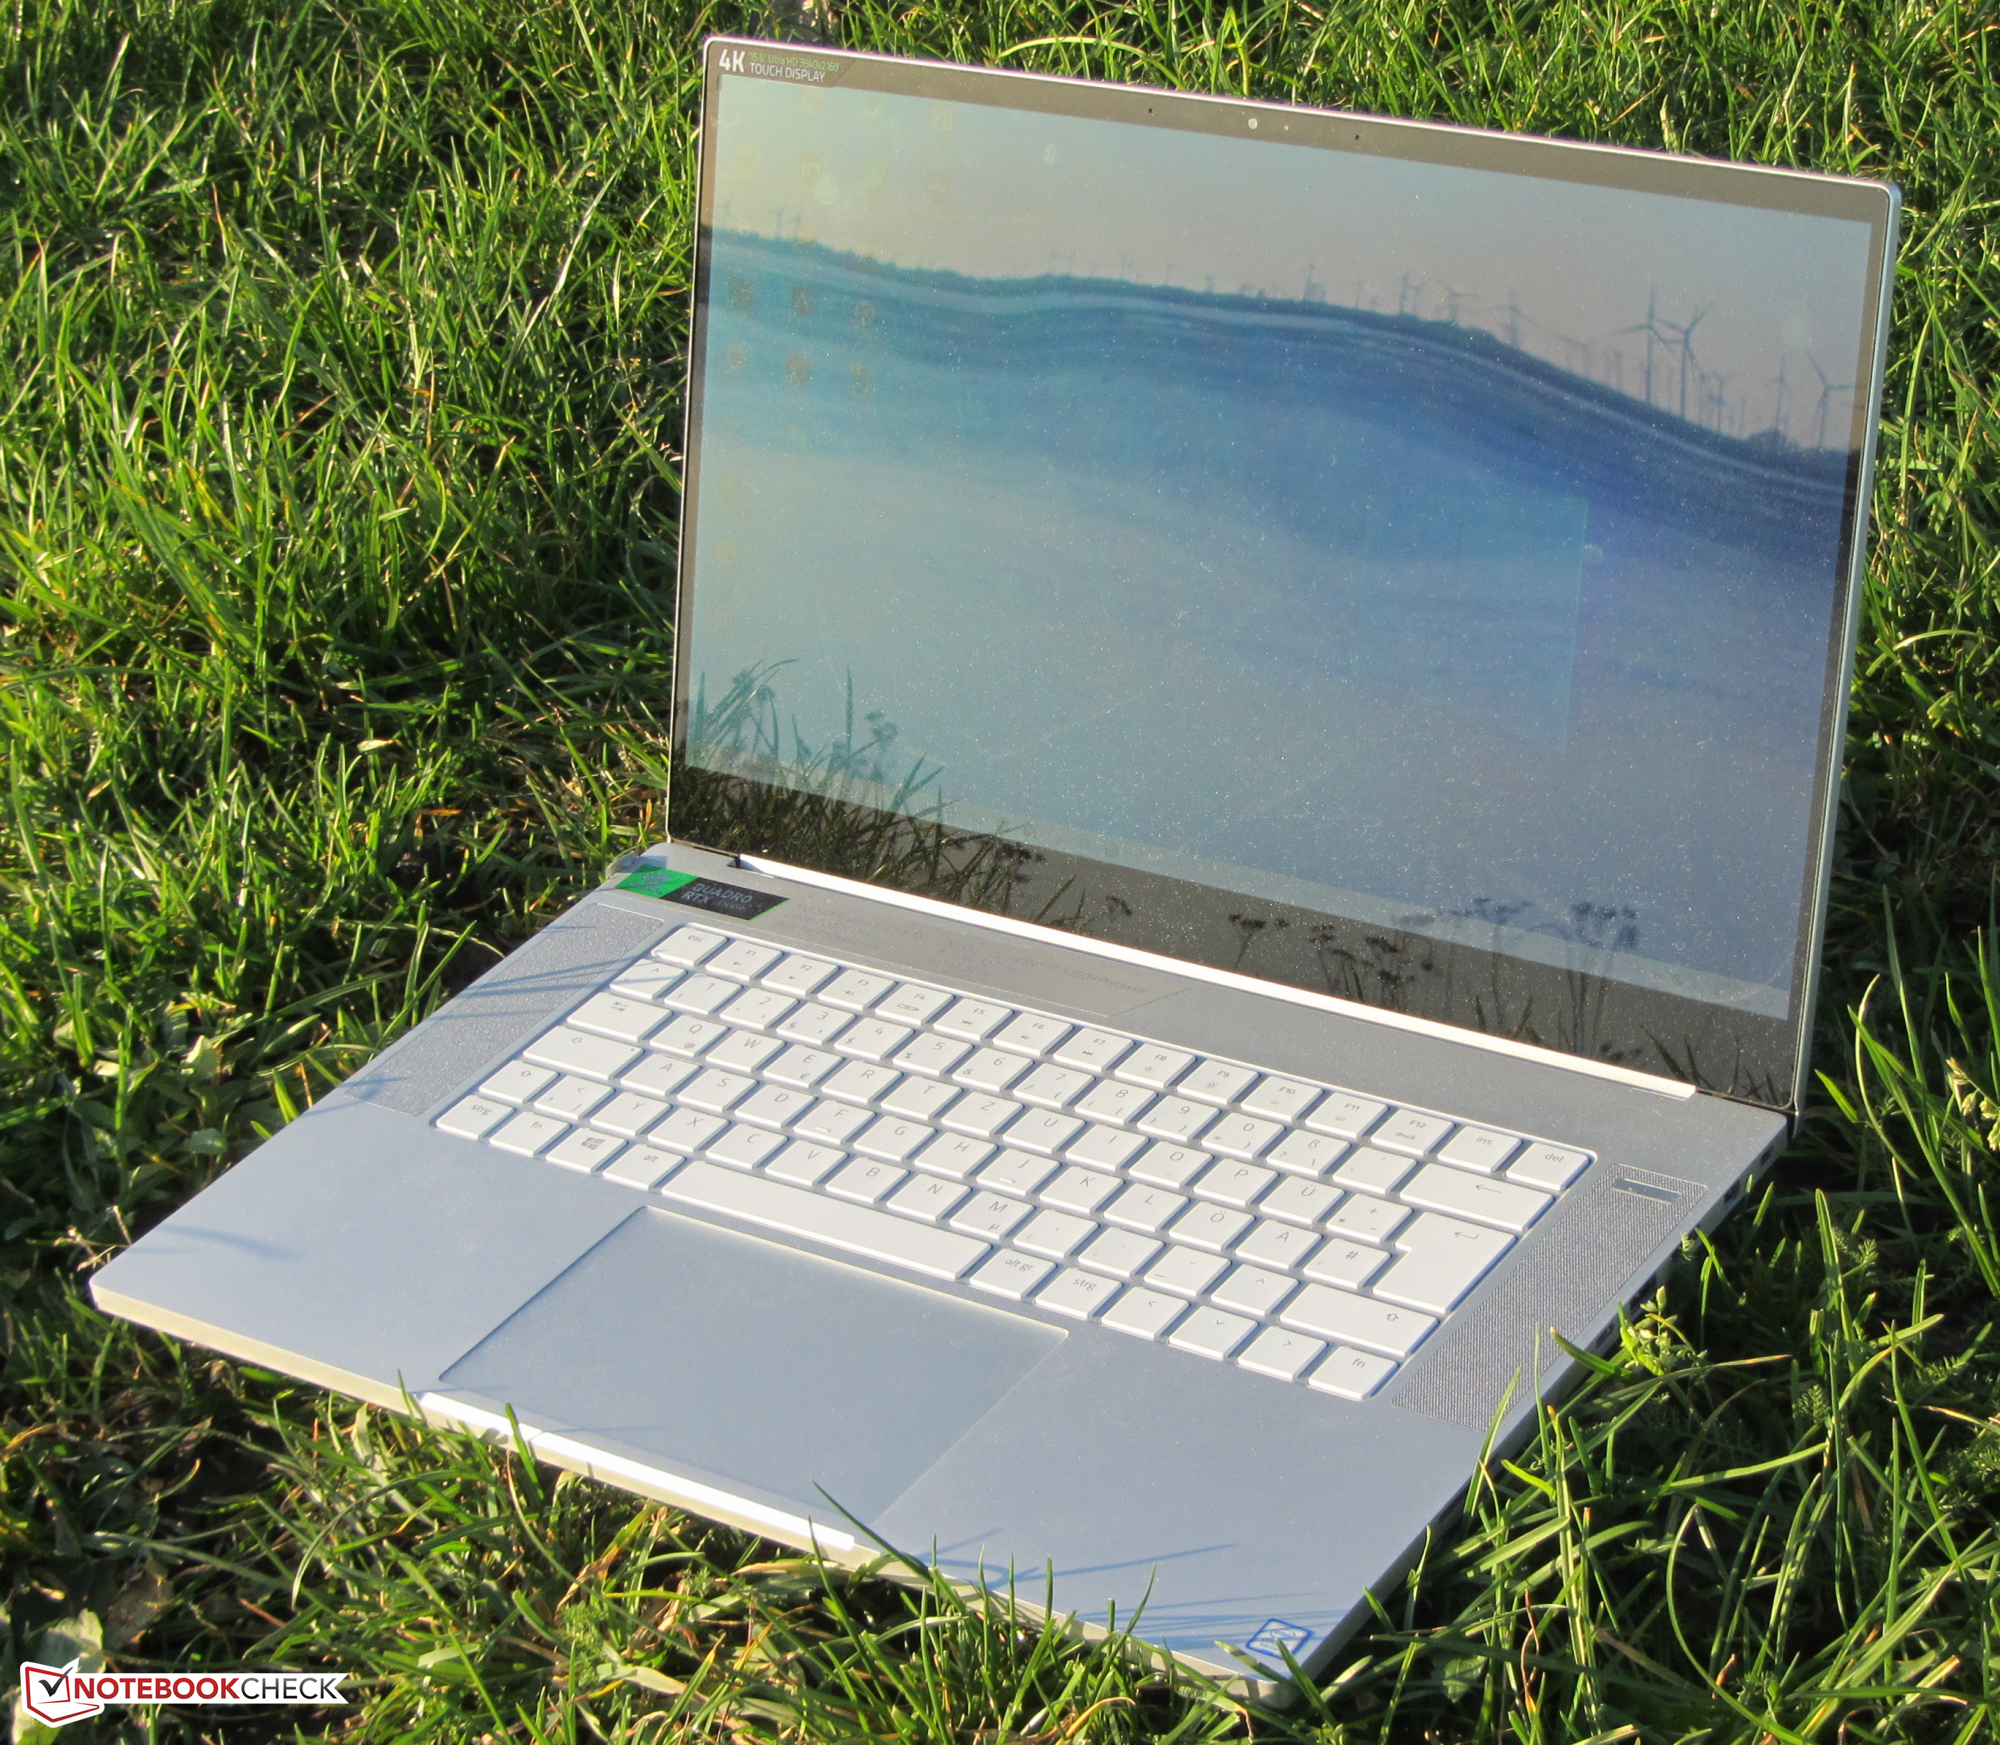
Het 4K OLED-touchscreen is de meest opvallende functie van de laptop. De geweldige zwartwaarde, het hoge helderheidsniveau, de brede kijkhoeken en snelle responstijden leiden tot een algehele verbluffende visuele ervaring. Alleen de kleurweergave kan beter.


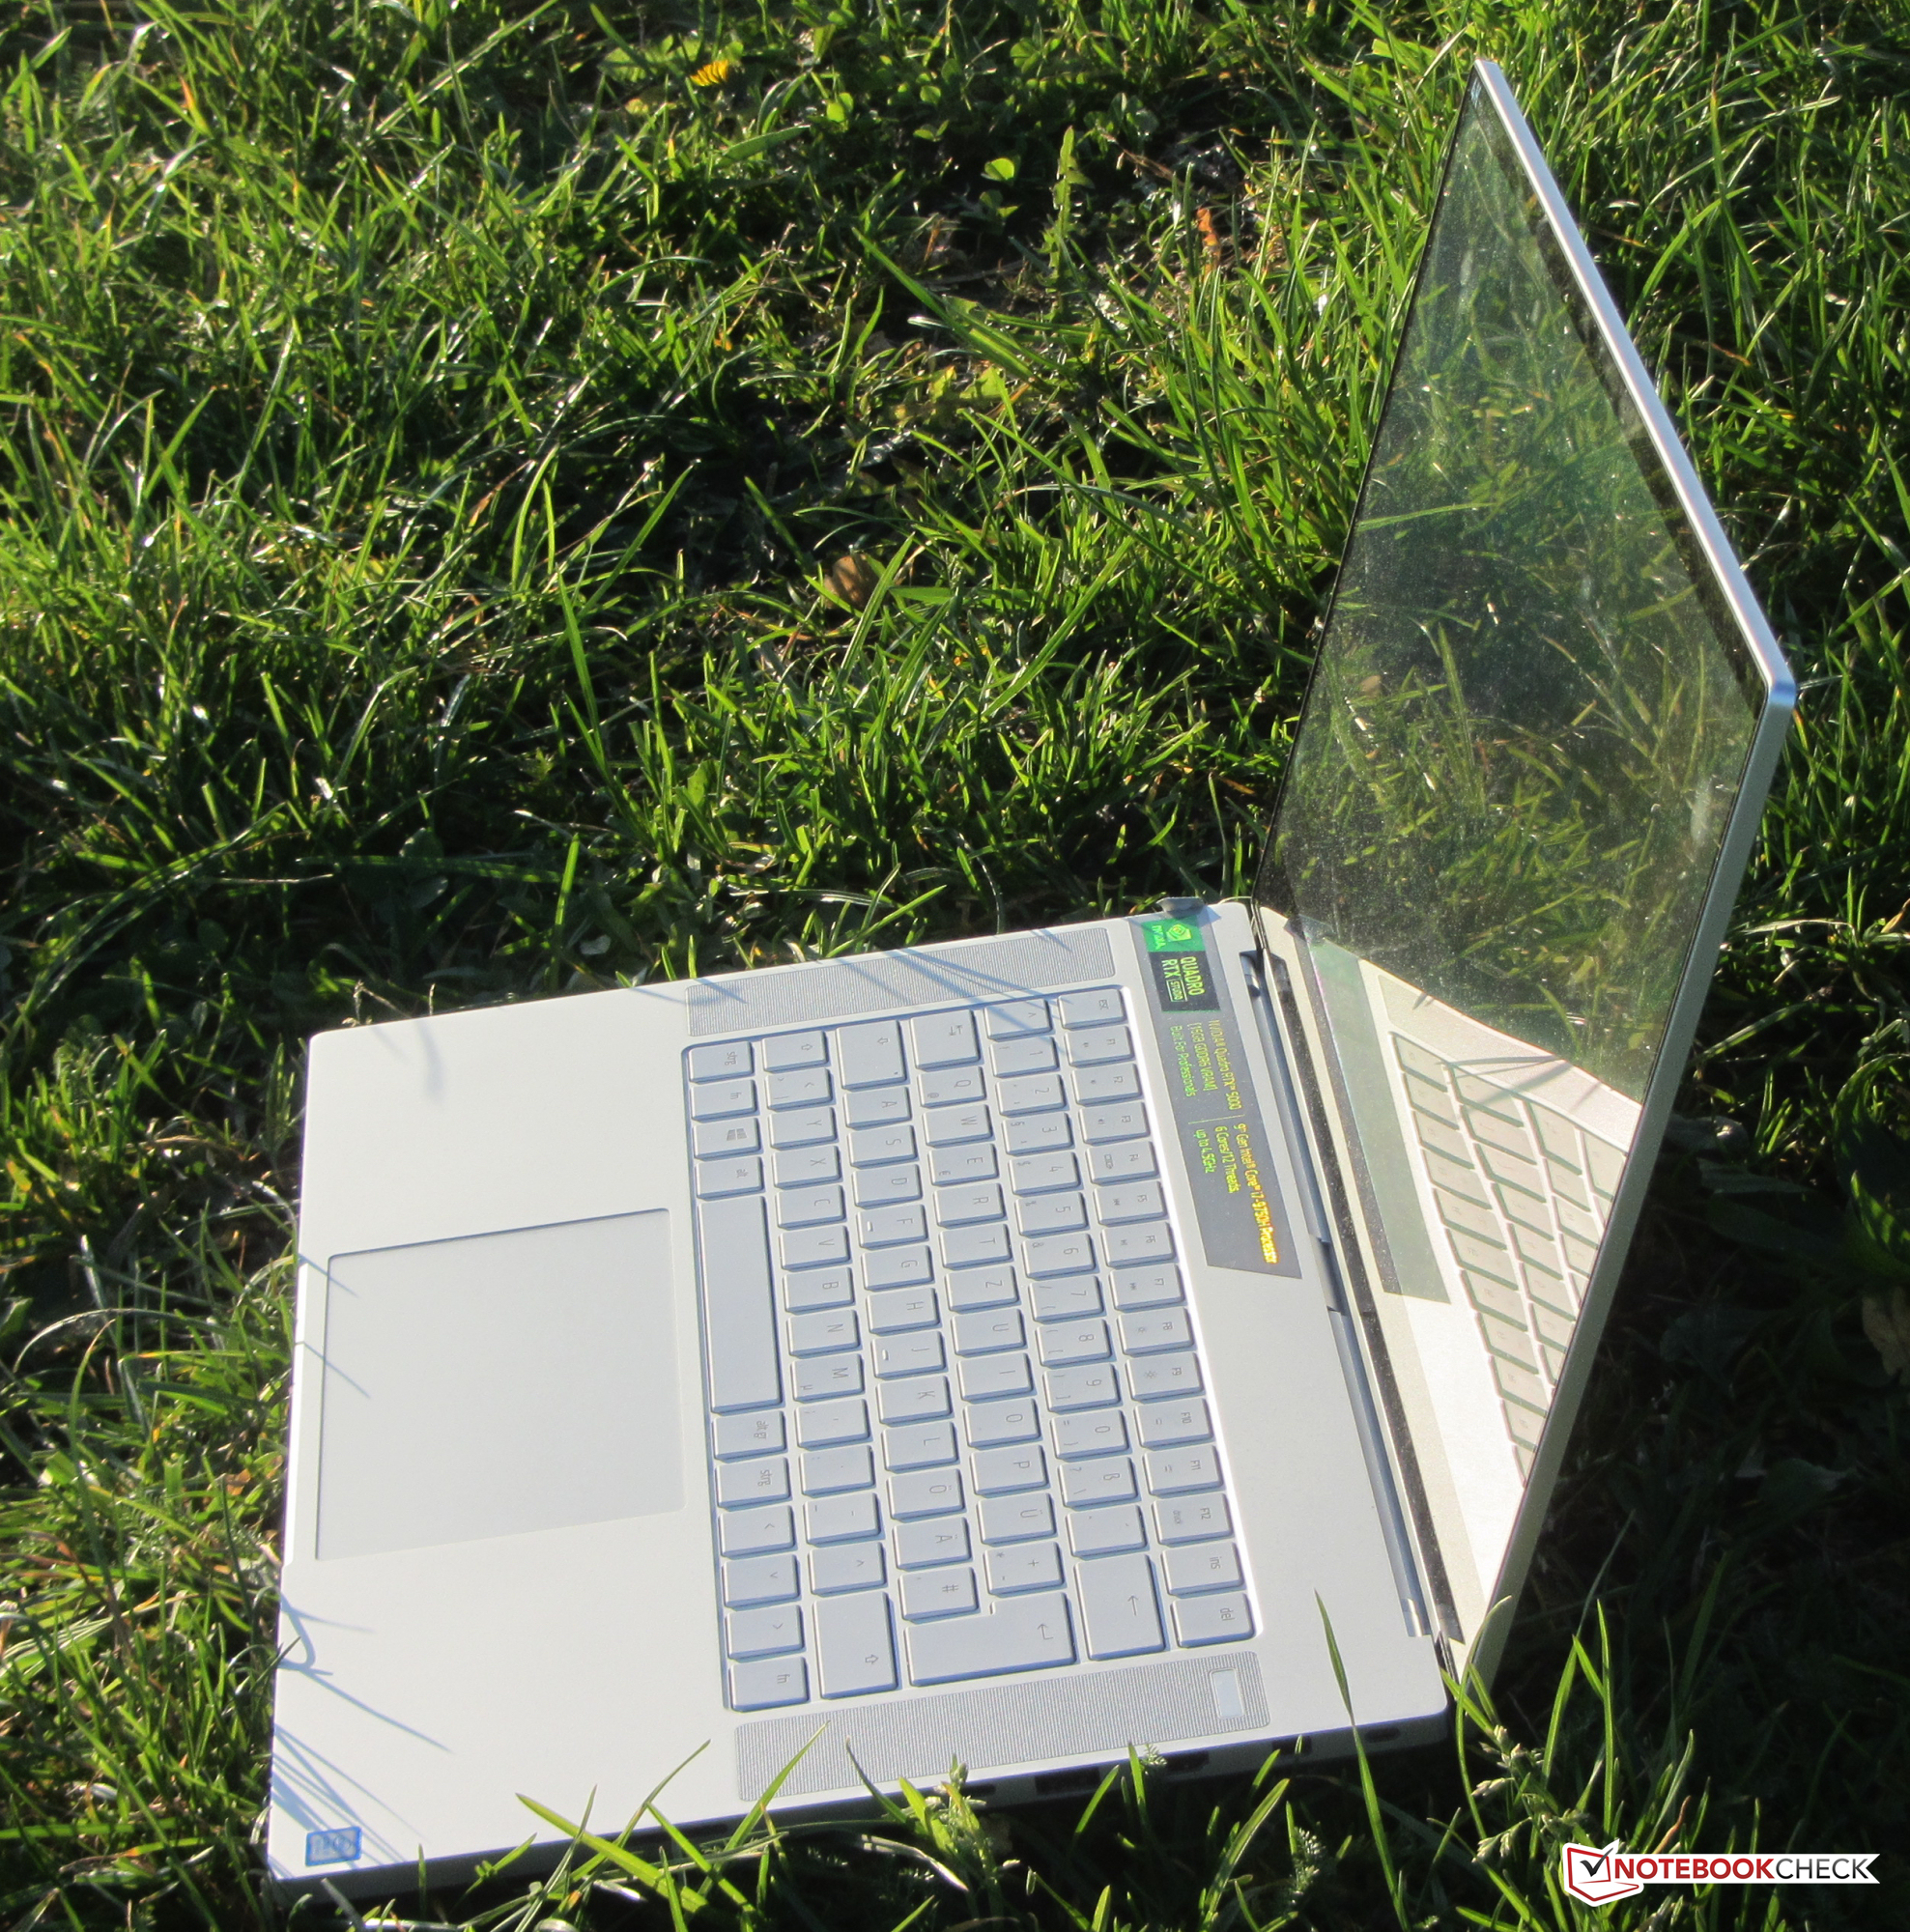
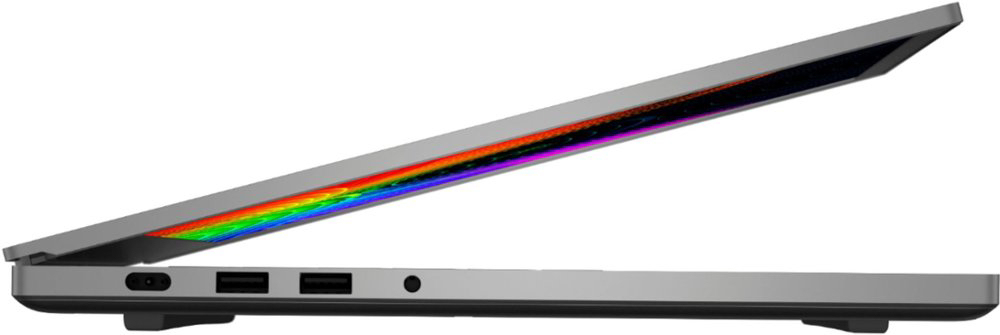
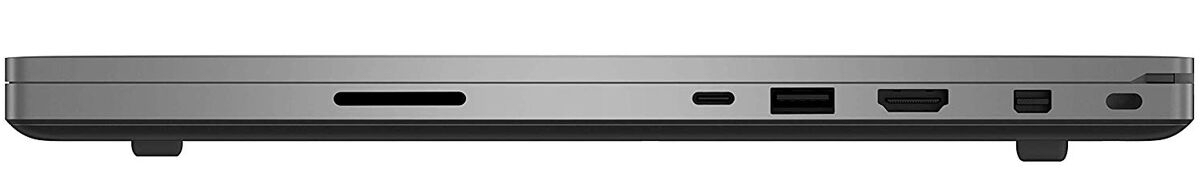
Het verlichte toetsenbord is geschikt gebleken voor dagelijks gebruik, maar niet voor mensen die veel typen. Bovendien is de batterijlevensduur redelijk goed. Ten slotte kunnen gebruikers via de Thunderbolt 3-poort dockingstations of een externe GPU aansluiten.


Razer Blade 15 Studio Edition - 02-12-2019 v7
Sascha Mölck

Behuizing
90 / 98 → 91%
Toetsenbord
81%
Aanwijsapparaat
89%
Aansluitmogelijkheden
70 / 80 → 87%
Gewicht
62 / 10-66 → 92%
Batterij
69 / 95 → 73%
Beeldscherm
86%
Gaming-performance
93%
Applicatie-performance
85%
Temperatuur
88 / 95 → 93%
Luidheid
91 / 90 → 100%
Audio
52%
Camera
45 / 85 → 53%
Gemiddelde
78%
87%
Workstation - Gewogen Gemiddelde

Pricecompare

Please share our article, every link counts!
> Overzichten en testrapporten over laptops en mobieltjes > Testrapporten > Kort testrapport Razer Blade 15 Studio Edition: Degelijk Werkstation met Veel Rekenkracht
Sascha Mölck, 2019-12- 8 (Update: 2019-12- 8)