Kort testrapport Lenovo ThinkPad P53: klassiek werkstation met veel GPU prestaties
Evaluatie | Datum | Model | Gewicht | Hoogte | Formaat | Resolutie | Beste prijs |
|---|---|---|---|---|---|---|---|
| 89.8 % v7 (old) | 11-2019 | Lenovo ThinkPad P53-20QN000YGE i7-9850H, Quadro RTX 5000 Max-Q | 2.7 kg | 29.4 mm | 15.60" | 1920x1080 | |
| 87.8 % v7 (old) | 08-2019 | Lenovo ThinkPad P1 2019-20QT000RGE i7-9850H, Quadro T1000 (Laptop) | 1.7 kg | 18.4 mm | 15.60" | 1920x1080 | |
| 86.9 % v7 (old) | 11-2018 | Dell Precision 7530 i9-8950HK, Quadro P3200 | 2.6 kg | 29.95 mm | 15.60" | 3840x2160 | |
| 85.6 % v6 (old) | Fujitsu Celsius H780 i7-8850H, Quadro P2000 | 2.8 kg | 31.9 mm | 15.60" | 1920x1080 | ||
| 85 % v7 (old) | 06-2019 | MSI P65 Creator 9SF-657 i9-9880H, GeForce RTX 2070 Max-Q | 1.9 kg | 18 mm | 15.60" | 3840x2160 |
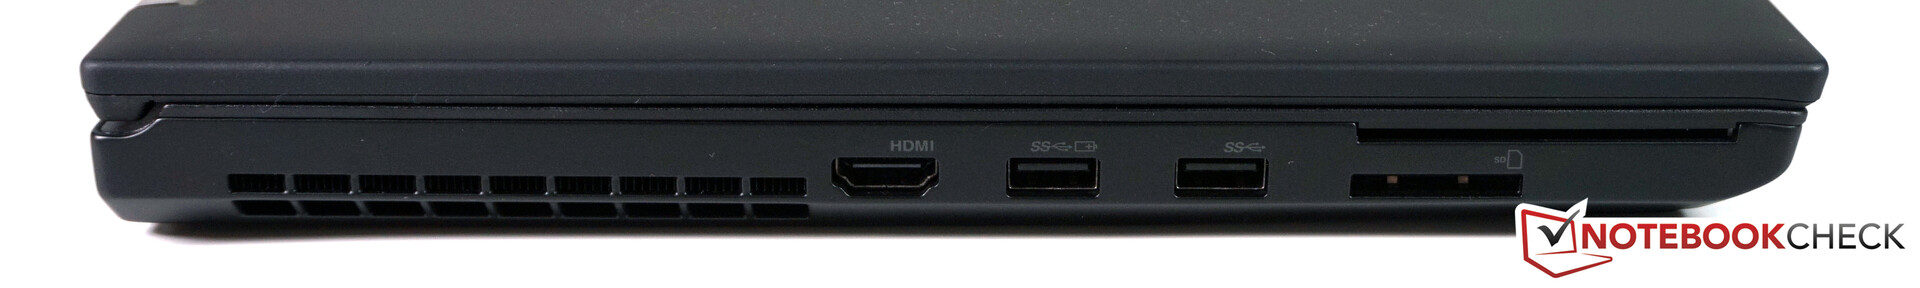

| SD Card Reader | |
| average JPG Copy Test (av. of 3 runs) | |
| Dell Precision 7530 (Toshiba Exceria Pro SDXC 64 GB UHS-II) | |
| Lenovo ThinkPad P53-20QN000YGE (Toshiba Exceria Pro SDXC 64 GB UHS-II) | |
| Lenovo ThinkPad P1 2019-20QT000RGE (Toshiba Exceria Pro SDXC 64 GB UHS-II) | |
| Lenovo ThinkPad P52 20MAS03N00 (Toshiba Exceria Pro SDXC 64 GB UHS-II) | |
| Fujitsu Celsius H780 (Toshiba Exceria Pro SDXC 64 GB UHS-II) | |
| Gemiddelde van klas Workstation (49.6 - 681, n=14, laatste 2 jaar) | |
| maximum AS SSD Seq Read Test (1GB) | |
| Gemiddelde van klas Workstation (87.6 - 1455, n=14, laatste 2 jaar) | |
| Lenovo ThinkPad P53-20QN000YGE (Toshiba Exceria Pro SDXC 64 GB UHS-II) | |
| Lenovo ThinkPad P1 2019-20QT000RGE (Toshiba Exceria Pro SDXC 64 GB UHS-II) | |
| Dell Precision 7530 (Toshiba Exceria Pro SDXC 64 GB UHS-II) | |
| Lenovo ThinkPad P52 20MAS03N00 (Toshiba Exceria Pro SDXC 64 GB UHS-II) | |
| Fujitsu Celsius H780 (Toshiba Exceria Pro SDXC 64 GB UHS-II) | |
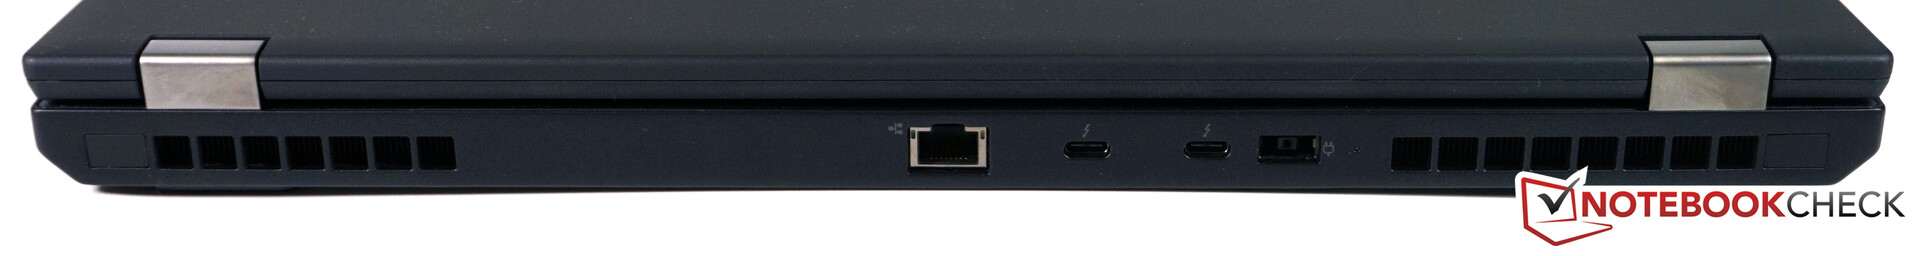
| Networking | |
| iperf3 transmit AX12 | |
| Lenovo ThinkPad P53-20QN000YGE | |
| Lenovo ThinkPad P53-20QN000YGE | |
| Lenovo ThinkPad P1 2019-20QT000RGE | |
| Dell Precision 7530 | |
| Lenovo ThinkPad P52 20MAS03N00 | |
| Fujitsu Celsius H780 | |
| MSI P65 Creator 9SF-657 | |
| iperf3 receive AX12 | |
| Lenovo ThinkPad P53-20QN000YGE | |
| Lenovo ThinkPad P53-20QN000YGE | |
| Dell Precision 7530 | |
| Fujitsu Celsius H780 | |
| Lenovo ThinkPad P52 20MAS03N00 | |
| Lenovo ThinkPad P1 2019-20QT000RGE | |
| MSI P65 Creator 9SF-657 | |
| |||||||||||||||||||||||||
Helderheidsverdeling: 89 %
Helderheid in Batterij-modus: 490 cd/m²
Contrast: 1417:1 (Zwart: 0.36 cd/m²)
ΔE ColorChecker Calman: 2.3 | ∀{0.5-29.43 Ø4.71}
calibrated: 1.2
ΔE Greyscale Calman: 3.2 | ∀{0.09-98 Ø4.96}
93.1% sRGB (Argyll 1.6.3 3D)
59.4% AdobeRGB 1998 (Argyll 1.6.3 3D)
64.3% AdobeRGB 1998 (Argyll 3D)
92.9% sRGB (Argyll 3D)
63.2% Display P3 (Argyll 3D)
Gamma: 2.34
CCT: 7036 K
| Lenovo ThinkPad P53-20QN000YGE N156HCE-GN1, IPS, 1920x1080, 15.6" | Lenovo ThinkPad P52 20MAS03N00 N156HCE-EN1, IPS LED, 1920x1080, 15.6" | Lenovo ThinkPad P1 2019-20QT000RGE N156HCE-GN1, IPS LED, 1920x1080, 15.6" | Dell Precision 7530 Sharp LQ156D1, IPS, 3840x2160, 15.6" | Fujitsu Celsius H780 LP156WF6-SPP1, IPS LED, 1920x1080, 15.6" | MSI P65 Creator 9SF-657 AU Optronics AUO41EB, IPS, 3840x2160, 15.6" | |
|---|---|---|---|---|---|---|
| Display | 1% | -1% | 29% | -2% | 32% | |
| Display P3 Coverage (%) | 63.2 | 65.6 4% | 62.4 -1% | 82.5 31% | 66.3 5% | 84.4 34% |
| sRGB Coverage (%) | 92.9 | 90.3 -3% | 91.5 -2% | 99.4 7% | 85.9 -8% | 100 8% |
| AdobeRGB 1998 Coverage (%) | 64.3 | 65.9 2% | 63.4 -1% | 96.2 50% | 62.8 -2% | 98.5 53% |
| Response Times | -3% | 27% | 2% | -3% | -28% | |
| Response Time Grey 50% / Grey 80% * (ms) | 38.4 ? | 39.2 ? -2% | 34.4 ? 10% | 35.2 ? 8% | 38 ? 1% | 51 ? -33% |
| Response Time Black / White * (ms) | 25.2 ? | 26 ? -3% | 14 ? 44% | 26.4 ? -5% | 26.8 ? -6% | 31 ? -23% |
| PWM Frequency (Hz) | 26040 ? | 25250 ? | 26040 ? | 198.4 ? | 20830 ? | |
| Screen | -34% | -15% | -31% | -36% | -23% | |
| Brightness middle (cd/m²) | 510 | 304 -40% | 542 6% | 292.8 -43% | 271 -47% | 445 -13% |
| Brightness (cd/m²) | 468 | 293 -37% | 528 13% | 295 -37% | 260 -44% | 462 -1% |
| Brightness Distribution (%) | 89 | 88 -1% | 84 -6% | 85 -4% | 86 -3% | 83 -7% |
| Black Level * (cd/m²) | 0.36 | 0.26 28% | 0.41 -14% | 0.36 -0% | 0.29 19% | 0.5 -39% |
| Contrast (:1) | 1417 | 1169 -18% | 1322 -7% | 813 -43% | 934 -34% | 890 -37% |
| Colorchecker dE 2000 * | 2.3 | 4.5 -96% | 3.5 -52% | 3.48 -51% | 3.9 -70% | 4.75 -107% |
| Colorchecker dE 2000 max. * | 5.5 | 7.7 -40% | 7.8 -42% | 6.81 -24% | 10.2 -85% | 7.79 -42% |
| Colorchecker dE 2000 calibrated * | 1.2 | 2.4 -100% | 1.3 -8% | 3.13 -161% | 2.9 -142% | |
| Greyscale dE 2000 * | 3.2 | 5.2 -63% | 4.8 -50% | 4.1 -28% | 2.6 19% | 4.49 -40% |
| Gamma | 2.34 94% | 2.26 97% | 2.33 94% | 2.2 100% | 2.29 96% | 2.49 88% |
| CCT | 7036 92% | 6789 96% | 7690 85% | 6740 96% | 6517 100% | 7374 88% |
| Color Space (Percent of AdobeRGB 1998) (%) | 59.4 | 53.8 -9% | 58.8 -1% | 84.4 42% | 56.1 -6% | 87 46% |
| Color Space (Percent of sRGB) (%) | 93.1 | 90.1 -3% | 91.1 -2% | 99.6 7% | 85.8 -8% | 100 7% |
| Totaal Gemiddelde (Programma / Instellingen) | -12% /
-24% | 4% /
-7% | 0% /
-16% | -14% /
-26% | -6% /
-13% |
* ... kleiner is beter
Responstijd Scherm
| ↔ Responstijd Zwart naar Wit | ||
|---|---|---|
| 25.2 ms ... stijging ↗ en daling ↘ gecombineerd | ↗ 15.2 ms stijging | 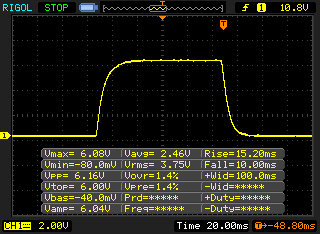 |
| ↘ 10 ms daling | ||
| Het scherm vertoonde relatief trage responstijden in onze tests en is misschien te traag voor games. Ter vergelijking: alle testtoestellen variëren van 0.1 (minimum) tot 240 (maximum) ms. » 61 % van alle toestellen zijn beter. Dit betekent dat de gemeten responstijd slechter is dan het gemiddelde (19.8 ms) van alle geteste toestellen. | ||
| ↔ Responstijd 50% Grijs naar 80% Grijs | ||
| 38.4 ms ... stijging ↗ en daling ↘ gecombineerd | ↗ 18.8 ms stijging | 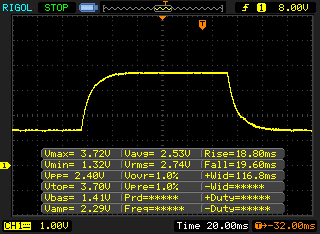 |
| ↘ 19.6 ms daling | ||
| Het scherm vertoonde trage responstijden in onze tests en is misschien te traag voor games. Ter vergelijking: alle testtoestellen variëren van 0.165 (minimum) tot 636 (maximum) ms. » 58 % van alle toestellen zijn beter. Dit betekent dat de gemeten responstijd slechter is dan het gemiddelde (31 ms) van alle geteste toestellen. | ||
Screen Flickering / PWM (Pulse-Width Modulation)
| Screen flickering / PWM waargenomen | 26040 Hz | ≤ 77 % helderheid instelling | 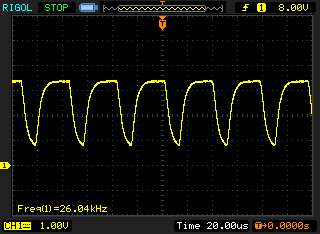 |
De achtergrondverlichting van het scherm flikkert op 26040 Hz (in het slechtste geval, bijvoorbeeld bij gebruik van PWM) aan een helderheid van 77 % en lager. Boven deze helderheid zou er geen flickering / PWM mogen optreden. De frequentie van 26040 Hz is redelijk hoog en de meeste mensen die gevoelig zijn aan flickering zouden dit dus niet mogen waarnemen of geïrriteerde ogen krijgen. Ter vergelijking: 52 % van alle geteste toestellen maakten geen gebruik van PWM om de schermhelderheid te verlagen. Als het wel werd gebruikt, werd een gemiddelde van 7757 (minimum: 5 - maximum: 343500) Hz waargenomen. | |||
| PCMark 10 | |
| Score | |
| Lenovo ThinkPad P53-20QN000YGE | |
| Dell Precision 7530 | |
| MSI P65 Creator 9SF-657 | |
| Fujitsu Celsius H780 | |
| Lenovo ThinkPad P1 2019-20QT000RGE | |
| Lenovo ThinkPad P52 20MAS03N00 | |
| Essentials | |
| Lenovo ThinkPad P53-20QN000YGE | |
| Lenovo ThinkPad P1 2019-20QT000RGE | |
| Dell Precision 7530 | |
| MSI P65 Creator 9SF-657 | |
| Fujitsu Celsius H780 | |
| Lenovo ThinkPad P52 20MAS03N00 | |
| Productivity | |
| Dell Precision 7530 | |
| Lenovo ThinkPad P53-20QN000YGE | |
| Fujitsu Celsius H780 | |
| Lenovo ThinkPad P1 2019-20QT000RGE | |
| Lenovo ThinkPad P52 20MAS03N00 | |
| MSI P65 Creator 9SF-657 | |
| Digital Content Creation | |
| MSI P65 Creator 9SF-657 | |
| Lenovo ThinkPad P53-20QN000YGE | |
| Dell Precision 7530 | |
| Fujitsu Celsius H780 | |
| Lenovo ThinkPad P1 2019-20QT000RGE | |
| Lenovo ThinkPad P52 20MAS03N00 | |

| 3DMark 06 Standard Score | 38739 punten | |
| 3DMark Vantage P Result | 54153 punten | |
| 3DMark 11 Performance | 19250 punten | |
| 3DMark Ice Storm Standard Score | 98630 punten | |
| 3DMark Cloud Gate Standard Score | 38066 punten | |
| 3DMark Fire Strike Score | 16547 punten | |
| 3DMark Time Spy Score | 6879 punten | |
Help | ||
| lage | gem. | hoge | ultra | QHD | 4K | |
|---|---|---|---|---|---|---|
| GTA V (2015) | 177 | 170 | 150.4 | 77.6 | 68.4 | |
| The Witcher 3 (2015) | 320 | 235 | 141 | 71 | 46.4 | |
| Dota 2 Reborn (2015) | 148 | 137 | 132 | 126 | 102 | |
| Rise of the Tomb Raider (2016) | 281.4 | 198.6 | 134.5 | 110.1 | 45.4 | |
| X-Plane 11.11 (2018) | 117 | 99 | 85 | |||
| Shadow of the Tomb Raider (2018) | 127 | 102 | 98 | 87 | 59 | 29 |
| Hitman 2 (2018) | 87.7 | 85.3 | 78.4 | 75.3 | 73.3 | 46.6 |
| Battlefield V (2018) | 153.6 | 105.4 | 88.2 | 81.2 | 68.3 | 42.5 |
| Far Cry New Dawn (2019) | 107 | 98 | 90 | 86 | 72 | 43 |
| Dirt Rally 2.0 (2019) | 275 | 188.9 | 160.3 | 89.3 | 66.8 | |
| Anno 1800 (2019) | 94.5 | 97.8 | 73.9 | 38.9 | 31.5 | |
| F1 2019 (2019) | 113 | 101 | 93 | 88 | 83 | 52 |
| Ghost Recon Breakpoint (2019) | 127 | 105 | 93 | 65 | 47 | 26 |
| GRID 2019 (2019) | 178.8 | 155.6 | 118.5 | 79.2 | 61.4 | 36.8 |
Geluidsniveau
| Onbelast |
| 28.3 / 28.3 / 28.3 dB (A) |
| Belasting |
| 29.8 / 38.3 dB (A) |
 | ||
30 dB stil 40 dB(A) hoorbaar 50 dB(A) luid |
||
min: | ||
| Lenovo ThinkPad P53-20QN000YGE Quadro RTX 5000 Max-Q, i7-9850H, Samsung PM981a MZVLB1T0HBLR | Lenovo ThinkPad P1 2019-20QT000RGE Quadro T1000 (Laptop), i7-9850H, WDC PC SN720 SDAQNTW-512G | Dell Precision 7530 Quadro P3200, i9-8950HK, Samsung PM961 NVMe MZVLW512HMJP | Fujitsu Celsius H780 Quadro P2000, i7-8850H, Samsung SSD PM981 MZVLB512HAJQ | MSI P65 Creator 9SF-657 GeForce RTX 2070 Max-Q, i9-9880H, 2x Samsung SSD PM981 MZVLB512HAJQ (RAID 0) | Lenovo ThinkPad P52 20MAS03N00 Quadro P1000, i7-8750H, Samsung SSD PM981 MZVLB512HAJQ | |
|---|---|---|---|---|---|---|
| Noise | -4% | -12% | -20% | -18% | -3% | |
| uit / omgeving * (dB) | 28.3 | 28.8 -2% | 28.3 -0% | 29.6 -5% | 30.2 -7% | 29.5 -4% |
| Idle Minimum * (dB) | 28.3 | 28.8 -2% | 28.3 -0% | 29.6 -5% | 32.8 -16% | 29.5 -4% |
| Idle Average * (dB) | 28.3 | 28.8 -2% | 28.3 -0% | 32.2 -14% | 32.8 -16% | 29.5 -4% |
| Idle Maximum * (dB) | 28.3 | 28.8 -2% | 30.5 -8% | 37 -31% | 33.6 -19% | 29.5 -4% |
| Load Average * (dB) | 29.8 | 36.1 -21% | 34.5 -16% | 40.3 -35% | 40.9 -37% | 34.7 -16% |
| Witcher 3 ultra * (dB) | 38.3 | 49.5 -29% | 33.1 14% | |||
| Load Maximum * (dB) | 38.3 | 36.7 4% | 49.5 -29% | 49.4 -29% | 42.7 -11% | 39.4 -3% |
* ... kleiner is beter
(±) De maximumtemperatuur aan de bovenzijde bedraagt 41.8 °C / 107 F, vergeleken met het gemiddelde van 38.2 °C / 101 F, variërend van 22.2 tot 69.8 °C voor de klasse Workstation.
(-) De bodem warmt op tot een maximum van 46.1 °C / 115 F, vergeleken met een gemiddelde van 41.1 °C / 106 F
(+) Bij onbelast gebruik bedraagt de gemiddelde temperatuur voor de bovenzijde 21.9 °C / 71 F, vergeleken met het apparaatgemiddelde van 32 °C / 90 F.
(±) Bij het spelen van The Witcher 3 is de gemiddelde temperatuur voor de bovenzijde 38 °C / 100 F, vergeleken met het apparaatgemiddelde van 32 °C / 90 F.
(±) De palmsteunen en het touchpad kunnen zeer heet aanvoelen met een maximum van ###max## °C / 98.8 F.
(-) De gemiddelde temperatuur van de handpalmsteun van soortgelijke toestellen bedroeg 27.8 °C / 82 F (-9.3 °C / -16.8 F).
Lenovo ThinkPad P53-20QN000YGE audioanalyse
(±) | luidspreker luidheid is gemiddeld maar goed (72.8 dB)
Bas 100 - 315 Hz
(±) | verminderde zeebaars - gemiddeld 11.6% lager dan de mediaan
(±) | lineariteit van de lage tonen is gemiddeld (13.6% delta ten opzichte van de vorige frequentie)
Midden 400 - 2000 Hz
(±) | hogere middens - gemiddeld 7.8% hoger dan de mediaan
(±) | lineariteit van de middentonen is gemiddeld (7.5% delta ten opzichte van de vorige frequentie)
Hoog 2 - 16 kHz
(+) | evenwichtige hoogtepunten - slechts 1.9% verwijderd van de mediaan
(+) | de hoge tonen zijn lineair (4.8% delta naar de vorige frequentie)
Algemeen 100 - 16.000 Hz
(±) | lineariteit van het totale geluid is gemiddeld (23.1% verschil met de mediaan)
Vergeleken met dezelfde klasse
» 83% van alle geteste apparaten in deze klasse waren beter, 3% vergelijkbaar, 14% slechter
» De beste had een delta van 7%, het gemiddelde was 17%, de slechtste was 35%
Vergeleken met alle geteste toestellen
» 69% van alle geteste apparaten waren beter, 5% gelijk, 26% slechter
» De beste had een delta van 4%, het gemiddelde was 23%, de slechtste was 134%
Dell Precision 7530 audioanalyse
(±) | luidspreker luidheid is gemiddeld maar goed (74.4 dB)
Bas 100 - 315 Hz
(±) | verminderde zeebaars - gemiddeld 8% lager dan de mediaan
(±) | lineariteit van de lage tonen is gemiddeld (12.3% delta ten opzichte van de vorige frequentie)
Midden 400 - 2000 Hz
(+) | evenwichtige middens - slechts 3.3% verwijderd van de mediaan
(±) | lineariteit van de middentonen is gemiddeld (7.8% delta ten opzichte van de vorige frequentie)
Hoog 2 - 16 kHz
(+) | evenwichtige hoogtepunten - slechts 2.3% verwijderd van de mediaan
(+) | de hoge tonen zijn lineair (5% delta naar de vorige frequentie)
Algemeen 100 - 16.000 Hz
(+) | het totale geluid is lineair (11.4% verschil met de mediaan)
Vergeleken met dezelfde klasse
» 13% van alle geteste apparaten in deze klasse waren beter, 4% vergelijkbaar, 83% slechter
» De beste had een delta van 7%, het gemiddelde was 17%, de slechtste was 35%
Vergeleken met alle geteste toestellen
» 7% van alle geteste apparaten waren beter, 2% gelijk, 90% slechter
» De beste had een delta van 4%, het gemiddelde was 23%, de slechtste was 134%
| Uit / Standby | |
| Inactief | |
| Belasting |
|
Key:
min: | |
| Lenovo ThinkPad P53-20QN000YGE i7-9850H, Quadro RTX 5000 Max-Q, Samsung PM981a MZVLB1T0HBLR, IPS, 1920x1080, 15.6" | Lenovo ThinkPad P1 2019-20QT000RGE i7-9850H, Quadro T1000 (Laptop), WDC PC SN720 SDAQNTW-512G, IPS LED, 1920x1080, 15.6" | Dell Precision 7530 i9-8950HK, Quadro P3200, Samsung PM961 NVMe MZVLW512HMJP, IPS, 3840x2160, 15.6" | Fujitsu Celsius H780 i7-8850H, Quadro P2000, Samsung SSD PM981 MZVLB512HAJQ, IPS LED, 1920x1080, 15.6" | MSI P65 Creator 9SF-657 i9-9880H, GeForce RTX 2070 Max-Q, 2x Samsung SSD PM981 MZVLB512HAJQ (RAID 0), IPS, 3840x2160, 15.6" | Lenovo ThinkPad P52 20MAS03N00 i7-8750H, Quadro P1000, Samsung SSD PM981 MZVLB512HAJQ, IPS LED, 1920x1080, 15.6" | |
|---|---|---|---|---|---|---|
| Power Consumption | -20% | -40% | 3% | -22% | 35% | |
| Idle Minimum * (Watt) | 7.9 | 13.7 -73% | 15.7 -99% | 9.1 -15% | 9.4 -19% | 4.02 49% |
| Idle Average * (Watt) | 11.8 | 17.5 -48% | 20.3 -72% | 13.2 -12% | 17.4 -47% | 7.2 39% |
| Idle Maximum * (Watt) | 14.9 | 20.9 -40% | 25.7 -72% | 14.04 6% | 19.6 -32% | 11.46 23% |
| Load Average * (Watt) | 96 | 77.2 20% | 118.9 -24% | 78.8 18% | 103 -7% | 76.3 21% |
| Witcher 3 ultra * (Watt) | 149 | 131.2 12% | 74 50% | |||
| Load Maximum * (Watt) | 207.8 | 123.7 40% | 174 16% | 172.5 17% | 216 -4% | 154 26% |
* ... kleiner is beter
| Lenovo ThinkPad P53-20QN000YGE i7-9850H, Quadro RTX 5000 Max-Q, 90 Wh | Lenovo ThinkPad P1 2019-20QT000RGE i7-9850H, Quadro T1000 (Laptop), 80 Wh | Dell Precision 7530 i9-8950HK, Quadro P3200, 97 Wh | Fujitsu Celsius H780 i7-8850H, Quadro P2000, 96 Wh | MSI P65 Creator 9SF-657 i9-9880H, GeForce RTX 2070 Max-Q, 82 Wh | Lenovo ThinkPad P52 20MAS03N00 i7-8750H, Quadro P1000, 96 Wh | Gemiddelde van klas Workstation | |
|---|---|---|---|---|---|---|---|
| Batterijduur | -20% | -40% | -32% | -46% | -5% | -16% | |
| H.264 (h) | 9.8 | 9.3 -5% | 12.2 24% | 10.1 ? 3% | |||
| WiFi v1.3 (h) | 11.1 | 8.9 -20% | 4.6 -59% | 7.5 -32% | 6 -46% | 10.6 -5% | 8.55 ? -23% |
| Load (h) | 2 | 1.3 -35% | 1.6 -20% | 1.1 -45% | 1.3 -35% | 1.441 ? -28% | |
| Reader / Idle (h) | 6.4 | 9.6 | 25.3 | 26.1 ? |
Pro
Contra
Dit is de verkorte versie van het originele artikel. Het volledige, Engelse testrapport vind je hier.
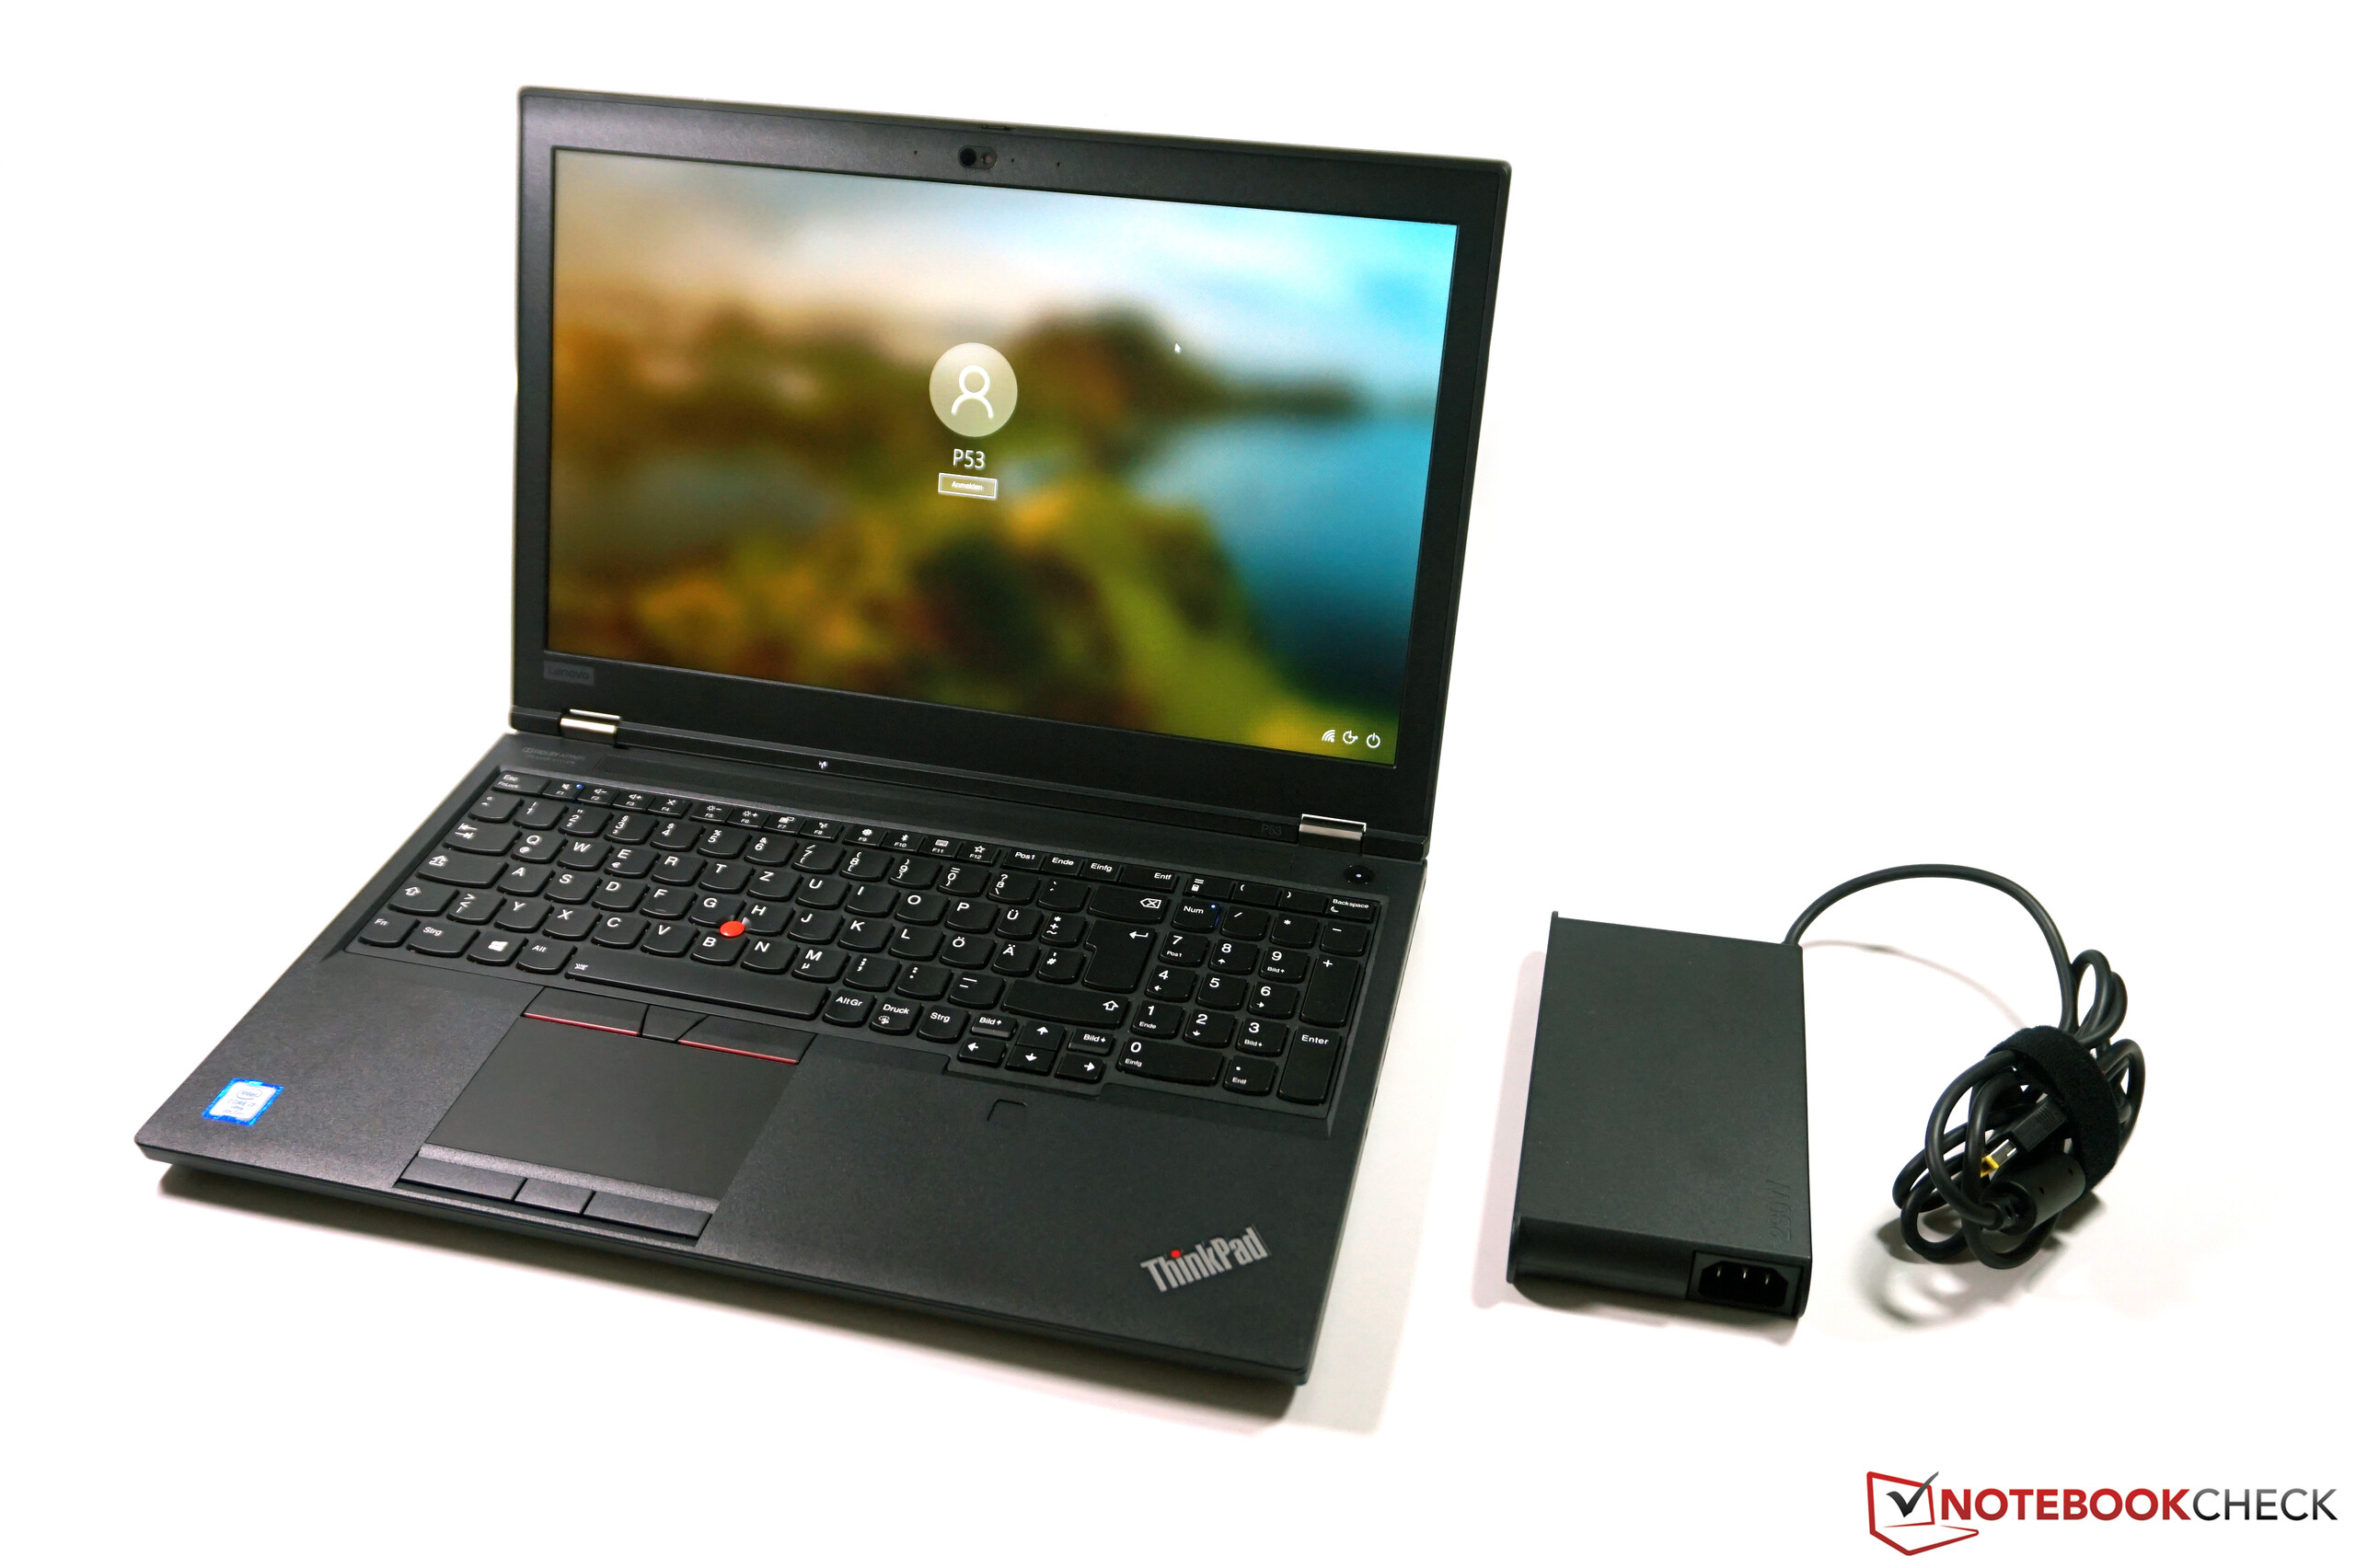
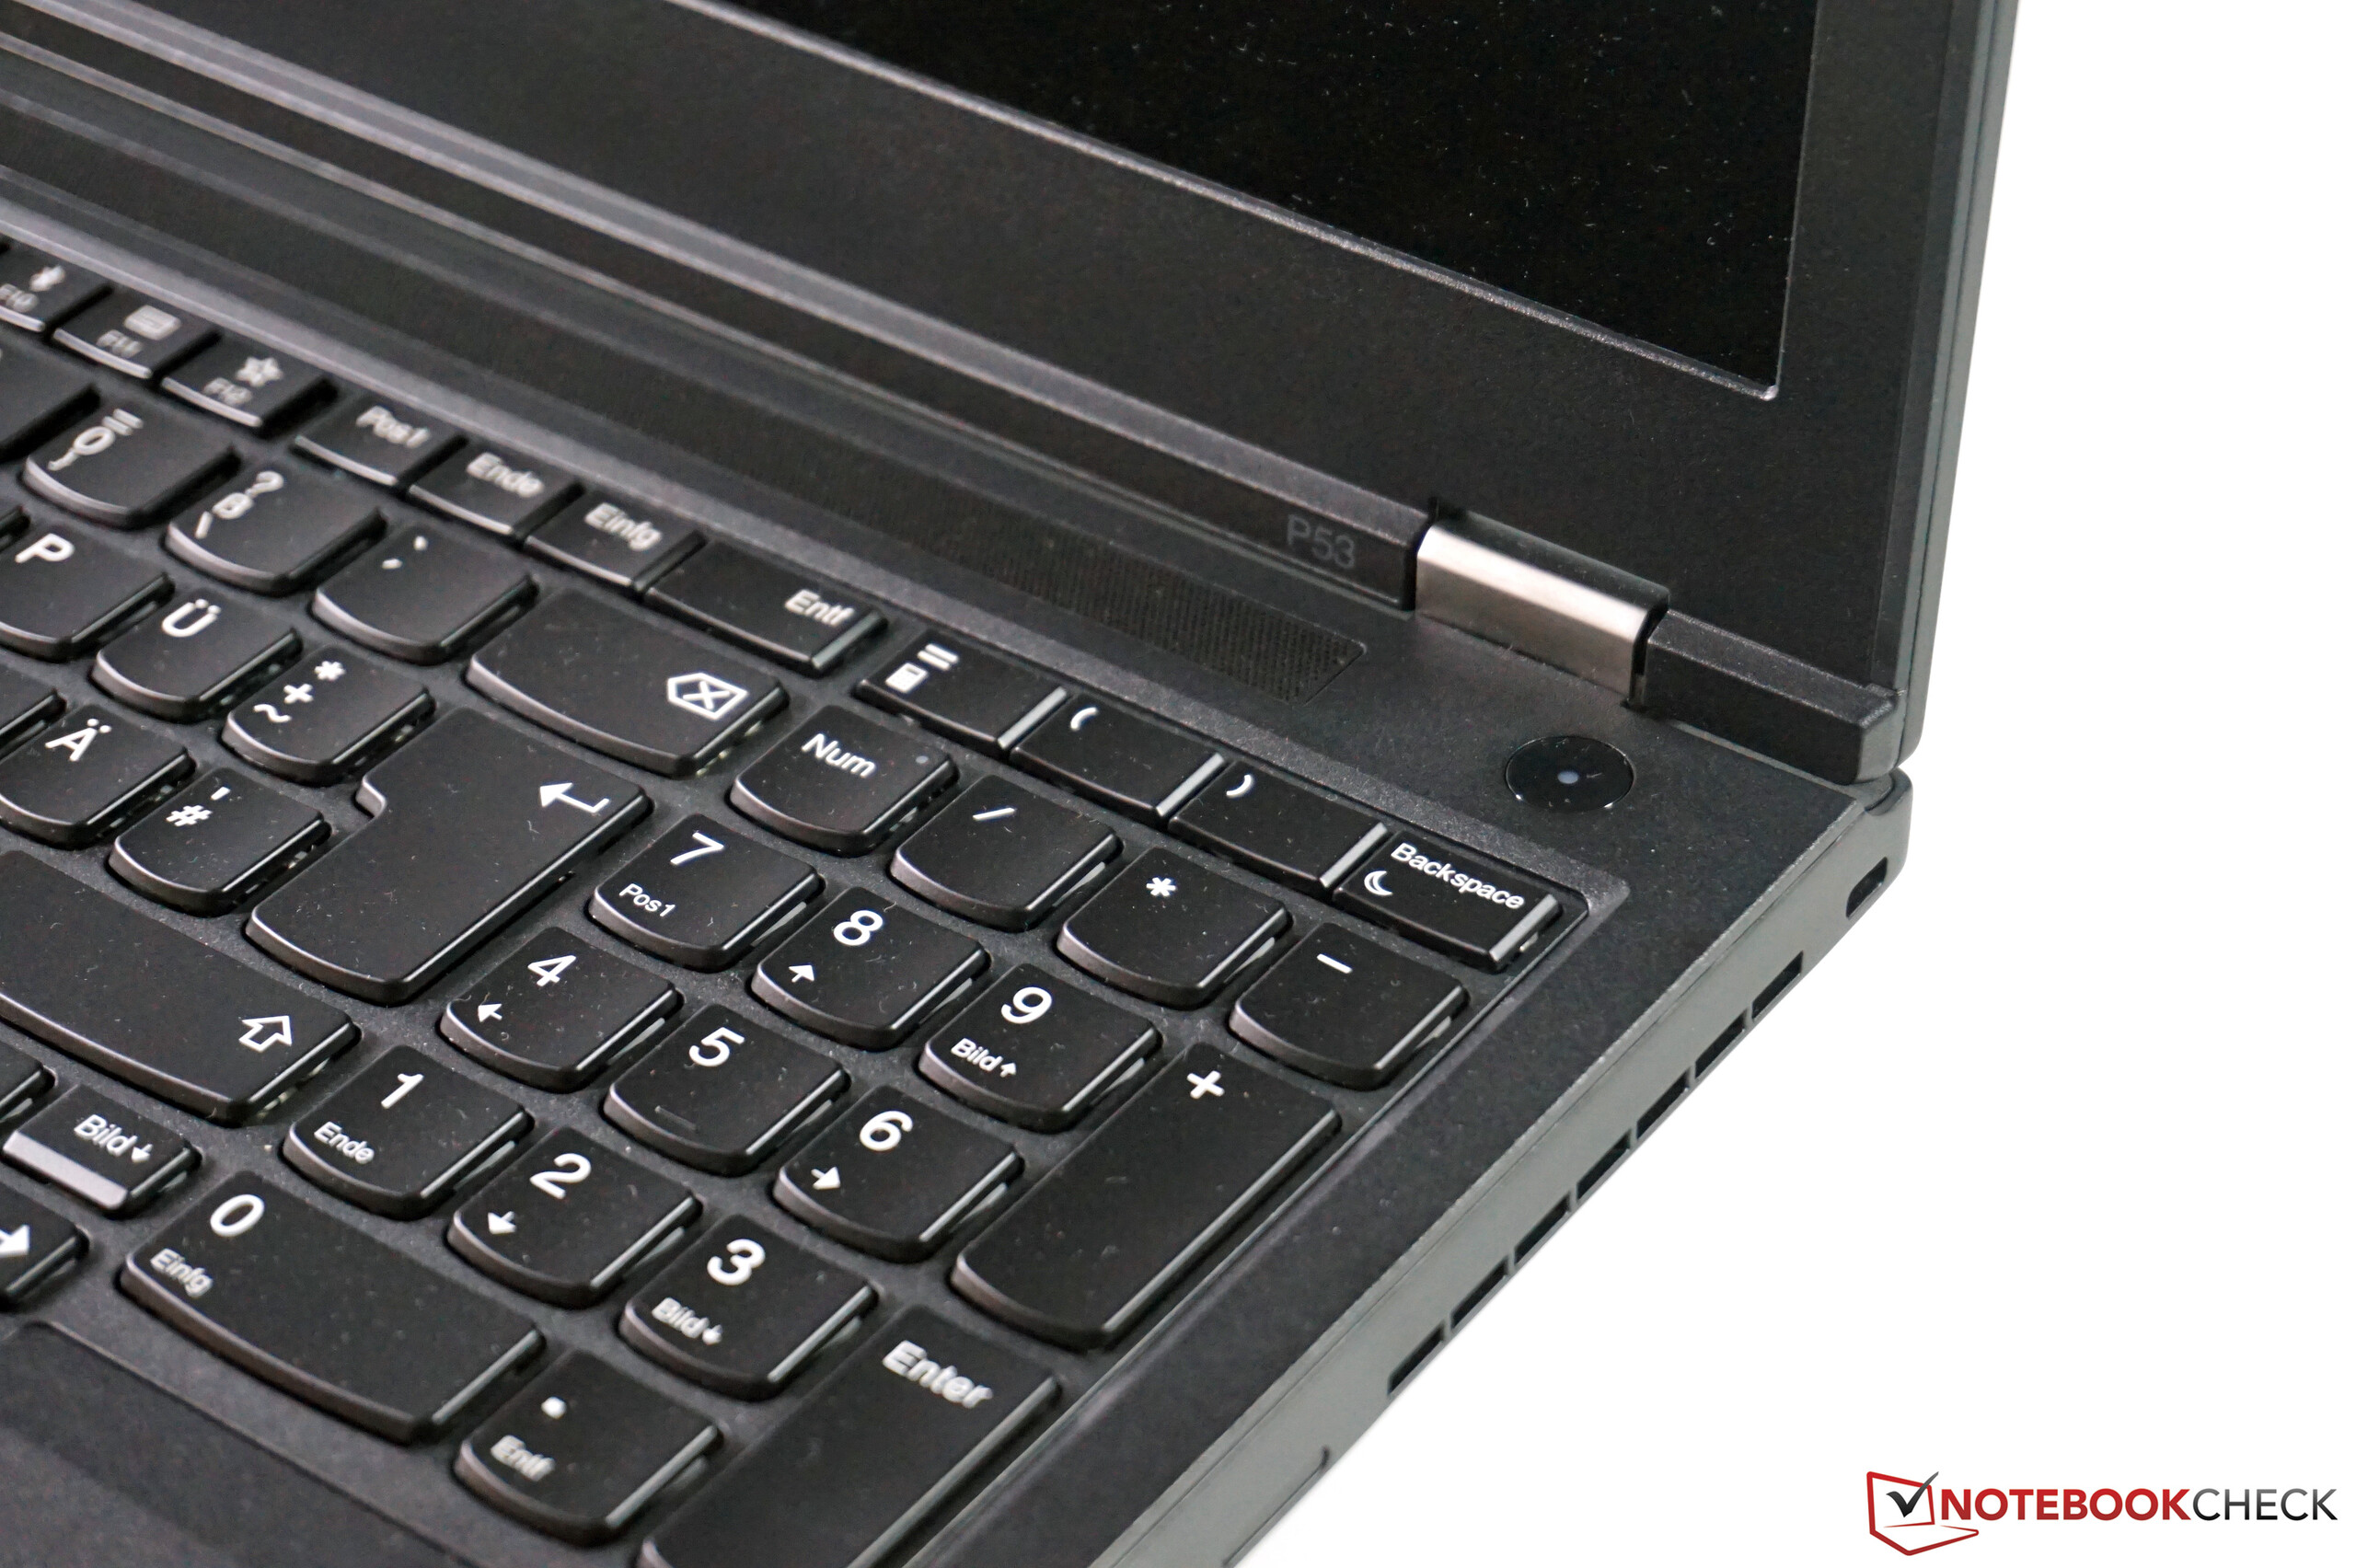
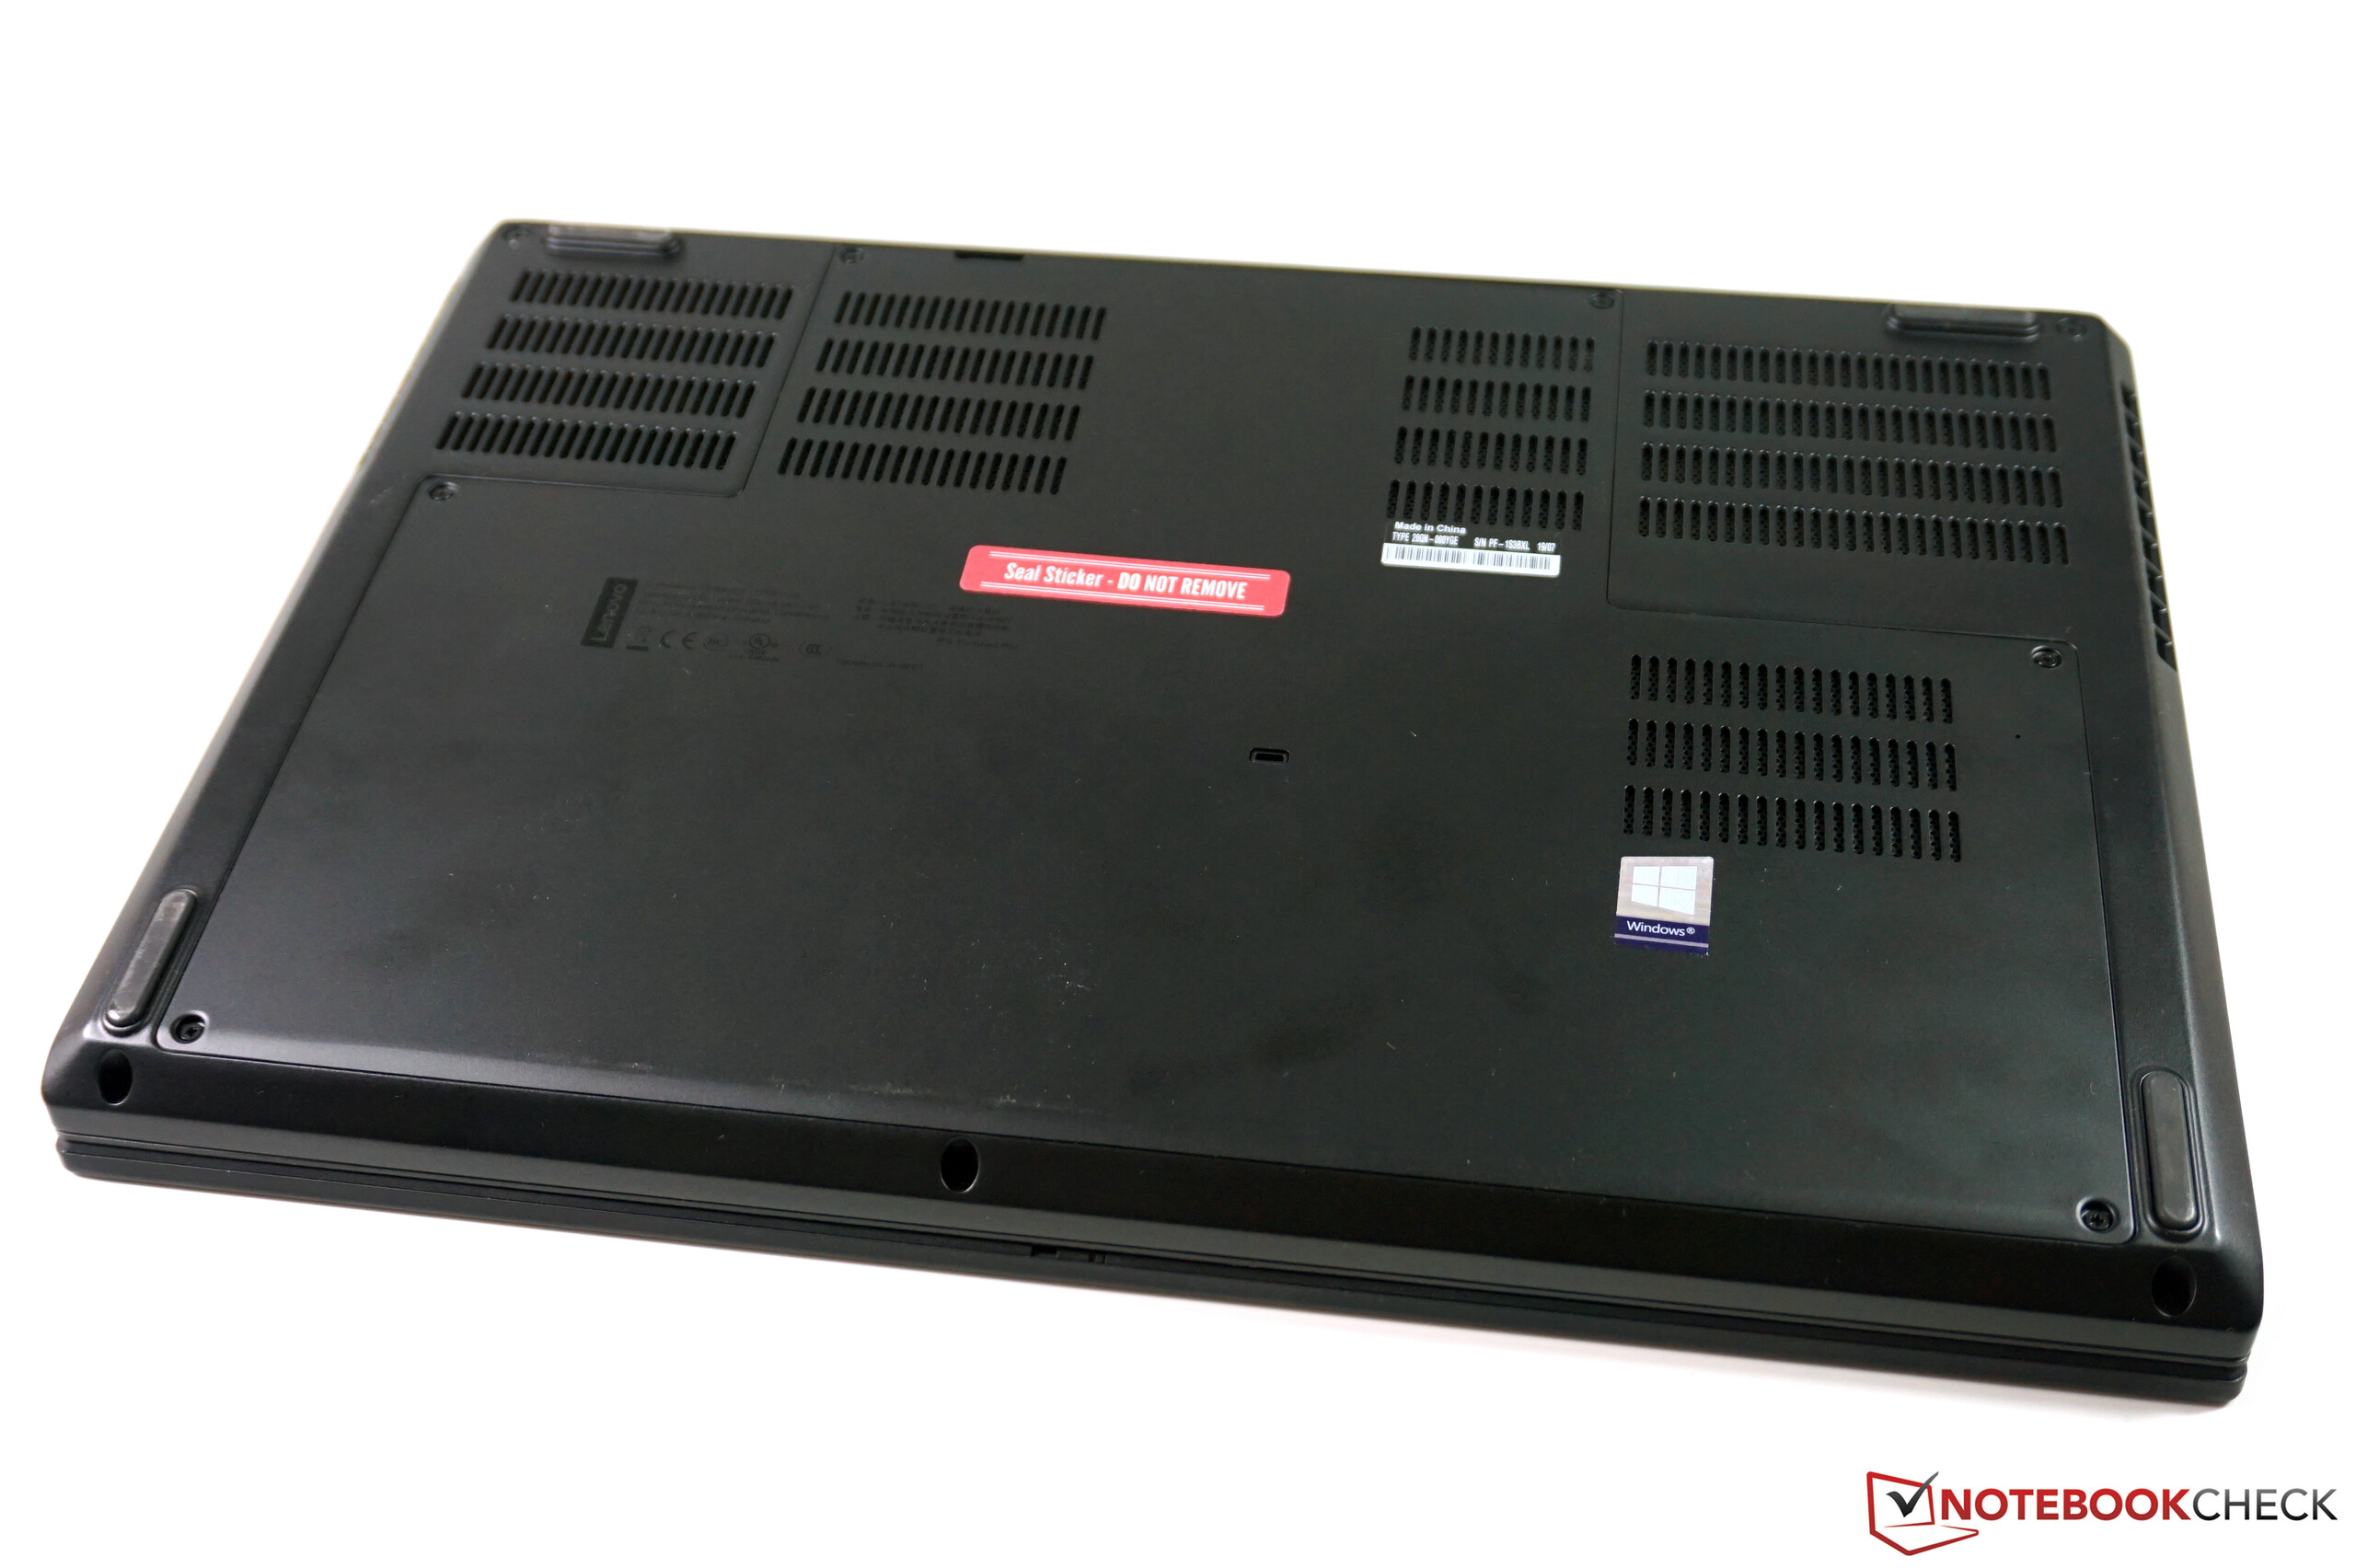
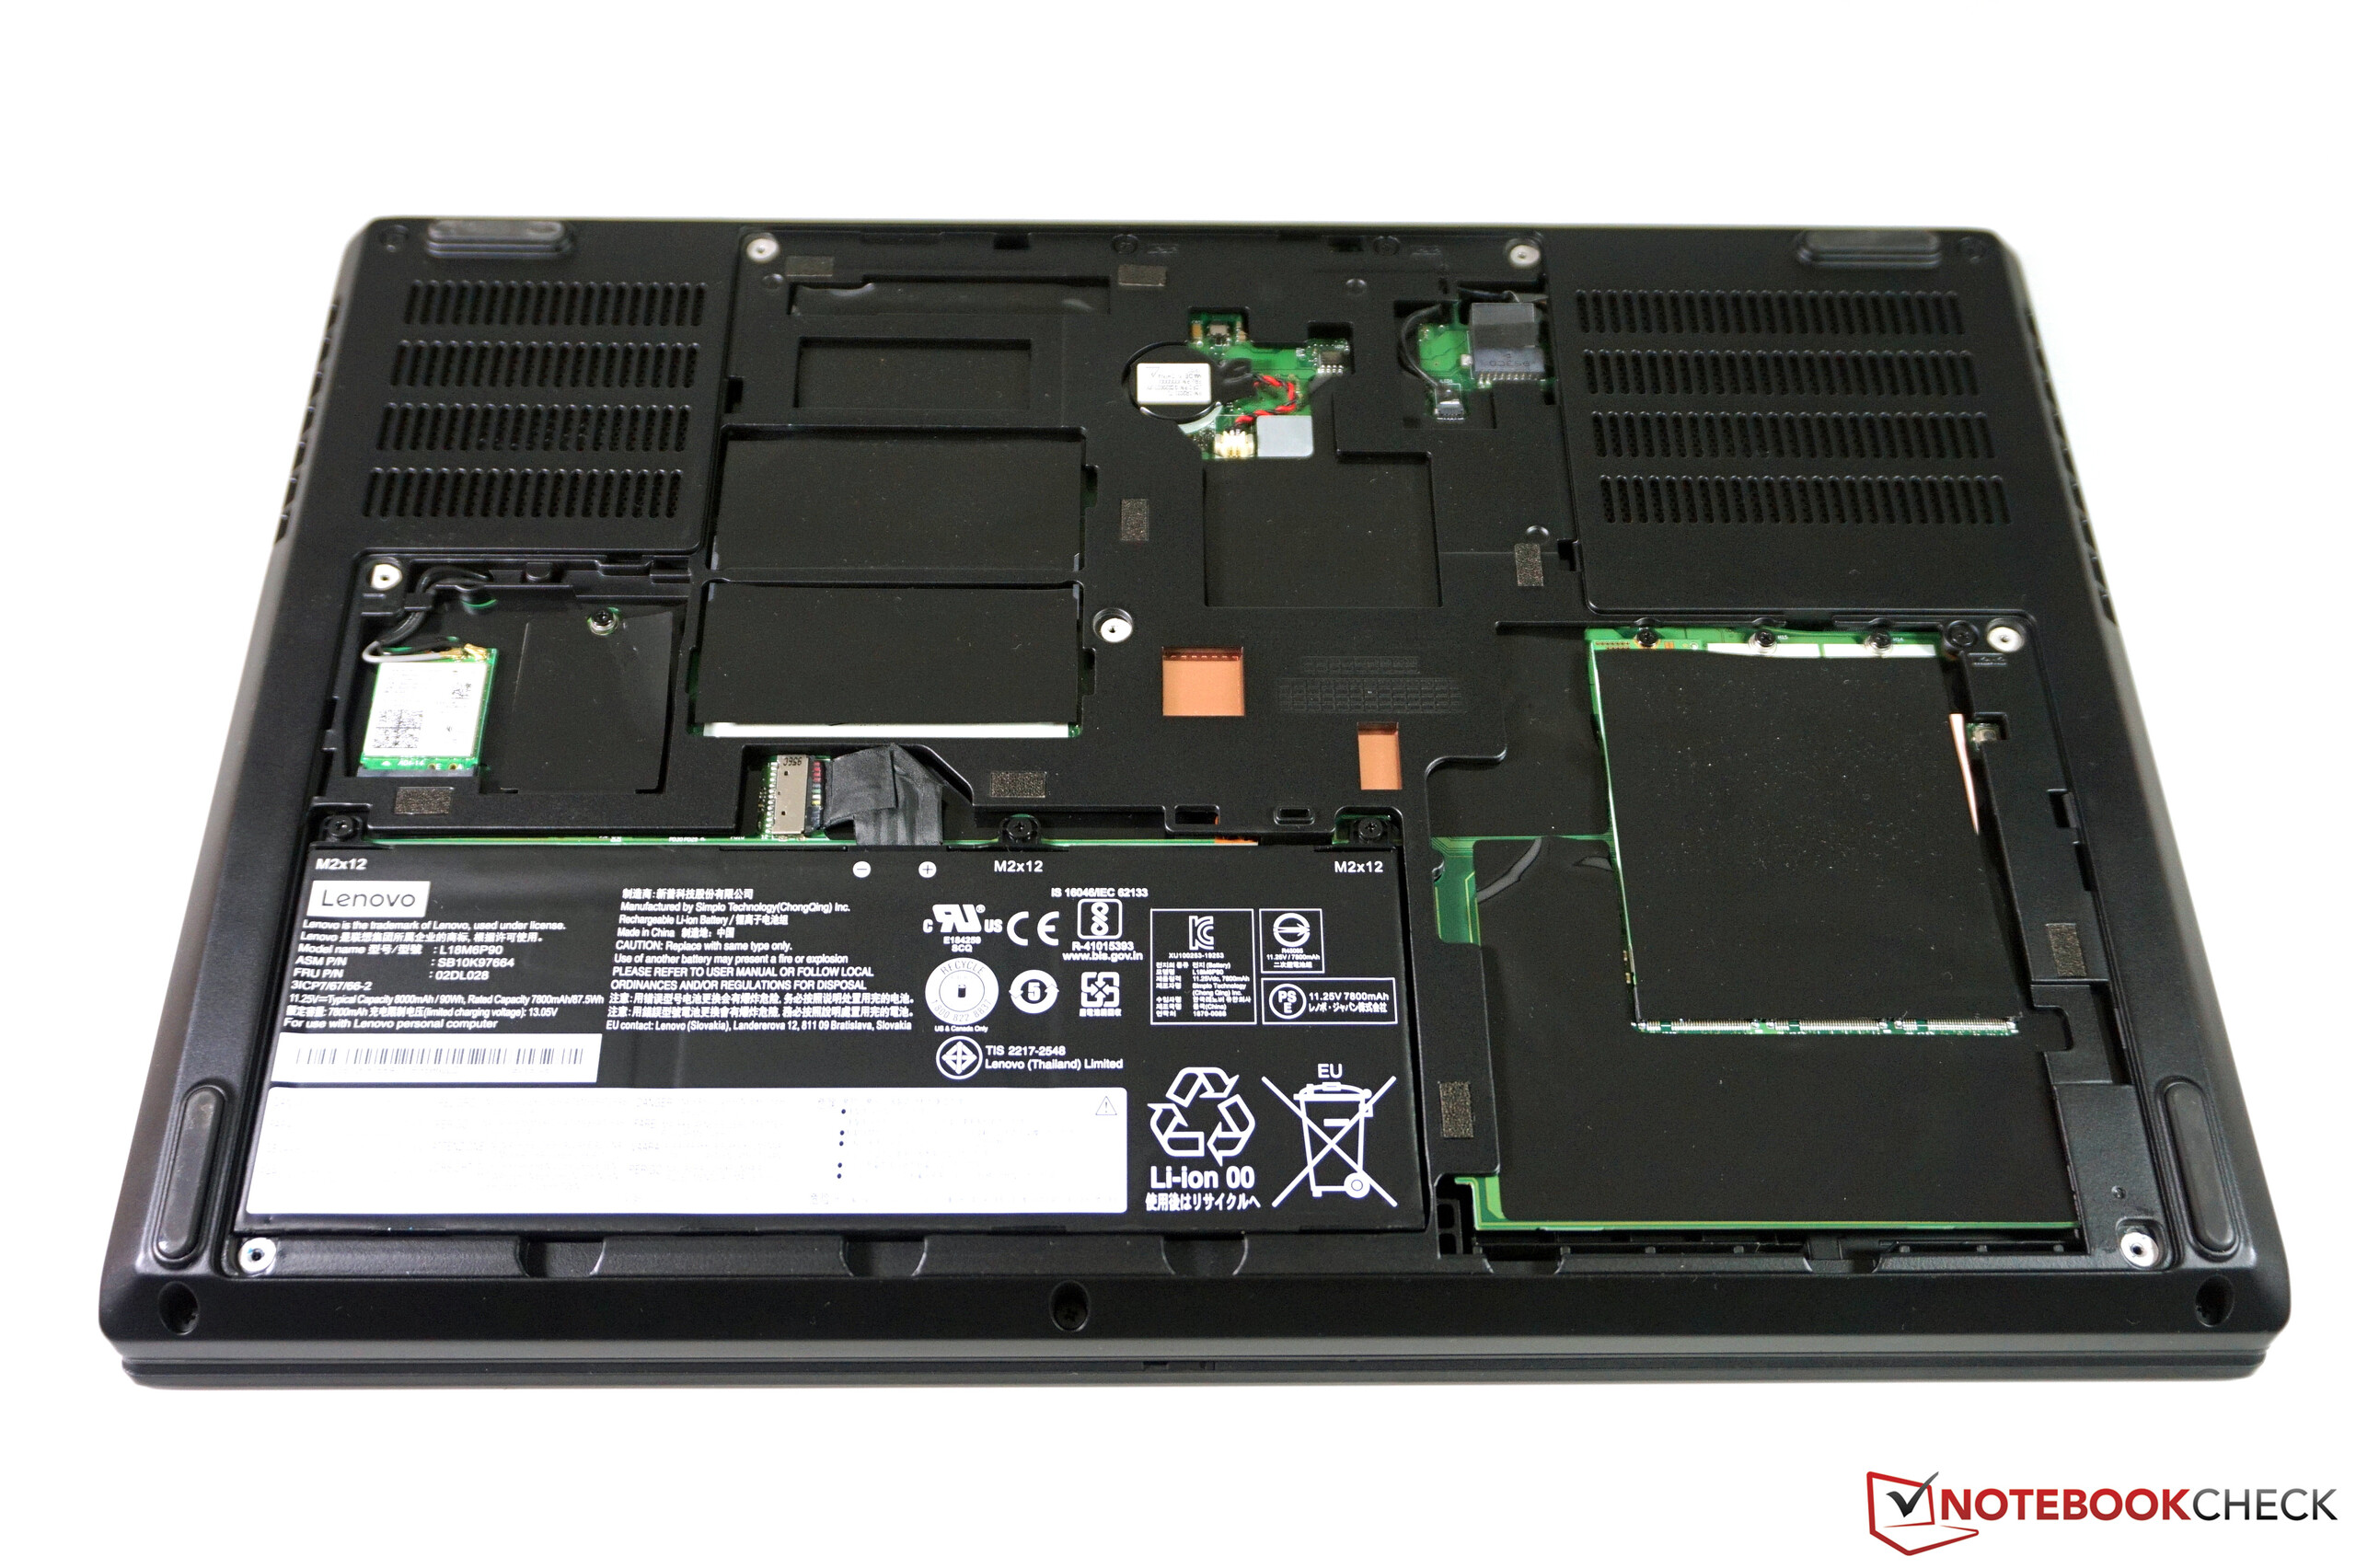
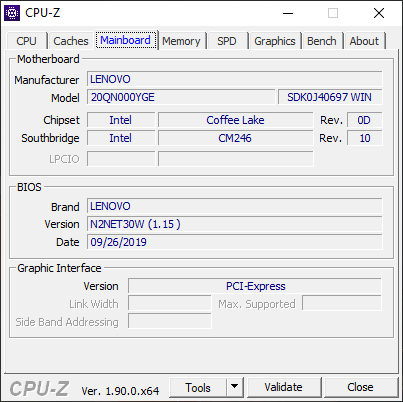
De ThinkPad P53 is een traditioneel notebook die niet veel aandacht besteed aan de huidige trends van slanke behuizingen en dunne beeldschermranden. Hierdoor is de behuizing erg robuust. Er zijn veel poorten, componenten upgraden is makkelijk en de hardware is erg krachtig, vooral op het grafische vlak.
Aan het uiterlijk is er weinig veranderd ten opzichte van de ThinkPad P52 van vorig jaar. Echter zijn er wel wat aanpassingen geweest onder de motorkap. De belangrijkste pluspunten zijn de krachtige videokaarten (Quadro RTX 4000 en 5000). Deze kaarten worden normaal gesproken gereserveerd voor de grotere 17-inch laptops. Echter is dit ook een punt van kritiek aangezien consumenten niet weten welke versie videokaarten ze kunnen verwachten. NVIDIA nog Lenovo willen bevestigen of het om de langzamere 80-watt versie in het systeem is gebouwd. Lenovo gebruikt waarschijnlijk de tragere variant van de RTX-kaarten. Al met al zijn de grafische prestaties nog steeds erg indrukwekkend.
Een scherp 1080p paneel, uitstekende invoerapparaten en indrukwekkende prestaties: de ThinkPad P53 is een goed gebalanceerd product zonder echte nadelen. Het enige waar we kritiek op hadden was het koelsysteem dat beter geoptimaliseerd kon zijn voor gecombineerde CPU & GPU ladingen.
Het koelsysteem is ook verre van perfect. We waarderen het conservatieve ventilatorbeheer. Deze verhindert het ronddraaien van de ventilatoren na korte periodes van belasting. Echter is het koelsysteem niet in staat om bij een gecombineerde CPU & GPU belasting voldoende te koelen. Dit resulteert in lagere processor prestaties. Hoewel stille ventilatoren goed zijn, kiezen gebruikers in deze prijsklasse waarschijnlijk voor high-end componenten omdat ze zoveel mogelijk prestaties nodig hebben. We kunnen alleen maar raden naar de prestaties van andere configuraties van de P53. We gaan ervanuit dat de uitvoeringen met de minder krachtige GPU’s (zoals de RTX 3000 of T-serie) beter gebruik maken van de CPU.
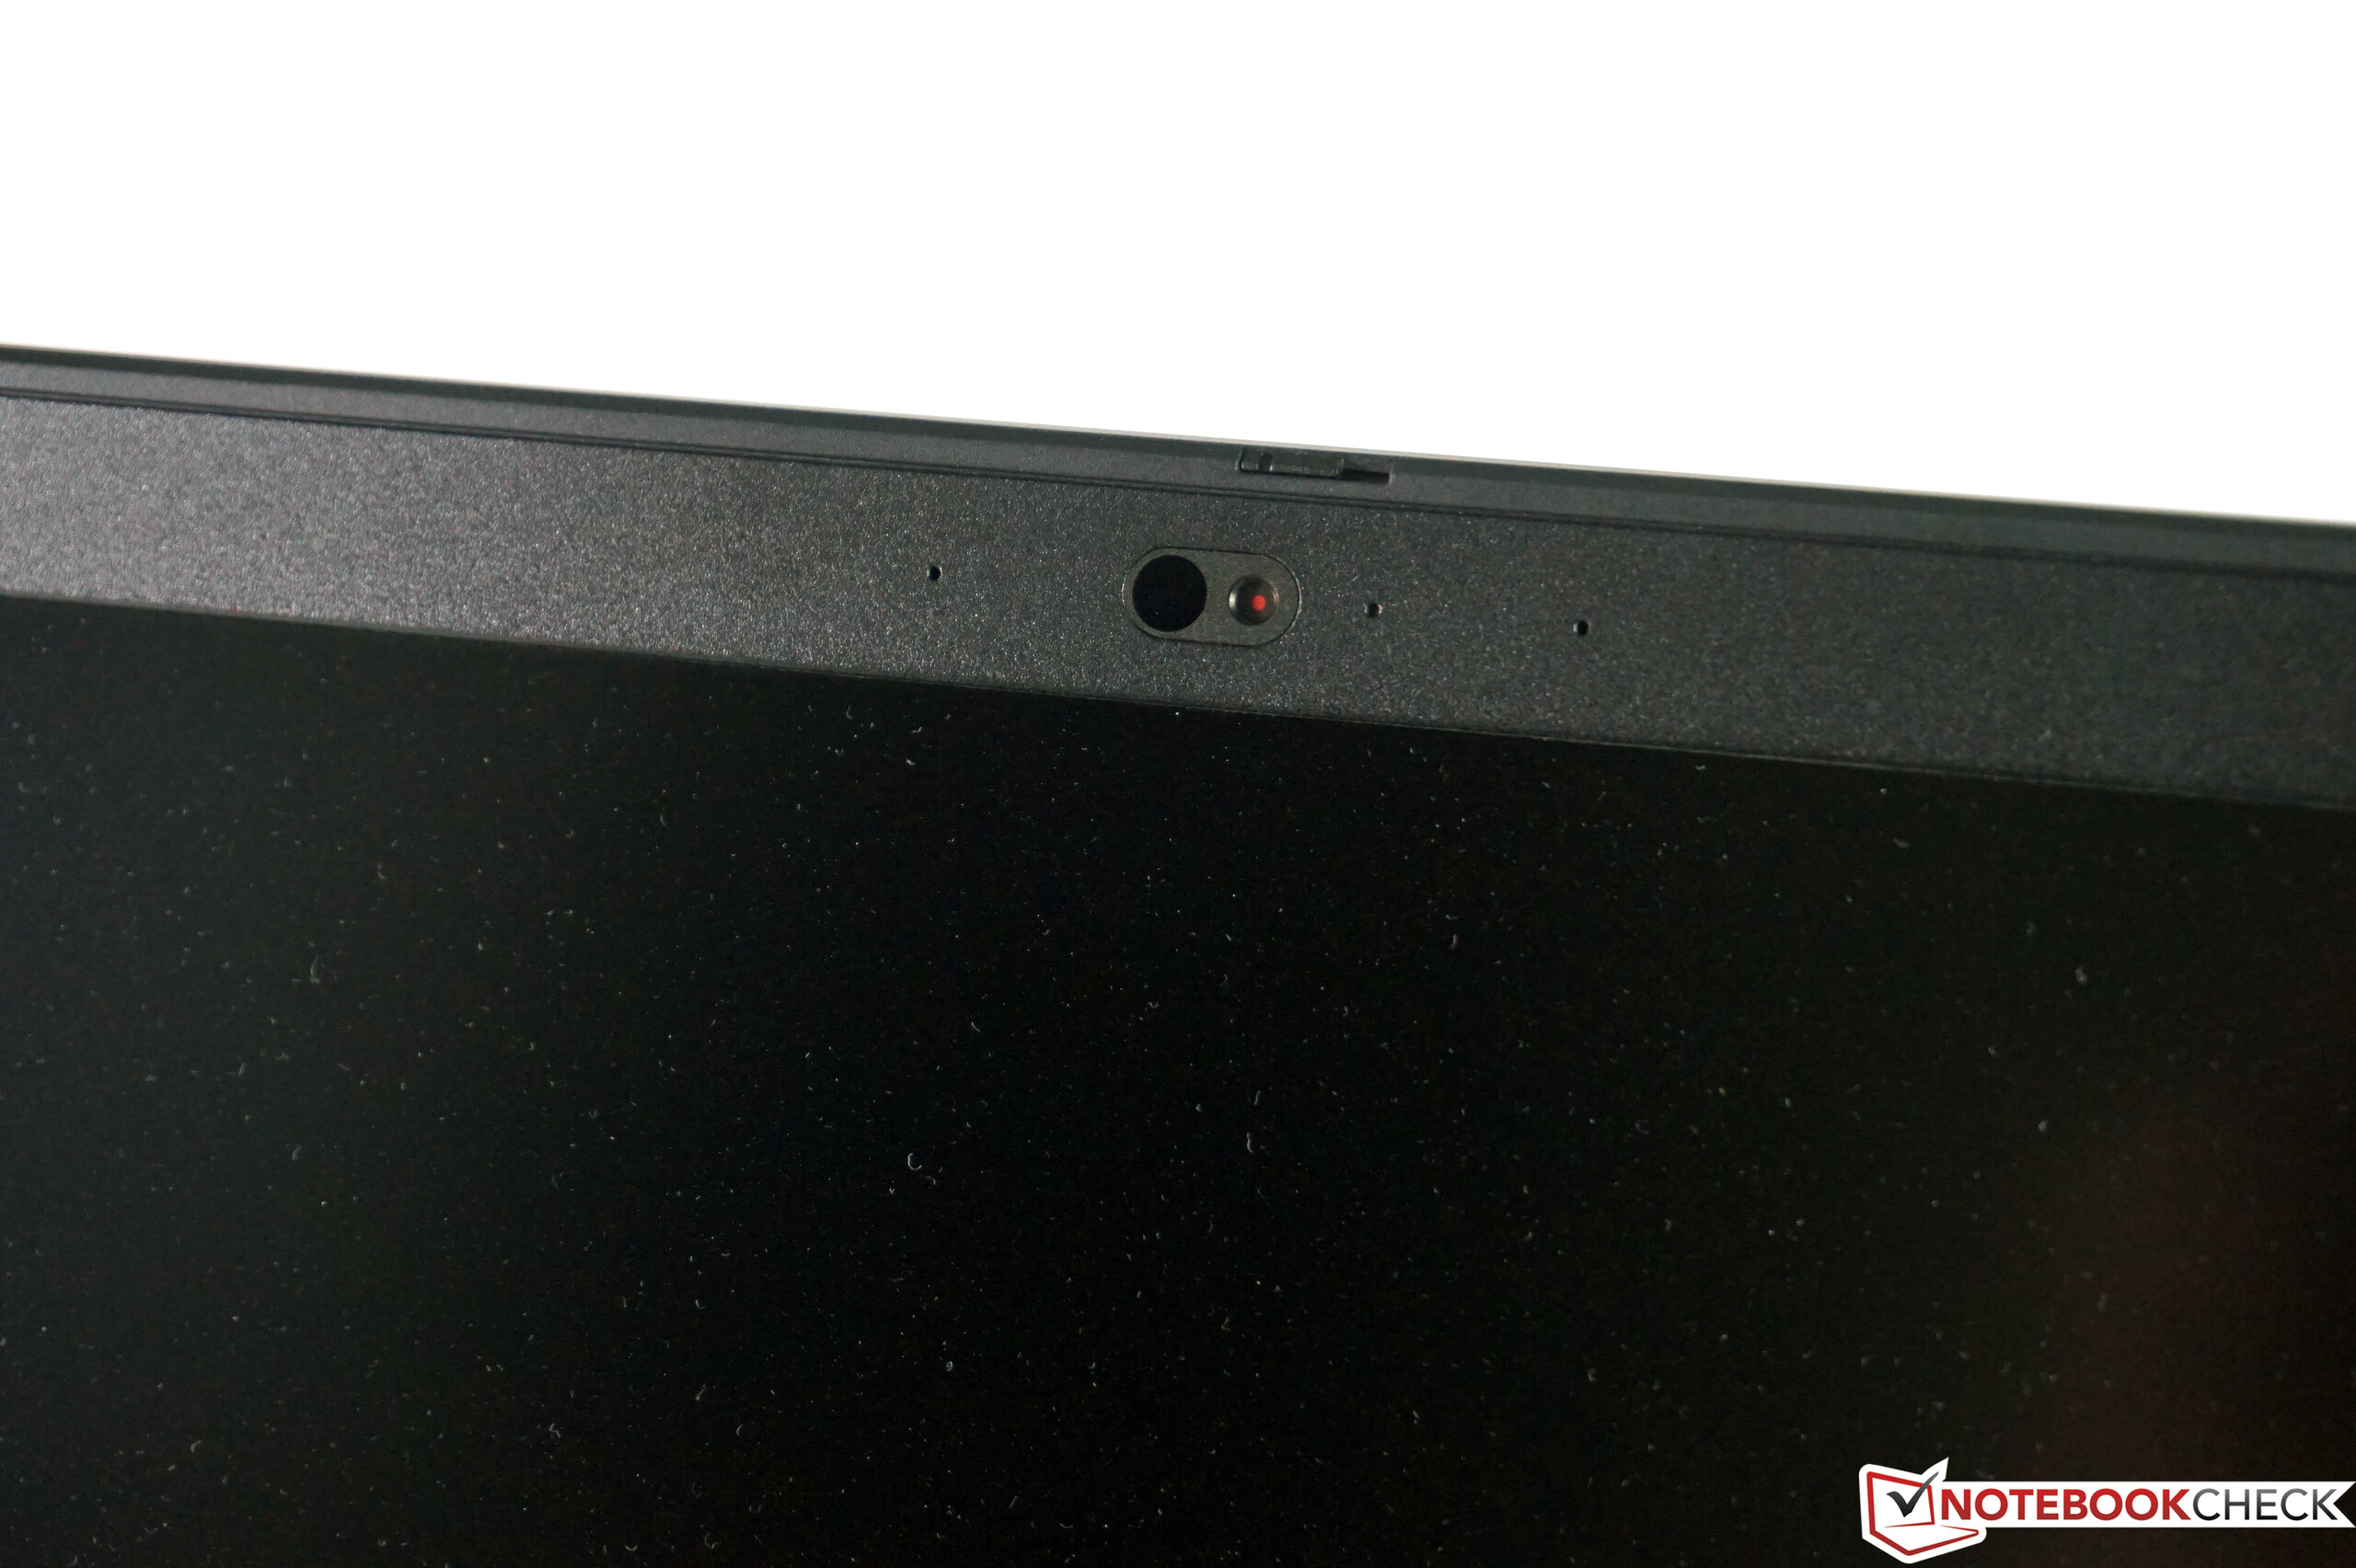
Net als veel andere moderne ThinkPads heeft de Lenovo P53 significante upgrades voor zijn beeldschermopties gekregen. Terwijl de basisconfiguratie nog steeds een IPS paneel heeft met 300cd/m² is er nu een betere en bovenal helderder 1080p model beschikbaar. Verder biedt Lenovo twee hoge resolutie schermen (een 4K-IPS en een 4K-OLED paneel). Dit garandeert dat alle gebruikers het model vinden wat ze zoeken.
De minpunten zijn ietwat muggenzifterij, omdat de ThinkPad P53 niet echt grote nadelen heeft en zijn goede score zonder meer verdient.
Lenovo ThinkPad P53-20QN000YGE
- 14-11-2019 v7 (old)
Andreas Osthoff
Price comparison
