Kort testrapport MSI GS66 Stealth 10SGS Laptop: Core i7 of Core i9?
Evaluatie | Datum | Model | Gewicht | Hoogte | Formaat | Resolutie | Beste prijs |
|---|---|---|---|---|---|---|---|
| 84 % v7 (old) | 05-2020 | MSI GS66 10SGS i7-10750H, GeForce RTX 2080 Super Max-Q | 2.2 kg | 20 mm | 15.60" | 1920x1080 | |
| 81.3 % v7 (old) | 05-2019 | Asus Zephyrus S GX502GW i7-9750H, GeForce RTX 2070 Mobile | 2.1 kg | 19 mm | 15.60" | 1920x1080 | |
| 88.8 % v6 (old) | 05-2019 | Razer Blade 15 RTX 2080 Max-Q i7-9750H, GeForce RTX 2080 Max-Q | 2.2 kg | 17.8 mm | 15.60" | 1920x1080 | |
| 84.8 % v7 (old) | Lenovo Legion Y740-15ICHg i7-9750H, GeForce RTX 2070 Max-Q | 2.3 kg | 25 mm | 15.60" | 1920x1080 | ||
| 83.3 % v7 (old) | 02-2020 | Schenker XMG Pro 15 i7-9750H, GeForce RTX 2070 Mobile | 2.5 kg | 30 mm | 15.60" | 1920x1080 |
| Networking | |
| iperf3 transmit AX12 | |
| Asus ZenBook Duo UX481FL | |
| MSI GP65 10SFK-047US | |
| MSI GS66 Stealth 10SFS | |
| MSI GS66 10SGS | |
| MSI GF75 Thin 10SCXR | |
| iperf3 receive AX12 | |
| Asus ZenBook Duo UX481FL | |
| MSI GS66 10SGS | |
| MSI GS66 Stealth 10SFS | |
| MSI GP65 10SFK-047US | |
| MSI GF75 Thin 10SCXR | |


| |||||||||||||||||||||||||
Helderheidsverdeling: 92 %
Helderheid in Batterij-modus: 339.4 cd/m²
Contrast: 1414:1 (Zwart: 0.24 cd/m²)
ΔE ColorChecker Calman: 1.58 | ∀{0.5-29.43 Ø4.73}
calibrated: 1.47
ΔE Greyscale Calman: 2.3 | ∀{0.09-98 Ø4.97}
99.4% sRGB (Argyll 1.6.3 3D)
64.8% AdobeRGB 1998 (Argyll 1.6.3 3D)
71.1% AdobeRGB 1998 (Argyll 3D)
99.1% sRGB (Argyll 3D)
69.9% Display P3 (Argyll 3D)
Gamma: 2.24
CCT: 6952 K
| MSI GS66 10SGS AU Optronics B156HAN12.0, IPS, 15.6", 1920x1080 | MSI GS65 Stealth 9SG Sharp LQ156M1JW03 (SHP14C5), IPS, 15.6", 1920x1080 | Asus Zephyrus S GX502GW AU Optronics B156HAN08.2 (AUO82ED), IPS, 15.6", 1920x1080 | Razer Blade 15 RTX 2080 Max-Q Sharp LQ156M1JW03 (SHP14C5), IPS, 15.6", 1920x1080 | HP Omen X 2S 15-dg0075cl AU Optronics AUO82ED, IPS, 15.6", 1920x1080 | Lenovo Legion Y740-15ICHg BOE NV156FHM-N4J, IPS, 15.6", 1920x1080 | |
|---|---|---|---|---|---|---|
| Display | -3% | -7% | -3% | -6% | -6% | |
| Display P3 Coverage (%) | 69.9 | 67.6 -3% | 64.9 -7% | 66.9 -4% | 66.2 -5% | 67.7 -3% |
| sRGB Coverage (%) | 99.1 | 97.5 -2% | 91 -8% | 98.1 -1% | 92.3 -7% | 91.6 -8% |
| AdobeRGB 1998 Coverage (%) | 71.1 | 68.9 -3% | 65.9 -7% | 68.5 -4% | 67.2 -5% | 67.1 -6% |
| Response Times | -21% | 24% | -9% | -22% | -35% | |
| Response Time Grey 50% / Grey 80% * (ms) | 11.2 ? | 13.6 ? -21% | 7.2 ? 36% | 12.8 ? -14% | 15.2 ? -36% | 19 ? -70% |
| Response Time Black / White * (ms) | 10 ? | 12 ? -20% | 8.8 ? 12% | 10.4 ? -4% | 10.8 ? -8% | 10 ? -0% |
| PWM Frequency (Hz) | 23260 ? | 23810 ? | ||||
| Screen | -0% | -23% | -6% | -58% | -18% | |
| Brightness middle (cd/m²) | 339.4 | 282.3 -17% | 286 -16% | 293 -14% | 324.8 -4% | 477 41% |
| Brightness (cd/m²) | 331 | 269 -19% | 275 -17% | 270 -18% | 316 -5% | 431 30% |
| Brightness Distribution (%) | 92 | 90 -2% | 90 -2% | 87 -5% | 84 -9% | 84 -9% |
| Black Level * (cd/m²) | 0.24 | 0.32 -33% | 0.37 -54% | 0.29 -21% | 0.26 -8% | 0.175 27% |
| Contrast (:1) | 1414 | 882 -38% | 773 -45% | 1010 -29% | 1249 -12% | 2726 93% |
| Colorchecker dE 2000 * | 1.58 | 1.17 26% | 2.19 -39% | 1.69 -7% | 4.96 -214% | 4.17 -164% |
| Colorchecker dE 2000 max. * | 3.8 | 3.29 13% | 4.4 -16% | 3.37 11% | 8.95 -136% | 6.97 -83% |
| Colorchecker dE 2000 calibrated * | 1.47 | 1.06 28% | 2.27 -54% | 1.24 16% | 3.23 -120% | 2.51 -71% |
| Greyscale dE 2000 * | 2.3 | 1.3 43% | 2.2 4% | 2.3 -0% | 5 -117% | 3.49 -52% |
| Gamma | 2.24 98% | 2.2 100% | 2.41 91% | 2.3 96% | 2.21 100% | 2.5 88% |
| CCT | 6952 93% | 6643 98% | 6405 101% | 6758 96% | 7742 84% | 7076 92% |
| Color Space (Percent of AdobeRGB 1998) (%) | 64.8 | 63.8 -2% | 59 -9% | 63 -3% | 59.8 -8% | 60 -7% |
| Color Space (Percent of sRGB) (%) | 99.4 | 97.5 -2% | 91 -8% | 98.5 -1% | 91.8 -8% | 91 -8% |
| Totaal Gemiddelde (Programma / Instellingen) | -8% /
-3% | -2% /
-14% | -6% /
-6% | -29% /
-44% | -20% /
-18% |
* ... kleiner is beter
Responstijd Scherm
| ↔ Responstijd Zwart naar Wit | ||
|---|---|---|
| 10 ms ... stijging ↗ en daling ↘ gecombineerd | ↗ 5.2 ms stijging | 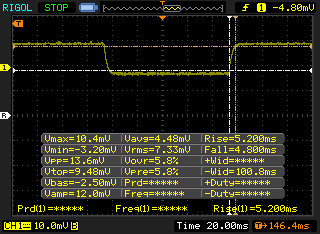 |
| ↘ 4.8 ms daling | ||
| Het scherm vertoonde prima responstijden in onze tests maar is misschien wat te traag voor competitieve games. Ter vergelijking: alle testtoestellen variëren van 0.1 (minimum) tot 240 (maximum) ms. » 27 % van alle toestellen zijn beter. Dit betekent dat de gemeten responstijd beter is dan het gemiddelde (19.9 ms) van alle geteste toestellen. | ||
| ↔ Responstijd 50% Grijs naar 80% Grijs | ||
| 11.2 ms ... stijging ↗ en daling ↘ gecombineerd | ↗ 6 ms stijging | 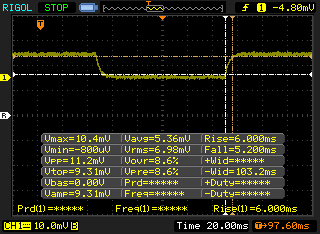 |
| ↘ 5.2 ms daling | ||
| Het scherm vertoonde prima responstijden in onze tests maar is misschien wat te traag voor competitieve games. Ter vergelijking: alle testtoestellen variëren van 0.165 (minimum) tot 636 (maximum) ms. » 25 % van alle toestellen zijn beter. Dit betekent dat de gemeten responstijd beter is dan het gemiddelde (31.1 ms) van alle geteste toestellen. | ||
Screen Flickering / PWM (Pulse-Width Modulation)
| Screen flickering / PWM niet waargenomen | 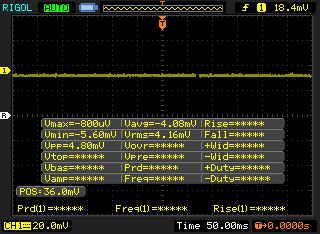 | ||
Ter vergelijking: 52 % van alle geteste toestellen maakten geen gebruik van PWM om de schermhelderheid te verlagen. Als het wel werd gebruikt, werd een gemiddelde van 7798 (minimum: 5 - maximum: 343500) Hz waargenomen. | |||
Cinebench R15: CPU Multi 64Bit | CPU Single 64Bit
Blender: v2.79 BMW27 CPU
7-Zip 18.03: 7z b 4 -mmt1 | 7z b 4
Geekbench 5.5: Single-Core | Multi-Core
HWBOT x265 Benchmark v2.2: 4k Preset
LibreOffice : 20 Documents To PDF
R Benchmark 2.5: Overall mean
| Cinebench R20 / CPU (Multi Core) | |
| Asus Zephyrus G14 GA401IV | |
| Gigabyte Aero 15 OLED XB-8DE51B0SP | |
| MSI GS66 Stealth 10SFS | |
| MSI GE65 Raider 9SF-049US | |
| MSI GS66 10SGS | |
| Medion Erazer X15805 | |
| Gemiddeld Intel Core i7-10750H (1749 - 3325, n=43) | |
| Gemiddeld Intel Core i7-9750H (2017 - 3133, n=55) | |
| Schenker XMG Pro 15 | |
| MSI GE63 Raider 8SG | |
| MSI GF75 Thin 10SCXR | |
| MSI GF63 Thin 9SC | |
| Cinebench R20 / CPU (Single Core) | |
| Gigabyte Aero 15 OLED XB-8DE51B0SP | |
| Medion Erazer X15805 | |
| Asus Zephyrus G14 GA401IV | |
| MSI GS66 Stealth 10SFS | |
| MSI GE65 Raider 9SF-049US | |
| Gemiddeld Intel Core i7-10750H (431 - 504, n=43) | |
| MSI GS66 10SGS | |
| Gemiddeld Intel Core i7-9750H (416 - 486, n=55) | |
| MSI GF75 Thin 10SCXR | |
| Schenker XMG Pro 15 | |
| MSI GF63 Thin 9SC | |
| MSI GE63 Raider 8SG | |
| Cinebench R15 / CPU Multi 64Bit | |
| Asus Zephyrus G14 GA401IV | |
| Gigabyte Aero 15 OLED XB-8DE51B0SP | |
| MSI GS66 Stealth 10SFS | |
| MSI GE65 Raider 9SF-049US | |
| MSI GS66 10SGS | |
| Gemiddeld Intel Core i7-10750H (804 - 1418, n=50) | |
| Medion Erazer X15805 | |
| Gemiddeld Intel Core i7-9750H (952 - 1306, n=85) | |
| Schenker XMG Pro 15 | |
| MSI GE63 Raider 8SG | |
| MSI GF75 Thin 10SCXR | |
| MSI GF63 Thin 9SC | |
| Cinebench R15 / CPU Single 64Bit | |
| Gigabyte Aero 15 OLED XB-8DE51B0SP | |
| Medion Erazer X15805 | |
| MSI GS66 Stealth 10SFS | |
| MSI GE65 Raider 9SF-049US | |
| Gemiddeld Intel Core i7-10750H (184 - 213, n=45) | |
| Asus Zephyrus G14 GA401IV | |
| MSI GS66 10SGS | |
| Gemiddeld Intel Core i7-9750H (170 - 194, n=82) | |
| MSI GF75 Thin 10SCXR | |
| Schenker XMG Pro 15 | |
| MSI GF63 Thin 9SC | |
| MSI GE63 Raider 8SG | |
| Blender / v2.79 BMW27 CPU | |
| MSI GF75 Thin 10SCXR | |
| Schenker XMG Pro 15 | |
| Gemiddeld Intel Core i7-9750H (342 - 495, n=21) | |
| Gemiddeld Intel Core i7-10750H (322 - 587, n=43) | |
| MSI GS66 10SGS | |
| Asus Zephyrus G14 GA401IV | |
| MSI GS66 Stealth 10SFS | |
| Gigabyte Aero 15 OLED XB-8DE51B0SP | |
| 7-Zip 18.03 / 7z b 4 -mmt1 | |
| Gigabyte Aero 15 OLED XB-8DE51B0SP | |
| MSI GS66 Stealth 10SFS | |
| Gemiddeld Intel Core i7-10750H (4504 - 5470, n=43) | |
| MSI GS66 10SGS | |
| Gemiddeld Intel Core i7-9750H (4580 - 5090, n=21) | |
| MSI GF75 Thin 10SCXR | |
| Asus Zephyrus G14 GA401IV | |
| Schenker XMG Pro 15 | |
| 7-Zip 18.03 / 7z b 4 | |
| Asus Zephyrus G14 GA401IV | |
| Gigabyte Aero 15 OLED XB-8DE51B0SP | |
| MSI GS66 Stealth 10SFS | |
| MSI GS66 10SGS | |
| Gemiddeld Intel Core i7-10750H (26040 - 37345, n=43) | |
| Schenker XMG Pro 15 | |
| Gemiddeld Intel Core i7-9750H (28512 - 35174, n=21) | |
| MSI GF75 Thin 10SCXR | |
| Geekbench 5.5 / Single-Core | |
| Gigabyte Aero 15 OLED XB-8DE51B0SP | |
| MSI GS66 Stealth 10SFS | |
| Gemiddeld Intel Core i7-10750H (1114 - 1333, n=43) | |
| Asus Zephyrus G14 GA401IV | |
| MSI GS66 10SGS | |
| Gemiddeld Intel Core i7-9750H (1117 - 1251, n=13) | |
| MSI GF75 Thin 10SCXR | |
| Schenker XMG Pro 15 | |
| Geekbench 5.5 / Multi-Core | |
| Gigabyte Aero 15 OLED XB-8DE51B0SP | |
| Asus Zephyrus G14 GA401IV | |
| MSI GS66 Stealth 10SFS | |
| MSI GS66 10SGS | |
| Gemiddeld Intel Core i7-10750H (4443 - 6674, n=43) | |
| Schenker XMG Pro 15 | |
| Gemiddeld Intel Core i7-9750H (4859 - 6262, n=13) | |
| MSI GF75 Thin 10SCXR | |
| HWBOT x265 Benchmark v2.2 / 4k Preset | |
| Gigabyte Aero 15 OLED XB-8DE51B0SP | |
| MSI GS66 Stealth 10SFS | |
| Asus Zephyrus G14 GA401IV | |
| MSI GS66 10SGS | |
| Gemiddeld Intel Core i7-10750H (5.54 - 11.6, n=43) | |
| Schenker XMG Pro 15 | |
| Gemiddeld Intel Core i7-9750H (7.1 - 10.7, n=21) | |
| MSI GF75 Thin 10SCXR | |
| LibreOffice / 20 Documents To PDF | |
| Gemiddeld Intel Core i7-9750H (54.5 - 64.7, n=9) | |
| MSI GF75 Thin 10SCXR | |
| MSI GS66 10SGS | |
| Gemiddeld Intel Core i7-10750H (43.1 - 99.2, n=43) | |
| MSI GS66 Stealth 10SFS | |
| Gigabyte Aero 15 OLED XB-8DE51B0SP | |
| R Benchmark 2.5 / Overall mean | |
| MSI GF75 Thin 10SCXR | |
| Schenker XMG Pro 15 | |
| Gemiddeld Intel Core i7-9750H (0.608 - 0.695, n=14) | |
| MSI GS66 10SGS | |
| Gemiddeld Intel Core i7-10750H (0.578 - 0.708, n=42) | |
| MSI GS66 Stealth 10SFS | |
| Gigabyte Aero 15 OLED XB-8DE51B0SP | |
* ... kleiner is beter
| PCMark 10 | |
| Score | |
| MSI GS66 Stealth 10SFS | |
| MSI GS66 10SGS | |
| Lenovo Legion Y740-15ICHg | |
| Razer Blade 15 RTX 2080 Max-Q | |
| MSI GS65 Stealth 9SG | |
| Asus Zephyrus S GX502GW | |
| Essentials | |
| MSI GS66 Stealth 10SFS | |
| MSI GS66 10SGS | |
| MSI GS65 Stealth 9SG | |
| Lenovo Legion Y740-15ICHg | |
| Asus Zephyrus S GX502GW | |
| Razer Blade 15 RTX 2080 Max-Q | |
| Productivity | |
| MSI GS66 Stealth 10SFS | |
| Razer Blade 15 RTX 2080 Max-Q | |
| MSI GS66 10SGS | |
| Asus Zephyrus S GX502GW | |
| MSI GS65 Stealth 9SG | |
| Lenovo Legion Y740-15ICHg | |
| Digital Content Creation | |
| MSI GS66 Stealth 10SFS | |
| Lenovo Legion Y740-15ICHg | |
| MSI GS66 10SGS | |
| Razer Blade 15 RTX 2080 Max-Q | |
| MSI GS65 Stealth 9SG | |
| Asus Zephyrus S GX502GW | |
| PCMark 8 | |
| Home Score Accelerated v2 | |
| Lenovo Legion Y740-15ICHg | |
| MSI GS66 10SGS | |
| MSI GS65 Stealth 9SG | |
| Razer Blade 15 RTX 2080 Max-Q | |
| Work Score Accelerated v2 | |
| MSI GS66 10SGS | |
| Lenovo Legion Y740-15ICHg | |
| MSI GS65 Stealth 9SG | |
| Razer Blade 15 RTX 2080 Max-Q | |
| PCMark 8 Home Score Accelerated v2 | 4579 punten | |
| PCMark 8 Work Score Accelerated v2 | 6219 punten | |
| PCMark 10 Score | 6154 punten | |
Help | ||
| DPC Latencies / LatencyMon - interrupt to process latency (max), Web, Youtube, Prime95 | |
| MSI GS66 10SGS | |
* ... kleiner is beter
| MSI GS66 10SGS Samsung SSD PM981 MZVLB512HAJQ | MSI GS65 Stealth 9SG Samsung SSD PM981 MZVLB512HAJQ | Asus Zephyrus S GX502GW 2x Intel SSD 660p SSDPEKNW512G8 (RAID 0) | Razer Blade 15 RTX 2080 Max-Q Samsung SSD PM981 MZVLB512HAJQ | Lenovo Legion Y740-15ICHg WDC PC SN520 SDAPMUW-128G | MSI GS66 Stealth 10SFS Samsung SSD PM981 MZVLB1T0HALR | |
|---|---|---|---|---|---|---|
| AS SSD | 9% | -6% | 3% | -49% | 9% | |
| Seq Read (MB/s) | 1086 | 2005 85% | 2506 131% | 1832 69% | 1372 26% | 1065 -2% |
| Seq Write (MB/s) | 1901 | 1580 -17% | 1712 -10% | 1864 -2% | 746 -61% | 2360 24% |
| 4K Read (MB/s) | 51 | 49.33 -3% | 48.32 -5% | 52.1 2% | 35.42 -31% | 48.09 -6% |
| 4K Write (MB/s) | 117.3 | 103.8 -12% | 103.6 -12% | 108.3 -8% | 99.9 -15% | 110.7 -6% |
| 4K-64 Read (MB/s) | 1503 | 1241 -17% | 624 -58% | 1159 -23% | 302.1 -80% | 1635 9% |
| 4K-64 Write (MB/s) | 1721 | 1730 1% | 1253 -27% | 1807 5% | 191.4 -89% | 1829 6% |
| Access Time Read * (ms) | 0.059 | 0.054 8% | 0.08 -36% | 0.05 15% | 0.132 -124% | 0.071 -20% |
| Access Time Write * (ms) | 0.1 | 0.036 64% | 0.04 60% | 0.034 66% | 0.037 63% | 0.034 66% |
| Score Read (Points) | 1662 | 1490 -10% | 923 -44% | 1394 -16% | 475 -71% | 1790 8% |
| Score Write (Points) | 2029 | 1991 -2% | 1528 -25% | 2102 4% | 366 -82% | 2176 7% |
| Score Total (Points) | 4588 | 4230 -8% | 2896 -37% | 4221 -8% | 1065 -77% | 4950 8% |
| Copy ISO MB/s (MB/s) | 2155 | 3025 40% | 2083 -3% | 1062 -51% | ||
| Copy Program MB/s (MB/s) | 715 | 713 0% | 496.5 -31% | 426 -40% | ||
| Copy Game MB/s (MB/s) | 1506 | 1554 3% | 977 -35% | 650 -57% | ||
| CrystalDiskMark 5.2 / 6 | -7% | -4% | -3% | -41% | 6% | |
| Write 4K (MB/s) | 132.5 | 91.3 -31% | 97 -27% | 137.2 4% | 134.2 1% | 131.3 -1% |
| Read 4K (MB/s) | 45.03 | 40.73 -10% | 49.58 10% | 46.82 4% | 37.72 -16% | 45.84 2% |
| Write Seq (MB/s) | 1987 | 1915 -4% | 1838 -7% | 1221 -39% | 389.2 -80% | 2370 19% |
| Read Seq (MB/s) | 1434 | 2051 43% | 2421 69% | 1217 -15% | 1030 -28% | 1509 5% |
| Write 4K Q32T1 (MB/s) | 467.5 | 308.3 -34% | 326.9 -30% | 527 13% | 238.9 -49% | 481.5 3% |
| Read 4K Q32T1 (MB/s) | 536 | 417.4 -22% | 372.9 -30% | 614 15% | 343.9 -36% | 560 4% |
| Write Seq Q32T1 (MB/s) | 2003 | 1922 -4% | 1894 -5% | 1986 -1% | 789 -61% | 2392 19% |
| Read Seq Q32T1 (MB/s) | 3306 | 3395 3% | 2828 -14% | 3234 -2% | 1502 -55% | 3232 -2% |
| Write 4K Q8T8 (MB/s) | 293.4 | |||||
| Read 4K Q8T8 (MB/s) | 405.8 | |||||
| Totaal Gemiddelde (Programma / Instellingen) | 1% /
3% | -5% /
-5% | 0% /
1% | -45% /
-46% | 8% /
8% |
* ... kleiner is beter

Disk Throttling: DiskSpd Read Loop, Queue Depth 8
| 3DMark 11 | |
| 1280x720 Performance GPU | |
| MSI RTX 2080 Ti Gaming X Trio | |
| Nvidia GeForce RTX 2080 Super FE | |
| Asus ROG Mothership GZ700GX | |
| Gemiddeld NVIDIA GeForce RTX 2080 Super Max-Q (26292 - 32995, n=10) | |
| Alienware m17 R2 P41E | |
| MSI GS66 10SGS | |
| MSI GS66 Stealth 10SFS | |
| MSI GS65 Stealth 9SG | |
| Alienware 15 R3 Max-Q | |
| Xiaomi Mi Gaming Laptop 2019 | |
| Maingear Vector 15 | |
| MSI Alpha 15 A3DDK-034 | |
| MSI GT72S-6QEG16SR421BW | |
| 1280x720 Performance Combined | |
| MSI RTX 2080 Ti Gaming X Trio | |
| Asus ROG Mothership GZ700GX | |
| MSI GS66 Stealth 10SFS | |
| Alienware m17 R2 P41E | |
| Gemiddeld NVIDIA GeForce RTX 2080 Super Max-Q (11707 - 17126, n=10) | |
| MSI GS66 10SGS | |
| MSI GS65 Stealth 9SG | |
| Maingear Vector 15 | |
| Xiaomi Mi Gaming Laptop 2019 | |
| Nvidia GeForce RTX 2080 Super FE | |
| Alienware 15 R3 Max-Q | |
| MSI GT72S-6QEG16SR421BW | |
| MSI Alpha 15 A3DDK-034 | |
| 3DMark 11 Performance | 21793 punten | |
| 3DMark Cloud Gate Standard Score | 39597 punten | |
| 3DMark Fire Strike Score | 17585 punten | |
| 3DMark Time Spy Score | 7475 punten | |
Help | ||
| Shadow of the Tomb Raider | |
| 1920x1080 Highest Preset AA:T | |
| Nvidia GeForce RTX 2080 Super | |
| MSI GE75 9SG | |
| Alienware m17 R2 P41E | |
| Aorus 17G XB | |
| MSI GS66 10SGS | |
| Gemiddeld NVIDIA GeForce RTX 2080 Super Max-Q (89 - 106, n=10) | |
| MSI GP65 10SFK-047US | |
| MSI GS66 Stealth 10SFS | |
| Walmart EVOO Gaming 17 | |
| Asus Zephyrus G14 GA401IV | |
| 1920x1080 High Preset AA:SM | |
| MSI GE75 9SG | |
| Nvidia GeForce RTX 2080 Super | |
| Aorus 17G XB | |
| Alienware m17 R2 P41E | |
| Gemiddeld NVIDIA GeForce RTX 2080 Super Max-Q (93 - 116, n=7) | |
| MSI GS66 10SGS | |
| MSI GS66 Stealth 10SFS | |
| MSI GP65 10SFK-047US | |
| Walmart EVOO Gaming 17 | |
| Asus Zephyrus G14 GA401IV | |
| The Witcher 3 | |
| 1920x1080 Ultra Graphics & Postprocessing (HBAO+) | |
| Nvidia GeForce RTX 2080 Super | |
| MSI GE75 9SG | |
| Gemiddeld NVIDIA GeForce RTX 2080 Super Max-Q (74.3 - 96, n=11) | |
| MSI GP65 10SFK-047US | |
| Alienware m17 R2 P41E | |
| MSI GS66 10SGS | |
| Aorus 17G XB | |
| MSI GS66 Stealth 10SFS | |
| Walmart EVOO Gaming 17 | |
| Asus Zephyrus G14 GA401IV | |
| 1920x1080 High Graphics & Postprocessing (Nvidia HairWorks Off) | |
| Nvidia GeForce RTX 2080 Super | |
| MSI GE75 9SG | |
| MSI GP65 10SFK-047US | |
| Alienware m17 R2 P41E | |
| Gemiddeld NVIDIA GeForce RTX 2080 Super Max-Q (138 - 160, n=7) | |
| MSI GS66 10SGS | |
| Aorus 17G XB | |
| Walmart EVOO Gaming 17 | |
| MSI GS66 Stealth 10SFS | |
| Asus Zephyrus G14 GA401IV | |
| Borderlands 3 | |
| 1920x1080 Badass Overall Quality (DX11) | |
| Gemiddeld NVIDIA GeForce RTX 2080 Super Max-Q (62.5 - 71.6, n=4) | |
| MSI GS66 10SGS | |
| MSI GS66 Stealth 10SFS | |
| Aorus 17G XB | |
| Asus Zephyrus G14 GA401IV | |
| 1920x1080 High Overall Quality (DX11) | |
| MSI GS66 10SGS | |
| Gemiddeld NVIDIA GeForce RTX 2080 Super Max-Q (78.2 - 84.3, n=4) | |
| Aorus 17G XB | |
| MSI GS66 Stealth 10SFS | |
| Asus Zephyrus G14 GA401IV | |
| lage | gem. | hoge | ultra | |
|---|---|---|---|---|
| The Witcher 3 (2015) | 310.3 | 239.5 | 142.7 | 74.3 |
| Dota 2 Reborn (2015) | 147 | 132 | 122 | 116 |
| X-Plane 11.11 (2018) | 102 | 90.9 | 76.8 | |
| Shadow of the Tomb Raider (2018) | 138 | 109 | 104 | 96 |
| Assassin´s Creed Odyssey (2018) | 102 | 87 | 75 | 54 |
| Apex Legends (2019) | 299 | 196 | 148.8 | 147.6 |
| Metro Exodus (2019) | 143.3 | 96.2 | 74.4 | 59 |
| Dirt Rally 2.0 (2019) | 252 | 168.4 | 158.5 | 90 |
| The Division 2 (2019) | 165 | 117 | 96 | 73 |
| Anno 1800 (2019) | 159 | 98.2 | 76.7 | 44.4 |
| Total War: Three Kingdoms (2019) | 233 | 127.8 | 88.5 | 64.1 |
| F1 2019 (2019) | 205 | 168 | 147 | 142 |
| Borderlands 3 (2019) | 132.5 | 105.7 | 81.1 | 63.5 |
| Ghost Recon Breakpoint (2019) | 117 | 96 | 86 | 65 |
| GRID 2019 (2019) | 174.8 | 125 | 111 | 74 |
| Need for Speed Heat (2019) | 101.9 | 92 | 84 | 76.9 |
| Escape from Tarkov (2020) | 121 | 121 | 120 | 120 |
| Hunt Showdown (2020) | 207.4 | 121.4 | 102 | |
| Doom Eternal (2020) | 256 | 167.6 | 147.1 | 140 |
| MSI GS66 10SGS GeForce RTX 2080 Super Max-Q, i7-10750H, Samsung SSD PM981 MZVLB512HAJQ | MSI GS65 Stealth 9SG GeForce RTX 2080 Max-Q, i7-9750H, Samsung SSD PM981 MZVLB512HAJQ | Asus Zephyrus S GX502GW GeForce RTX 2070 Mobile, i7-9750H, 2x Intel SSD 660p SSDPEKNW512G8 (RAID 0) | Razer Blade 15 RTX 2080 Max-Q GeForce RTX 2080 Max-Q, i7-9750H, Samsung SSD PM981 MZVLB512HAJQ | HP Omen X 2S 15-dg0075cl GeForce RTX 2070 Max-Q, i7-9750H, WDC PC SN720 SDAPNTW-1T00 | Lenovo Legion Y740-15ICHg GeForce RTX 2070 Max-Q, i7-9750H, WDC PC SN520 SDAPMUW-128G | MSI GS66 Stealth 10SFS GeForce RTX 2070 Super Max-Q, i9-10980HK, Samsung SSD PM981 MZVLB1T0HALR | |
|---|---|---|---|---|---|---|---|
| Noise | 2% | -10% | 9% | -1% | 2% | -11% | |
| uit / omgeving * (dB) | 28.5 | 28.3 1% | 30 -5% | 28.3 1% | 29 -2% | 30 -5% | 30 -5% |
| Idle Minimum * (dB) | 30 | 30.4 -1% | 31 -3% | 28.8 4% | 30.5 -2% | 31.3 -4% | 32 -7% |
| Idle Average * (dB) | 30 | 30.5 -2% | 33 -10% | 28.8 4% | 31.5 -5% | 31.3 -4% | 34 -13% |
| Idle Maximum * (dB) | 30.9 | 30.6 1% | 38 -23% | 29 6% | 31.5 -2% | 31.3 -1% | 39 -26% |
| Load Average * (dB) | 39.5 | 37.6 5% | 50 -27% | 33.5 15% | 40.6 -3% | 42 -6% | 53 -34% |
| Witcher 3 ultra * (dB) | 48 | 46 4% | 53 -10% | 45 6% | 49.5 -3% | 42.1 12% | 48 -0% |
| Load Maximum * (dB) | 59.4 | 55.1 7% | 56 6% | 45.2 24% | 53.4 10% | 46.5 22% | 53 11% |
* ... kleiner is beter
Geluidsniveau
| Onbelast |
| 30 / 30 / 30.9 dB (A) |
| Belasting |
| 39.5 / 59.4 dB (A) |
 | ||
30 dB stil 40 dB(A) hoorbaar 50 dB(A) luid |
||
min: | ||
(-) De maximumtemperatuur aan de bovenzijde bedraagt 47.8 °C / 118 F, vergeleken met het gemiddelde van 40.4 °C / 105 F, variërend van 21.2 tot 68.8 °C voor de klasse Gaming.
(-) De bodem warmt op tot een maximum van 54.4 °C / 130 F, vergeleken met een gemiddelde van 43.2 °C / 110 F
(+) Bij onbelast gebruik bedraagt de gemiddelde temperatuur voor de bovenzijde 25.9 °C / 79 F, vergeleken met het apparaatgemiddelde van 33.9 °C / 93 F.
(±) Bij het spelen van The Witcher 3 is de gemiddelde temperatuur voor de bovenzijde 33.3 °C / 92 F, vergeleken met het apparaatgemiddelde van 33.9 °C / 93 F.
(+) De palmsteunen en het touchpad zijn met een maximum van ###max## °C / 83.5 F koeler dan de huidtemperatuur en voelen daarom koel aan.
(±) De gemiddelde temperatuur van de handpalmsteun van soortgelijke toestellen bedroeg 28.8 °C / 83.8 F (+0.2 °C / 0.3 F).
MSI GS66 10SGS audioanalyse
(+) | luidsprekers kunnen relatief luid spelen (92.3 dB)
Bas 100 - 315 Hz
(-) | bijna geen lage tonen - gemiddeld 29.8% lager dan de mediaan
(±) | lineariteit van de lage tonen is gemiddeld (7.5% delta ten opzichte van de vorige frequentie)
Midden 400 - 2000 Hz
(±) | hogere middens - gemiddeld 9.3% hoger dan de mediaan
(±) | lineariteit van de middentonen is gemiddeld (9.2% delta ten opzichte van de vorige frequentie)
Hoog 2 - 16 kHz
(±) | lagere maxima - gemiddeld 6.1% lager dan de mediaan
(±) | lineariteit van de hoogtepunten is gemiddeld (7.5% delta ten opzichte van de vorige frequentie)
Algemeen 100 - 16.000 Hz
(±) | lineariteit van het totale geluid is gemiddeld (29.4% verschil met de mediaan)
Vergeleken met dezelfde klasse
» 95% van alle geteste apparaten in deze klasse waren beter, 2% vergelijkbaar, 3% slechter
» De beste had een delta van 6%, het gemiddelde was 18%, de slechtste was 132%
Vergeleken met alle geteste toestellen
» 87% van alle geteste apparaten waren beter, 2% gelijk, 10% slechter
» De beste had een delta van 4%, het gemiddelde was 24%, de slechtste was 134%
Apple MacBook 12 (Early 2016) 1.1 GHz audioanalyse
(+) | luidsprekers kunnen relatief luid spelen (83.6 dB)
Bas 100 - 315 Hz
(±) | verminderde zeebaars - gemiddeld 11.3% lager dan de mediaan
(±) | lineariteit van de lage tonen is gemiddeld (14.2% delta ten opzichte van de vorige frequentie)
Midden 400 - 2000 Hz
(+) | evenwichtige middens - slechts 2.4% verwijderd van de mediaan
(+) | de middentonen zijn lineair (5.5% delta ten opzichte van de vorige frequentie)
Hoog 2 - 16 kHz
(+) | evenwichtige hoogtepunten - slechts 2% verwijderd van de mediaan
(+) | de hoge tonen zijn lineair (4.5% delta naar de vorige frequentie)
Algemeen 100 - 16.000 Hz
(+) | het totale geluid is lineair (10.2% verschil met de mediaan)
Vergeleken met dezelfde klasse
» 7% van alle geteste apparaten in deze klasse waren beter, 2% vergelijkbaar, 91% slechter
» De beste had een delta van 5%, het gemiddelde was 18%, de slechtste was 53%
Vergeleken met alle geteste toestellen
» 5% van alle geteste apparaten waren beter, 1% gelijk, 94% slechter
» De beste had een delta van 4%, het gemiddelde was 24%, de slechtste was 134%
| Uit / Standby | |
| Inactief | |
| Belasting |
|
Key:
min: | |
| MSI GS66 10SGS i7-10750H, GeForce RTX 2080 Super Max-Q, Samsung SSD PM981 MZVLB512HAJQ, IPS, 1920x1080, 15.6" | MSI GS65 Stealth 9SG i7-9750H, GeForce RTX 2080 Max-Q, Samsung SSD PM981 MZVLB512HAJQ, IPS, 1920x1080, 15.6" | Asus Zephyrus S GX502GW i7-9750H, GeForce RTX 2070 Mobile, 2x Intel SSD 660p SSDPEKNW512G8 (RAID 0), IPS, 1920x1080, 15.6" | Razer Blade 15 RTX 2080 Max-Q i7-9750H, GeForce RTX 2080 Max-Q, Samsung SSD PM981 MZVLB512HAJQ, IPS, 1920x1080, 15.6" | HP Omen X 2S 15-dg0075cl i7-9750H, GeForce RTX 2070 Max-Q, WDC PC SN720 SDAPNTW-1T00, IPS, 1920x1080, 15.6" | Lenovo Legion Y740-15ICHg i7-9750H, GeForce RTX 2070 Max-Q, WDC PC SN520 SDAPMUW-128G, IPS, 1920x1080, 15.6" | MSI GS66 Stealth 10SFS i9-10980HK, GeForce RTX 2070 Super Max-Q, Samsung SSD PM981 MZVLB1T0HALR, IPS, 1920x1080, 15.6" | |
|---|---|---|---|---|---|---|---|
| Power Consumption | -8% | -31% | 9% | -97% | -15% | -1% | |
| Idle Minimum * (Watt) | 14.9 | 18.3 -23% | 24 -61% | 12.5 16% | 46 -209% | 22.2 -49% | 13 13% |
| Idle Average * (Watt) | 17.5 | 22 -26% | 27 -54% | 15.3 13% | 59 -237% | 24.9 -42% | 16 9% |
| Idle Maximum * (Watt) | 29.5 | 28.8 2% | 33 -12% | 20.7 30% | 65.5 -122% | 30.6 -4% | 27 8% |
| Load Average * (Watt) | 94.8 | 93 2% | 129 -36% | 90.2 5% | 99.8 -5% | 101 -7% | 109 -15% |
| Witcher 3 ultra * (Watt) | 146.1 | 142.6 2% | 176 -20% | 162 -11% | 154.1 -5% | 143 2% | 155 -6% |
| Load Maximum * (Watt) | 210.9 | 215.9 -2% | 216 -2% | 209.3 1% | 222.7 -6% | 186 12% | 236 -12% |
* ... kleiner is beter
| MSI GS66 10SGS i7-10750H, GeForce RTX 2080 Super Max-Q, 99.99 Wh | MSI GS65 Stealth 9SG i7-9750H, GeForce RTX 2080 Max-Q, 82 Wh | Asus Zephyrus S GX502GW i7-9750H, GeForce RTX 2070 Mobile, 76 Wh | Razer Blade 15 RTX 2080 Max-Q i7-9750H, GeForce RTX 2080 Max-Q, 80 Wh | Lenovo Legion Y740-15ICHg i7-9750H, GeForce RTX 2070 Max-Q, 57 Wh | MSI GS66 Stealth 10SFS i9-10980HK, GeForce RTX 2070 Super Max-Q, 99.99 Wh | |
|---|---|---|---|---|---|---|
| Batterijduur | -13% | -42% | 19% | -57% | -8% | |
| Reader / Idle (h) | 10.2 | 5.9 -42% | 15.9 56% | 8.4 -18% | ||
| WiFi v1.3 (h) | 6.9 | 6 -13% | 3.7 -46% | 6.6 -4% | 3 -57% | 6.1 -12% |
| Load (h) | 1.6 | 1 -37% | 1.7 6% | 1.7 6% |
Pro
Contra

Dit is de verkorte versie van het originele artikel. Het volledige, Engelse testrapport vind je hier.
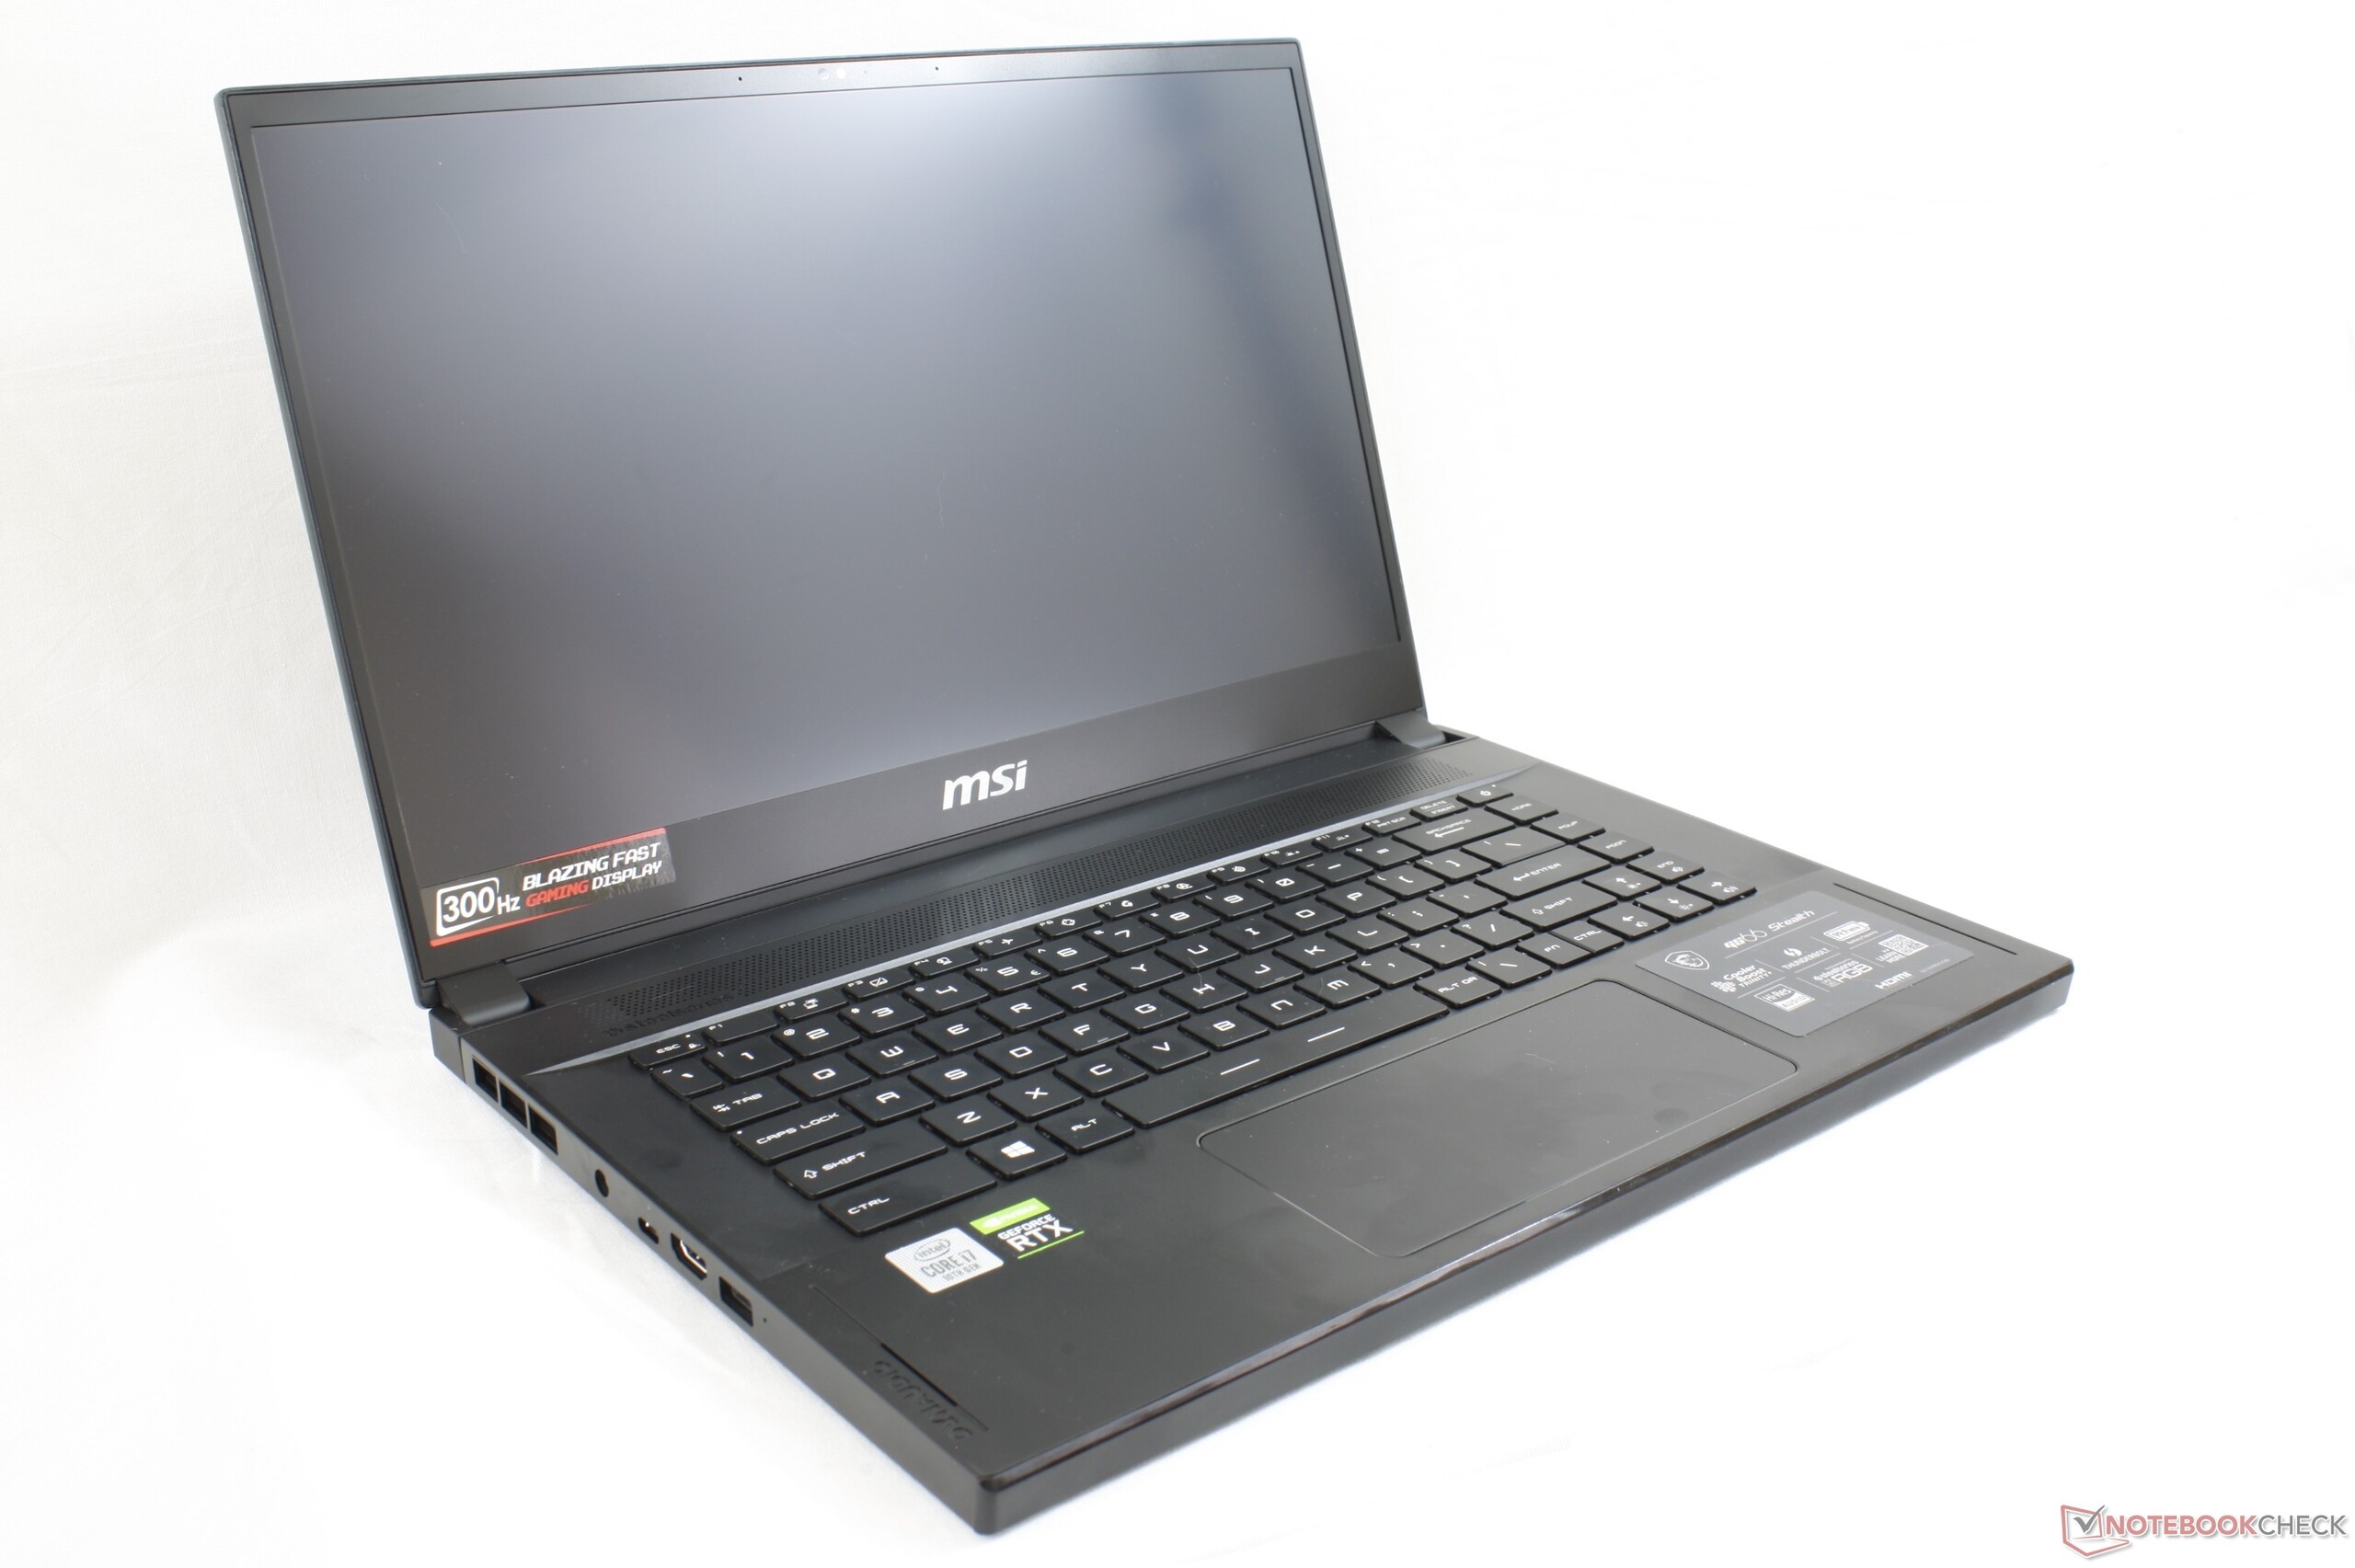
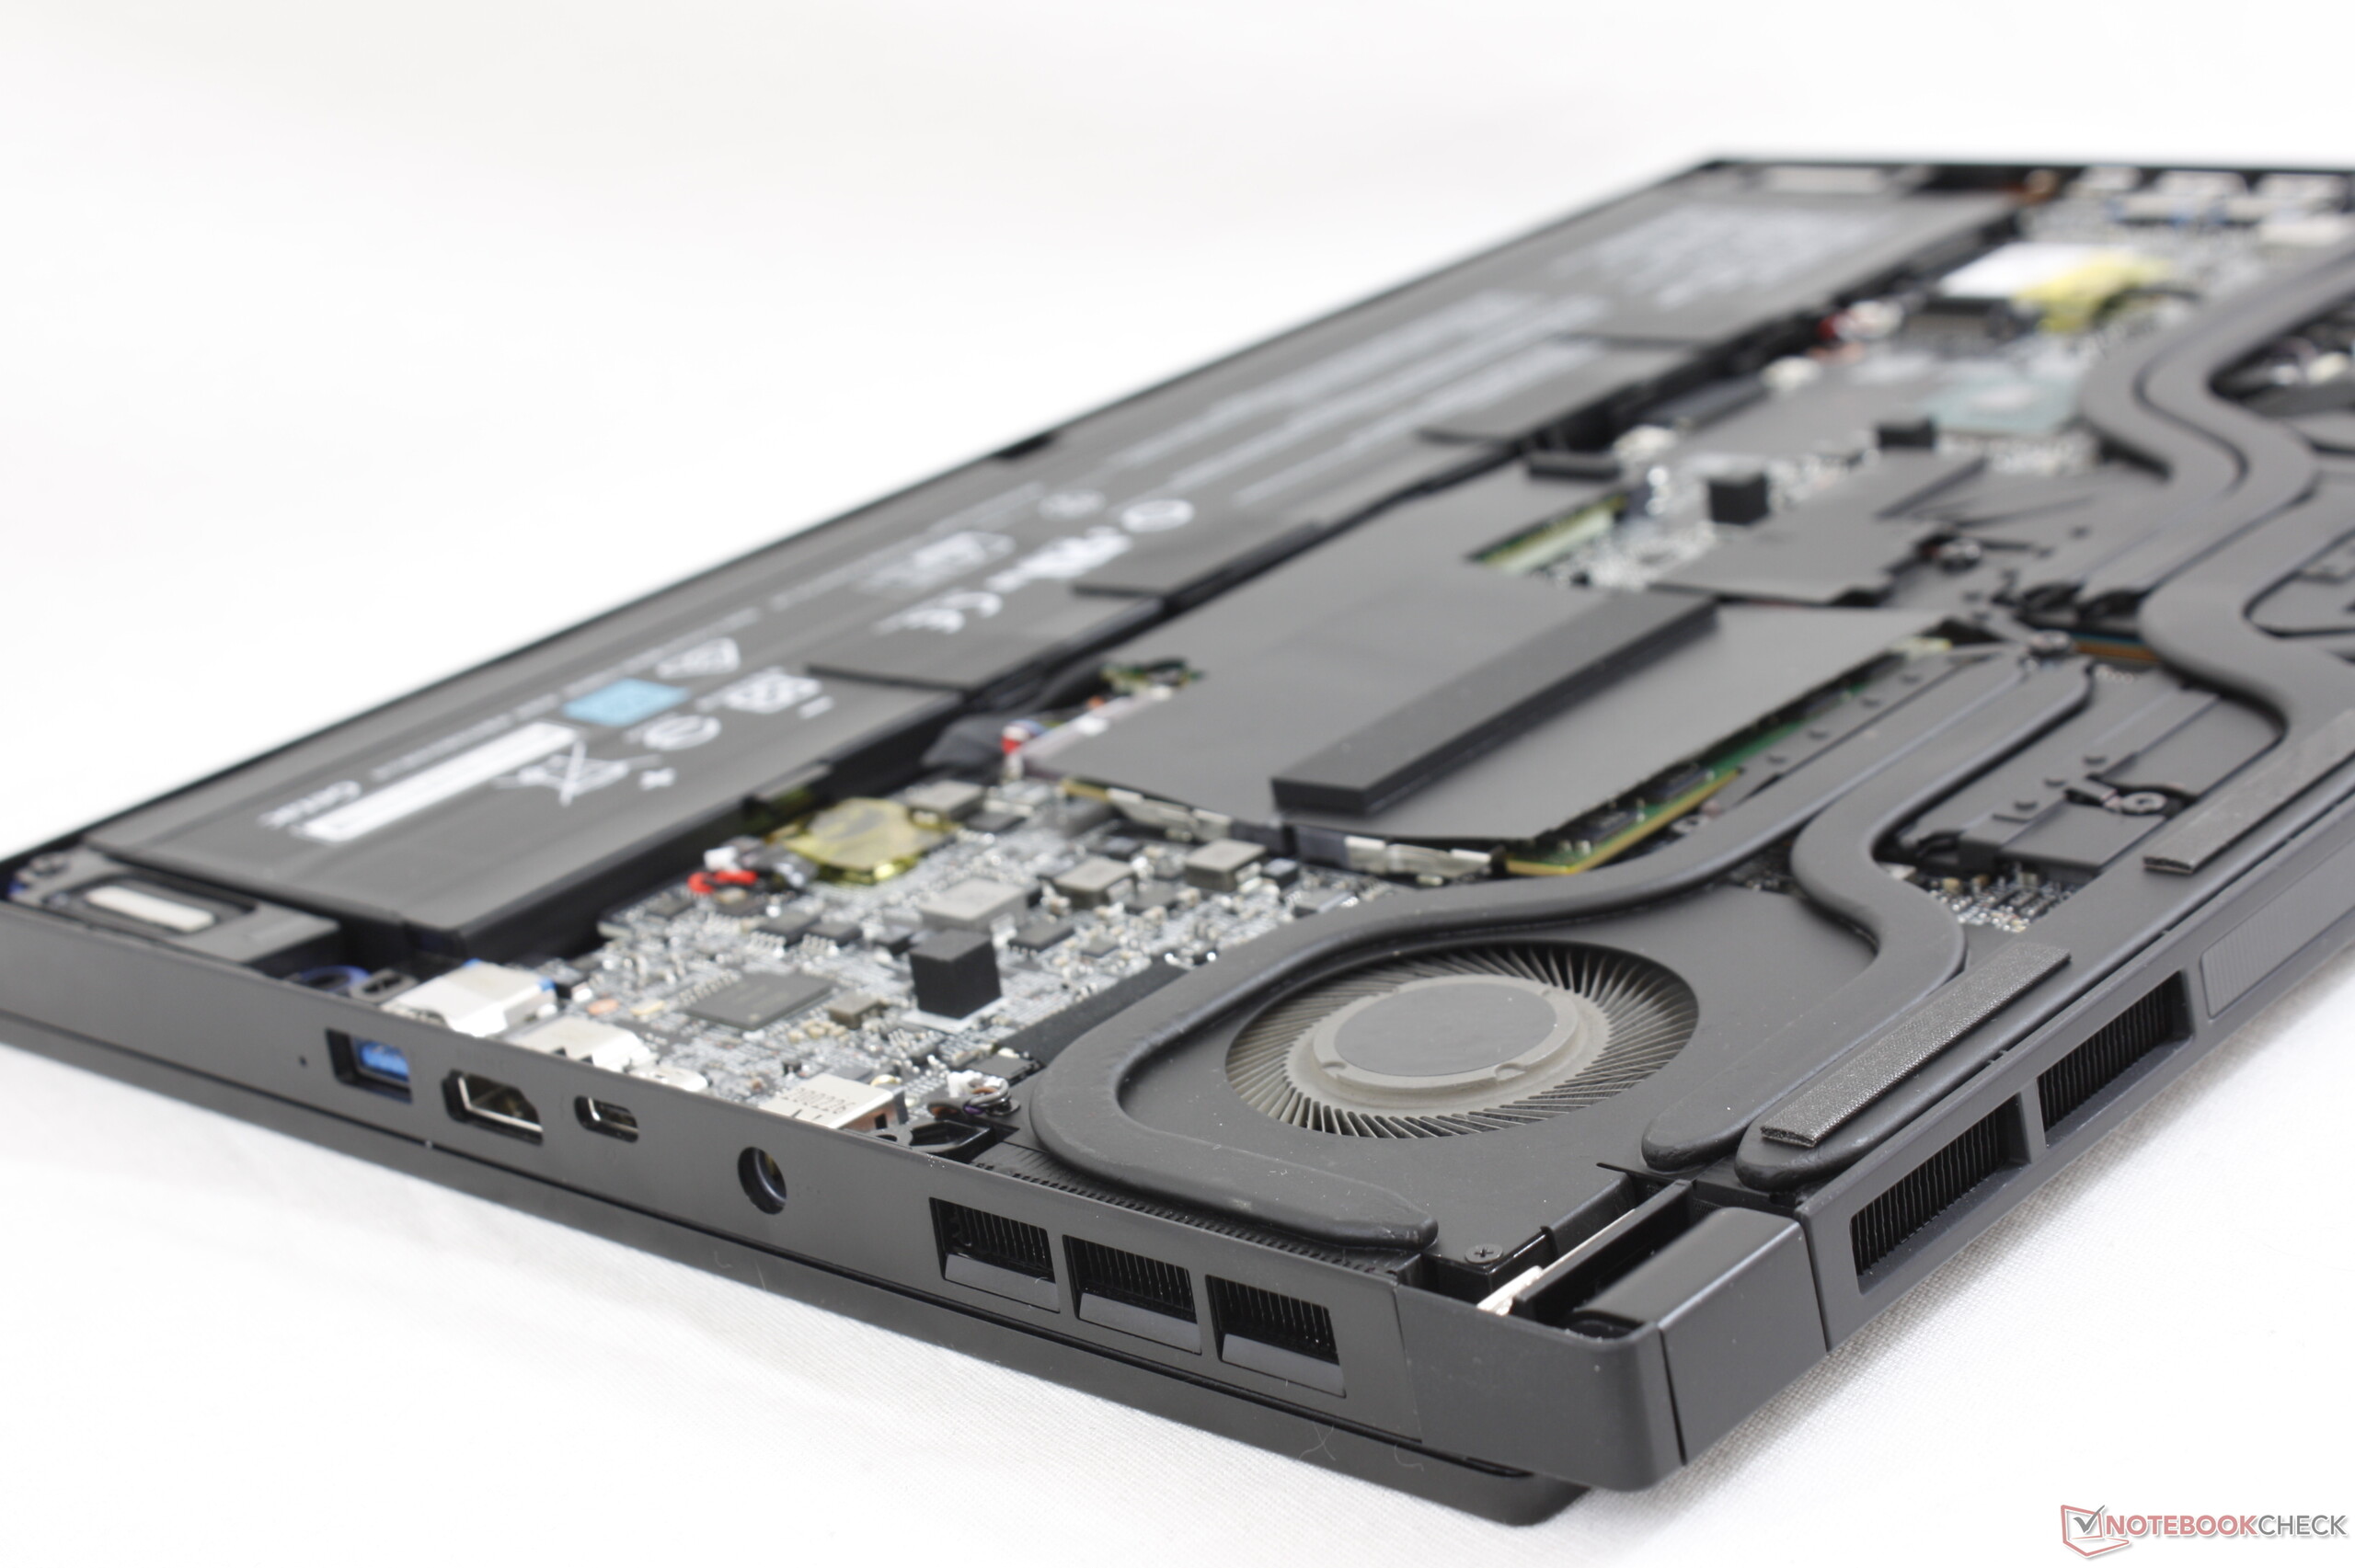
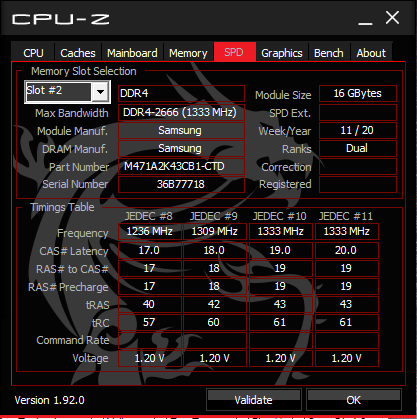
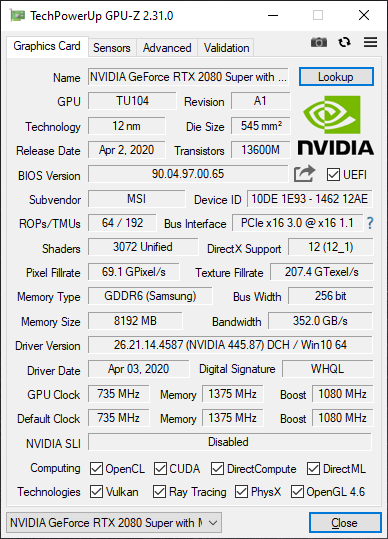
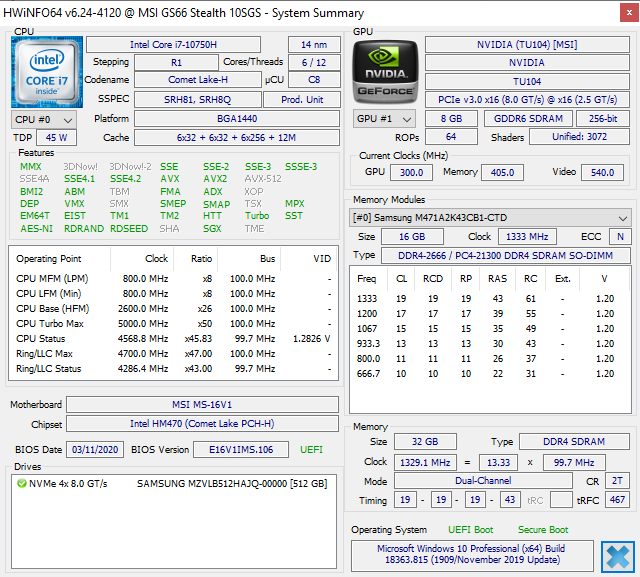
De MSI GS66 wordt geleverd in verschillende SKU's met twee CPU-opties (Core i7-10750H, Core i9-10980HK) en drie GPU-opties (GeForce RTX 2060, RTX 2070 Super Max-Q, RTX 2080 Super Max-Q). De twee SKU's die we tot nu toe hebben getest zijn de GS66 10SGS (Core i7-10750H, RTX 2080 Super Max-Q) en GS66 10SFS (Core i9-10980HK, RTX 2070 Super Max-Q). Als we moesten kiezen tussen de snellere CPU met tragere GPU of tragere CPU met snellere GPU voor gaming doeleinden, zou het zeker de laatste zijn aangezien games in het algemeen nog steeds marginaal sneller zullen lopen met deze configuratie.
Als je van plan bent om de GS66 te gebruiken voor CPU zware taken anders dan gamen, dan is de octa-core Core i9 SKU wellicht zinvoller vanwege het 25 tot 35 procent snellere multi-thread prestatievoordeel ten opzichte van de hexa-core Core i7. Anders zouden eventuele verschillen te marginaal zijn bij het gamen, waarbij de snellere GPU-optie vaak grotere invloed heeft. Gebruikers die het beste van beide werelden willen, kunnen altijd terecht bij de ultra high-end GS66 10SGS-031-configuratie.
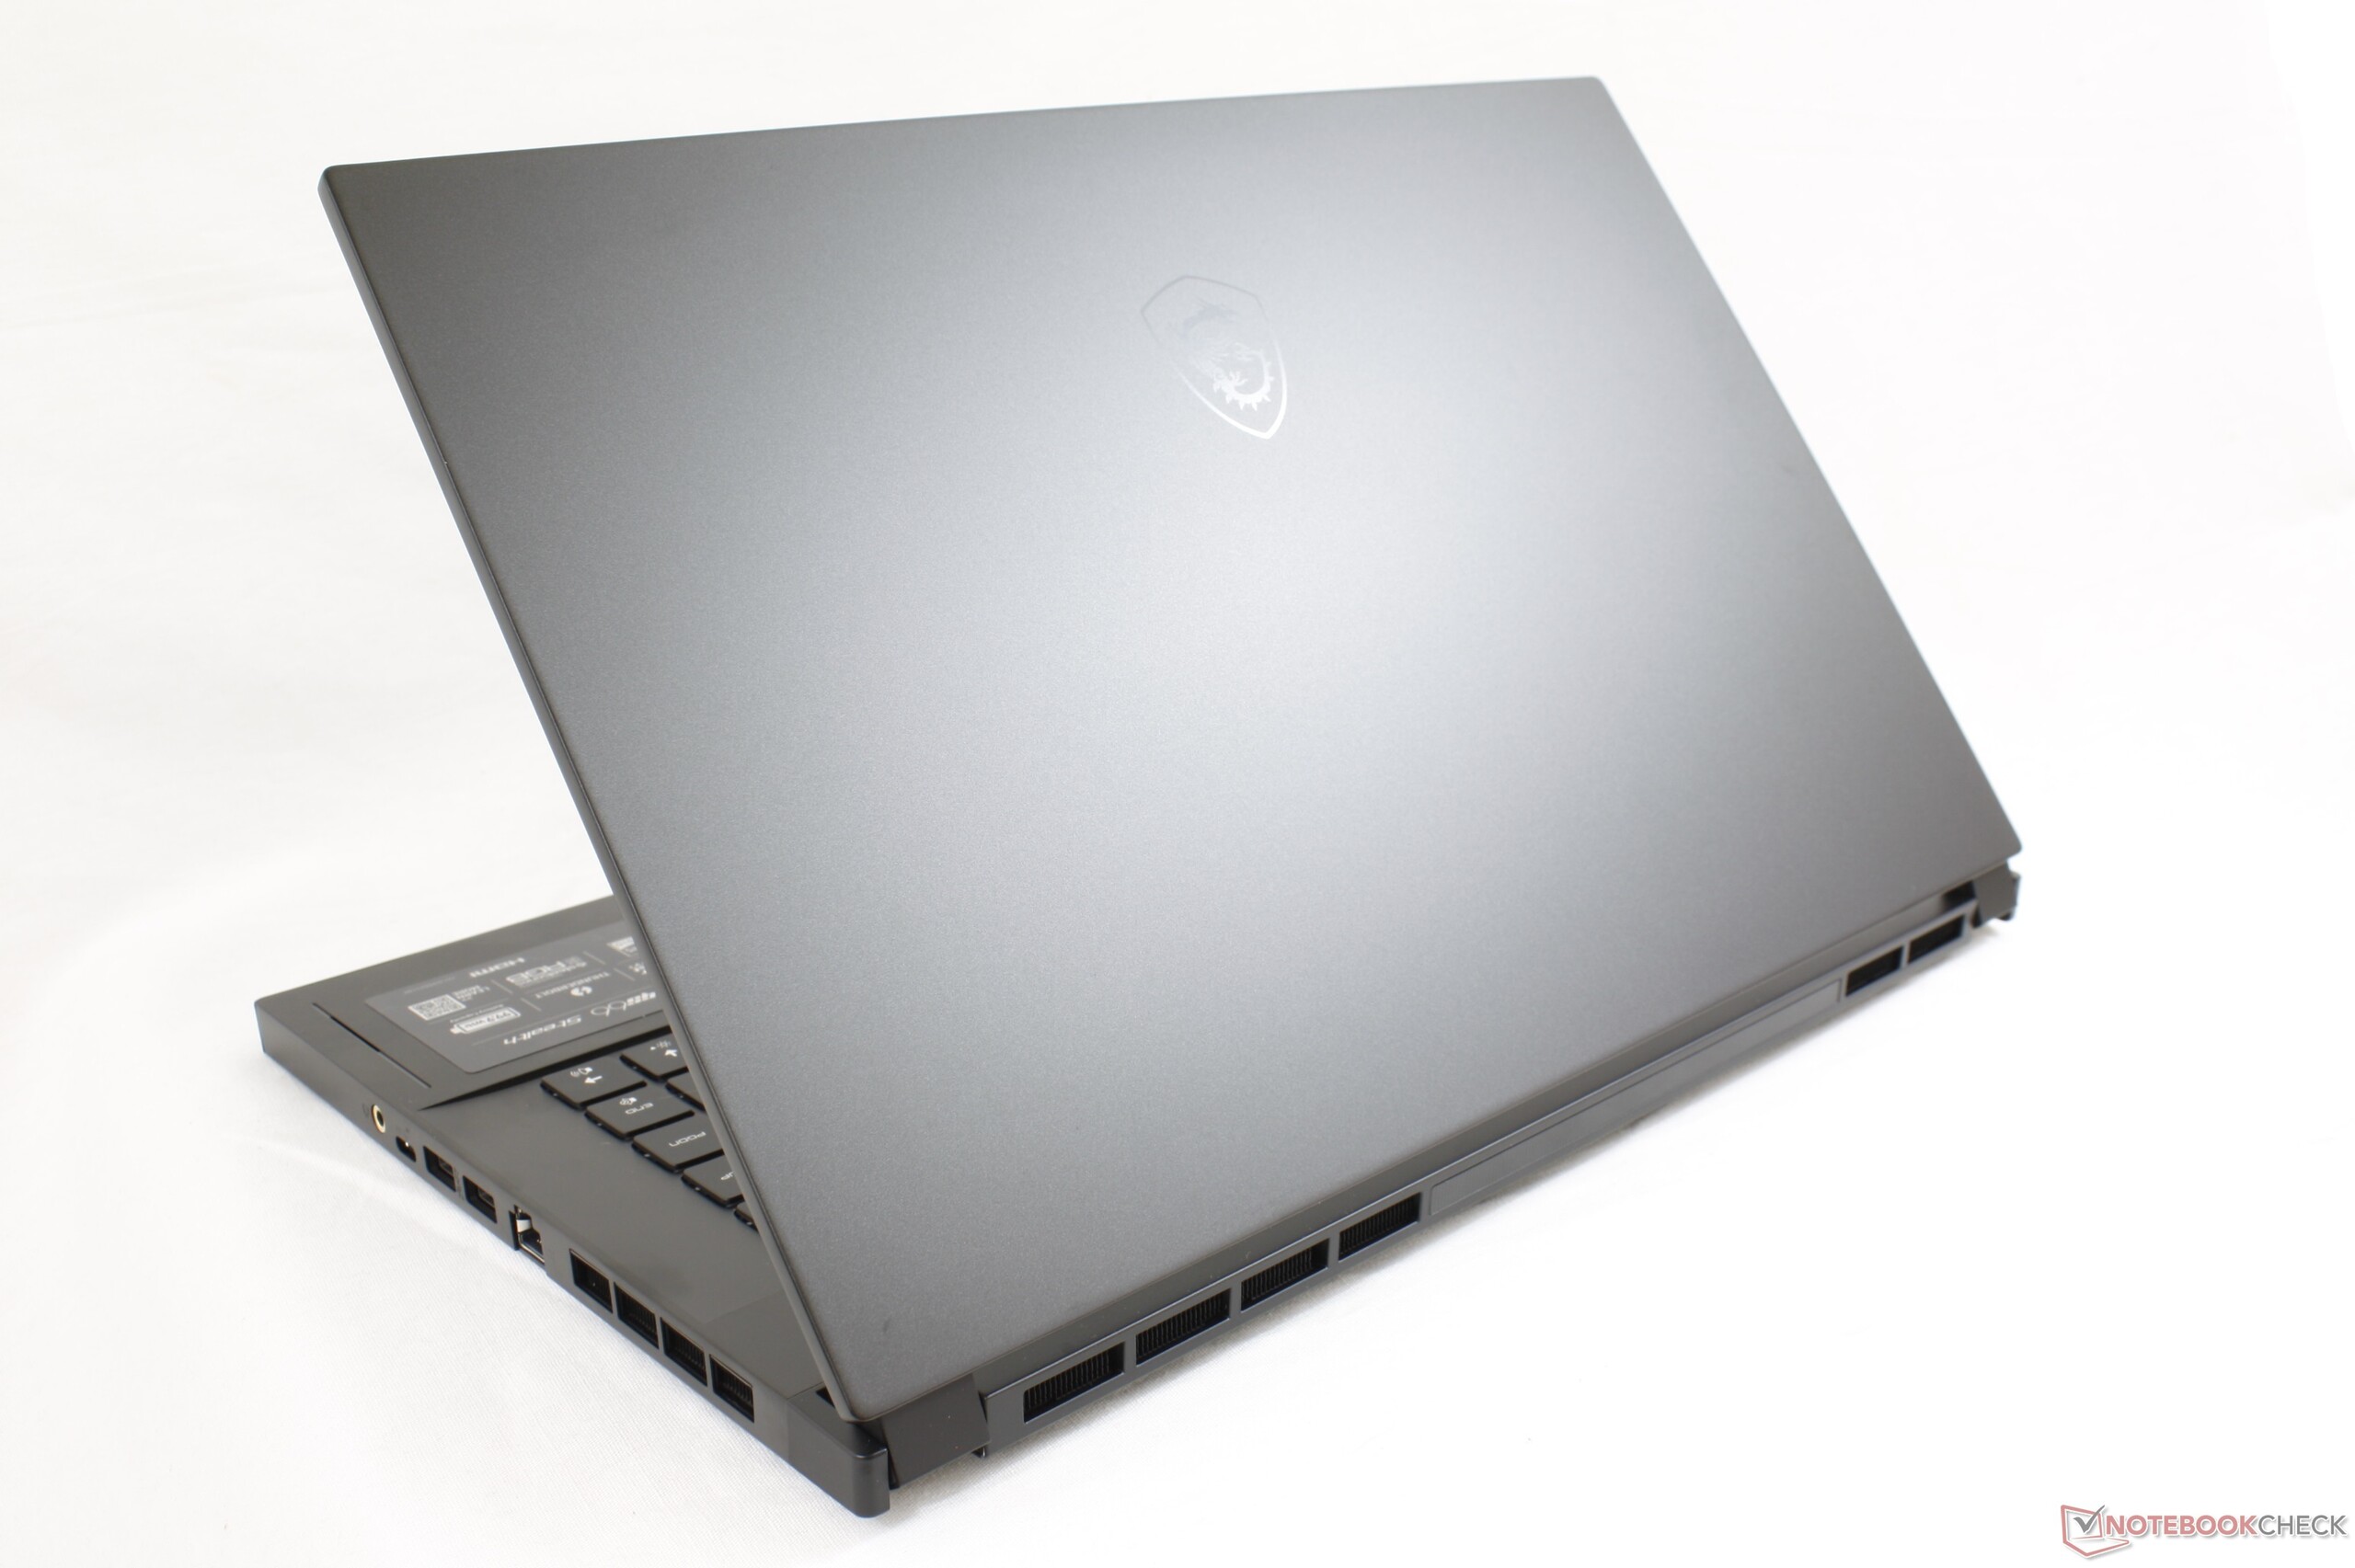
Indrukwekkend nieuwe behuizing met niet-zo-indrukwekkende game-upgrades. De GeForce RTX 2080 Super Max-Q in de GS66 biedt slechts 5 tot 10 procent snellere grafische prestaties dan de oudere MSI GS65 met de GeForce RTX 2080 Max-Q. De beste redenen om de GS66 in plaats van de GS65 aan te schaffen zijn daarom het sterkere chassisontwerp en de upgradebaarheid in plaats van de kleine prestatieverbeteringen bij het gamen.
MSI GS66 10SGS
- 17-05-2020 v7 (old)
Allen Ngo
Price comparison
