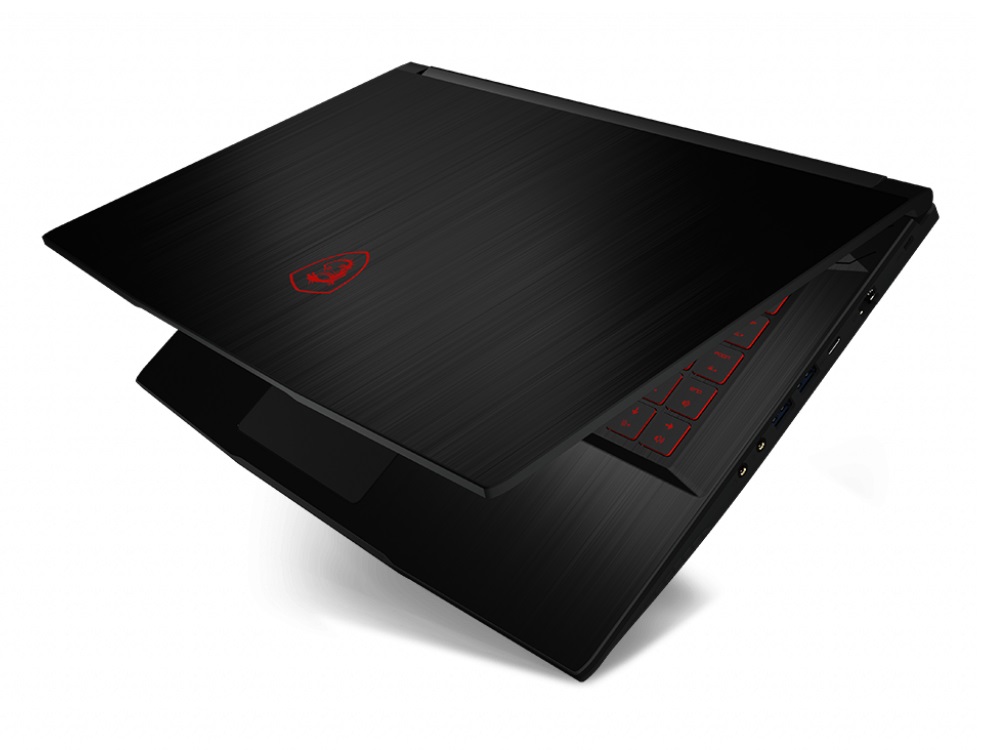
Kort testrapport MSI GF63 Thin 9SC Laptop: lichte gaming-machine voor minder dan 1000 euro
Evaluatie | Datum | Model | Gewicht | Hoogte | Formaat | Resolutie | Beste prijs |
|---|---|---|---|---|---|---|---|
| 77.6 % v7 (old) | 01-2020 | MSI GF63 Thin 9SC i5-9300H, GeForce GTX 1650 Max-Q | 1.8 kg | 22 mm | 15.60" | 1920x1080 | |
| 79.6 % v7 (old) | 10-2019 | Dell G5 15 5590-PCNJJ i5-9300H, GeForce GTX 1650 Mobile | 2.7 kg | 23.7 mm | 15.60" | 1920x1080 | |
| 82.5 % v6 (old) | 05-2019 | Acer Aspire Nitro 5 AN515-54-53Z2 i5-9300H, GeForce GTX 1650 Mobile | 2.2 kg | 27 mm | 15.60" | 1920x1080 | |
| 81.5 % v7 (old) | 07-2019 | HP Omen 15-dc1020ng i5-9300H, GeForce GTX 1650 Mobile | 2.3 kg | 25 mm | 15.60" | 1920x1080 | |
| 77 % v7 (old) | 10-2019 | Lenovo IdeaPad L340-15IRH 81LK00BMGE i5-9300H, GeForce GTX 1650 Mobile | 2.1 kg | 23.9 mm | 15.60" | 1920x1080 |
| Networking | |
| iperf3 transmit AX12 | |
| MSI GF63 Thin 9SC | |
| iperf3 receive AX12 | |
| MSI GF63 Thin 9SC | |
| |||||||||||||||||||||||||
Helderheidsverdeling: 92 %
Helderheid in Batterij-modus: 260 cd/m²
Contrast: 1130:1 (Zwart: 0.23 cd/m²)
ΔE ColorChecker Calman: 4.1 | ∀{0.5-29.43 Ø4.71}
calibrated: 3.56
ΔE Greyscale Calman: 2.83 | ∀{0.09-98 Ø4.96}
56% sRGB (Argyll 1.6.3 3D)
36% AdobeRGB 1998 (Argyll 1.6.3 3D)
39.01% AdobeRGB 1998 (Argyll 3D)
56.5% sRGB (Argyll 3D)
37.76% Display P3 (Argyll 3D)
Gamma: 2.53
CCT: 6158 K
| MSI GF63 Thin 9SC AU Optronics B156HAN02.1 (AUO21ED), IPS, 1920x1080 | Dell G5 15 5590-PCNJJ AU Optronics B156HAN (AUO23ED), IPS, 1920x1080 | Acer Aspire Nitro 5 AN515-54-53Z2 LG LP156WFC-SPD1 (LGD0563), IPS, 1920x1080 | HP Omen 15-dc1020ng LGD05CE, IPS, 1920x1080 | Lenovo IdeaPad L340-15IRH 81LK00BMGE CMN 156HCA-EAB, IPS, 1920x1080 | |
|---|---|---|---|---|---|
| Display | 115% | 1% | 2% | 13% | |
| Display P3 Coverage (%) | 37.76 | 83.1 120% | 37.97 1% | 38.37 2% | 42.81 13% |
| sRGB Coverage (%) | 56.5 | 99.9 77% | 57 1% | 57.6 2% | 63.8 13% |
| AdobeRGB 1998 Coverage (%) | 39.01 | 96.8 148% | 39.23 1% | 39.69 2% | 44.31 14% |
| Response Times | -1% | 11% | 9% | 1% | |
| Response Time Grey 50% / Grey 80% * (ms) | 44.8 ? | 48 ? -7% | 42 ? 6% | 40 ? 11% | 45.6 ? -2% |
| Response Time Black / White * (ms) | 31.6 ? | 30 ? 5% | 26.8 ? 15% | 29.6 ? 6% | 30.8 ? 3% |
| PWM Frequency (Hz) | 25910 ? | ||||
| Screen | -19% | -2% | -21% | -16% | |
| Brightness middle (cd/m²) | 260 | 234 -10% | 238 -8% | 251 -3% | 275 6% |
| Brightness (cd/m²) | 249 | 216 -13% | 226 -9% | 232 -7% | 253 2% |
| Brightness Distribution (%) | 92 | 87 -5% | 83 -10% | 76 -17% | 83 -10% |
| Black Level * (cd/m²) | 0.23 | 0.22 4% | 0.27 -17% | 0.17 26% | 0.18 22% |
| Contrast (:1) | 1130 | 1064 -6% | 881 -22% | 1476 31% | 1528 35% |
| Colorchecker dE 2000 * | 4.1 | 6.52 -59% | 4.11 -0% | 6.2 -51% | 5.4 -32% |
| Colorchecker dE 2000 max. * | 7.93 | 10.58 -33% | 6.89 13% | 18.6 -135% | 21.3 -169% |
| Colorchecker dE 2000 calibrated * | 3.56 | 3.56 -0% | 3.76 -6% | 4.8 -35% | 4.4 -24% |
| Greyscale dE 2000 * | 2.83 | 5.33 -88% | 1.78 37% | 4.2 -48% | 3.7 -31% |
| Gamma | 2.53 87% | 2.86 77% | 2.41 91% | 2.32 95% | 2.12 104% |
| CCT | 6158 106% | 5983 109% | 6311 103% | 7454 87% | 6376 102% |
| Color Space (Percent of AdobeRGB 1998) (%) | 36 | 36 0% | 36 0% | 36.5 1% | 40.8 13% |
| Color Space (Percent of sRGB) (%) | 56 | 57 2% | 57 2% | 57.4 2% | 63.6 14% |
| Totaal Gemiddelde (Programma / Instellingen) | 32% /
8% | 3% /
0% | -3% /
-13% | -1% /
-8% |
* ... kleiner is beter
Responstijd Scherm
| ↔ Responstijd Zwart naar Wit | ||
|---|---|---|
| 31.6 ms ... stijging ↗ en daling ↘ gecombineerd | ↗ 17.2 ms stijging | 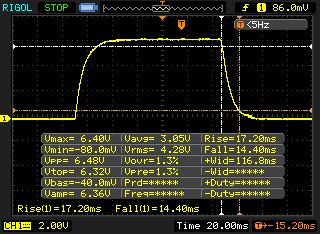 |
| ↘ 14.4 ms daling | ||
| Het scherm vertoonde trage responstijden in onze tests en is misschien te traag voor games. Ter vergelijking: alle testtoestellen variëren van 0.1 (minimum) tot 240 (maximum) ms. » 85 % van alle toestellen zijn beter. Dit betekent dat de gemeten responstijd slechter is dan het gemiddelde (19.8 ms) van alle geteste toestellen. | ||
| ↔ Responstijd 50% Grijs naar 80% Grijs | ||
| 44.8 ms ... stijging ↗ en daling ↘ gecombineerd | ↗ 22 ms stijging | 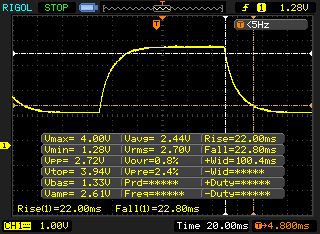 |
| ↘ 22.8 ms daling | ||
| Het scherm vertoonde trage responstijden in onze tests en is misschien te traag voor games. Ter vergelijking: alle testtoestellen variëren van 0.165 (minimum) tot 636 (maximum) ms. » 76 % van alle toestellen zijn beter. Dit betekent dat de gemeten responstijd slechter is dan het gemiddelde (30.9 ms) van alle geteste toestellen. | ||
Screen Flickering / PWM (Pulse-Width Modulation)
| Screen flickering / PWM niet waargenomen | 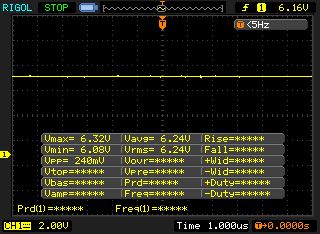 | ||
Ter vergelijking: 52 % van alle geteste toestellen maakten geen gebruik van PWM om de schermhelderheid te verlagen. Als het wel werd gebruikt, werd een gemiddelde van 7741 (minimum: 5 - maximum: 343500) Hz waargenomen. | |||
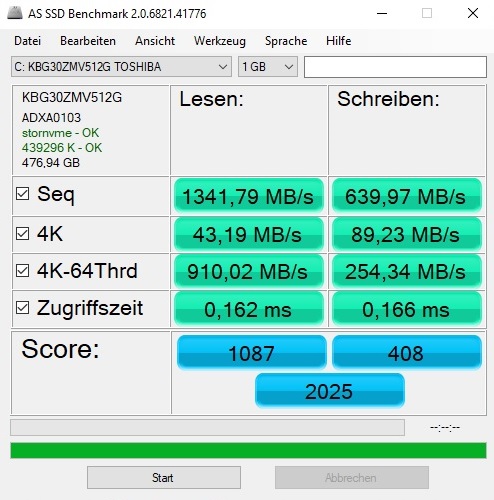
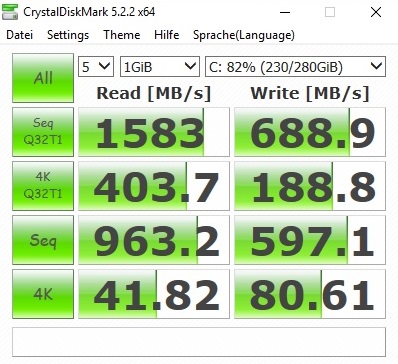
| MSI GF63 Thin 9SC Toshiba KBG30ZMV512G | Dell G5 15 5590-PCNJJ KBG30ZMS128G | Acer Aspire Nitro 5 AN515-54-53Z2 WDC PC SN520 SDAPNUW-512G | HP Omen 15-dc1020ng WDC PC SN720 SDAQNTW-512G | Lenovo IdeaPad L340-15IRH 81LK00BMGE WDC PC SN520 SDAPMUW-512 | |
|---|---|---|---|---|---|
| CrystalDiskMark 5.2 / 6 | -43% | 48% | 105% | 34% | |
| Write 4K (MB/s) | 80.6 | 65.3 -19% | 109.1 35% | 112.1 39% | 103.6 29% |
| Read 4K (MB/s) | 41.82 | 29.71 -29% | 42.05 1% | 42.01 0% | 39.91 -5% |
| Write Seq (MB/s) | 597 | 128.8 -78% | 1457 144% | 1964 229% | 1160 94% |
| Read Seq (MB/s) | 963 | 859 -11% | 1421 48% | 2065 114% | 990 3% |
| Write 4K Q32T1 (MB/s) | 188.8 | 95.8 -49% | 287.8 52% | 318.2 69% | 283.4 50% |
| Read 4K Q32T1 (MB/s) | 403.7 | 197.6 -51% | 317.9 -21% | 406.7 1% | 344.5 -15% |
| Write Seq Q32T1 (MB/s) | 689 | 132.5 -81% | 1455 111% | 2534 268% | 1455 111% |
| Read Seq Q32T1 (MB/s) | 1583 | 1208 -24% | 1739 10% | 3438 117% | 1690 7% |

| 3DMark 11 Performance | 10378 punten | |
| 3DMark Cloud Gate Standard Score | 17713 punten | |
| 3DMark Fire Strike Score | 7177 punten | |
| 3DMark Time Spy Score | 3136 punten | |
Help | ||
| The Witcher 3 | |
| 1920x1080 High Graphics & Postprocessing (Nvidia HairWorks Off) | |
| Gemiddelde van klas Gaming (341 - 404, n=2, laatste 2 jaar) | |
| HP Omen 15-dc1020ng | |
| Acer Aspire Nitro 5 AN515-54-53Z2 | |
| Dell G5 15 5590-PCNJJ | |
| MSI GF63 Thin 9SC | |
| 1920x1080 Ultra Graphics & Postprocessing (HBAO+) | |
| Gemiddelde van klas Gaming (104.7 - 240, n=7, laatste 2 jaar) | |
| HP Omen 15-dc1020ng | |
| Acer Aspire Nitro 5 AN515-54-53Z2 | |
| Lenovo IdeaPad L340-15IRH 81LK00BMGE | |
| Dell G5 15 5590-PCNJJ | |
| MSI GF63 Thin 9SC | |
| lage | gem. | hoge | ultra | |
|---|---|---|---|---|
| The Witcher 3 (2015) | 146 | 99 | 53.2 | 30.4 |
| Apex Legends (2019) | 144 | 71.1 | 58.4 | 57 |
| Far Cry New Dawn (2019) | 72 | 52 | 49 | 46 |
| Metro Exodus (2019) | 73.3 | 36.9 | 27.5 | 22.6 |
| Dirt Rally 2.0 (2019) | 154 | 81.6 | 68.8 | 38.7 |
| The Division 2 (2019) | 82 | 56 | 45 | 32 |
| Anno 1800 (2019) | 60.4 | 52.2 | 34.7 | 18 |
| Rage 2 (2019) | 103 | 46.5 | 39.7 | 38.9 |
| F1 2019 (2019) | 127 | 83 | 69 | 46 |
| Control (2019) | 120 | 39.9 | 29.1 | |
| Borderlands 3 (2019) | 86 | 53.6 | 34.9 | 26 |
| FIFA 20 (2019) | 150 | 118 | 115 | 114 |
| Ghost Recon Breakpoint (2019) | 63 | 41 | 39 | 26 |
| GRID 2019 (2019) | 92.4 | 65.9 | 53.4 | 36.7 |
| Call of Duty Modern Warfare 2019 (2019) | 94.1 | 59 | 49.8 | 40.6 |
| Need for Speed Heat (2019) | 67.6 | 52.2 | 46.8 | 37.2 |
| Star Wars Jedi Fallen Order (2019) | 57.2 | 49.7 | 44.4 | |
| Red Dead Redemption 2 (2019) | 56.3 | 43.5 | 29.3 | 18.6 |
Geluidsniveau
| Onbelast |
| 35 / 36 / 37 dB (A) |
| Belasting |
| 44 / 43 dB (A) |
 | ||
30 dB stil 40 dB(A) hoorbaar 50 dB(A) luid |
||
min: | ||
| MSI GF63 Thin 9SC i5-9300H, GeForce GTX 1650 Max-Q | Dell G5 15 5590-PCNJJ i5-9300H, GeForce GTX 1650 Mobile | Acer Aspire Nitro 5 AN515-54-53Z2 i5-9300H, GeForce GTX 1650 Mobile | HP Omen 15-dc1020ng i5-9300H, GeForce GTX 1650 Mobile | Lenovo IdeaPad L340-15IRH 81LK00BMGE i5-9300H, GeForce GTX 1650 Mobile | Gemiddelde van klas Gaming | |
|---|---|---|---|---|---|---|
| Noise | -3% | 1% | 14% | 16% | 11% | |
| uit / omgeving * (dB) | 30 | 30 -0% | 30 -0% | 28.8 4% | 28.4 5% | 24.1 ? 20% |
| Idle Minimum * (dB) | 35 | 31 11% | 30 14% | 28.8 18% | 28.4 19% | 25.9 ? 26% |
| Idle Average * (dB) | 36 | 32 11% | 31 14% | 29.5 18% | 28.4 21% | 27.4 ? 24% |
| Idle Maximum * (dB) | 37 | 35 5% | 33 11% | 31.1 16% | 28.4 23% | 30.1 ? 19% |
| Load Average * (dB) | 44 | 49 -11% | 46 -5% | 35.2 20% | 30.1 32% | 43.7 ? 1% |
| Witcher 3 ultra * (dB) | 41 | 47 -15% | 46 -12% | 35.2 14% | 40.2 2% | |
| Load Maximum * (dB) | 43 | 53 -23% | 49 -14% | 41 5% | 40.2 7% | 54.3 ? -26% |
* ... kleiner is beter
(-) De maximumtemperatuur aan de bovenzijde bedraagt 47 °C / 117 F, vergeleken met het gemiddelde van 40.4 °C / 105 F, variërend van 21.2 tot 68.8 °C voor de klasse Gaming.
(-) De bodem warmt op tot een maximum van 47 °C / 117 F, vergeleken met een gemiddelde van 43.2 °C / 110 F
(+) Bij onbelast gebruik bedraagt de gemiddelde temperatuur voor de bovenzijde 23.8 °C / 75 F, vergeleken met het apparaatgemiddelde van 33.9 °C / 93 F.
(-) Bij het spelen van The Witcher 3 is de gemiddelde temperatuur voor de bovenzijde 38.8 °C / 102 F, vergeleken met het apparaatgemiddelde van 33.9 °C / 93 F.
(+) De handpalmsteunen en het touchpad bereiken maximaal de huidtemperatuur (32 °C / 89.6 F) en zijn dus niet heet.
(-) De gemiddelde temperatuur van de handpalmsteun van soortgelijke toestellen bedroeg 28.8 °C / 83.8 F (-3.2 °C / -5.8 F).
| MSI GF63 Thin 9SC i5-9300H, GeForce GTX 1650 Max-Q | Dell G5 15 5590-PCNJJ i5-9300H, GeForce GTX 1650 Mobile | Acer Aspire Nitro 5 AN515-54-53Z2 i5-9300H, GeForce GTX 1650 Mobile | HP Omen 15-dc1020ng i5-9300H, GeForce GTX 1650 Mobile | Lenovo IdeaPad L340-15IRH 81LK00BMGE i5-9300H, GeForce GTX 1650 Mobile | Gemiddelde van klas Gaming | |
|---|---|---|---|---|---|---|
| Heat | -4% | 2% | 6% | -8% | -12% | |
| Maximum Upper Side * (°C) | 47 | 49 -4% | 47 -0% | 40.3 14% | 44.8 5% | 45.1 ? 4% |
| Maximum Bottom * (°C) | 47 | 55 -17% | 50 -6% | 48.5 -3% | 58.1 -24% | 48.1 ? -2% |
| Idle Upper Side * (°C) | 26 | 25 4% | 24 8% | 23.9 8% | 27.9 -7% | 31 ? -19% |
| Idle Bottom * (°C) | 26 | 26 -0% | 25 4% | 24.6 5% | 27.9 -7% | 34.2 ? -32% |
* ... kleiner is beter
MSI GF63 Thin 9SC audioanalyse
(+) | luidsprekers kunnen relatief luid spelen (86 dB)
Bas 100 - 315 Hz
(-) | bijna geen lage tonen - gemiddeld 19.5% lager dan de mediaan
(±) | lineariteit van de lage tonen is gemiddeld (10.9% delta ten opzichte van de vorige frequentie)
Midden 400 - 2000 Hz
(±) | hogere middens - gemiddeld 7.7% hoger dan de mediaan
(±) | lineariteit van de middentonen is gemiddeld (9.9% delta ten opzichte van de vorige frequentie)
Hoog 2 - 16 kHz
(+) | evenwichtige hoogtepunten - slechts 1.8% verwijderd van de mediaan
(+) | de hoge tonen zijn lineair (6.3% delta naar de vorige frequentie)
Algemeen 100 - 16.000 Hz
(±) | lineariteit van het totale geluid is gemiddeld (18.9% verschil met de mediaan)
Vergeleken met dezelfde klasse
» 63% van alle geteste apparaten in deze klasse waren beter, 8% vergelijkbaar, 29% slechter
» De beste had een delta van 6%, het gemiddelde was 18%, de slechtste was 132%
Vergeleken met alle geteste toestellen
» 44% van alle geteste apparaten waren beter, 8% gelijk, 48% slechter
» De beste had een delta van 4%, het gemiddelde was 23%, de slechtste was 134%
Dell G5 15 5590-PCNJJ audioanalyse
(+) | luidsprekers kunnen relatief luid spelen (87 dB)
Bas 100 - 315 Hz
(-) | bijna geen lage tonen - gemiddeld 19.7% lager dan de mediaan
(±) | lineariteit van de lage tonen is gemiddeld (11.9% delta ten opzichte van de vorige frequentie)
Midden 400 - 2000 Hz
(±) | hogere middens - gemiddeld 5.7% hoger dan de mediaan
(+) | de middentonen zijn lineair (4.9% delta ten opzichte van de vorige frequentie)
Hoog 2 - 16 kHz
(±) | lagere maxima - gemiddeld 6.5% lager dan de mediaan
(±) | lineariteit van de hoogtepunten is gemiddeld (9.6% delta ten opzichte van de vorige frequentie)
Algemeen 100 - 16.000 Hz
(±) | lineariteit van het totale geluid is gemiddeld (17.4% verschil met de mediaan)
Vergeleken met dezelfde klasse
» 48% van alle geteste apparaten in deze klasse waren beter, 12% vergelijkbaar, 40% slechter
» De beste had een delta van 6%, het gemiddelde was 18%, de slechtste was 132%
Vergeleken met alle geteste toestellen
» 33% van alle geteste apparaten waren beter, 8% gelijk, 58% slechter
» De beste had een delta van 4%, het gemiddelde was 23%, de slechtste was 134%
| Uit / Standby | |
| Inactief | |
| Belasting |
|
Key:
min: | |
| MSI GF63 Thin 9SC i5-9300H, GeForce GTX 1650 Max-Q | Dell G5 15 5590-PCNJJ i5-9300H, GeForce GTX 1650 Mobile | Acer Aspire Nitro 5 AN515-54-53Z2 i5-9300H, GeForce GTX 1650 Mobile | HP Omen 15-dc1020ng i5-9300H, GeForce GTX 1650 Mobile | Lenovo IdeaPad L340-15IRH 81LK00BMGE i5-9300H, GeForce GTX 1650 Mobile | Gemiddelde van klas Gaming | |
|---|---|---|---|---|---|---|
| Power Consumption | 9% | 8% | 9% | 20% | -77% | |
| Idle Minimum * (Watt) | 7 | 4 43% | 5 29% | 4.04 42% | 3.8 46% | 13.1 ? -87% |
| Idle Average * (Watt) | 9 | 7 22% | 7 22% | 7.2 20% | 6.6 27% | 19 ? -111% |
| Idle Maximum * (Watt) | 13 | 12 8% | 11 15% | 11.4 12% | 8.9 32% | 24.6 ? -89% |
| Load Average * (Watt) | 79 | 95 -20% | 89 -13% | 80.8 -2% | 78.4 1% | 111.3 ? -41% |
| Witcher 3 ultra * (Watt) | 73 | 86 -18% | 90 -23% | 93.6 -28% | 82 -12% | |
| Load Maximum * (Watt) | 164 | 135 18% | 132 20% | 144.5 12% | 124 24% | 260 ? -59% |
* ... kleiner is beter
| MSI GF63 Thin 9SC i5-9300H, GeForce GTX 1650 Max-Q, 51 Wh | Dell G5 15 5590-PCNJJ i5-9300H, GeForce GTX 1650 Mobile, 60 Wh | Acer Aspire Nitro 5 AN515-54-53Z2 i5-9300H, GeForce GTX 1650 Mobile, 57 Wh | HP Omen 15-dc1020ng i5-9300H, GeForce GTX 1650 Mobile, 52.5 Wh | Lenovo IdeaPad L340-15IRH 81LK00BMGE i5-9300H, GeForce GTX 1650 Mobile, 45 Wh | Gemiddelde van klas Gaming | |
|---|---|---|---|---|---|---|
| Batterijduur | 79% | 71% | 44% | 5% | 26% | |
| Reader / Idle (h) | 8.5 | 14.5 71% | 17.4 105% | 15.9 87% | 7.8 -8% | 7.84 ? -8% |
| WiFi v1.3 (h) | 4.4 | 8 82% | 8.1 84% | 6.4 45% | 6.1 39% | 7.08 ? 61% |
| Load (h) | 1.2 | 2.2 83% | 1.5 25% | 1.2 0% | 1 -17% | 1.496 ? 25% |
| H.264 (h) | 8 | 8.27 ? | ||||
| Witcher 3 ultra (h) | 1 |
Pro
Contra
Dit is de verkorte versie van het originele artikel. Het volledige, Engelse testrapport vind je hier.
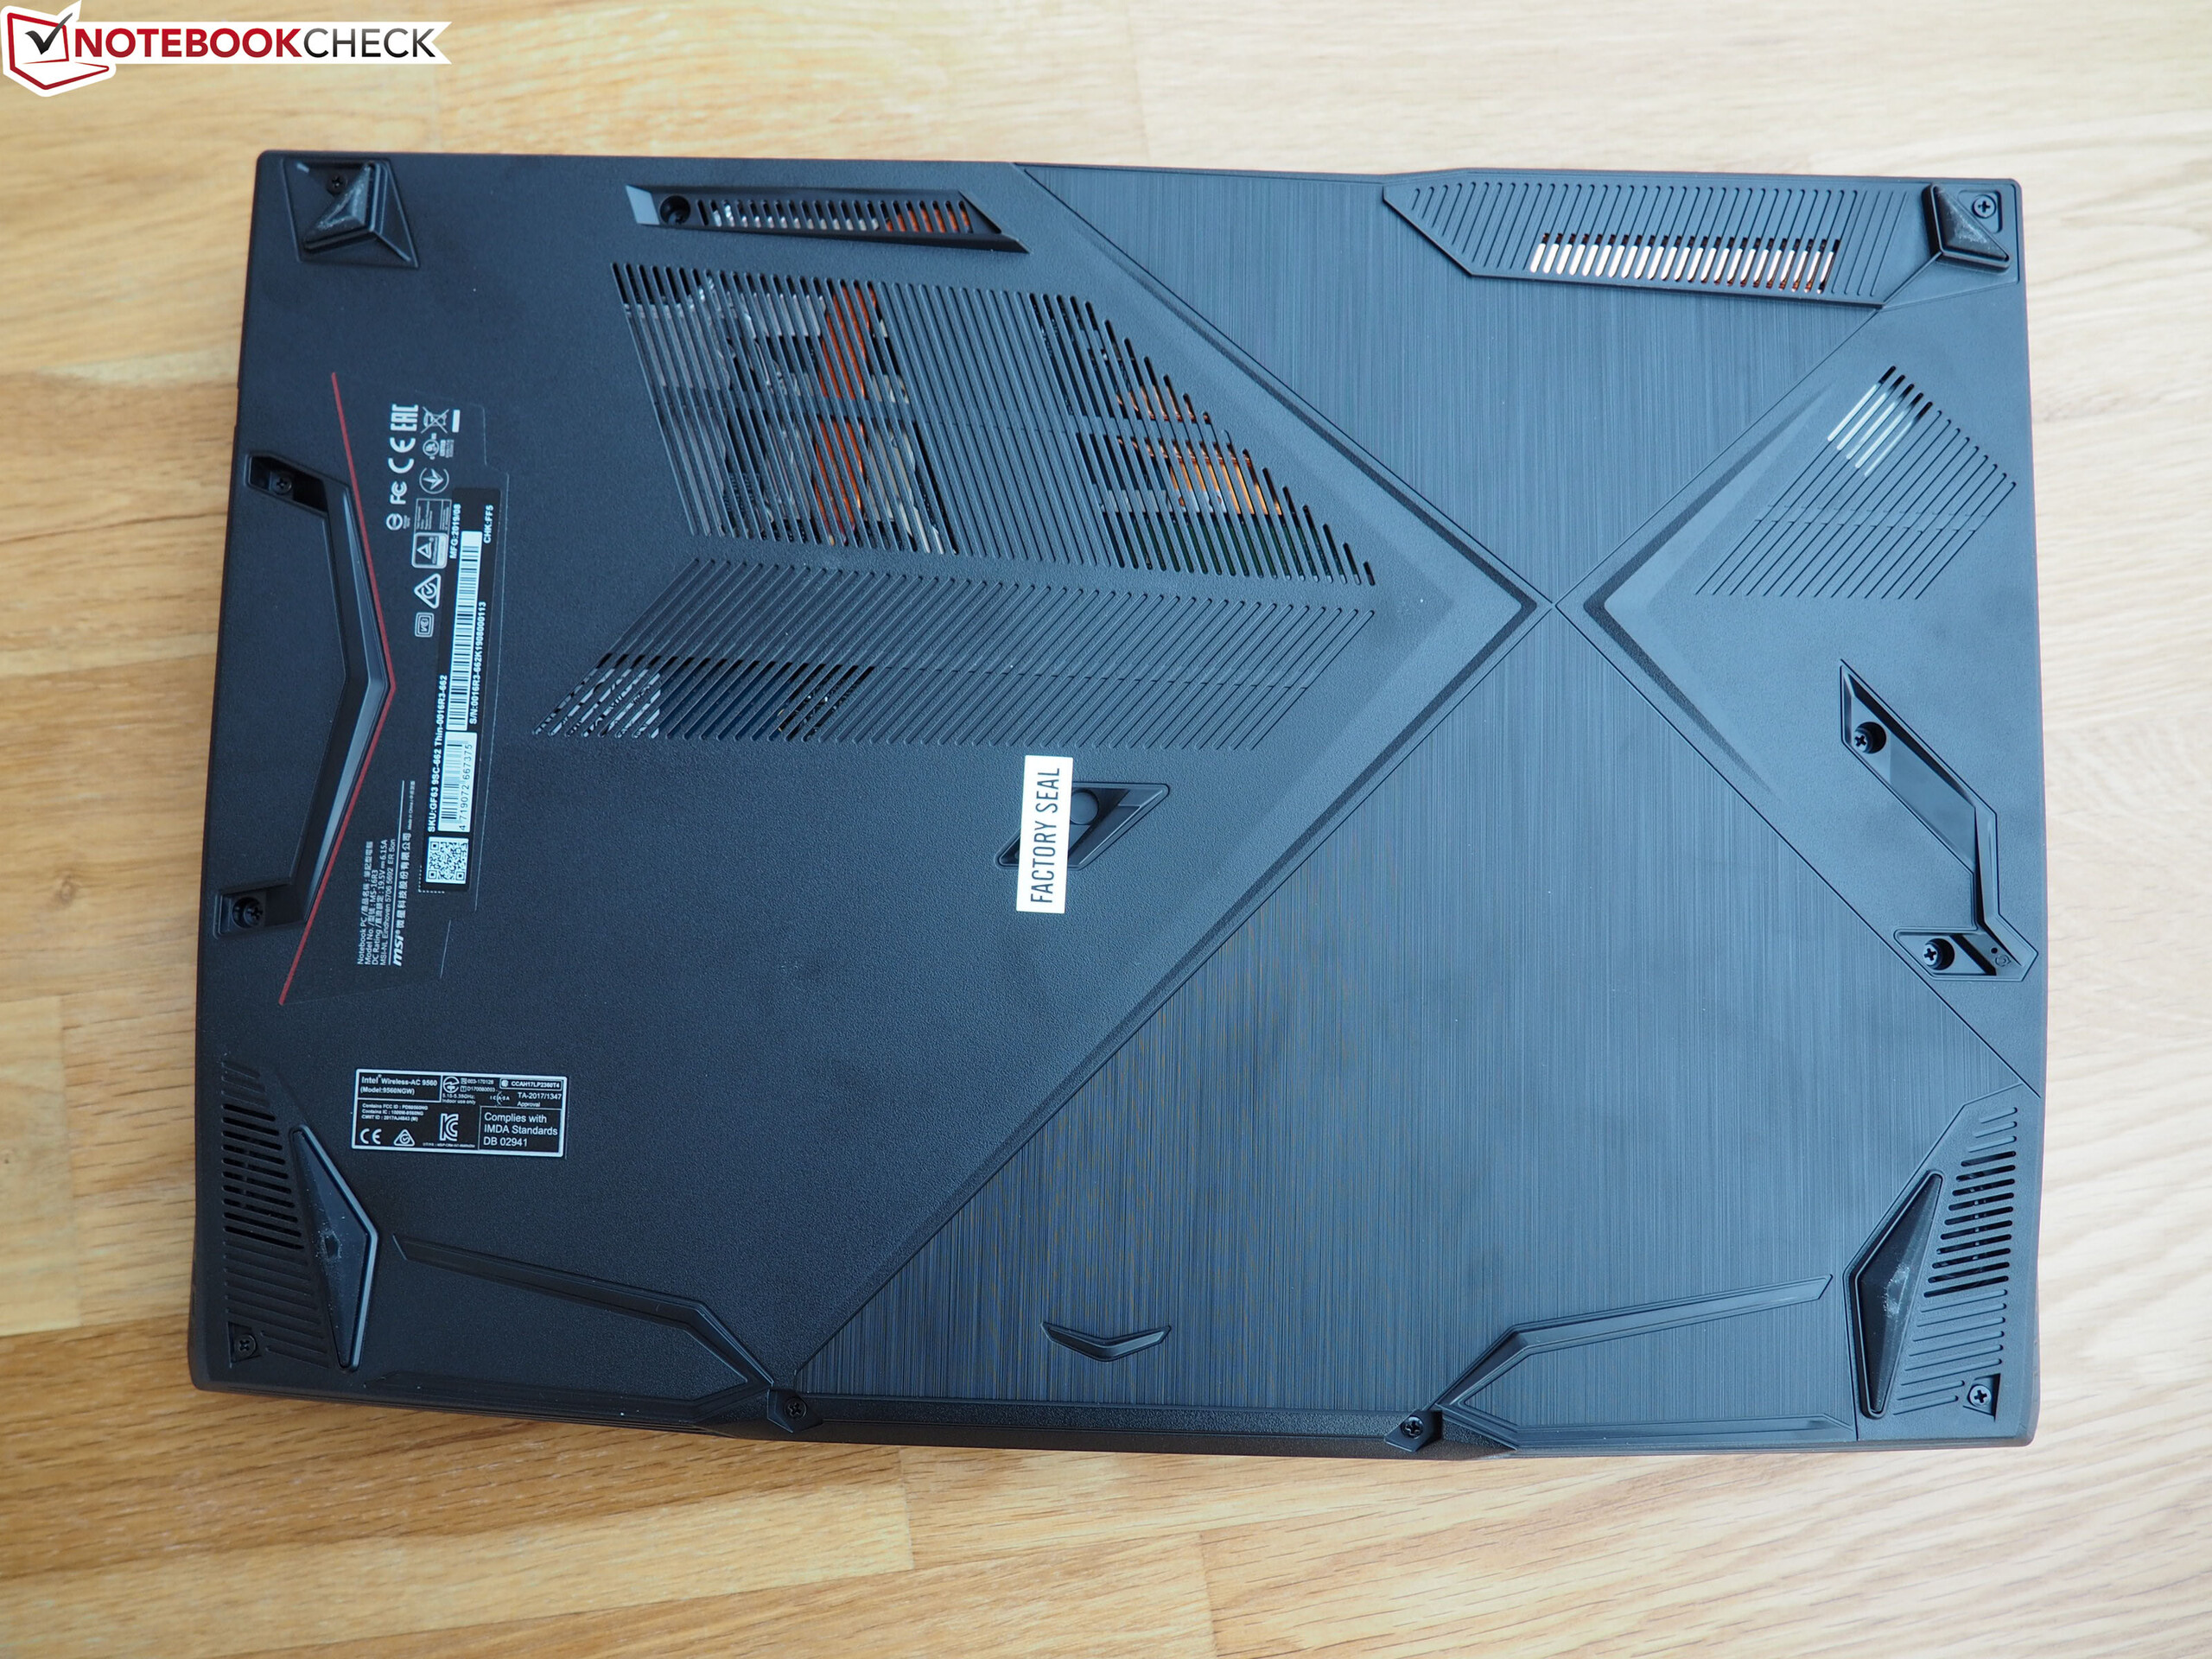
Als je de zwakke poortselectie (geen kaartlezer, geen DisplayPort, geen Thunderbolt 3 of USB 3.1 Gen2), het vervelende gedrag van de ventilator (idle-modus!) en het relatief donkere en trage scherm buiten beschouwing laat, vertoont de GF36 Thin 9SC geen grote zwaktes.
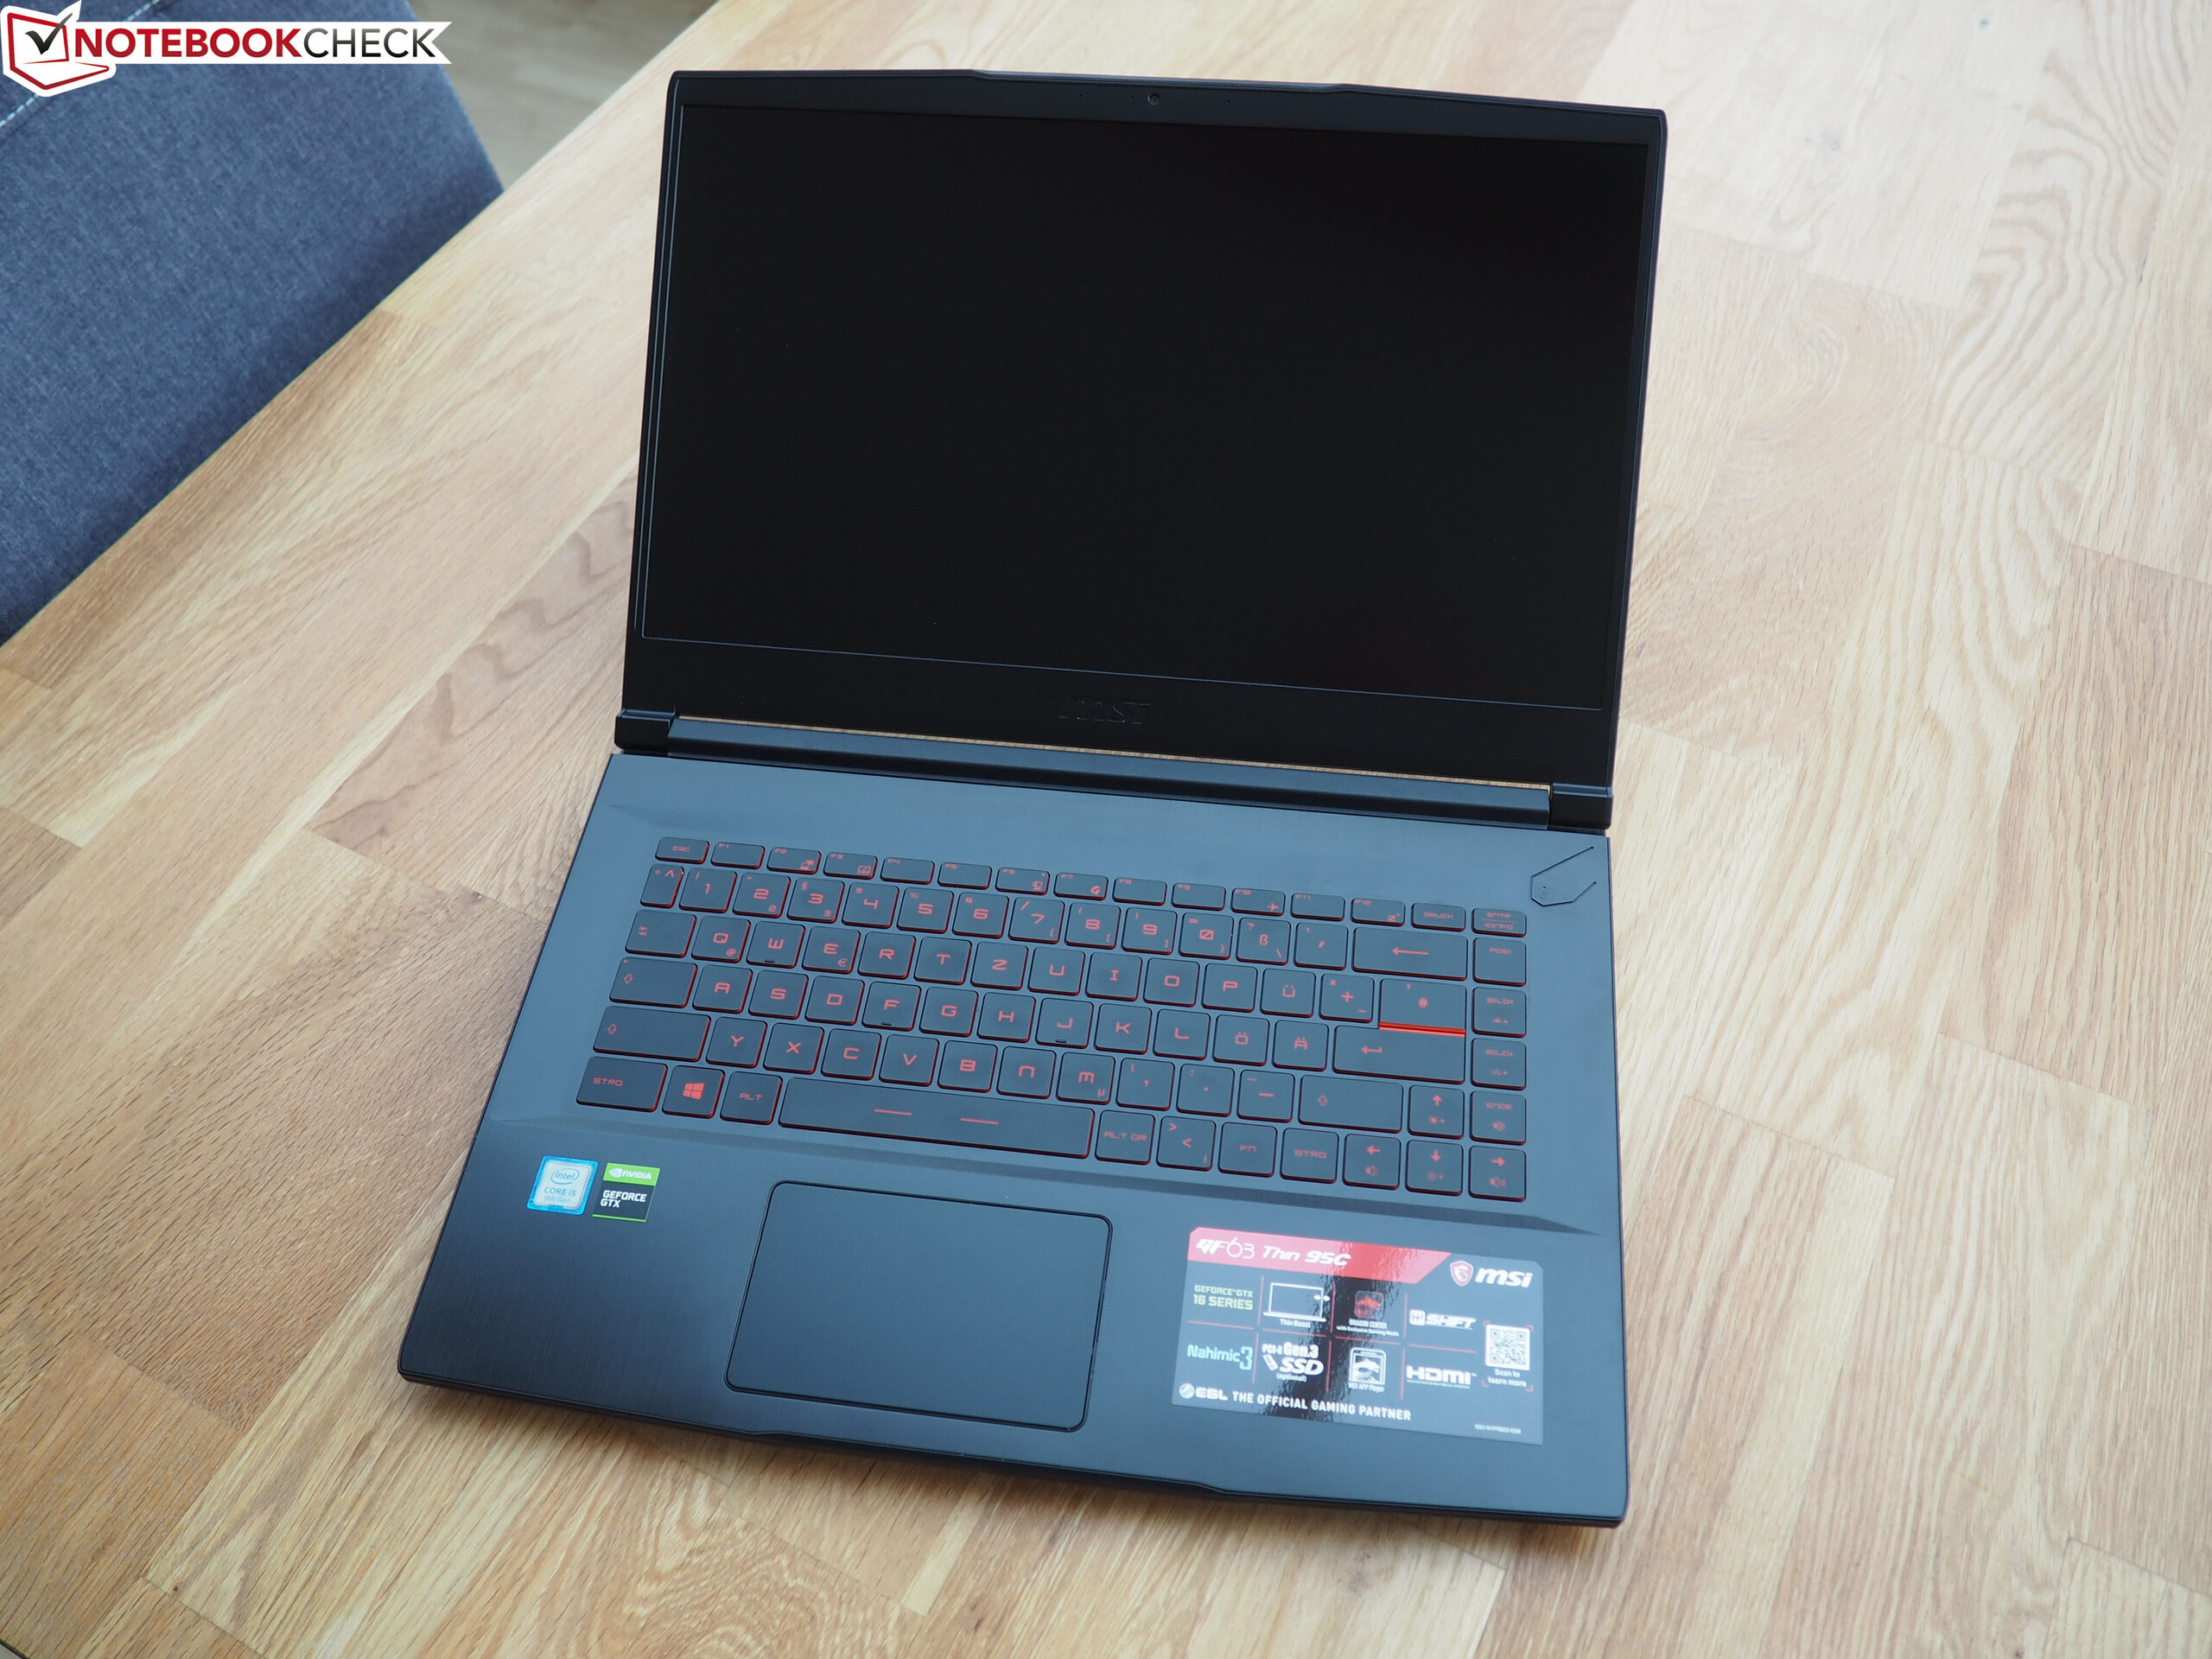
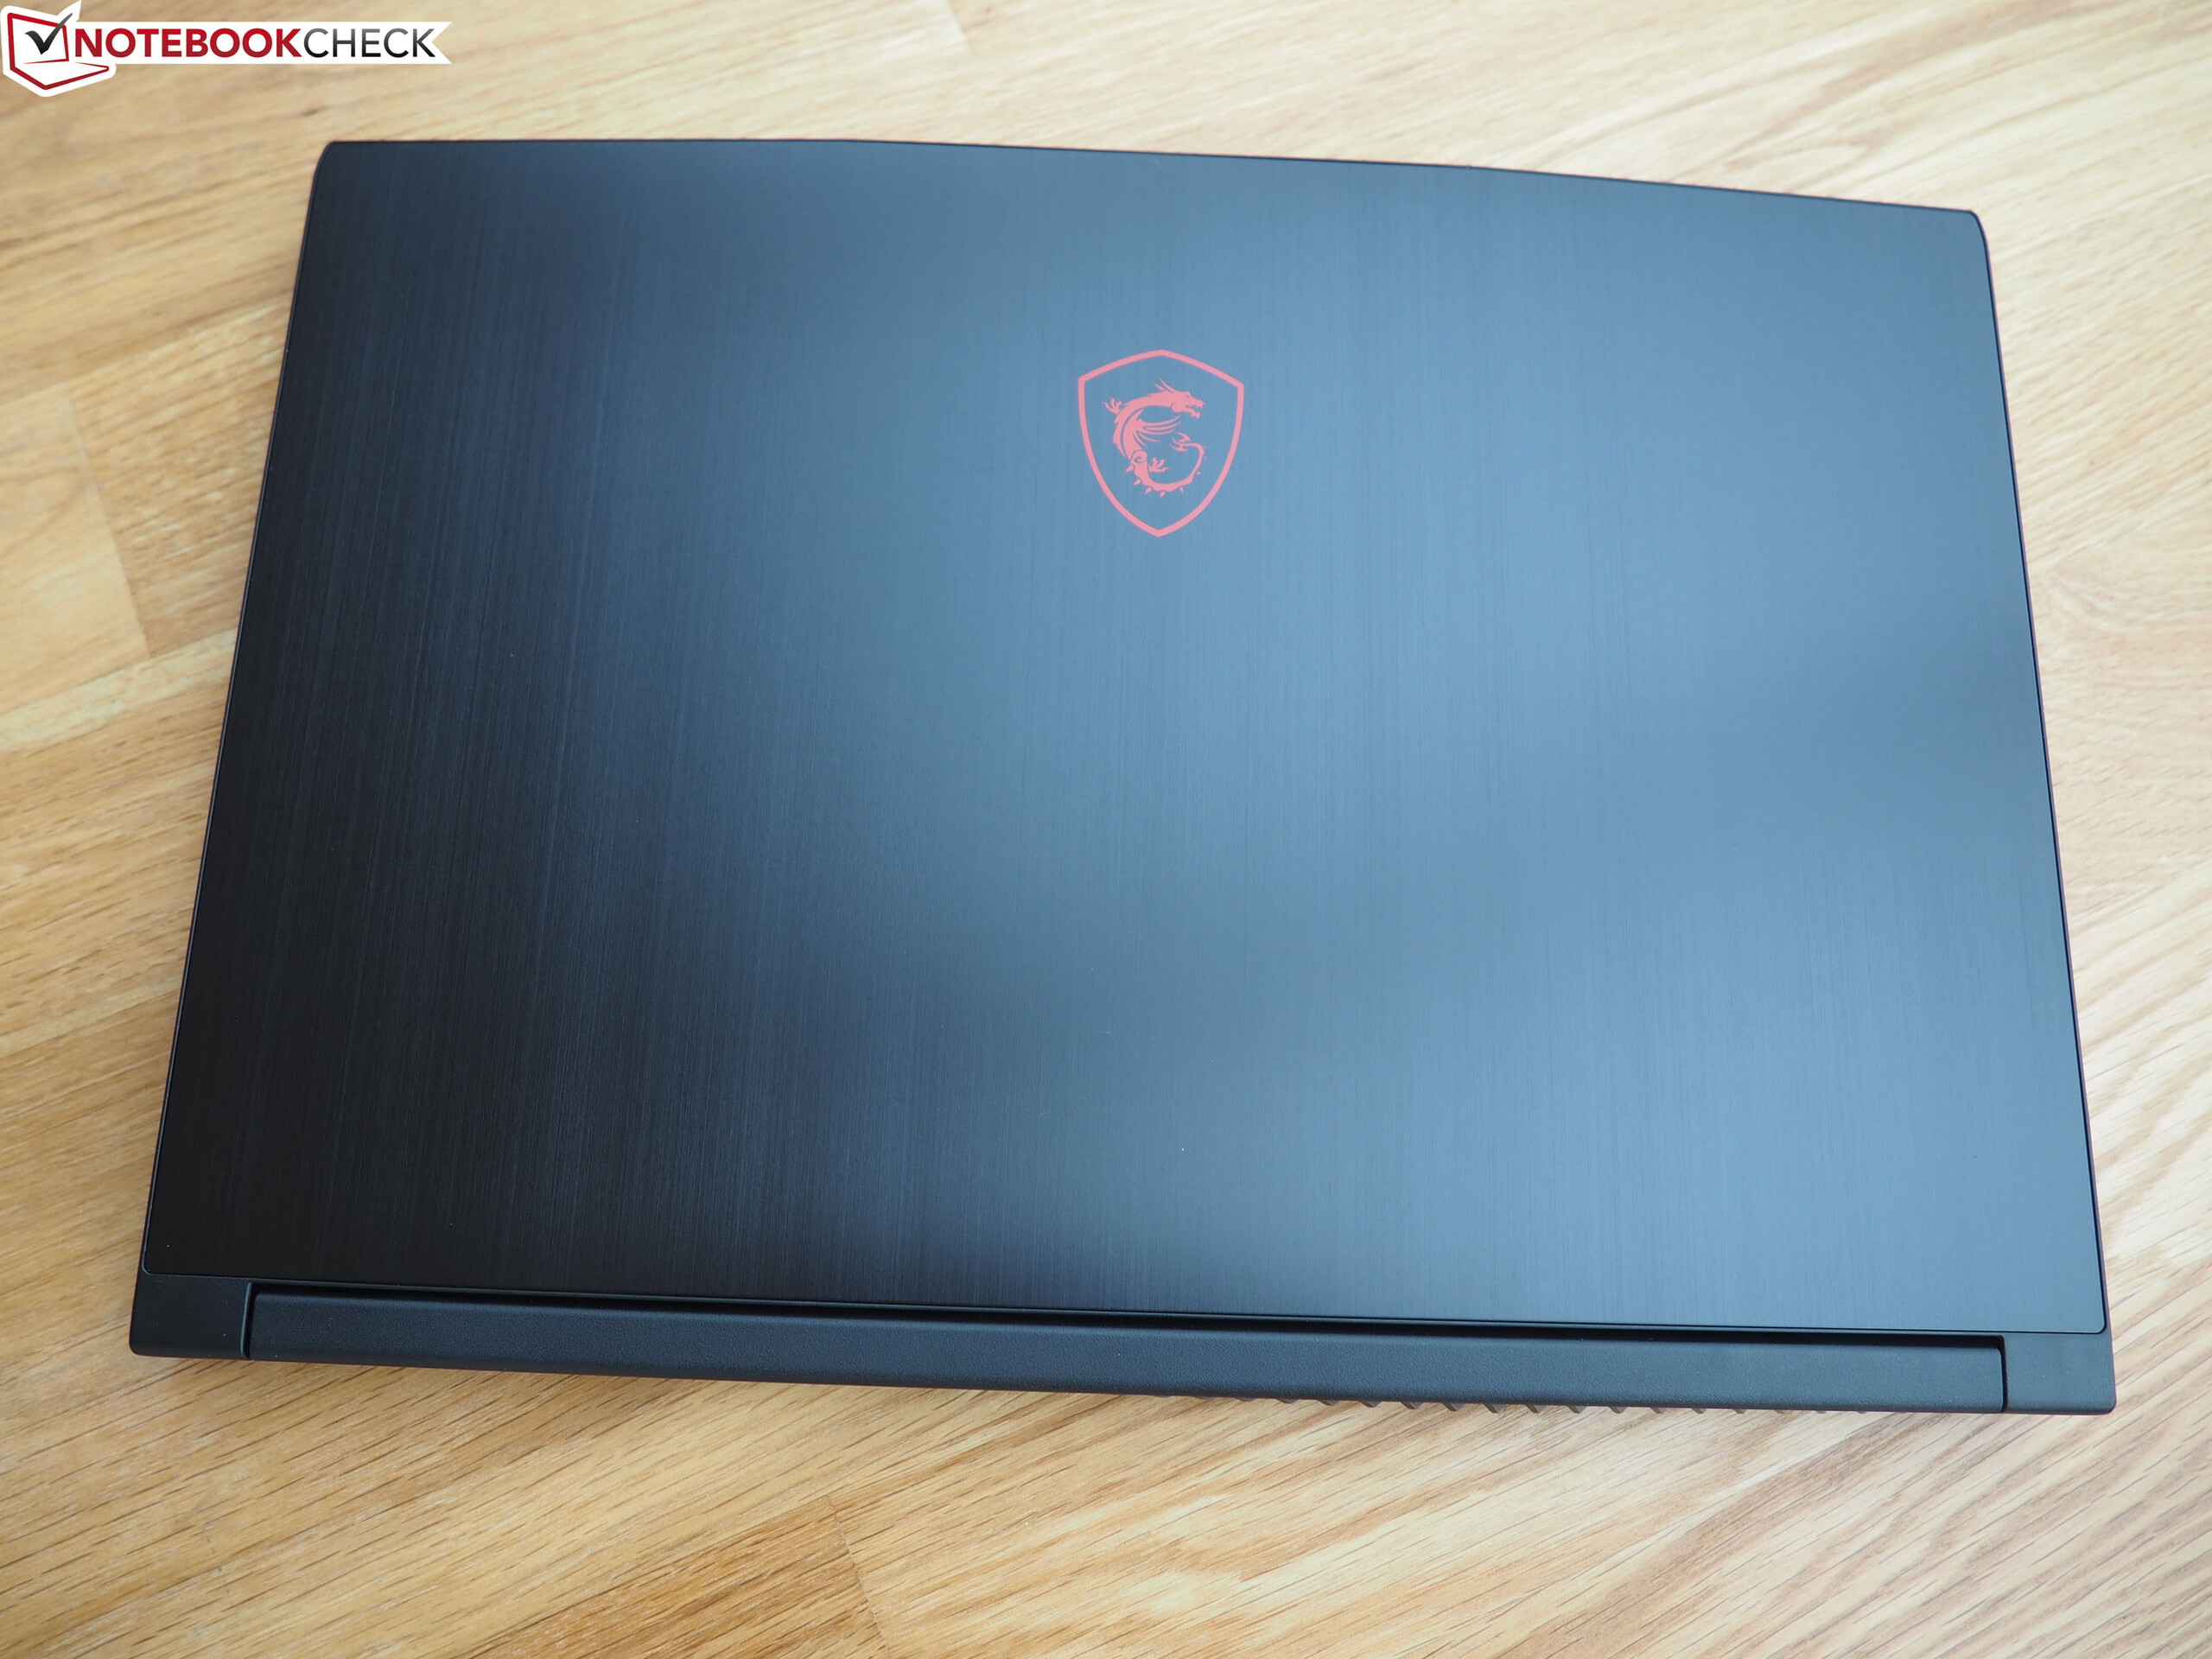
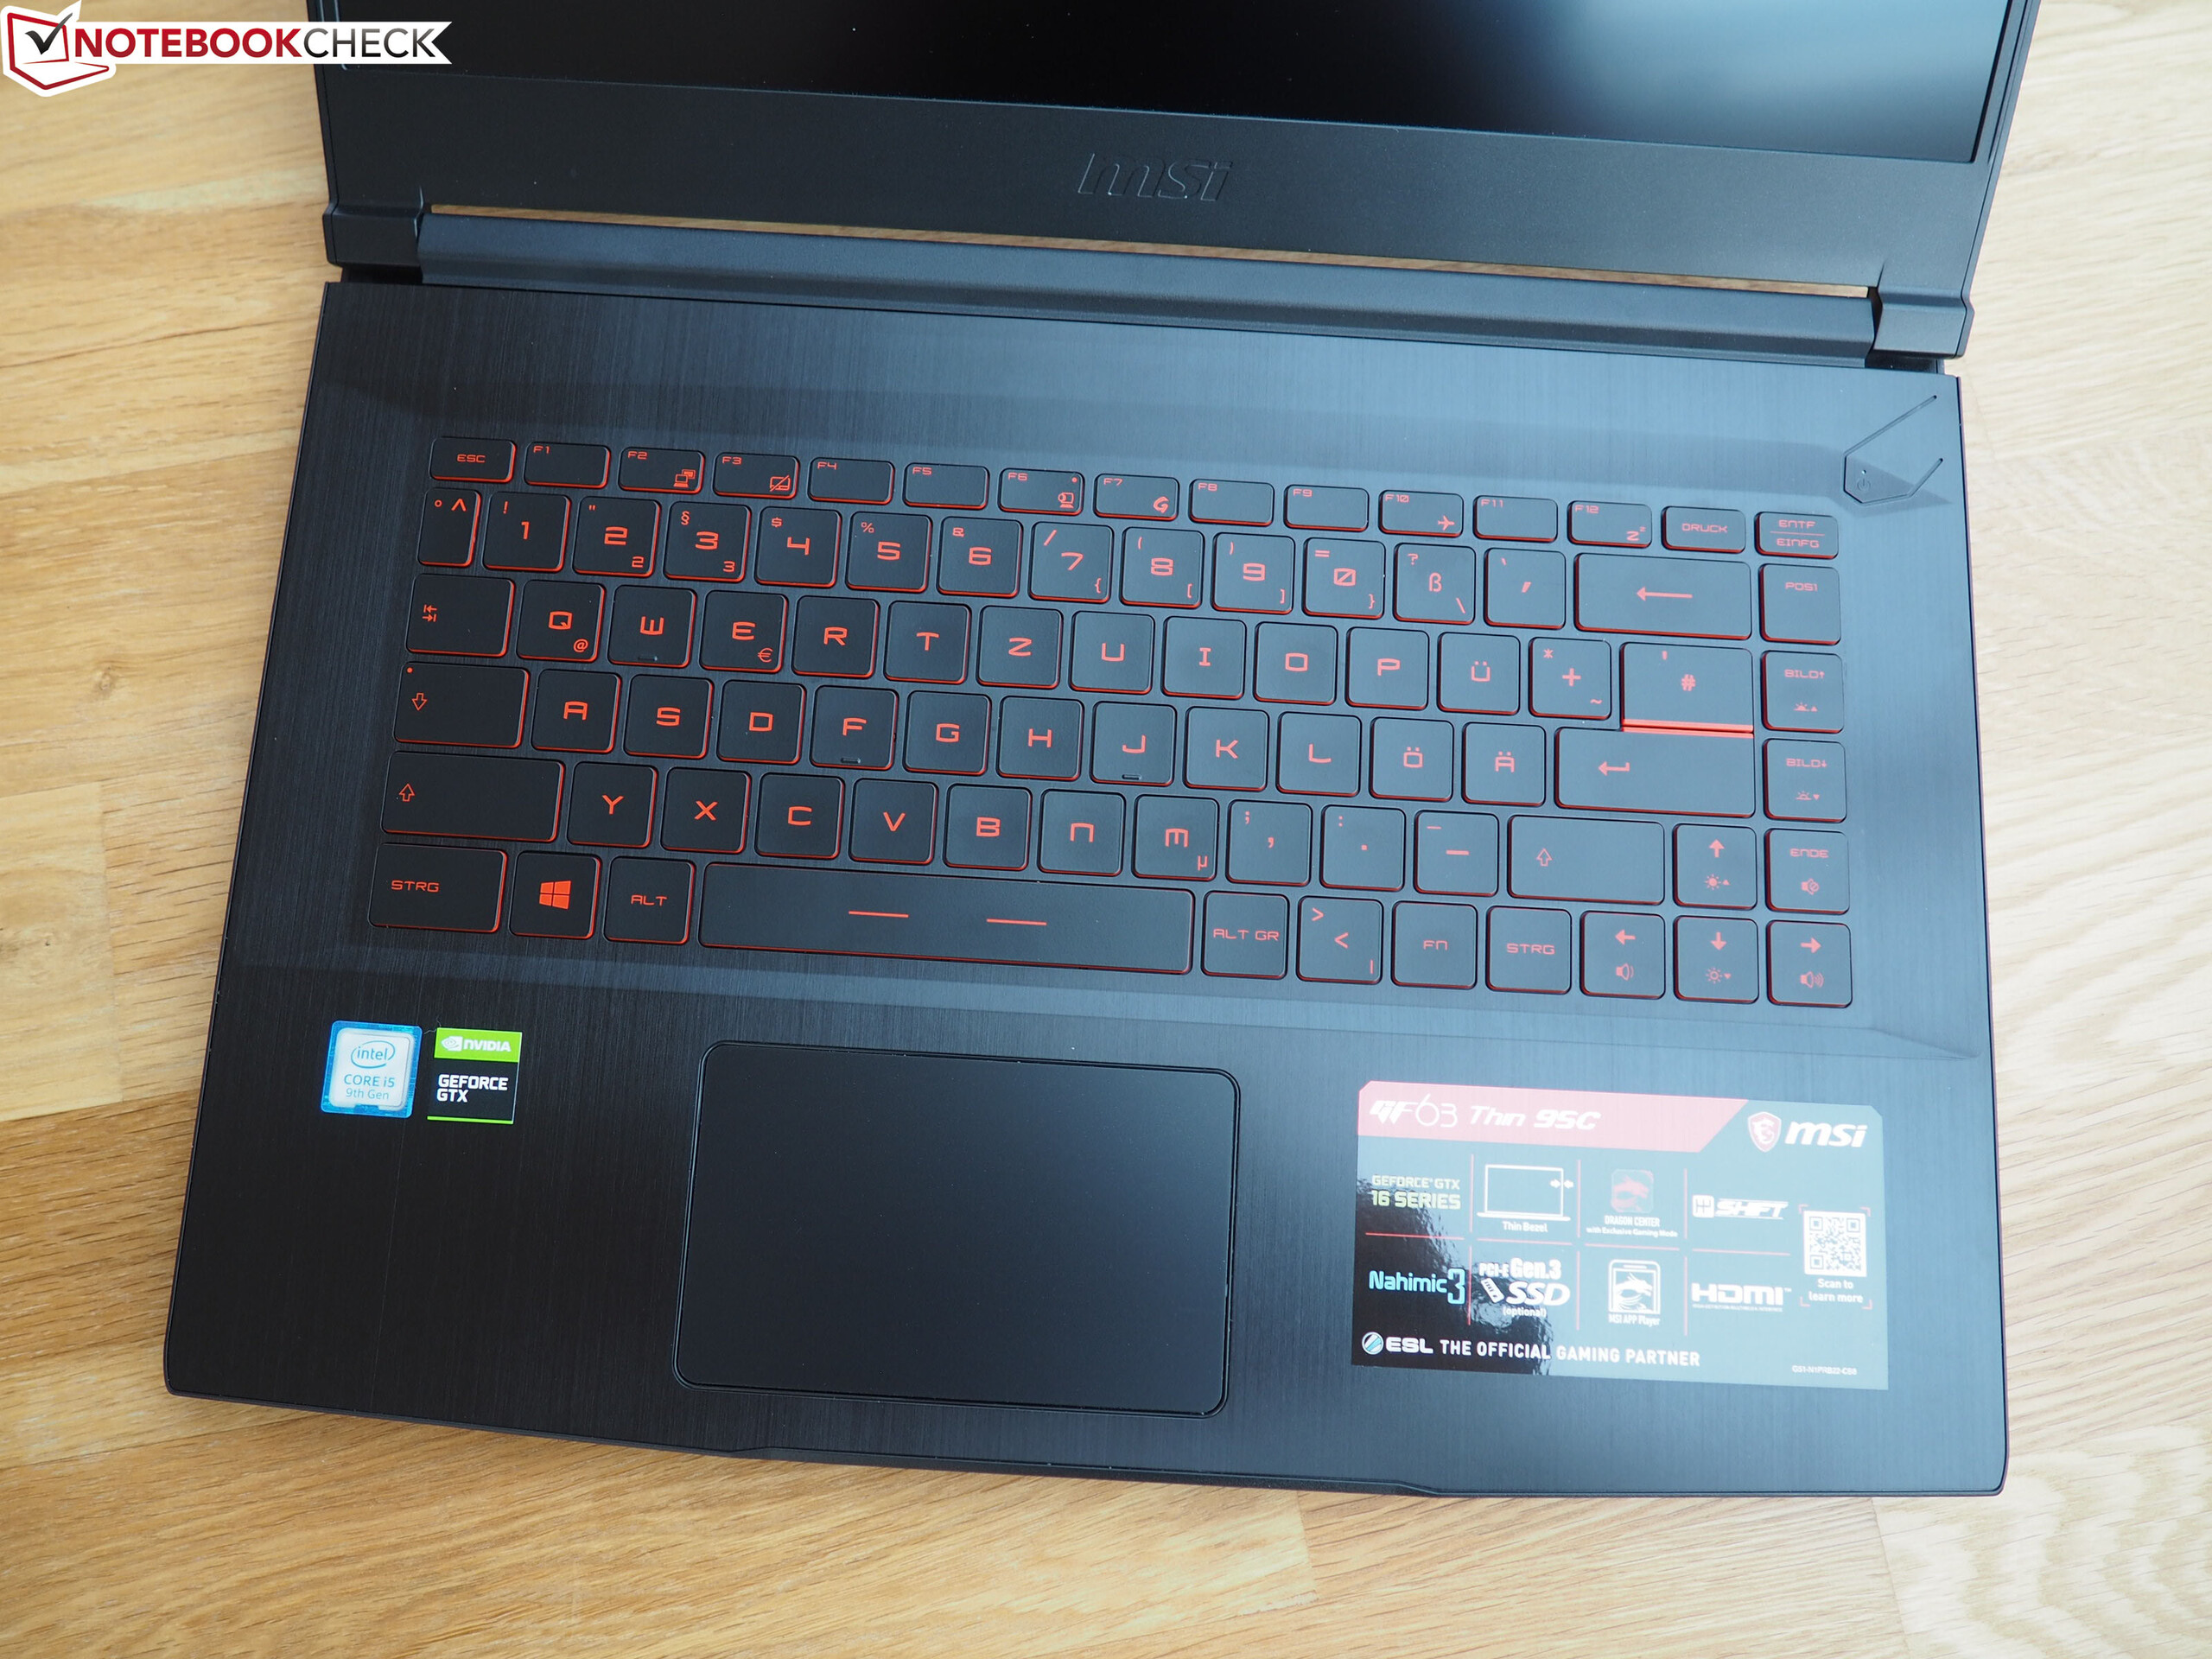
De 15-inch-gamer is compact, heeft een laag gewicht en biedt een uitstekende prijs/prestaties-verhouding, wat aantrekkelijk is voor gamers die op zoek zijn naar een gaming-notebook die zowel mobiel als betaalbaar is. Invoerapparatuur, batterijduur, bouwkwaliteit en prestaties zijn stuk voor stuk degelijk voor deze prijsklasse.
Dit is echter een erg competitief marktsegment en er zijn veel vergelijkbare of zelfs betere alternatieven van andere fabrikanten (bv. Dell, Acer, HP en Lenovo).
MSI GF63 Thin 9SC
- 14-05-2020 v7 (old)
Florian Glaser
Price comparison