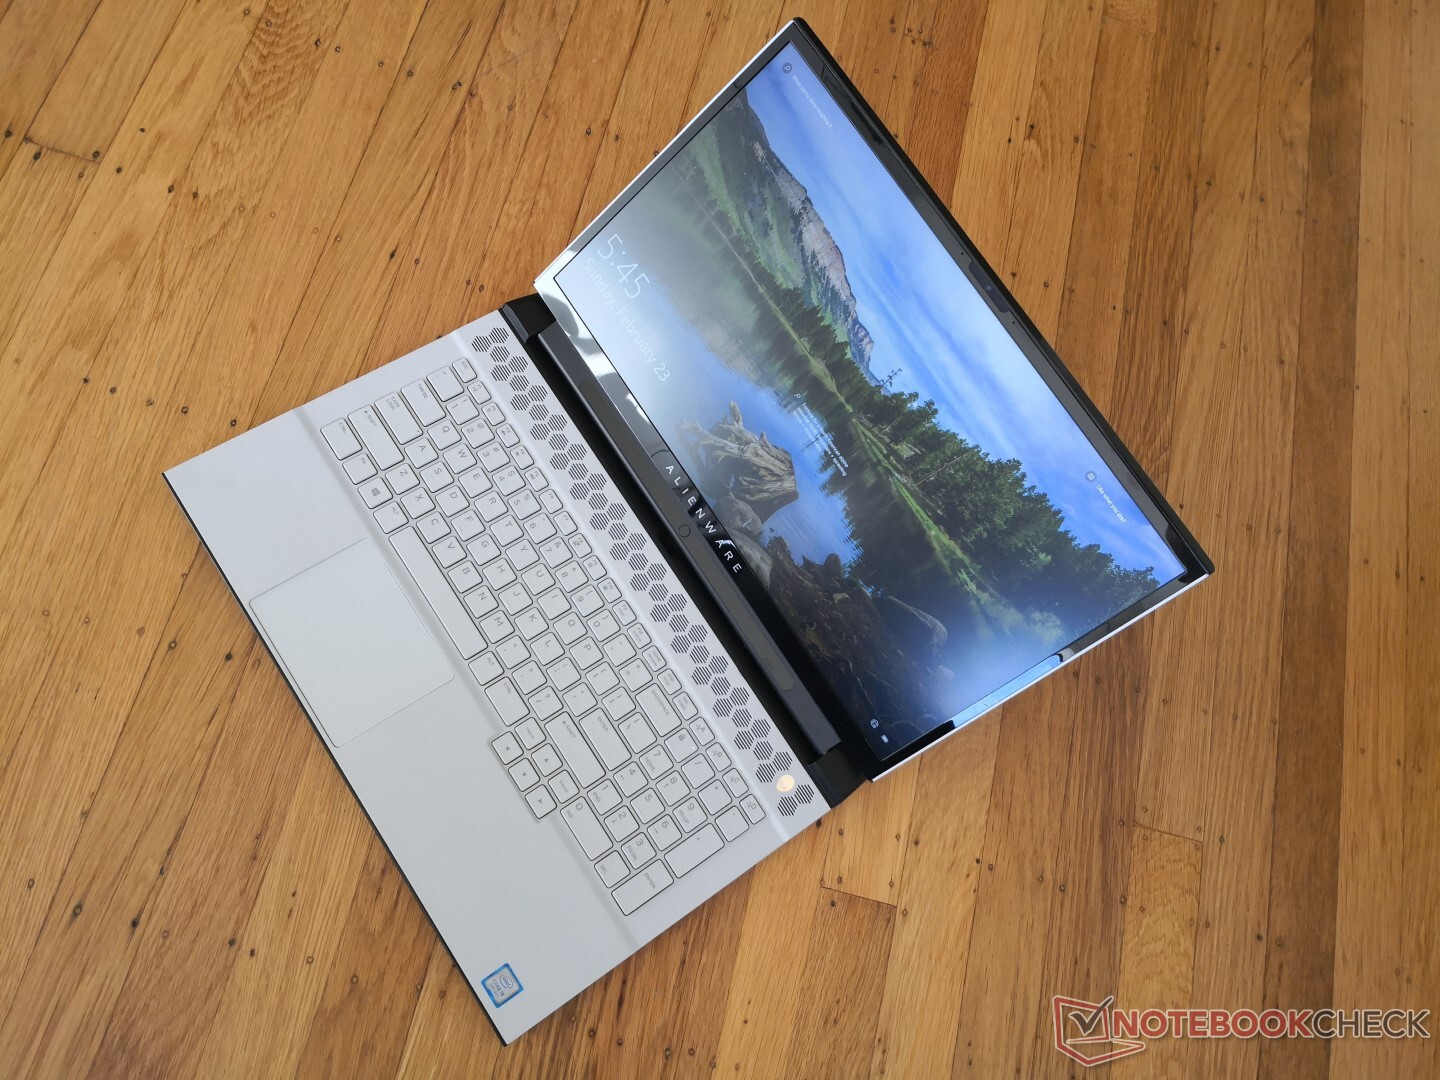
Kort testrapport Dell Alienware m17 R2 Laptop: maakt Core i9 de moeite waard
Evaluatie | Datum | Model | Gewicht | Hoogte | Formaat | Resolutie | Beste prijs |
|---|---|---|---|---|---|---|---|
| 84.2 % v7 (old) | 02-2020 | Alienware m17 R2 P41E i9-9980HK, GeForce RTX 2080 Max-Q | 2.6 kg | 20.5 mm | 17.30" | 1920x1080 | |
| 82.9 % v7 (old) | 06-2019 | MSI GS75 Stealth 9SG i7-9750H, GeForce RTX 2080 Max-Q | 2.3 kg | 18.9 mm | 17.30" | 1920x1080 | |
| 87.7 % v7 (old) | 06-2019 | Razer Blade Pro 17 RTX 2080 Max-Q i7-9750H, GeForce RTX 2080 Max-Q | 2.8 kg | 19.9 mm | 17.30" | 1920x1080 | |
| 86.1 % v7 (old) | 09-2019 | Gigabyte Aero 17 XA RP77 i9-9980HK, GeForce RTX 2070 Max-Q | 2.5 kg | 21.4 mm | 17.30" | 3840x2160 | |
| 85.6 % v6 (old) | 02-2019 | Asus ROG Strix Scar II GL704GW i7-8750H, GeForce RTX 2070 Mobile | 2.9 kg | 26.4 mm | 17.30" | 1920x1080 |
| Networking | |
| iperf3 transmit AX12 | |
| Acer Aspire 5 A514-52 | |
| Alienware m17 R2 P41E | |
| iperf3 receive AX12 | |
| Acer Aspire 5 A514-52 | |
| Alienware m17 R2 P41E | |

| |||||||||||||||||||||||||
Helderheidsverdeling: 90 %
Contrast: 1325:1 (Zwart: 0.29 cd/m²)
ΔE ColorChecker Calman: 1.35 | ∀{0.5-29.43 Ø4.71}
calibrated: 1.42
ΔE Greyscale Calman: 1.2 | ∀{0.09-98 Ø4.96}
98.5% sRGB (Argyll 1.6.3 3D)
65.5% AdobeRGB 1998 (Argyll 1.6.3 3D)
72.2% AdobeRGB 1998 (Argyll 3D)
98.5% sRGB (Argyll 3D)
70.8% Display P3 (Argyll 3D)
Gamma: 2.23
CCT: 6580 K
| Alienware m17 R2 P41E Chi Mei 173HCE, CMN175F, IPS, 17.3", 1920x1080 | Alienware m17 P37E AU Optronics B173ZAN01.0, IPS, 17.3", 3840x2160 | MSI GS75 Stealth 9SG Chi Mei N173HCE-G33 (CMN175C), IPS, 17.3", 1920x1080 | Razer Blade Pro 17 RTX 2080 Max-Q AU Optronics B173HAN04.0, IPS, 17.3", 1920x1080 | Gigabyte Aero 17 XA RP77 AU Optronics B173ZAN03.2, IPS, 17.3", 3840x2160 | Asus ROG Strix Scar II GL704GW B173HAN04.0 (AUO409D), AHVA, 17.3", 1920x1080 | |
|---|---|---|---|---|---|---|
| Display | 20% | -9% | -13% | 21% | -12% | |
| Display P3 Coverage (%) | 70.8 | 86.4 22% | 62.6 -12% | 60.6 -14% | 86.8 23% | 62.9 -11% |
| sRGB Coverage (%) | 98.5 | 99.9 1% | 93.5 -5% | 89 -10% | 100 2% | 87.1 -12% |
| AdobeRGB 1998 Coverage (%) | 72.2 | 99.1 37% | 64.7 -10% | 62.1 -14% | 99.5 38% | 63.7 -12% |
| Response Times | -133% | 33% | 36% | -173% | -3% | |
| Response Time Grey 50% / Grey 80% * (ms) | 17.2 ? | 35.6 ? -107% | 7.2 ? 58% | 6.8 ? 60% | 45.6 ? -165% | 17.6 ? -2% |
| Response Time Black / White * (ms) | 10.8 ? | 28 ? -159% | 10 ? 7% | 9.6 ? 11% | 30.4 ? -181% | 11.2 ? -4% |
| PWM Frequency (Hz) | 26320 ? | 25510 ? | ||||
| Screen | -110% | -4% | -46% | -24% | -40% | |
| Brightness middle (cd/m²) | 384.2 | 357.9 -7% | 366 -5% | 299.3 -22% | 667.3 74% | 295 -23% |
| Brightness (cd/m²) | 357 | 347 -3% | 343 -4% | 294 -18% | 633 77% | 291 -18% |
| Brightness Distribution (%) | 90 | 94 4% | 91 1% | 94 4% | 90 0% | 96 7% |
| Black Level * (cd/m²) | 0.29 | 0.33 -14% | 0.29 -0% | 0.29 -0% | 0.46 -59% | 0.24 17% |
| Contrast (:1) | 1325 | 1085 -18% | 1262 -5% | 1032 -22% | 1451 10% | 1229 -7% |
| Colorchecker dE 2000 * | 1.35 | 6.57 -387% | 1.51 -12% | 2.55 -89% | 3.53 -161% | 3.2 -137% |
| Colorchecker dE 2000 max. * | 3.45 | 9.86 -186% | 3.22 7% | 4.73 -37% | 6.88 -99% | 6.64 -92% |
| Colorchecker dE 2000 calibrated * | 1.42 | 6.74 -375% | 0.71 50% | 2.9 -104% | 3.79 -167% | 2.52 -77% |
| Greyscale dE 2000 * | 1.2 | 4.3 -258% | 1.93 -61% | 3.5 -192% | 0.9 25% | 2.16 -80% |
| Gamma | 2.23 99% | 2.6 85% | 2.38 92% | 2.28 96% | 2.17 101% | 2.46 89% |
| CCT | 6580 99% | 6403 102% | 6881 94% | 7101 92% | 6533 99% | 6872 95% |
| Color Space (Percent of AdobeRGB 1998) (%) | 65.5 | 88.4 35% | 60 -8% | 57 -13% | 87.1 33% | 57 -13% |
| Color Space (Percent of sRGB) (%) | 98.5 | 100 2% | 94 -5% | 88.7 -10% | 100 2% | 87 -12% |
| Totaal Gemiddelde (Programma / Instellingen) | -74% /
-88% | 7% /
-0% | -8% /
-29% | -59% /
-34% | -18% /
-30% |
* ... kleiner is beter
Responstijd Scherm
| ↔ Responstijd Zwart naar Wit | ||
|---|---|---|
| 10.8 ms ... stijging ↗ en daling ↘ gecombineerd | ↗ 6 ms stijging | 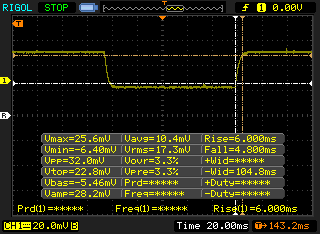 |
| ↘ 4.8 ms daling | ||
| Het scherm vertoonde prima responstijden in onze tests maar is misschien wat te traag voor competitieve games. Ter vergelijking: alle testtoestellen variëren van 0.1 (minimum) tot 240 (maximum) ms. » 29 % van alle toestellen zijn beter. Dit betekent dat de gemeten responstijd beter is dan het gemiddelde (19.8 ms) van alle geteste toestellen. | ||
| ↔ Responstijd 50% Grijs naar 80% Grijs | ||
| 17.2 ms ... stijging ↗ en daling ↘ gecombineerd | ↗ 8.8 ms stijging | 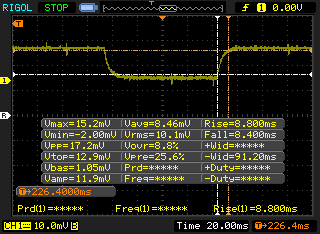 |
| ↘ 8.4 ms daling | ||
| Het scherm vertoonde prima responstijden in onze tests maar is misschien wat te traag voor competitieve games. Ter vergelijking: alle testtoestellen variëren van 0.165 (minimum) tot 636 (maximum) ms. » 31 % van alle toestellen zijn beter. Dit betekent dat de gemeten responstijd beter is dan het gemiddelde (30.9 ms) van alle geteste toestellen. | ||
Screen Flickering / PWM (Pulse-Width Modulation)
| Screen flickering / PWM waargenomen | 26320 Hz | ≤ 25 % helderheid instelling | 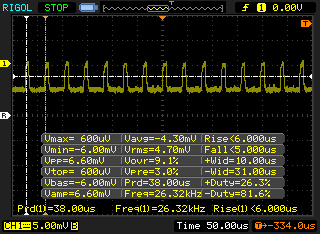 |
De achtergrondverlichting van het scherm flikkert op 26320 Hz (in het slechtste geval, bijvoorbeeld bij gebruik van PWM) aan een helderheid van 25 % en lager. Boven deze helderheid zou er geen flickering / PWM mogen optreden. De frequentie van 26320 Hz is redelijk hoog en de meeste mensen die gevoelig zijn aan flickering zouden dit dus niet mogen waarnemen of geïrriteerde ogen krijgen. Ter vergelijking: 52 % van alle geteste toestellen maakten geen gebruik van PWM om de schermhelderheid te verlagen. Als het wel werd gebruikt, werd een gemiddelde van 7744 (minimum: 5 - maximum: 343500) Hz waargenomen. | |||
| Cinebench R11.5 | |
| CPU Single 64Bit | |
| Eurocom Sky X4C i9-9900KS | |
| Gemiddeld Intel Core i9-9980HK (2.25 - 2.4, n=3) | |
| CPU Multi 64Bit | |
| Eurocom Sky X4C i9-9900KS | |
| Gemiddeld Intel Core i9-9980HK (14.8 - 18, n=3) | |
| Cinebench R10 | |
| Rendering Multiple CPUs 32Bit | |
| Eurocom Sky X4C i9-9900KS | |
| Gemiddeld Intel Core i9-9980HK (39440 - 50439, n=4) | |
| Medion Erazer X15805 | |
| MSI Alpha 15 A3DDK-034 | |
| Rendering Single 32Bit | |
| Gemiddeld Intel Core i9-9980HK (7709 - 9734, n=4) | |
| Eurocom Sky X4C i9-9900KS | |
| Medion Erazer X15805 | |
| MSI Alpha 15 A3DDK-034 | |
| wPrime 2.10 - 1024m | |
| Gemiddeld Intel Core i9-9980HK (110.4 - 120.2, n=2) | |
| Eurocom Sky X4C i9-9900KS | |
* ... kleiner is beter
| PCMark 8 Home Score Accelerated v2 | 4384 punten | |
| PCMark 8 Work Score Accelerated v2 | 5818 punten | |
| PCMark 10 Score | 5502 punten | |
Help | ||
| Alienware m17 R2 P41E 2x SK Hynix PC601 NVMe 512 GB (RAID 0) | Alienware m17 P37E SK Hynix PC401 512GB M.2 (HFS512GD9TNG) | MSI GS75 Stealth 9SG 2x Samsung SSD PM981 MZVLB1T0HALR (RAID 0) | Gigabyte Aero 17 XA RP77 Intel SSD 760p SSDPEKKW512G8 | Asus ROG Strix Scar II GL704GW Intel SSD 660p SSDPEKNW512G8 | Lenovo ThinkBook 15 Samsung SSD PM981 MZVLB512HAJQ | |
|---|---|---|---|---|---|---|
| AS SSD | -23% | 13% | -34% | -26% | 28% | |
| Seq Read (MB/s) | 1938 | 1835 -5% | 2855 47% | 1812 -7% | 1315 -32% | 2564 32% |
| Seq Write (MB/s) | 2094 | 1121 -46% | 2687 28% | 1512 -28% | 927 -56% | 2268 8% |
| 4K Read (MB/s) | 25.88 | 23.98 -7% | 30.31 17% | 32.68 26% | 52.4 102% | 57 120% |
| 4K Write (MB/s) | 100.8 | 100 -1% | 96.3 -4% | 107.7 7% | 122.8 22% | 141.4 40% |
| 4K-64 Read (MB/s) | 1217 | 687 -44% | 1460 20% | 504 -59% | 326.5 -73% | 1175 -3% |
| 4K-64 Write (MB/s) | 1137 | 776 -32% | 1224 8% | 534 -53% | 727 -36% | 1665 46% |
| Access Time Read * (ms) | 0.051 | 0.047 8% | 0.054 -6% | 0.05 2% | 0.11 -116% | 0.032 37% |
| Access Time Write * (ms) | 0.107 | 0.053 50% | 0.038 64% | 0.227 -112% | 0.045 58% | 0.025 77% |
| Score Read (Points) | 1437 | 895 -38% | 1776 24% | 718 -50% | 510 -65% | 1488 4% |
| Score Write (Points) | 1447 | 988 -32% | 1589 10% | 793 -45% | 942 -35% | 2033 40% |
| Score Total (Points) | 3624 | 2306 -36% | 4259 18% | 1871 -48% | 1715 -53% | 4279 18% |
| Copy ISO MB/s (MB/s) | 1926 | 773 -60% | 2226 16% | 946 -51% | 2118 10% | |
| Copy Program MB/s (MB/s) | 626 | 493 -21% | 426.4 -32% | 414.3 -34% | 495.6 -21% | |
| Copy Game MB/s (MB/s) | 1533 | 647 -58% | 1152 -25% | 1263 -18% | 1174 -23% | |
| CrystalDiskMark 5.2 / 6 | -18% | 6% | 2% | -33% | 6% | |
| Write 4K (MB/s) | 110.6 | 120.2 9% | 95.5 -14% | 169.6 53% | 99.6 -10% | 176.3 59% |
| Read 4K (MB/s) | 41.46 | 44.3 7% | 42.59 3% | 58 40% | 48.99 18% | 48.98 18% |
| Write Seq (MB/s) | 2378 | 1278 -46% | 2851 20% | 1516 -36% | 972 -59% | 1789 -25% |
| Read Seq (MB/s) | 2114 | 1389 -34% | 2696 28% | 2362 12% | 1515 -28% | 1671 -21% |
| Write 4K Q32T1 (MB/s) | 445.4 | 436.2 -2% | 402.6 -10% | 481.8 8% | 280.6 -37% | 433.5 -3% |
| Read 4K Q32T1 (MB/s) | 509 | 515 1% | 443.9 -13% | 506 -1% | 327.8 -36% | 526 3% |
| Write Seq Q32T1 (MB/s) | 2735 | 1157 -58% | 3420 25% | 1530 -44% | 970 -65% | 2983 9% |
| Read Seq Q32T1 (MB/s) | 3206 | 2671 -17% | 3514 10% | 2645 -17% | 1757 -45% | 3555 11% |
| Write 4K Q8T8 (MB/s) | 1688 | |||||
| Read 4K Q8T8 (MB/s) | 1036 | |||||
| Totaal Gemiddelde (Programma / Instellingen) | -21% /
-21% | 10% /
11% | -16% /
-21% | -30% /
-29% | 17% /
20% |
* ... kleiner is beter

| 3DMark | |
| 1280x720 Cloud Gate Standard Graphics | |
| MSI RTX 2080 Ti Gaming X Trio | |
| MSI GE65 Raider 9SF-049US | |
| Alienware m17 R2 P41E | |
| Walmart EVOO Gaming 17 | |
| Alienware 17 R5 | |
| Gemiddeld NVIDIA GeForce RTX 2080 Max-Q (38256 - 129506, n=17) | |
| Dell G5 15 5590-P8RVW | |
| Maingear Vector 15 | |
| HP Omen X 17-ap0xx | |
| MSI GE63 Raider 8SG | |
| MSI GT72S-6QEG16SR421BW | |
| 1920x1080 Fire Strike Graphics | |
| MSI RTX 2080 Ti Gaming X Trio | |
| MSI GE63 Raider 8SG | |
| Alienware m17 R2 P41E | |
| MSI GE65 Raider 9SF-049US | |
| Gemiddeld NVIDIA GeForce RTX 2080 Max-Q (18048 - 23032, n=19) | |
| HP Omen X 17-ap0xx | |
| Walmart EVOO Gaming 17 | |
| Alienware 17 R5 | |
| Dell G5 15 5590-P8RVW | |
| Maingear Vector 15 | |
| MSI GT72S-6QEG16SR421BW | |
| 2560x1440 Time Spy Graphics | |
| MSI RTX 2080 Ti Gaming X Trio | |
| MSI GE63 Raider 8SG | |
| Alienware m17 R2 P41E | |
| MSI GE65 Raider 9SF-049US | |
| Gemiddeld NVIDIA GeForce RTX 2080 Max-Q (6464 - 8844, n=19) | |
| Walmart EVOO Gaming 17 | |
| HP Omen X 17-ap0xx | |
| Dell G5 15 5590-P8RVW | |
| Alienware 17 R5 | |
| Maingear Vector 15 | |
| MSI GT72S-6QEG16SR421BW | |
| 3DMark 11 | |
| 1280x720 Performance GPU | |
| MSI RTX 2080 Ti Gaming X Trio | |
| MSI GE63 Raider 8SG | |
| Alienware m17 R2 P41E | |
| Gemiddeld NVIDIA GeForce RTX 2080 Max-Q (23386 - 30910, n=20) | |
| HP Omen X 17-ap0xx | |
| MSI GE65 Raider 9SF-049US | |
| Walmart EVOO Gaming 17 | |
| Alienware 17 R5 | |
| Dell G5 15 5590-P8RVW | |
| Maingear Vector 15 | |
| MSI GT72S-6QEG16SR421BW | |
| 1280x720 Performance Combined | |
| MSI RTX 2080 Ti Gaming X Trio | |
| MSI GE65 Raider 9SF-049US | |
| Alienware m17 R2 P41E | |
| Walmart EVOO Gaming 17 | |
| Maingear Vector 15 | |
| Dell G5 15 5590-P8RVW | |
| Gemiddeld NVIDIA GeForce RTX 2080 Max-Q (9212 - 14894, n=20) | |
| Alienware 17 R5 | |
| HP Omen X 17-ap0xx | |
| MSI GT72S-6QEG16SR421BW | |
| MSI GE63 Raider 8SG | |
| 3DMark 11 Performance | 23774 punten | |
| 3DMark Cloud Gate Standard Score | 50705 punten | |
| 3DMark Fire Strike Score | 19583 punten | |
| 3DMark Time Spy Score | 8604 punten | |
Help | ||
| Shadow of the Tomb Raider | |
| 1280x720 Lowest Preset | |
| Corsair One i160 | |
| MSI GE75 9SG | |
| MSI GE65 Raider 9SF-049US | |
| Alienware m17 R2 P41E | |
| Walmart EVOO Gaming 17 | |
| Gemiddeld NVIDIA GeForce RTX 2080 Max-Q (114 - 142, n=5) | |
| HP Omen 15-dc0015ng | |
| HP Omen X 2S 15-dg0075cl | |
| Acer Predator Triton 700 | |
| Razer Blade 15 GTX 1660 Ti | |
| Dell G3 3590 | |
| HP Pavilion Gaming 15-ec0017ng | |
| 1920x1080 Highest Preset AA:T | |
| Corsair One i160 | |
| MSI GE75 9SG | |
| Alienware m17 R2 P41E | |
| MSI GE65 Raider 9SF-049US | |
| Gemiddeld NVIDIA GeForce RTX 2080 Max-Q (71 - 105, n=8) | |
| HP Omen X 2S 15-dg0075cl | |
| Walmart EVOO Gaming 17 | |
| Acer Predator Triton 700 | |
| Razer Blade 15 GTX 1660 Ti | |
| HP Omen 15-dc0015ng | |
| HP Pavilion Gaming 15-ec0017ng | |
| Asus TUF FX705GM | |
| The Witcher 3 - 1920x1080 Ultra Graphics & Postprocessing (HBAO+) | |
| Corsair One i160 | |
| MSI GE75 9SG | |
| Gemiddeld NVIDIA GeForce RTX 2080 Max-Q (65.7 - 92.7, n=22) | |
| MSI GE65 Raider 9SF-049US | |
| Alienware m17 R2 P41E | |
| HP Omen X 2S 15-dg0075cl | |
| Walmart EVOO Gaming 17 | |
| HP Omen 15-dc0015ng | |
| HP Pavilion Gaming 15-ec0017ng | |
| Razer Blade 15 GTX 1660 Ti | |
| Asus TUF FX705GM | |
| Dell G3 3590 | |
| lage | gem. | hoge | ultra | |
|---|---|---|---|---|
| BioShock Infinite (2013) | 396.1 | 337.3 | 321 | 179 |
| The Witcher 3 (2015) | 326.6 | 239.3 | 149.6 | 78 |
| Shadow of the Tomb Raider (2018) | 142 | 110 | 105 | 99 |
| Alienware m17 R2 P41E GeForce RTX 2080 Max-Q, i9-9980HK, 2x SK Hynix PC601 NVMe 512 GB (RAID 0) | Alienware m17 P37E GeForce RTX 2080 Max-Q, i9-8950HK, SK Hynix PC401 512GB M.2 (HFS512GD9TNG) | MSI GS75 Stealth 9SG GeForce RTX 2080 Max-Q, i7-9750H, 2x Samsung SSD PM981 MZVLB1T0HALR (RAID 0) | Razer Blade Pro 17 RTX 2080 Max-Q GeForce RTX 2080 Max-Q, i7-9750H, Samsung SSD PM981 MZVLB512HAJQ | Gigabyte Aero 17 XA RP77 GeForce RTX 2070 Max-Q, i9-9980HK, Intel SSD 760p SSDPEKKW512G8 | Asus ROG Strix Scar II GL704GW GeForce RTX 2070 Mobile, i7-8750H, Intel SSD 660p SSDPEKNW512G8 | |
|---|---|---|---|---|---|---|
| Noise | 2% | -3% | 4% | -2% | -4% | |
| uit / omgeving * (dB) | 29.1 | 28.2 3% | 30 -3% | 28.2 3% | 29.3 -1% | 29 -0% |
| Idle Minimum * (dB) | 29.4 | 28.2 4% | 31 -5% | 28.2 4% | 33 -12% | 29 1% |
| Idle Average * (dB) | 29.4 | 28.2 4% | 32 -9% | 28.2 4% | 33 -12% | 32 -9% |
| Idle Maximum * (dB) | 31.5 | 31 2% | 38 -21% | 30.8 2% | 33 -5% | 40 -27% |
| Load Average * (dB) | 49.7 | 50.8 -2% | 47 5% | 42 15% | 42.5 14% | 46 7% |
| Witcher 3 ultra * (dB) | 49.5 | 50.8 -3% | 48 3% | 51 -3% | 42 15% | 51 -3% |
| Load Maximum * (dB) | 53.3 | 50.8 5% | 49 8% | 53 1% | 59.6 -12% | 52 2% |
* ... kleiner is beter
Geluidsniveau
| Onbelast |
| 29.4 / 29.4 / 31.5 dB (A) |
| Belasting |
| 49.7 / 53.3 dB (A) |
 | ||
30 dB stil 40 dB(A) hoorbaar 50 dB(A) luid |
||
min: | ||
(-) De maximumtemperatuur aan de bovenzijde bedraagt 54.2 °C / 130 F, vergeleken met het gemiddelde van 40.4 °C / 105 F, variërend van 21.2 tot 68.8 °C voor de klasse Gaming.
(-) De bodem warmt op tot een maximum van 61.4 °C / 143 F, vergeleken met een gemiddelde van 43.2 °C / 110 F
(+) Bij onbelast gebruik bedraagt de gemiddelde temperatuur voor de bovenzijde 31.9 °C / 89 F, vergeleken met het apparaatgemiddelde van 33.9 °C / 93 F.
(±) Bij het spelen van The Witcher 3 is de gemiddelde temperatuur voor de bovenzijde 33.8 °C / 93 F, vergeleken met het apparaatgemiddelde van 33.9 °C / 93 F.
(+) De palmsteunen en het touchpad zijn met een maximum van ###max## °C / 88.5 F koeler dan de huidtemperatuur en voelen daarom koel aan.
(-) De gemiddelde temperatuur van de handpalmsteun van soortgelijke toestellen bedroeg 28.8 °C / 83.8 F (-2.6 °C / -4.7 F).
| Uit / Standby | |
| Inactief | |
| Belasting |
|
Key:
min: | |
| Alienware m17 R2 P41E i9-9980HK, GeForce RTX 2080 Max-Q, 2x SK Hynix PC601 NVMe 512 GB (RAID 0), IPS, 1920x1080, 17.3" | Alienware m17 P37E i9-8950HK, GeForce RTX 2080 Max-Q, SK Hynix PC401 512GB M.2 (HFS512GD9TNG), IPS, 3840x2160, 17.3" | MSI GS75 Stealth 9SG i7-9750H, GeForce RTX 2080 Max-Q, 2x Samsung SSD PM981 MZVLB1T0HALR (RAID 0), IPS, 1920x1080, 17.3" | Razer Blade Pro 17 RTX 2080 Max-Q i7-9750H, GeForce RTX 2080 Max-Q, Samsung SSD PM981 MZVLB512HAJQ, IPS, 1920x1080, 17.3" | Gigabyte Aero 17 XA RP77 i9-9980HK, GeForce RTX 2070 Max-Q, Intel SSD 760p SSDPEKKW512G8, IPS, 3840x2160, 17.3" | Asus ROG Strix Scar II GL704GW i7-8750H, GeForce RTX 2070 Mobile, Intel SSD 660p SSDPEKNW512G8, AHVA, 1920x1080, 17.3" | |
|---|---|---|---|---|---|---|
| Power Consumption | 17% | 35% | 30% | 25% | 25% | |
| Idle Minimum * (Watt) | 24.7 | 21.2 14% | 13 47% | 16.2 34% | 13.9 44% | 19 23% |
| Idle Average * (Watt) | 35.9 | 29.6 18% | 17 53% | 20.4 43% | 24.3 32% | 22 39% |
| Idle Maximum * (Watt) | 69.6 | 34 51% | 25 64% | 26.1 62% | 35.5 49% | 29 58% |
| Load Average * (Watt) | 141.8 | 130.9 8% | 96 32% | 96.5 32% | 127.6 10% | 102 28% |
| Witcher 3 ultra * (Watt) | 185.8 | 177.5 4% | 156 16% | 182.9 2% | 158 15% | 190 -2% |
| Load Maximum * (Watt) | 235.4 | 219.7 7% | 239 -2% | 214.3 9% | 237.5 -1% | 231 2% |
* ... kleiner is beter
| Alienware m17 R2 P41E i9-9980HK, GeForce RTX 2080 Max-Q, 76 Wh | Alienware m17 P37E i9-8950HK, GeForce RTX 2080 Max-Q, 90 Wh | MSI GS75 Stealth 9SG i7-9750H, GeForce RTX 2080 Max-Q, 80.25 Wh | Razer Blade Pro 17 RTX 2080 Max-Q i7-9750H, GeForce RTX 2080 Max-Q, 70 Wh | Gigabyte Aero 17 XA RP77 i9-9980HK, GeForce RTX 2070 Max-Q, 94.24 Wh | Asus ROG Strix Scar II GL704GW i7-8750H, GeForce RTX 2070 Mobile, 66 Wh | |
|---|---|---|---|---|---|---|
| Batterijduur | 30% | 58% | 49% | 113% | 29% | |
| Reader / Idle (h) | 7.1 | 9.1 28% | 7.7 8% | 4.9 -31% | 11.9 68% | 6.2 -13% |
| WiFi v1.3 (h) | 4.8 | 4.9 2% | 6 25% | 4.7 -2% | 7.2 50% | 3.9 -19% |
| Load (h) | 0.5 | 0.8 60% | 1.2 140% | 1.4 180% | 1.6 220% | 1.1 120% |
| Witcher 3 ultra (h) | 0.9 |
Pro
Contra
Dit is de verkorte versie van het originele artikel. Het volledige, Engelse testrapport vind je hier.
Gebruikers verwachten altijd dat modellen van de tweede generatie op alle vlakken beter zijn dan de eerste generatie. In het geval van de Alienware m17 R2 is het echter meer een zijwaartse stap ten opzichte van de Alienware m17 R1. Deze nieuwste iteratie voegt functies waar sommige fans zich aan zullen storen. Gebruikers moeten verwisselbaar RAM, verwisselbare Wi-Fi, 2,5-inch SATA III-opties, 4K UHD-schermopties en een grotere batterij (zoals bij de originele m17 R1) inruilen voor een verbeterd toetsenbord, groter clickpad, RGB-verlichting per toets, en een nieuwere behuizing. Als je gebruiksscenario's hoge eisen stellen aan RAM- en opslagcapaciteit, kan je in de plaats ook de grotere Alienware Area-51m overwegen.
Op het vlak van prestaties zijn we onder de indruk van de consistente Turbo Boost van de CPU. Core i9-laptops - vooral de dunnere - stellen meestal teleur omdat de meeste ontwerpen het potentieel van de processor niet volledig kunnen benutten, maar deze Alienware is een opmerkelijke uitzondering. De belangrijkste nadelen zijn de grotere voetafdruk, veel hogere core-temperaturen en luid ventilatorgeluid dat niet echt een verbetering is ten opzichte van de m17 R1. Dit zijn helaas de gevolgen van de integratie van een Core i9-CPU in zo'n dunne behuizing. Toch vermoeden we dat de minder high-end versies met de Core i5 of Core i7 koeler zullen werken dan wat we hier hebben opgemeten.
Heeft de Alienware m17 R2 genoeg te bieden om een sterke aanbeveling te verdienen? Tenzij je veel waarde hecht aan het betere toetsenbord, de Core i9 en Tobii eye-tracking-opties, kun je vergelijkbare gaming-prestaties krijgen van kleinere en meer draagbare Core i7-alternatieven zoals de Asus ROG Strix Scar GL704GW of Razer Blade Pro 17.
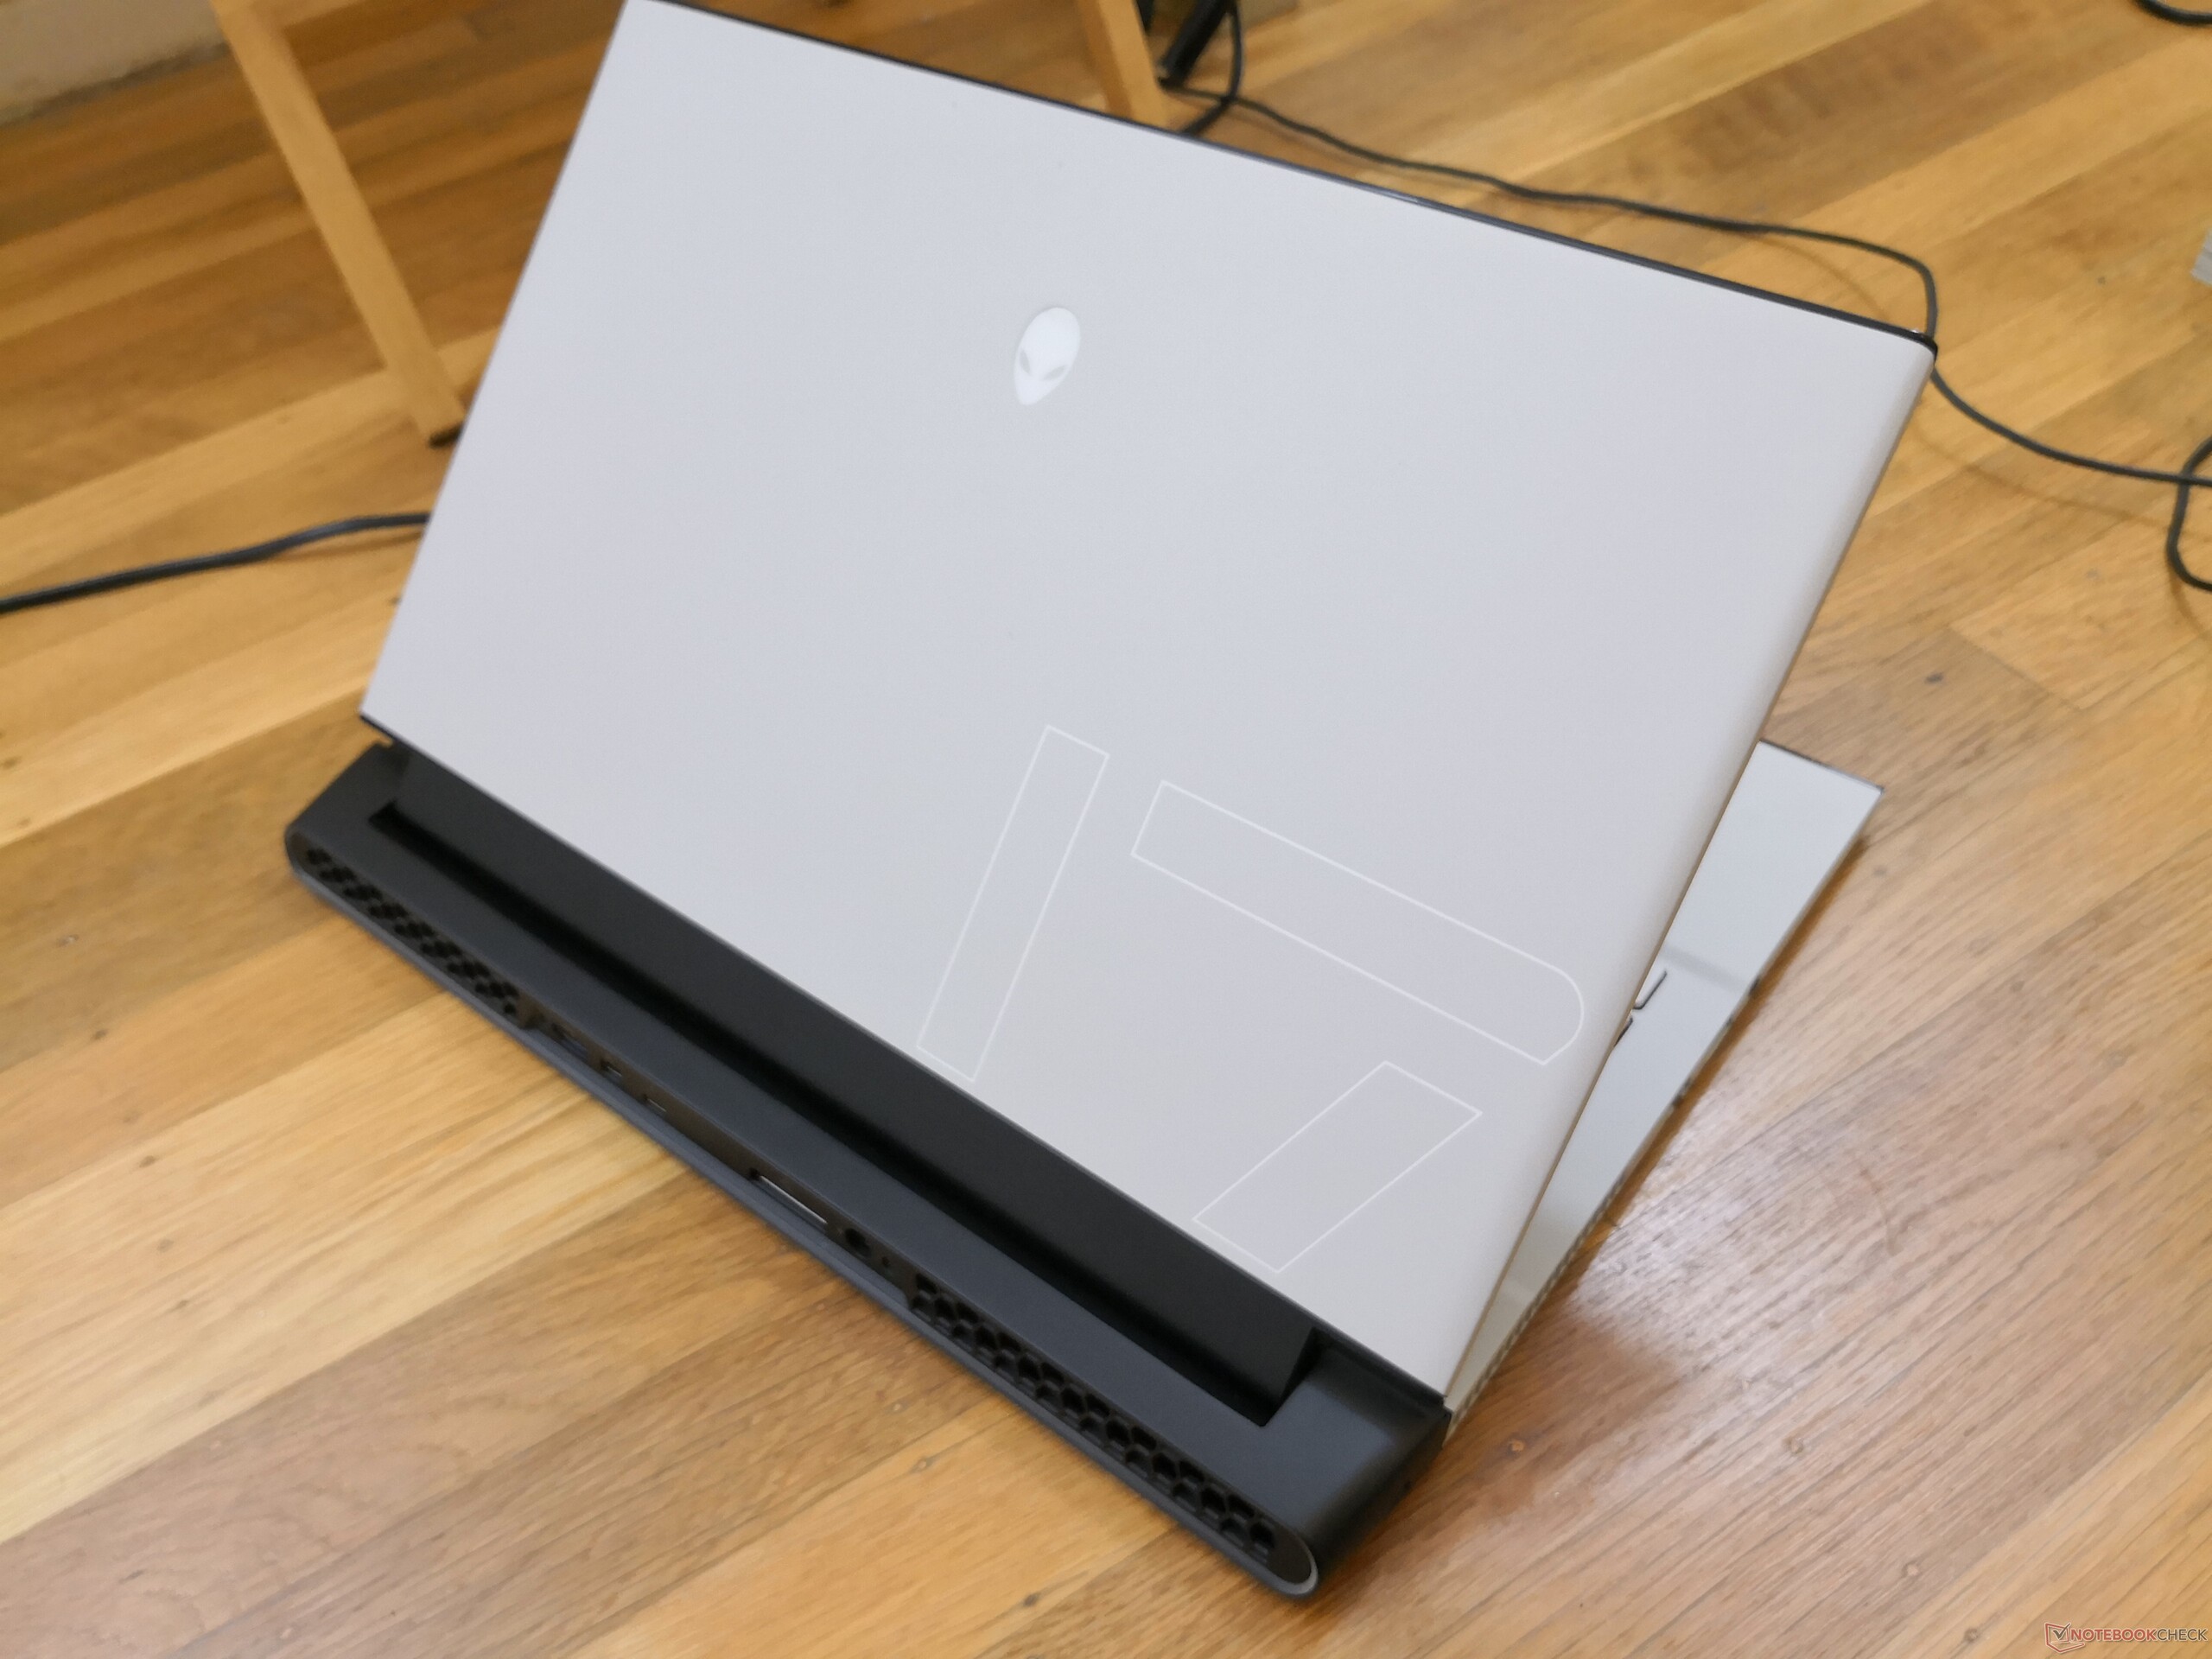
Bij de Alienware m17 R2 draait alles om het maximaliseren van de prestaties binnen de dunste behuizing in de serie tot nu toe. Gebruikers zullen vrede moeten nemen met de onvermijdelijk luidere fans, warmere core-temperaturen en grotere voetafdruk, zelfs voor een 17,3-inch gaminglaptop als ze het potentieel van het systeem ten volle willen benutten.
Alienware m17 R2 P41E
- 31-07-2020 v7 (old)
Allen Ngo
Price comparison
