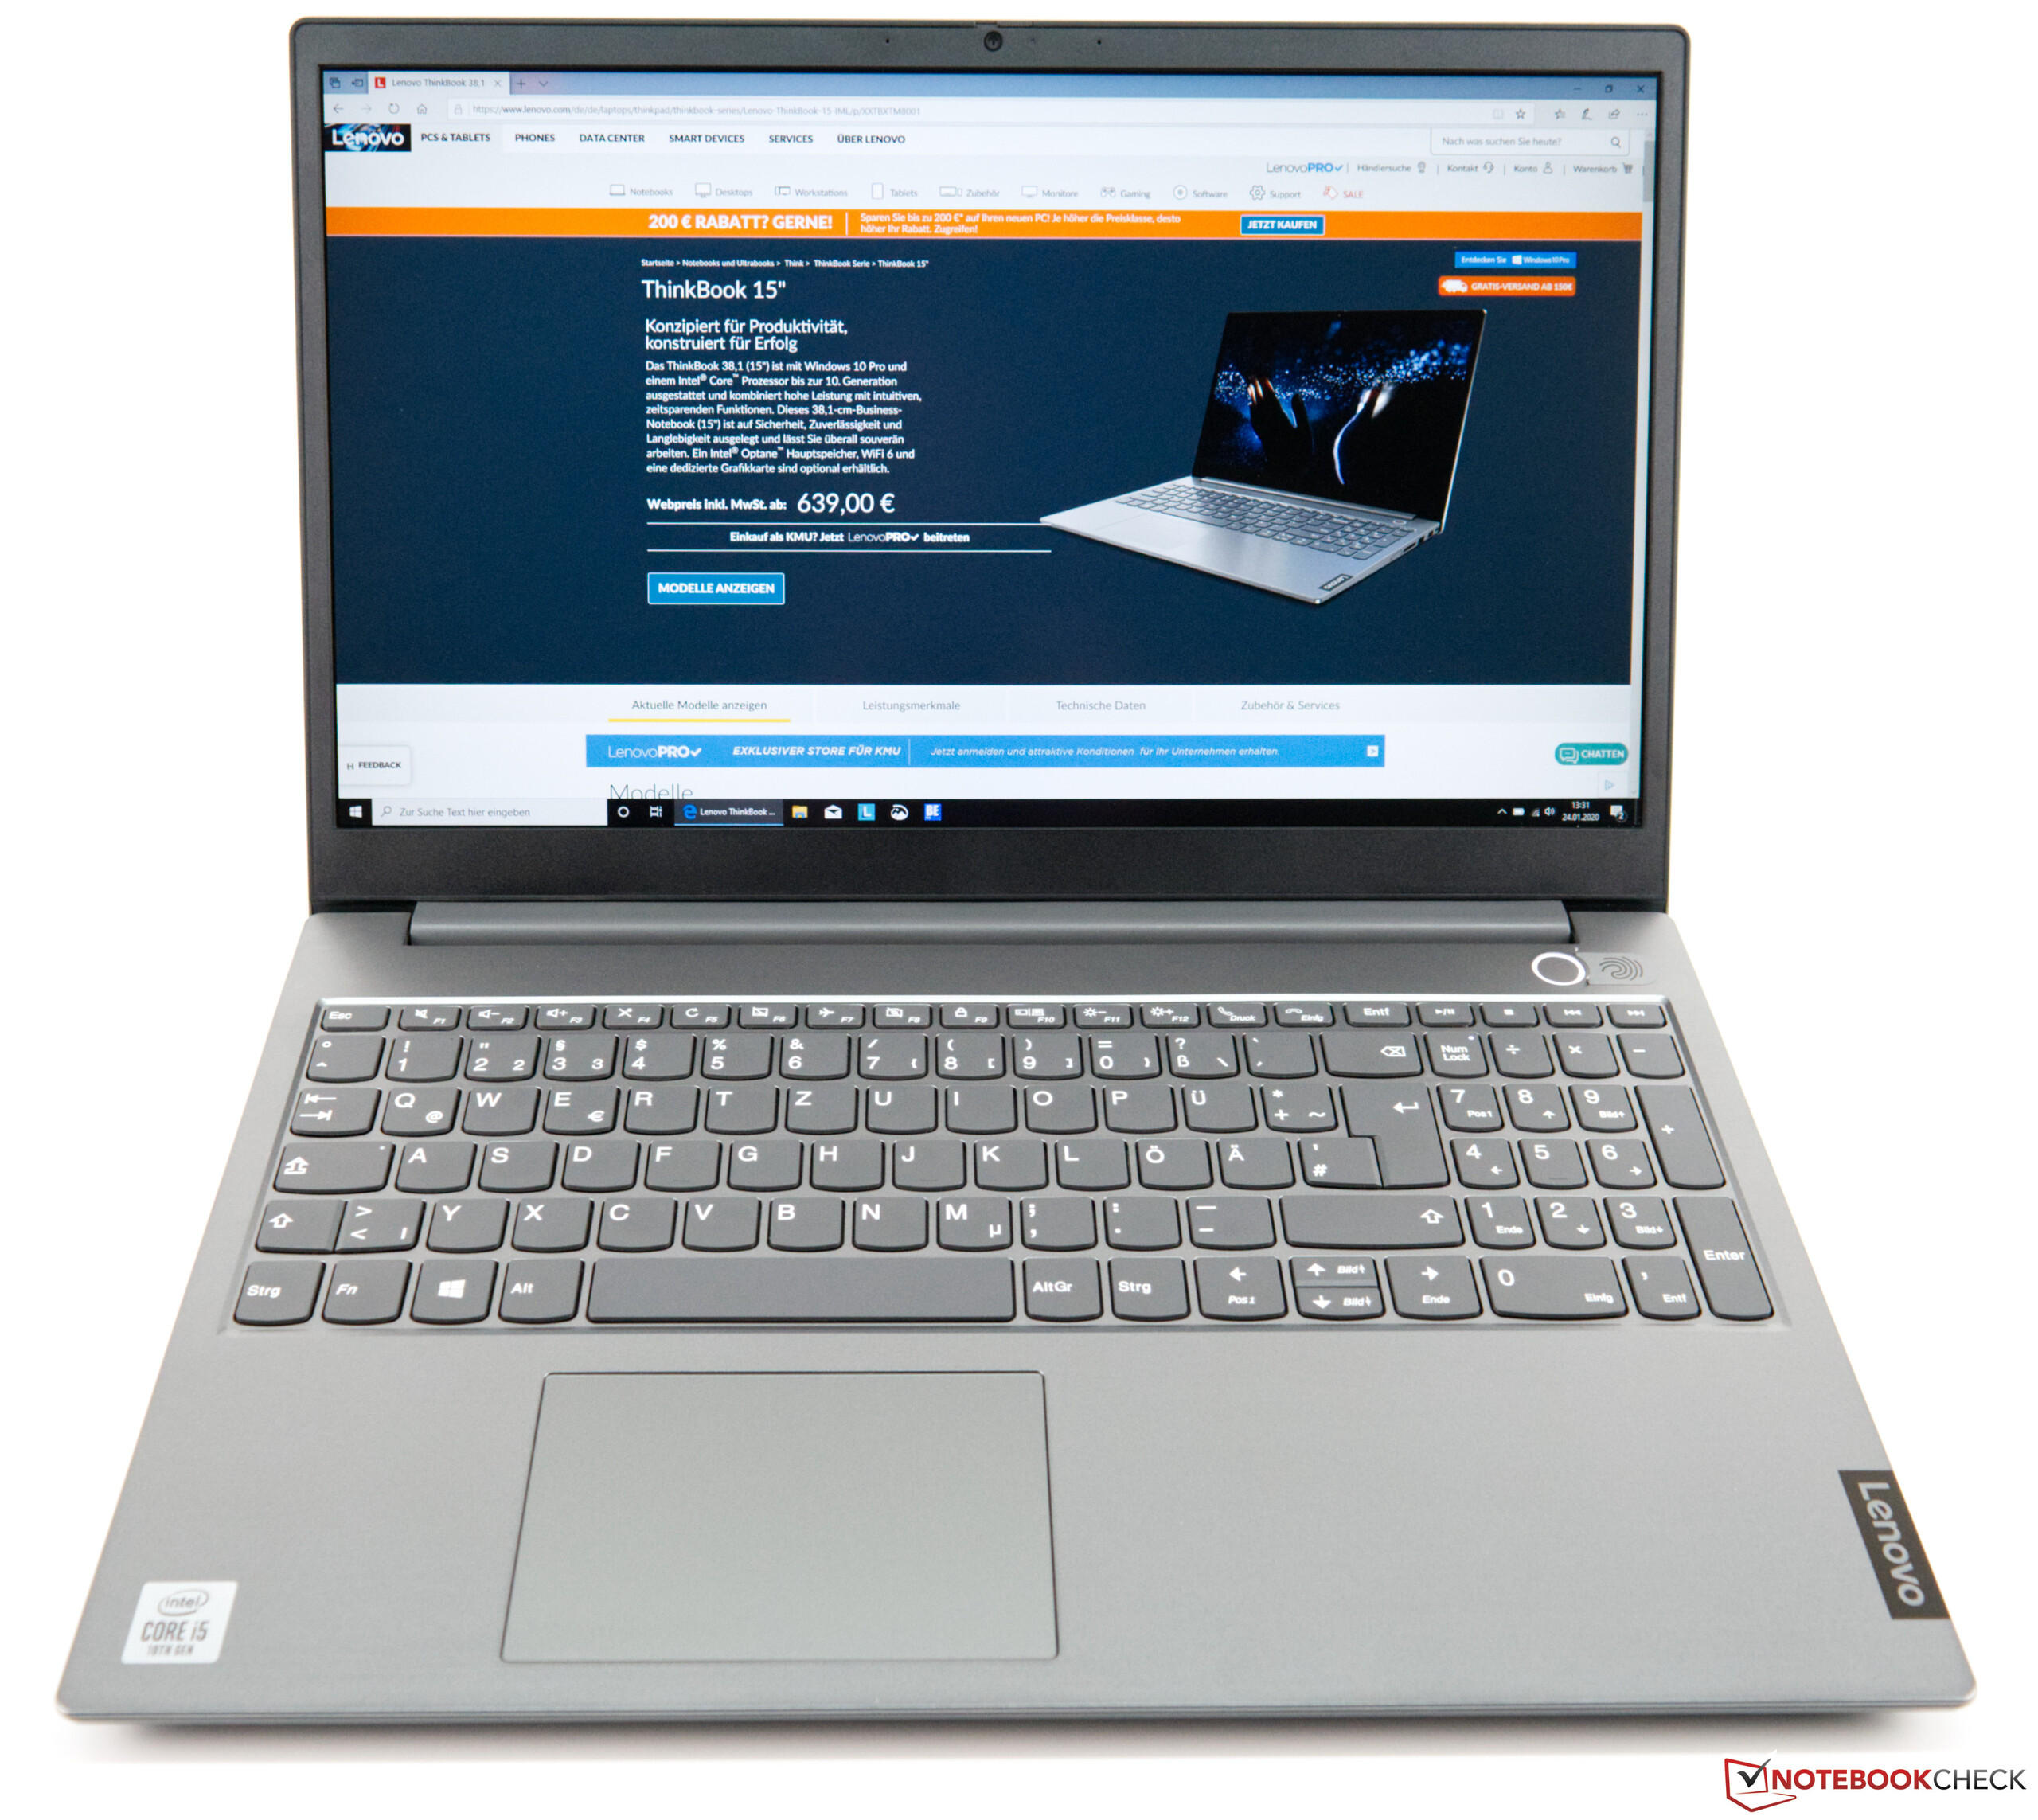
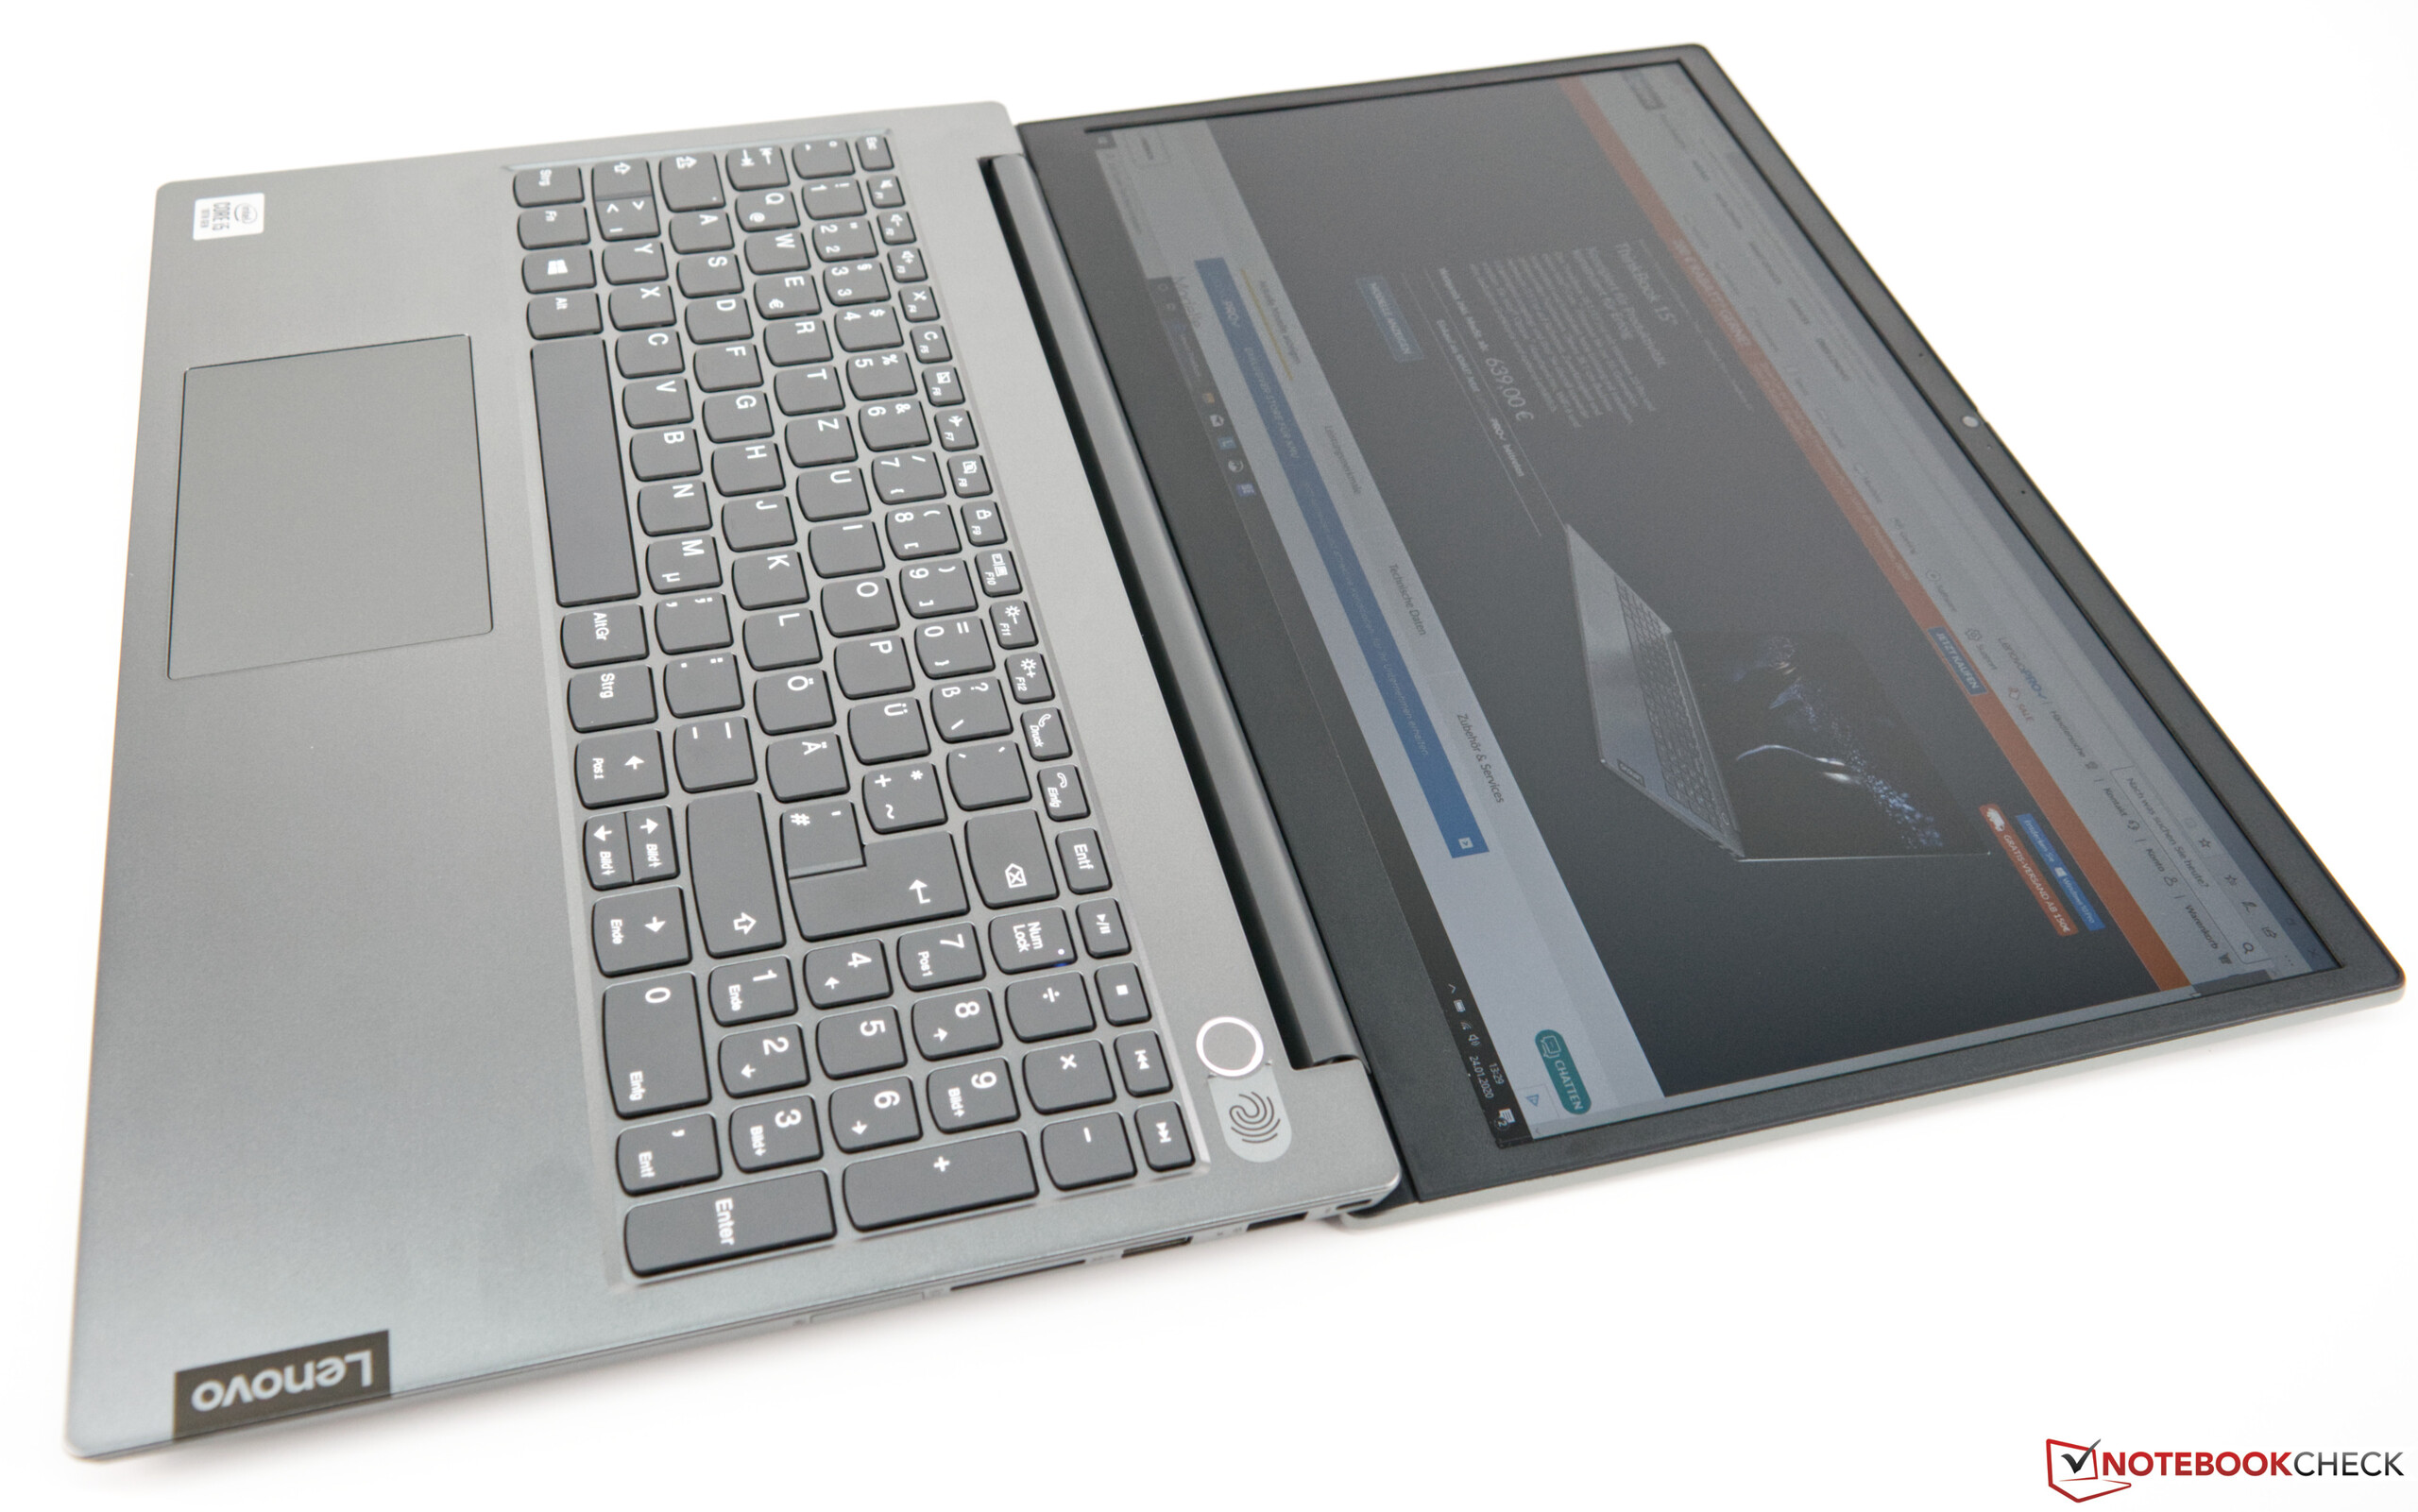
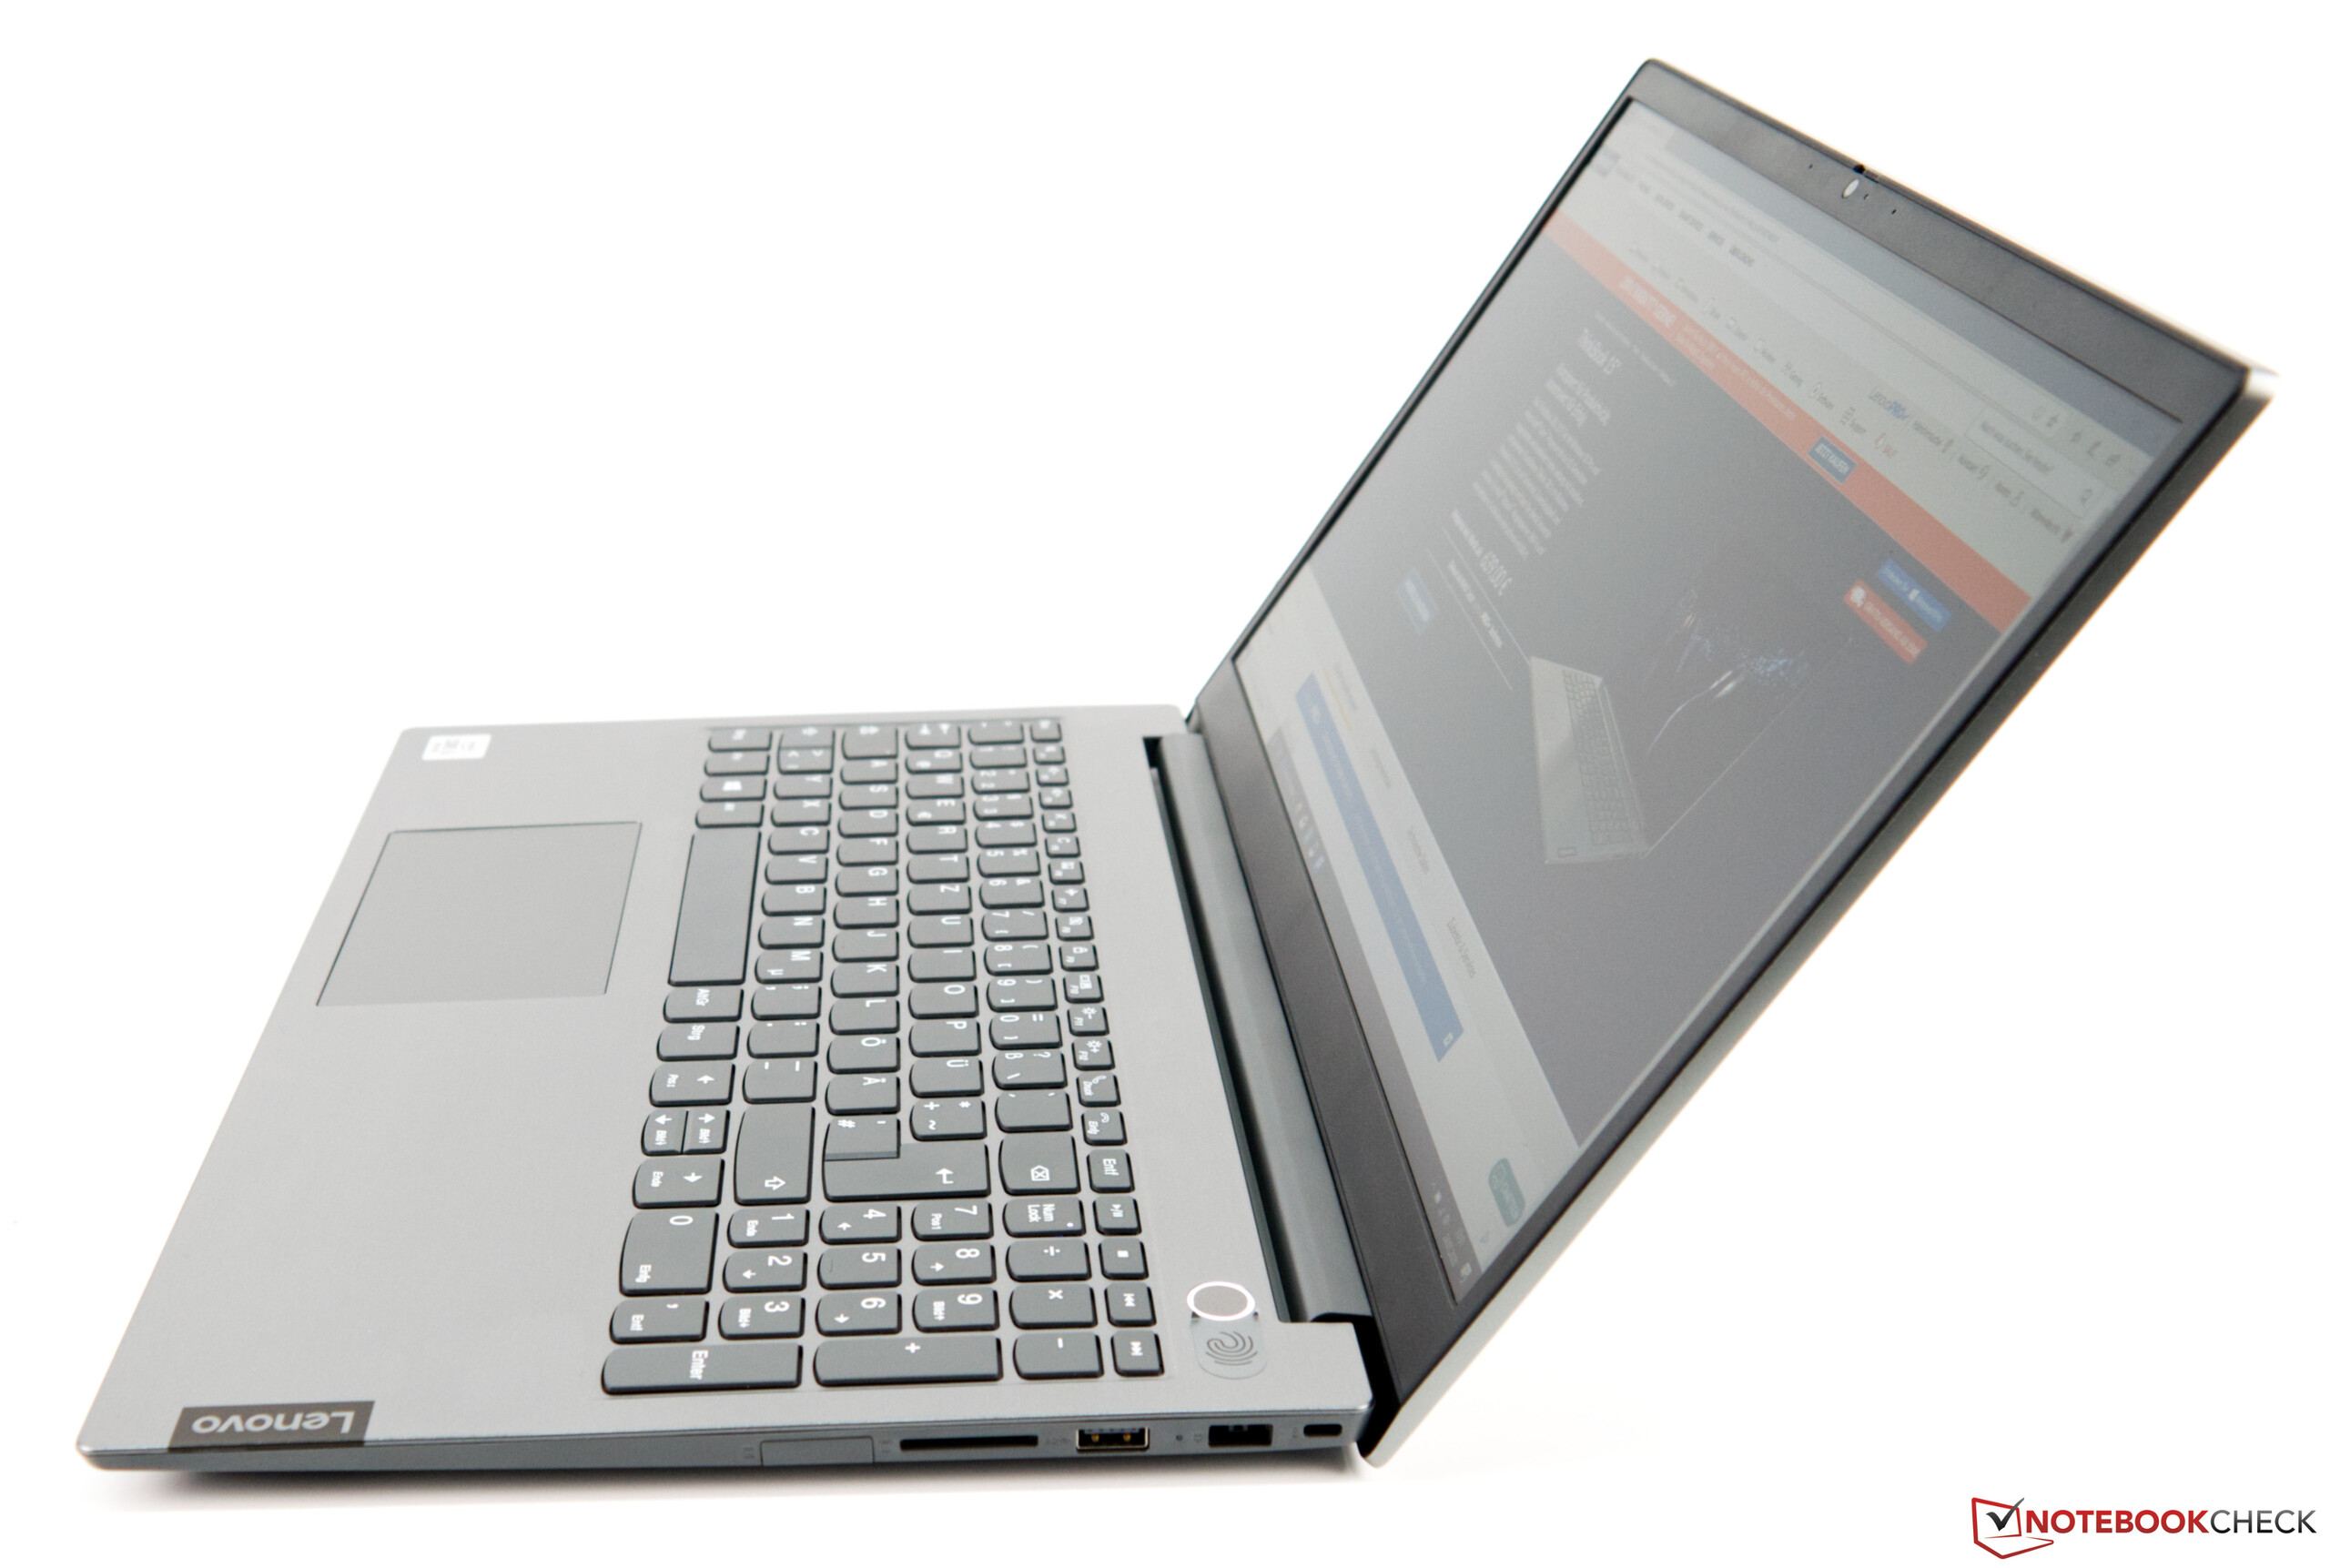
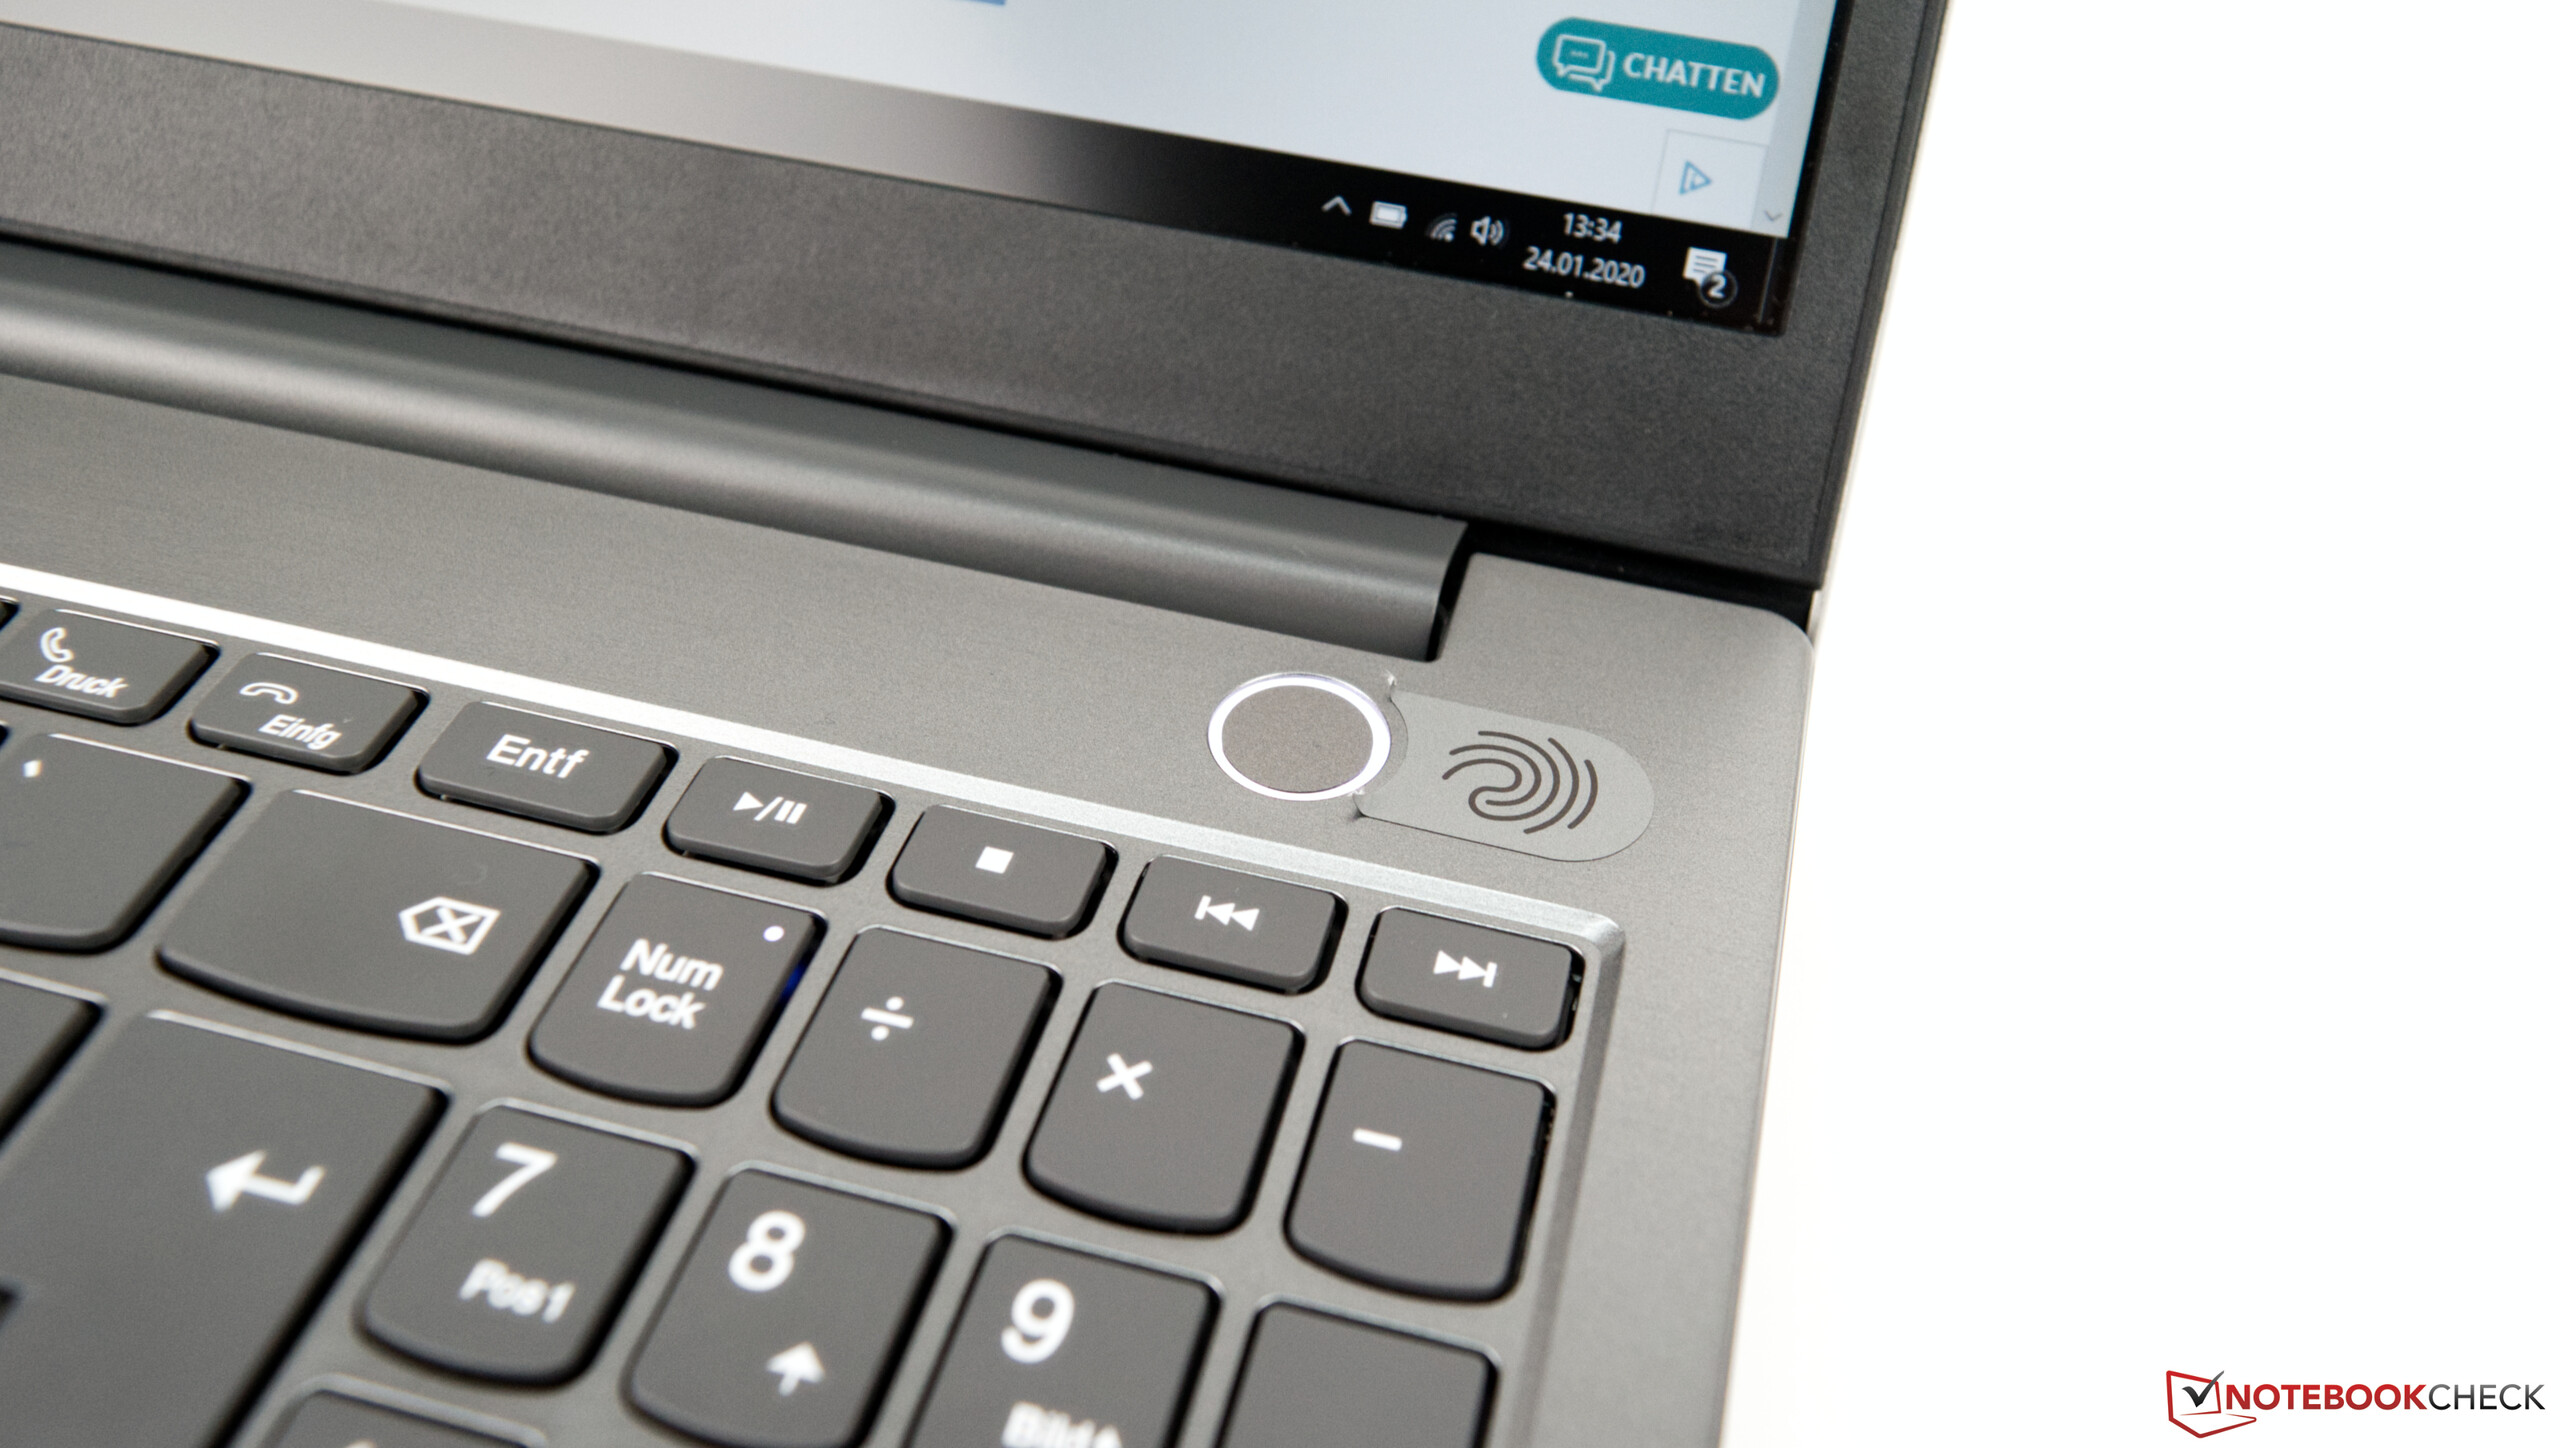
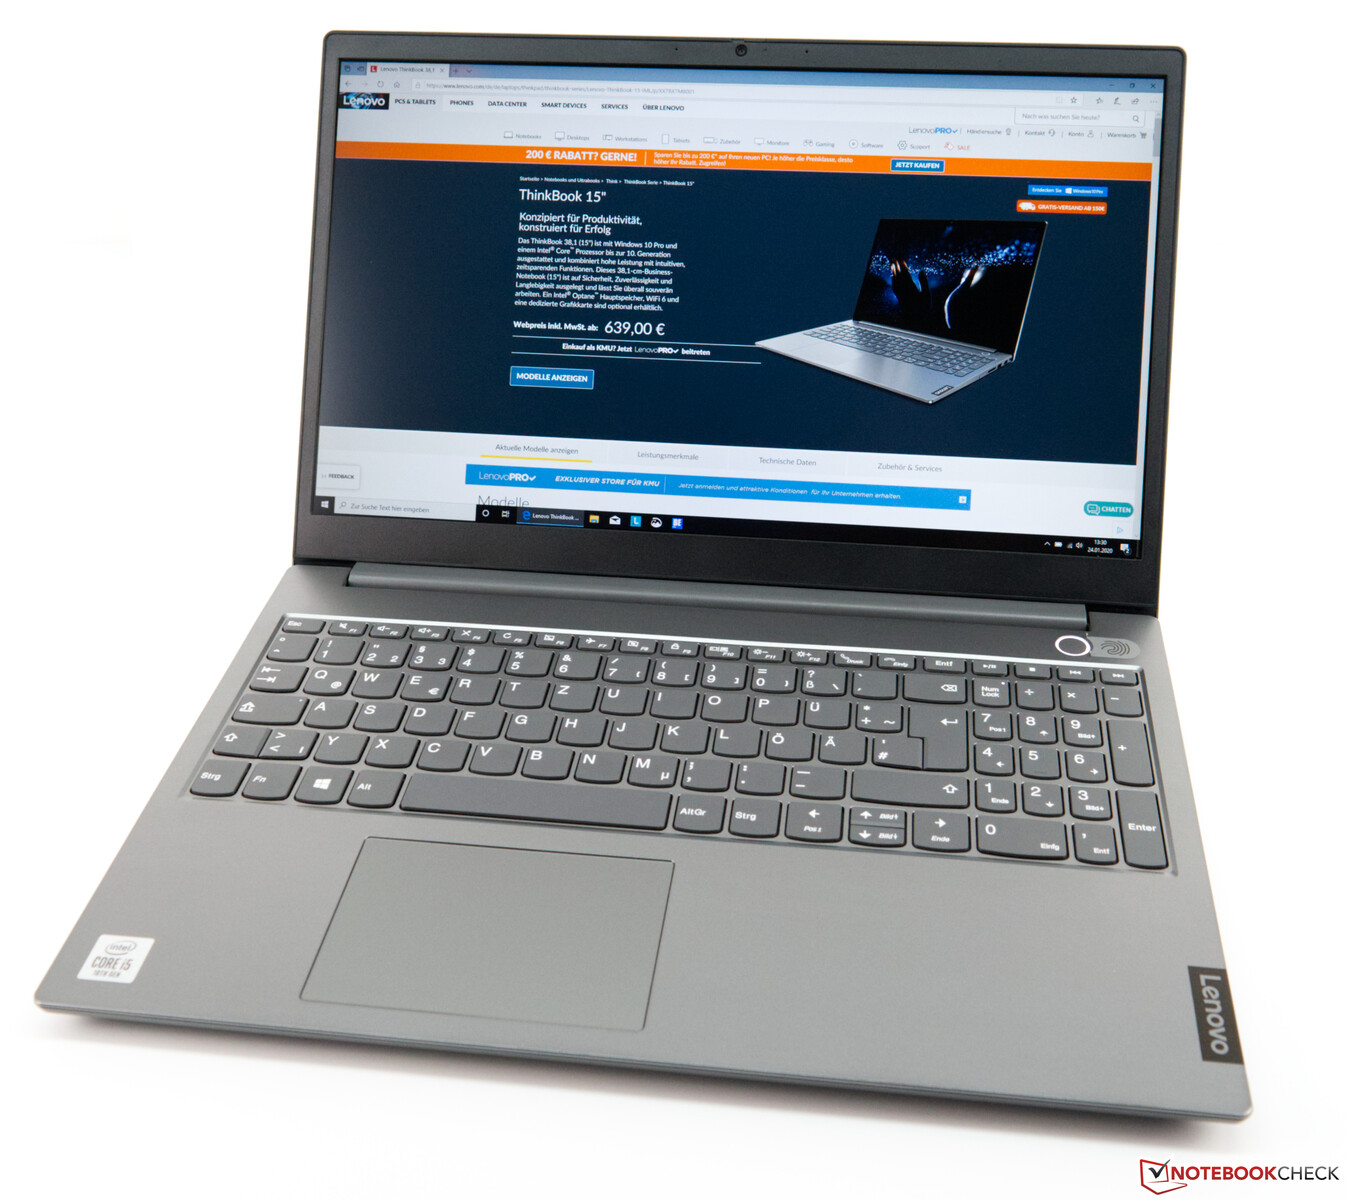
Kort testrapport Lenovo ThinkBook 15 Laptop: An affordable office device with a Comet Lake processor
Evaluatie | Datum | Model | Gewicht | Hoogte | Formaat | Resolutie | Beste prijs |
|---|---|---|---|---|---|---|---|
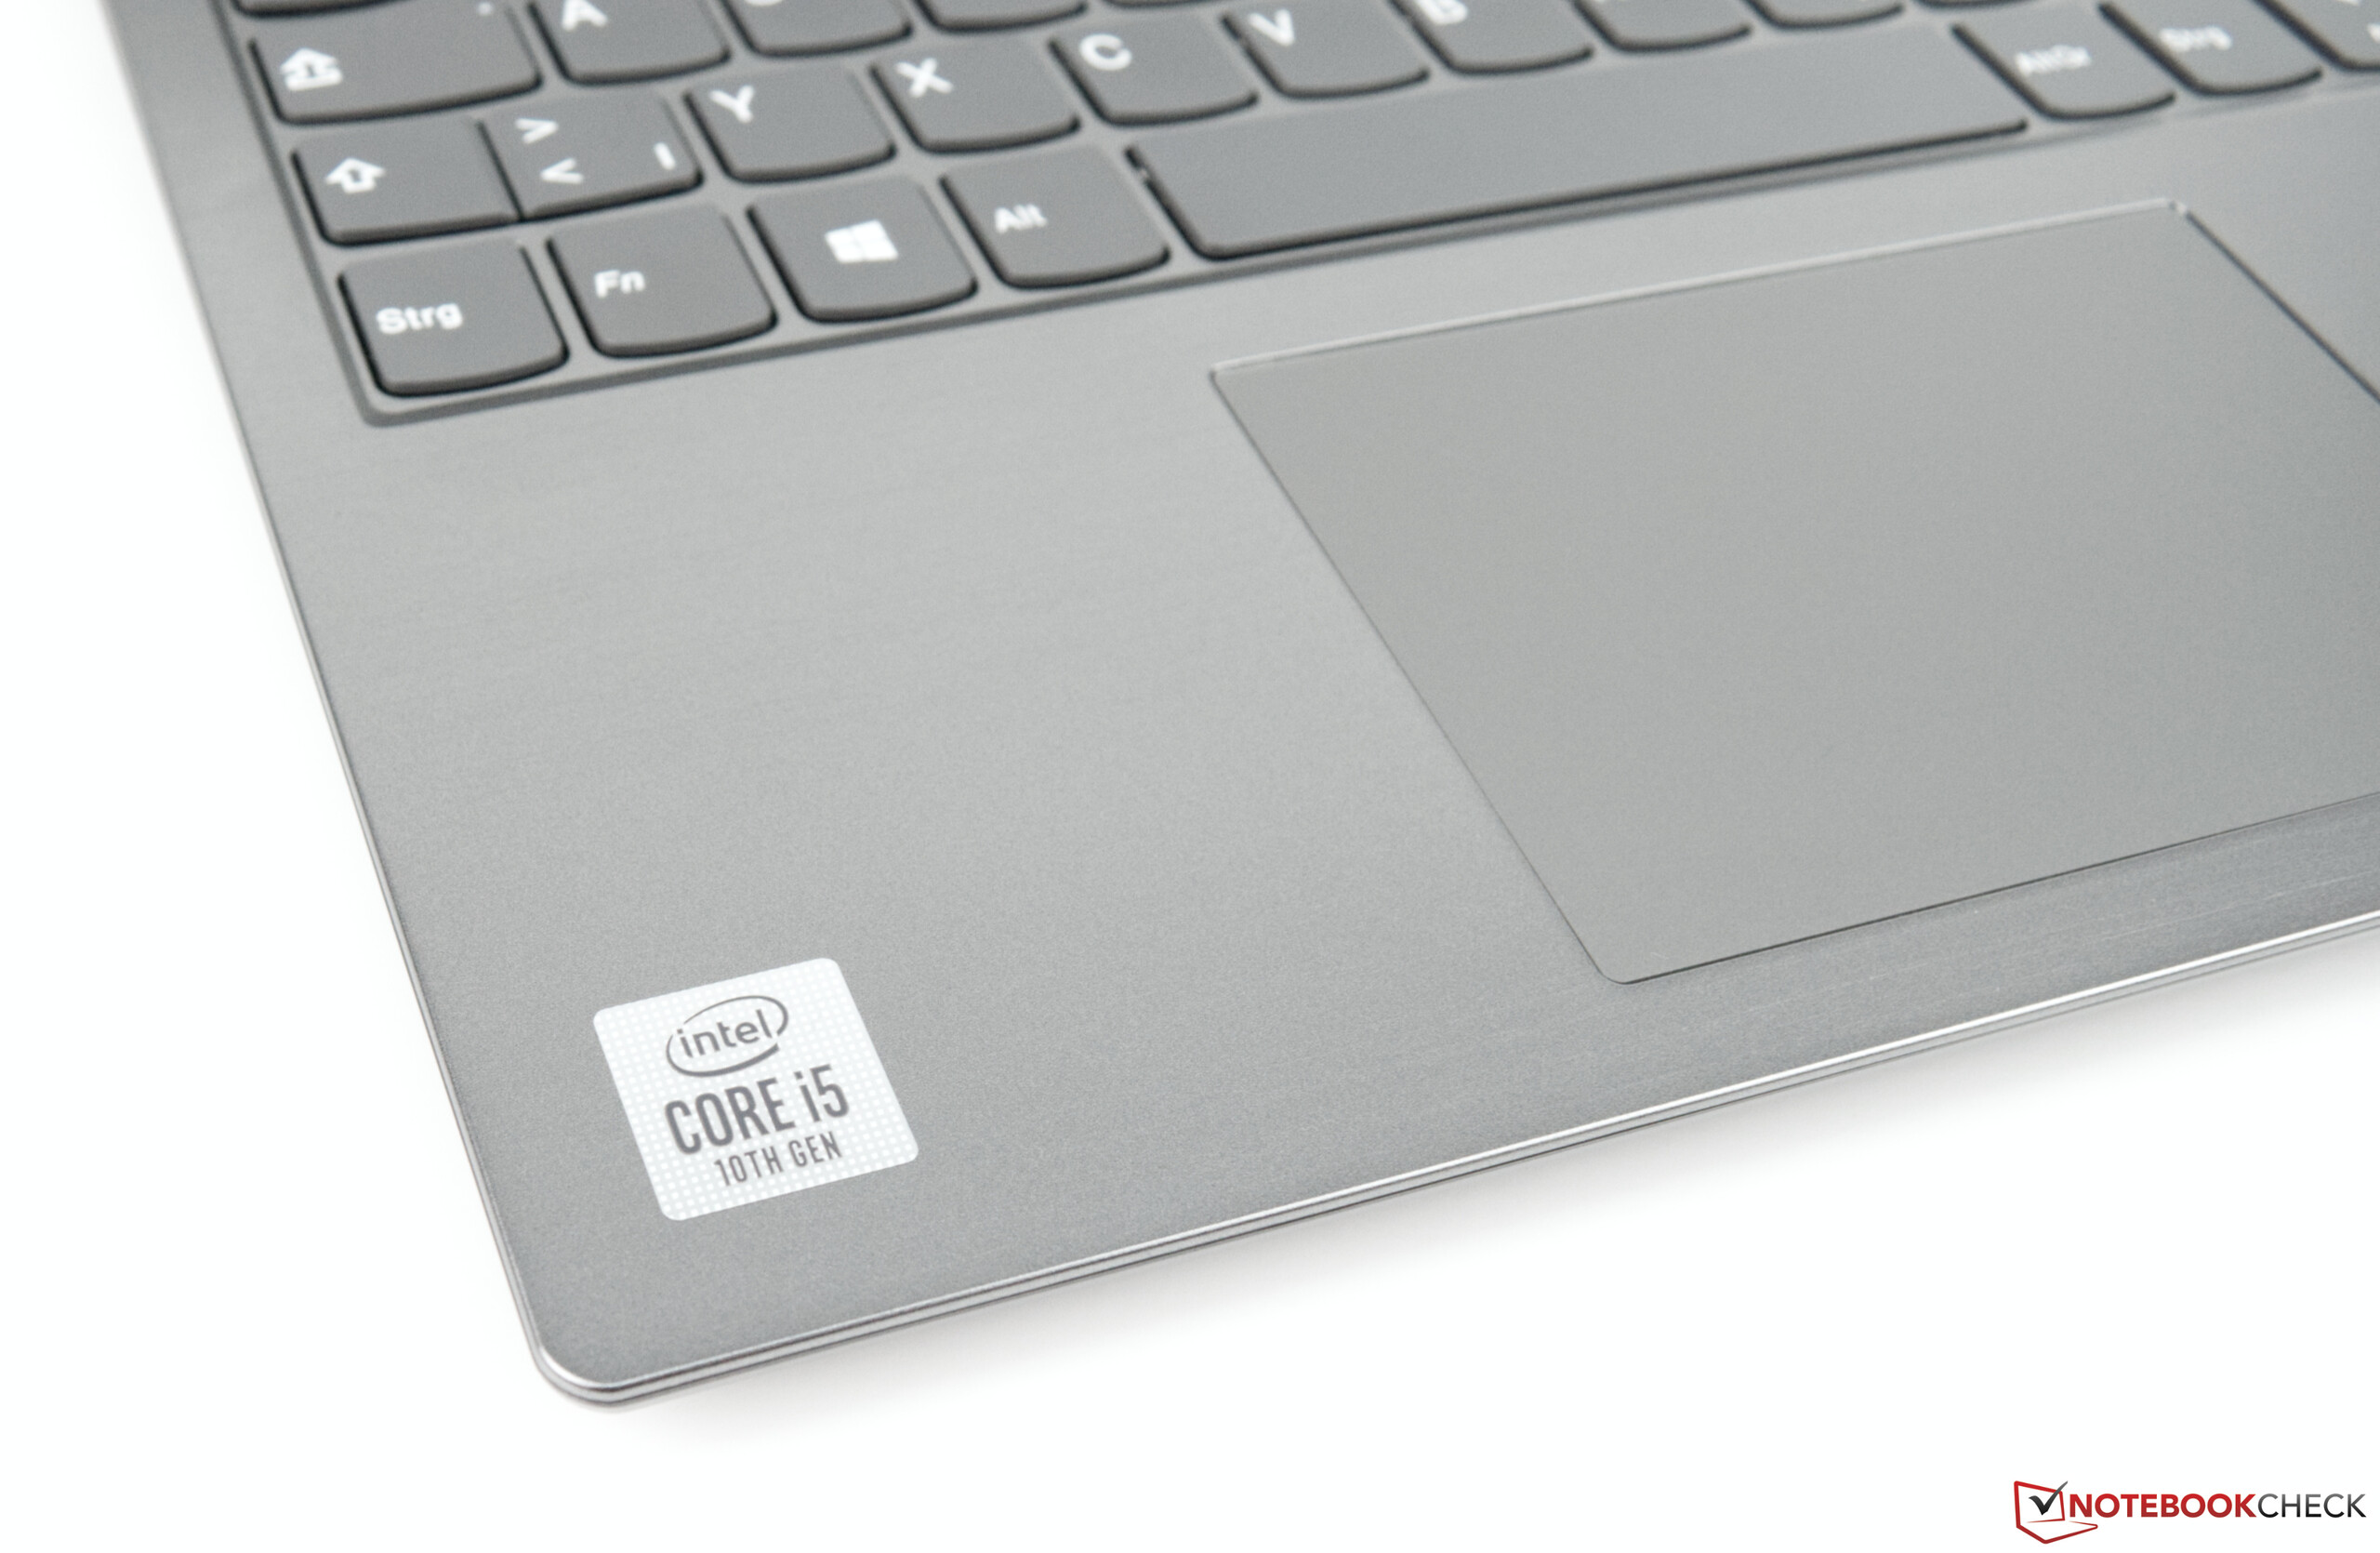
| 81.8 % v7 (old) | 02-2020 | Lenovo ThinkBook 15 i5-10210U, UHD Graphics 620 | 1.9 kg | 18.9 mm | 15.60" | 1920x1080 | |
| 88.4 % v6 (old) | 10-2024 | Lenovo ThinkPad E595-20NF0000GE R7 3700U, Vega 10 | 1.9 kg | 19.9 mm | 15.60" | 1920x1080 | |
| 83.2 % v7 (old) | 10-2019 | Lenovo ThinkPad L590-20Q70019GE i5-8265U, UHD Graphics 620 | 2 kg | 23 mm | 15.60" | 1920x1080 | |
| 82.1 % v7 (old) | Schenker Slim 15 L19 i5-10210U, UHD Graphics 620 | 1.6 kg | 19.9 mm | 15.60" | 1920x1080 | ||
| 84.6 % v6 (old) | 03-2019 | HP ProBook 450 G6-5TJ93EA i7-8565U, GeForce MX130 | 2 kg | 20 mm | 15.60" | 1920x1080 | |
| 79.6 % v6 (old) | 07-2019 | Dell Latitude 15 3590 i5-8250U, UHD Graphics 620 | 2.1 kg | 22 mm | 15.60" | 1920x1080 |


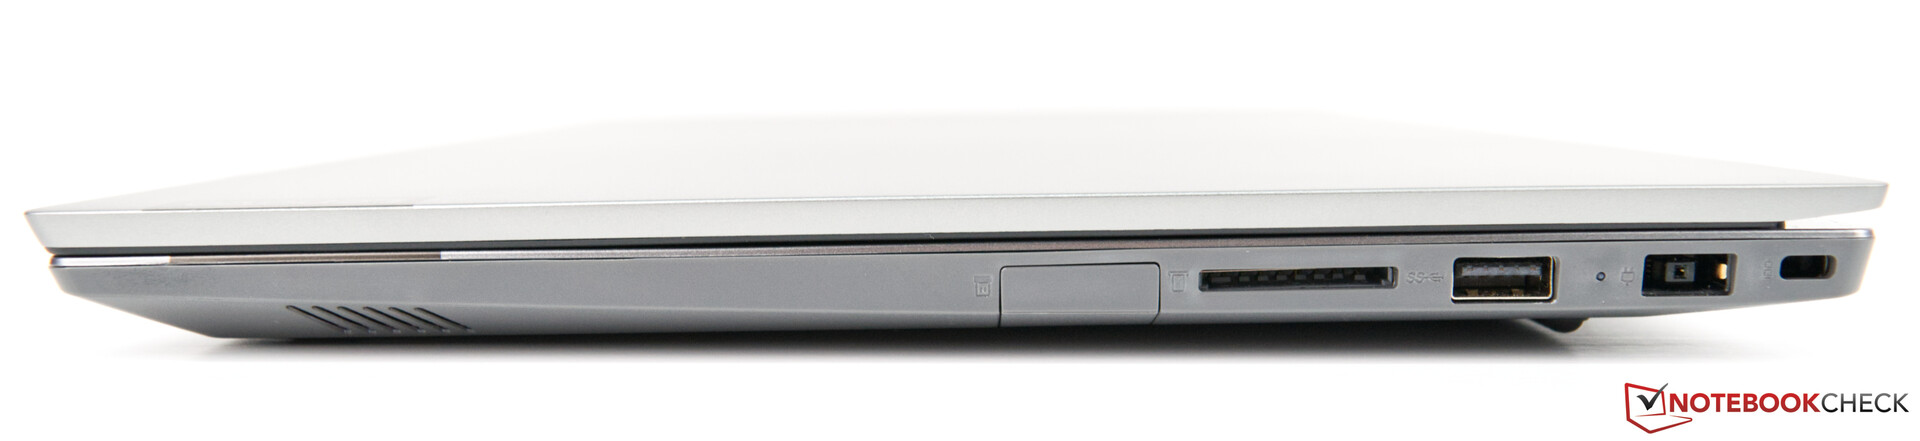
| SD Card Reader | |
| average JPG Copy Test (av. of 3 runs) | |
| Lenovo ThinkBook 15 (Toshiba Exceria Pro SDXC 64 GB UHS-II) | |
| Lenovo ThinkPad E595-20NF0000GE (Toshiba Exceria Pro M501 64 GB UHS-II) | |
| HP ProBook 450 G6-5TJ93EA (Toshiba Exceria Pro SDXC 64 GB UHS-II) | |
| Lenovo ThinkPad L590-20Q70019GE (Toshiba Exceria Pro M501 64 GB UHS-II) | |
| Schenker Slim 15 L19 (Toshiba Exceria Pro SDXC 64 GB UHS-II) | |
| Gemiddelde van klas Office (19.8 - 198.5, n=22, laatste 2 jaar) | |
| Dell Latitude 15 3590 (Toshiba Exceria Pro SDXC 64 GB UHS-II) | |
| maximum AS SSD Seq Read Test (1GB) | |
| Lenovo ThinkPad E595-20NF0000GE (Toshiba Exceria Pro M501 64 GB UHS-II) | |
| Lenovo ThinkBook 15 (Toshiba Exceria Pro SDXC 64 GB UHS-II) | |
| Lenovo ThinkPad L590-20Q70019GE (Toshiba Exceria Pro M501 64 GB UHS-II) | |
| Schenker Slim 15 L19 (Toshiba Exceria Pro SDXC 64 GB UHS-II) | |
| HP ProBook 450 G6-5TJ93EA (Toshiba Exceria Pro SDXC 64 GB UHS-II) | |
| Gemiddelde van klas Office (27.4 - 249, n=21, laatste 2 jaar) | |
| Dell Latitude 15 3590 (Toshiba Exceria Pro SDXC 64 GB UHS-II) | |
| Networking | |
| iperf3 transmit AX12 | |
| Schenker Slim 15 L19 | |
| Lenovo ThinkBook 15 | |
| HP ProBook 450 G6-5TJ93EA | |
| Lenovo ThinkPad L590-20Q70019GE | |
| Lenovo ThinkPad E595-20NF0000GE | |
| Dell Latitude 15 3590 | |
| iperf3 receive AX12 | |
| Schenker Slim 15 L19 | |
| Lenovo ThinkBook 15 | |
| Lenovo ThinkPad E595-20NF0000GE | |
| HP ProBook 450 G6-5TJ93EA | |
| Lenovo ThinkPad L590-20Q70019GE | |
| Dell Latitude 15 3590 | |
| |||||||||||||||||||||||||
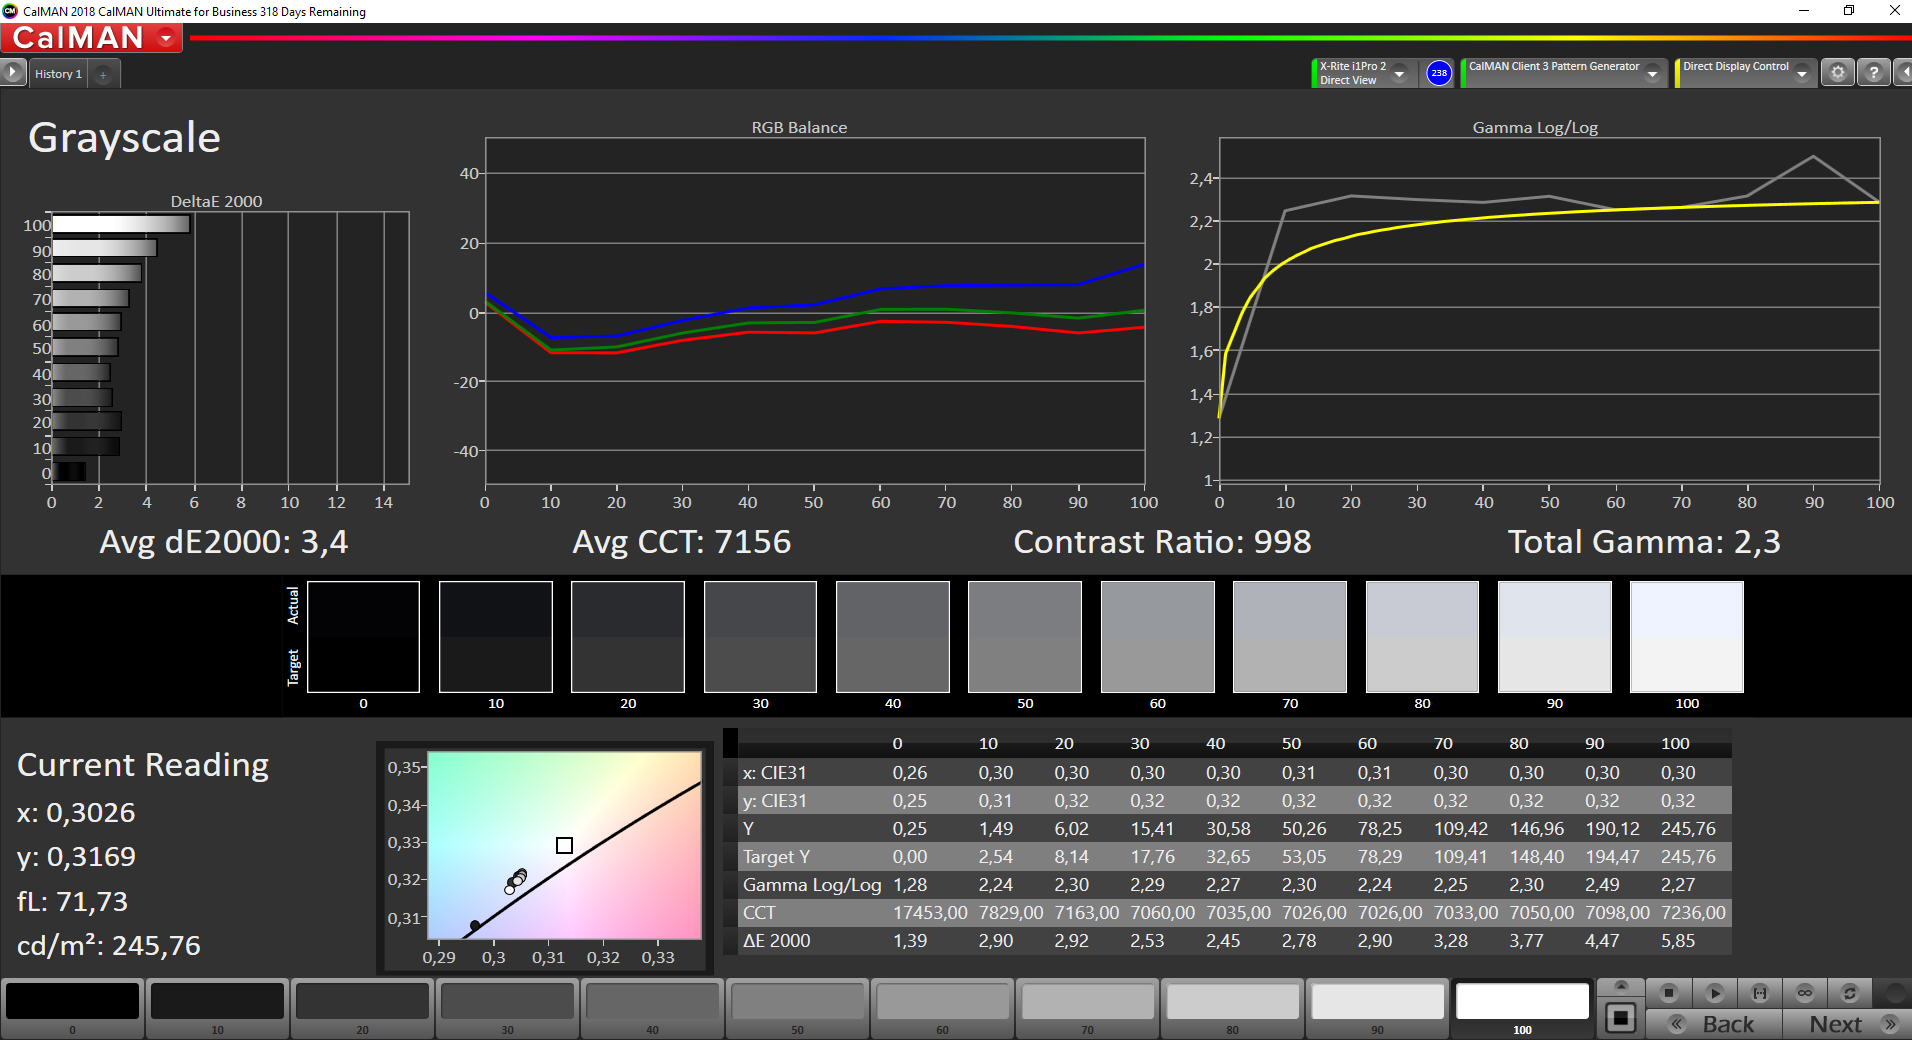
Helderheidsverdeling: 82 %
Helderheid in Batterij-modus: 245 cd/m²
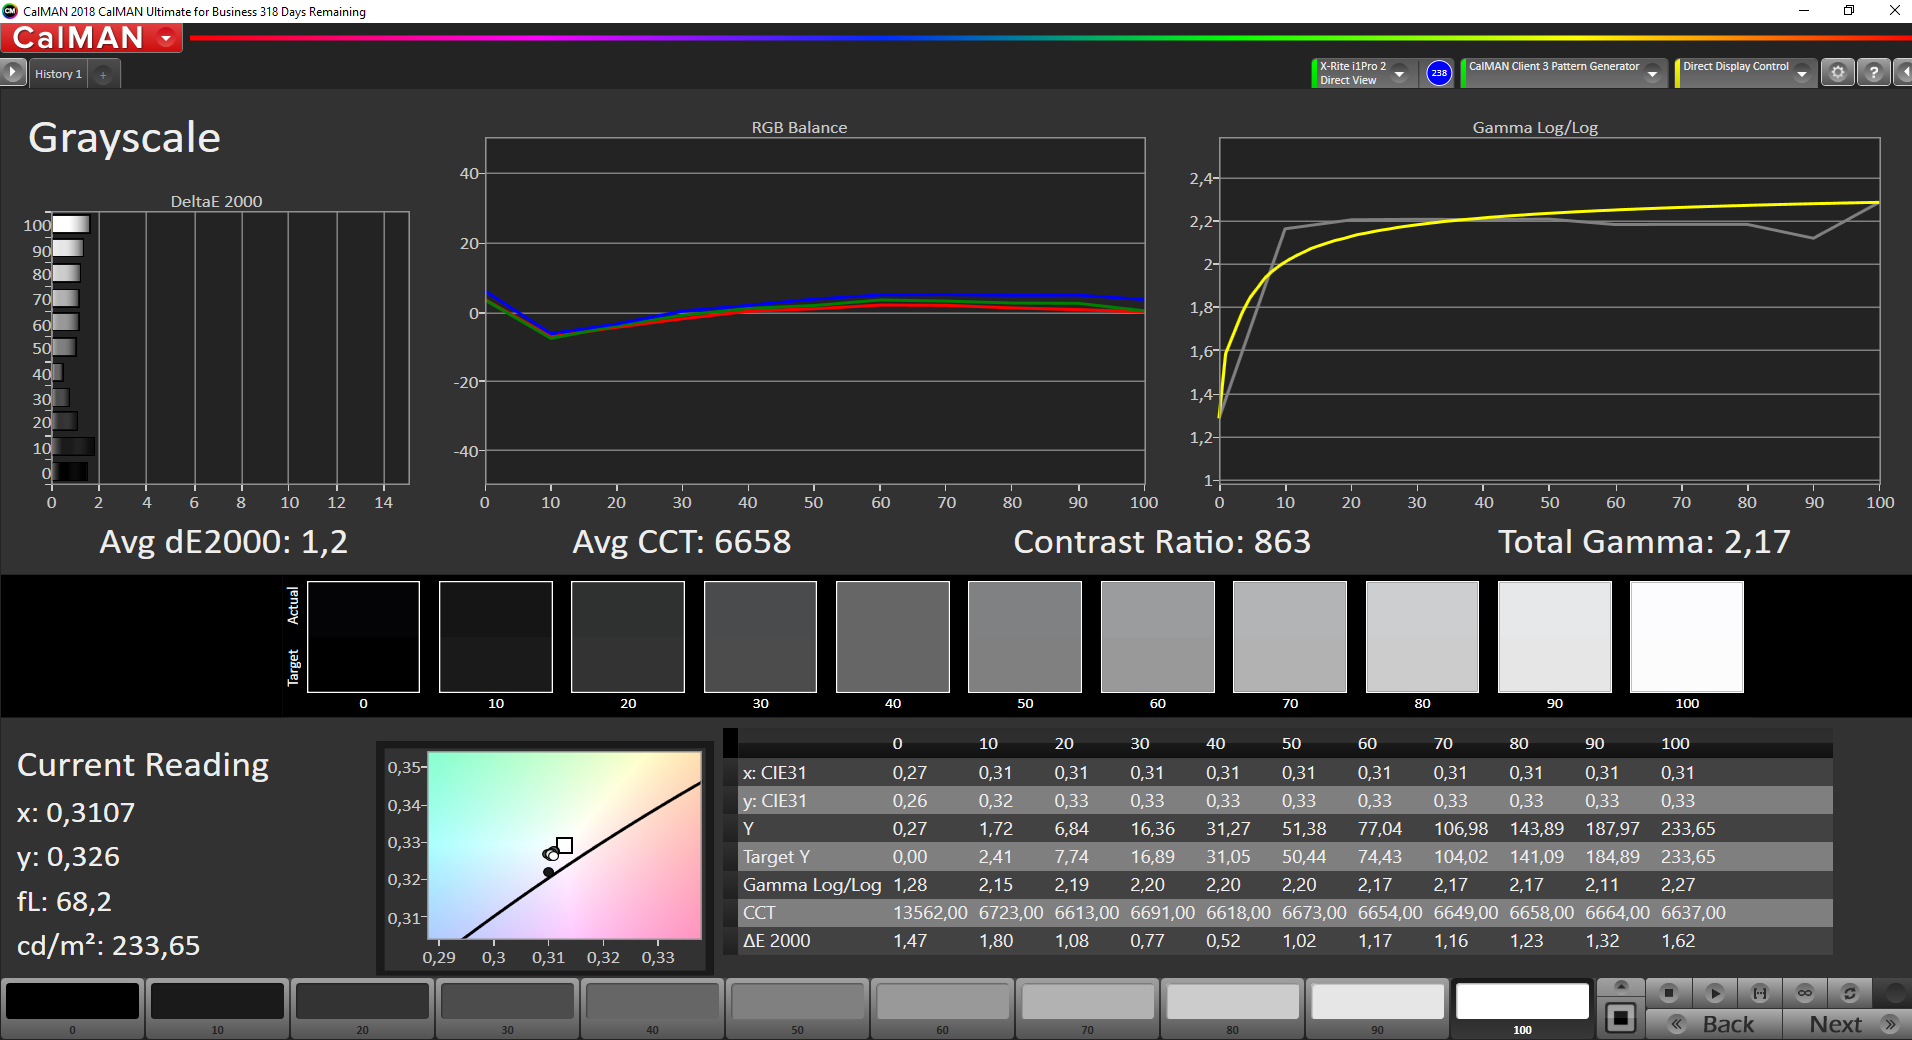
Contrast: 980:1 (Zwart: 0.25 cd/m²)
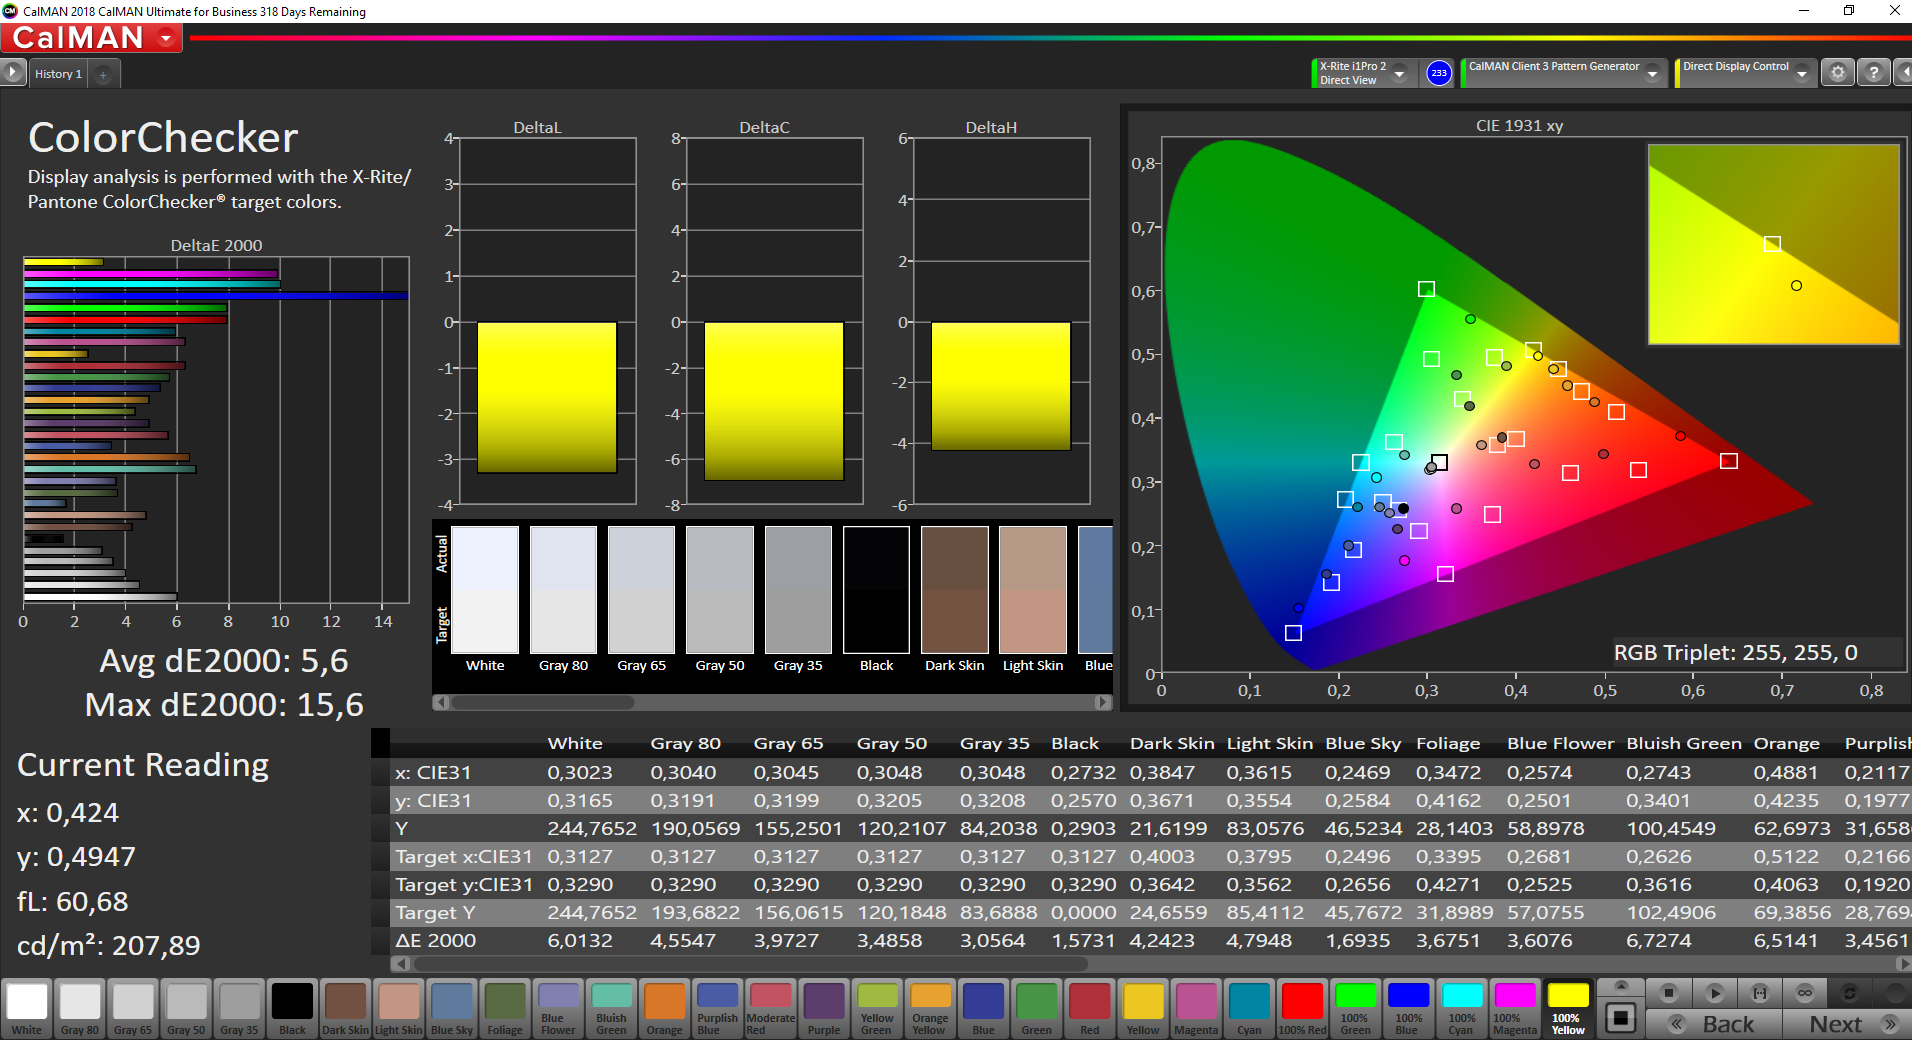
ΔE ColorChecker Calman: 5.6 | ∀{0.5-29.43 Ø4.71}
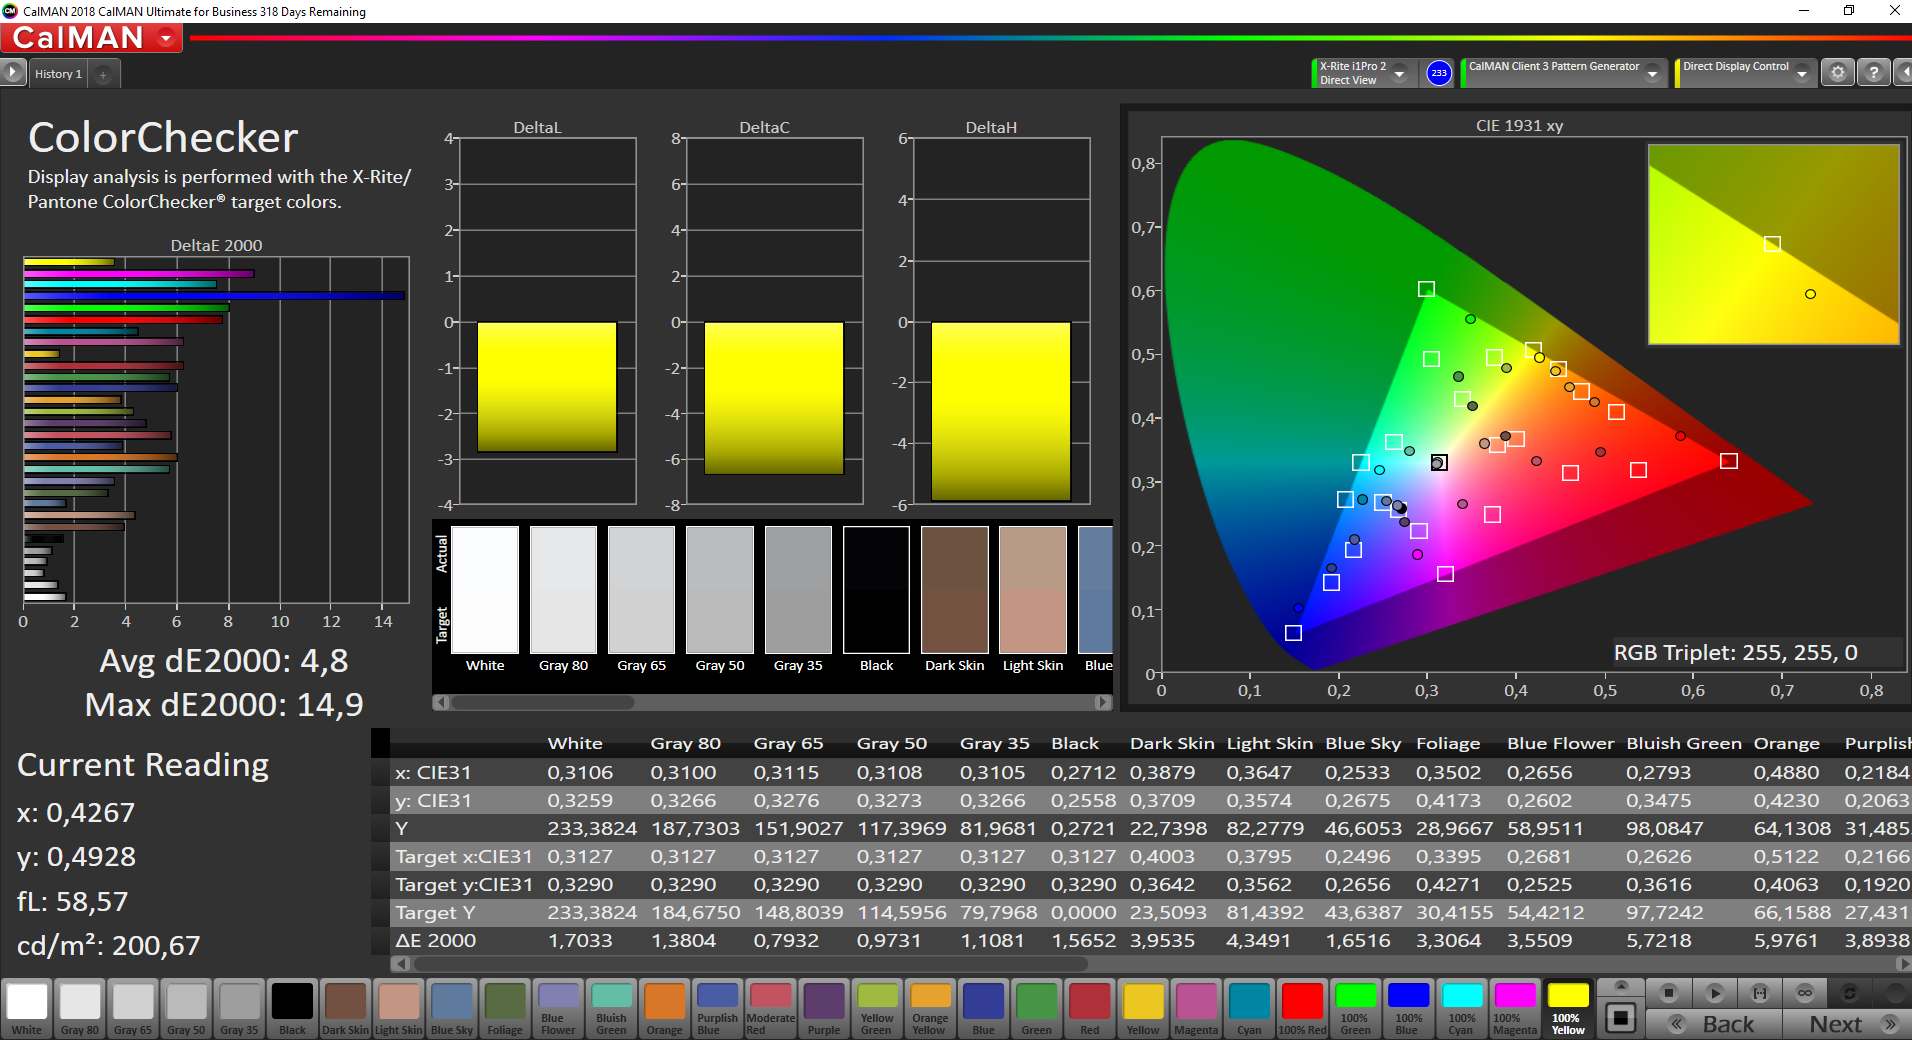
calibrated: 4.8
ΔE Greyscale Calman: 3.4 | ∀{0.09-98 Ø4.96}
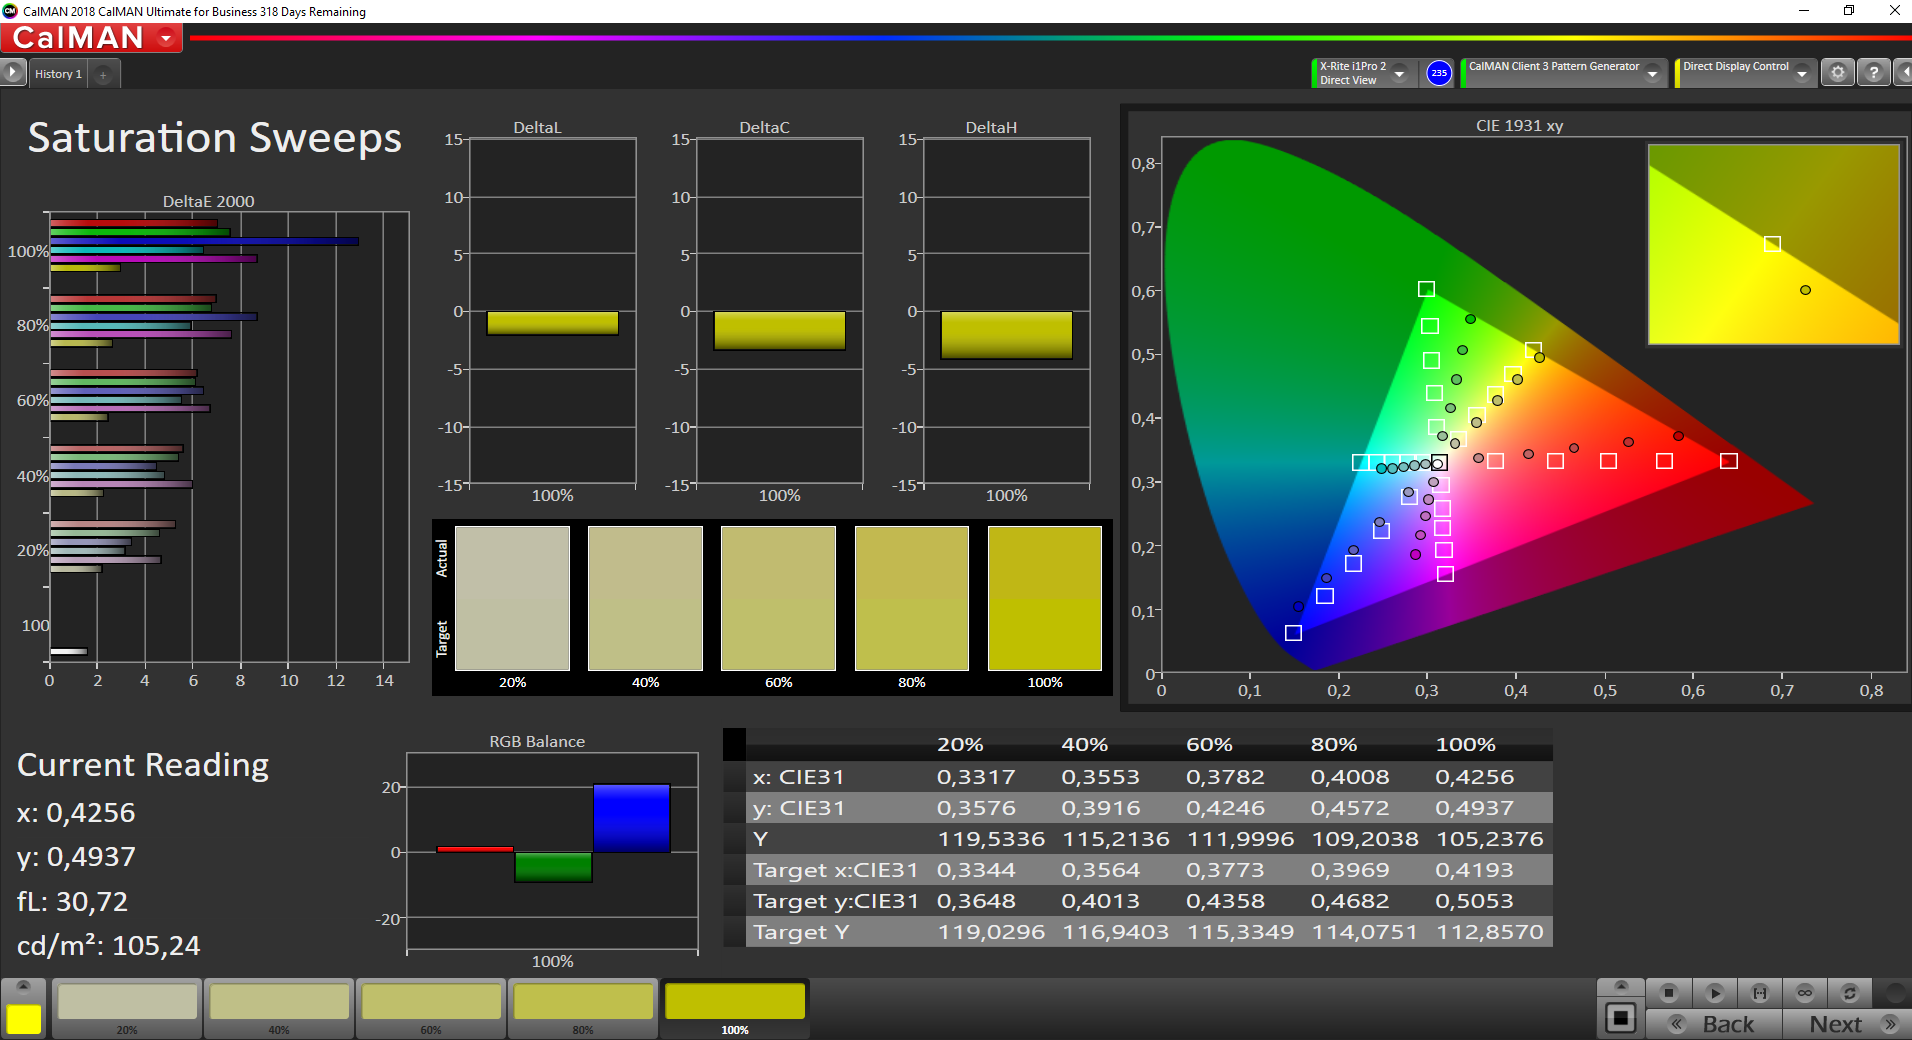
57.5% sRGB (Argyll 1.6.3 3D)
36.5% AdobeRGB 1998 (Argyll 1.6.3 3D)
39.67% AdobeRGB 1998 (Argyll 3D)
57.7% sRGB (Argyll 3D)
38.38% Display P3 (Argyll 3D)
Gamma: 2.3
CCT: 7156 K
| Lenovo ThinkBook 15 LP156WFC-SPD1, IPS, 1920x1080, 15.6" | Lenovo ThinkPad E595-20NF0000GE NV156FHM-N49, IPS, 1920x1080, 15.6" | Lenovo ThinkPad L590-20Q70019GE N156HCE-EAA, IPS, 1920x1080, 15.6" | Schenker Slim 15 L19 BOE CQ NV156FHM-N61, , 1920x1080, 15.6" | HP ProBook 450 G6-5TJ93EA Chi Mei CMN15FE, IPS, 1920x1080, 15.6" | Dell Latitude 15 3590 BOE0802 / NT15N41 / Dell: M9P74, TN LED, 1920x1080, 15.6" | |
|---|---|---|---|---|---|---|
| Display | 3% | 13% | 62% | 12% | 3% | |
| Display P3 Coverage (%) | 38.38 | 39.88 4% | 43.3 13% | 66.8 74% | 42.83 12% | 39.67 3% |
| sRGB Coverage (%) | 57.7 | 58.6 2% | 64.4 12% | 87.1 51% | 64.2 11% | 59.7 3% |
| AdobeRGB 1998 Coverage (%) | 39.67 | 41.2 4% | 44.81 13% | 63.7 61% | 44.29 12% | 40.99 3% |
| Response Times | -14% | -12% | -16% | 11% | 24% | |
| Response Time Grey 50% / Grey 80% * (ms) | 37.6 ? | 41.2 ? -10% | 42.8 ? -14% | 45 ? -20% | 34.4 ? 9% | 41 ? -9% |
| Response Time Black / White * (ms) | 28 ? | 32.8 ? -17% | 30.8 ? -10% | 31 ? -11% | 24.4 ? 13% | 12 ? 57% |
| PWM Frequency (Hz) | 1220 ? | 24510 ? | 250 ? | 26040 ? | 250 ? | |
| Screen | 18% | -1% | 13% | 8% | -40% | |
| Brightness middle (cd/m²) | 245 | 318 30% | 247 1% | 315 29% | 242 -1% | 215 -12% |
| Brightness (cd/m²) | 239 | 297 24% | 228 -5% | 294 23% | 226 -5% | 214 -10% |
| Brightness Distribution (%) | 82 | 89 9% | 81 -1% | 83 1% | 88 7% | 91 11% |
| Black Level * (cd/m²) | 0.25 | 0.17 32% | 0.18 28% | 0.29 -16% | 0.21 16% | 0.385 -54% |
| Contrast (:1) | 980 | 1871 91% | 1372 40% | 1086 11% | 1152 18% | 558 -43% |
| Colorchecker dE 2000 * | 5.6 | 5.5 2% | 5.9 -5% | 6 -7% | 4.7 16% | 10.31 -84% |
| Colorchecker dE 2000 max. * | 15.6 | 21 -35% | 22.9 -47% | 10.2 35% | 18.5 -19% | 20.44 -31% |
| Colorchecker dE 2000 calibrated * | 4.8 | 5.1 -6% | 4.7 2% | 3.1 35% | 4 17% | 3.88 19% |
| Greyscale dE 2000 * | 3.4 | 1.8 47% | 5.1 -50% | 6 -76% | 2.7 21% | 11.84 -248% |
| Gamma | 2.3 96% | 2.12 104% | 2.21 100% | 2.16 102% | 2.26 97% | 2.67 82% |
| CCT | 7156 91% | 6257 104% | 6398 102% | 8038 81% | 6442 101% | 13398 49% |
| Color Space (Percent of AdobeRGB 1998) (%) | 36.5 | 37.6 3% | 41.2 13% | 57 56% | 40.8 12% | 39 7% |
| Color Space (Percent of sRGB) (%) | 57.5 | 58.2 1% | 64.1 11% | 87 51% | 64 11% | 61 6% |
| Totaal Gemiddelde (Programma / Instellingen) | 2% /
11% | 0% /
0% | 20% /
19% | 10% /
9% | -4% /
-24% |
* ... kleiner is beter

Responstijd Scherm
| ↔ Responstijd Zwart naar Wit | ||
|---|---|---|
| 28 ms ... stijging ↗ en daling ↘ gecombineerd | ↗ 16.4 ms stijging | 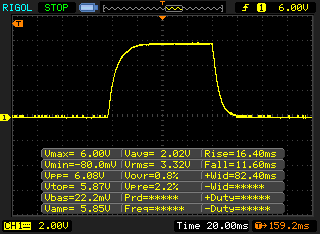 |
| ↘ 11.6 ms daling | ||
| Het scherm vertoonde relatief trage responstijden in onze tests en is misschien te traag voor games. Ter vergelijking: alle testtoestellen variëren van 0.1 (minimum) tot 240 (maximum) ms. » 71 % van alle toestellen zijn beter. Dit betekent dat de gemeten responstijd slechter is dan het gemiddelde (19.8 ms) van alle geteste toestellen. | ||
| ↔ Responstijd 50% Grijs naar 80% Grijs | ||
| 37.6 ms ... stijging ↗ en daling ↘ gecombineerd | ↗ 19.6 ms stijging | 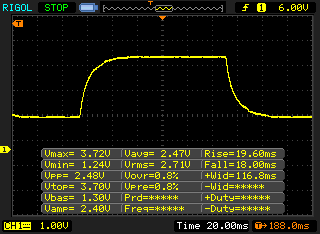 |
| ↘ 18 ms daling | ||
| Het scherm vertoonde trage responstijden in onze tests en is misschien te traag voor games. Ter vergelijking: alle testtoestellen variëren van 0.165 (minimum) tot 636 (maximum) ms. » 55 % van alle toestellen zijn beter. Dit betekent dat de gemeten responstijd slechter is dan het gemiddelde (31 ms) van alle geteste toestellen. | ||
Screen Flickering / PWM (Pulse-Width Modulation)
| Screen flickering / PWM niet waargenomen | 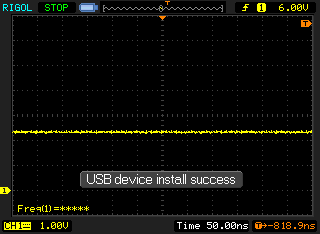 | ||
Ter vergelijking: 52 % van alle geteste toestellen maakten geen gebruik van PWM om de schermhelderheid te verlagen. Als het wel werd gebruikt, werd een gemiddelde van 7757 (minimum: 5 - maximum: 343500) Hz waargenomen. | |||
* ... kleiner is beter
| PCMark 8 Home Score Accelerated v2 | 4227 punten | |
| PCMark 8 Creative Score Accelerated v2 | 5312 punten | |
| PCMark 8 Work Score Accelerated v2 | 5102 punten | |
| PCMark 10 Score | 4248 punten | |
Help | ||
| Lenovo ThinkBook 15 Samsung SSD PM981 MZVLB512HAJQ | Lenovo ThinkPad E595-20NF0000GE SK Hynix BC501 HFM512GDJTNG | Lenovo ThinkPad L590-20Q70019GE Toshiba XG6 KXG6AZNV512G | Schenker Slim 15 L19 Samsung SSD 970 EVO Plus 500GB | HP ProBook 450 G6-5TJ93EA Samsung SSD PM981 MZVLB512HAJQ | Dell Latitude 15 3590 Samsung SSD PM871b MZ7LN256HAJQ | Gemiddeld Samsung SSD PM981 MZVLB512HAJQ | |
|---|---|---|---|---|---|---|---|
| CrystalDiskMark 5.2 / 6 | -38% | -27% | 1% | -12% | -60% | -12% | |
| Write 4K (MB/s) | 176.3 | 129.5 -27% | 115.3 -35% | 188.7 7% | 126.1 -28% | 79.5 -55% | 126.7 ? -28% |
| Read 4K (MB/s) | 48.98 | 41.23 -16% | 43.34 -12% | 51.9 6% | 43.92 -10% | 32.72 -33% | 44 ? -10% |
| Write Seq (MB/s) | 1789 | 811 -55% | 1014 -43% | 1566 -12% | 1669 -7% | 472.5 -74% | 1617 ? -10% |
| Read Seq (MB/s) | 1671 | 1145 -31% | 1481 -11% | 1452 -13% | 2224 33% | 504 -70% | 1716 ? 3% |
| Write 4K Q32T1 (MB/s) | 433.5 | 314.1 -28% | 495.4 14% | 444 2% | 410.4 -5% | 322.6 -26% | 413 ? -5% |
| Read 4K Q32T1 (MB/s) | 526 | 356.2 -32% | 332.6 -37% | 566 8% | 338.1 -36% | 249.9 -52% | 420 ? -20% |
| Write Seq Q32T1 (MB/s) | 2983 | 839 -72% | 1654 -45% | 3279 10% | 1979 -34% | 531 -82% | 2076 ? -30% |
| Read Seq Q32T1 (MB/s) | 3555 | 2042 -43% | 1746 -51% | 3558 0% | 3368 -5% | 544 -85% | 3130 ? -12% |
| Write 4K Q8T8 (MB/s) | 1688 | 1033 -39% | 1264 ? -25% | ||||
| Read 4K Q8T8 (MB/s) | 1036 | 892 -14% | 1193 ? 15% | ||||
| AS SSD | -43% | -33% | -66% | -71% | -31% | ||
| Seq Read (MB/s) | 2564 | 1698 -34% | 1383 -46% | 2063 -20% | 498.7 -81% | 1976 ? -23% | |
| Seq Write (MB/s) | 2268 | 740 -67% | 852 -62% | 1163 -49% | 361.7 -84% | 1637 ? -28% | |
| 4K Read (MB/s) | 57 | 39.18 -31% | 45.72 -20% | 50.6 -11% | 34.65 -39% | 50.5 ? -11% | |
| 4K Write (MB/s) | 141.4 | 87.7 -38% | 120.2 -15% | 125.4 -11% | 79.8 -44% | 112 ? -21% | |
| 4K-64 Read (MB/s) | 1175 | 764 -35% | 1344 14% | 1352 15% | 372.5 -68% | 1203 ? 2% | |
| 4K-64 Write (MB/s) | 1665 | 669 -60% | 926 -44% | 1023 -39% | 247.7 -85% | 1504 ? -10% | |
| Access Time Read * (ms) | 0.032 | 0.04 -25% | 0.063 -97% | 0.044 -38% | 0.06 -88% | 0.05092 ? -59% | |
| Access Time Write * (ms) | 0.025 | 0.036 -44% | 0.036 -44% | 0.182 -628% | 0.042 -68% | 0.08337 ? -233% | |
| Score Read (Points) | 1488 | 973 -35% | 1528 3% | 1608 8% | 457 -69% | 1451 ? -2% | |
| Score Write (Points) | 2033 | 831 -59% | 1132 -44% | 1265 -38% | 364 -82% | 1780 ? -12% | |
| Score Total (Points) | 4279 | 2261 -47% | 3420 -20% | 3658 -15% | 1060 -75% | 3966 ? -7% | |
| Copy ISO MB/s (MB/s) | 2118 | 1147 -46% | 1382 -35% | 1755 ? -17% | |||
| Copy Program MB/s (MB/s) | 495.6 | 419.8 -15% | 414.3 -16% | 454 ? -8% | |||
| Copy Game MB/s (MB/s) | 1174 | 928 -21% | 660 -44% | 1057 ? -10% | |||
| Totaal Gemiddelde (Programma / Instellingen) | -41% /
-41% | -30% /
-30% | 1% /
1% | -39% /
-46% | -66% /
-66% | -22% /
-23% |
* ... kleiner is beter

| 3DMark 11 - 1280x720 Performance GPU | |
| Gemiddelde van klas Office (2551 - 18313, n=72, laatste 2 jaar) | |
| Lenovo ThinkPad E595-20NF0000GE | |
| HP ProBook 450 G6-5TJ93EA | |
| Lenovo ThinkBook 15 | |
| Schenker Slim 15 L19 | |
| Gemiddeld Intel UHD Graphics 620 (1144 - 3432, n=244) | |
| Lenovo ThinkPad L590-20Q70019GE | |
| Dell Latitude 15 3590 | |
| 3DMark | |
| 1280x720 Cloud Gate Standard Graphics | |
| Gemiddelde van klas Office (11640 - 118515, n=38, laatste 2 jaar) | |
| Lenovo ThinkPad E595-20NF0000GE | |
| HP ProBook 450 G6-5TJ93EA | |
| Lenovo ThinkBook 15 | |
| Schenker Slim 15 L19 | |
| Gemiddeld Intel UHD Graphics 620 (6205 - 16400, n=225) | |
| Lenovo ThinkPad L590-20Q70019GE | |
| Dell Latitude 15 3590 | |
| 1920x1080 Fire Strike Graphics | |
| Gemiddelde van klas Office (736 - 21871, n=75, laatste 2 jaar) | |
| HP ProBook 450 G6-5TJ93EA | |
| Lenovo ThinkPad E595-20NF0000GE | |
| Lenovo ThinkBook 15 | |
| Schenker Slim 15 L19 | |
| Gemiddeld Intel UHD Graphics 620 (557 - 2608, n=213) | |
| Lenovo ThinkPad L590-20Q70019GE | |
| Dell Latitude 15 3590 | |
| 2560x1440 Time Spy Graphics | |
| Gemiddelde van klas Office (493 - 6679, n=70, laatste 2 jaar) | |
| Lenovo ThinkBook 15 | |
| Schenker Slim 15 L19 | |
| Gemiddeld Intel UHD Graphics 620 (299 - 797, n=88) | |
| Lenovo ThinkPad L590-20Q70019GE | |
| 3DMark 11 Performance | 2165 punten | |
| 3DMark Ice Storm Standard Score | 68444 punten | |
| 3DMark Cloud Gate Standard Score | 8887 punten | |
| 3DMark Fire Strike Score | 1182 punten | |
| 3DMark Fire Strike Extreme Score | 528 punten | |
| 3DMark Time Spy Score | 484 punten | |
Help | ||
| lage | gem. | hoge | ultra | |
|---|---|---|---|---|
| BioShock Infinite (2013) | 81.9 | 40.3 | 33.2 | 10.8 |
| Dota 2 Reborn (2015) | 84.6 | 53.7 | 21.9 | 19.6 |
| Rise of the Tomb Raider (2016) | 23.6 | 15.6 | 8.03 | |
| X-Plane 11.11 (2018) | 11.5 | 13.4 | 12.4 |
Geluidsniveau
| Onbelast |
| 29.2 / 29.2 / 29.9 dB (A) |
| Belasting |
| 30.6 / 33.8 dB (A) |
 | ||
30 dB stil 40 dB(A) hoorbaar 50 dB(A) luid |
||
min: | ||
| Lenovo ThinkBook 15 UHD Graphics 620, i5-10210U, Samsung SSD PM981 MZVLB512HAJQ | Lenovo ThinkPad E595-20NF0000GE Vega 10, R7 3700U, SK Hynix BC501 HFM512GDJTNG | Lenovo ThinkPad L590-20Q70019GE UHD Graphics 620, i5-8265U, Toshiba XG6 KXG6AZNV512G | Schenker Slim 15 L19 UHD Graphics 620, i5-10210U, Samsung SSD 970 EVO Plus 500GB | HP ProBook 450 G6-5TJ93EA GeForce MX130, i7-8565U, Samsung SSD PM981 MZVLB512HAJQ | Dell Latitude 15 3590 UHD Graphics 620, i5-8250U, Samsung SSD PM871b MZ7LN256HAJQ | |
|---|---|---|---|---|---|---|
| Noise | -1% | 2% | -13% | -3% | -12% | |
| uit / omgeving * (dB) | 29.2 | 29.3 -0% | 29 1% | 30.6 -5% | 29 1% | 30.6 -5% |
| Idle Minimum * (dB) | 29.2 | 29.3 -0% | 29 1% | 30.6 -5% | 29 1% | 30.6 -5% |
| Idle Average * (dB) | 29.2 | 29.3 -0% | 29 1% | 30.6 -5% | 29 1% | 31.9 -9% |
| Idle Maximum * (dB) | 29.9 | 30.1 -1% | 29 3% | 30.6 -2% | 29 3% | 31.9 -7% |
| Load Average * (dB) | 30.6 | 30.9 -1% | 29 5% | 40.5 -32% | 34.2 -12% | 39 -27% |
| Load Maximum * (dB) | 33.8 | 35.2 -4% | 33.8 -0% | 42.7 -26% | 38.4 -14% | 39.1 -16% |
| Witcher 3 ultra * (dB) | 34.2 |
* ... kleiner is beter
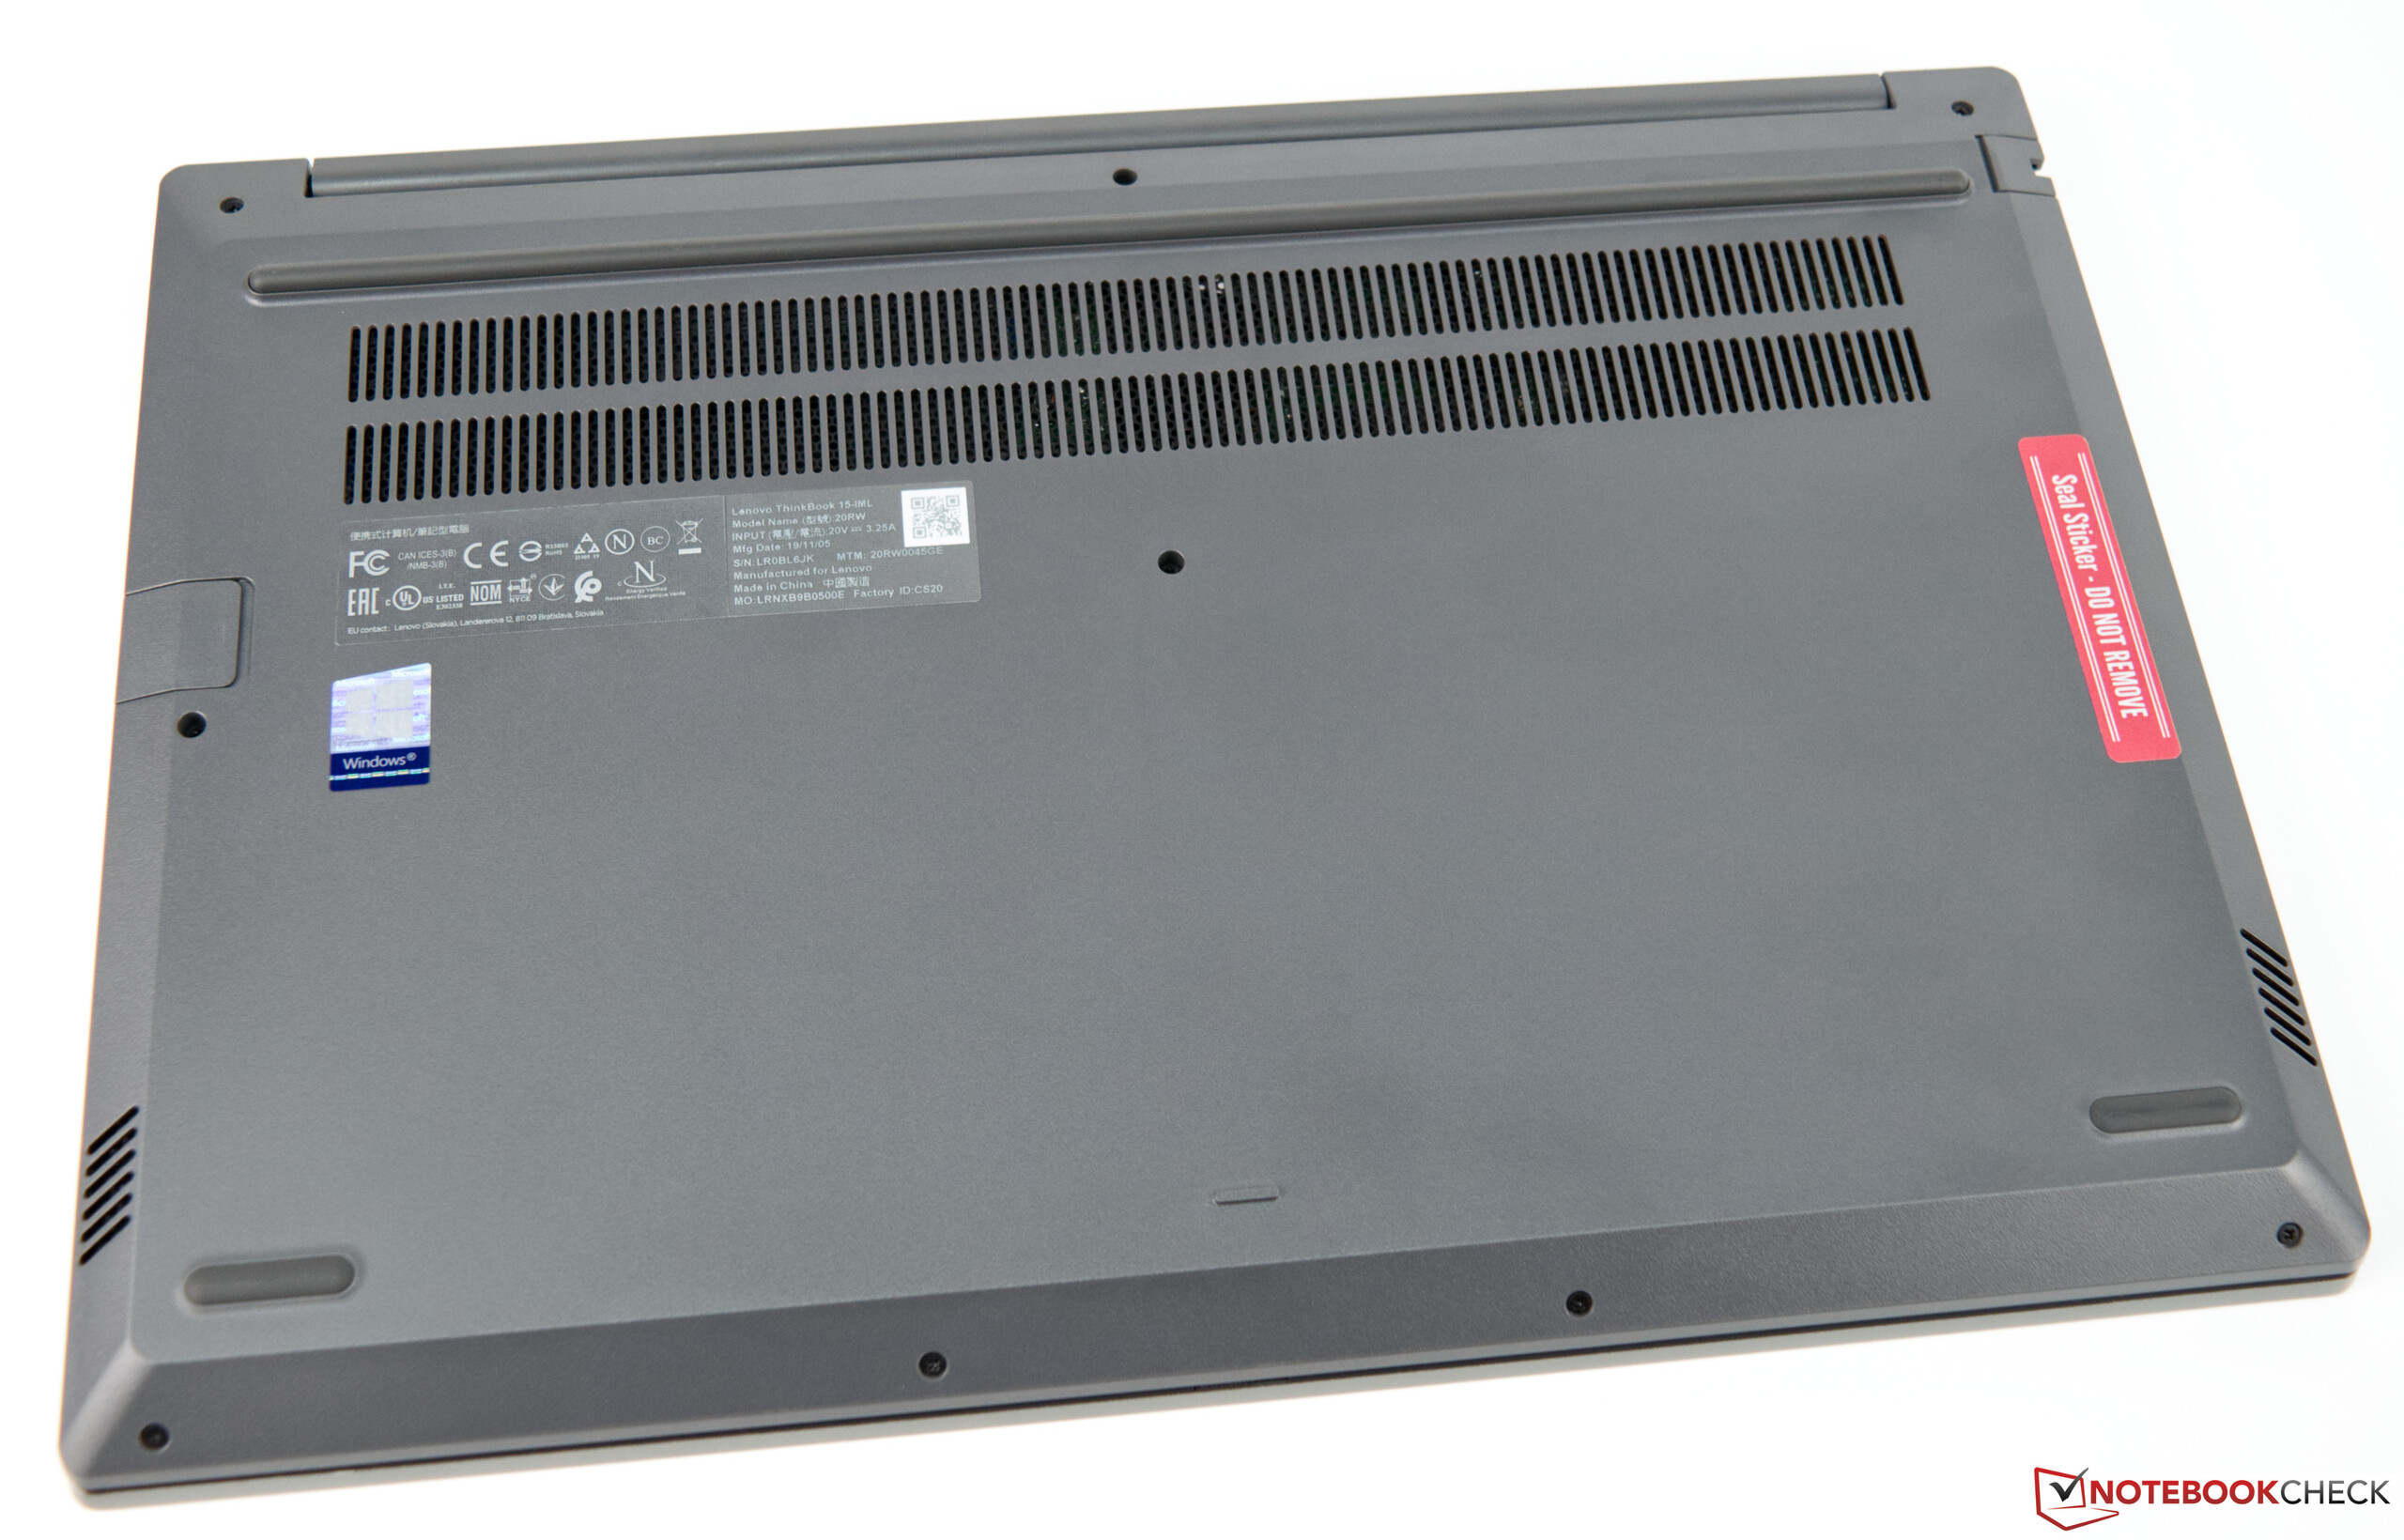
(+) De maximumtemperatuur aan de bovenzijde bedraagt 38 °C / 100 F, vergeleken met het gemiddelde van 34.3 °C / 94 F, variërend van 21.2 tot 62.5 °C voor de klasse Office.
(±) De bodem warmt op tot een maximum van 43.9 °C / 111 F, vergeleken met een gemiddelde van 36.8 °C / 98 F
(+) Bij onbelast gebruik bedraagt de gemiddelde temperatuur voor de bovenzijde 23.5 °C / 74 F, vergeleken met het apparaatgemiddelde van 29.5 °C / 85 F.
(+) De palmsteunen en het touchpad zijn met een maximum van ###max## °C / 82 F koeler dan de huidtemperatuur en voelen daarom koel aan.
(±) De gemiddelde temperatuur van de handpalmsteun van soortgelijke toestellen bedroeg 27.5 °C / 81.5 F (-0.3 °C / -0.5 F).
| Lenovo ThinkBook 15 UHD Graphics 620, i5-10210U, Samsung SSD PM981 MZVLB512HAJQ | Lenovo ThinkPad E595-20NF0000GE Vega 10, R7 3700U, SK Hynix BC501 HFM512GDJTNG | Lenovo ThinkPad L590-20Q70019GE UHD Graphics 620, i5-8265U, Toshiba XG6 KXG6AZNV512G | Schenker Slim 15 L19 UHD Graphics 620, i5-10210U, Samsung SSD 970 EVO Plus 500GB | HP ProBook 450 G6-5TJ93EA GeForce MX130, i7-8565U, Samsung SSD PM981 MZVLB512HAJQ | Dell Latitude 15 3590 UHD Graphics 620, i5-8250U, Samsung SSD PM871b MZ7LN256HAJQ | |
|---|---|---|---|---|---|---|
| Heat | -20% | -11% | 1% | -2% | 1% | |
| Maximum Upper Side * (°C) | 38 | 48.8 -28% | 42.7 -12% | 37 3% | 39.4 -4% | 40.6 -7% |
| Maximum Bottom * (°C) | 43.9 | 48.4 -10% | 51 -16% | 43.1 2% | 50.2 -14% | 37.5 15% |
| Idle Upper Side * (°C) | 24.5 | 29.1 -19% | 25.9 -6% | 25.1 -2% | 22.9 7% | 26.3 -7% |
| Idle Bottom * (°C) | 25.4 | 31 -22% | 28.3 -11% | 25.1 1% | 24.1 5% | 25.2 1% |
* ... kleiner is beter
Lenovo ThinkBook 15 audioanalyse
(-) | niet erg luide luidsprekers (68.9 dB)
Bas 100 - 315 Hz
(-) | bijna geen lage tonen - gemiddeld 18.4% lager dan de mediaan
(±) | lineariteit van de lage tonen is gemiddeld (7.3% delta ten opzichte van de vorige frequentie)
Midden 400 - 2000 Hz
(±) | hogere middens - gemiddeld 8.1% hoger dan de mediaan
(±) | lineariteit van de middentonen is gemiddeld (12.5% delta ten opzichte van de vorige frequentie)
Hoog 2 - 16 kHz
(±) | higher highs - on average 6.1% higher than median
(±) | lineariteit van de hoogtepunten is gemiddeld (13.1% delta ten opzichte van de vorige frequentie)
Algemeen 100 - 16.000 Hz
(-) | het totale geluid is niet lineair (38.1% verschil met de mediaan)
Vergeleken met dezelfde klasse
» 98% van alle geteste apparaten in deze klasse waren beter, 1% vergelijkbaar, 1% slechter
» De beste had een delta van 7%, het gemiddelde was 21%, de slechtste was 53%
Vergeleken met alle geteste toestellen
» 95% van alle geteste apparaten waren beter, 1% gelijk, 5% slechter
» De beste had een delta van 4%, het gemiddelde was 23%, de slechtste was 134%
Schenker Slim 15 L19 audioanalyse
(-) | niet erg luide luidsprekers (70.7 dB)
Bas 100 - 315 Hz
(-) | bijna geen lage tonen - gemiddeld 30.1% lager dan de mediaan
(+) | de lage tonen zijn lineair (6.4% delta naar de vorige frequentie)
Midden 400 - 2000 Hz
(±) | hogere middens - gemiddeld 8.7% hoger dan de mediaan
(±) | lineariteit van de middentonen is gemiddeld (11.6% delta ten opzichte van de vorige frequentie)
Hoog 2 - 16 kHz
(+) | evenwichtige hoogtepunten - slechts 4.6% verwijderd van de mediaan
(+) | de hoge tonen zijn lineair (6.5% delta naar de vorige frequentie)
Algemeen 100 - 16.000 Hz
(-) | het totale geluid is niet lineair (32.4% verschil met de mediaan)
Vergeleken met dezelfde klasse
» 95% van alle geteste apparaten in deze klasse waren beter, 1% vergelijkbaar, 4% slechter
» De beste had een delta van 7%, het gemiddelde was 21%, de slechtste was 53%
Vergeleken met alle geteste toestellen
» 92% van alle geteste apparaten waren beter, 1% gelijk, 7% slechter
» De beste had een delta van 4%, het gemiddelde was 23%, de slechtste was 134%
| Uit / Standby | |
| Inactief | |
| Belasting |
|
Key:
min: | |
| Lenovo ThinkBook 15 i5-10210U, UHD Graphics 620, Samsung SSD PM981 MZVLB512HAJQ, IPS, 1920x1080, 15.6" | Lenovo ThinkPad E595-20NF0000GE R7 3700U, Vega 10, SK Hynix BC501 HFM512GDJTNG, IPS, 1920x1080, 15.6" | Lenovo ThinkPad L590-20Q70019GE i5-8265U, UHD Graphics 620, Toshiba XG6 KXG6AZNV512G, IPS, 1920x1080, 15.6" | Schenker Slim 15 L19 i5-10210U, UHD Graphics 620, Samsung SSD 970 EVO Plus 500GB, , 1920x1080, 15.6" | HP ProBook 450 G6-5TJ93EA i7-8565U, GeForce MX130, Samsung SSD PM981 MZVLB512HAJQ, IPS, 1920x1080, 15.6" | Dell Latitude 15 3590 i5-8250U, UHD Graphics 620, Samsung SSD PM871b MZ7LN256HAJQ, TN LED, 1920x1080, 15.6" | Gemiddeld Intel UHD Graphics 620 | Gemiddelde van klas Office | |
|---|---|---|---|---|---|---|---|---|
| Power Consumption | 5% | 3% | -23% | -11% | 3% | 4% | -9% | |
| Idle Minimum * (Watt) | 3.5 | 4.2 -20% | 3.96 -13% | 5.5 -57% | 3.12 11% | 4.3 -23% | 3.81 ? -9% | 4.26 ? -22% |
| Idle Average * (Watt) | 7.1 | 7.92 -12% | 6.9 3% | 8.9 -25% | 6.3 11% | 7.2 -1% | 6.94 ? 2% | 7.31 ? -3% |
| Idle Maximum * (Watt) | 7.8 | 8.16 -5% | 9.8 -26% | 9.1 -17% | 9.78 -25% | 9.8 -26% | 8.75 ? -12% | 8.55 ? -10% |
| Load Average * (Watt) | 38.9 | 29 25% | 31.4 19% | 47 -21% | 57.6 -48% | 38 2% | 35 ? 10% | 43.8 ? -13% |
| Load Maximum * (Watt) | 65.4 | 42.2 35% | 45.4 31% | 61.2 6% | 67.3 -3% | 24 63% | 47.5 ? 27% | 64.5 ? 1% |
| Witcher 3 ultra * (Watt) | 42 |
* ... kleiner is beter


| Lenovo ThinkBook 15 i5-10210U, UHD Graphics 620, 45 Wh | Lenovo ThinkPad E595-20NF0000GE R7 3700U, Vega 10, 45 Wh | Lenovo ThinkPad L590-20Q70019GE i5-8265U, UHD Graphics 620, 45 Wh | Schenker Slim 15 L19 i5-10210U, UHD Graphics 620, Wh | HP ProBook 450 G6-5TJ93EA i7-8565U, GeForce MX130, 45 Wh | Dell Latitude 15 3590 i5-8250U, UHD Graphics 620, 56 Wh | Gemiddelde van klas Office | |
|---|---|---|---|---|---|---|---|
| Batterijduur | 6% | 30% | -9% | 21% | 35% | 68% | |
| Reader / Idle (h) | 17.9 | 15.7 -12% | 17.4 -3% | 14.6 -18% | 20.2 13% | 24.5 ? 37% | |
| H.264 (h) | 7 | 8.6 23% | 9 29% | 7.7 10% | 10.3 47% | 15.5 ? 121% | |
| WiFi v1.3 (h) | 6.8 | 7.7 13% | 7.2 6% | 6.2 -9% | 9.7 43% | 9.1 34% | 13.2 ? 94% |
| Load (h) | 1.5 | 1.5 0% | 2.8 87% | 2.2 47% | 2.2 47% | 1.808 ? 21% |
Pro
Contra
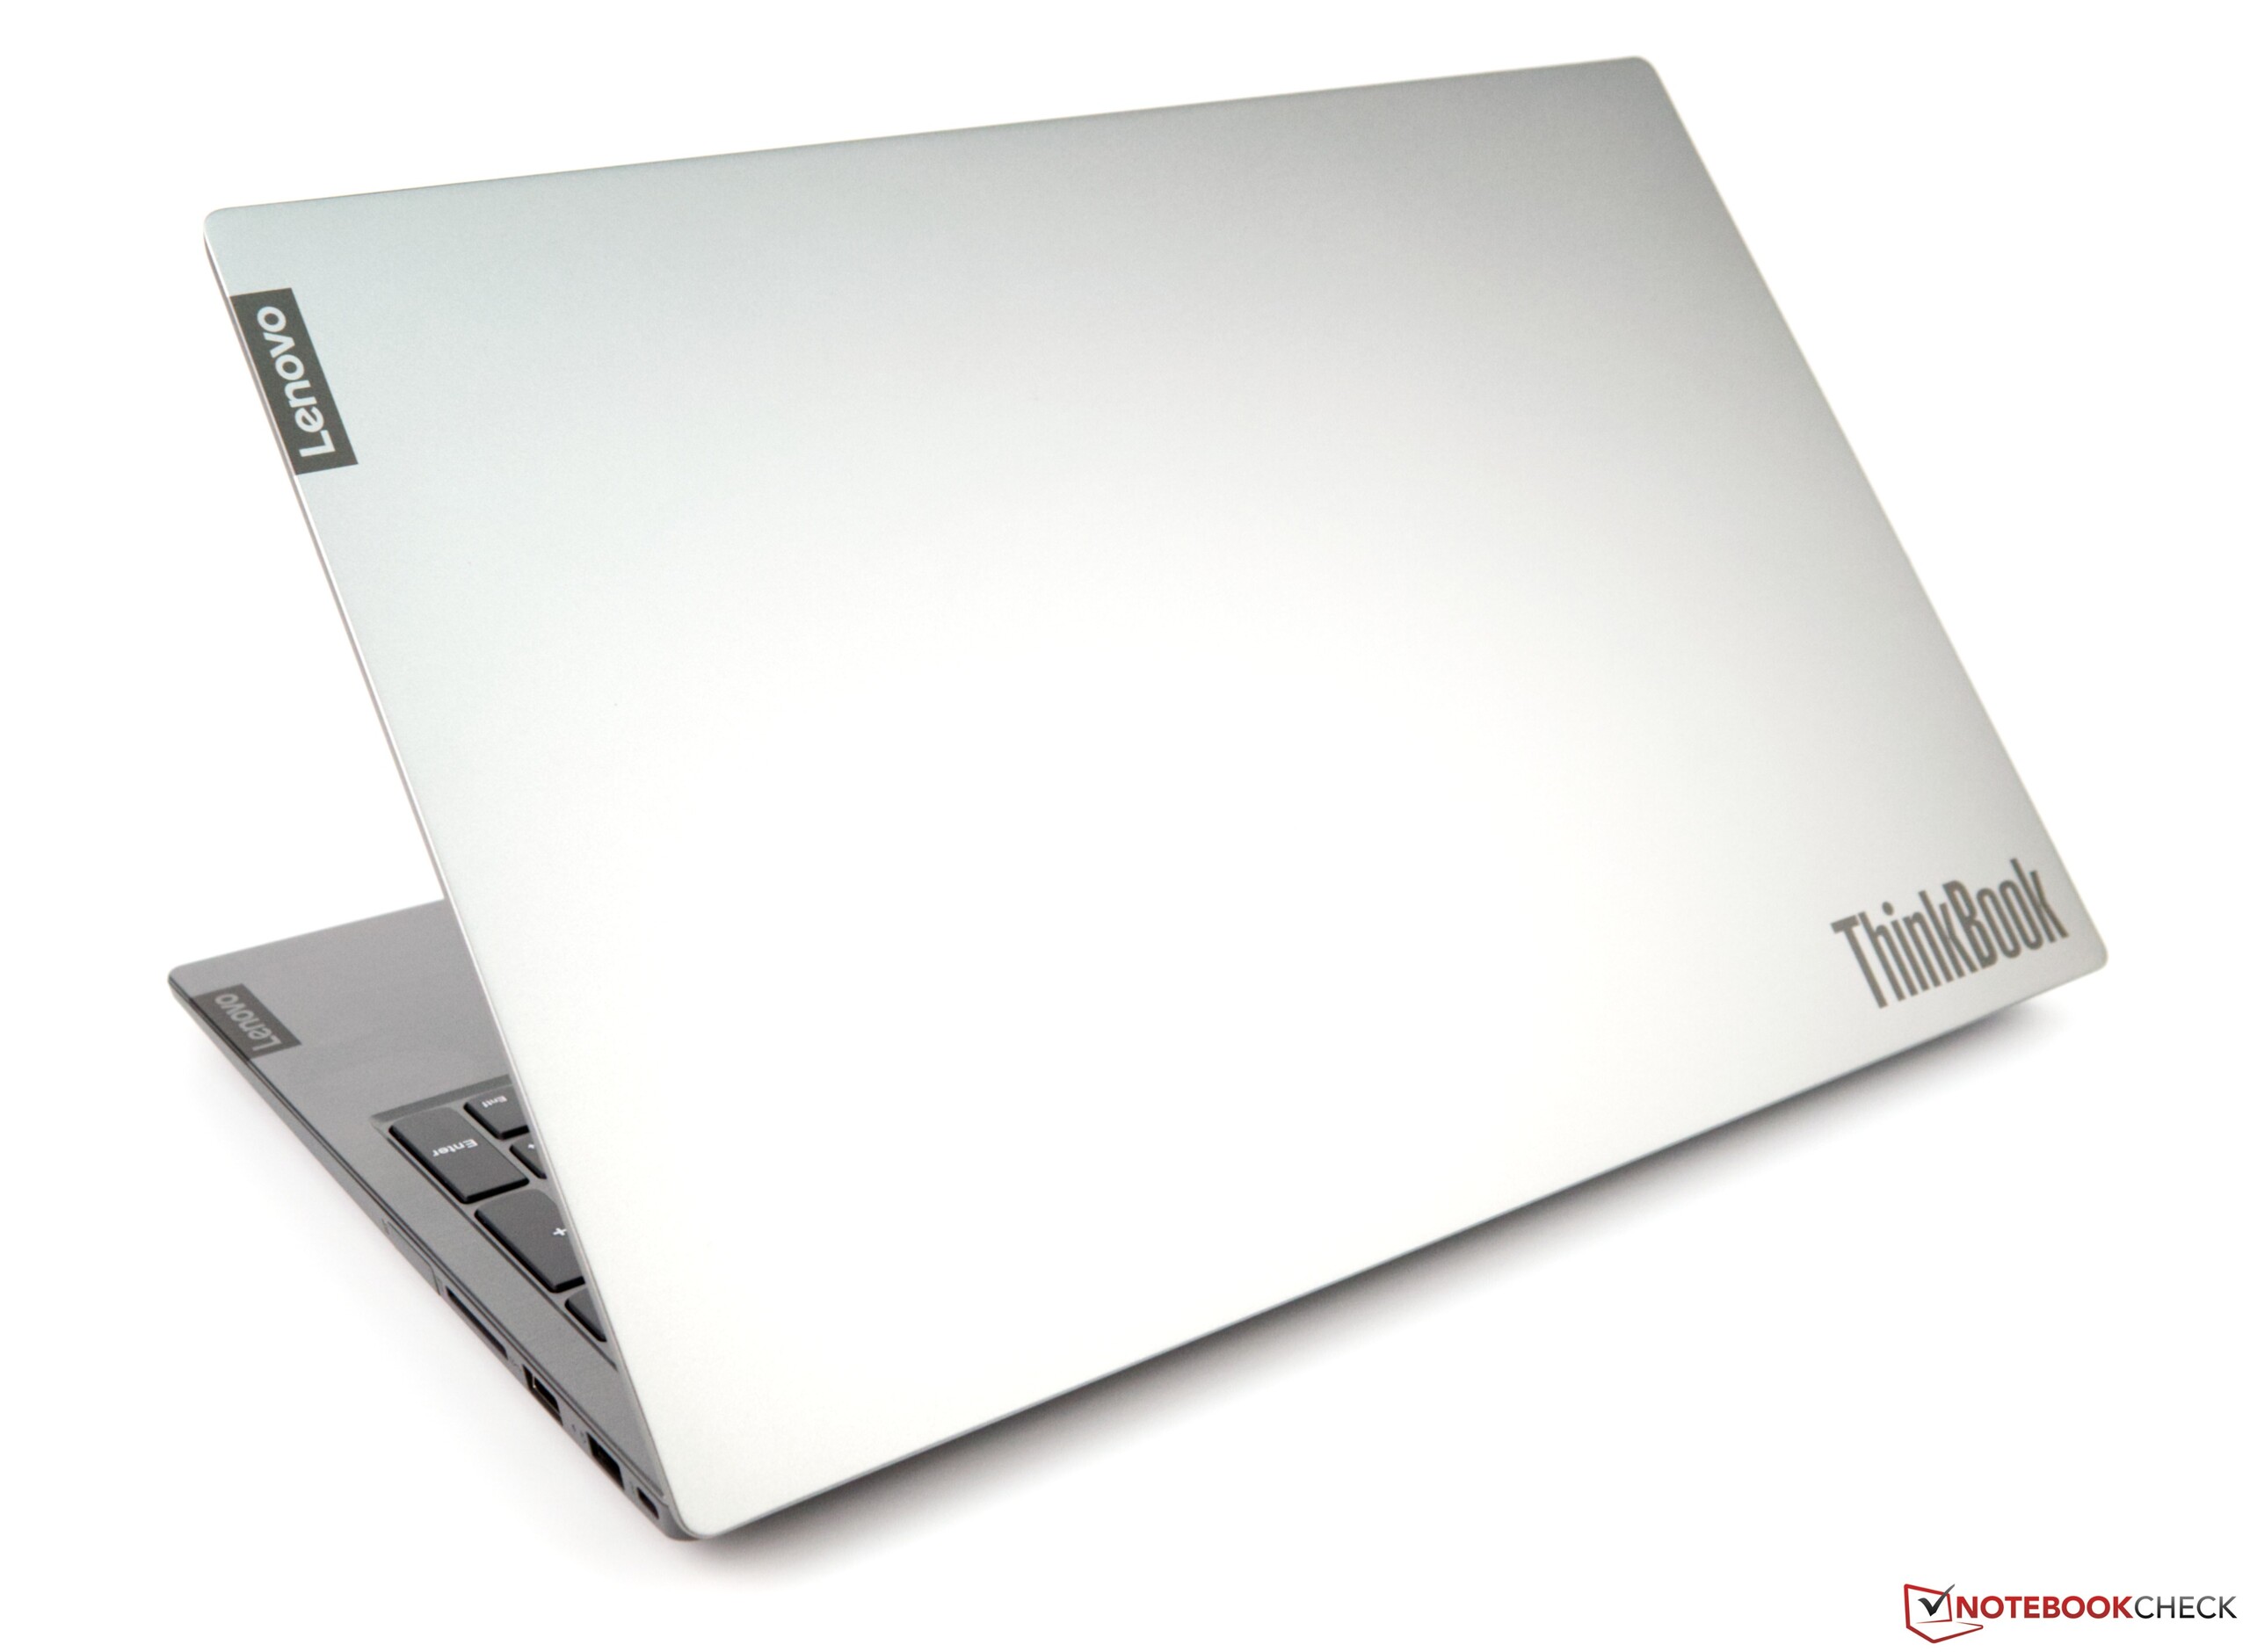
Verdict - A solid work tool in a modern guise
Voor het volledige, Engelse testrapport, klik hier.
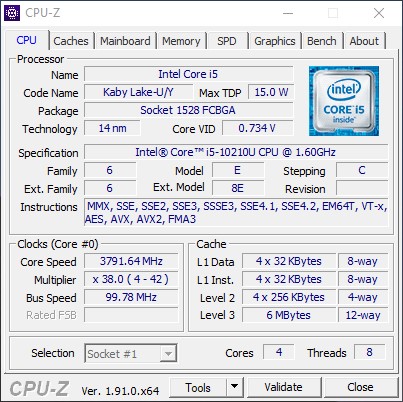
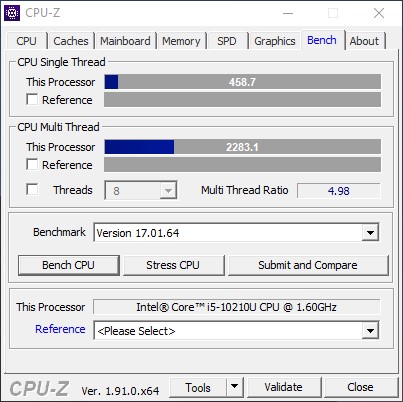
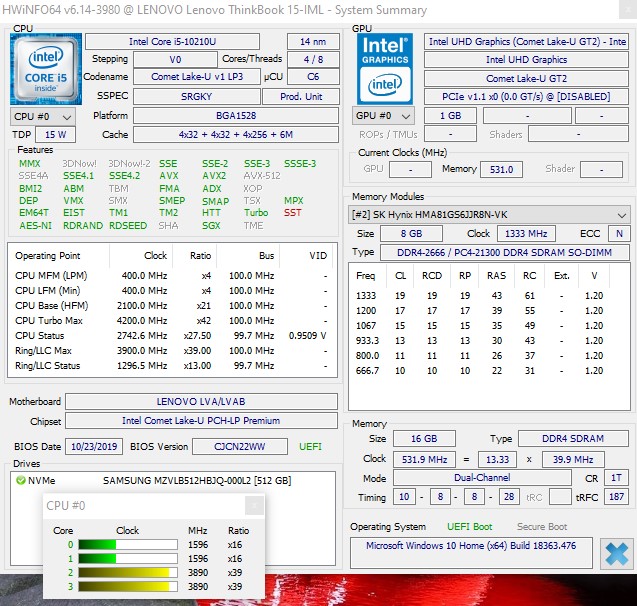
De ThinkBook 15 is een eenvoudige kantoorlaptop die goed scoort vanwege zijn moderne ontwerp en goede invoerapparaten. De Comet Lake-processor biedt ook een kleine prestatieverbetering ten opzichte van zijn Kaby Lake- en Whiskey Lake-voorgangers. De Core i5-10210U in ons testmodel is altijd in staat om algemene taken te doorstaan. Kortom, de CPU maakt de ThinkBook 15 bijvoorbeeld geschikt voor gebruik als een thuiskantoorlaptop. De overvloedige 16 GB RAM en de snelle 512 GB NVMe SSD zorgen ervoor dat alles blijft draaien.
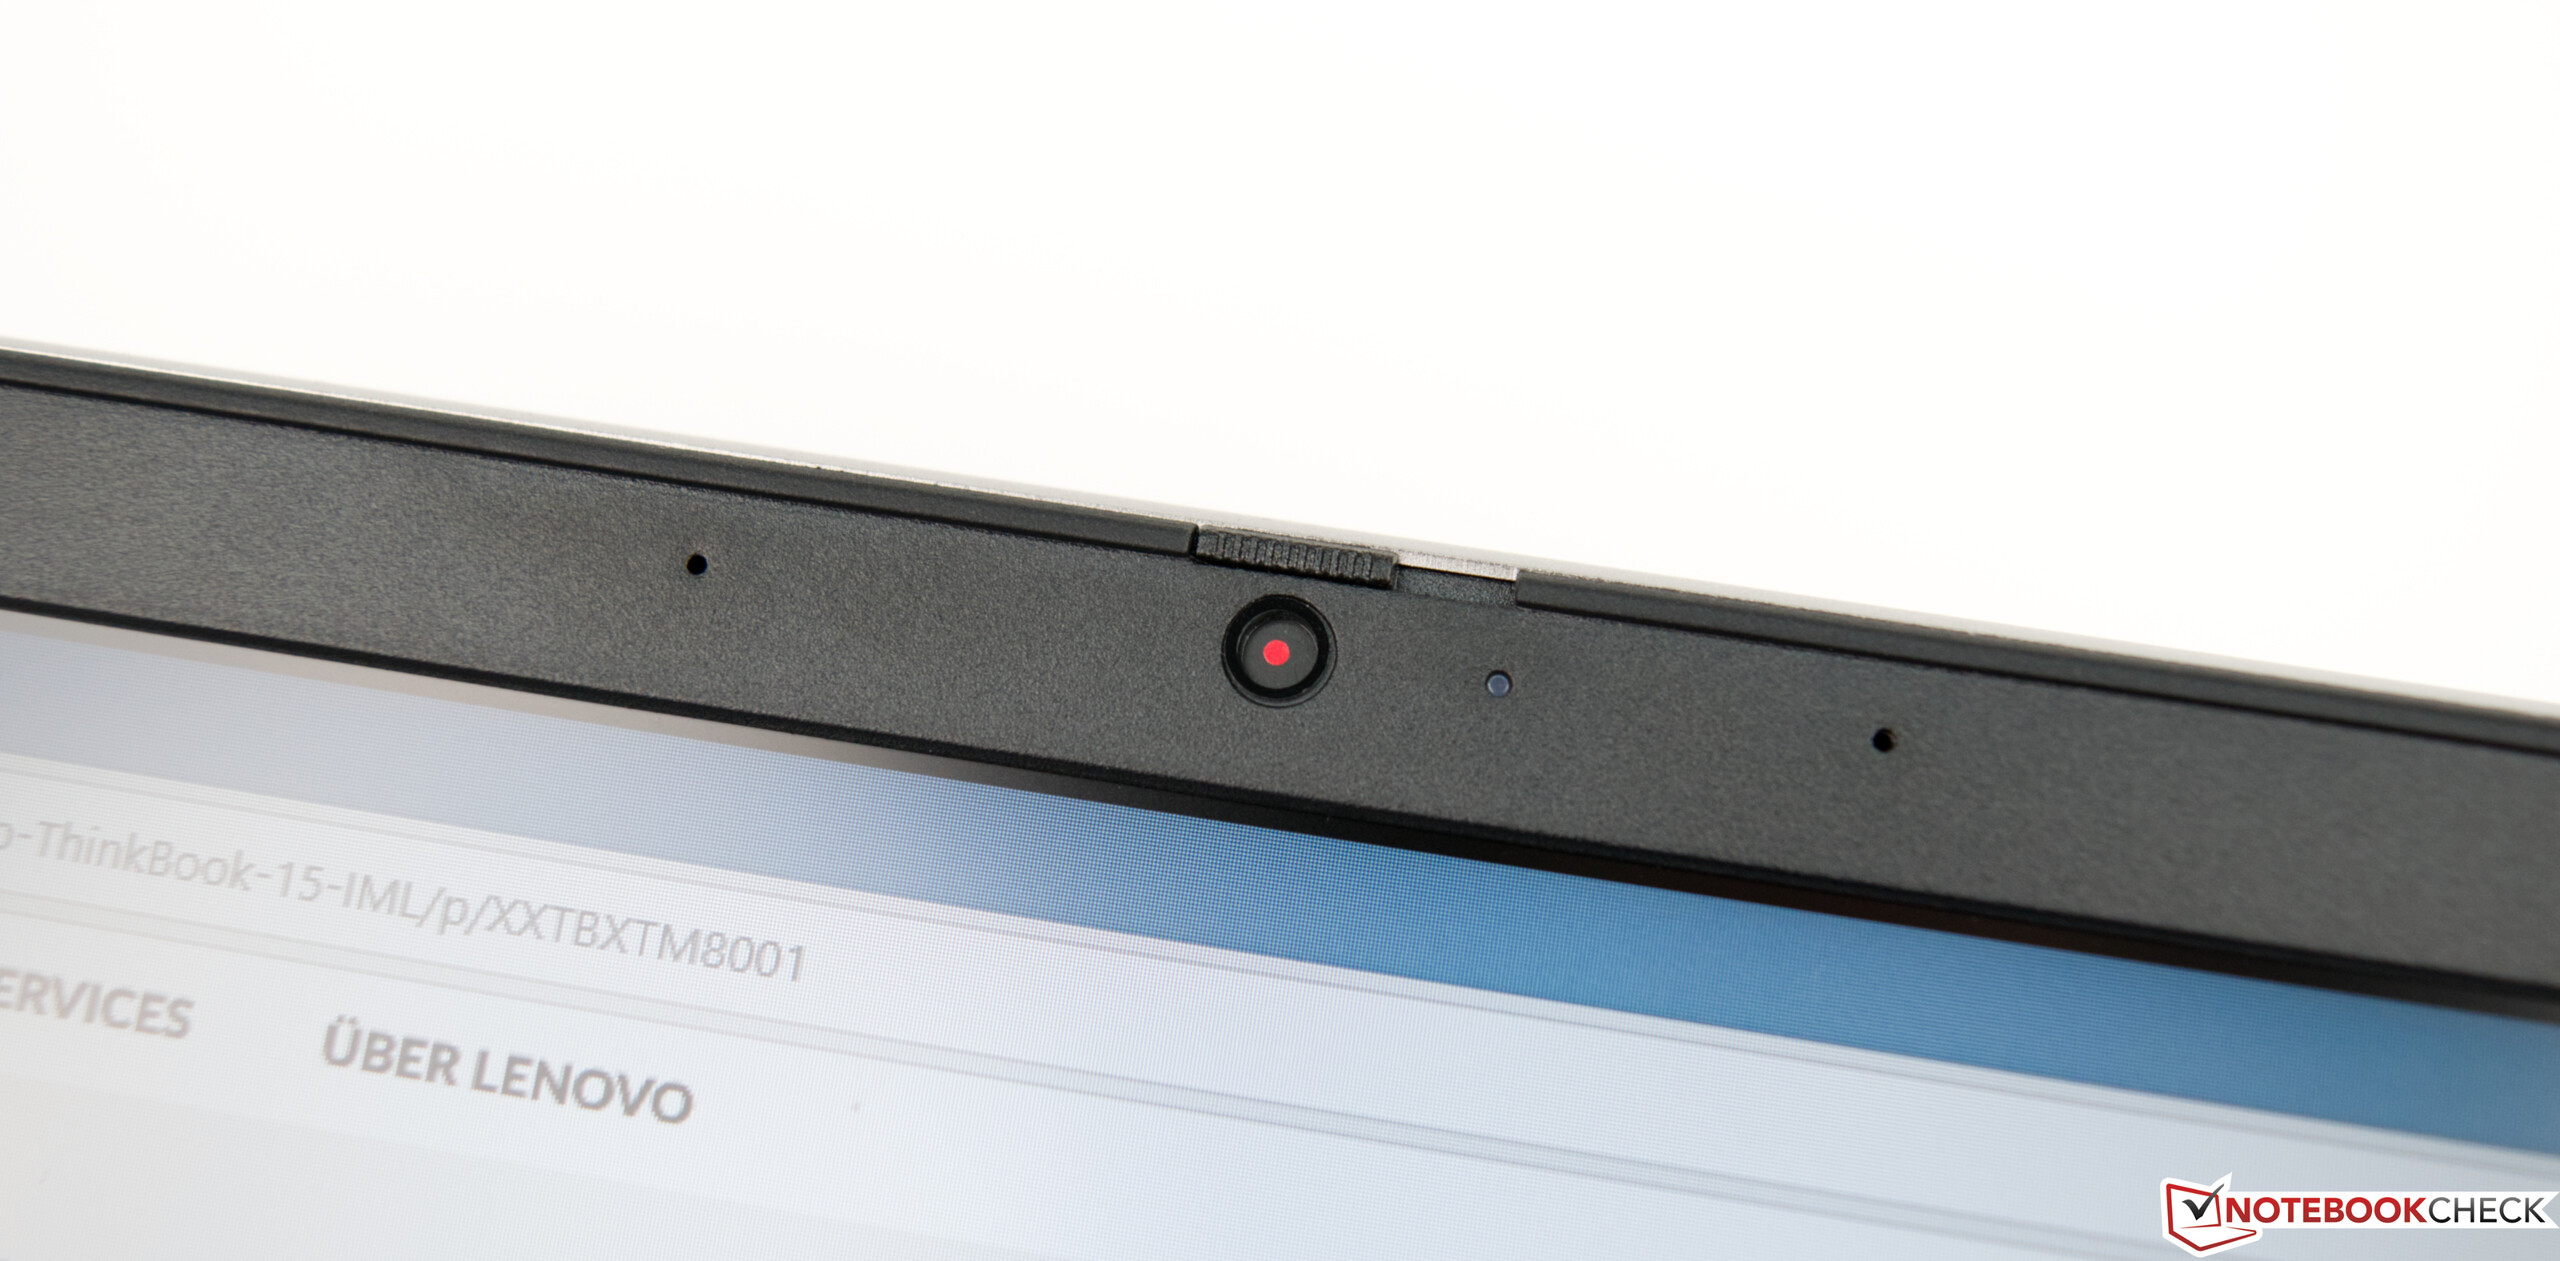
Het beeldscherm zal echter de meningen verdelen. Hoewel we de matte afwerking en brede kijkhoeken waarderen, maakt de lage dekking van de kleurruimte de ThinkBook 15 onaantrekkelijk voor het bewerken van foto's of video's.
De Lenovo ThinkBook 15 is een goedkope kantoorlaptop die geen ernstige tekortkomingen heeft.
Over het algemeen is de ThinkBook 15 goed geprijsd voor ongeveer €810. Zijn 45 Wh-batterij houdt het echter niet een volledige werkdag vol. We hadden hier minstens acht uur of meer verwacht.
Lenovo ThinkBook 15
- 06-02-2020 v7 (old)
Sebastian Bade
Price comparison
