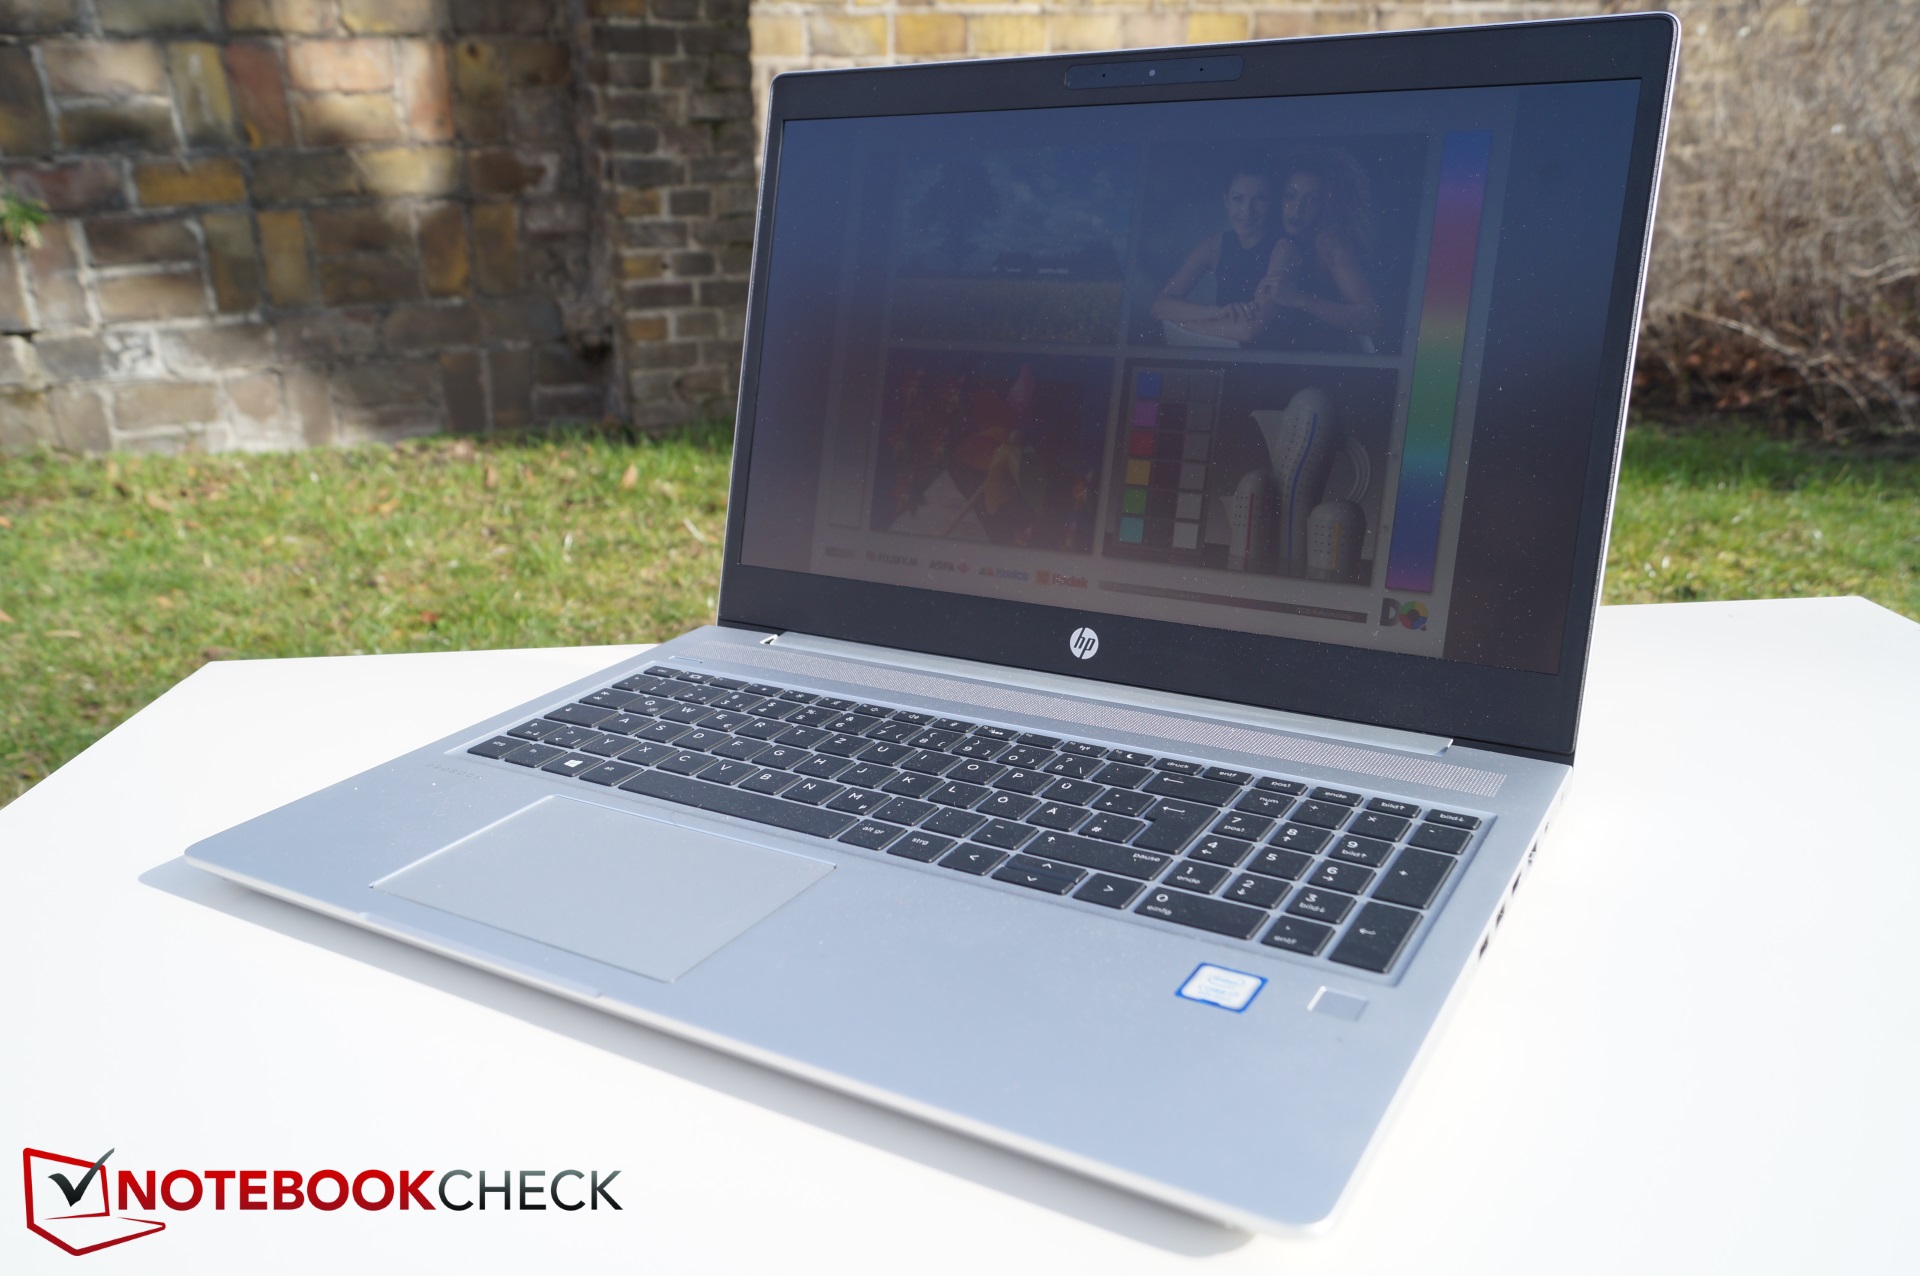
Kort testrapport HP ProBook 450 G6 (Core i7-8565U, GeForce MX130) Laptop
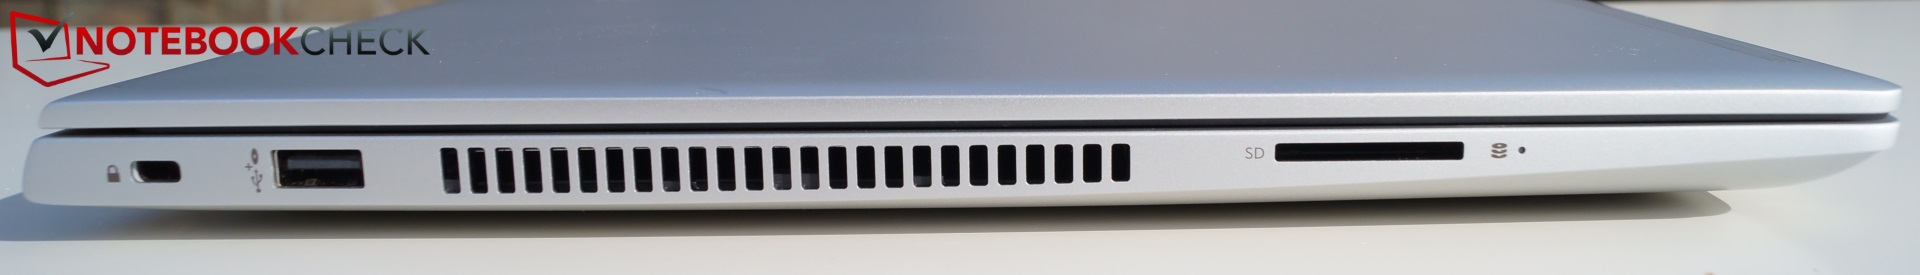
| SD Card Reader | |
| average JPG Copy Test (av. of 3 runs) | |
| Dell Latitude 5590 (Toshiba Exceria Pro SDXC 64 GB UHS-II) | |
| HP ProBook 450 G5-2UB53EA (Toshiba Exceria Pro SDXC 64 GB UHS-II) | |
| HP ProBook 450 G6-5TJ93EA (Toshiba Exceria Pro SDXC 64 GB UHS-II) | |
| Lenovo ThinkPad E580-20KS001RGE (Toshiba Exceria Pro SDXC 64 GB UHS-II) | |
| HP ProBook 650 G4 3UP57EA (Toshiba Exceria Pro M501 microSDXC 64GB) | |
| Gemiddelde van klas Office (22.4 - 198.5, n=22, laatste 2 jaar) | |
| Acer TravelMate P2510-G2-MG-50WE (Toshiba Exceria Pro SDXC 64 GB UHS-II) | |
| maximum AS SSD Seq Read Test (1GB) | |
| Dell Latitude 5590 (Toshiba Exceria Pro SDXC 64 GB UHS-II) | |
| HP ProBook 450 G5-2UB53EA (Toshiba Exceria Pro SDXC 64 GB UHS-II) | |
| Lenovo ThinkPad E580-20KS001RGE (Toshiba Exceria Pro SDXC 64 GB UHS-II) | |
| HP ProBook 450 G6-5TJ93EA (Toshiba Exceria Pro SDXC 64 GB UHS-II) | |
| Gemiddelde van klas Office (27.4 - 249, n=20, laatste 2 jaar) | |
| HP ProBook 650 G4 3UP57EA (Toshiba Exceria Pro M501 microSDXC 64GB) | |
| Acer TravelMate P2510-G2-MG-50WE (Toshiba Exceria Pro SDXC 64 GB UHS-II) | |
| Networking | |
| iperf3 transmit AX12 | |
| HP ProBook 450 G6-5TJ93EA | |
| Acer TravelMate P2510-G2-MG-50WE | |
| HP ProBook 650 G4 3UP57EA | |
| HP ProBook 450 G5-2UB53EA | |
| Lenovo ThinkPad E580-20KS001RGE | |
| Dell Latitude 5590 | |
| iperf3 receive AX12 | |
| HP ProBook 450 G6-5TJ93EA | |
| HP ProBook 450 G5-2UB53EA | |
| HP ProBook 650 G4 3UP57EA | |
| Acer TravelMate P2510-G2-MG-50WE | |
| Dell Latitude 5590 | |
| Lenovo ThinkPad E580-20KS001RGE | |
| |||||||||||||||||||||||||
Helderheidsverdeling: 88 %
Helderheid in Batterij-modus: 244 cd/m²
Contrast: 1152:1 (Zwart: 0.21 cd/m²)
ΔE ColorChecker Calman: 4.7 | ∀{0.5-29.43 Ø4.73}
calibrated: 4
ΔE Greyscale Calman: 2.7 | ∀{0.09-98 Ø4.97}
64% sRGB (Argyll 1.6.3 3D)
40.8% AdobeRGB 1998 (Argyll 1.6.3 3D)
44.29% AdobeRGB 1998 (Argyll 3D)
64.2% sRGB (Argyll 3D)
42.83% Display P3 (Argyll 3D)
Gamma: 2.26
CCT: 6442 K
| HP ProBook 450 G6-5TJ93EA Chi Mei CMN15FE, , 1920x1080, 15.6" | HP ProBook 450 G5-2UB53EA AUO41ED, , 1920x1080, 15.6" | HP ProBook 650 G4 3UP57EA CMN15D3, , 1920x1080, 15.6" | Acer TravelMate P2510-G2-MG-50WE Chi Mei CMN15D3, , 1920x1080, 15.6" | Lenovo ThinkPad E580-20KS001RGE BOE NV156FHM-N49, , 1920x1080, 15.6" | Dell Latitude 5590 NV15N42, , 1920x1080, 15.6" | Apple MacBook 12 (Early 2016) 1.1 GHz APPA027, , 2304x1440, 12" | |
|---|---|---|---|---|---|---|---|
| Display | -11% | -2% | -1% | -8% | -4% | 53% | |
| Display P3 Coverage (%) | 42.83 | 38.04 -11% | 41.89 -2% | 42.27 -1% | 40 -7% | 41.56 -3% | 66.8 56% |
| sRGB Coverage (%) | 64.2 | 57.3 -11% | 63 -2% | 63.5 -1% | 58.2 -9% | 61.3 -5% | 95.4 49% |
| AdobeRGB 1998 Coverage (%) | 44.29 | 39.31 -11% | 43.28 -2% | 43.69 -1% | 41.32 -7% | 42.93 -3% | 68 54% |
| Response Times | -50% | 6% | -24% | -36% | -59% | -23% | |
| Response Time Grey 50% / Grey 80% * (ms) | 34.4 ? | 52.4 ? -52% | 31 ? 10% | 40 ? -16% | 48 ? -40% | 53.2 ? -55% | 41.2 ? -20% |
| Response Time Black / White * (ms) | 24.4 ? | 36 ? -48% | 24 ? 2% | 32 ? -31% | 32 ? -31% | 39.6 ? -62% | 30.4 ? -25% |
| PWM Frequency (Hz) | 26040 ? | 1000 ? | 25000 ? | 25000 ? | 1000 ? | ||
| Screen | -22% | 4% | 17% | 9% | -15% | 25% | |
| Brightness middle (cd/m²) | 242 | 252 4% | 305 26% | 259 7% | 290 20% | 243 0% | 387 60% |
| Brightness (cd/m²) | 226 | 249 10% | 270 19% | 230 2% | 267 18% | 234 4% | 358 58% |
| Brightness Distribution (%) | 88 | 88 0% | 80 -9% | 82 -7% | 81 -8% | 83 -6% | 88 0% |
| Black Level * (cd/m²) | 0.21 | 0.22 -5% | 0.39 -86% | 0.19 10% | 0.19 10% | 0.19 10% | 0.47 -124% |
| Contrast (:1) | 1152 | 1145 -1% | 782 -32% | 1363 18% | 1526 32% | 1279 11% | 823 -29% |
| Colorchecker dE 2000 * | 4.7 | 6.9 -47% | 3.26 31% | 3.13 33% | 4.9 -4% | 6.6 -40% | 1.6 66% |
| Colorchecker dE 2000 max. * | 18.5 | 18.4 1% | 6.84 63% | 7.81 58% | 9.52 49% | 22.3 -21% | 4 78% |
| Colorchecker dE 2000 calibrated * | 4 | 3.09 23% | 5 -25% | ||||
| Greyscale dE 2000 * | 2.7 | 6.9 -156% | 1.98 27% | 1.42 47% | 2.92 -8% | 5.2 -93% | 1 63% |
| Gamma | 2.26 97% | 2.43 91% | 2.38 92% | 2.36 93% | 2.31 95% | 2.24 98% | 2.26 97% |
| CCT | 6442 101% | 7524 86% | 6540 99% | 6391 102% | 6091 107% | 6990 93% | 6680 97% |
| Color Space (Percent of AdobeRGB 1998) (%) | 40.8 | 36.3 -11% | 40 -2% | 40 -2% | 37 -9% | 39.2 -4% | 61.6 51% |
| Color Space (Percent of sRGB) (%) | 64 | 57.2 -11% | 63 -2% | 63 -2% | 58 -9% | 60.8 -5% | 82.2 28% |
| Totaal Gemiddelde (Programma / Instellingen) | -28% /
-23% | 3% /
3% | -3% /
9% | -12% /
-0% | -26% /
-19% | 18% /
24% |
* ... kleiner is beter
Responstijd Scherm
| ↔ Responstijd Zwart naar Wit | ||
|---|---|---|
| 24.4 ms ... stijging ↗ en daling ↘ gecombineerd | ↗ 14.4 ms stijging | 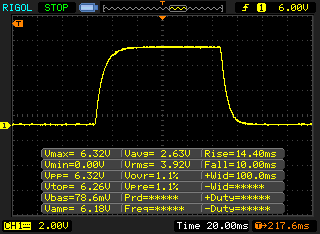 |
| ↘ 10 ms daling | ||
| Het scherm vertoonde prima responstijden in onze tests maar is misschien wat te traag voor competitieve games. Ter vergelijking: alle testtoestellen variëren van 0.1 (minimum) tot 240 (maximum) ms. » 57 % van alle toestellen zijn beter. Dit betekent dat de gemeten responstijd slechter is dan het gemiddelde (19.9 ms) van alle geteste toestellen. | ||
| ↔ Responstijd 50% Grijs naar 80% Grijs | ||
| 34.4 ms ... stijging ↗ en daling ↘ gecombineerd | ↗ 17.2 ms stijging | 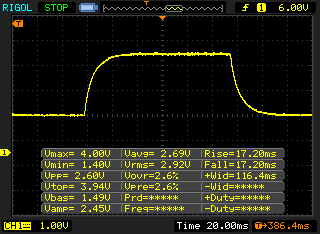 |
| ↘ 17.2 ms daling | ||
| Het scherm vertoonde trage responstijden in onze tests en is misschien te traag voor games. Ter vergelijking: alle testtoestellen variëren van 0.165 (minimum) tot 636 (maximum) ms. » 48 % van alle toestellen zijn beter. Dit betekent dat de gemeten responstijd slechter is dan het gemiddelde (31.1 ms) van alle geteste toestellen. | ||
Screen Flickering / PWM (Pulse-Width Modulation)
| Screen flickering / PWM waargenomen | 26040 Hz | ≤ 40 % helderheid instelling | 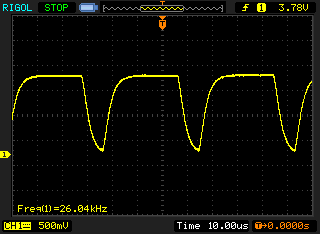 |
De achtergrondverlichting van het scherm flikkert op 26040 Hz (in het slechtste geval, bijvoorbeeld bij gebruik van PWM) aan een helderheid van 40 % en lager. Boven deze helderheid zou er geen flickering / PWM mogen optreden. De frequentie van 26040 Hz is redelijk hoog en de meeste mensen die gevoelig zijn aan flickering zouden dit dus niet mogen waarnemen of geïrriteerde ogen krijgen. Ter vergelijking: 52 % van alle geteste toestellen maakten geen gebruik van PWM om de schermhelderheid te verlagen. Als het wel werd gebruikt, werd een gemiddelde van 7798 (minimum: 5 - maximum: 343500) Hz waargenomen. | |||
| Cinebench R15 | |
| CPU Single 64Bit | |
| Gemiddelde van klas Office (99.5 - 312, n=74, laatste 2 jaar) | |
| Gemiddeld Intel Core i7-8565U (138.3 - 193, n=51) | |
| Lenovo ThinkPad E580-20KS001RGE | |
| HP ProBook 450 G5-2UB53EA | |
| Dell Latitude 5590 | |
| HP ProBook 650 G4 3UP57EA | |
| Acer TravelMate P2510-G2-MG-50WE | |
| HP ProBook 450 G6-5TJ93EA | |
| CPU Multi 64Bit | |
| Gemiddelde van klas Office (250 - 3380, n=74, laatste 2 jaar) | |
| Dell Latitude 5590 | |
| Gemiddeld Intel Core i7-8565U (452 - 815, n=52) | |
| HP ProBook 650 G4 3UP57EA | |
| HP ProBook 450 G5-2UB53EA | |
| HP ProBook 450 G6-5TJ93EA | |
| Acer TravelMate P2510-G2-MG-50WE | |
| Lenovo ThinkPad E580-20KS001RGE | |
| Cinebench R11.5 | |
| CPU Single 64Bit | |
| Gemiddelde van klas Office (2 - 3.6, n=13, laatste 2 jaar) | |
| HP ProBook 450 G6-5TJ93EA | |
| Gemiddeld Intel Core i7-8565U (0.65 - 2.16, n=11) | |
| Dell Latitude 5590 | |
| CPU Multi 64Bit | |
| Gemiddelde van klas Office (9.76 - 31.5, n=13, laatste 2 jaar) | |
| Dell Latitude 5590 | |
| Gemiddeld Intel Core i7-8565U (4.09 - 7.4, n=11) | |
| HP ProBook 450 G6-5TJ93EA | |
| Cinebench R10 | |
| Rendering Single CPUs 64Bit | |
| Gemiddelde van klas Office (11106 - 15443, n=6, laatste 2 jaar) | |
| HP ProBook 450 G6-5TJ93EA | |
| Dell Latitude 5590 | |
| Gemiddeld Intel Core i7-8565U (5474 - 9435, n=6) | |
| Rendering Multiple CPUs 64Bit | |
| Gemiddelde van klas Office (48700 - 76704, n=6, laatste 2 jaar) | |
| Dell Latitude 5590 | |
| Gemiddeld Intel Core i7-8565U (14542 - 26851, n=6) | |
| HP ProBook 450 G6-5TJ93EA | |
| PCMark 8 | |
| Home Score Accelerated v2 | |
| Gemiddelde van klas Office (n=1laatste 2 jaar) | |
| Lenovo ThinkPad E580-20KS001RGE | |
| HP ProBook 450 G5-2UB53EA | |
| Dell Latitude 5590 | |
| HP ProBook 650 G4 3UP57EA | |
| Acer TravelMate P2510-G2-MG-50WE | |
| HP ProBook 450 G6-5TJ93EA | |
| Gemiddeld Intel Core i7-8565U, NVIDIA GeForce MX130 (n=1) | |
| Work Score Accelerated v2 | |
| Gemiddelde van klas Office (n=1laatste 2 jaar) | |
| Lenovo ThinkPad E580-20KS001RGE | |
| HP ProBook 450 G6-5TJ93EA | |
| Gemiddeld Intel Core i7-8565U, NVIDIA GeForce MX130 (n=1) | |
| HP ProBook 650 G4 3UP57EA | |
| Acer TravelMate P2510-G2-MG-50WE | |
| Dell Latitude 5590 | |
| PCMark 8 Home Score Accelerated v2 | 3457 punten | |
| PCMark 8 Work Score Accelerated v2 | 5033 punten | |
| PCMark 10 Score | 3668 punten | |
Help | ||
| HP ProBook 450 G6-5TJ93EA Samsung SSD PM981 MZVLB512HAJQ | HP ProBook 450 G5-2UB53EA SanDisk SD8SN8U256G1006 | HP ProBook 650 G4 3UP57EA Toshiba XG5 KXG50ZNV256G | Acer TravelMate P2510-G2-MG-50WE SK Hynix HFS256G39TND-N210A | Lenovo ThinkPad E580-20KS001RGE Lenovo LENSE20256GMSP34MEAT2TA | Dell Latitude 5590 SK hynix SC311 M.2 | Gemiddeld Samsung SSD PM981 MZVLB512HAJQ | |
|---|---|---|---|---|---|---|---|
| CrystalDiskMark 5.2 / 6 | -58% | -37% | -62% | -41% | -54% | -0% | |
| Write 4K (MB/s) | 126.1 | 51.6 -59% | 89.7 -29% | 71.8 -43% | 86.1 -32% | 76.7 -39% | 126.7 ? 0% |
| Read 4K (MB/s) | 43.92 | 27.1 -38% | 30.73 -30% | 21.23 -52% | 36.81 -16% | 28.41 -35% | 44 ? 0% |
| Write Seq (MB/s) | 1669 | 471.6 -72% | 385.3 -77% | 257.1 -85% | 845 -49% | 436.7 -74% | 1617 ? -3% |
| Read Seq (MB/s) | 2224 | 499.3 -78% | 1986 -11% | 476.3 -79% | 1268 -43% | 508 -77% | 1716 ? -23% |
| Write 4K Q32T1 (MB/s) | 410.4 | 283.2 -31% | 339.9 -17% | 202.6 -51% | 161.1 -61% | 288.1 -30% | 413 ? 1% |
| Read 4K Q32T1 (MB/s) | 338.1 | 257.9 -24% | 241.7 -29% | 282 -17% | 249.6 -26% | 271.9 -20% | 420 ? 24% |
| Write Seq Q32T1 (MB/s) | 1979 | 476.6 -76% | 345.2 -83% | 265.6 -87% | 1034 -48% | 503 -75% | 2076 ? 5% |
| Read Seq Q32T1 (MB/s) | 3368 | 533 -84% | 2759 -18% | 559 -83% | 1732 -49% | 549 -84% | 3130 ? -7% |
| Write 4K Q8T8 (MB/s) | 4.686 | 1264 ? | |||||
| Read 4K Q8T8 (MB/s) | 452.5 | 1193 ? | |||||
| AS SSD | -75% | -48% | -66% | -71% | -63% | 17% | |
| Seq Read (MB/s) | 2063 | 433.2 -79% | 1542 -25% | 487.3 -76% | 1315 -36% | 503 -76% | 1976 ? -4% |
| Seq Write (MB/s) | 1163 | 363.6 -69% | 362.7 -69% | 250.6 -78% | 770 -34% | 393 -66% | 1637 ? 41% |
| 4K Read (MB/s) | 50.6 | 25.58 -49% | 29.81 -41% | 27.61 -45% | 31.54 -38% | 29.03 -43% | 50.5 ? 0% |
| 4K Write (MB/s) | 125.4 | 48.17 -62% | 94.9 -24% | 72.1 -43% | 68.5 -45% | 73.5 -41% | 112 ? -11% |
| 4K-64 Read (MB/s) | 1352 | 338.3 -75% | 408.5 -70% | 375.9 -72% | 419 -69% | 306 -77% | 1203 ? -11% |
| 4K-64 Write (MB/s) | 1023 | 144.1 -86% | 327.6 -68% | 202.1 -80% | 91.6 -91% | 212.7 -79% | 1504 ? 47% |
| Access Time Read * (ms) | 0.044 | 0.145 -230% | 0.079 -80% | 0.08 -82% | 0.176 -300% | 0.111 -152% | 0.05092 ? -16% |
| Access Time Write * (ms) | 0.182 | 0.092 49% | 0.054 70% | 0.233 -28% | 0.173 5% | 0.047 74% | 0.08337 ? 54% |
| Score Read (Points) | 1608 | 407 -75% | 592 -63% | 452 -72% | 582 -64% | 385 -76% | 1451 ? -10% |
| Score Write (Points) | 1265 | 229 -82% | 459 -64% | 299 -76% | 237 -81% | 326 -74% | 1780 ? 41% |
| Score Total (Points) | 3658 | 849 -77% | 1303 -64% | 980 -73% | 1099 -70% | 912 -75% | 3966 ? 8% |
| Copy ISO MB/s (MB/s) | 1382 | 284.6 -79% | 369.5 -73% | 908 -34% | 311.5 -77% | 1755 ? 27% | |
| Copy Program MB/s (MB/s) | 414.3 | 122.4 -70% | 246.7 -40% | 174 -58% | 208.6 -50% | 454 ? 10% | |
| Copy Game MB/s (MB/s) | 660 | 182.2 -72% | 286.1 -57% | 132.7 -80% | 210 -68% | 1057 ? 60% | |
| Totaal Gemiddelde (Programma / Instellingen) | -67% /
-69% | -43% /
-44% | -64% /
-64% | -56% /
-60% | -59% /
-60% | 9% /
11% |
* ... kleiner is beter

| 3DMark 11 - 1280x720 Performance GPU | |
| Gemiddelde van klas Office (2551 - 18313, n=68, laatste 2 jaar) | |
| Lenovo ThinkPad E580-20KS001RGE | |
| HP ProBook 450 G6-5TJ93EA | |
| Gemiddeld NVIDIA GeForce MX130 (2476 - 3203, n=14) | |
| Acer TravelMate P2510-G2-MG-50WE | |
| HP ProBook 650 G4 3UP57EA | |
| Dell Latitude 5590 | |
| HP ProBook 450 G5-2UB53EA | |
| 3DMark | |
| 1280x720 Cloud Gate Standard Graphics | |
| Gemiddelde van klas Office (11640 - 118515, n=37, laatste 2 jaar) | |
| Lenovo ThinkPad E580-20KS001RGE | |
| HP ProBook 450 G6-5TJ93EA | |
| Gemiddeld NVIDIA GeForce MX130 (12166 - 14880, n=13) | |
| Acer TravelMate P2510-G2-MG-50WE | |
| HP ProBook 650 G4 3UP57EA | |
| Dell Latitude 5590 | |
| HP ProBook 450 G5-2UB53EA | |
| 1920x1080 Fire Strike Graphics | |
| Gemiddelde van klas Office (736 - 21871, n=72, laatste 2 jaar) | |
| Lenovo ThinkPad E580-20KS001RGE | |
| HP ProBook 450 G6-5TJ93EA | |
| Gemiddeld NVIDIA GeForce MX130 (2149 - 2495, n=13) | |
| Acer TravelMate P2510-G2-MG-50WE | |
| HP ProBook 650 G4 3UP57EA | |
| Dell Latitude 5590 | |
| HP ProBook 450 G5-2UB53EA | |
| 3DMark 11 Performance | 3122 punten | |
| 3DMark Cloud Gate Standard Score | 10308 punten | |
| 3DMark Fire Strike Score | 2226 punten | |
Help | ||
| Rise of the Tomb Raider | |
| 1024x768 Lowest Preset | |
| Acer TravelMate P2510-G2-MG-50WE | |
| Lenovo ThinkPad E580-20KS001RGE | |
| Gemiddeld NVIDIA GeForce MX130 (30.7 - 51.2, n=8) | |
| HP ProBook 450 G6-5TJ93EA | |
| 1366x768 Medium Preset AF:2x | |
| Lenovo ThinkPad E580-20KS001RGE | |
| Acer TravelMate P2510-G2-MG-50WE | |
| Gemiddeld NVIDIA GeForce MX130 (22.5 - 31.3, n=8) | |
| HP ProBook 450 G6-5TJ93EA | |
| 1920x1080 High Preset AA:FX AF:4x | |
| Lenovo ThinkPad E580-20KS001RGE | |
| Acer TravelMate P2510-G2-MG-50WE | |
| Gemiddeld NVIDIA GeForce MX130 (13.2 - 16.9, n=8) | |
| HP ProBook 450 G6-5TJ93EA | |
| 1920x1080 Very High Preset AA:FX AF:16x | |
| Acer TravelMate P2510-G2-MG-50WE | |
| Gemiddeld NVIDIA GeForce MX130 (12.1 - 14, n=7) | |
| HP ProBook 450 G6-5TJ93EA | |
| BioShock Infinite | |
| 1280x720 Very Low Preset | |
| Lenovo ThinkPad E580-20KS001RGE | |
| HP ProBook 450 G6-5TJ93EA | |
| Gemiddeld NVIDIA GeForce MX130 (83.6 - 152.6, n=10) | |
| HP ProBook 650 G4 3UP57EA | |
| HP ProBook 450 G5-2UB53EA | |
| Dell Latitude 5590 | |
| 1366x768 Medium Preset | |
| Lenovo ThinkPad E580-20KS001RGE | |
| HP ProBook 450 G6-5TJ93EA | |
| Gemiddeld NVIDIA GeForce MX130 (57.3 - 84.5, n=10) | |
| Dell Latitude 5590 | |
| HP ProBook 650 G4 3UP57EA | |
| HP ProBook 450 G5-2UB53EA | |
| 1366x768 High Preset | |
| Lenovo ThinkPad E580-20KS001RGE | |
| HP ProBook 450 G6-5TJ93EA | |
| Gemiddeld NVIDIA GeForce MX130 (48 - 69, n=10) | |
| Dell Latitude 5590 | |
| HP ProBook 650 G4 3UP57EA | |
| HP ProBook 450 G5-2UB53EA | |
| 1920x1080 Ultra Preset, DX11 (DDOF) | |
| Gemiddeld NVIDIA GeForce MX130 (22 - 48.7, n=10) | |
| HP ProBook 450 G6-5TJ93EA | |
| Lenovo ThinkPad E580-20KS001RGE | |
| HP ProBook 650 G4 3UP57EA | |
| Dell Latitude 5590 | |
| lage | gem. | hoge | ultra | |
|---|---|---|---|---|
| BioShock Infinite (2013) | 134.3 | 73.7 | 63.4 | 23.7 |
| The Witcher 3 (2015) | 26.1 | 21.3 | 10.6 | 7 |
| Dota 2 Reborn (2015) | 27.8 | 23.1 | 22.9 | 21 |
| Rise of the Tomb Raider (2016) | 30.7 | 23.6 | 14.4 | 12.4 |
Geluidsniveau
| Onbelast |
| 29 / 29 / 29 dB (A) |
| HDD |
| 29.4 dB (A) |
| Belasting |
| 34.2 / 38.4 dB (A) |
 | ||
30 dB stil 40 dB(A) hoorbaar 50 dB(A) luid |
||
min: | ||
| HP ProBook 450 G6-5TJ93EA GeForce MX130, i7-8565U, Samsung SSD PM981 MZVLB512HAJQ | HP ProBook 450 G5-2UB53EA UHD Graphics 620, i5-8250U, SanDisk SD8SN8U256G1006 | HP ProBook 650 G4 3UP57EA UHD Graphics 620, i5-8250U, Toshiba XG5 KXG50ZNV256G | Acer TravelMate P2510-G2-MG-50WE GeForce MX130, i5-8250U, SK Hynix HFS256G39TND-N210A | Lenovo ThinkPad E580-20KS001RGE Radeon RX 550 (Laptop), i5-8550U, Lenovo LENSE20256GMSP34MEAT2TA | Dell Latitude 5590 UHD Graphics 620, i5-8250U, SK hynix SC311 M.2 | |
|---|---|---|---|---|---|---|
| Noise | 4% | -8% | -4% | -5% | -4% | |
| uit / omgeving * (dB) | 29 | 29.1 -0% | 30.3 -4% | 30.3 -4% | 30.1 -4% | 29 -0% |
| Idle Minimum * (dB) | 29 | 29.1 -0% | 32 -10% | 30.3 -4% | 30.1 -4% | 29 -0% |
| Idle Average * (dB) | 29 | 29.1 -0% | 33.8 -17% | 30.3 -4% | 30.1 -4% | 29 -0% |
| Idle Maximum * (dB) | 29 | 29.1 -0% | 34.2 -18% | 31 -7% | 31.6 -9% | 31.3 -8% |
| Load Average * (dB) | 34.2 | 31.4 8% | 36.2 -6% | 35.6 -4% | 37.7 -10% | 36.6 -7% |
| Witcher 3 ultra * (dB) | 34.2 | |||||
| Load Maximum * (dB) | 38.4 | 32 17% | 35.6 7% | 38.6 -1% | 38 1% | 40.9 -7% |
* ... kleiner is beter
| HP ProBook 450 G6-5TJ93EA GeForce MX130, i7-8565U, Samsung SSD PM981 MZVLB512HAJQ | HP ProBook 450 G5-2UB53EA UHD Graphics 620, i5-8250U, SanDisk SD8SN8U256G1006 | HP ProBook 650 G4 3UP57EA UHD Graphics 620, i5-8250U, Toshiba XG5 KXG50ZNV256G | Acer TravelMate P2510-G2-MG-50WE GeForce MX130, i5-8250U, SK Hynix HFS256G39TND-N210A | Lenovo ThinkPad E580-20KS001RGE Radeon RX 550 (Laptop), i5-8550U, Lenovo LENSE20256GMSP34MEAT2TA | Dell Latitude 5590 UHD Graphics 620, i5-8250U, SK hynix SC311 M.2 | |
|---|---|---|---|---|---|---|
| Heat | -1% | 1% | -11% | -30% | 3% | |
| Maximum Upper Side * (°C) | 39.4 | 42.2 -7% | 35.7 9% | 49 -24% | 60 -52% | 36.6 7% |
| Maximum Bottom * (°C) | 50.2 | 45.5 9% | 33.8 33% | 47.4 6% | 57 -14% | 47.5 5% |
| Idle Upper Side * (°C) | 22.9 | 23.9 -4% | 28.4 -24% | 26.6 -16% | 29.1 -27% | 23.2 -1% |
| Idle Bottom * (°C) | 24.1 | 24.2 -0% | 27.4 -14% | 26.7 -11% | 30.2 -25% | 24.2 -0% |
* ... kleiner is beter
(+) De maximumtemperatuur aan de bovenzijde bedraagt 39.4 °C / 103 F, vergeleken met het gemiddelde van 34.3 °C / 94 F, variërend van 21.2 tot 62.5 °C voor de klasse Office.
(-) De bodem warmt op tot een maximum van 50.2 °C / 122 F, vergeleken met een gemiddelde van 36.8 °C / 98 F
(+) Bij onbelast gebruik bedraagt de gemiddelde temperatuur voor de bovenzijde 22.5 °C / 73 F, vergeleken met het apparaatgemiddelde van 29.5 °C / 85 F.
(±) Bij het spelen van The Witcher 3 is de gemiddelde temperatuur voor de bovenzijde 34.9 °C / 95 F, vergeleken met het apparaatgemiddelde van 29.5 °C / 85 F.
(+) De palmsteunen en het touchpad zijn met een maximum van ###max## °C / 86.9 F koeler dan de huidtemperatuur en voelen daarom koel aan.
(-) De gemiddelde temperatuur van de handpalmsteun van soortgelijke toestellen bedroeg 27.5 °C / 81.5 F (-3 °C / -5.4 F).
HP ProBook 450 G6-5TJ93EA audioanalyse
(±) | luidspreker luidheid is gemiddeld maar goed (74.4 dB)
Bas 100 - 315 Hz
(-) | bijna geen lage tonen - gemiddeld 21.8% lager dan de mediaan
(±) | lineariteit van de lage tonen is gemiddeld (10.6% delta ten opzichte van de vorige frequentie)
Midden 400 - 2000 Hz
(±) | hogere middens - gemiddeld 5.6% hoger dan de mediaan
(±) | lineariteit van de middentonen is gemiddeld (7.7% delta ten opzichte van de vorige frequentie)
Hoog 2 - 16 kHz
(±) | higher highs - on average 5.1% higher than median
(+) | de hoge tonen zijn lineair (4.6% delta naar de vorige frequentie)
Algemeen 100 - 16.000 Hz
(±) | lineariteit van het totale geluid is gemiddeld (27.1% verschil met de mediaan)
Vergeleken met dezelfde klasse
» 84% van alle geteste apparaten in deze klasse waren beter, 5% vergelijkbaar, 11% slechter
» De beste had een delta van 7%, het gemiddelde was 21%, de slechtste was 53%
Vergeleken met alle geteste toestellen
» 83% van alle geteste apparaten waren beter, 4% gelijk, 14% slechter
» De beste had een delta van 4%, het gemiddelde was 24%, de slechtste was 134%
Apple MacBook 12 (Early 2016) 1.1 GHz audioanalyse
(+) | luidsprekers kunnen relatief luid spelen (83.6 dB)
Bas 100 - 315 Hz
(±) | verminderde zeebaars - gemiddeld 11.3% lager dan de mediaan
(±) | lineariteit van de lage tonen is gemiddeld (14.2% delta ten opzichte van de vorige frequentie)
Midden 400 - 2000 Hz
(+) | evenwichtige middens - slechts 2.4% verwijderd van de mediaan
(+) | de middentonen zijn lineair (5.5% delta ten opzichte van de vorige frequentie)
Hoog 2 - 16 kHz
(+) | evenwichtige hoogtepunten - slechts 2% verwijderd van de mediaan
(+) | de hoge tonen zijn lineair (4.5% delta naar de vorige frequentie)
Algemeen 100 - 16.000 Hz
(+) | het totale geluid is lineair (10.2% verschil met de mediaan)
Vergeleken met dezelfde klasse
» 7% van alle geteste apparaten in deze klasse waren beter, 2% vergelijkbaar, 91% slechter
» De beste had een delta van 5%, het gemiddelde was 18%, de slechtste was 53%
Vergeleken met alle geteste toestellen
» 5% van alle geteste apparaten waren beter, 1% gelijk, 94% slechter
» De beste had een delta van 4%, het gemiddelde was 24%, de slechtste was 134%
| Uit / Standby | |
| Inactief | |
| Belasting |
|
Key:
min: | |
| HP ProBook 450 G6-5TJ93EA i7-8565U, GeForce MX130, Samsung SSD PM981 MZVLB512HAJQ, IPS, 1920x1080, 15.6" | HP ProBook 450 G5-2UB53EA i5-8250U, UHD Graphics 620, SanDisk SD8SN8U256G1006, IPS LED, 1920x1080, 15.6" | HP ProBook 650 G4 3UP57EA i5-8250U, UHD Graphics 620, Toshiba XG5 KXG50ZNV256G, IPS LED, 1920x1080, 15.6" | Acer TravelMate P2510-G2-MG-50WE i5-8250U, GeForce MX130, SK Hynix HFS256G39TND-N210A, IPS, 1920x1080, 15.6" | Lenovo ThinkPad E580-20KS001RGE i5-8550U, Radeon RX 550 (Laptop), Lenovo LENSE20256GMSP34MEAT2TA, IPS LED, 1920x1080, 15.6" | Dell Latitude 5590 i5-8250U, UHD Graphics 620, SK hynix SC311 M.2, IPS, 1920x1080, 15.6" | Gemiddeld NVIDIA GeForce MX130 | Gemiddelde van klas Office | |
|---|---|---|---|---|---|---|---|---|
| Power Consumption | 17% | 25% | 7% | -38% | 5% | -9% | -3% | |
| Idle Minimum * (Watt) | 3.12 | 3.6 -15% | 3.2 -3% | 3.3 -6% | 7.4 -137% | 3.6 -15% | 4.54 ? -46% | 4.4 ? -41% |
| Idle Average * (Watt) | 6.3 | 6.2 2% | 6 5% | 5.6 11% | 10.4 -65% | 6.5 -3% | 6.98 ? -11% | 7.32 ? -16% |
| Idle Maximum * (Watt) | 9.78 | 7.2 26% | 6.4 35% | 7.8 20% | 10.3 -5% | 7.2 26% | 9.08 ? 7% | 8.56 ? 12% |
| Load Average * (Watt) | 57.6 | 35.2 39% | 34 41% | 54 6% | 57 1% | 46.2 20% | 54.1 ? 6% | 42.5 ? 26% |
| Witcher 3 ultra * (Watt) | 42 | |||||||
| Load Maximum * (Watt) | 67.3 | 46.4 31% | 34.4 49% | 63 6% | 57 15% | 68.8 -2% | 66.4 ? 1% | 64.1 ? 5% |
* ... kleiner is beter
| HP ProBook 450 G6-5TJ93EA i7-8565U, GeForce MX130, 45 Wh | HP ProBook 450 G5-2UB53EA i5-8250U, UHD Graphics 620, 48 Wh | HP ProBook 650 G4 3UP57EA i5-8250U, UHD Graphics 620, 48 Wh | Acer TravelMate P2510-G2-MG-50WE i5-8250U, GeForce MX130, 48 Wh | Lenovo ThinkPad E580-20KS001RGE i5-8550U, Radeon RX 550 (Laptop), 45 Wh | Dell Latitude 5590 i5-8250U, UHD Graphics 620, 51 Wh | Gemiddelde van klas Office | |
|---|---|---|---|---|---|---|---|
| Batterijduur | -21% | -15% | -3% | -13% | -14% | 43% | |
| Reader / Idle (h) | 14.6 | 14.4 -1% | 17.4 19% | 23.7 ? 62% | |||
| H.264 (h) | 7.7 | 8.6 12% | 9.1 18% | 6.7 -13% | 15 ? 95% | ||
| WiFi v1.3 (h) | 9.7 | 7.7 -21% | 8.2 -15% | 8.4 -13% | 6.7 -31% | 7.4 -24% | 12.9 ? 33% |
| Load (h) | 2.2 | 2 -9% | 1.4 -36% | 1.4 -36% | 1.807 ? -18% |
Pro
Contra
Dit is de verkorte versie van het originele artikel. Het volledige, Engelse testrapport vind je hier.
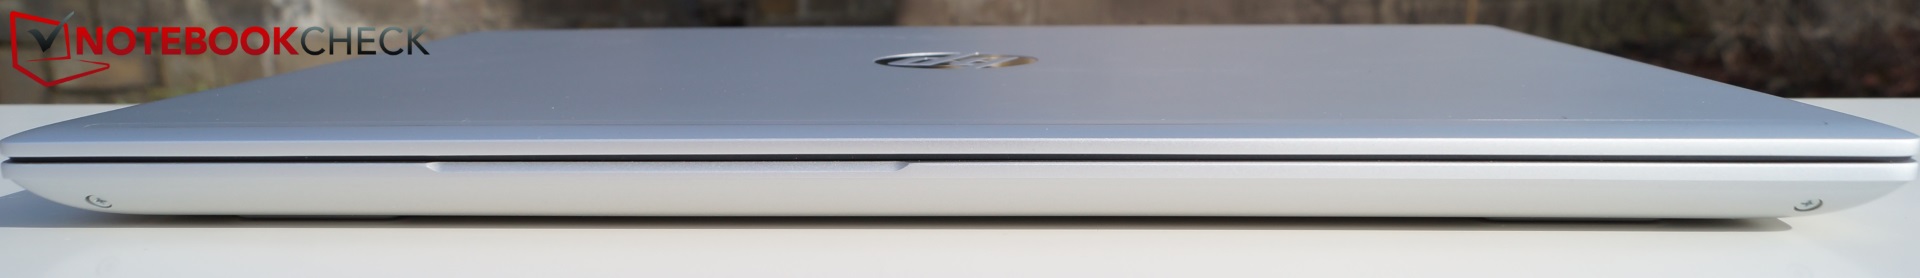
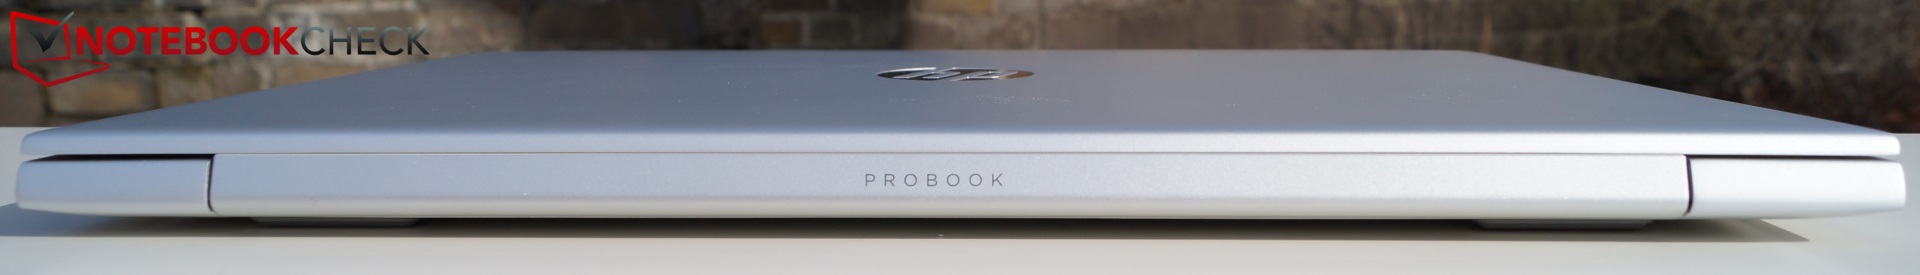
De HP ProBook 450 G6 is grotendeels onopvallend. Er zijn nauwelijks vlakken waarop het notebook schijnt, maar er zijn ook geen serieuze minpunten aan te wijzen. HP heeft in de ProBook 400-serie sommige merkbare compromissen gesloten vergeleken met de ProBook 600-serie.
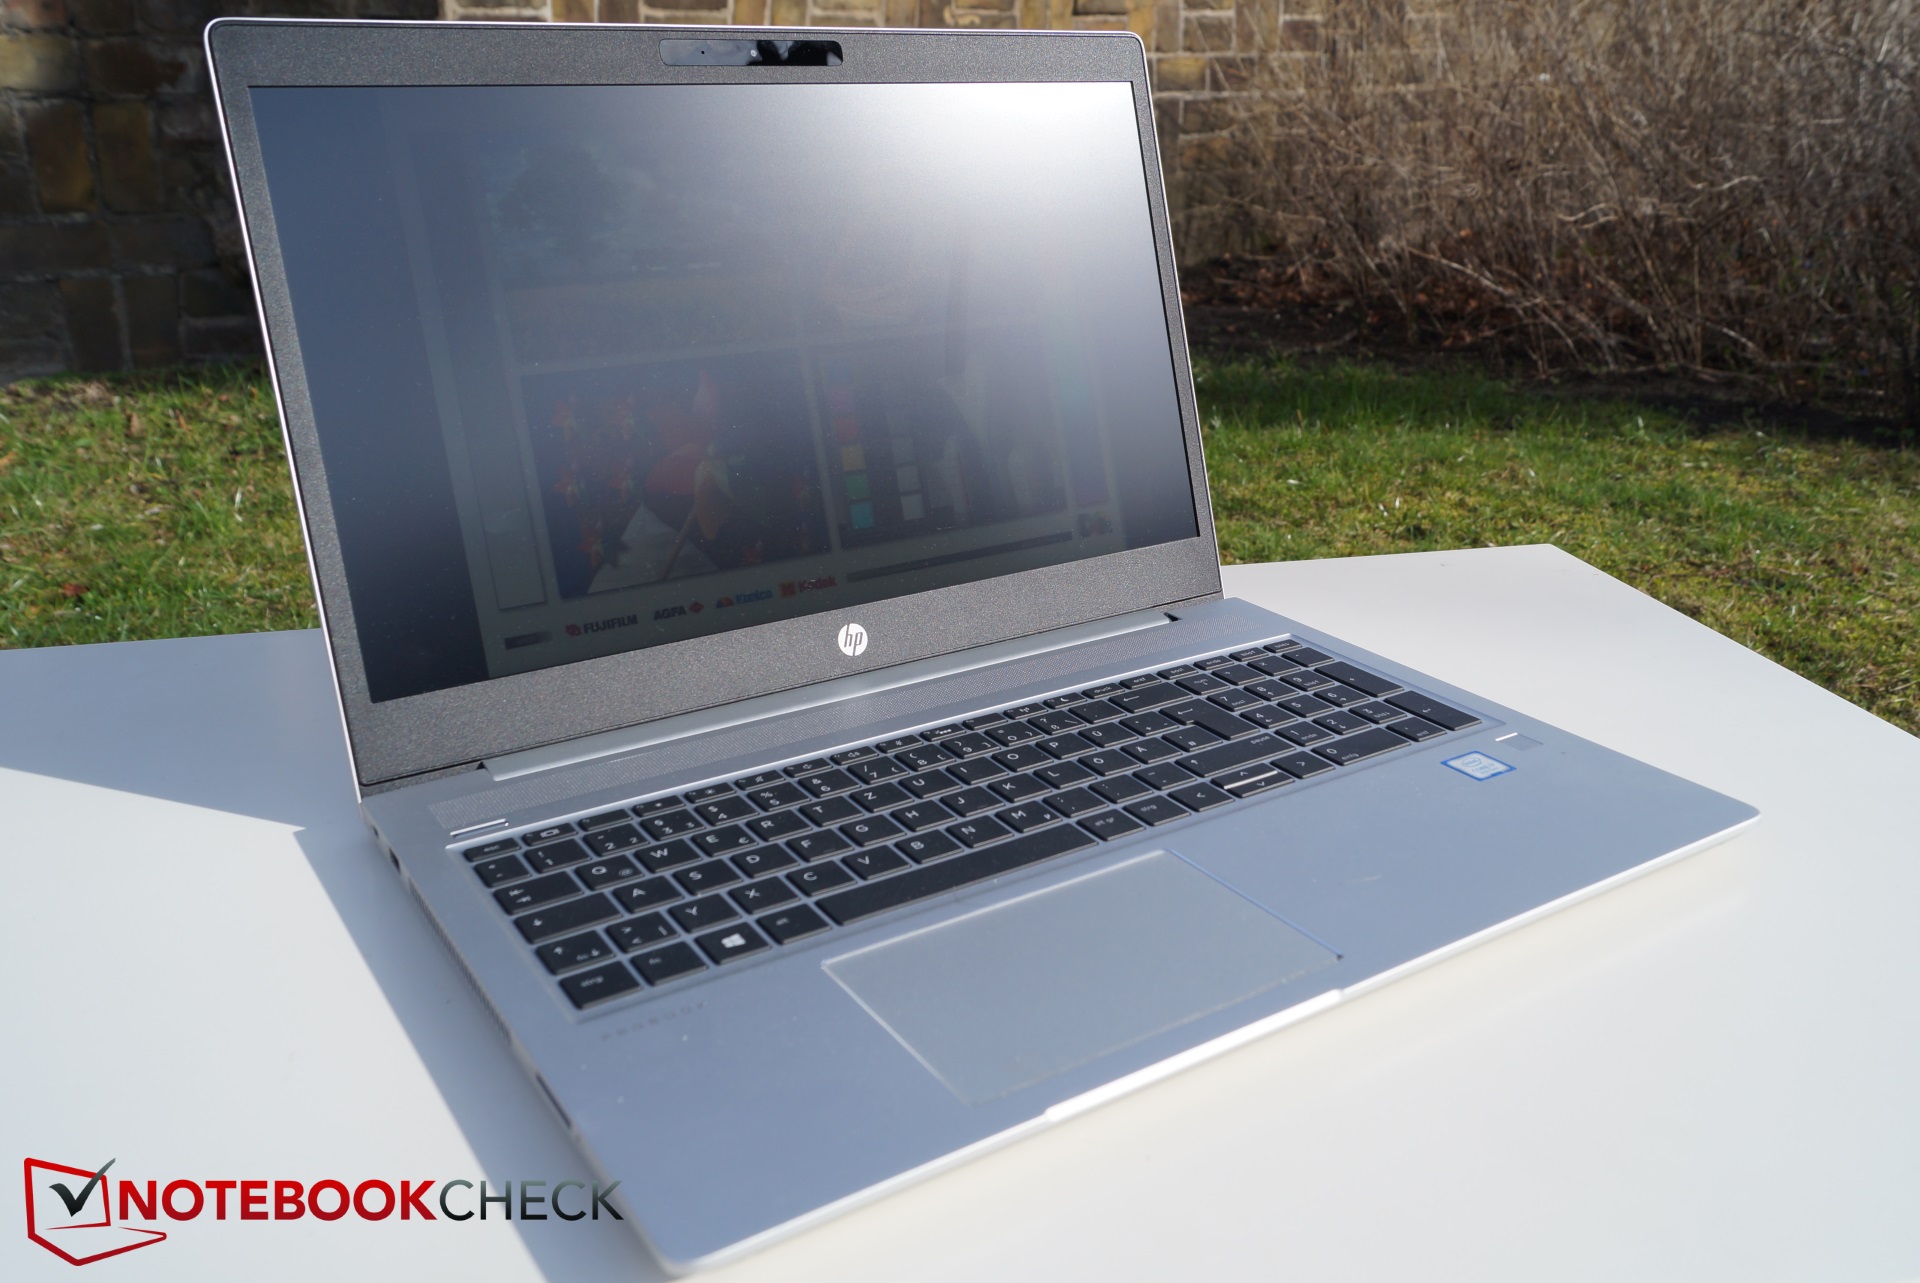
Er zijn echter genoeg fraaie zaken te benoemen. De SSD is uitzonderlijk snel, net als de Wi-Fi module. Veel van de componenten zijn te vervangen of te upgraden, hoewel de toegang hiertoe lastiger is dan bij de voorganger, de ProBook 450 G5.
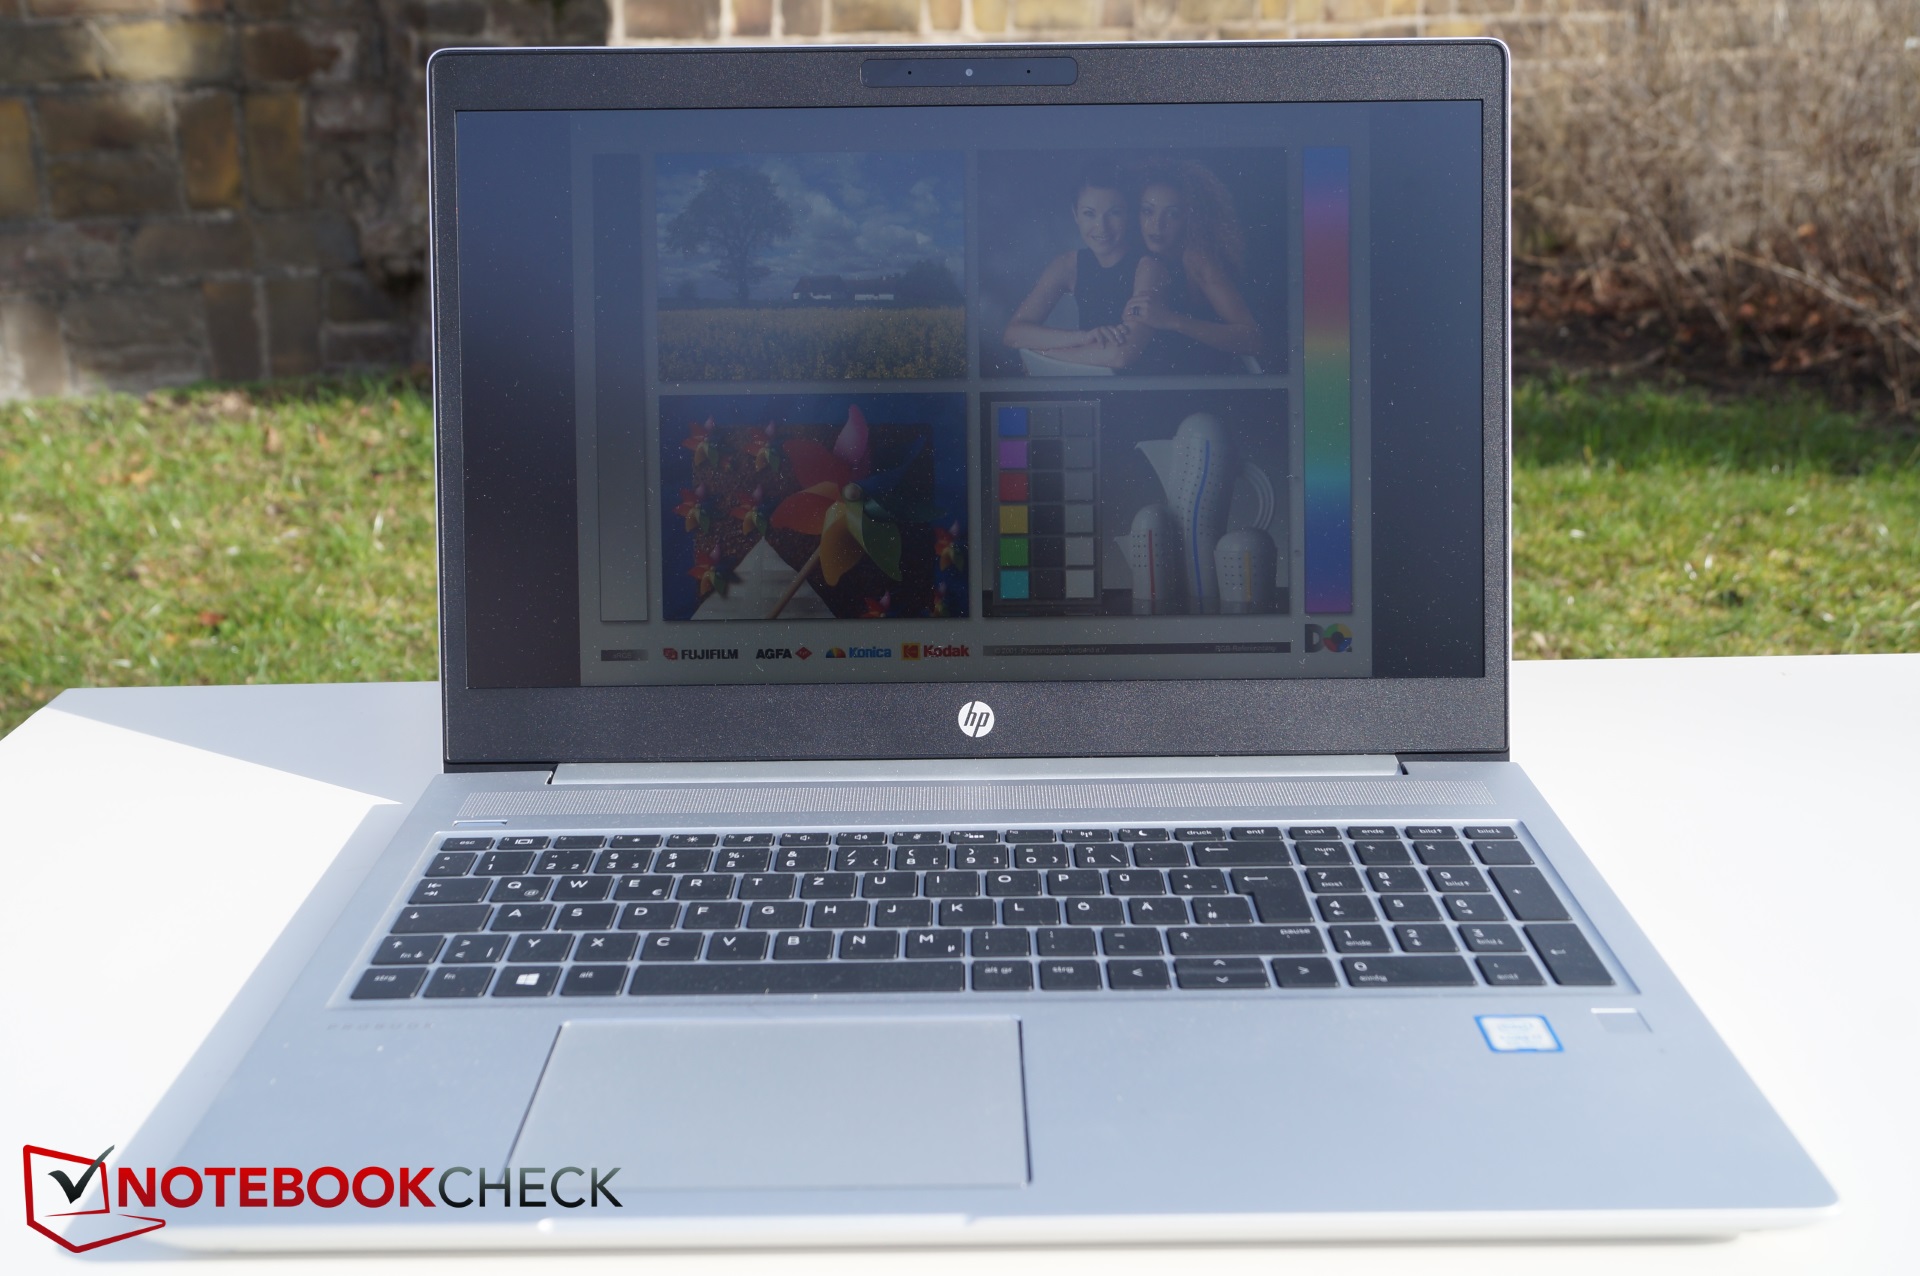
De HP ProBook 450 G6 is een compact en licht 15.6-inch notebook die het op de meeste vlakken goed doet. Ons testmodel biedt echter helaas weinig waar voor zijn geld en kan zich niet onderscheiden van de concurrentie.
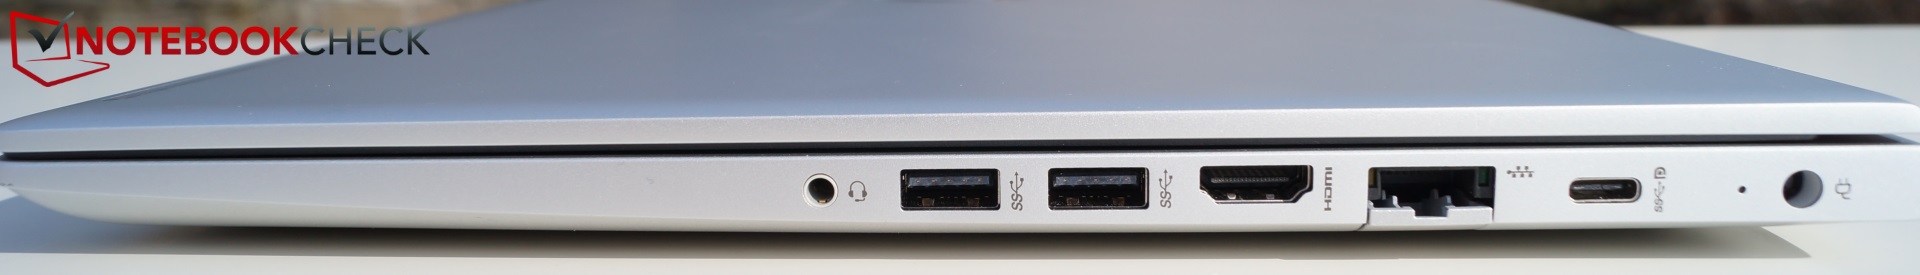
De ProBook 450 G6 kan niet het beste halen uit zijn Core i7-8565U en dat maakt de versie met Core i5-8250U de koop met meer waar voor je geld. En de pulserende ventilator zal sommige mensen, waaronder ons, ergeren. Het beeldscherm had helderder gekund, en ook de poorten hadden meer toekomstbestendig kunnen zijn. Samengevat is de ProBook 450 G6 een solide zakelijk notebook die op enkele vlakken teleurstellend tekort schiet.
HP ProBook 450 G6-5TJ93EA
- 14-03-2019 v6 (old)
Christian Hintze
Price comparison
