Kort testrapport Lenovo ThinkPad L590 Laptop: Een zakelijke laptop met prima invoerapparatuur
Evaluatie | Datum | Model | Gewicht | Hoogte | Formaat | Resolutie | Beste prijs |
|---|---|---|---|---|---|---|---|
| 83.2 % v7 (old) | 10-2019 | Lenovo ThinkPad L590-20Q70019GE i5-8265U, UHD Graphics 620 | 2 kg | 23 mm | 15.60" | 1920x1080 | |
| 84.3 % v7 (old) | 07-2018 | Lenovo ThinkPad L580-20LW000VGE i5-8250U, UHD Graphics 620 | 2 kg | 23 mm | 15.60" | 1920x1080 | |
| 82.6 % v6 (old) | Schenker Slim 15-RE-E19 i5-8265U, UHD Graphics 620 | 1.5 kg | 19.9 mm | 15.60" | 2x1 | ||
| 83.4 % v7 (old) | Lenovo ThinkPad E590-20NC0003GE i7-8565U, UHD Graphics 620 | 1.9 kg | 19.9 mm | 15.60" | 1920x1080 | ||
| 83.9 % v6 (old) | Tuxedo Book BU1307 i5-8550U, UHD Graphics 620 | 1.4 kg | 21 mm | 13.30" | 1920x1080 | ||
| 84 % v7 (old) | 01-2019 | Acer TravelMate X3410-M-50DD i5-8550U, GeForce MX130 | 1.7 kg | 19.9 mm | 14.00" | 1920x1080 |

| SD Card Reader | |
| average JPG Copy Test (av. of 3 runs) | |
| Lenovo ThinkPad E590-20NC0003GE (Toshiba Exceria Pro M501 64 GB UHS-II) | |
| Lenovo ThinkPad L580-20LW000VGE (Toshiba Exceria Pro M501) | |
| Lenovo ThinkPad L590-20Q70019GE (Toshiba Exceria Pro M501 64 GB UHS-II) | |
| Schenker Slim 15-RE-E19 (Toshiba Exceria Pro SDXC 64 GB UHS-II) | |
| Gemiddelde van klas Office (22.4 - 198.5, n=22, laatste 2 jaar) | |
| Tuxedo Book BU1307 (Toshiba Exceria Pro SDXC 64 GB UHS-II) | |
| Acer TravelMate X3410-M-50DD (Toshiba Exceria Pro SDXC 64 GB UHS-II) | |
| maximum AS SSD Seq Read Test (1GB) | |
| Lenovo ThinkPad L580-20LW000VGE (Toshiba Exceria Pro M501) | |
| Lenovo ThinkPad E590-20NC0003GE (Toshiba Exceria Pro M501 64 GB UHS-II) | |
| Lenovo ThinkPad L590-20Q70019GE (Toshiba Exceria Pro M501 64 GB UHS-II) | |
| Schenker Slim 15-RE-E19 (Toshiba Exceria Pro SDXC 64 GB UHS-II) | |
| Gemiddelde van klas Office (27.4 - 249, n=20, laatste 2 jaar) | |
| Acer TravelMate X3410-M-50DD (Toshiba Exceria Pro SDXC 64 GB UHS-II) | |
| Networking | |
| iperf3 transmit AX12 | |
| Lenovo ThinkPad E590-20NC0003GE | |
| Schenker Slim 15-RE-E19 | |
| Lenovo ThinkPad L590-20Q70019GE | |
| Acer TravelMate X3410-M-50DD | |
| Lenovo ThinkPad L580-20LW000VGE | |
| iperf3 receive AX12 | |
| Lenovo ThinkPad L590-20Q70019GE | |
| Lenovo ThinkPad L580-20LW000VGE | |
| Lenovo ThinkPad E590-20NC0003GE | |
| Schenker Slim 15-RE-E19 | |
| Acer TravelMate X3410-M-50DD | |
| |||||||||||||||||||||||||
Helderheidsverdeling: 81 %
Helderheid in Batterij-modus: 245 cd/m²
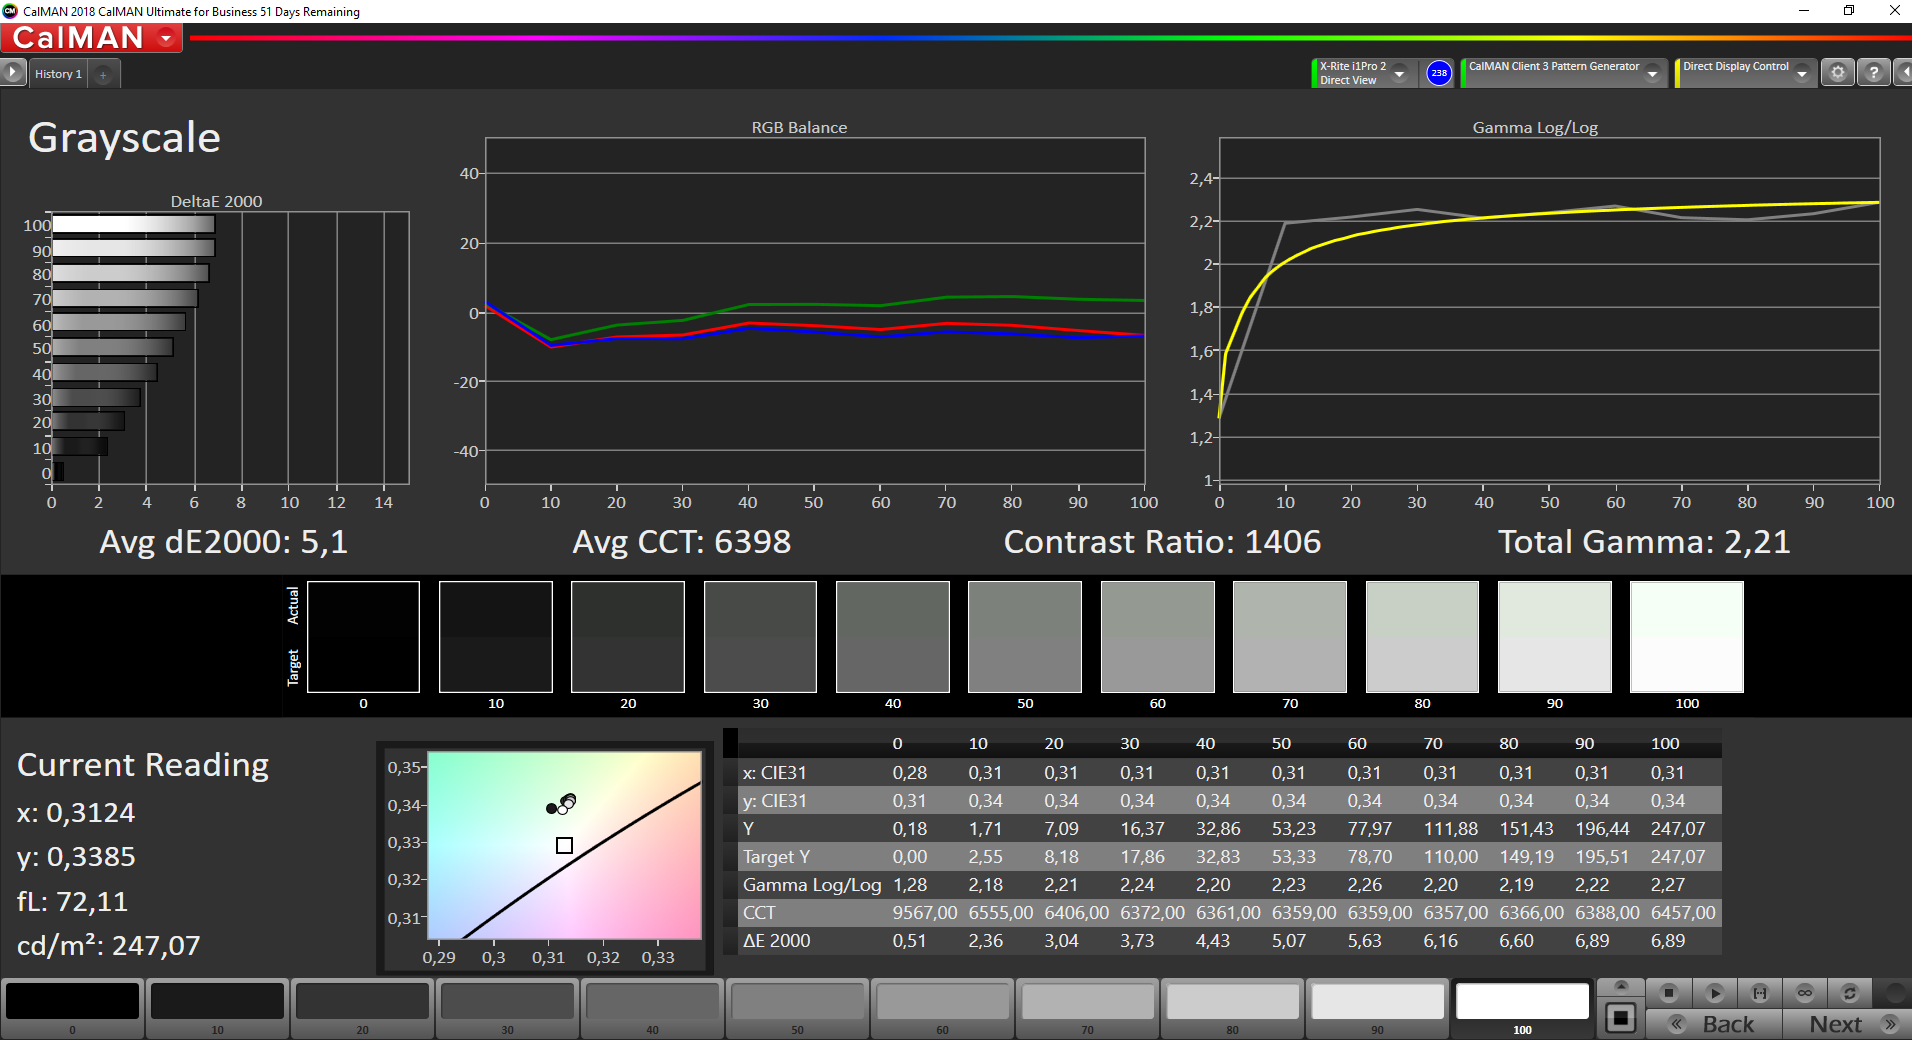
Contrast: 1372:1 (Zwart: 0.18 cd/m²)
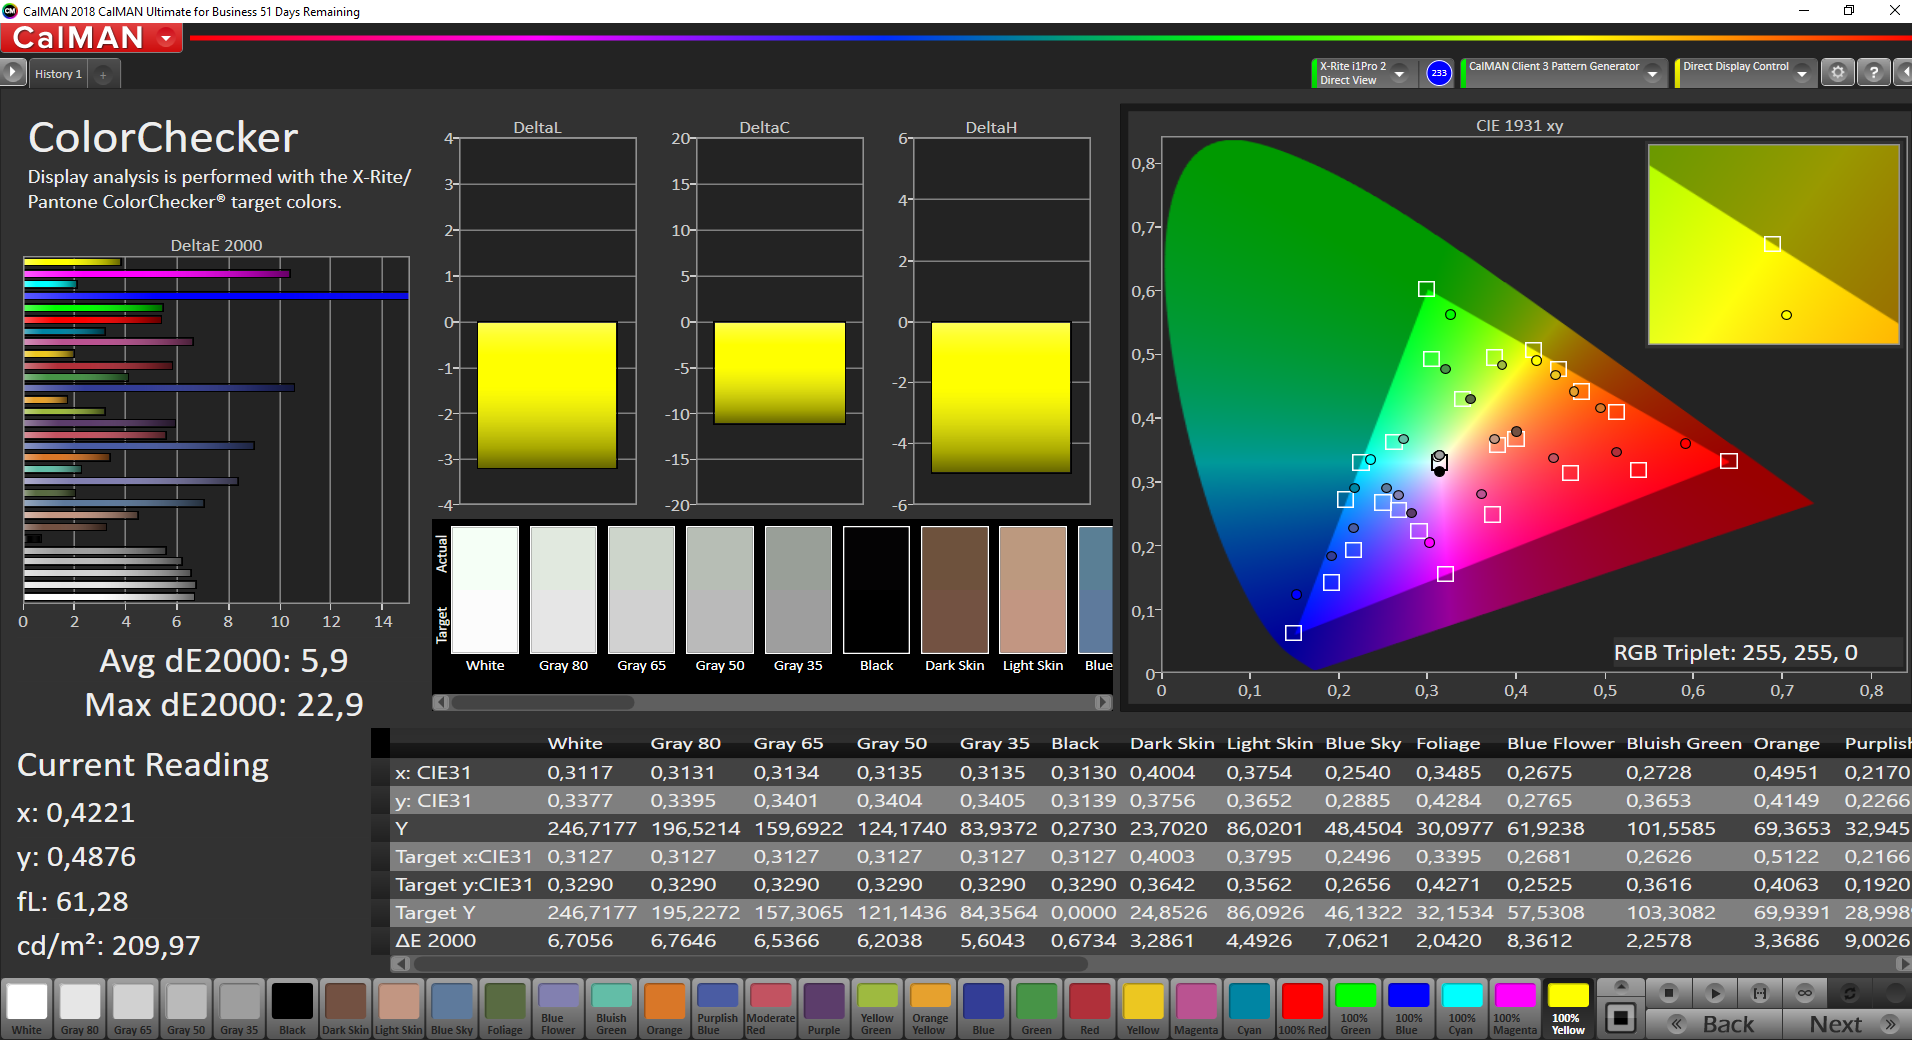
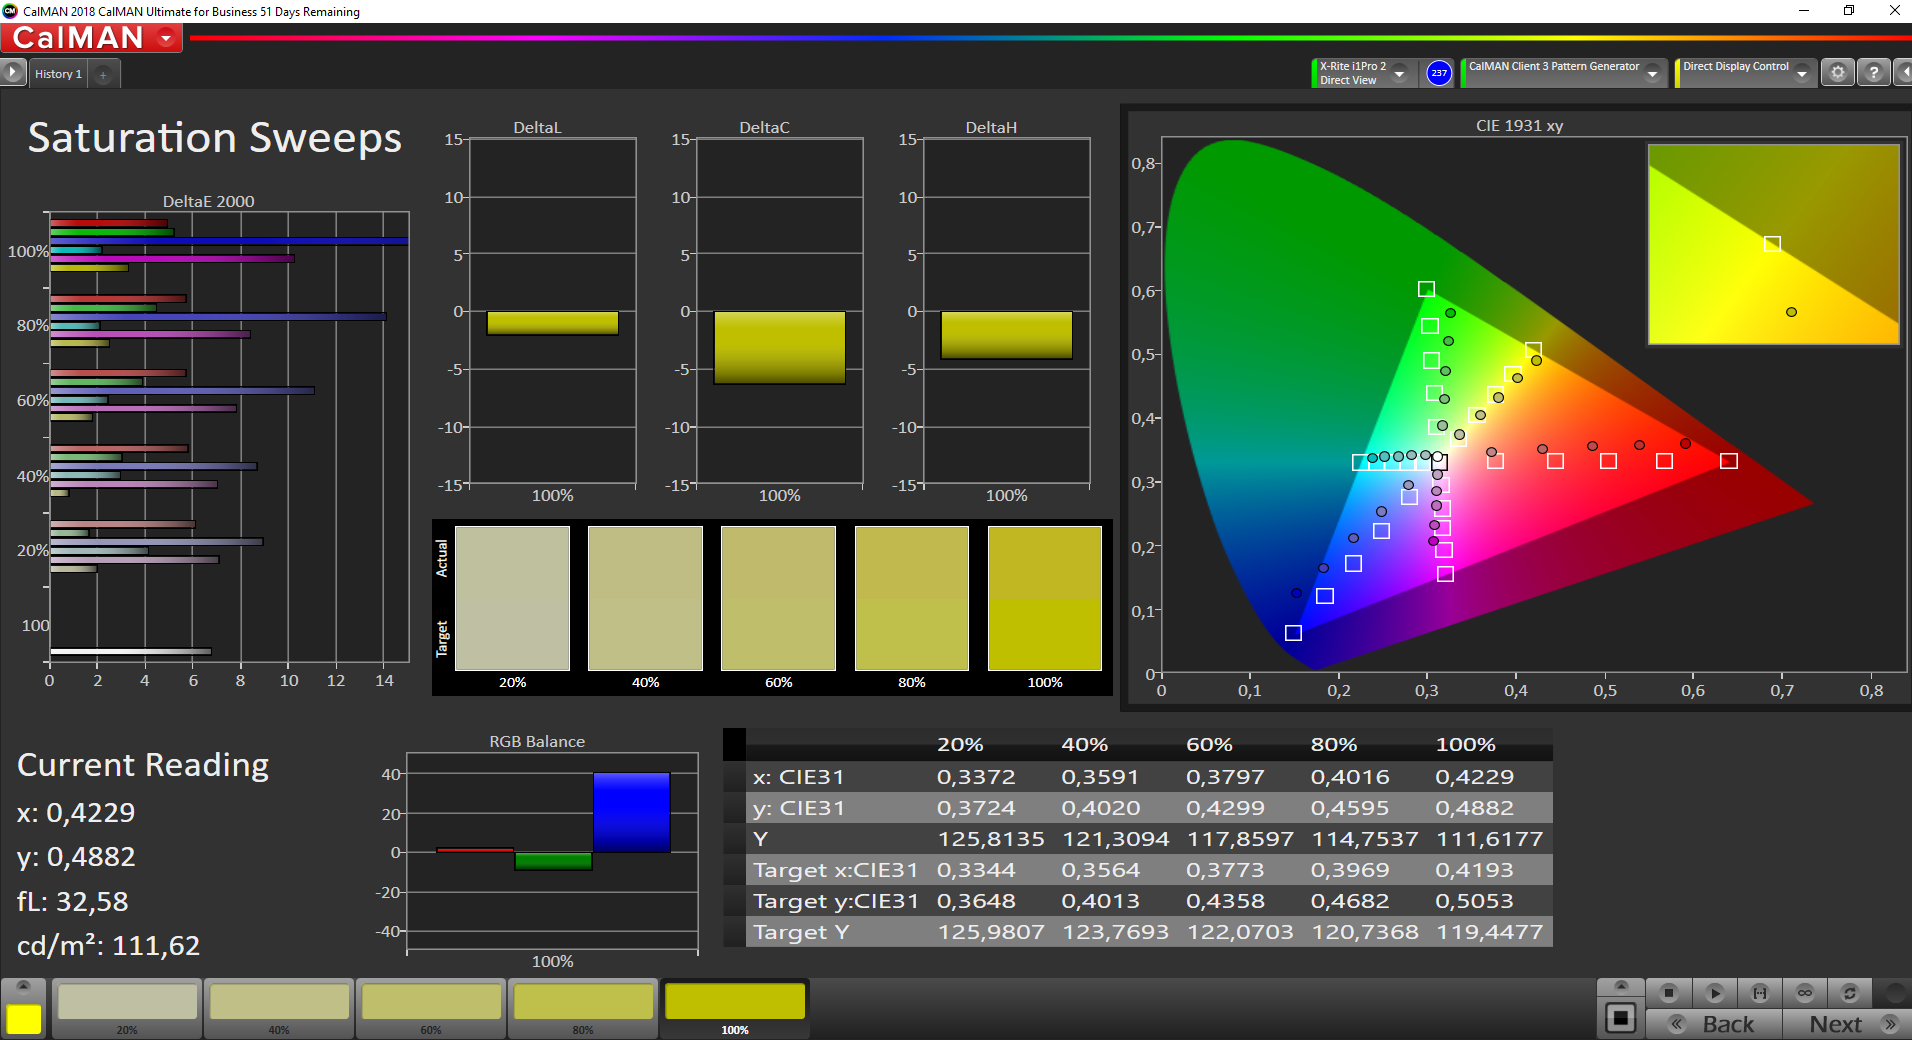
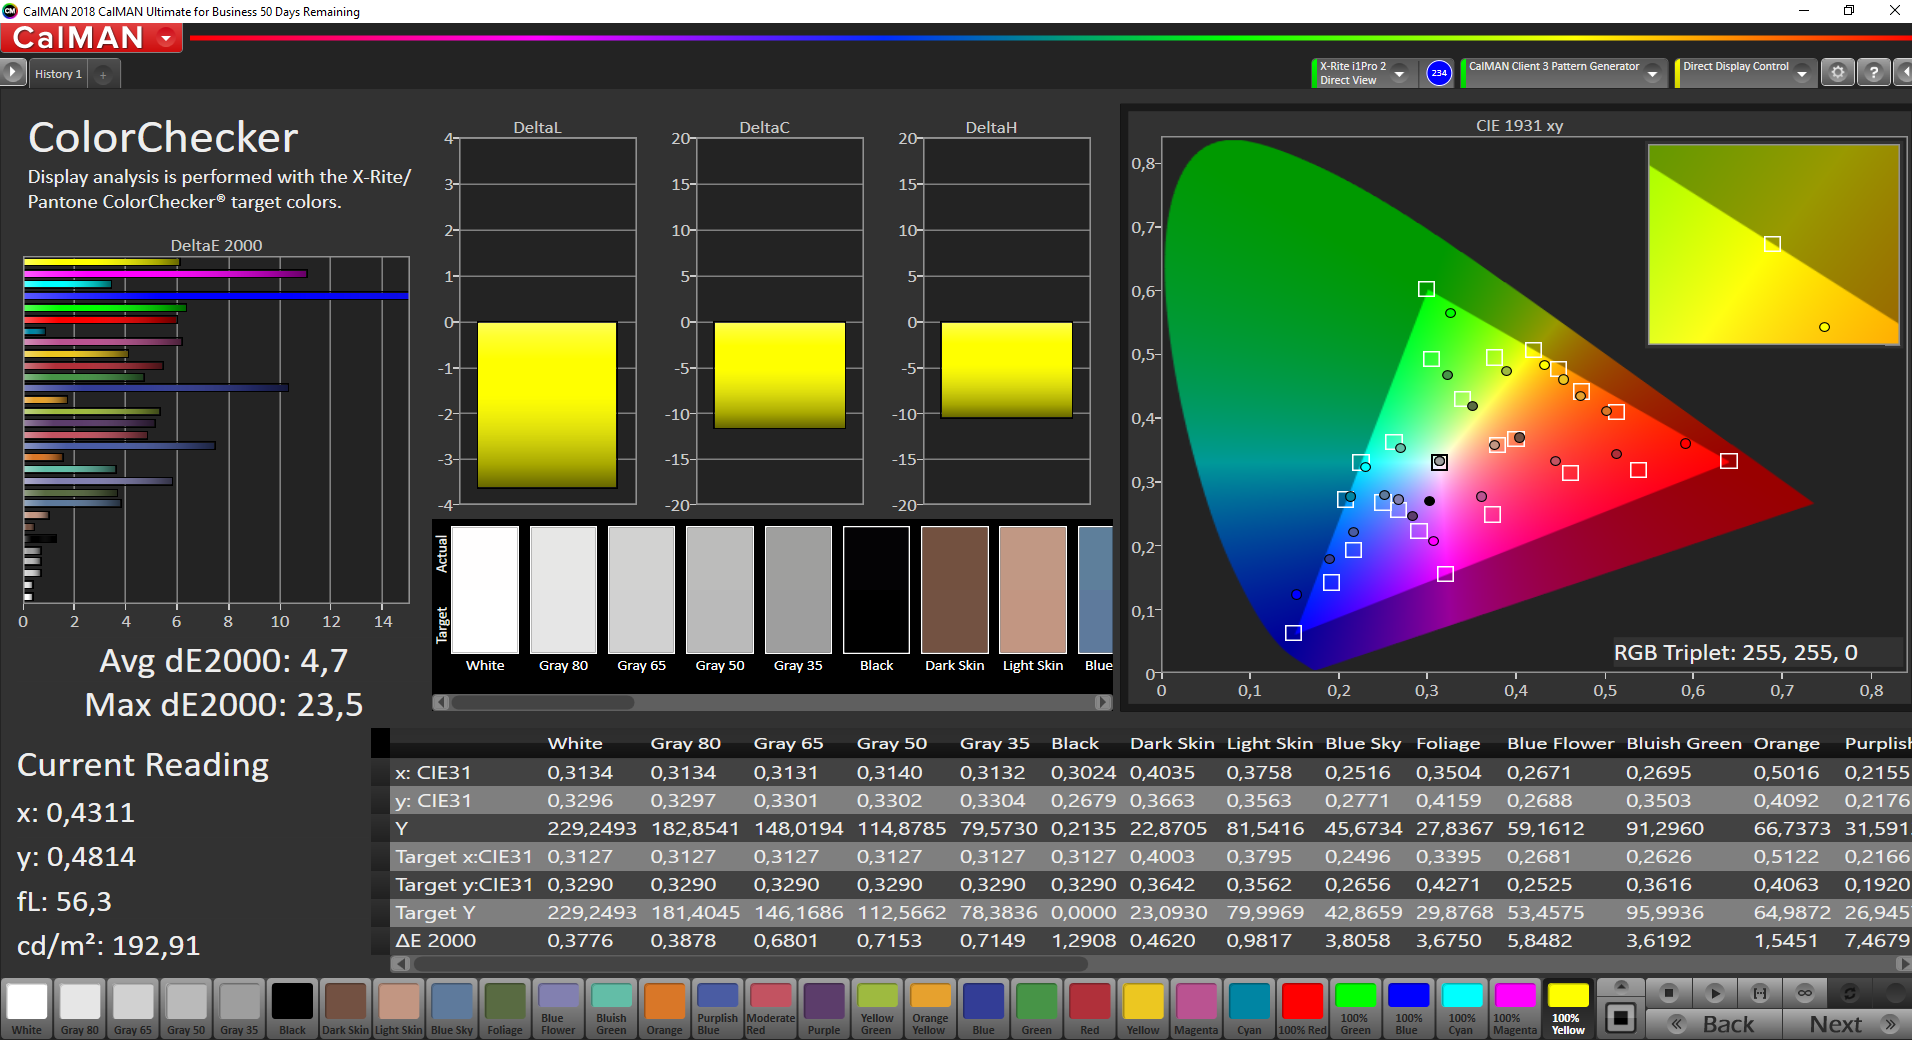
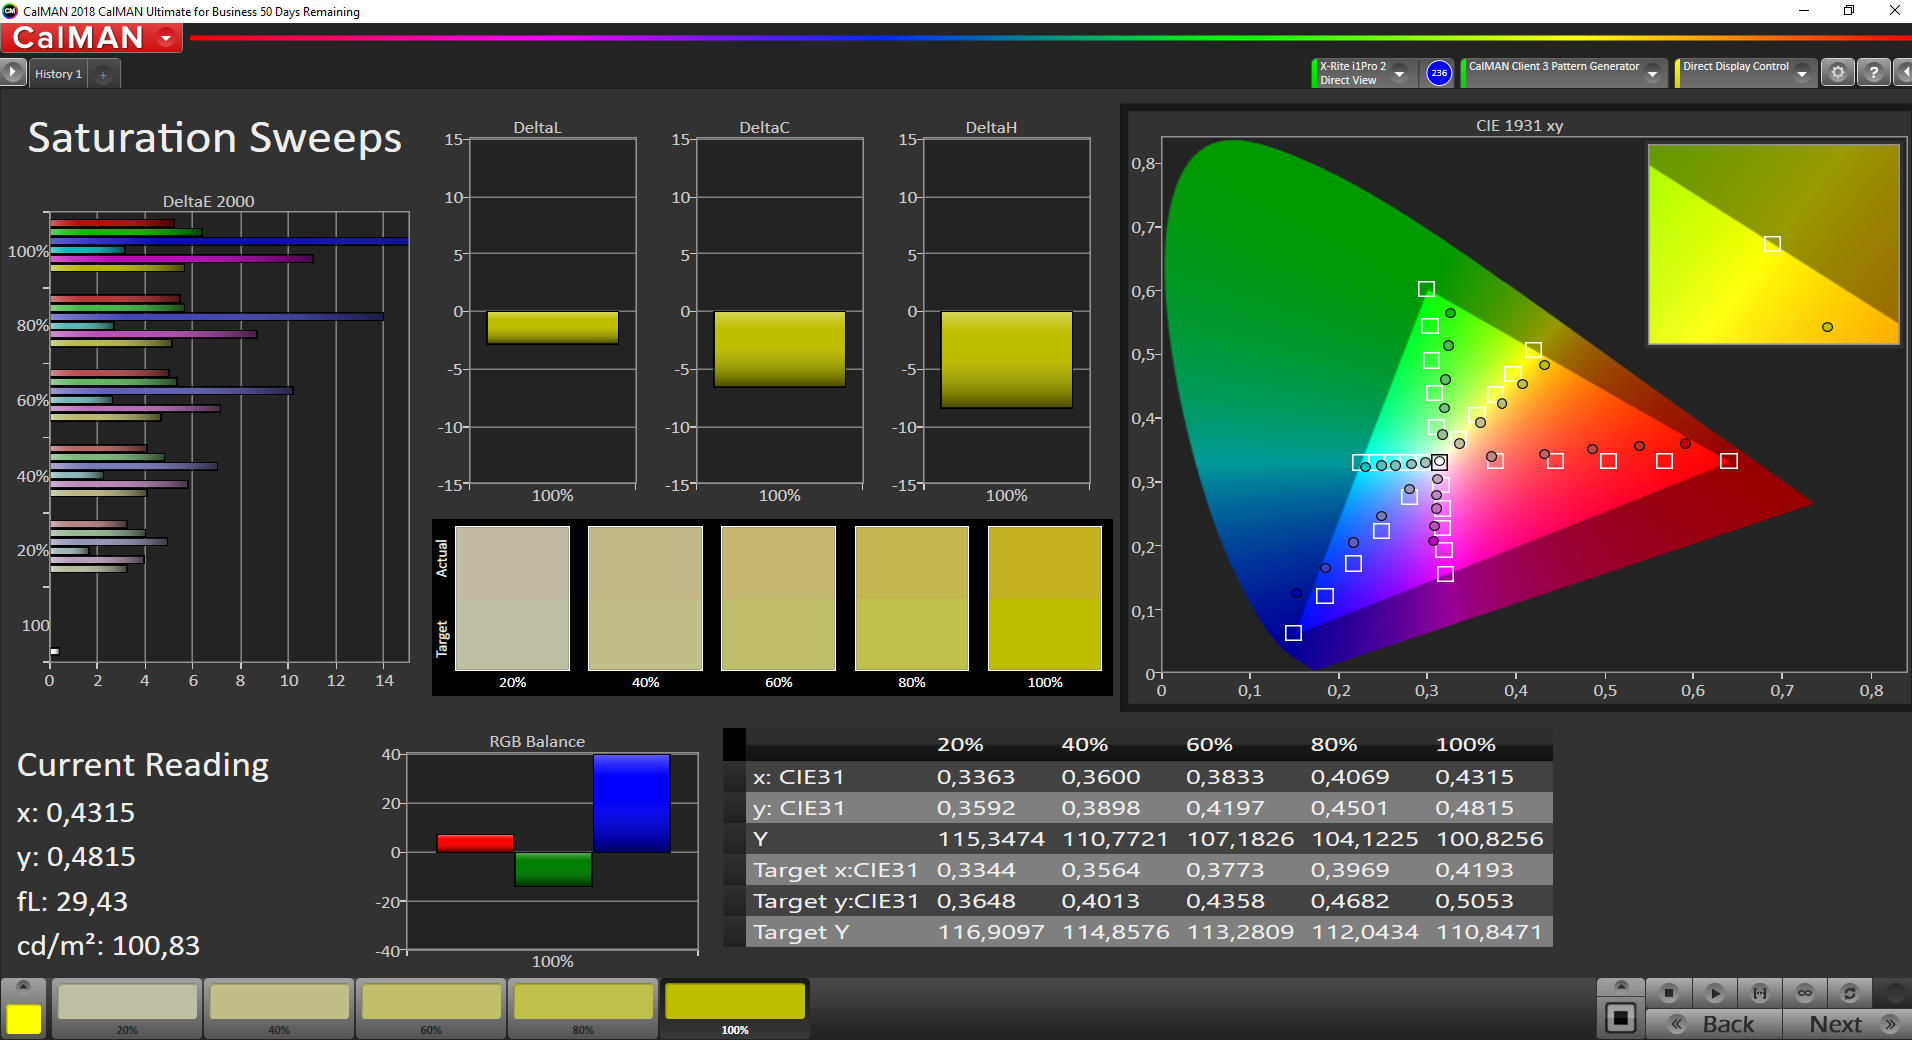
ΔE ColorChecker Calman: 5.9 | ∀{0.5-29.43 Ø4.73}
calibrated: 4.7
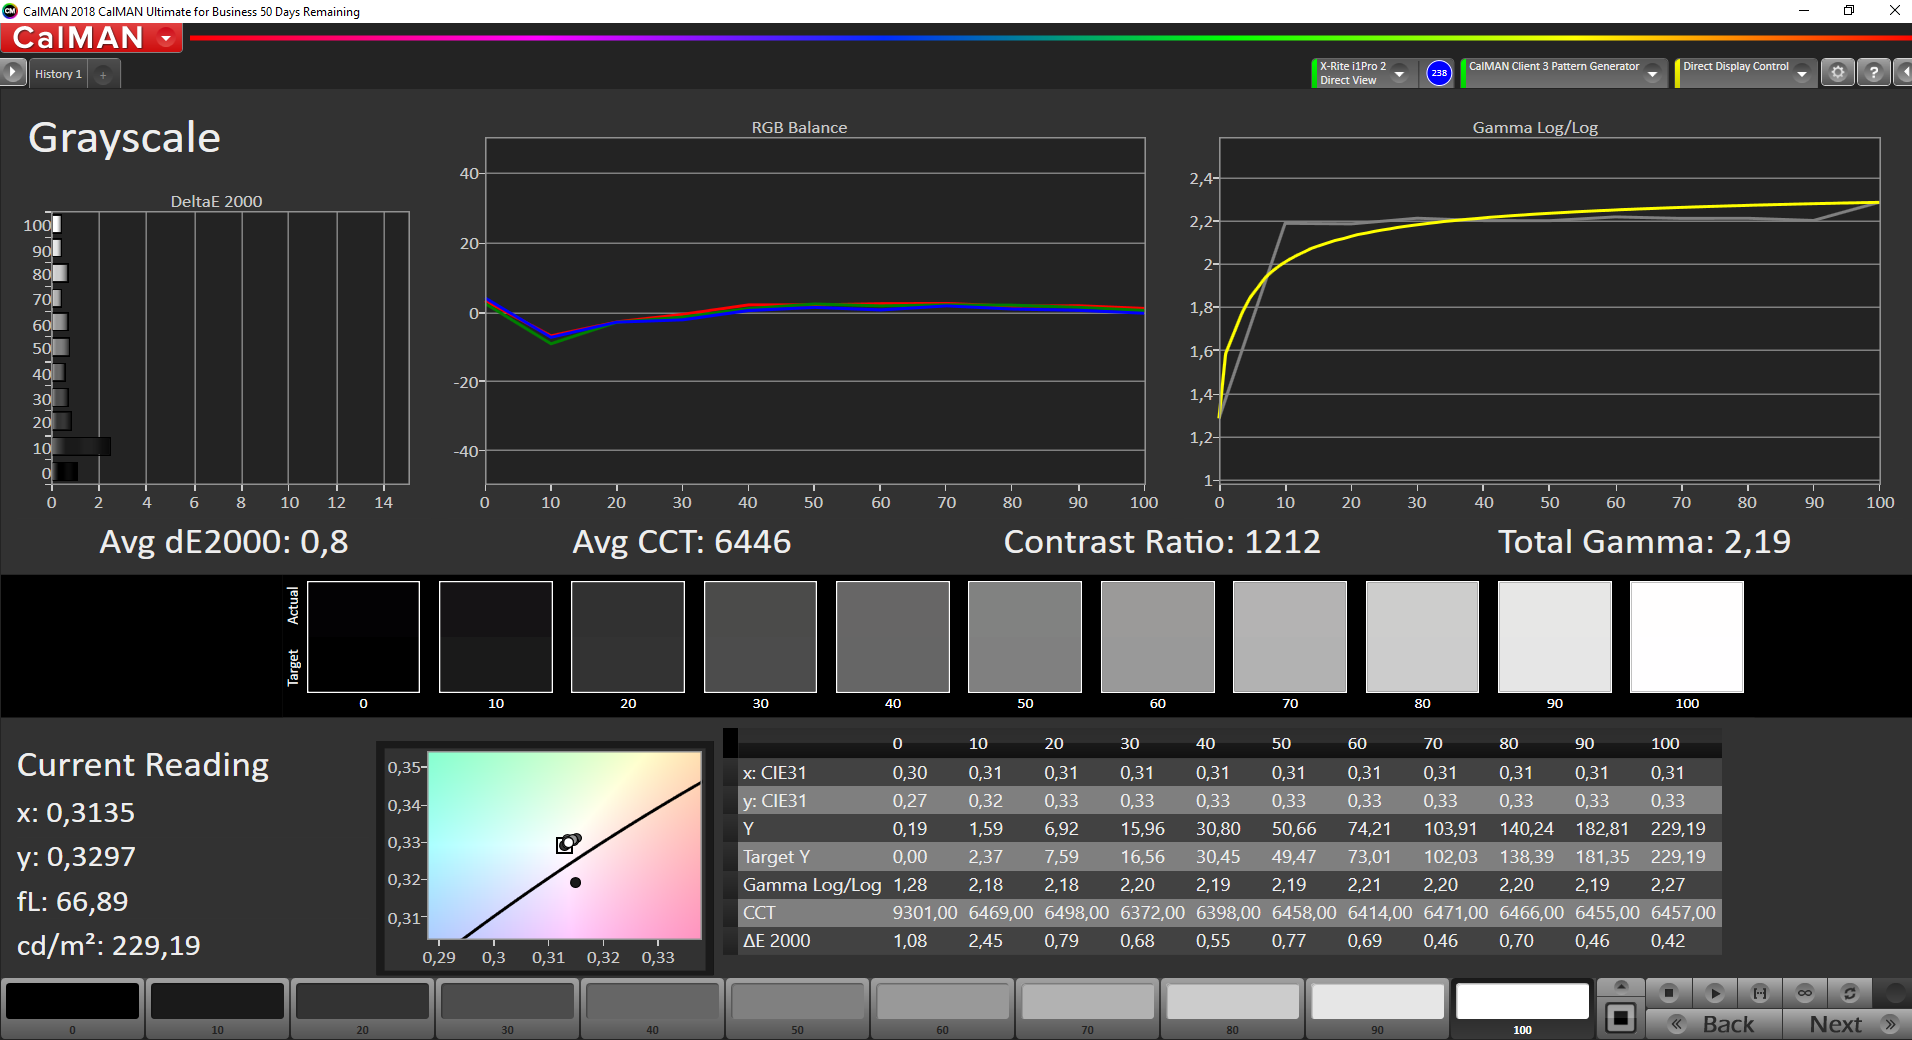
ΔE Greyscale Calman: 5.1 | ∀{0.09-98 Ø4.97}
64.1% sRGB (Argyll 1.6.3 3D)
41.2% AdobeRGB 1998 (Argyll 1.6.3 3D)
44.81% AdobeRGB 1998 (Argyll 3D)
64.4% sRGB (Argyll 3D)
43.3% Display P3 (Argyll 3D)
Gamma: 2.21
CCT: 6398 K
| Lenovo ThinkPad L590-20Q70019GE N156HCE-EAA, IPS, 1920x1080, 15.6" | Lenovo ThinkPad L580-20LW000VGE N156HCE-EAA, IPS, 1920x1080, 15.6" | Schenker Slim 15-RE-E19 Chi Mei CMN15E8, IPS, 2x1, 15.6" | Lenovo ThinkPad E590-20NC0003GE LP156WFC-SPDB, IPS LED, 1920x1080, 15.6" | Tuxedo Book BU1307 AUO272D, IPS, 1920x1080, 13.3" | Acer TravelMate X3410-M-50DD N140HCA-EAC, IPS LED, 1920x1080, 14" | |
|---|---|---|---|---|---|---|
| Display | -1% | 42% | -12% | -3% | ||
| Display P3 Coverage (%) | 43.3 | 42.86 -1% | 63.7 47% | 38.21 -12% | 41.96 -3% | |
| sRGB Coverage (%) | 64.4 | 64.4 0% | 87.7 36% | 57.5 -11% | 63 -2% | |
| AdobeRGB 1998 Coverage (%) | 44.81 | 44.29 -1% | 63.9 43% | 39.47 -12% | 43.37 -3% | |
| Response Times | 16% | 18% | 9% | 27% | 3% | |
| Response Time Grey 50% / Grey 80% * (ms) | 42.8 ? | 33.6 ? 21% | 37 ? 14% | 40 ? 7% | 34 ? 21% | 42 ? 2% |
| Response Time Black / White * (ms) | 30.8 ? | 27.6 ? 10% | 24 ? 22% | 27.6 ? 10% | 21 ? 32% | 30 ? 3% |
| PWM Frequency (Hz) | 24510 ? | 24750 ? | 25000 ? | 400 ? | 24500 ? | |
| Screen | 13% | 11% | 5% | -9% | 24% | |
| Brightness middle (cd/m²) | 247 | 269 9% | 289 17% | 254 3% | 333 35% | 255 3% |
| Brightness (cd/m²) | 228 | 237 4% | 280 23% | 251 10% | 319 40% | 218 -4% |
| Brightness Distribution (%) | 81 | 80 -1% | 87 7% | 90 11% | 83 2% | 72 -11% |
| Black Level * (cd/m²) | 0.18 | 0.21 -17% | 0.36 -100% | 0.2 -11% | 0.3 -67% | 0.08 56% |
| Contrast (:1) | 1372 | 1281 -7% | 803 -41% | 1270 -7% | 1110 -19% | 3188 132% |
| Colorchecker dE 2000 * | 5.9 | 3.9 34% | 3.93 33% | 5.6 5% | 5.01 15% | |
| Colorchecker dE 2000 max. * | 22.9 | 16.3 29% | 6.98 70% | 15.4 33% | 17.44 24% | |
| Colorchecker dE 2000 calibrated * | 4.7 | 3.7 21% | 4.9 -4% | 4.06 14% | ||
| Greyscale dE 2000 * | 5.1 | 1.5 71% | 3.73 27% | 3.1 39% | 7.35 -44% | 3 41% |
| Gamma | 2.21 100% | 2.21 100% | 2.42 91% | 2.22 99% | 2.35 94% | 2.26 97% |
| CCT | 6398 102% | 6332 103% | 6802 96% | 6450 101% | 7156 91% | 6185 105% |
| Color Space (Percent of AdobeRGB 1998) (%) | 41.2 | 40.8 -1% | 57 38% | 36.3 -12% | 40 -3% | |
| Color Space (Percent of sRGB) (%) | 64.1 | 64.3 0% | 87 36% | 57.1 -11% | 63 -2% | |
| Totaal Gemiddelde (Programma / Instellingen) | 9% /
11% | 24% /
18% | 1% /
2% | 9% /
0% | 8% /
16% |
* ... kleiner is beter
Responstijd Scherm
| ↔ Responstijd Zwart naar Wit | ||
|---|---|---|
| 30.8 ms ... stijging ↗ en daling ↘ gecombineerd | ↗ 18 ms stijging | 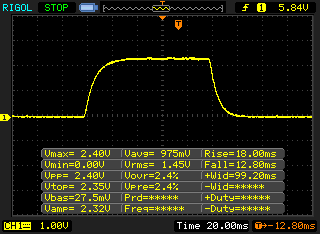 |
| ↘ 12.8 ms daling | ||
| Het scherm vertoonde trage responstijden in onze tests en is misschien te traag voor games. Ter vergelijking: alle testtoestellen variëren van 0.1 (minimum) tot 240 (maximum) ms. » 83 % van alle toestellen zijn beter. Dit betekent dat de gemeten responstijd slechter is dan het gemiddelde (19.9 ms) van alle geteste toestellen. | ||
| ↔ Responstijd 50% Grijs naar 80% Grijs | ||
| 42.8 ms ... stijging ↗ en daling ↘ gecombineerd | ↗ 22.8 ms stijging | 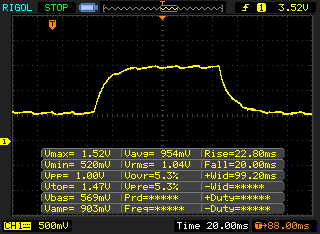 |
| ↘ 20 ms daling | ||
| Het scherm vertoonde trage responstijden in onze tests en is misschien te traag voor games. Ter vergelijking: alle testtoestellen variëren van 0.165 (minimum) tot 636 (maximum) ms. » 70 % van alle toestellen zijn beter. Dit betekent dat de gemeten responstijd slechter is dan het gemiddelde (31.1 ms) van alle geteste toestellen. | ||
Screen Flickering / PWM (Pulse-Width Modulation)
| Screen flickering / PWM waargenomen | 24510 Hz | ≤ 40 % helderheid instelling | 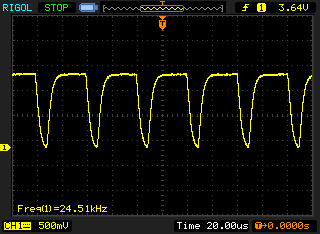 |
De achtergrondverlichting van het scherm flikkert op 24510 Hz (in het slechtste geval, bijvoorbeeld bij gebruik van PWM) aan een helderheid van 40 % en lager. Boven deze helderheid zou er geen flickering / PWM mogen optreden. De frequentie van 24510 Hz is redelijk hoog en de meeste mensen die gevoelig zijn aan flickering zouden dit dus niet mogen waarnemen of geïrriteerde ogen krijgen. Ter vergelijking: 52 % van alle geteste toestellen maakten geen gebruik van PWM om de schermhelderheid te verlagen. Als het wel werd gebruikt, werd een gemiddelde van 7798 (minimum: 5 - maximum: 343500) Hz waargenomen. | |||
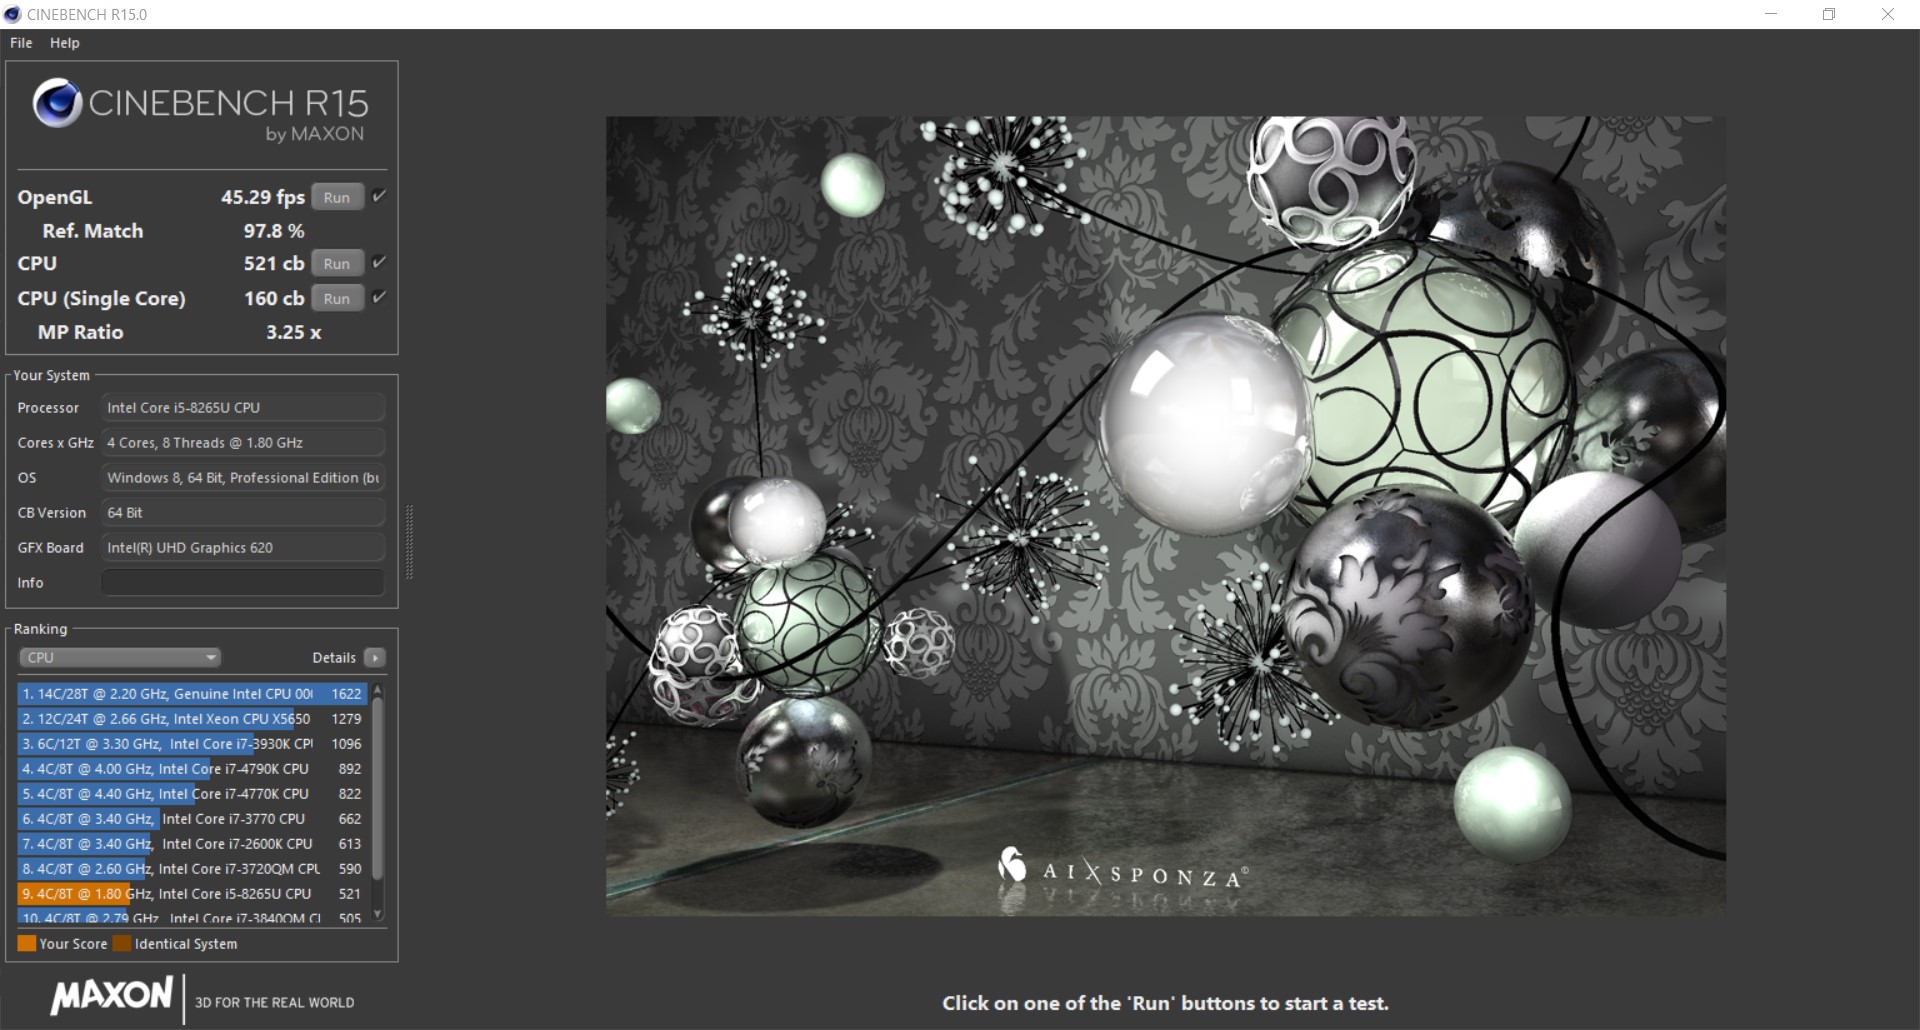
| Cinebench R15 | |
| CPU Single 64Bit | |
| Lenovo ThinkPad E590-20NC0003GE | |
| Acer TravelMate X3410-M-50DD | |
| Schenker Slim 15-RE-E19 | |
| Lenovo ThinkPad L590-20Q70019GE | |
| Gemiddeld Intel Core i5-8265U (111 - 164, n=35) | |
| Tuxedo Book BU1307 | |
| Lenovo ThinkPad L580-20LW000VGE | |
| CPU Multi 64Bit | |
| Gemiddeld Intel Core i5-8265U (457 - 750, n=38) | |
| Lenovo ThinkPad L580-20LW000VGE | |
| Schenker Slim 15-RE-E19 | |
| Lenovo ThinkPad E590-20NC0003GE | |
| Tuxedo Book BU1307 | |
| Acer TravelMate X3410-M-50DD | |
| Lenovo ThinkPad L590-20Q70019GE | |
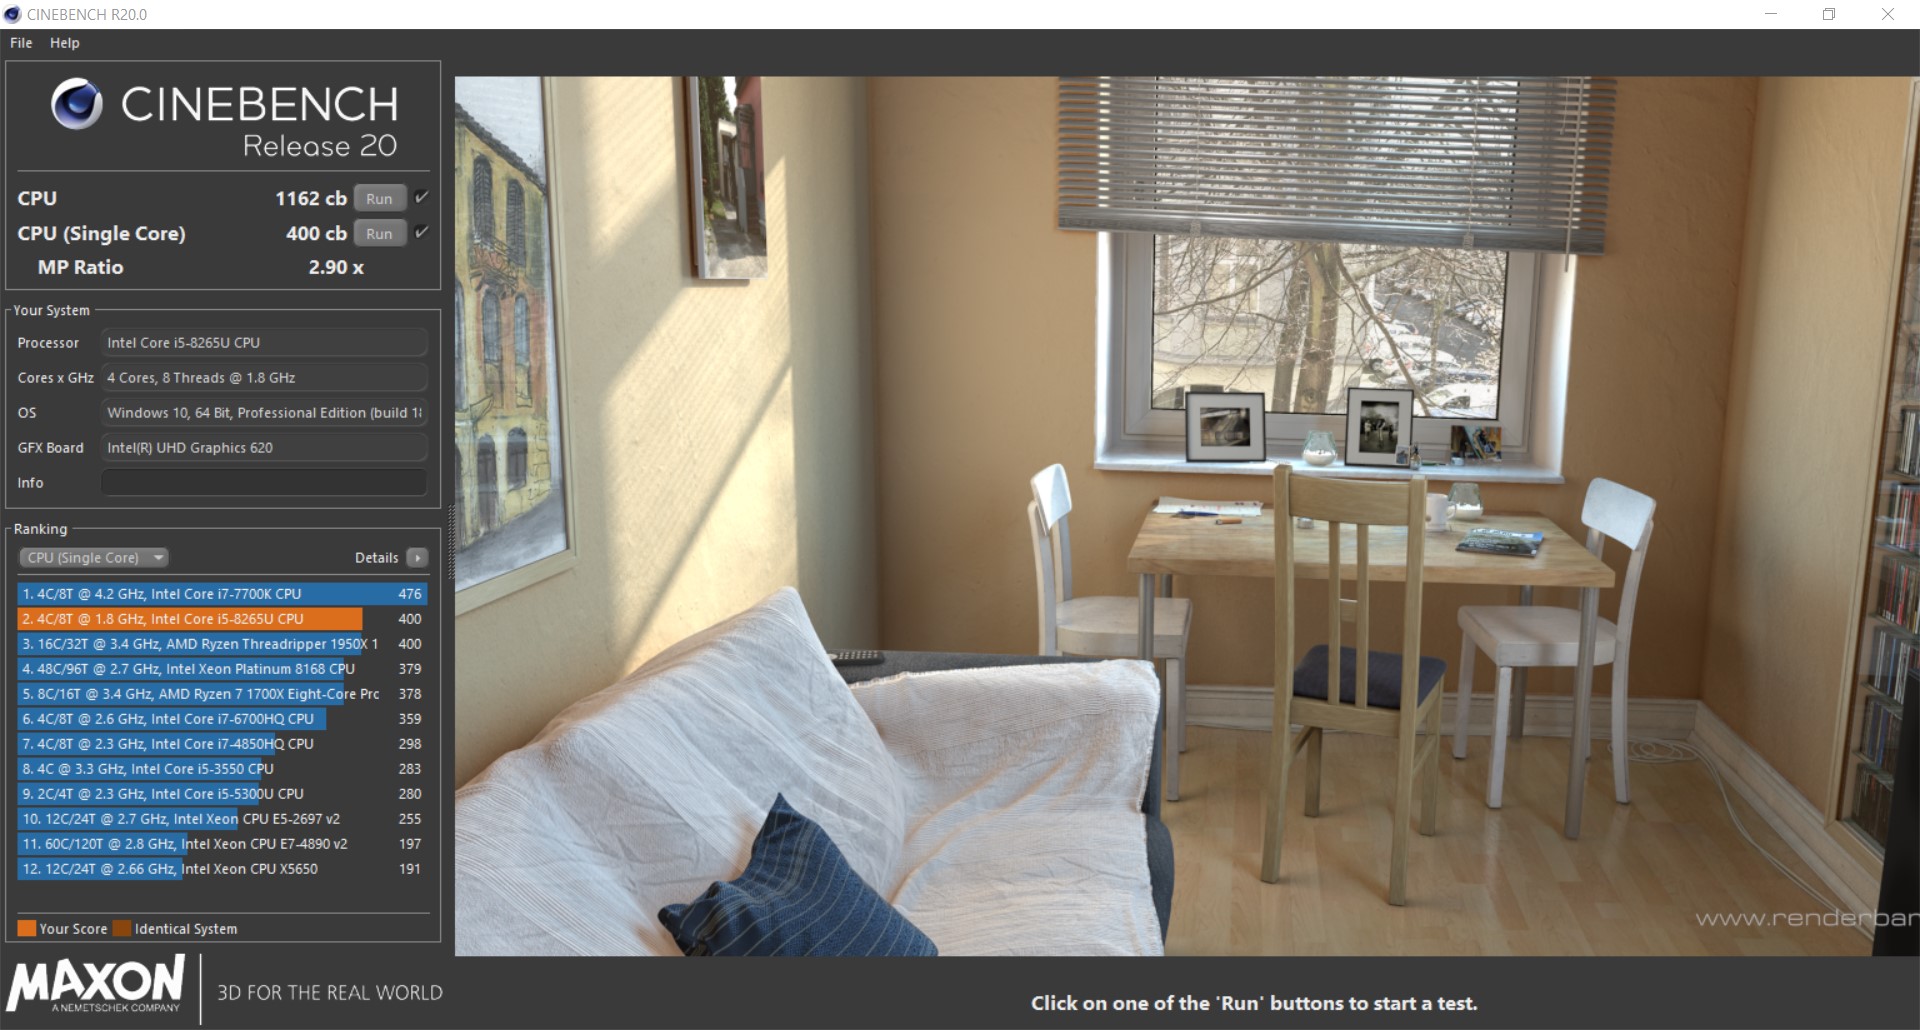
| Cinebench R20 | |
| CPU (Single Core) | |
| Lenovo ThinkPad L590-20Q70019GE | |
| Gemiddeld Intel Core i5-8265U (325 - 403, n=16) | |
| CPU (Multi Core) | |
| Gemiddeld Intel Core i5-8265U (972 - 1564, n=16) | |
| Lenovo ThinkPad L590-20Q70019GE | |
| 3DMark 11 - 1280x720 Performance Physics | |
| Schenker Slim 15-RE-E19 | |
| Gemiddeld Intel Core i5-8265U (4154 - 8443, n=35) | |
| Lenovo ThinkPad L580-20LW000VGE | |
| Tuxedo Book BU1307 | |
| Acer TravelMate X3410-M-50DD | |
| Lenovo ThinkPad E590-20NC0003GE | |
| Lenovo ThinkPad L590-20Q70019GE | |
| Blender - v2.79 BMW27 CPU | |
| Lenovo ThinkPad L590-20Q70019GE | |
| Gemiddeld Intel Core i5-8265U (769 - 1098, n=15) | |
| Geekbench 4.4 | |
| 64 Bit Single-Core Score | |
| Gemiddeld Intel Core i5-8265U (2106 - 4830, n=19) | |
| Lenovo ThinkPad L590-20Q70019GE | |
| Lenovo ThinkPad L590-20Q70019GE | |
| 64 Bit Multi-Core Score | |
| Gemiddeld Intel Core i5-8265U (7144 - 16249, n=19) | |
| Lenovo ThinkPad L590-20Q70019GE | |
| Lenovo ThinkPad L590-20Q70019GE | |
| 7-Zip 18.03 | |
| 7z b 4 | |
| Gemiddeld Intel Core i5-8265U (13731 - 18802, n=15) | |
| Lenovo ThinkPad L590-20Q70019GE | |
| 7z b 4 -mmt1 | |
| Gemiddeld Intel Core i5-8265U (3780 - 4195, n=15) | |
| Lenovo ThinkPad L590-20Q70019GE | |
* ... kleiner is beter
| PCMark 8 | |
| Home Score Accelerated v2 | |
| Gemiddelde van klas Office (n=1laatste 2 jaar) | |
| Acer TravelMate X3410-M-50DD | |
| Tuxedo Book BU1307 | |
| Schenker Slim 15-RE-E19 | |
| Gemiddeld Intel Core i5-8265U, Intel UHD Graphics 620 (2747 - 4244, n=24) | |
| Lenovo ThinkPad L580-20LW000VGE | |
| Lenovo ThinkPad L590-20Q70019GE | |
| Lenovo ThinkPad E590-20NC0003GE | |
| Work Score Accelerated v2 | |
| Gemiddelde van klas Office (n=1laatste 2 jaar) | |
| Acer TravelMate X3410-M-50DD | |
| Gemiddeld Intel Core i5-8265U, Intel UHD Graphics 620 (3132 - 4927, n=23) | |
| Lenovo ThinkPad L580-20LW000VGE | |
| Lenovo ThinkPad E590-20NC0003GE | |
| Lenovo ThinkPad L590-20Q70019GE | |
| PCMark 8 Home Score Accelerated v2 | 2747 punten | |
| PCMark 8 Creative Score Accelerated v2 | 3504 punten | |
| PCMark 8 Work Score Accelerated v2 | 3132 punten | |
| PCMark 10 Score | 2247 punten | |
Help | ||
| Lenovo ThinkPad L590-20Q70019GE Toshiba XG6 KXG6AZNV512G | Lenovo ThinkPad L580-20LW000VGE Samsung PM961 MZVLW256HEHP | Schenker Slim 15-RE-E19 Samsung SSD 970 EVO Plus 500GB | Lenovo ThinkPad E590-20NC0003GE Toshiba KBG30ZMT512G | Tuxedo Book BU1307 Samsung SSD 970 EVO 250GB | Acer TravelMate X3410-M-50DD Micron 1100 MTFDDAV256TBN | Gemiddeld Toshiba XG6 KXG6AZNV512G | |
|---|---|---|---|---|---|---|---|
| CrystalDiskMark 5.2 / 6 | -0% | 45% | -45% | 16% | -58% | 31% | |
| Write 4K (MB/s) | 115.3 | 117 1% | 187.2 62% | 53.4 -54% | 158.2 37% | 85.4 -26% | 139 ? 21% |
| Read 4K (MB/s) | 43.34 | 41.47 -4% | 51.8 20% | 33.03 -24% | 38.78 -11% | 26.4 -39% | 45.8 ? 6% |
| Write Seq (MB/s) | 1014 | 791 -22% | 1438 42% | 624 -38% | 1487 47% | 402.5 -60% | 1628 ? 61% |
| Read Seq (MB/s) | 1481 | 1390 -6% | 1347 -9% | 835 -44% | 913 -38% | 461.2 -69% | 1647 ? 11% |
| Write 4K Q32T1 (MB/s) | 495.4 | 651 31% | 396.7 -20% | 87.4 -82% | 330.5 -33% | 175.8 -65% | 547 ? 10% |
| Read 4K Q32T1 (MB/s) | 332.6 | 408.9 23% | 534 61% | 135.9 -59% | 423.8 27% | 228.8 -31% | 436 ? 31% |
| Write Seq Q32T1 (MB/s) | 1654 | 1227 -26% | 3280 98% | 784 -53% | 1540 -7% | 442.9 -73% | 2522 ? 52% |
| Read Seq Q32T1 (MB/s) | 1746 | 1779 2% | 3556 104% | 1623 -7% | 3556 104% | 522 -70% | 2739 ? 57% |
| Write 4K Q8T8 (MB/s) | 1033 | 309 -70% | 1266 ? 23% | ||||
| Read 4K Q8T8 (MB/s) | 892 | 247.1 -72% | 1212 ? 36% | ||||
| AS SSD | -10% | 52% | -58% | -723% | -50% | 18% | |
| Seq Read (MB/s) | 1383 | 1315 -5% | 2661 92% | 1348 -3% | 2406 74% | 492.9 -64% | 2383 ? 72% |
| Seq Write (MB/s) | 852 | 741 -13% | 2426 185% | 789 -7% | 435.1 -49% | 462.2 -46% | 1459 ? 71% |
| 4K Read (MB/s) | 45.72 | 45.28 -1% | 59 29% | 38.82 -15% | 50.2 10% | 26.89 -41% | 46.8 ? 2% |
| 4K Write (MB/s) | 120.2 | 119.9 0% | 166 38% | 81.8 -32% | 1.45 -99% | 85.1 -29% | 125.1 ? 4% |
| 4K-64 Read (MB/s) | 1344 | 1186 -12% | 1314 -2% | 825 -39% | 818 -39% | 234.2 -83% | 1294 ? -4% |
| 4K-64 Write (MB/s) | 926 | 456.3 -51% | 1494 61% | 488 -47% | 145.6 -84% | 312.8 -66% | 1276 ? 38% |
| Access Time Read * (ms) | 0.063 | 0.043 32% | 0.046 27% | 0.081 -29% | 0.047 25% | 0.0825 ? -31% | |
| Access Time Write * (ms) | 0.036 | 0.029 19% | 0.023 36% | 0.188 -422% | 2.784 -7633% | 0.056 -56% | 0.0335 ? 7% |
| Score Read (Points) | 1528 | 1363 -11% | 1639 7% | 999 -35% | 1108 -27% | 310 -80% | 1580 ? 3% |
| Score Write (Points) | 1132 | 650 -43% | 1902 68% | 649 -43% | 191 -83% | 444 -61% | 1547 ? 37% |
| Score Total (Points) | 3420 | 2689 -21% | 4379 28% | 2139 -37% | 1780 -48% | 922 -73% | 3893 ? 14% |
| Copy ISO MB/s (MB/s) | 1147 | 876 -24% | 923 -20% | 1645 ? 43% | |||
| Copy Program MB/s (MB/s) | 419.8 | 209.7 -50% | 453.6 8% | 425 ? 1% | |||
| Copy Game MB/s (MB/s) | 928 | 599 -35% | 523 -44% | 933 ? 1% | |||
| Totaal Gemiddelde (Programma / Instellingen) | -5% /
-6% | 49% /
49% | -52% /
-54% | -354% /
-412% | -54% /
-53% | 25% /
24% |
* ... kleiner is beter

| 3DMark 11 - 1280x720 Performance GPU | |
| Gemiddelde van klas Office (2551 - 18313, n=68, laatste 2 jaar) | |
| Acer TravelMate X3410-M-50DD | |
| Lenovo ThinkPad E590-20NC0003GE | |
| Schenker Slim 15-RE-E19 | |
| Gemiddeld Intel UHD Graphics 620 (1144 - 3432, n=244) | |
| Lenovo ThinkPad L590-20Q70019GE | |
| Lenovo ThinkPad L580-20LW000VGE | |
| Tuxedo Book BU1307 | |
| 3DMark | |
| 1280x720 Cloud Gate Standard Graphics | |
| Gemiddelde van klas Office (11640 - 118515, n=37, laatste 2 jaar) | |
| Acer TravelMate X3410-M-50DD | |
| Lenovo ThinkPad E590-20NC0003GE | |
| Gemiddeld Intel UHD Graphics 620 (6205 - 16400, n=225) | |
| Lenovo ThinkPad L590-20Q70019GE | |
| Lenovo ThinkPad L580-20LW000VGE | |
| 1920x1080 Fire Strike Graphics | |
| Gemiddelde van klas Office (736 - 21871, n=72, laatste 2 jaar) | |
| Acer TravelMate X3410-M-50DD | |
| Lenovo ThinkPad E590-20NC0003GE | |
| Gemiddeld Intel UHD Graphics 620 (557 - 2608, n=213) | |
| Lenovo ThinkPad L590-20Q70019GE | |
| Lenovo ThinkPad L580-20LW000VGE | |
| 2560x1440 Time Spy Graphics | |
| Gemiddelde van klas Office (493 - 6679, n=67, laatste 2 jaar) | |
| Gemiddeld Intel UHD Graphics 620 (299 - 797, n=88) | |
| Lenovo ThinkPad L590-20Q70019GE | |
| 3DMark 11 Performance | 1846 punten | |
| 3DMark Ice Storm Standard Score | 41848 punten | |
| 3DMark Cloud Gate Standard Score | 6555 punten | |
| 3DMark Fire Strike Score | 1043 punten | |
| 3DMark Fire Strike Extreme Score | 501 punten | |
| 3DMark Time Spy Score | 412 punten | |
Help | ||
| lage | gem. | hoge | ultra | |
|---|---|---|---|---|
| BioShock Infinite (2013) | 56 | 31 | 24 | 8 |
| Dota 2 Reborn (2015) | 60.4 | 36.7 | 18 | 16.2 |
| Rise of the Tomb Raider (2016) | 16.6 | 12.3 | 6.5 | |
| X-Plane 11.11 (2018) | 17.6 | 12.8 | 11.1 |
Geluidsniveau
| Onbelast |
| 29 / 29 / 29 dB (A) |
| Belasting |
| 29 / 33.8 dB (A) |
 | ||
30 dB stil 40 dB(A) hoorbaar 50 dB(A) luid |
||
min: | ||
| Lenovo ThinkPad L590-20Q70019GE UHD Graphics 620, i5-8265U, Toshiba XG6 KXG6AZNV512G | Lenovo ThinkPad L580-20LW000VGE UHD Graphics 620, i5-8250U, Samsung PM961 MZVLW256HEHP | Schenker Slim 15-RE-E19 UHD Graphics 620, i5-8265U, Samsung SSD 970 EVO Plus 500GB | Lenovo ThinkPad E590-20NC0003GE UHD Graphics 620, i7-8565U, Toshiba KBG30ZMT512G | Tuxedo Book BU1307 UHD Graphics 620, i5-8550U, Samsung SSD 970 EVO 250GB | Acer TravelMate X3410-M-50DD GeForce MX130, i5-8550U, Micron 1100 MTFDDAV256TBN | |
|---|---|---|---|---|---|---|
| Noise | -7% | -19% | -0% | -7% | -9% | |
| uit / omgeving * (dB) | 29 | 29.9 -3% | 30.4 -5% | 29.3 -1% | 30.5 -5% | 30.2 -4% |
| Idle Minimum * (dB) | 29 | 29.9 -3% | 30.4 -5% | 29.3 -1% | 30.5 -5% | 30.2 -4% |
| Idle Average * (dB) | 29 | 29.9 -3% | 30.4 -5% | 29.3 -1% | 30.8 -6% | 30.2 -4% |
| Idle Maximum * (dB) | 29 | 31.6 -9% | 31.6 -9% | 29.3 -1% | 30.8 -6% | 30.2 -4% |
| Load Average * (dB) | 29 | 33.1 -14% | 44.8 -54% | 30.6 -6% | 34.3 -18% | 36.8 -27% |
| Load Maximum * (dB) | 33.8 | 36 -7% | 44.8 -33% | 30.6 9% | 34.3 -1% | 36.8 -9% |
* ... kleiner is beter
(±) De maximumtemperatuur aan de bovenzijde bedraagt 42.7 °C / 109 F, vergeleken met het gemiddelde van 34.3 °C / 94 F, variërend van 21.2 tot 62.5 °C voor de klasse Office.
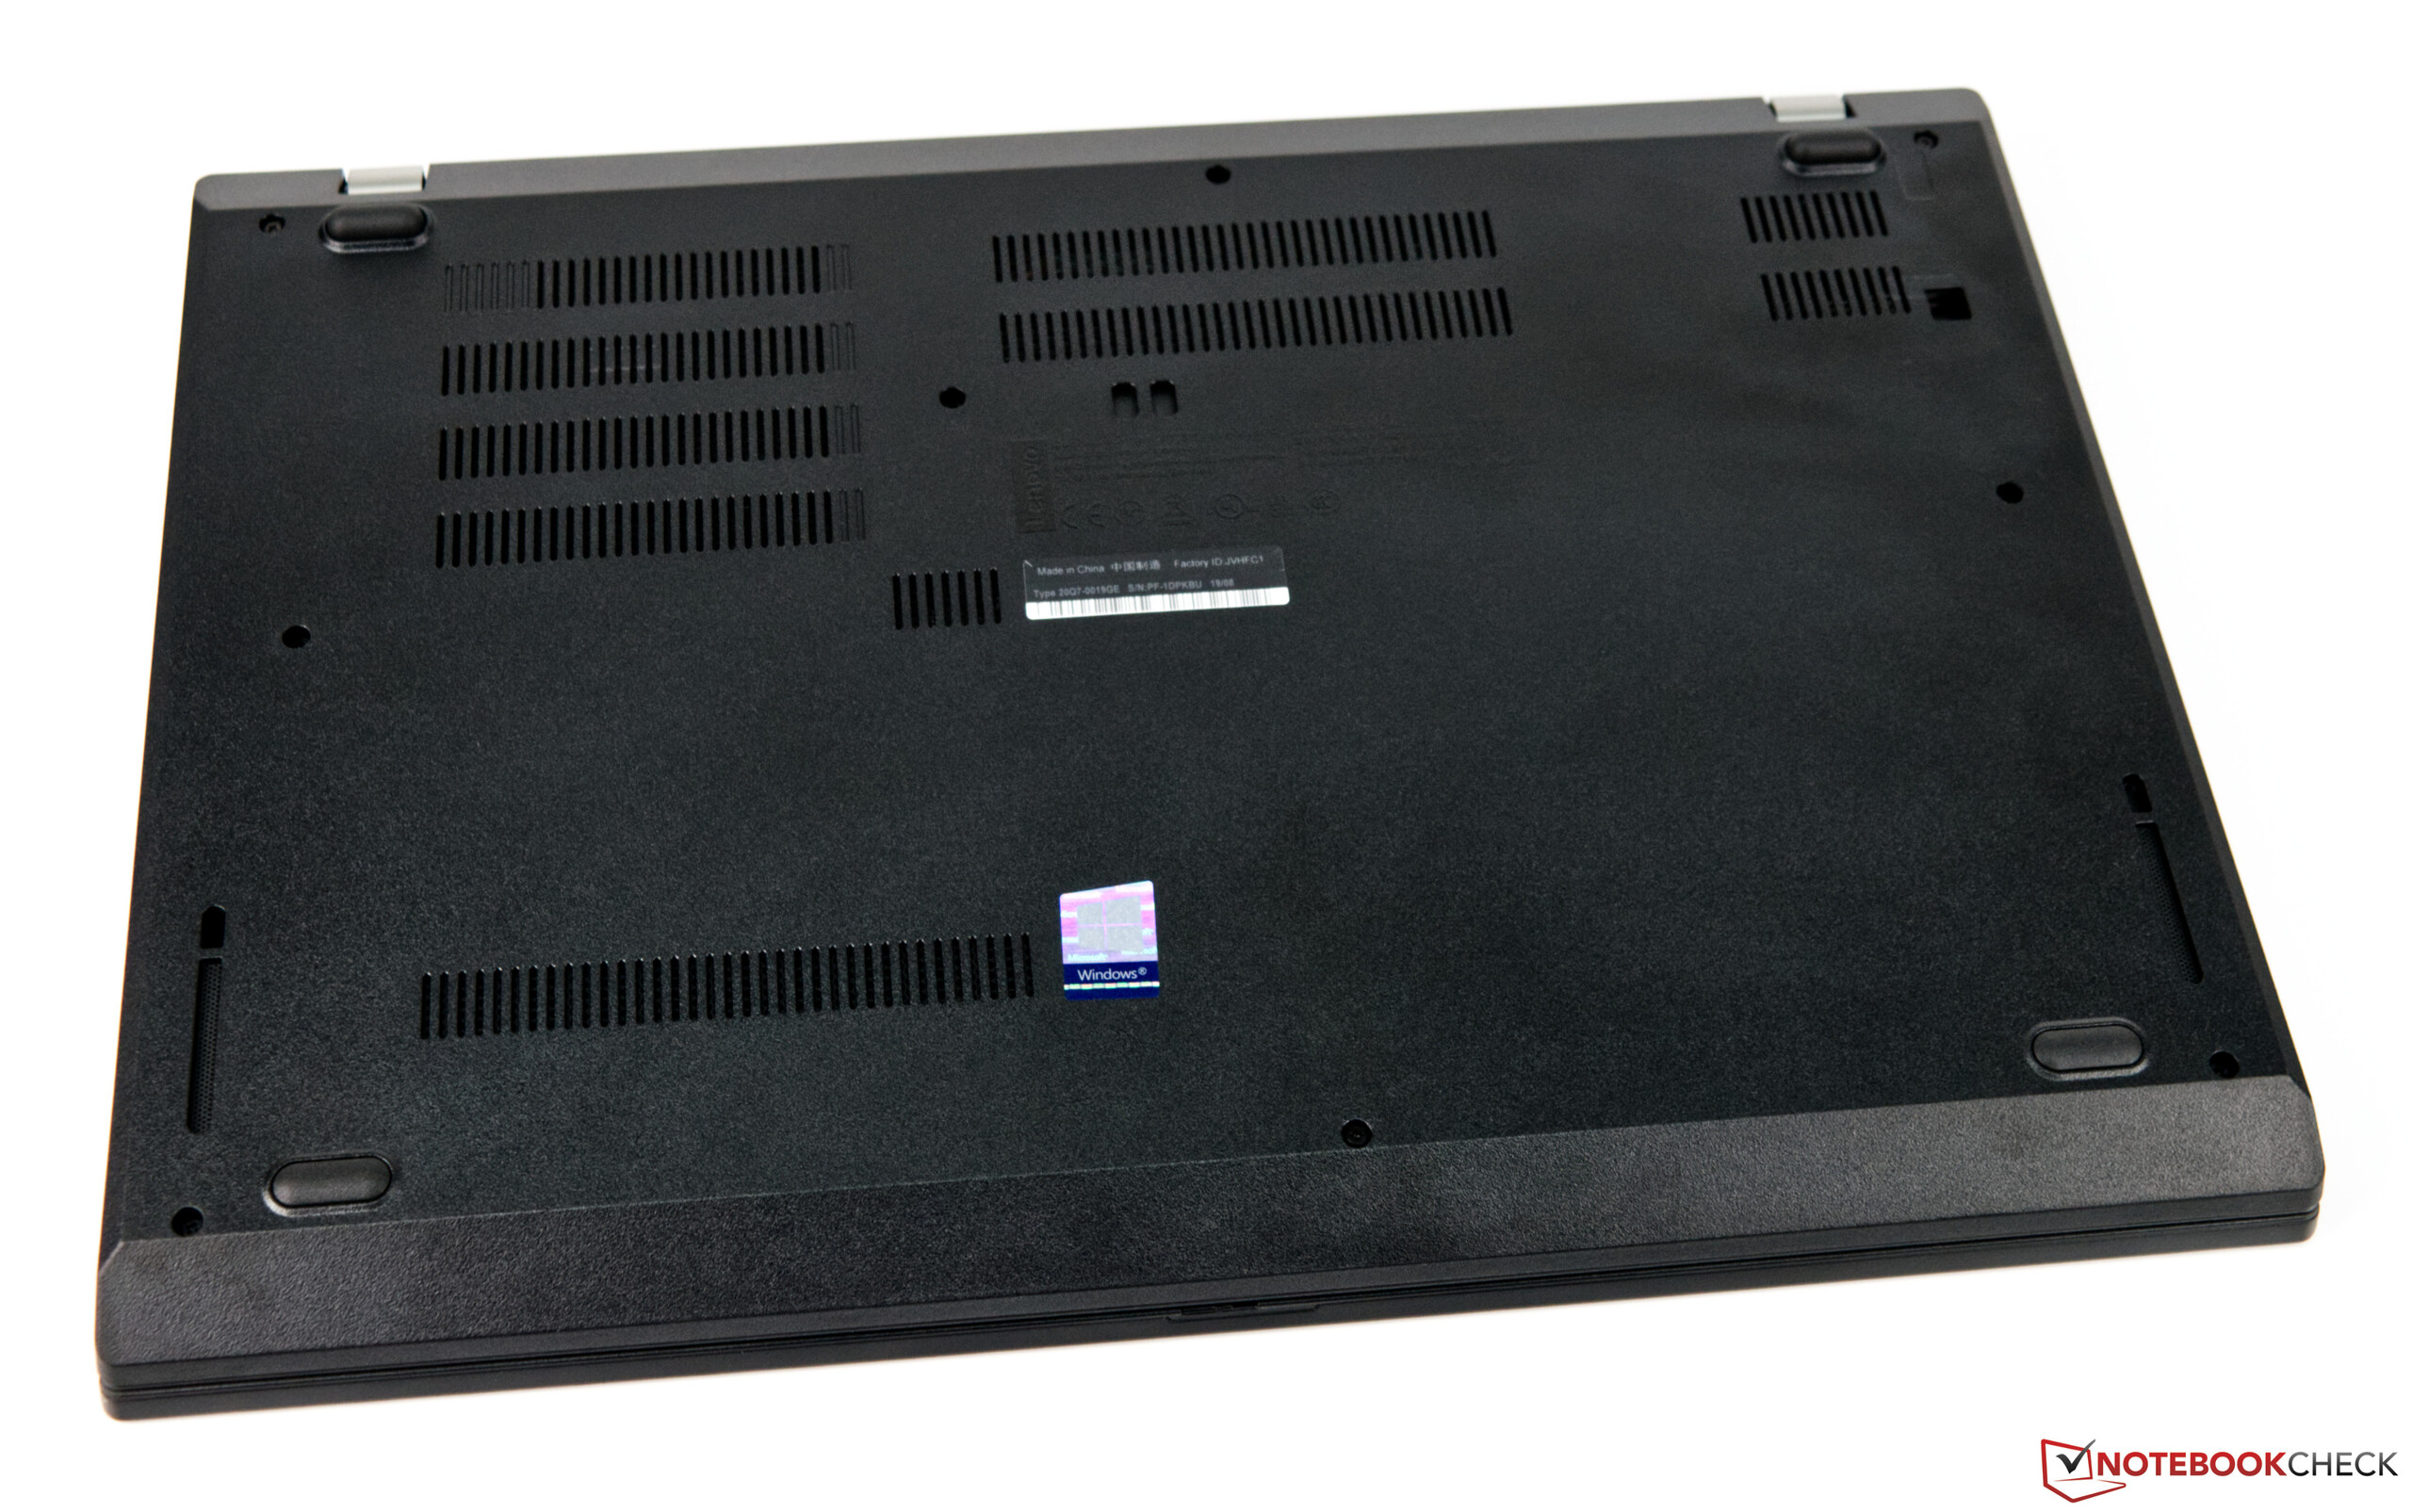
(-) De bodem warmt op tot een maximum van 51 °C / 124 F, vergeleken met een gemiddelde van 36.8 °C / 98 F
(+) Bij onbelast gebruik bedraagt de gemiddelde temperatuur voor de bovenzijde 24.8 °C / 77 F, vergeleken met het apparaatgemiddelde van 29.5 °C / 85 F.
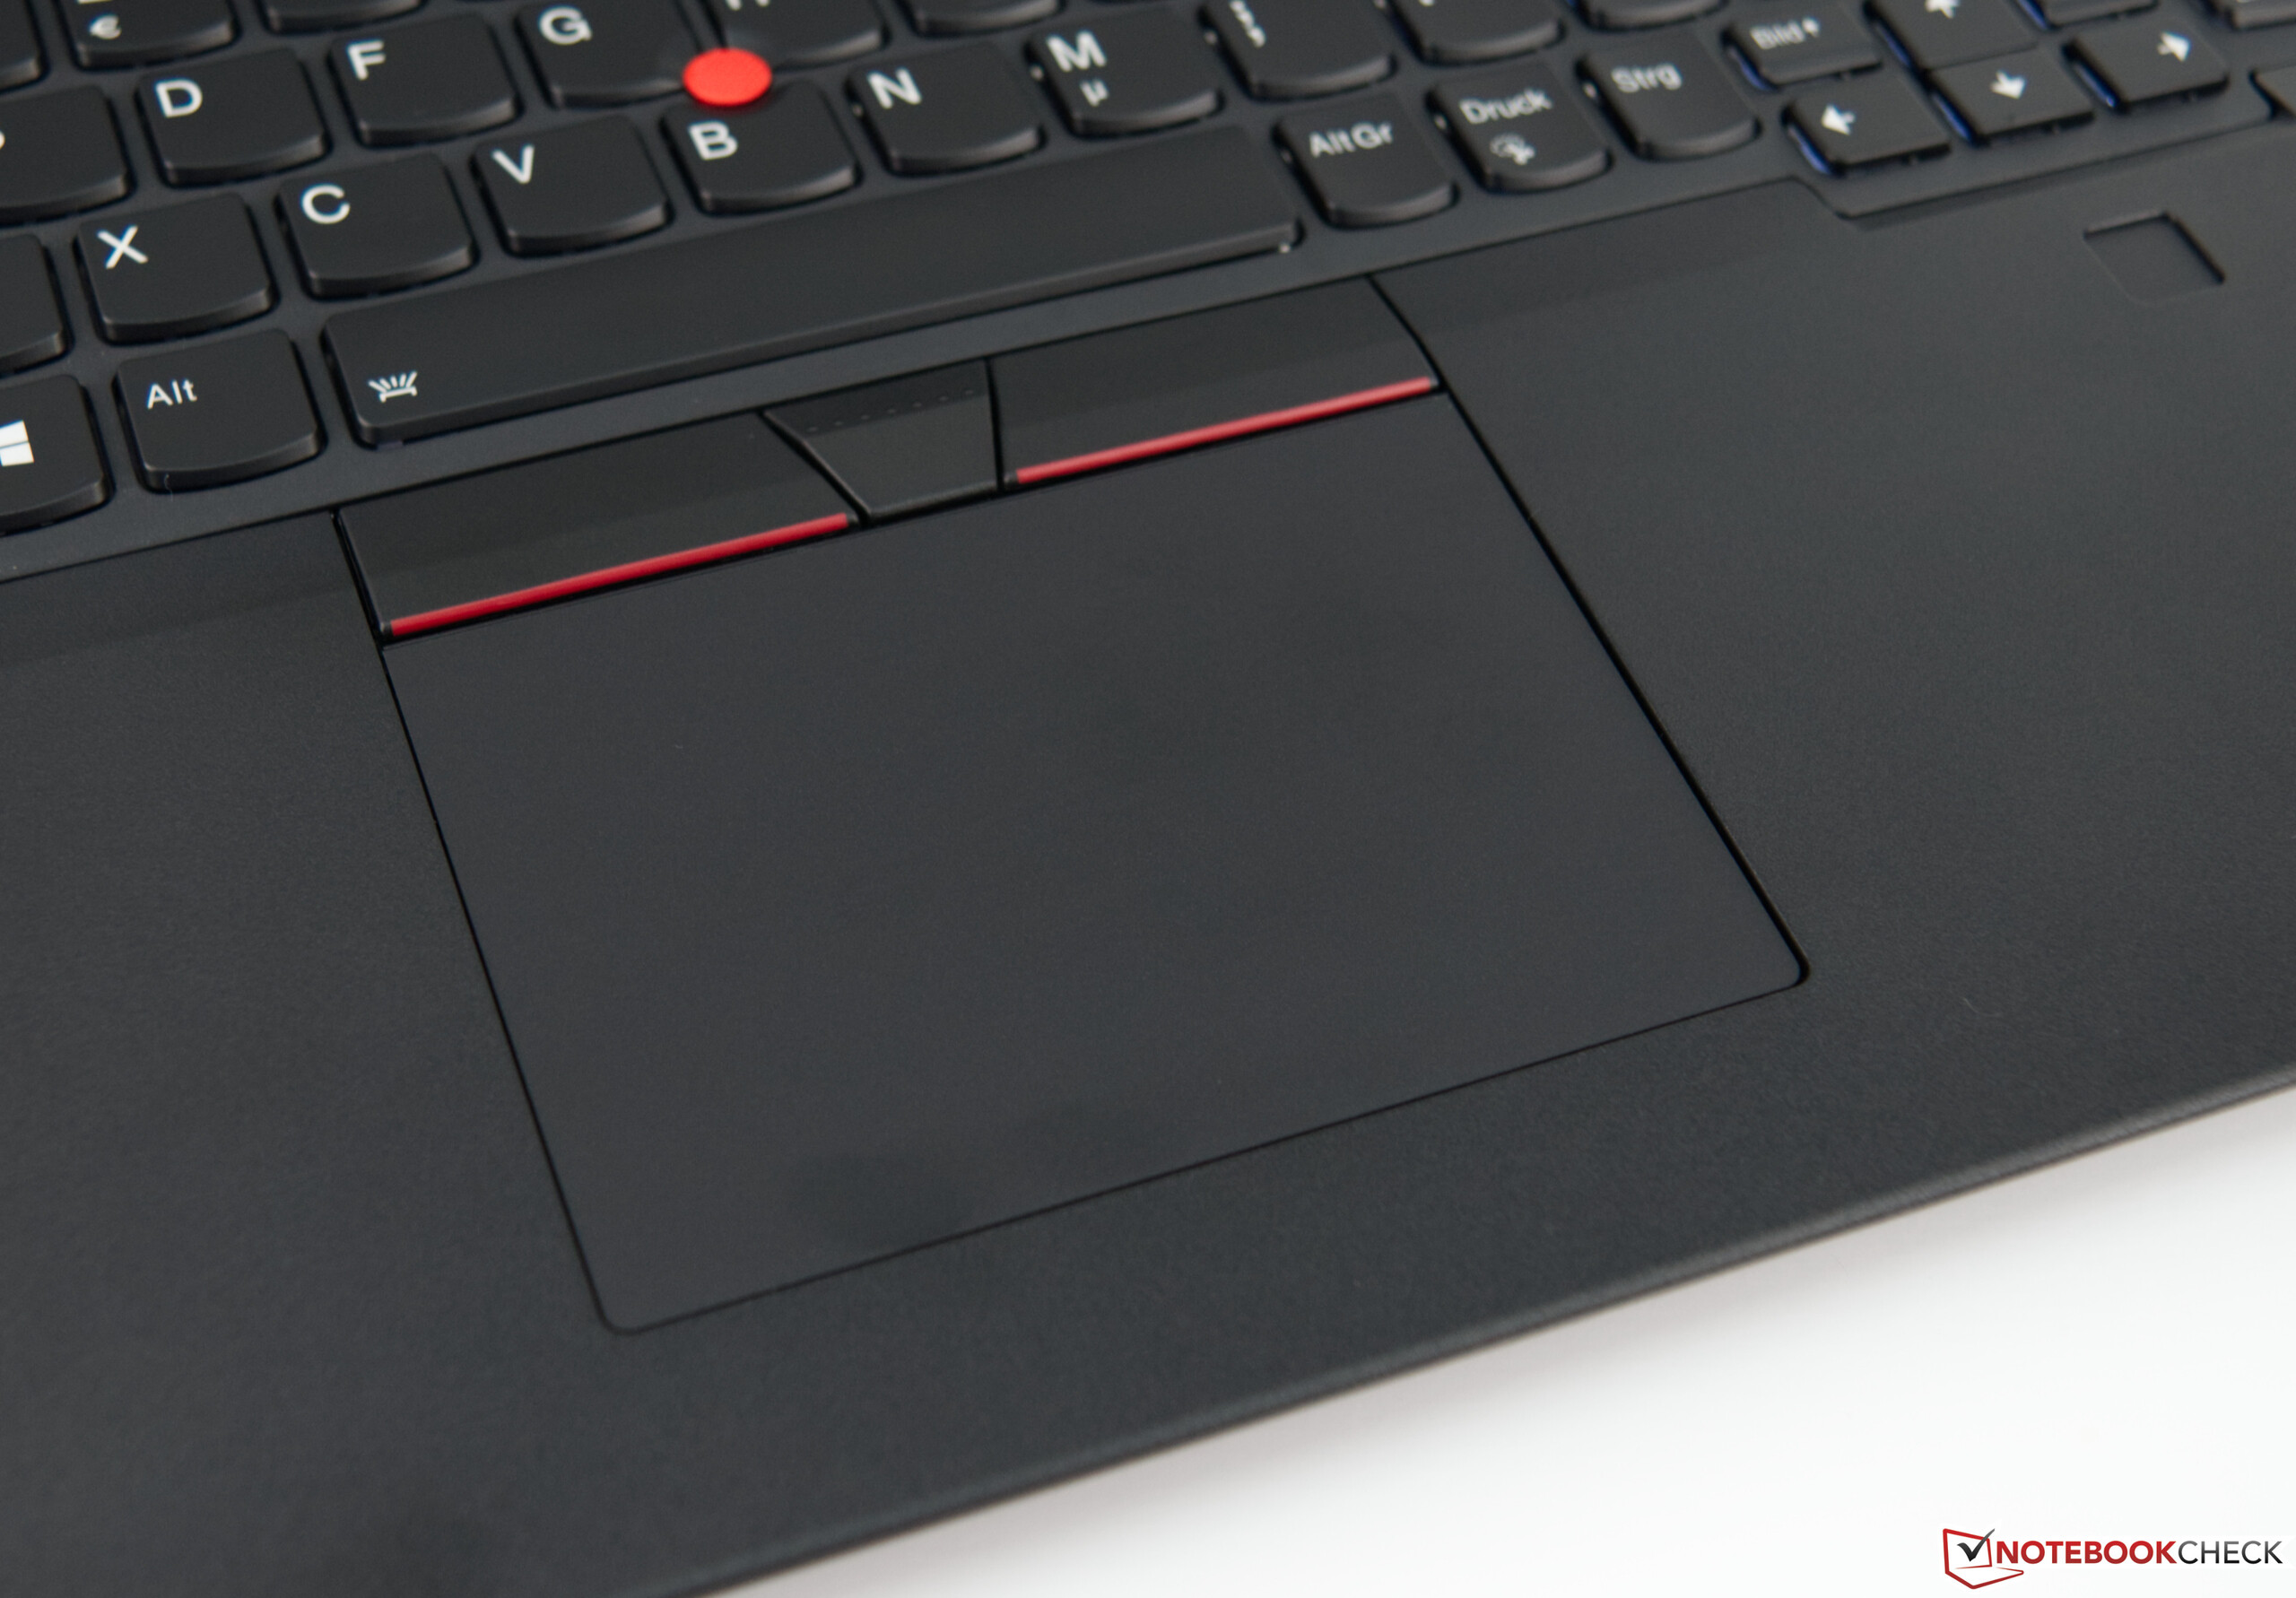
(+) De palmsteunen en het touchpad zijn met een maximum van ###max## °C / 77.4 F koeler dan de huidtemperatuur en voelen daarom koel aan.
(+) De gemiddelde temperatuur van de handpalmsteun van soortgelijke toestellen bedroeg 27.5 °C / 81.5 F (+2.3 °C / 4.1 F).
| Lenovo ThinkPad L590-20Q70019GE UHD Graphics 620, i5-8265U, Toshiba XG6 KXG6AZNV512G | Lenovo ThinkPad L580-20LW000VGE UHD Graphics 620, i5-8250U, Samsung PM961 MZVLW256HEHP | Schenker Slim 15-RE-E19 UHD Graphics 620, i5-8265U, Samsung SSD 970 EVO Plus 500GB | Lenovo ThinkPad E590-20NC0003GE UHD Graphics 620, i7-8565U, Toshiba KBG30ZMT512G | Tuxedo Book BU1307 UHD Graphics 620, i5-8550U, Samsung SSD 970 EVO 250GB | Acer TravelMate X3410-M-50DD GeForce MX130, i5-8550U, Micron 1100 MTFDDAV256TBN | |
|---|---|---|---|---|---|---|
| Heat | 7% | 6% | 5% | 10% | -1% | |
| Maximum Upper Side * (°C) | 42.7 | 43 -1% | 40.3 6% | 43.8 -3% | 35.9 16% | 48.4 -13% |
| Maximum Bottom * (°C) | 51 | 46.2 9% | 47.1 8% | 43.9 14% | 39.2 23% | 45 12% |
| Idle Upper Side * (°C) | 25.9 | 24.1 7% | 25 3% | 25.5 2% | 25.6 1% | 27.2 -5% |
| Idle Bottom * (°C) | 28.3 | 25.3 11% | 26.4 7% | 27 5% | 28.7 -1% | 27.2 4% |
* ... kleiner is beter
Lenovo ThinkPad L590-20Q70019GE audioanalyse
(-) | niet erg luide luidsprekers (68 dB)
Bas 100 - 315 Hz
(±) | verminderde zeebaars - gemiddeld 14.1% lager dan de mediaan
(±) | lineariteit van de lage tonen is gemiddeld (13% delta ten opzichte van de vorige frequentie)
Midden 400 - 2000 Hz
(±) | hogere middens - gemiddeld 7.4% hoger dan de mediaan
(±) | lineariteit van de middentonen is gemiddeld (10% delta ten opzichte van de vorige frequentie)
Hoog 2 - 16 kHz
(+) | evenwichtige hoogtepunten - slechts 1.9% verwijderd van de mediaan
(±) | lineariteit van de hoogtepunten is gemiddeld (10.9% delta ten opzichte van de vorige frequentie)
Algemeen 100 - 16.000 Hz
(±) | lineariteit van het totale geluid is gemiddeld (27.5% verschil met de mediaan)
Vergeleken met dezelfde klasse
» 86% van alle geteste apparaten in deze klasse waren beter, 4% vergelijkbaar, 10% slechter
» De beste had een delta van 7%, het gemiddelde was 21%, de slechtste was 53%
Vergeleken met alle geteste toestellen
» 84% van alle geteste apparaten waren beter, 3% gelijk, 13% slechter
» De beste had een delta van 4%, het gemiddelde was 24%, de slechtste was 134%
Acer TravelMate X3410-M-50DD audioanalyse
(-) | niet erg luide luidsprekers (65 dB)
Bas 100 - 315 Hz
(±) | verminderde zeebaars - gemiddeld 10% lager dan de mediaan
(±) | lineariteit van de lage tonen is gemiddeld (8% delta ten opzichte van de vorige frequentie)
Midden 400 - 2000 Hz
(±) | hogere middens - gemiddeld 5.3% hoger dan de mediaan
(±) | lineariteit van de middentonen is gemiddeld (9.3% delta ten opzichte van de vorige frequentie)
Hoog 2 - 16 kHz
(+) | evenwichtige hoogtepunten - slechts 1.2% verwijderd van de mediaan
(+) | de hoge tonen zijn lineair (6.5% delta naar de vorige frequentie)
Algemeen 100 - 16.000 Hz
(±) | lineariteit van het totale geluid is gemiddeld (19.5% verschil met de mediaan)
Vergeleken met dezelfde klasse
» 40% van alle geteste apparaten in deze klasse waren beter, 7% vergelijkbaar, 53% slechter
» De beste had een delta van 7%, het gemiddelde was 21%, de slechtste was 53%
Vergeleken met alle geteste toestellen
» 48% van alle geteste apparaten waren beter, 7% gelijk, 44% slechter
» De beste had een delta van 4%, het gemiddelde was 24%, de slechtste was 134%
| Uit / Standby | |
| Inactief | |
| Belasting |
|
Key:
min: | |
| Lenovo ThinkPad L590-20Q70019GE i5-8265U, UHD Graphics 620, Toshiba XG6 KXG6AZNV512G, IPS, 1920x1080, 15.6" | Lenovo ThinkPad L580-20LW000VGE i5-8250U, UHD Graphics 620, Samsung PM961 MZVLW256HEHP, IPS, 1920x1080, 15.6" | Schenker Slim 15-RE-E19 i5-8265U, UHD Graphics 620, Samsung SSD 970 EVO Plus 500GB, IPS, 2x1, 15.6" | Lenovo ThinkPad E590-20NC0003GE i7-8565U, UHD Graphics 620, Toshiba KBG30ZMT512G, IPS LED, 1920x1080, 15.6" | Tuxedo Book BU1307 i5-8550U, UHD Graphics 620, Samsung SSD 970 EVO 250GB, IPS, 1920x1080, 13.3" | Acer TravelMate X3410-M-50DD i5-8550U, GeForce MX130, Micron 1100 MTFDDAV256TBN, IPS LED, 1920x1080, 14" | Gemiddeld Intel UHD Graphics 620 | Gemiddelde van klas Office | |
|---|---|---|---|---|---|---|---|---|
| Power Consumption | -2% | 3% | -1% | -15% | -25% | -0% | -16% | |
| Idle Minimum * (Watt) | 3.96 | 4.4 -11% | 3.2 19% | 3.72 6% | 5.5 -39% | 4.6 -16% | 3.81 ? 4% | 4.4 ? -11% |
| Idle Average * (Watt) | 6.9 | 7.2 -4% | 6.5 6% | 7.8 -13% | 8.9 -29% | 6.5 6% | 6.94 ? -1% | 7.32 ? -6% |
| Idle Maximum * (Watt) | 9.8 | 8.3 15% | 11.3 -15% | 10.32 -5% | 11.5 -17% | 8.5 13% | 8.75 ? 11% | 8.56 ? 13% |
| Load Average * (Watt) | 31.4 | 36.4 -16% | 32 -2% | 30.24 4% | 34.6 -10% | 56 -78% | 35 ? -11% | 42.5 ? -35% |
| Load Maximum * (Watt) | 45.4 | 42.5 6% | 42.2 7% | 44 3% | 36.6 19% | 67 -48% | 47.5 ? -5% | 64.1 ? -41% |
* ... kleiner is beter


| Lenovo ThinkPad L590-20Q70019GE i5-8265U, UHD Graphics 620, 45 Wh | Lenovo ThinkPad L580-20LW000VGE i5-8250U, UHD Graphics 620, 45 Wh | Schenker Slim 15-RE-E19 i5-8265U, UHD Graphics 620, 36 Wh | Lenovo ThinkPad E590-20NC0003GE i7-8565U, UHD Graphics 620, 45 Wh | Tuxedo Book BU1307 i5-8550U, UHD Graphics 620, 66 Wh | Acer TravelMate X3410-M-50DD i5-8550U, GeForce MX130, 57 Wh | Gemiddelde van klas Office | |
|---|---|---|---|---|---|---|---|
| Batterijduur | 6% | -37% | -12% | 28% | 15% | 37% | |
| Reader / Idle (h) | 17.4 | 18.3 5% | 17.4 0% | 23.7 ? 36% | |||
| H.264 (h) | 9 | 8.4 -7% | 11.6 29% | 15 ? 67% | |||
| WiFi v1.3 (h) | 7.2 | 7.6 6% | 4.5 -37% | 6.4 -11% | 9.2 28% | 10.9 51% | 12.9 ? 79% |
| Load (h) | 2.8 | 1.8 -36% | 2.2 -21% | 1.807 ? -35% |
Pro
Contra

Dit is de verkorte versie van het originele artikel. Het volledige, Engelse artikel vind je hier.
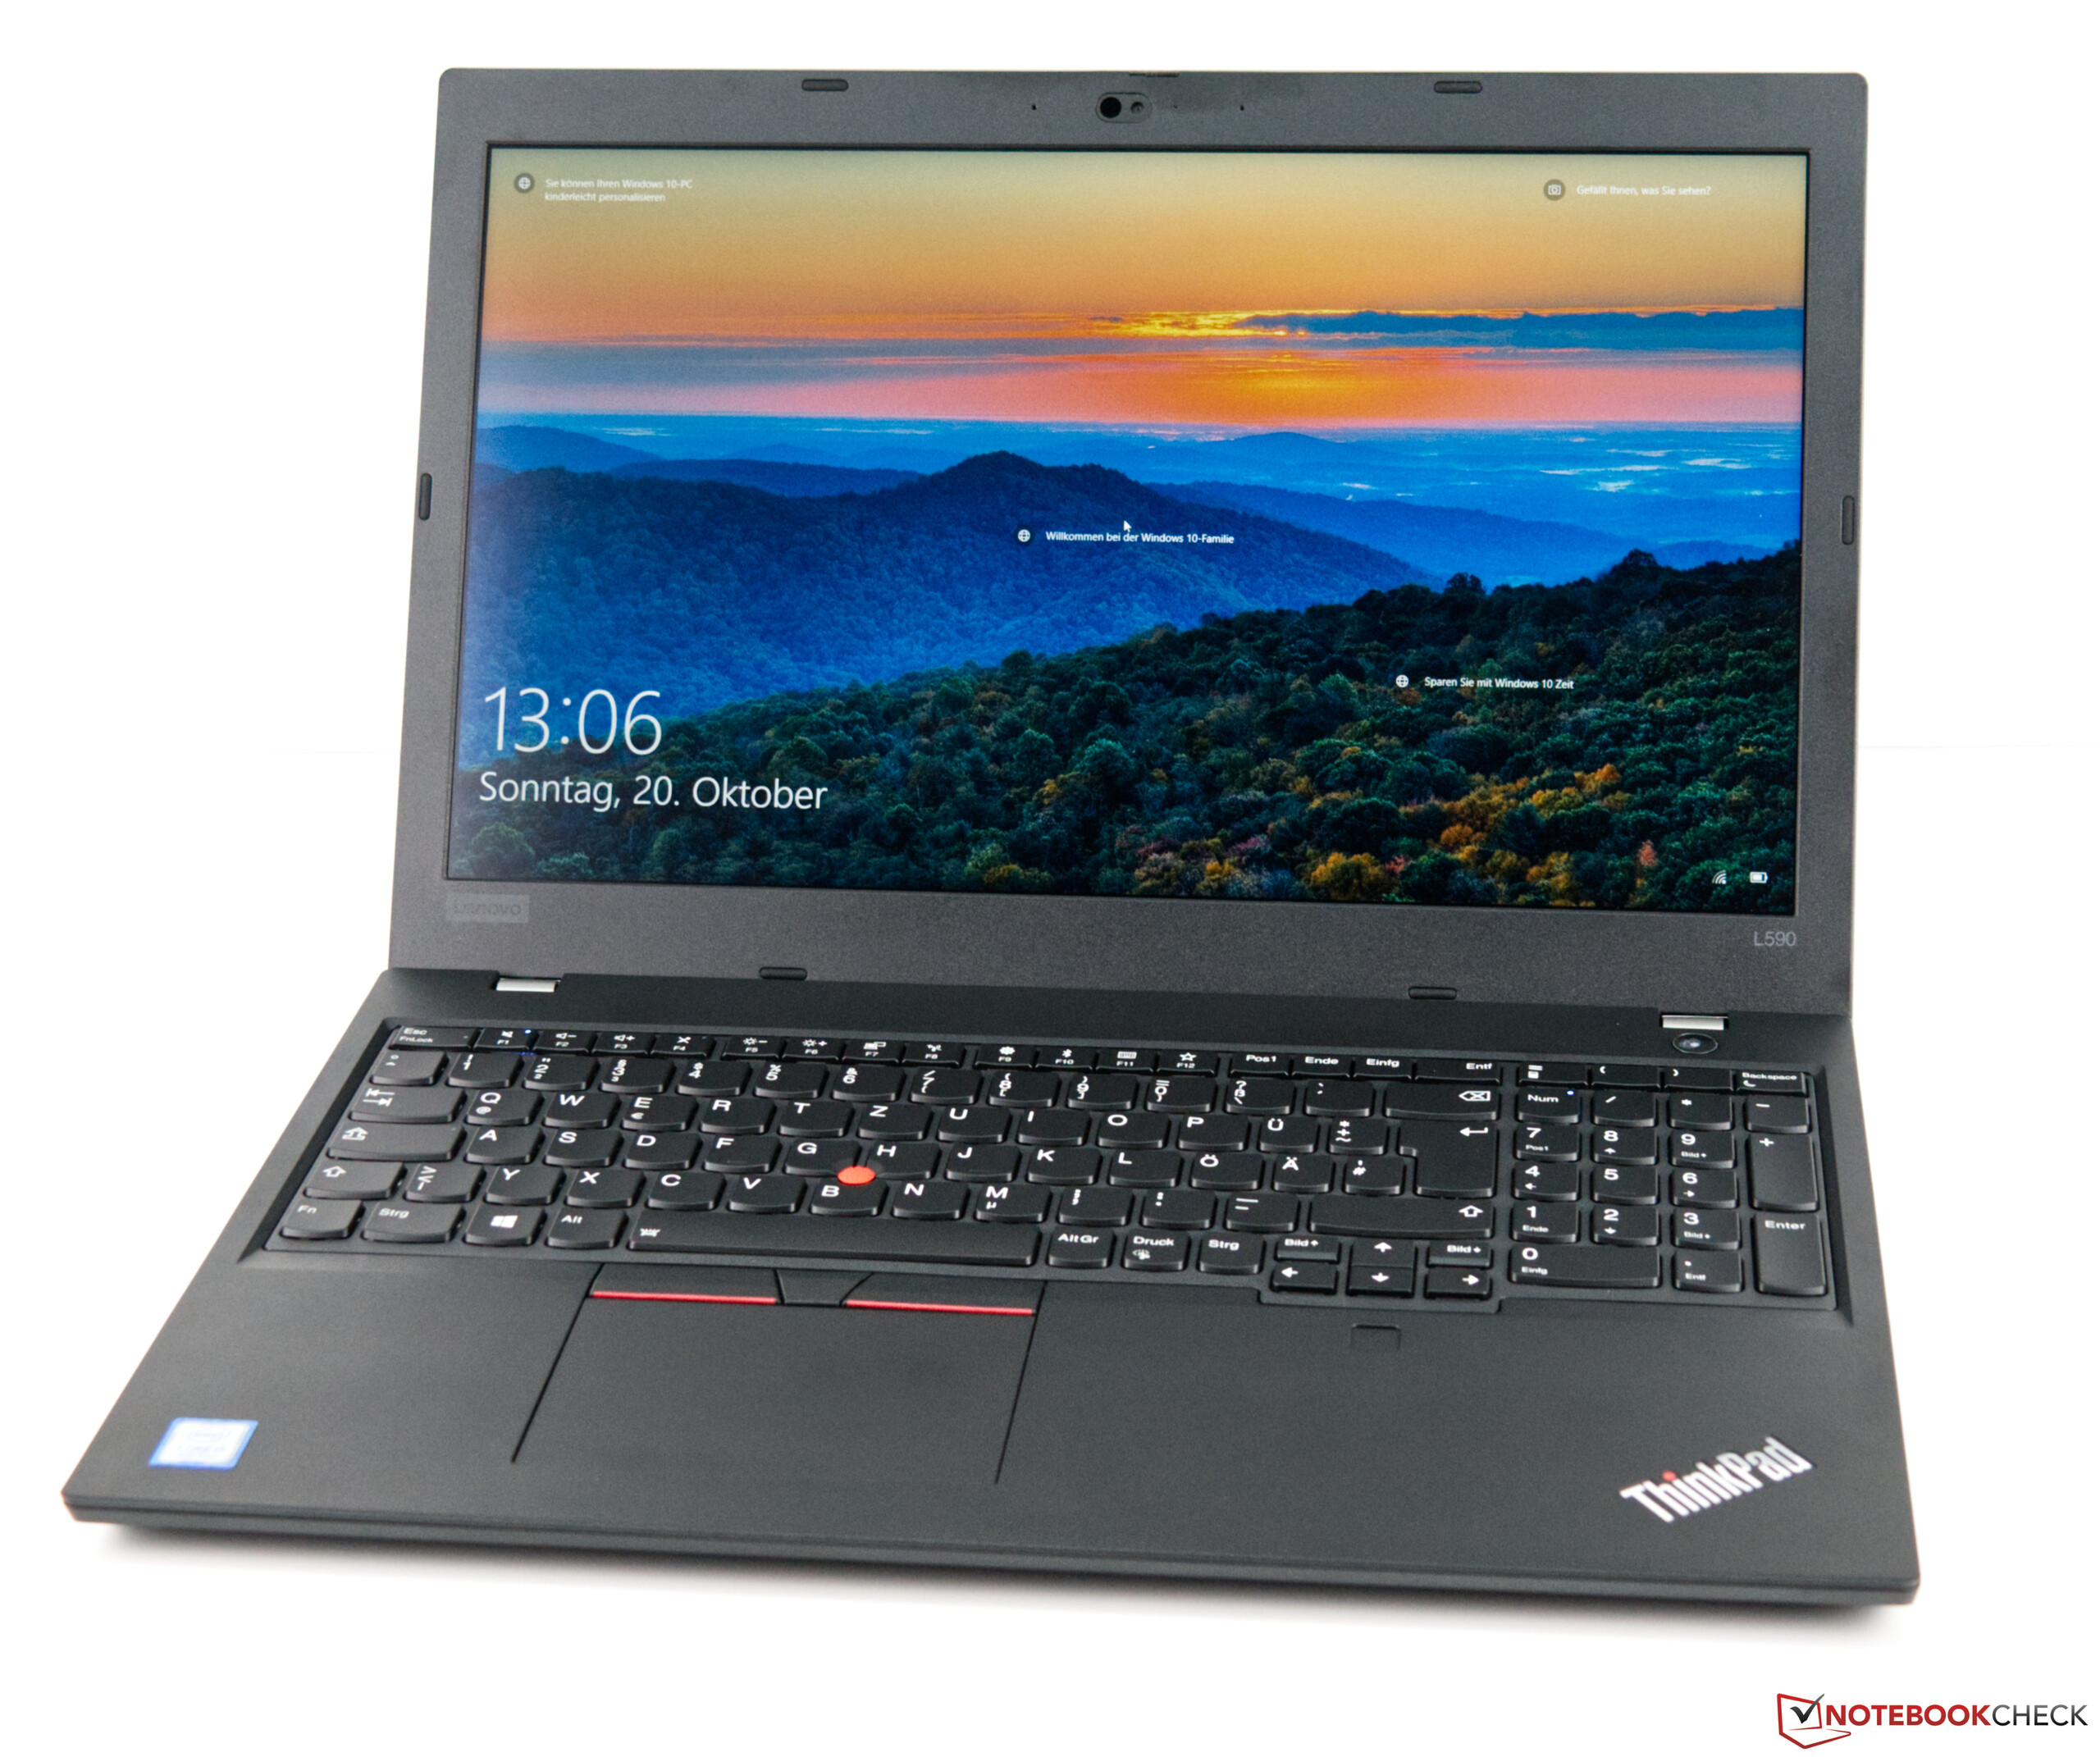
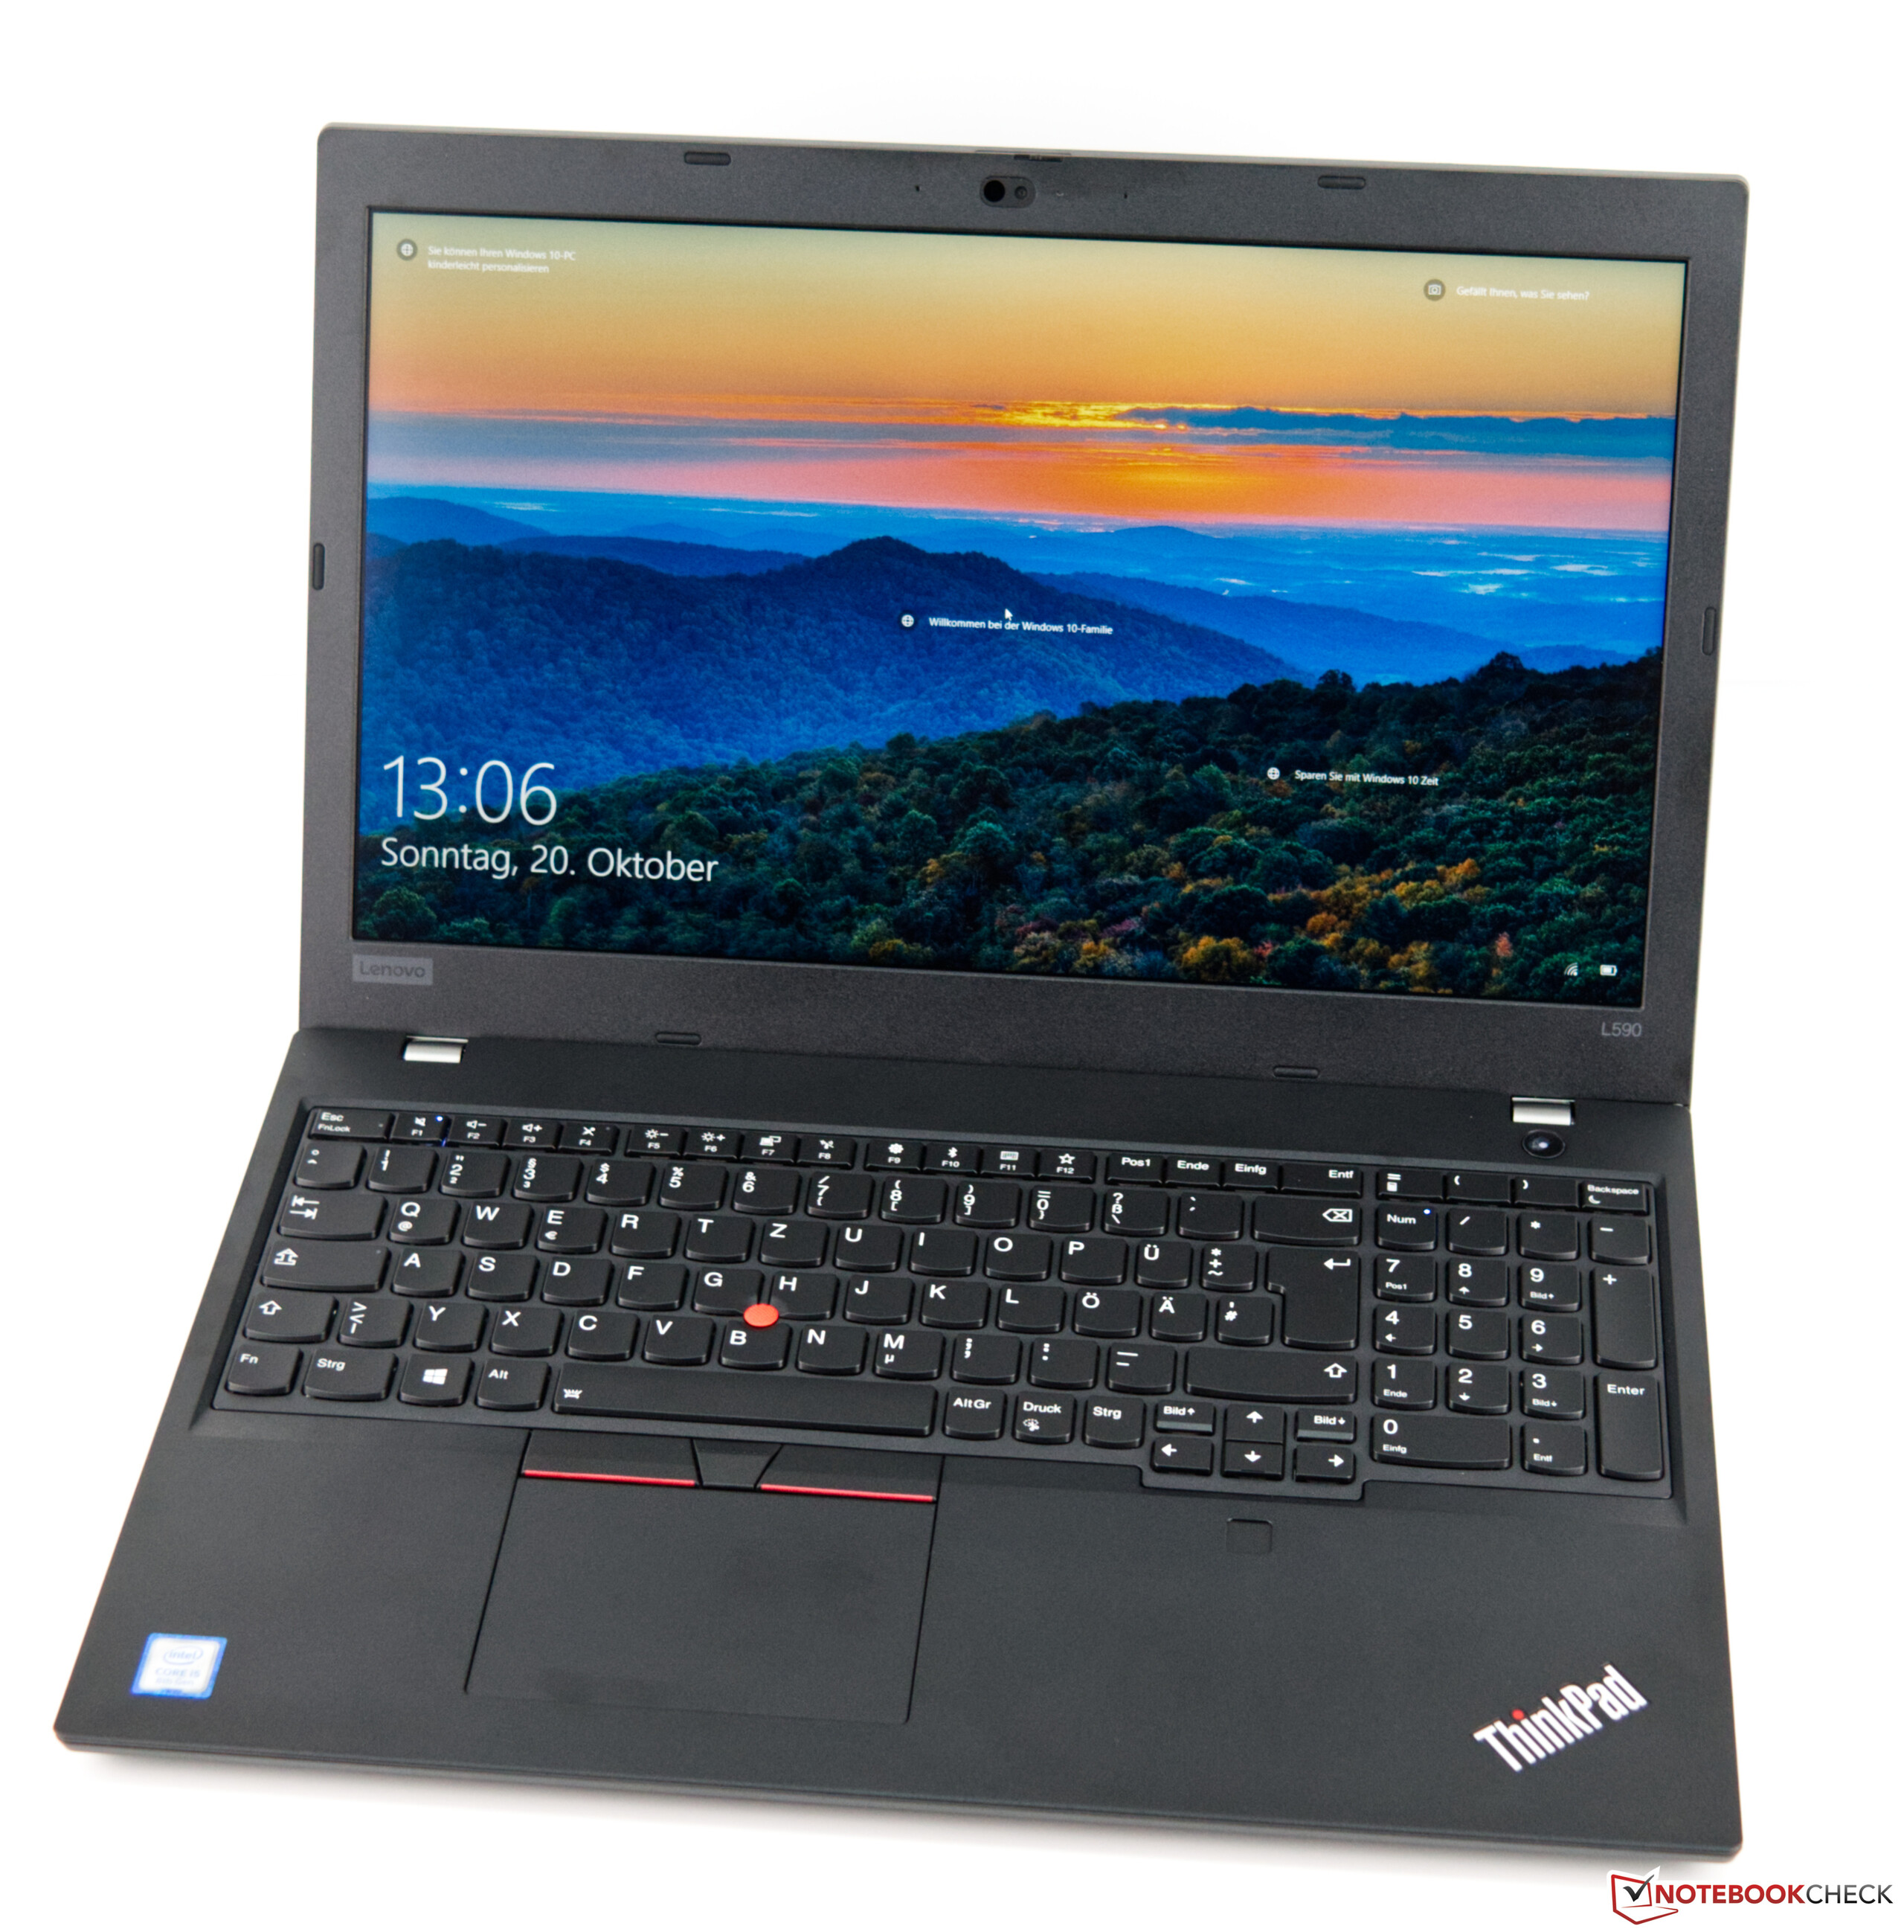
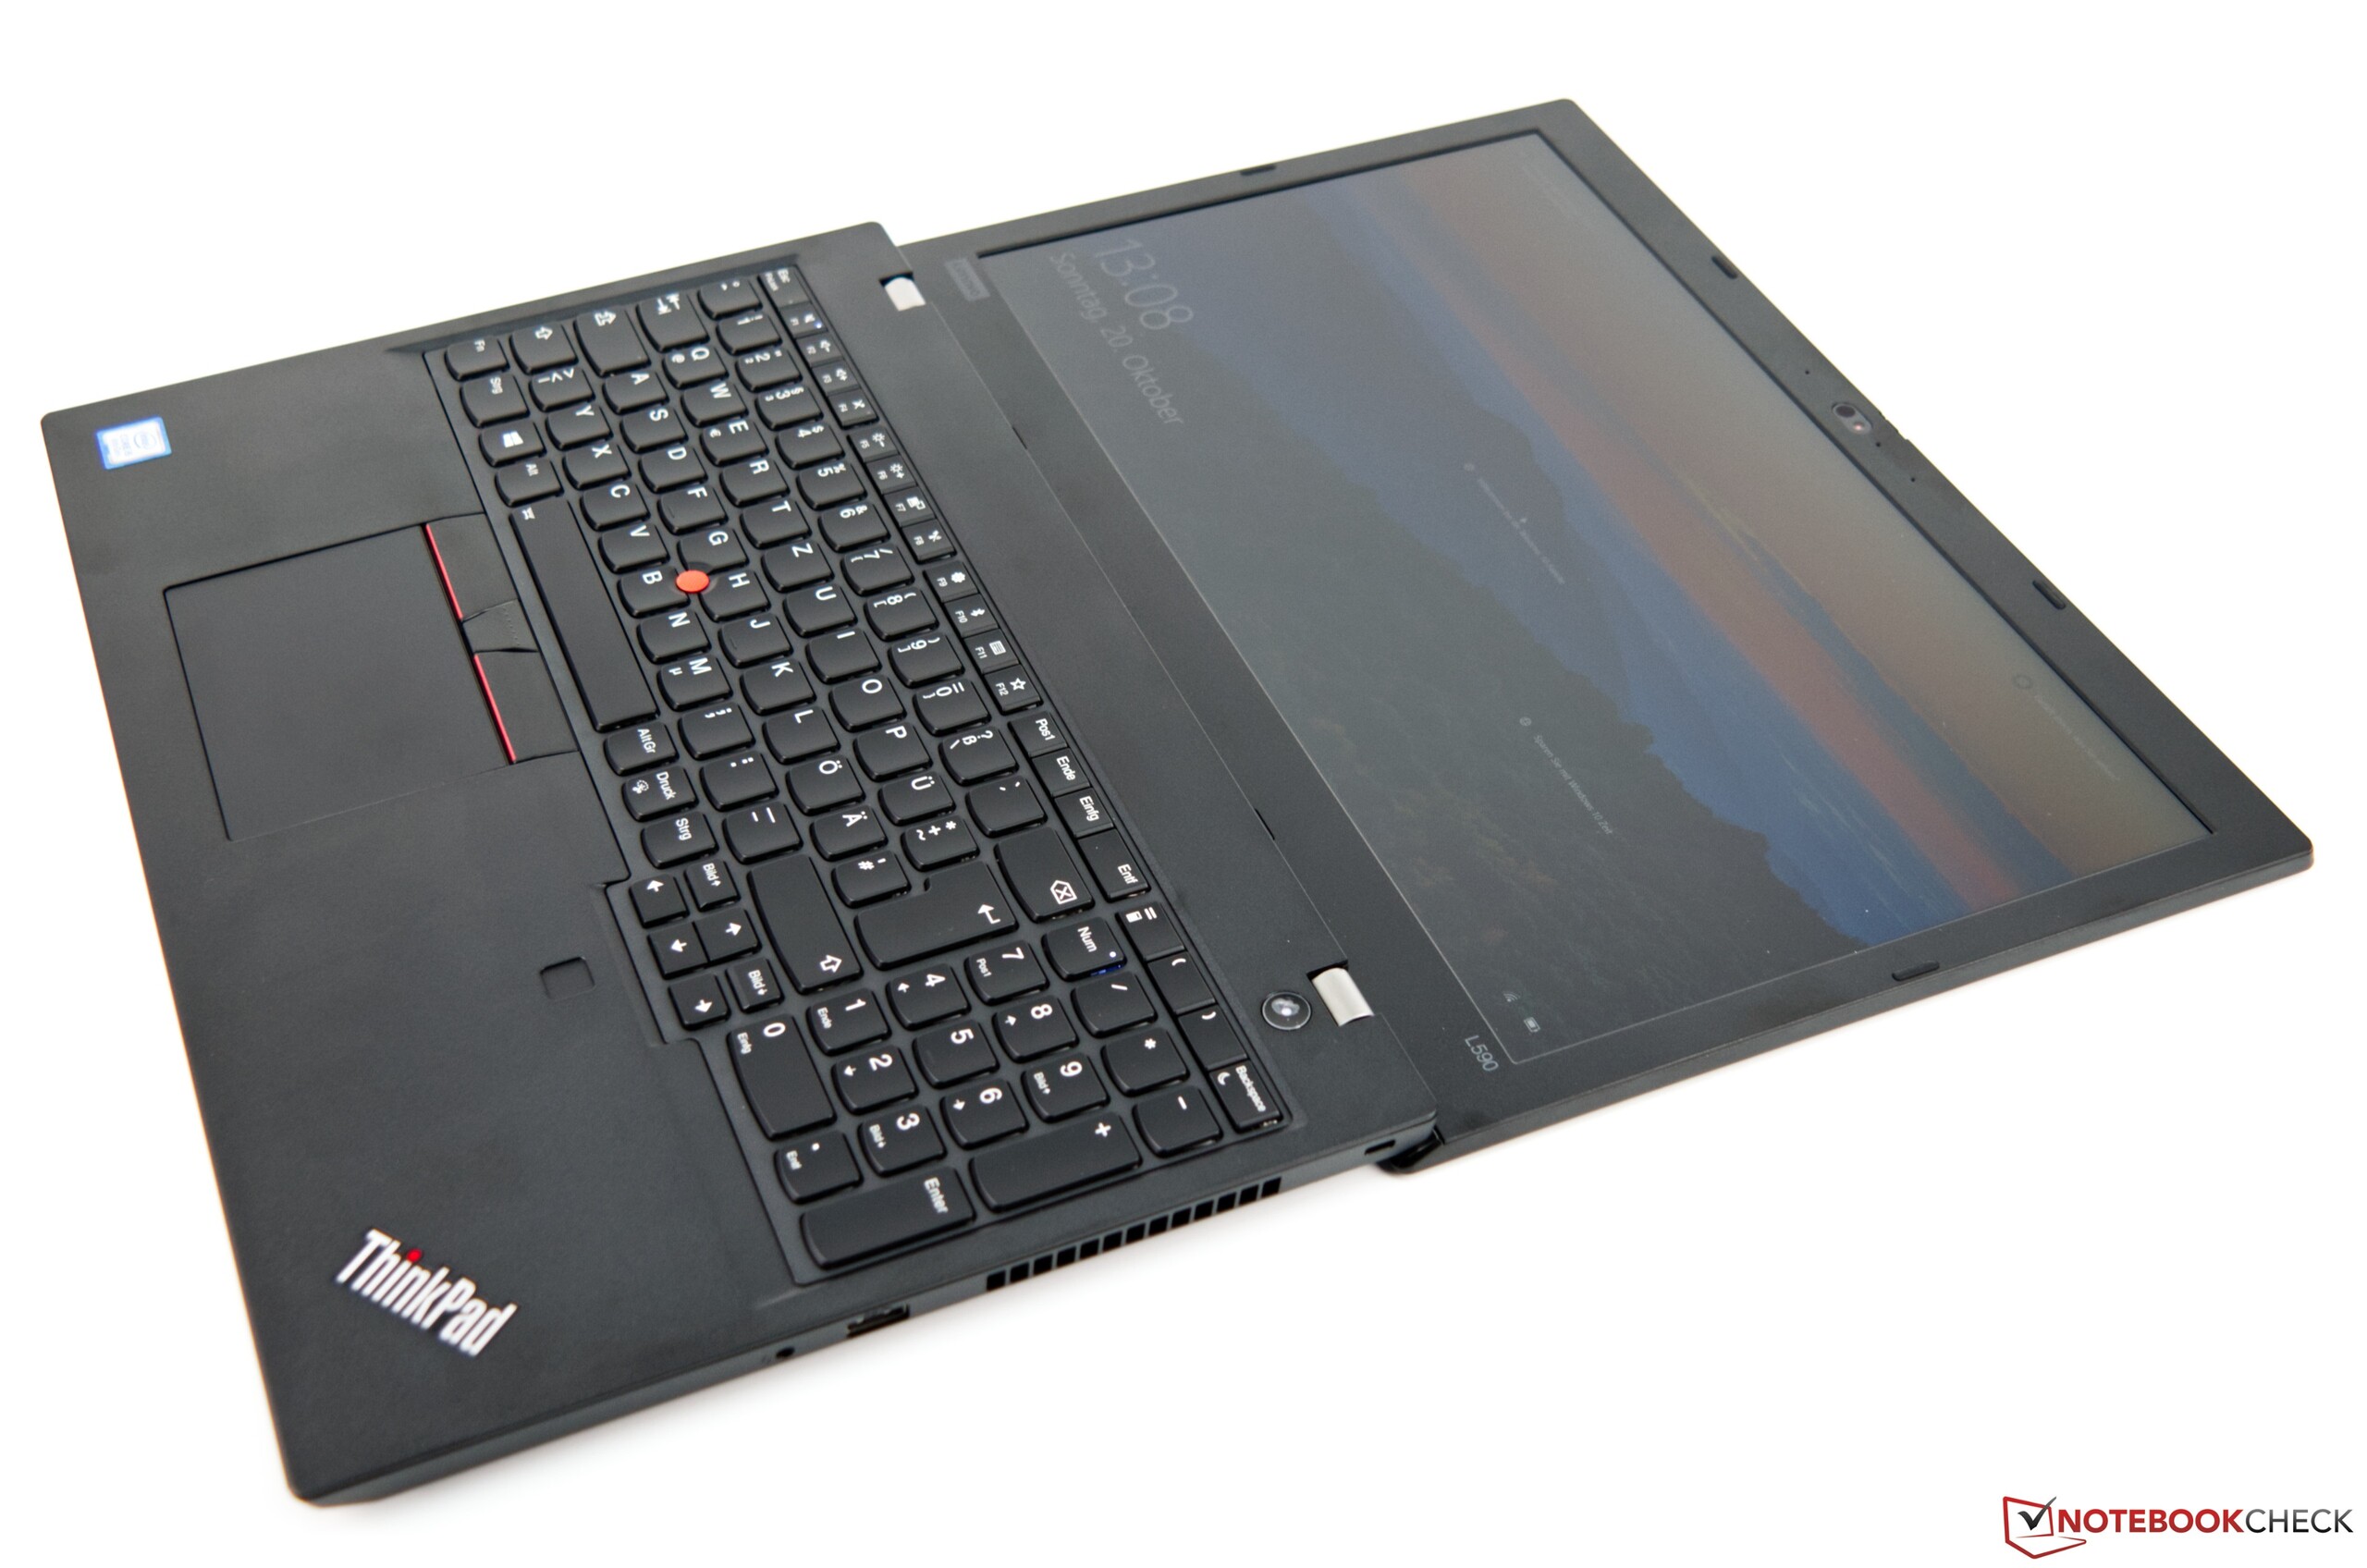
De ThinkPad L590 is een eenvoudige kantoorlaptop die vooral indruk maakt met zijn invoerapparatuur van de bovenste plank. Het toestel heeft echter weinig andere verkoopargumenten, aangezien veel andere fabrikanten Lenovo hebben ingehaald op de resterende vlakken. De L590 heeft ook een aantal nadelen, waaronder zijn donkere scherm dat bovendien een onaanvaardbaar kleine kleurruimte dekt. De concurrentie doet het hier echter niet veel beter.
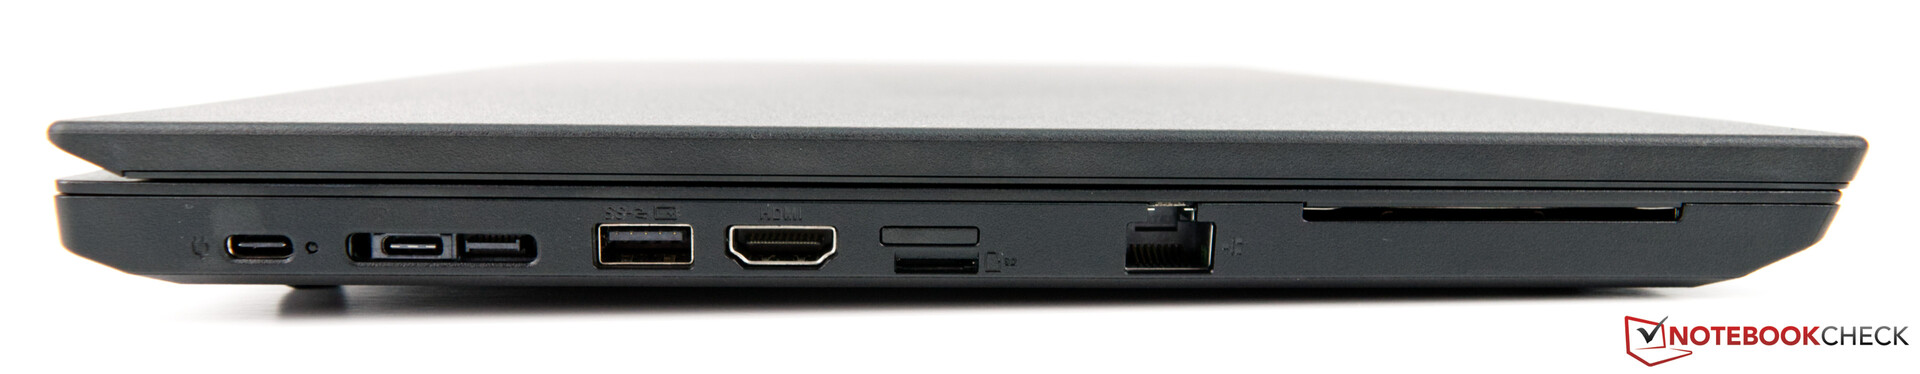
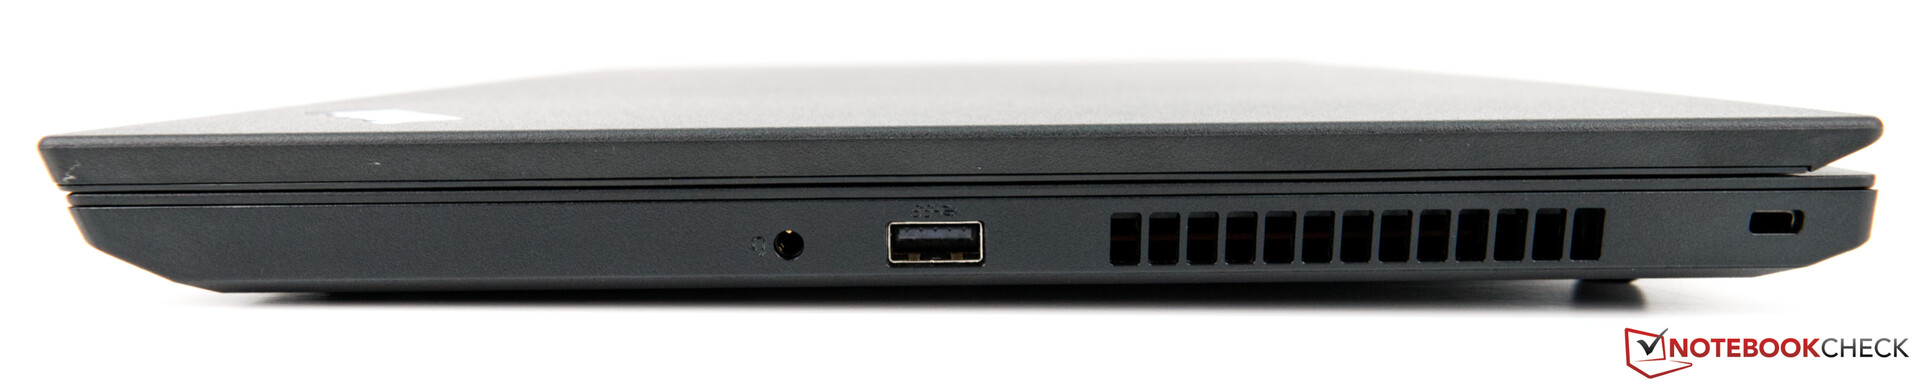
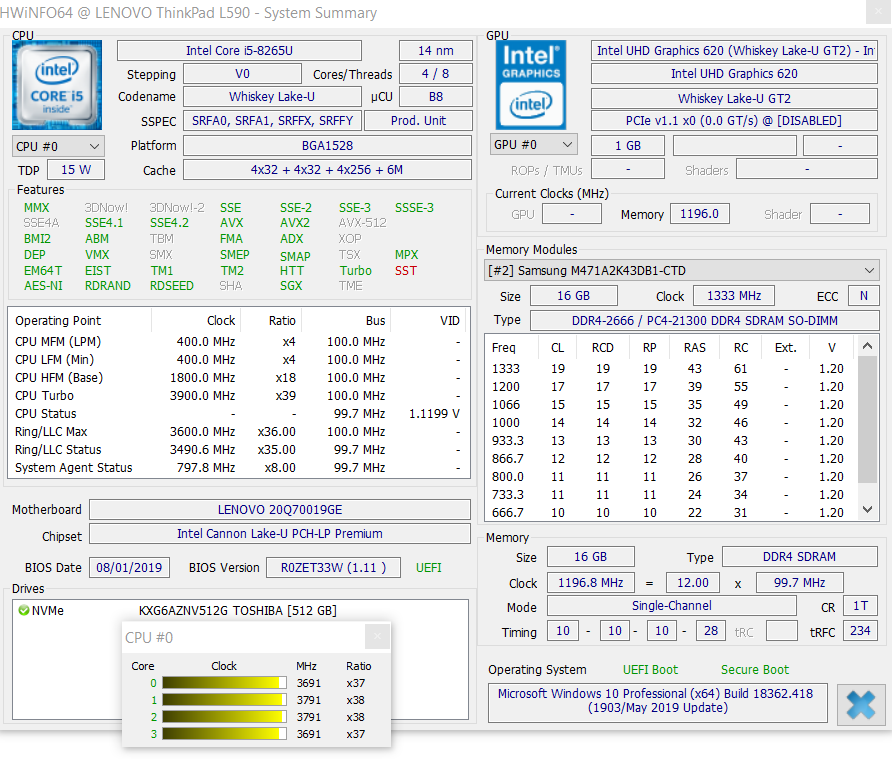
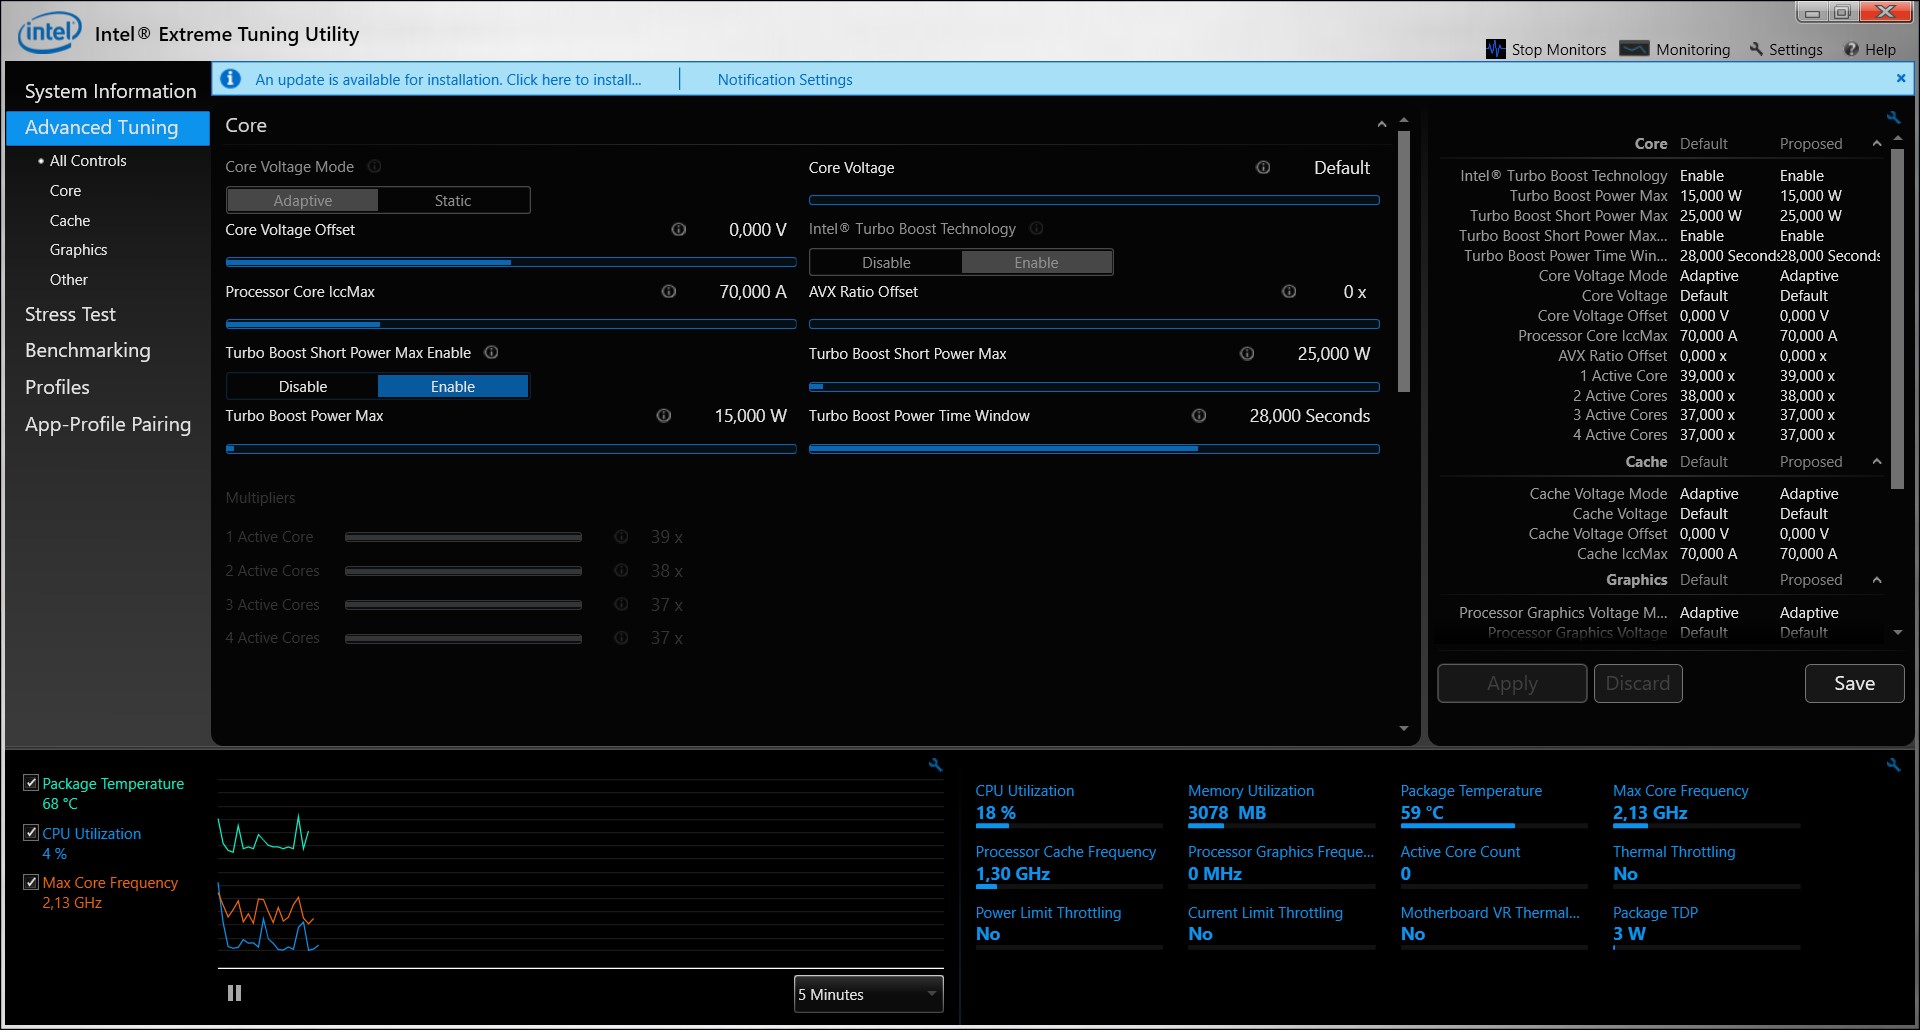
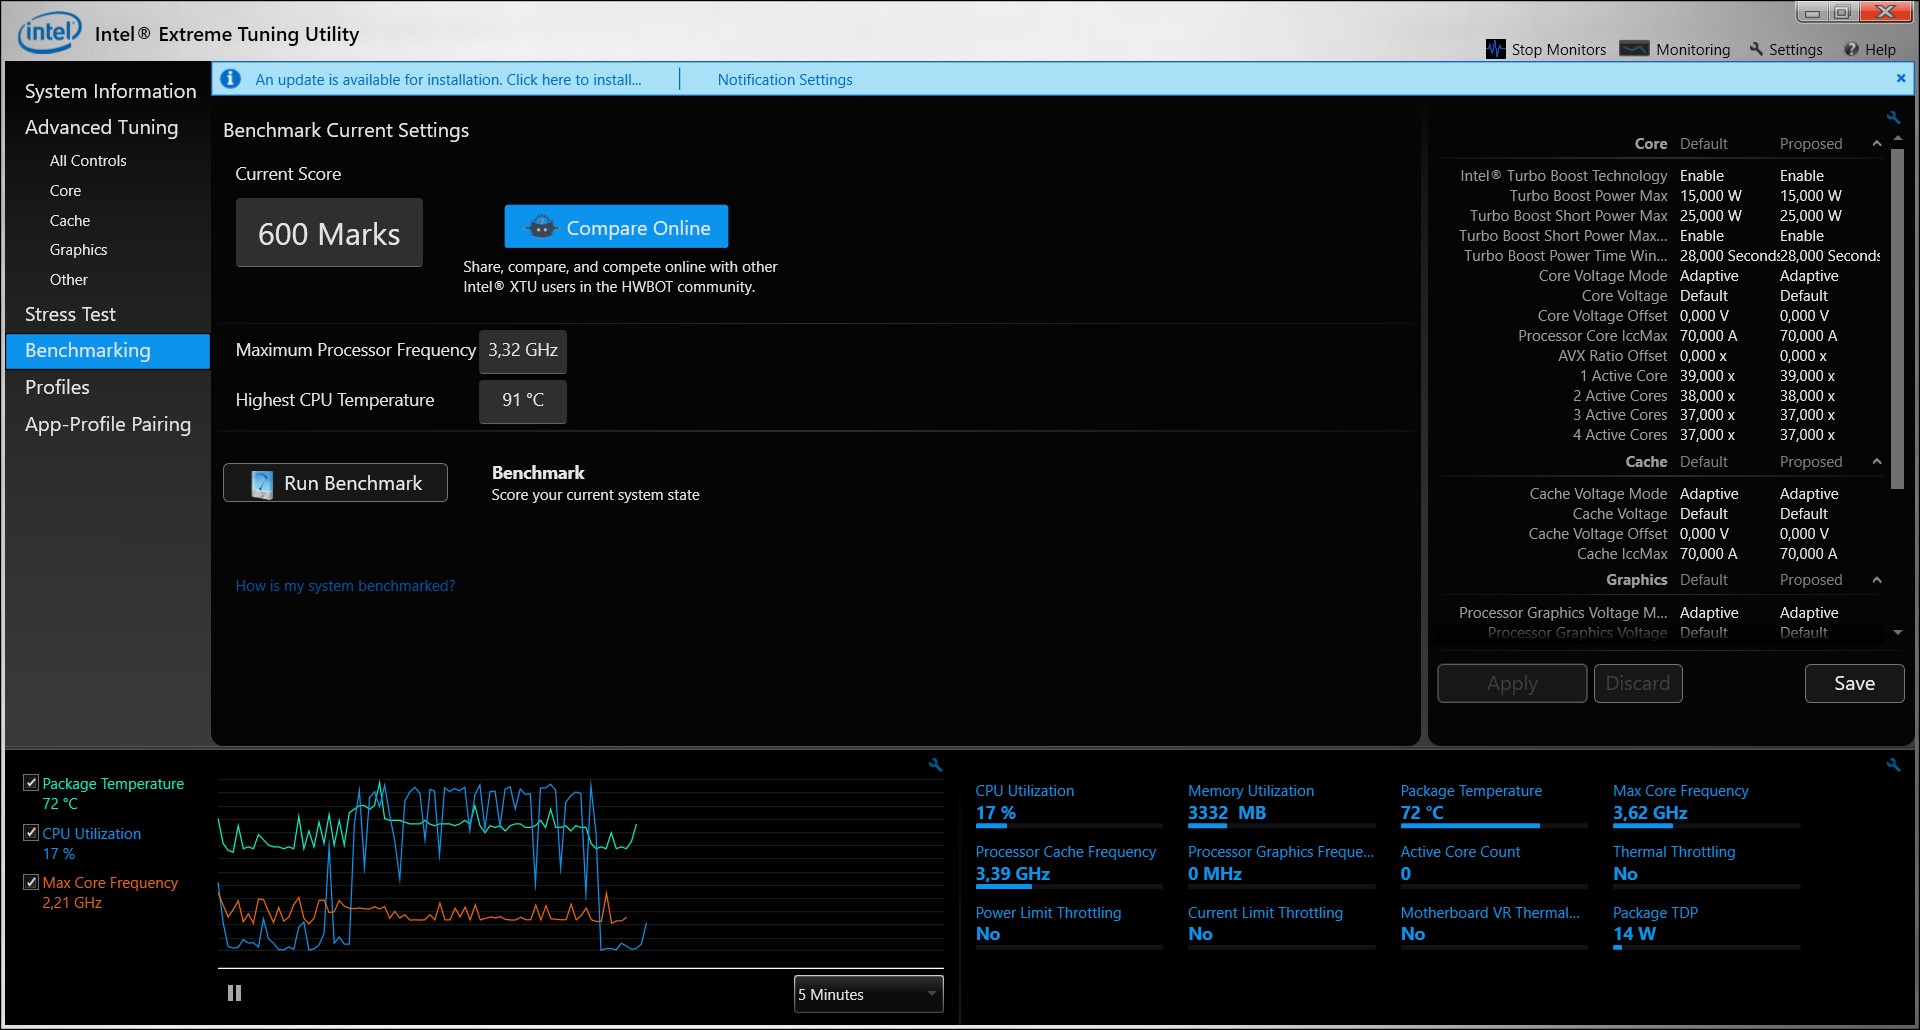
De L590 kan net als zijn voorganger niet het volle potentieel benutten van zijn quad-core-processor. De oorzaak van deze zwakke prestaties is te vinden bij de zwakke koeling. We hopen dus dat Lenovo hier meer investeert voor de volgende toestellen van de L-serie. We hebben echter geen klachten over de ruime poortselectie die de L590 heeft te bieden. De luidsprekers stelden ons evenmin teleur tijdens onze testen.
Als je op zoek bent naar een betaalbare kantoorlaptop kan je weinig verkeerd doen met de Lenovo ThinkPad L590. Het toestel is voor minder dan 1000 euro het overwegen waard omwille van alleen al zijn connectiviteit en invoerapparatuur, al moet je ook wat tekortkomingen door de vingers kijken.
Lenovo ThinkPad L590-20Q70019GE
- 25-10-2019 v7 (old)
Sebastian Bade
Price comparison
