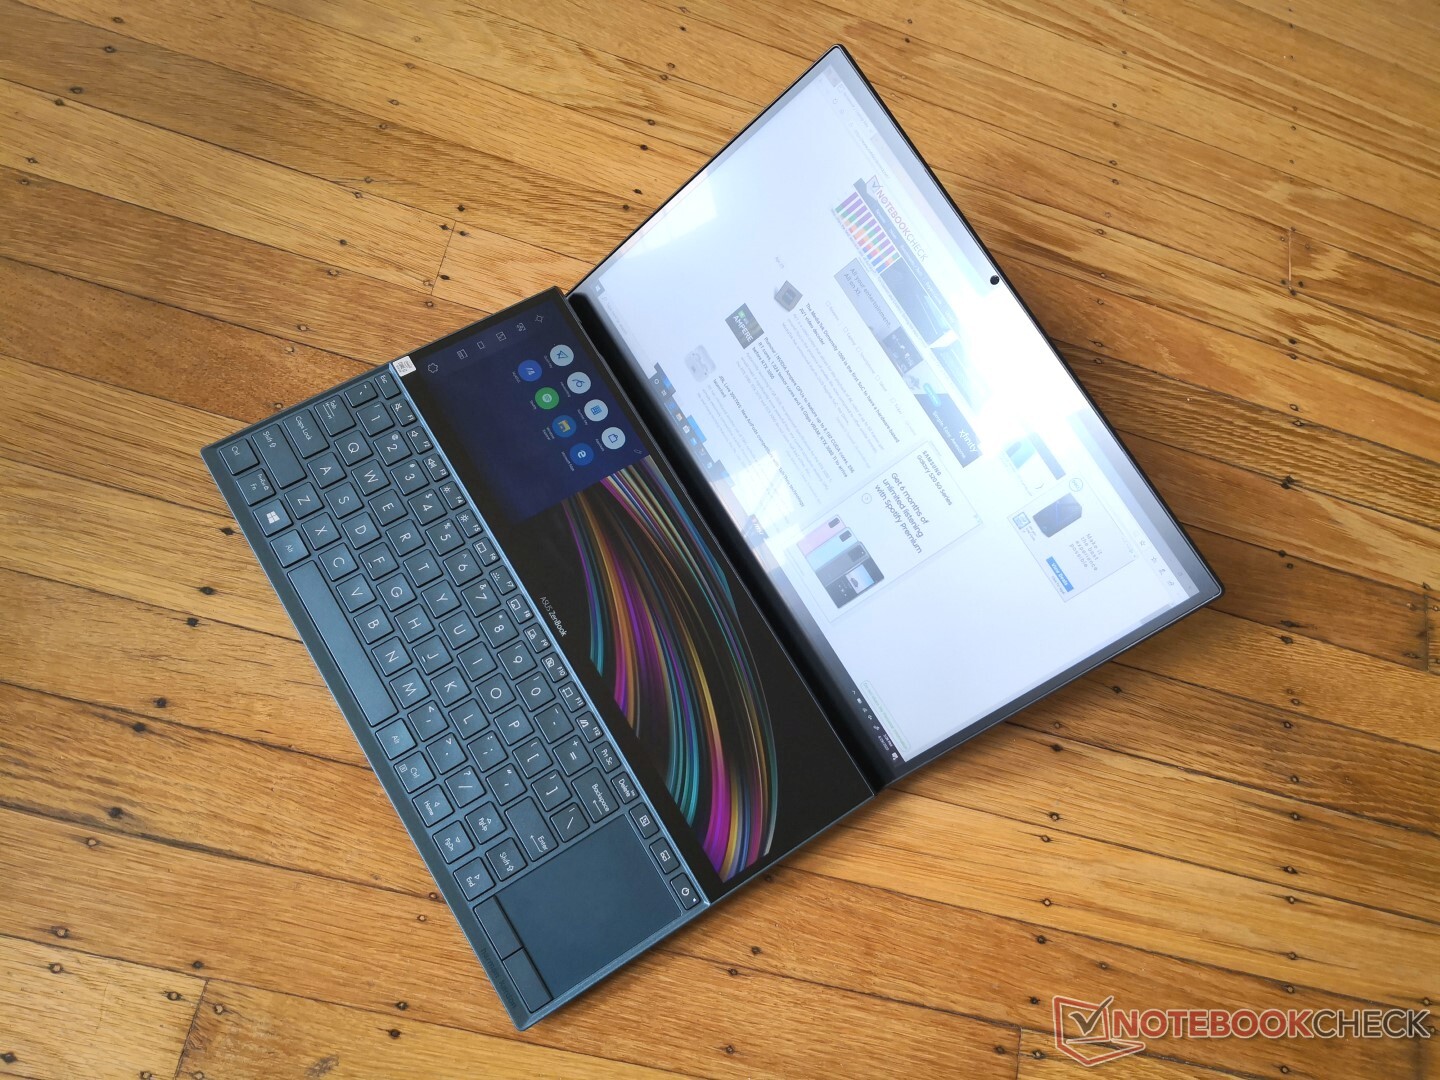
Kort testrapport Asus ZenBook Duo UX481 Laptop: Zoals De Apple Touch Bar, Maar Beter
Evaluatie | Datum | Model | Gewicht | Hoogte | Formaat | Resolutie | Beste prijs |
|---|---|---|---|---|---|---|---|
| 82.7 % v7 (old) | 05-2020 | Asus ZenBook Duo UX481FL i7-10510U, GeForce MX250 | 1.8 kg | 19 mm | 14.00" | 1920x1080 | |
| 84.2 % v7 (old) | 02-2020 | MSI Prestige 14 A10SC-009 i7-10710U, GeForce GTX 1650 Max-Q | 1.3 kg | 16 mm | 14.00" | 3840x2160 | |
| 85 % v6 (old) | 06-2019 | Lenovo IdeaPad S940-14IWL i7-8565U, UHD Graphics 620 | 1.2 kg | 12 mm | 14.00" | 3840x2160 | |
| 84 % v7 (old) | 02-2020 | Microsoft Surface Laptop 3 13 Core i5-1035G7 i5-1035G7, Iris Plus Graphics G7 (Ice Lake 64 EU) | 1.3 kg | 14.5 mm | 13.50" | 2256x1504 | |
| 81.2 % v7 (old) | 02-2020 | Asus ZenBook 14 UM431DA-AM020T R7 3700U, Vega 10 | 1.4 kg | 16 mm | 14.00" | 1920x1080 |
| SD Card Reader | |
| average JPG Copy Test (av. of 3 runs) | |
| MSI Prestige 14 A10SC-009 (Toshiba Exceria Pro M501 microSDXC 64GB) | |
| Dell XPS 13 9300 Core i7-1065G7 (Toshiba Exceria Pro M501 64 GB UHS-II) | |
| Asus ZenBook Duo UX481FL (Toshiba Exceria Pro M501 microSDXC 64GB) | |
| Asus ZenBook 14 UM431DA-AM020T (Toshiba Exceria Pro SDXC 64 GB UHS-II) | |
| maximum AS SSD Seq Read Test (1GB) | |
| Dell XPS 13 9300 Core i7-1065G7 (Toshiba Exceria Pro M501 64 GB UHS-II) | |
| MSI Prestige 14 A10SC-009 (Toshiba Exceria Pro M501 microSDXC 64GB) | |
| Asus ZenBook Duo UX481FL (Toshiba Exceria Pro M501 microSDXC 64GB) | |
| Asus ZenBook 14 UM431DA-AM020T (Toshiba Exceria Pro SDXC 64 GB UHS-II) | |
| Networking | |
| iperf3 transmit AX12 | |
| Asus Zephyrus G14 GA401IV | |
| Asus ZenBook Duo UX481FL | |
| Lenovo ThinkPad X1 Carbon G7 20R1-000YUS | |
| MSI GF75 Thin 10SCXR | |
| iperf3 receive AX12 | |
| Asus ZenBook Duo UX481FL | |
| MSI GF75 Thin 10SCXR | |
| Asus Zephyrus G14 GA401IV | |
| Lenovo ThinkPad X1 Carbon G7 20R1-000YUS | |


| |||||||||||||||||||||||||
Helderheidsverdeling: 89 %
Helderheid in Batterij-modus: 301 cd/m²
Contrast: 717:1 (Zwart: 0.42 cd/m²)
ΔE ColorChecker Calman: 1.01 | ∀{0.5-29.43 Ø4.71}
calibrated: 0.97
ΔE Greyscale Calman: 2.2 | ∀{0.09-98 Ø4.96}
99.5% sRGB (Argyll 1.6.3 3D)
63.2% AdobeRGB 1998 (Argyll 1.6.3 3D)
68.9% AdobeRGB 1998 (Argyll 3D)
99.5% sRGB (Argyll 3D)
67.1% Display P3 (Argyll 3D)
Gamma: 2.19
CCT: 6605 K
| Asus ZenBook Duo UX481FL Chi Mei N140HCE-EN2, IPS, 14", 1920x1080 | Asus ZenBook 14 UM431DA-AM020T CEC PA LM140LF-3L03, IPS, 14", 1920x1080 | Huawei Matebook X Pro i5 Tianma XM, IPS, 13.9", 3000x2000 | Lenovo IdeaPad S940-14IWL B140ZAN01.3, IPS, 14", 3840x2160 | Lenovo ThinkPad X1 Carbon G7 20R1-000YUS BOE NV140QUM-N53, IPS, 14", 3840x2160 | MSI Prestige 14 A10SC-009 IPS, 14", 3840x2160 | |
|---|---|---|---|---|---|---|
| Display | -3% | -3% | 16% | 15% | ||
| Display P3 Coverage (%) | 67.1 | 66.7 -1% | 65.9 -2% | 87.5 30% | 83 24% | |
| sRGB Coverage (%) | 99.5 | 92.3 -7% | 95.2 -4% | 99.7 0% | 99.7 0% | |
| AdobeRGB 1998 Coverage (%) | 68.9 | 67.5 -2% | 67.6 -2% | 81.1 18% | 83.1 21% | |
| Response Times | -9% | -15% | -54% | -42% | -59% | |
| Response Time Grey 50% / Grey 80% * (ms) | 31.2 ? | 36 ? -15% | 40.4 ? -29% | 57.2 ? -83% | 49.2 ? -58% | 55 ? -76% |
| Response Time Black / White * (ms) | 25.6 ? | 26 ? -2% | 25.6 ? -0% | 32 ? -25% | 32.2 ? -26% | 36 ? -41% |
| PWM Frequency (Hz) | 24750 ? | 44 ? | 201.6 ? | |||
| Screen | -124% | -34% | -57% | -103% | 16% | |
| Brightness middle (cd/m²) | 301 | 253 -16% | 442.7 47% | 594.5 98% | 532 77% | 567 88% |
| Brightness (cd/m²) | 285 | 245 -14% | 428 50% | 536 88% | 513 80% | 516 81% |
| Brightness Distribution (%) | 89 | 78 -12% | 84 -6% | 83 -7% | 90 1% | 86 -3% |
| Black Level * (cd/m²) | 0.42 | 0.225 46% | 0.31 26% | 0.43 -2% | 0.41 2% | 0.445 -6% |
| Contrast (:1) | 717 | 1124 57% | 1428 99% | 1383 93% | 1298 81% | 1274 78% |
| Colorchecker dE 2000 * | 1.01 | 8.89 -780% | 2.24 -122% | 4.87 -382% | 6.88 -581% | 1.55 -53% |
| Colorchecker dE 2000 max. * | 3.42 | 4.56 -33% | 7.19 -110% | 7.9 -131% | 12.65 -270% | 5.14 -50% |
| Colorchecker dE 2000 calibrated * | 0.97 | 4.9 -405% | 1.11 -14% | 2.83 -192% | 2.52 -160% | 1.24 -28% |
| Greyscale dE 2000 * | 2.2 | 6.33 -188% | 9.7 -341% | 6.7 -205% | 10.5 -377% | 1.48 33% |
| Gamma | 2.19 100% | 2.52 87% | 1.42 155% | 2.091 105% | 1.98 111% | 2.19 100% |
| CCT | 6605 98% | 6745 96% | 6227 104% | 6891 94% | 7394 88% | 6741 96% |
| Color Space (Percent of AdobeRGB 1998) (%) | 63.2 | 60 -5% | 61.6 -3% | 72 14% | 74.1 17% | |
| Color Space (Percent of sRGB) (%) | 99.5 | 91 -9% | 95 -5% | 100 1% | 99.7 0% | |
| Totaal Gemiddelde (Programma / Instellingen) | -45% /
-87% | -17% /
-26% | -32% /
-43% | -43% /
-73% | -22% /
2% |
* ... kleiner is beter
Responstijd Scherm
| ↔ Responstijd Zwart naar Wit | ||
|---|---|---|
| 25.6 ms ... stijging ↗ en daling ↘ gecombineerd | ↗ 14.8 ms stijging | 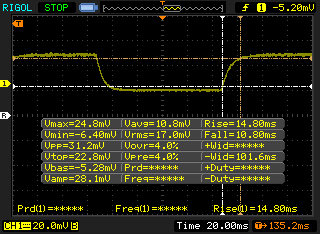 |
| ↘ 10.8 ms daling | ||
| Het scherm vertoonde relatief trage responstijden in onze tests en is misschien te traag voor games. Ter vergelijking: alle testtoestellen variëren van 0.1 (minimum) tot 240 (maximum) ms. » 61 % van alle toestellen zijn beter. Dit betekent dat de gemeten responstijd slechter is dan het gemiddelde (19.8 ms) van alle geteste toestellen. | ||
| ↔ Responstijd 50% Grijs naar 80% Grijs | ||
| 31.2 ms ... stijging ↗ en daling ↘ gecombineerd | ↗ 15.6 ms stijging | 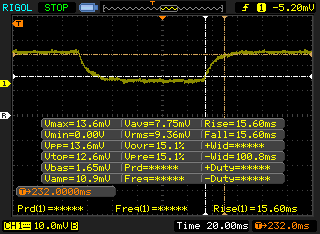 |
| ↘ 15.6 ms daling | ||
| Het scherm vertoonde trage responstijden in onze tests en is misschien te traag voor games. Ter vergelijking: alle testtoestellen variëren van 0.165 (minimum) tot 636 (maximum) ms. » 42 % van alle toestellen zijn beter. Dit betekent dat de gemeten responstijd vergelijkbaar is met het gemiddelde (30.9 ms) van alle geteste toestellen. | ||
Screen Flickering / PWM (Pulse-Width Modulation)
| Screen flickering / PWM waargenomen | 24750 Hz | ≤ 29 % helderheid instelling | 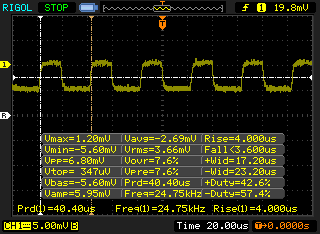 |
De achtergrondverlichting van het scherm flikkert op 24750 Hz (in het slechtste geval, bijvoorbeeld bij gebruik van PWM) aan een helderheid van 29 % en lager. Boven deze helderheid zou er geen flickering / PWM mogen optreden. De frequentie van 24750 Hz is redelijk hoog en de meeste mensen die gevoelig zijn aan flickering zouden dit dus niet mogen waarnemen of geïrriteerde ogen krijgen. Ter vergelijking: 52 % van alle geteste toestellen maakten geen gebruik van PWM om de schermhelderheid te verlagen. Als het wel werd gebruikt, werd een gemiddelde van 7744 (minimum: 5 - maximum: 343500) Hz waargenomen. | |||
Cinebench R15: CPU Single 64Bit | CPU Multi 64Bit
Blender: v2.79 BMW27 CPU
7-Zip 18.03: 7z b 4 -mmt1 | 7z b 4
Geekbench 5.5: Single-Core | Multi-Core
HWBOT x265 Benchmark v2.2: 4k Preset
LibreOffice : 20 Documents To PDF
R Benchmark 2.5: Overall mean
| Cinebench R20 / CPU (Multi Core) | |
| Dell XPS 13 7390 Core i7-10710U | |
| Dell XPS 13 9300 Core i7-1065G7 | |
| MSI GF63 Thin 9SC | |
| Asus ZenBook 15 UX534FT-DB77 | |
| Microsoft Surface Laptop 3 13 Core i5-1035G7 | |
| Dell Inspiron 15 5000 5585 | |
| Asus ZenBook Duo UX481FL | |
| Gemiddeld Intel Core i7-10510U (1015 - 1897, n=38) | |
| Dynabook Portege A30-E-174 | |
| HP Elite Dragonfly-8MK79EA | |
| Cinebench R20 / CPU (Single Core) | |
| Dell XPS 13 7390 Core i7-10710U | |
| Dell XPS 13 9300 Core i7-1065G7 | |
| Asus ZenBook 15 UX534FT-DB77 | |
| Asus ZenBook Duo UX481FL | |
| Microsoft Surface Laptop 3 13 Core i5-1035G7 | |
| Gemiddeld Intel Core i7-10510U (362 - 497, n=37) | |
| MSI GF63 Thin 9SC | |
| Dynabook Portege A30-E-174 | |
| HP Elite Dragonfly-8MK79EA | |
| Dell Inspiron 15 5000 5585 | |
| Cinebench R15 / CPU Single 64Bit | |
| Asus ZenBook 15 UX534FT-DB77 | |
| Dell XPS 13 7390 Core i7-10710U | |
| Dell XPS 13 9300 Core i7-1065G7 | |
| Gemiddeld Intel Core i7-10510U (113 - 202, n=42) | |
| Asus ZenBook Duo UX481FL | |
| MSI GF63 Thin 9SC | |
| Microsoft Surface Laptop 3 13 Core i5-1035G7 | |
| Dynabook Portege A30-E-174 | |
| HP Elite Dragonfly-8MK79EA | |
| Dell Inspiron 15 5000 5585 | |
| Cinebench R15 / CPU Multi 64Bit | |
| Dell XPS 13 7390 Core i7-10710U | |
| MSI GF63 Thin 9SC | |
| Asus ZenBook Duo UX481FL | |
| Dell XPS 13 9300 Core i7-1065G7 | |
| Microsoft Surface Laptop 3 13 Core i5-1035G7 | |
| Asus ZenBook 15 UX534FT-DB77 | |
| Dell Inspiron 15 5000 5585 | |
| Gemiddeld Intel Core i7-10510U (482 - 856, n=45) | |
| HP Elite Dragonfly-8MK79EA | |
| Dynabook Portege A30-E-174 | |
| Blender / v2.79 BMW27 CPU | |
| HP Elite Dragonfly-8MK79EA | |
| Gemiddeld Intel Core i7-10510U (628 - 1051, n=31) | |
| Asus ZenBook Duo UX481FL | |
| Microsoft Surface Laptop 3 13 Core i5-1035G7 | |
| Dell XPS 13 7390 Core i7-10710U | |
| 7-Zip 18.03 / 7z b 4 -mmt1 | |
| Asus ZenBook Duo UX481FL | |
| Gemiddeld Intel Core i7-10510U (3747 - 4981, n=31) | |
| Dell XPS 13 7390 Core i7-10710U | |
| Microsoft Surface Laptop 3 13 Core i5-1035G7 | |
| HP Elite Dragonfly-8MK79EA | |
| 7-Zip 18.03 / 7z b 4 | |
| Dell XPS 13 7390 Core i7-10710U | |
| Asus ZenBook Duo UX481FL | |
| Microsoft Surface Laptop 3 13 Core i5-1035G7 | |
| Gemiddeld Intel Core i7-10510U (12196 - 21298, n=31) | |
| HP Elite Dragonfly-8MK79EA | |
| Geekbench 5.5 / Single-Core | |
| Asus ZenBook Duo UX481FL | |
| Gemiddeld Intel Core i7-10510U (977 - 1287, n=31) | |
| Geekbench 5.5 / Multi-Core | |
| Asus ZenBook Duo UX481FL | |
| Gemiddeld Intel Core i7-10510U (2474 - 4484, n=31) | |
| HWBOT x265 Benchmark v2.2 / 4k Preset | |
| Dell XPS 13 7390 Core i7-10710U | |
| Asus ZenBook Duo UX481FL | |
| Gemiddeld Intel Core i7-10510U (3.41 - 6.04, n=31) | |
| Microsoft Surface Laptop 3 13 Core i5-1035G7 | |
| HP Elite Dragonfly-8MK79EA | |
| LibreOffice / 20 Documents To PDF | |
| Asus ZenBook Duo UX481FL | |
| Gemiddeld Intel Core i7-10510U (50.7 - 77.8, n=27) | |
| R Benchmark 2.5 / Overall mean | |
| Asus ZenBook Duo UX481FL | |
| Gemiddeld Intel Core i7-10510U (0.637 - 0.81, n=28) | |
* ... kleiner is beter
| PCMark 8 | |
| Home Score Accelerated v2 | |
| Asus ZenBook Duo UX481FL | |
| Asus ZenBook 14 UM431DA-AM020T | |
| Gemiddeld Intel Core i7-10510U, NVIDIA GeForce MX250 (3214 - 3958, n=8) | |
| MSI Prestige 14 A10SC-009 | |
| Huawei Matebook X Pro i5 | |
| Lenovo ThinkPad X1 Carbon G7 20R1-000YUS | |
| Lenovo IdeaPad S940-14IWL | |
| Work Score Accelerated v2 | |
| Asus ZenBook Duo UX481FL | |
| Gemiddeld Intel Core i7-10510U, NVIDIA GeForce MX250 (4599 - 5443, n=8) | |
| Asus ZenBook 14 UM431DA-AM020T | |
| MSI Prestige 14 A10SC-009 | |
| Lenovo ThinkPad X1 Carbon G7 20R1-000YUS | |
| Huawei Matebook X Pro i5 | |
| Lenovo IdeaPad S940-14IWL | |
| PCMark 8 Home Score Accelerated v2 | 3747 punten | |
| PCMark 8 Work Score Accelerated v2 | 5266 punten | |
| PCMark 10 Score | 4246 punten | |
Help | ||
| DPC Latencies / LatencyMon - interrupt to process latency (max), Web, Youtube, Prime95 | |
| Asus ZenBook Duo UX481FL | |
* ... kleiner is beter
| Asus ZenBook Duo UX481FL Intel SSD 660p 1TB SSDPEKNW010T8 | Asus ZenBook 14 UM431DA-AM020T SK hynix BC501 HFM512GDHTNG-8310A | Huawei Matebook X Pro i5 Samsung PM961 MZVLW256HEHP | Lenovo ThinkPad X1 Carbon G7 20R1-000YUS WDC PC SN730 SDBPNTY-512G | MSI Prestige 14 A10SC-009 Samsung SSD PM981 MZVLB1T0HALR | |
|---|---|---|---|---|---|
| AS SSD | 0% | 3% | 14% | 74% | |
| Seq Read (MB/s) | 1237 | 1417 15% | 2416 95% | 1786 44% | 2300 86% |
| Seq Write (MB/s) | 1069 | 781 -27% | 1170 9% | 1259 18% | 2051 92% |
| 4K Read (MB/s) | 52.1 | 37.03 -29% | 48.33 -7% | 45.86 -12% | 46.23 -11% |
| 4K Write (MB/s) | 134.7 | 80.1 -41% | 103.1 -23% | 147.9 10% | 84.6 -37% |
| 4K-64 Read (MB/s) | 585 | 740 26% | 1039 78% | 885 51% | 1552 165% |
| 4K-64 Write (MB/s) | 854 | 748 -12% | 399.6 -53% | 950 11% | 1789 109% |
| Access Time Read * (ms) | 0.05 | 0.047 6% | 0.058 -16% | 0.058 -16% | 0.049 2% |
| Access Time Write * (ms) | 0.117 | 0.045 62% | 0.036 69% | 0.074 37% | 0.045 62% |
| Score Read (Points) | 761 | 918 21% | 1329 75% | 1110 46% | 1828 140% |
| Score Write (Points) | 1095 | 906 -17% | 620 -43% | 1224 12% | 2079 90% |
| Score Total (Points) | 2255 | 2270 1% | 2575 14% | 2885 28% | 4831 114% |
| Copy ISO MB/s (MB/s) | 1714 | 739 -57% | 1384 -19% | ||
| Copy Program MB/s (MB/s) | 511 | 312.3 -39% | 525 3% | ||
| Copy Game MB/s (MB/s) | 1187 | 486.3 -59% | 1008 -15% | ||
| CrystalDiskMark 5.2 / 6 | -32% | -17% | 24% | 20% | |
| Write 4K (MB/s) | 140.7 | 118.8 -16% | 116.5 -17% | 151.5 8% | 163.8 16% |
| Read 4K (MB/s) | 55.6 | 41.62 -25% | 42.18 -24% | 45.83 -18% | 48.6 -13% |
| Write Seq (MB/s) | 1415 | 796 -44% | 1079 -24% | 2060 46% | 2269 60% |
| Read Seq (MB/s) | 1516 | 1101 -27% | 1030 -32% | 1973 30% | 1963 29% |
| Write 4K Q32T1 (MB/s) | 474.5 | 234.7 -51% | 225.7 -52% | 489.8 3% | 289.8 -39% |
| Read 4K Q32T1 (MB/s) | 403.4 | 313.8 -22% | 302.9 -25% | 386.2 -4% | 373.6 -7% |
| Write Seq Q32T1 (MB/s) | 1796 | 842 -53% | 1174 -35% | 2703 51% | 2395 33% |
| Read Seq Q32T1 (MB/s) | 1913 | 1645 -14% | 3394 77% | 3376 76% | 3479 82% |
| Totaal Gemiddelde (Programma / Instellingen) | -16% /
-13% | -7% /
-4% | 19% /
18% | 47% /
51% |
* ... kleiner is beter

| 3DMark | |
| 1280x720 Cloud Gate Standard Graphics | |
| Dell G5 15 5587 | |
| Asus ZenBook 15 UX534FTC-A8190T | |
| Asus ZenBook Flip 15 UX563FD-A1027T | |
| Gemiddeld NVIDIA GeForce MX250 (13805 - 23863, n=25) | |
| Dell Inspiron 15 5000 5585 | |
| Asus ZenBook Duo UX481FL | |
| Asus Zenbook 14 UX433FN-A6023T | |
| Lenovo Yoga C940-14IIL 81Q9 | |
| Asus VivoBook 15 X510UQ-BQ534T | |
| 1920x1080 Fire Strike Graphics | |
| Dell G5 15 5587 | |
| Asus ZenBook 15 UX534FTC-A8190T | |
| Asus ZenBook Flip 15 UX563FD-A1027T | |
| Gemiddeld NVIDIA GeForce MX250 (2939 - 3885, n=29) | |
| Dell Inspiron 15 5000 5585 | |
| Lenovo Yoga C940-14IIL 81Q9 | |
| Asus ZenBook Duo UX481FL | |
| Asus Zenbook 14 UX433FN-A6023T | |
| Asus VivoBook 15 X510UQ-BQ534T | |
| 2560x1440 Time Spy Graphics | |
| Dell G5 15 5587 | |
| Asus ZenBook 15 UX534FTC-A8190T | |
| Asus ZenBook Flip 15 UX563FD-A1027T | |
| Gemiddeld NVIDIA GeForce MX250 (881 - 1169, n=22) | |
| Asus ZenBook Duo UX481FL | |
| Asus Zenbook 14 UX433FN-A6023T | |
| Dell Inspiron 15 5000 5585 | |
| Lenovo Yoga C940-14IIL 81Q9 | |
| Asus VivoBook 15 X510UQ-BQ534T | |
| 3DMark 11 | |
| 1280x720 Performance GPU | |
| Dell G5 15 5587 | |
| Asus ZenBook 15 UX534FTC-A8190T | |
| Asus ZenBook Flip 15 UX563FD-A1027T | |
| Lenovo Yoga C940-14IIL 81Q9 | |
| Gemiddeld NVIDIA GeForce MX250 (3585 - 4942, n=29) | |
| Dell Inspiron 15 5000 5585 | |
| Asus ZenBook Duo UX481FL | |
| Asus Zenbook 14 UX433FN-A6023T | |
| Asus VivoBook 15 X510UQ-BQ534T | |
| 1280x720 Performance Combined | |
| Dell G5 15 5587 | |
| Asus ZenBook 15 UX534FTC-A8190T | |
| Asus ZenBook Flip 15 UX563FD-A1027T | |
| Gemiddeld NVIDIA GeForce MX250 (3532 - 4638, n=29) | |
| Lenovo Yoga C940-14IIL 81Q9 | |
| Asus ZenBook Duo UX481FL | |
| Asus Zenbook 14 UX433FN-A6023T | |
| Dell Inspiron 15 5000 5585 | |
| Asus VivoBook 15 X510UQ-BQ534T | |
| 3DMark 11 Performance | 3991 punten | |
| 3DMark Cloud Gate Standard Score | 12710 punten | |
| 3DMark Fire Strike Score | 2758 punten | |
| 3DMark Time Spy Score | 995 punten | |
Help | ||
| lage | gem. | hoge | ultra | |
|---|---|---|---|---|
| The Witcher 3 (2015) | 58.3 | 33.8 | 18 | 9.8 |
| Dota 2 Reborn (2015) | 114 | 102 | 62.3 | 56 |
| X-Plane 11.11 (2018) | 64.8 | 45.5 | 42.5 |
| Asus ZenBook Duo UX481FL GeForce MX250, i7-10510U, Intel SSD 660p 1TB SSDPEKNW010T8 | Asus ZenBook 14 UM431DA-AM020T Vega 10, R7 3700U, SK hynix BC501 HFM512GDHTNG-8310A | Huawei Matebook X Pro i5 GeForce MX150, i5-8250U, Samsung PM961 MZVLW256HEHP | MSI Prestige 14 A10SC-009 GeForce GTX 1650 Max-Q, i7-10710U, Samsung SSD PM981 MZVLB1T0HALR | Asus Zenbook 14 UX433FN-A6023T GeForce MX150, i7-8565U, Intel SSD 660p SSDPEKNW512G8 | |
|---|---|---|---|---|---|
| Noise | 1% | -3% | -7% | -5% | |
| uit / omgeving * (dB) | 28.3 | 29.8 -5% | 27.9 1% | 30.3 -7% | 30.7 -8% |
| Idle Minimum * (dB) | 28.3 | 28 1% | 27.9 1% | 30.3 -7% | 30.7 -8% |
| Idle Average * (dB) | 28.3 | 28 1% | 27.9 1% | 30.3 -7% | 30.7 -8% |
| Idle Maximum * (dB) | 28.3 | 28 1% | 27.9 1% | 30.3 -7% | 30.7 -8% |
| Load Average * (dB) | 39.1 | 36.8 6% | 36.2 7% | 40.2 -3% | 38.8 1% |
| Witcher 3 ultra * (dB) | 39.1 | 45 -15% | |||
| Load Maximum * (dB) | 39.1 | 39 -0% | 45.2 -16% | 43.5 -11% | 39.3 -1% |
* ... kleiner is beter
Geluidsniveau
| Onbelast |
| 28.3 / 28.3 / 28.3 dB (A) |
| Belasting |
| 39.1 / 39.1 dB (A) |
 | ||
30 dB stil 40 dB(A) hoorbaar 50 dB(A) luid |
||
min: | ||
(+) De maximumtemperatuur aan de bovenzijde bedraagt 38.4 °C / 101 F, vergeleken met het gemiddelde van 36.8 °C / 98 F, variërend van 21 tot 71 °C voor de klasse Multimedia.
(-) De bodem warmt op tot een maximum van 48 °C / 118 F, vergeleken met een gemiddelde van 39.1 °C / 102 F
(+) Bij onbelast gebruik bedraagt de gemiddelde temperatuur voor de bovenzijde 27.8 °C / 82 F, vergeleken met het apparaatgemiddelde van 31.3 °C / 88 F.
(±) Bij het spelen van The Witcher 3 is de gemiddelde temperatuur voor de bovenzijde 32.6 °C / 91 F, vergeleken met het apparaatgemiddelde van 31.3 °C / 88 F.
(+) De palmsteunen en het touchpad zijn met een maximum van ###max## °C / 82.4 F koeler dan de huidtemperatuur en voelen daarom koel aan.
(±) De gemiddelde temperatuur van de handpalmsteun van soortgelijke toestellen bedroeg 28.7 °C / 83.7 F (+0.7 °C / 1.3 F).
Asus ZenBook Duo UX481FL audioanalyse
(±) | luidspreker luidheid is gemiddeld maar goed (78.7 dB)
Bas 100 - 315 Hz
(±) | verminderde zeebaars - gemiddeld 9.8% lager dan de mediaan
(-) | de lage tonen zijn niet lineair (16.6% delta naar de vorige frequentie)
Midden 400 - 2000 Hz
(±) | hogere middens - gemiddeld 5.5% hoger dan de mediaan
(+) | de middentonen zijn lineair (6.1% delta ten opzichte van de vorige frequentie)
Hoog 2 - 16 kHz
(+) | evenwichtige hoogtepunten - slechts 1.9% verwijderd van de mediaan
(+) | de hoge tonen zijn lineair (4.7% delta naar de vorige frequentie)
Algemeen 100 - 16.000 Hz
(±) | lineariteit van het totale geluid is gemiddeld (18.9% verschil met de mediaan)
Vergeleken met dezelfde klasse
» 59% van alle geteste apparaten in deze klasse waren beter, 7% vergelijkbaar, 33% slechter
» De beste had een delta van 5%, het gemiddelde was 17%, de slechtste was 45%
Vergeleken met alle geteste toestellen
» 44% van alle geteste apparaten waren beter, 8% gelijk, 48% slechter
» De beste had een delta van 4%, het gemiddelde was 23%, de slechtste was 134%
Apple MacBook 12 (Early 2016) 1.1 GHz audioanalyse
(+) | luidsprekers kunnen relatief luid spelen (83.6 dB)
Bas 100 - 315 Hz
(±) | verminderde zeebaars - gemiddeld 11.3% lager dan de mediaan
(±) | lineariteit van de lage tonen is gemiddeld (14.2% delta ten opzichte van de vorige frequentie)
Midden 400 - 2000 Hz
(+) | evenwichtige middens - slechts 2.4% verwijderd van de mediaan
(+) | de middentonen zijn lineair (5.5% delta ten opzichte van de vorige frequentie)
Hoog 2 - 16 kHz
(+) | evenwichtige hoogtepunten - slechts 2% verwijderd van de mediaan
(+) | de hoge tonen zijn lineair (4.5% delta naar de vorige frequentie)
Algemeen 100 - 16.000 Hz
(+) | het totale geluid is lineair (10.2% verschil met de mediaan)
Vergeleken met dezelfde klasse
» 7% van alle geteste apparaten in deze klasse waren beter, 2% vergelijkbaar, 90% slechter
» De beste had een delta van 5%, het gemiddelde was 18%, de slechtste was 53%
Vergeleken met alle geteste toestellen
» 5% van alle geteste apparaten waren beter, 1% gelijk, 94% slechter
» De beste had een delta van 4%, het gemiddelde was 23%, de slechtste was 134%
| Uit / Standby | |
| Inactief | |
| Belasting |
|
Key:
min: | |
| Asus ZenBook Duo UX481FL i7-10510U, GeForce MX250, Intel SSD 660p 1TB SSDPEKNW010T8, IPS, 1920x1080, 14" | Asus ZenBook 14 UM431DA-AM020T R7 3700U, Vega 10, SK hynix BC501 HFM512GDHTNG-8310A, IPS, 1920x1080, 14" | Huawei Matebook X Pro i5 i5-8250U, GeForce MX150, Samsung PM961 MZVLW256HEHP, IPS, 3000x2000, 13.9" | Lenovo ThinkPad X1 Carbon G7 20R1-000YUS i7-10510U, UHD Graphics 620, WDC PC SN730 SDBPNTY-512G, IPS, 3840x2160, 14" | MSI Prestige 14 A10SC-009 i7-10710U, GeForce GTX 1650 Max-Q, Samsung SSD PM981 MZVLB1T0HALR, IPS, 3840x2160, 14" | Lenovo IdeaPad S940-14IWL i7-8565U, UHD Graphics 620, Samsung SSD PM981 MZVLB512HAJQ, IPS, 3840x2160, 14" | |
|---|---|---|---|---|---|---|
| Power Consumption | 17% | -1% | -4% | -26% | -4% | |
| Idle Minimum * (Watt) | 3.5 | 3.6 -3% | 3.5 -0% | 3.5 -0% | 5.2 -49% | 5.2 -49% |
| Idle Average * (Watt) | 10 | 7.2 28% | 8.9 11% | 10.8 -8% | 12.2 -22% | 10.2 -2% |
| Idle Maximum * (Watt) | 11 | 10.8 2% | 12.3 -12% | 12.5 -14% | 14.3 -30% | 11.9 -8% |
| Load Average * (Watt) | 53 | 38 28% | 54.2 -2% | 47.2 11% | 67 -26% | 42.1 21% |
| Witcher 3 ultra * (Watt) | 35.6 | 42.4 -19% | ||||
| Load Maximum * (Watt) | 63.6 | 45.2 29% | 52.1 18% | 68.8 -8% | 67 -5% | 53.6 16% |
* ... kleiner is beter
| Asus ZenBook Duo UX481FL i7-10510U, GeForce MX250, 70 Wh | Asus ZenBook 14 UM431DA-AM020T R7 3700U, Vega 10, 47 Wh | Huawei Matebook X Pro i5 i5-8250U, GeForce MX150, 57.4 Wh | Lenovo ThinkPad X1 Carbon G7 20R1-000YUS i7-10510U, UHD Graphics 620, 51 Wh | MSI Prestige 14 A10SC-009 i7-10710U, GeForce GTX 1650 Max-Q, 52 Wh | Lenovo IdeaPad S940-14IWL i7-8565U, UHD Graphics 620, 52 Wh | |
|---|---|---|---|---|---|---|
| Batterijduur | -30% | -16% | 5% | -45% | -54% | |
| Reader / Idle (h) | 22.1 | 17.8 -19% | 20.7 -6% | 9.9 -55% | 8.4 -62% | |
| WiFi v1.3 (h) | 9.5 | 6.7 -29% | 9.3 -2% | 10 5% | 5.9 -38% | 5 -47% |
| Load (h) | 3.7 | 2.1 -43% | 2.2 -41% | 2.1 -43% | 1.7 -54% |
Pro
Contra
Voor het volledige, Engelse testrapport, klik hier.
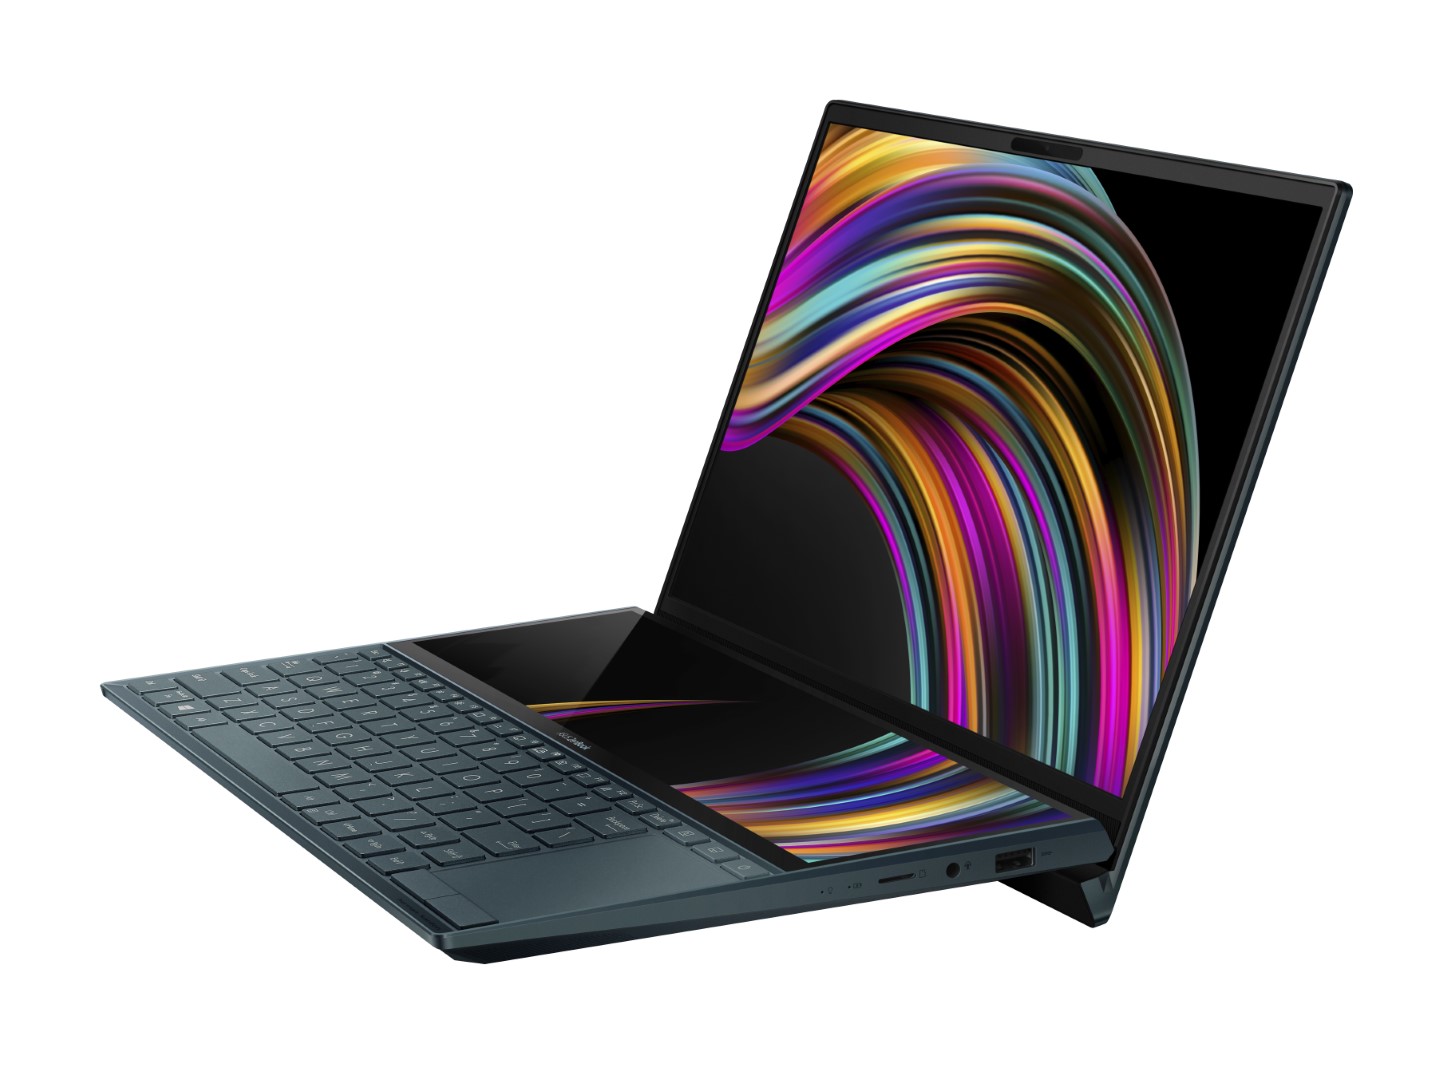
Zoals elke desktopgebruiker kan bevestigen, kan het hebben van twee schermen in plaats van één de productiviteit echt verhogen en de ZenBook Duo is in dit opzicht niet anders. Het is moeilijk om terug te gaan naar slechts één scherm nadat je gewend bent geraakt aan ruime setups met twee schermen en dit is het belangrijkste voordeel waar Asus op rekent.
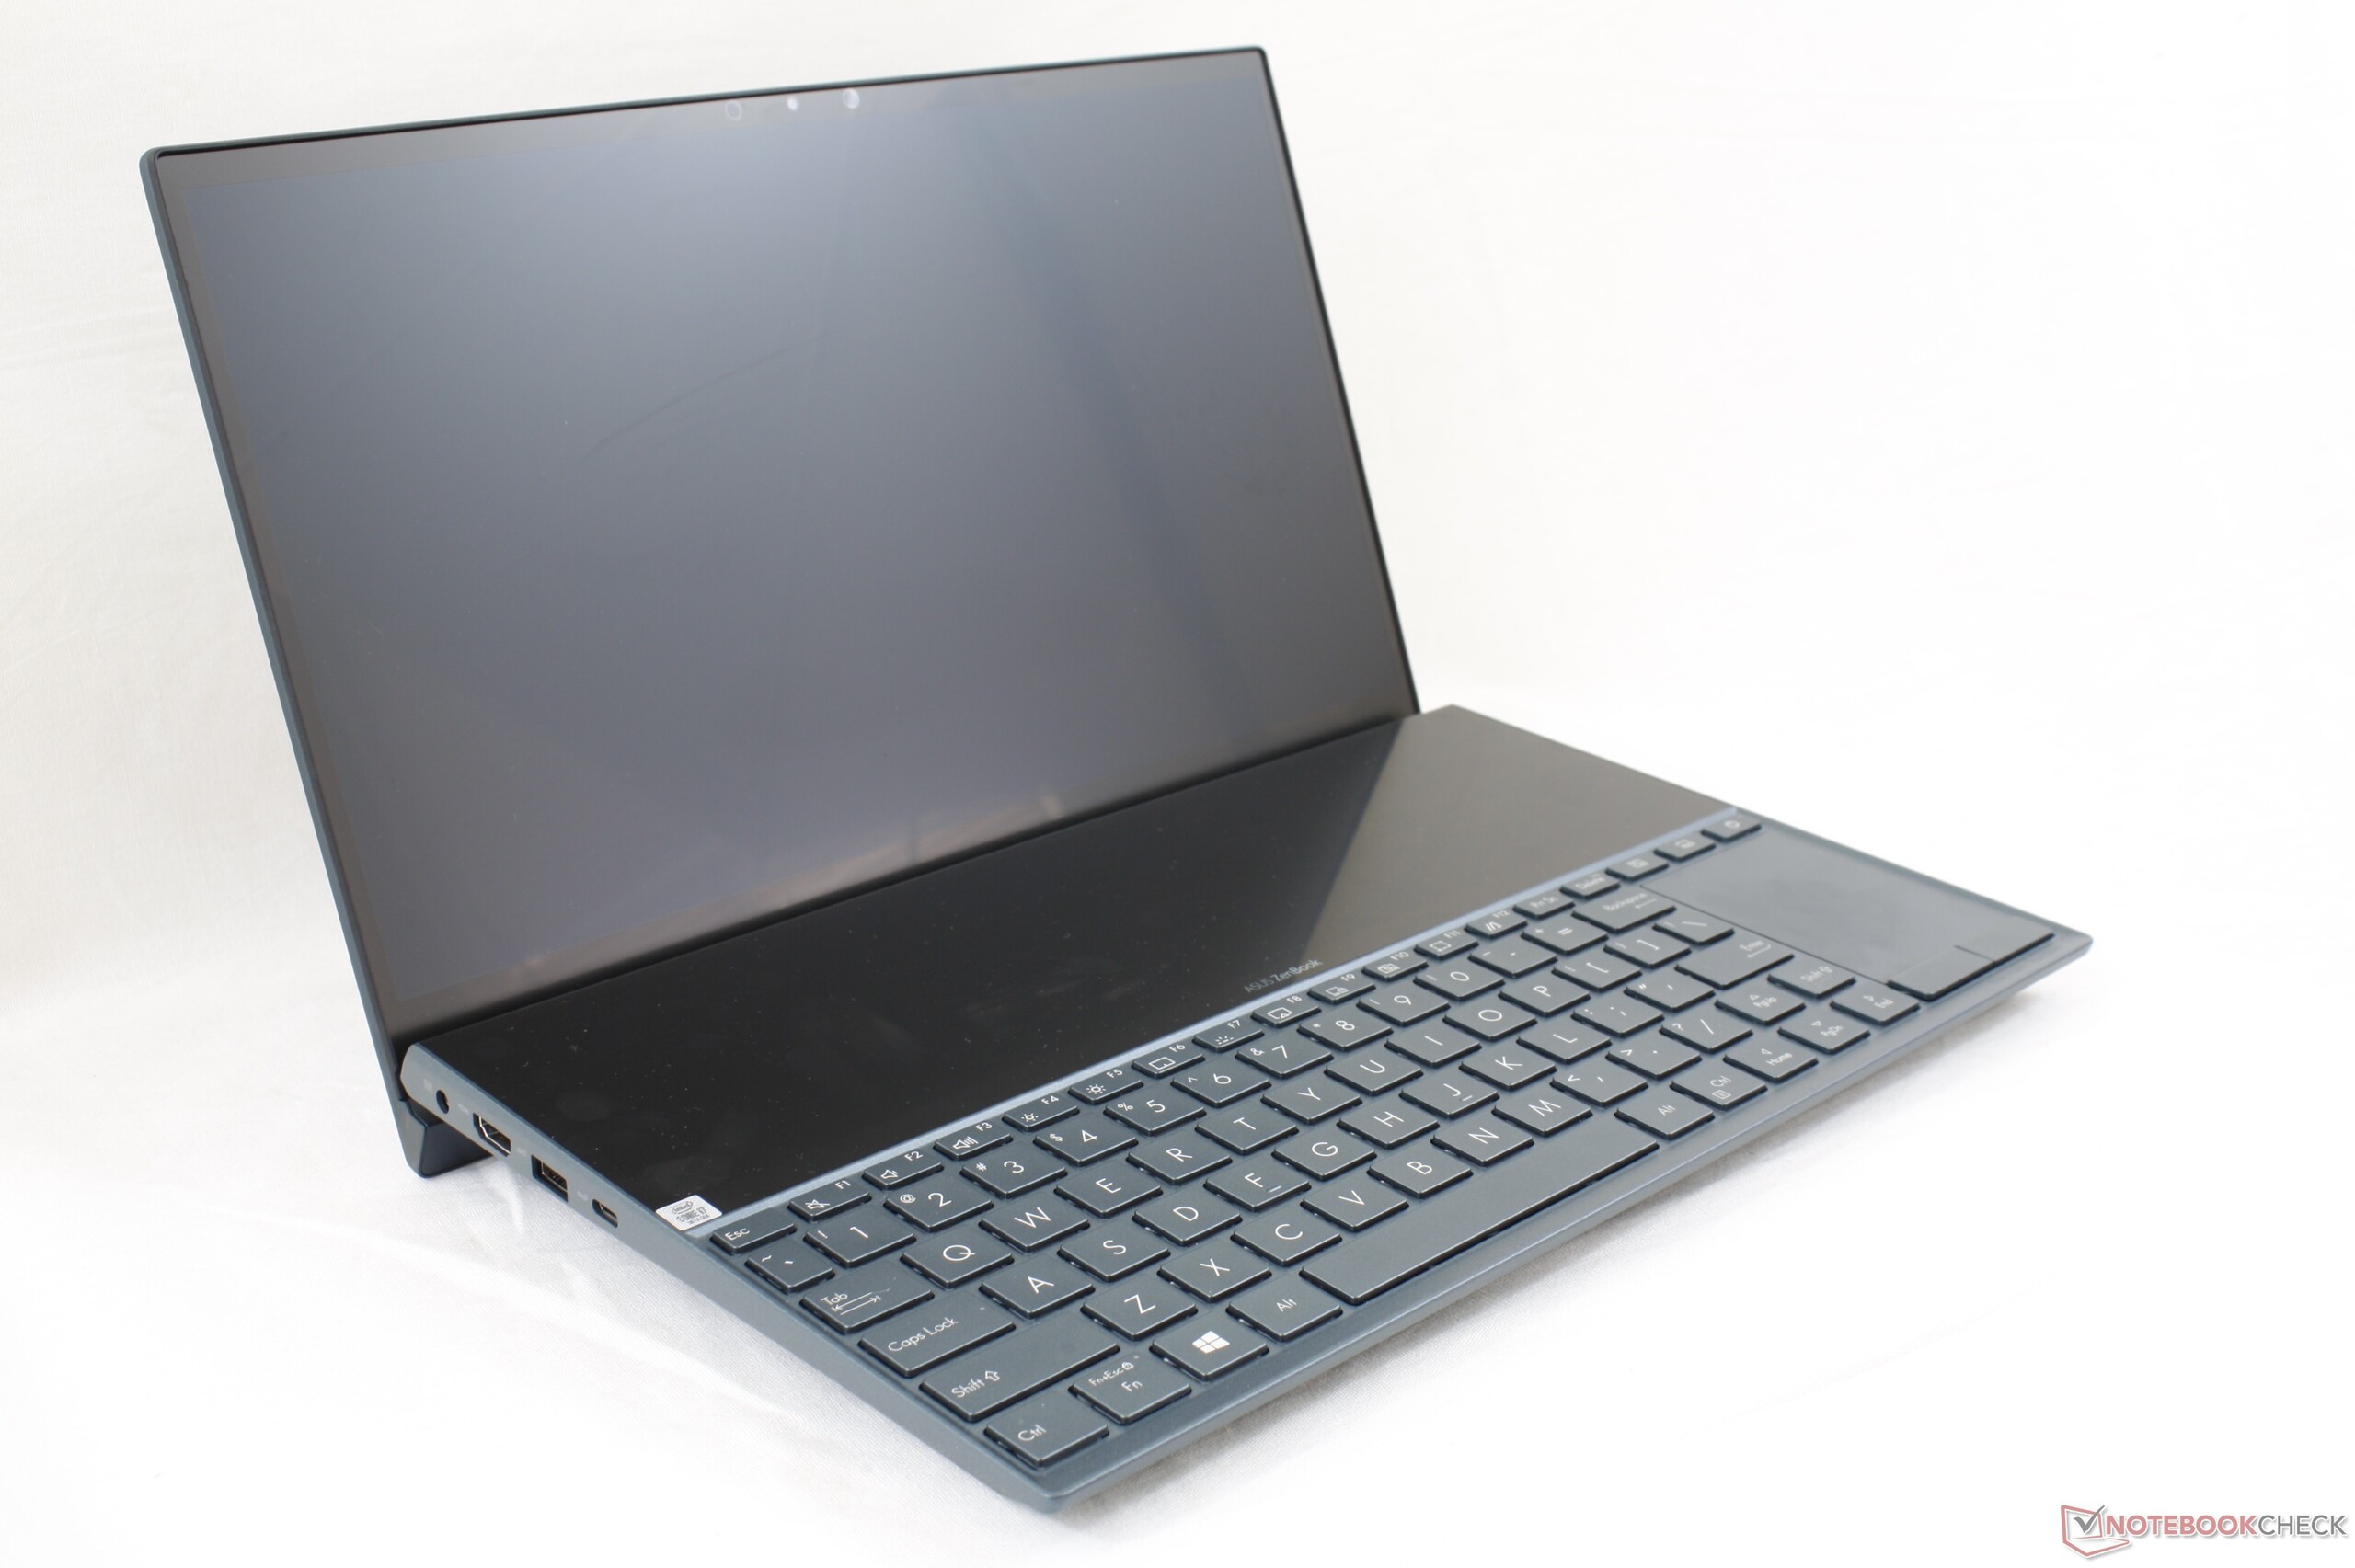
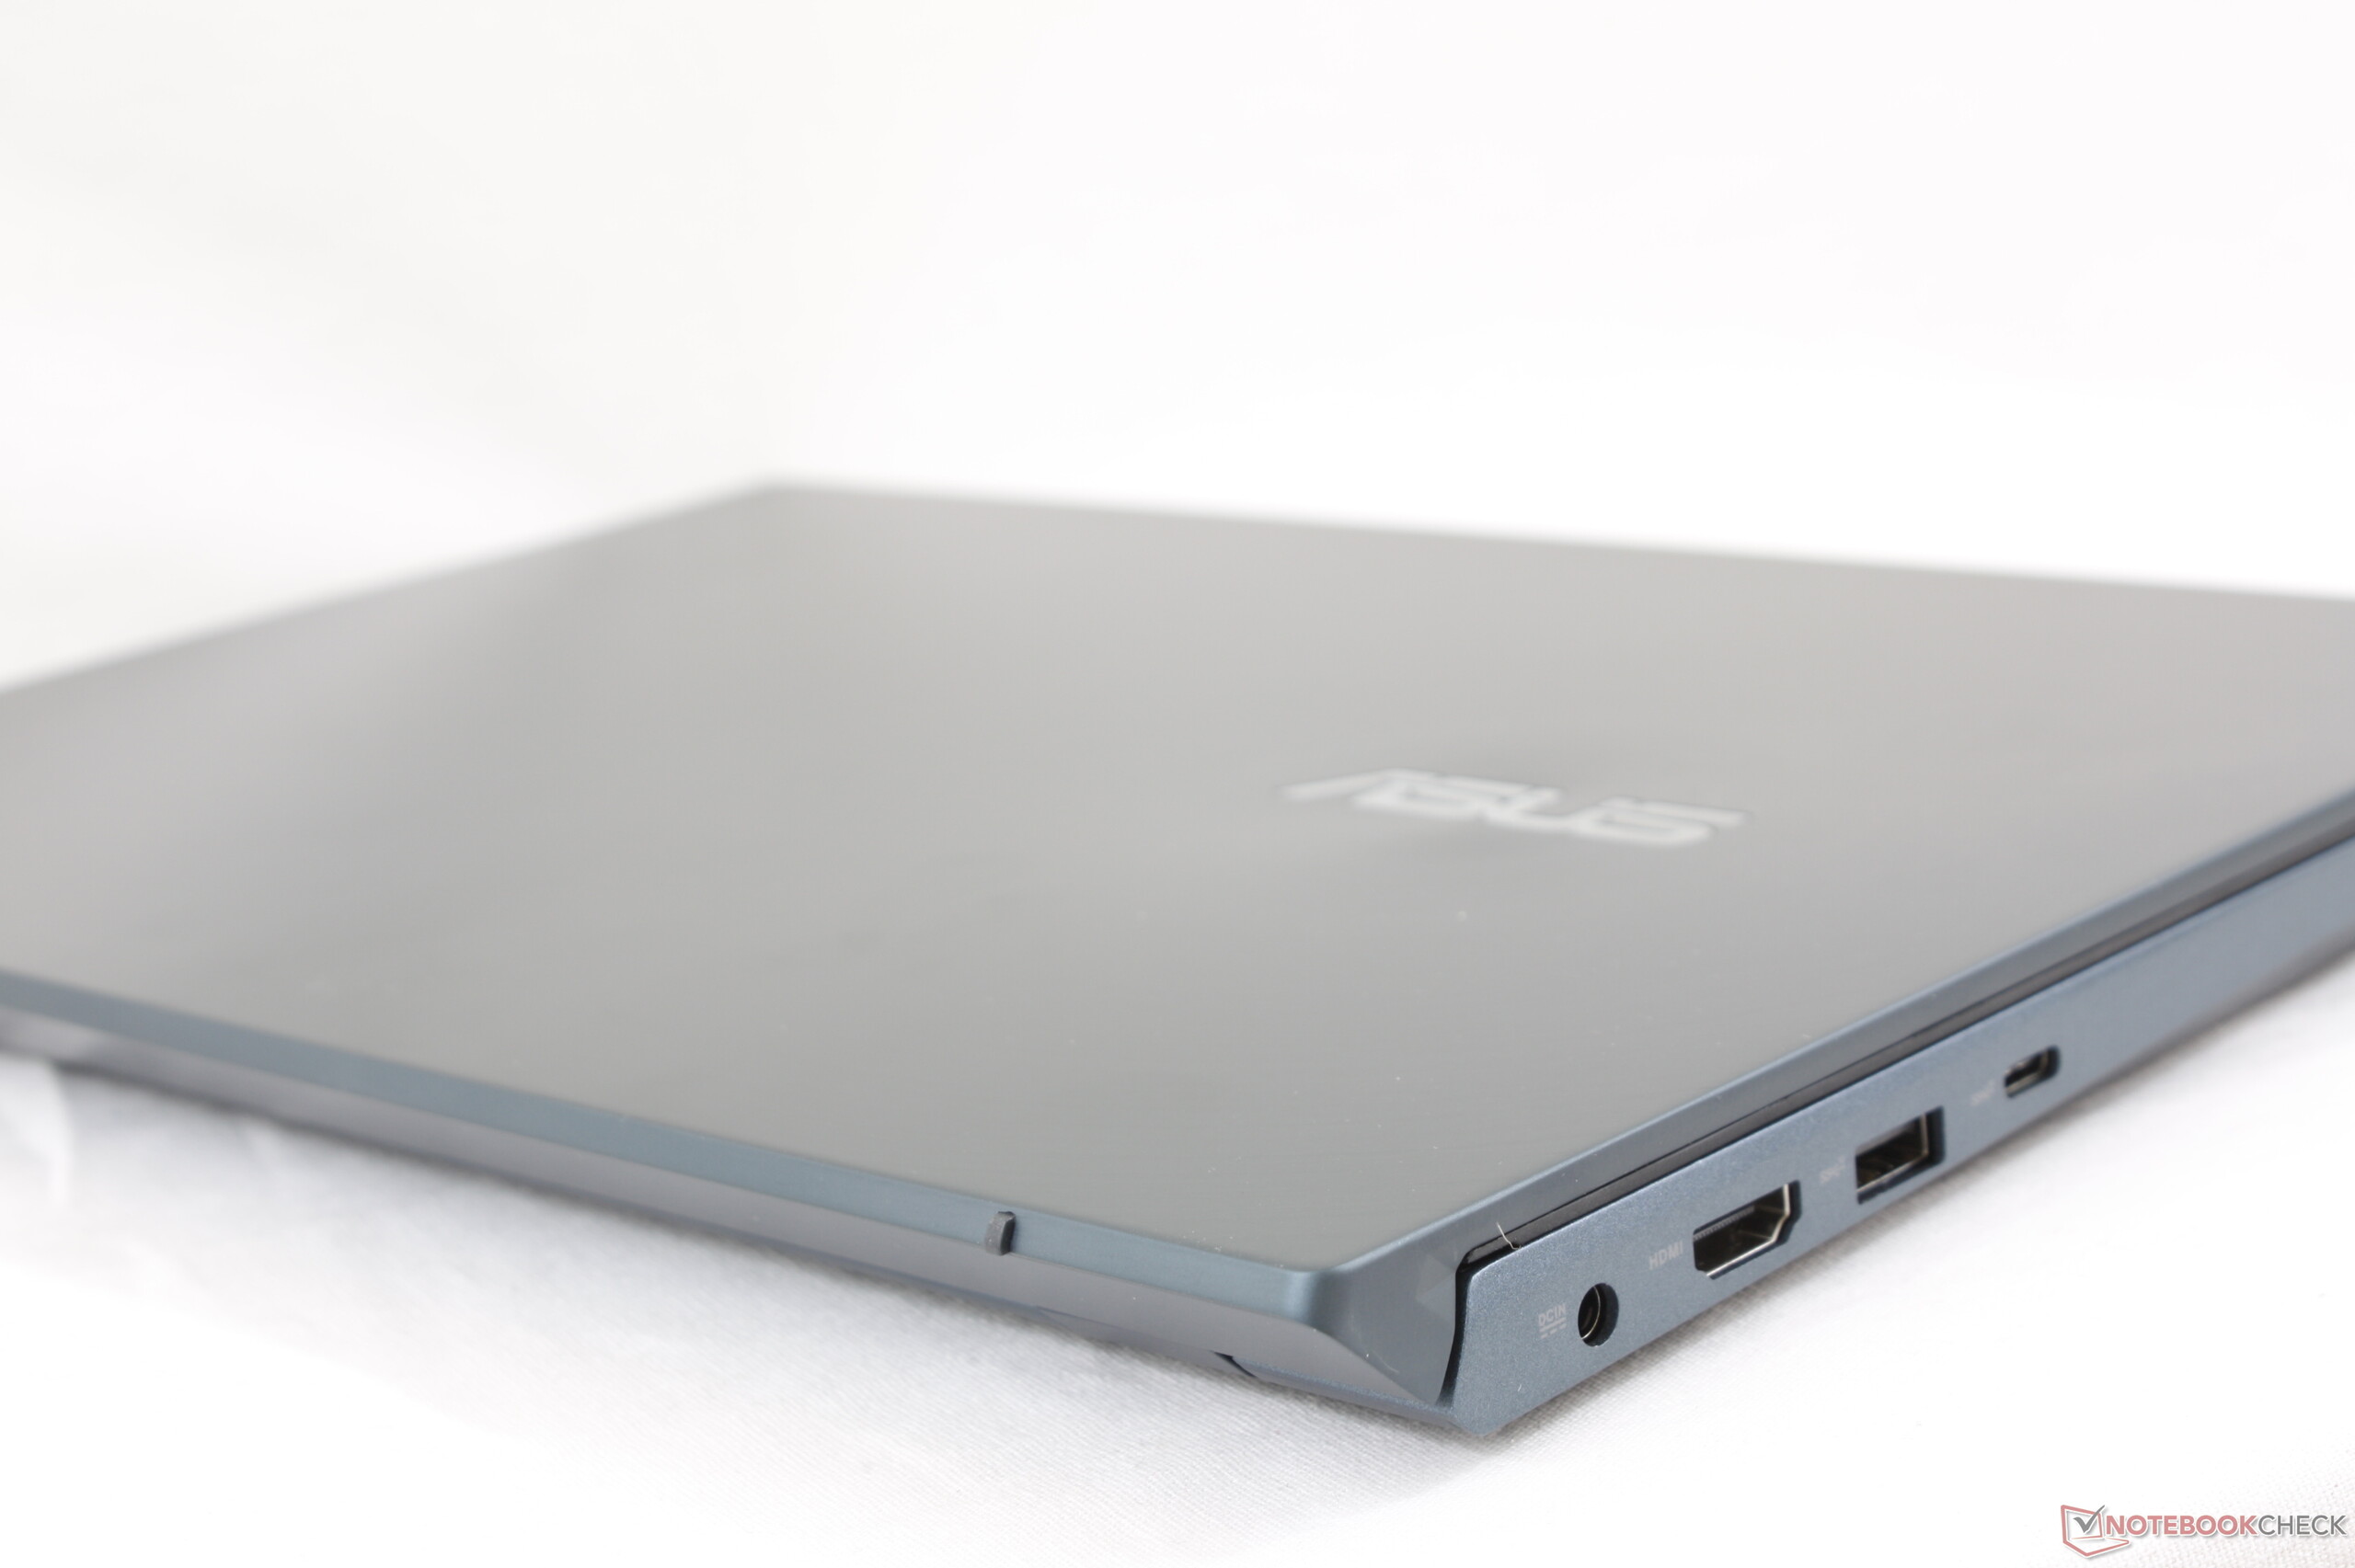
Voor een laptop-vormfactor zullen gebruikers echter enkele compromissen moeten accepteren. Ten eerste is het gewicht het duidelijkste nadeel, aangezien het systeem enkele honderden gram zwaarder is dan een gewone ZenBook 14. Ten tweede zullen de kleuren op het tweede scherm niet zo levendig zijn als op het door Pantone gecertificeerde hoofdscherm. Ten derde zal de brede kijkhoek tussen de gebruiker en het tweede scherm zowel de verblinding accentueren als de schijnbare helderheid duidelijker verminderen, tenzij de omgevingsomstandigheden perfect zijn. Ten vierde kan de ongebruikelijke toetsenbordpositionering een leercurve zijn, vooral als je in krappe werkruimtes typt. En tot slot doen de schermen het buiten niet goed, ondanks het compacte 14-inch formaat en de verrassend lange batterijduur. OLED had mogelijk veel van deze problemen kunnen aanpakken, maar een dergelijke aanpak zou de prijzen waarschijnlijk aanzienlijk hebben opgedreven.
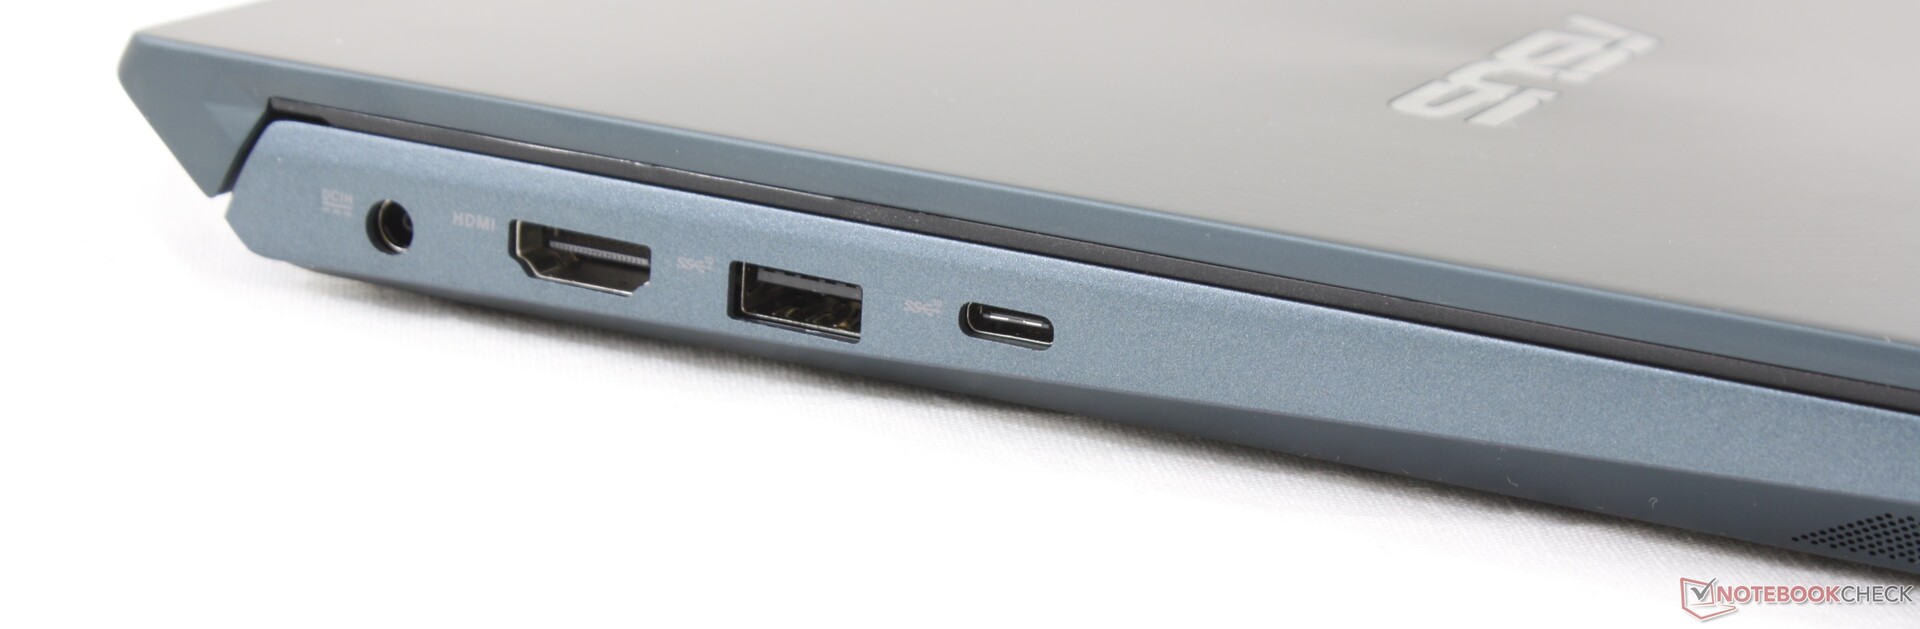
Er zijn nog een aantal ontbrekende functies die we graag zouden willen zien bij toekomstige herzieningen. Een fysieke privacy-sluiter voor de webcam en de mogelijkheid om bijvoorbeeld op te laden via USB Type-C zijn hier niet beschikbaar, hoewel ze standaard zijn geworden op de meeste andere vlaggenschiplaptops.
Als de bovenstaande nadelen je niet storen of als je denkt dat je ze kunt overwinnen, dan zal je merken dat de draagbare ZenBook Duo en het tweede scherm van onschatbare waarde zijn voor je multitasking-behoeften.
De Asus ZenBook Duo is op zijn best wanneer hij werkt in een omgeving met gecontroleerde verlichting en een externe muis om de zichtbaarheid en ergonomie van het secundaire beeldscherm te maximaliseren. Als je op reis bent en graag ruimte wilt besparen, dan is de ZenBook Duo heel logisch. Als je echter nog tafelruimte over heeft, zouden een standaard ZenBook 14 en een goede externe monitor je verder helpen.
Asus ZenBook Duo UX481FL
- 01-05-2020 v7 (old)
Allen Ngo
Price comparison
