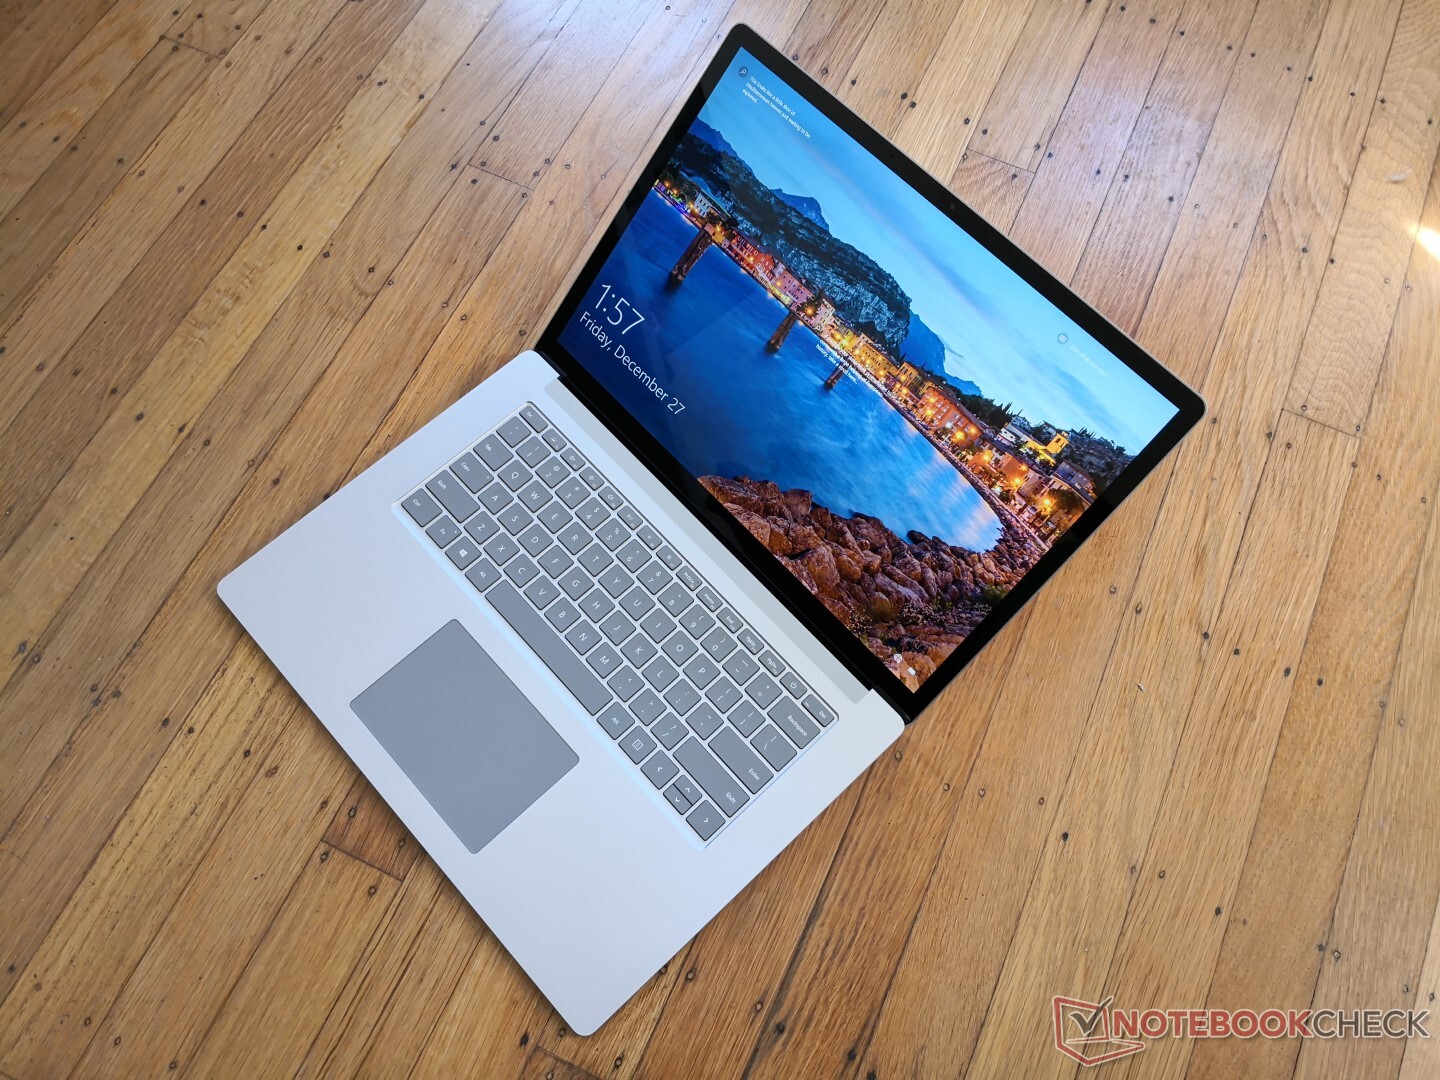
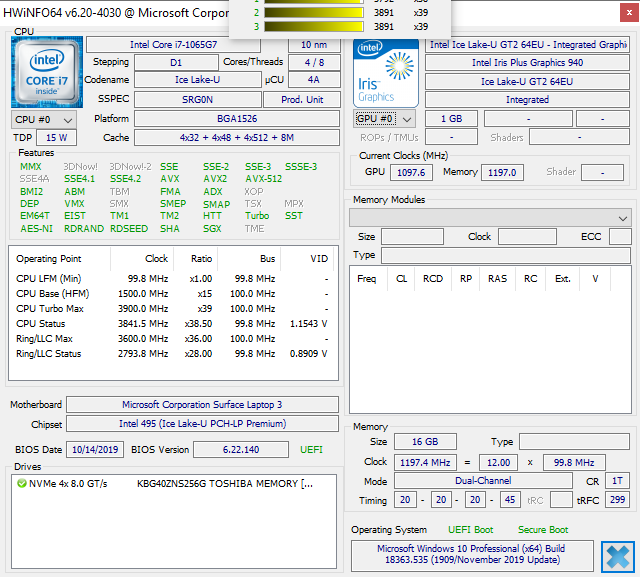
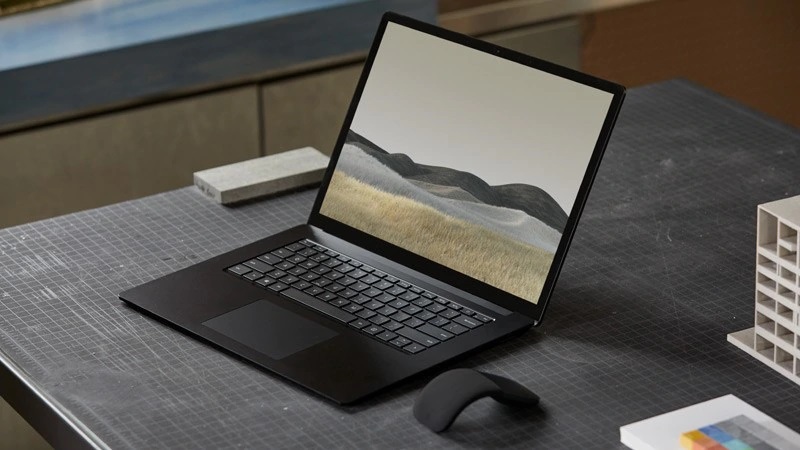
Kort testrapport Microsoft Surface Laptop 3 15-inch Core i7: Beter met Ice Lake
Evaluatie | Datum | Model | Gewicht | Hoogte | Formaat | Resolutie | Beste prijs |
|---|---|---|---|---|---|---|---|
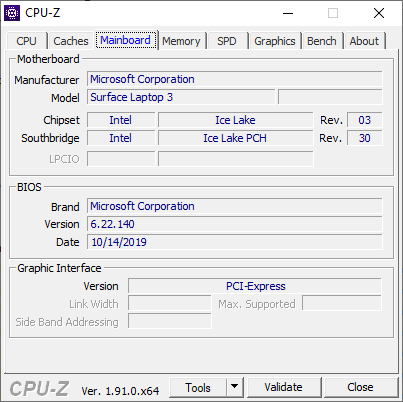
| 83.9 % v7 (old) | 12-2019 | Microsoft Surface Laptop 3 15 i7-1065G7 i7-1065G7, Iris Plus Graphics G7 (Ice Lake 64 EU) | 1.5 kg | 14.7 mm | 15.00" | 2496x1664 | |
| 86.3 % v7 (old) | 09-2019 | Dell XPS 15 7590 i5 iGPU FHD i5-9300H, UHD Graphics 630 | 1.9 kg | 17 mm | 15.60" | 1920x1080 | |
| 86 % v7 (old) | 12-2019 | Lenovo Yoga C940-15IRH i7-9750H, GeForce GTX 1650 Max-Q | 2 kg | 19.7 mm | 15.60" | 1920x1080 | |
| 83.9 % v7 (old) | 03-2019 | HP Spectre x360 15-df0126ng i7-8750H, GeForce GTX 1050 Ti Max-Q | 2.2 kg | 19.3 mm | 15.60" | 3840x2160 | |
| 89.7 % v7 (old) | 12-2019 | Apple MacBook Pro 16 2019 i9 5500M i9-9880H, Radeon Pro 5500M | 2 kg | 16.2 mm | 16.00" | 3072x1920 |

| |||||||||||||||||||||||||
Helderheidsverdeling: 78 %
Helderheid in Batterij-modus: 412.4 cd/m²
Contrast: 1178:1 (Zwart: 0.35 cd/m²)
ΔE ColorChecker Calman: 1.04 | ∀{0.5-29.43 Ø4.71}
calibrated: 0.74
ΔE Greyscale Calman: 1.3 | ∀{0.09-98 Ø4.96}
98.4% sRGB (Argyll 1.6.3 3D)
62.4% AdobeRGB 1998 (Argyll 1.6.3 3D)
67.8% AdobeRGB 1998 (Argyll 3D)
98.4% sRGB (Argyll 3D)
65.6% Display P3 (Argyll 3D)
Gamma: 2.07
CCT: 6634 K
| Microsoft Surface Laptop 3 15 i7-1065G7 Sharp LQ150P1JX51, IPS, 15", 2496x1664 | Apple MacBook Pro 16 2019 i9 5500M APPA044, IPS, 16", 3072x1920 | Dell XPS 15 7590 i5 iGPU FHD LQ156M1, IPS, 15.6", 1920x1080 | Asus ZenBook 15 UX534FT-DB77 BOE NV156FHM-N63, IPS, 15.6", 1920x1080 | MSI Prestige 15 A10SC Sharp LQ156D1JW42, IPS, 15.6", 3840x2160 | Microsoft Surface Laptop 3 15 Ryzen 5 3580U Sharp LQ150P1JX51, IPS, 15", 2496x1664 | |
|---|---|---|---|---|---|---|
| Display | 1% | -5% | 22% | -1% | ||
| Display P3 Coverage (%) | 65.6 | 66.5 1% | 66.6 2% | 82 25% | 66.9 2% | |
| sRGB Coverage (%) | 98.4 | 98 0% | 87.7 -11% | 98.3 0% | 99.3 1% | |
| AdobeRGB 1998 Coverage (%) | 67.8 | 68.4 1% | 64.1 -5% | 96.2 42% | 63.7 -6% | |
| Response Times | 7% | 11% | 20% | -8% | 10% | |
| Response Time Grey 50% / Grey 80% * (ms) | 56 ? | 52.4 ? 6% | 52.8 ? 6% | 41.2 ? 26% | 60 ? -7% | 47.2 ? 16% |
| Response Time Black / White * (ms) | 38 ? | 34.9 ? 8% | 32 ? 16% | 33.2 ? 13% | 41.2 ? -8% | 36.8 ? 3% |
| PWM Frequency (Hz) | 21370 ? | 131700 | 1020 ? | 26040 ? | 21370 ? | |
| Screen | -14% | -34% | -132% | -65% | -31% | |
| Brightness middle (cd/m²) | 412.4 | 519 26% | 588 43% | 312.6 -24% | 464.5 13% | 416.9 1% |
| Brightness (cd/m²) | 374 | 477 28% | 555 48% | 290 -22% | 451 21% | 389 4% |
| Brightness Distribution (%) | 78 | 86 10% | 89 14% | 85 9% | 92 18% | 86 10% |
| Black Level * (cd/m²) | 0.35 | 0.39 -11% | 0.4 -14% | 0.31 11% | 0.5 -43% | 0.4 -14% |
| Contrast (:1) | 1178 | 1331 13% | 1470 25% | 1008 -14% | 929 -21% | 1042 -12% |
| Colorchecker dE 2000 * | 1.04 | 2.28 -119% | 2.5 -140% | 5.78 -456% | 3.36 -223% | 2.75 -164% |
| Colorchecker dE 2000 max. * | 2.83 | 6.54 -131% | 6.3 -123% | 8.86 -213% | 7.06 -149% | 6.64 -135% |
| Colorchecker dE 2000 calibrated * | 0.74 | 0.86 -16% | 0.6 19% | 3.78 -411% | 3.42 -362% | 0.71 4% |
| Greyscale dE 2000 * | 1.3 | 0.9 31% | 4.5 -246% | 5.4 -315% | 1.3 -0% | 1.8 -38% |
| Gamma | 2.07 106% | 2145 0% | 2.2 100% | 2.21 100% | 2.14 103% | 2.09 105% |
| CCT | 6634 98% | 6572 99% | 6836 95% | 7864 83% | 6596 99% | 6646 98% |
| Color Space (Percent of AdobeRGB 1998) (%) | 62.4 | 78 25% | 63.2 1% | 57.1 -8% | 84.8 36% | 63.4 2% |
| Color Space (Percent of sRGB) (%) | 98.4 | 98 0% | 87.4 -11% | 98.3 0% | 99.4 1% | |
| Totaal Gemiddelde (Programma / Instellingen) | -4% /
-11% | -7% /
-22% | -39% /
-89% | -17% /
-41% | -7% /
-20% |
* ... kleiner is beter
Responstijd Scherm
| ↔ Responstijd Zwart naar Wit | ||
|---|---|---|
| 38 ms ... stijging ↗ en daling ↘ gecombineerd | ↗ 21.2 ms stijging | 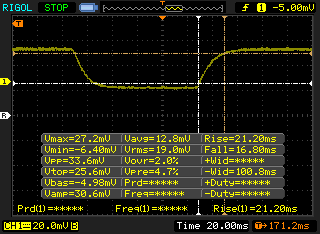 |
| ↘ 16.8 ms daling | ||
| Het scherm vertoonde trage responstijden in onze tests en is misschien te traag voor games. Ter vergelijking: alle testtoestellen variëren van 0.1 (minimum) tot 240 (maximum) ms. » 96 % van alle toestellen zijn beter. Dit betekent dat de gemeten responstijd slechter is dan het gemiddelde (19.8 ms) van alle geteste toestellen. | ||
| ↔ Responstijd 50% Grijs naar 80% Grijs | ||
| 56 ms ... stijging ↗ en daling ↘ gecombineerd | ↗ 27.6 ms stijging | 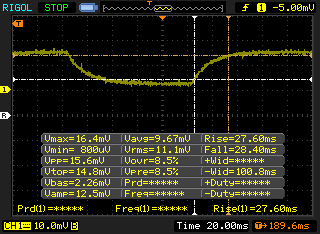 |
| ↘ 28.4 ms daling | ||
| Het scherm vertoonde trage responstijden in onze tests en is misschien te traag voor games. Ter vergelijking: alle testtoestellen variëren van 0.165 (minimum) tot 636 (maximum) ms. » 93 % van alle toestellen zijn beter. Dit betekent dat de gemeten responstijd slechter is dan het gemiddelde (31 ms) van alle geteste toestellen. | ||
Screen Flickering / PWM (Pulse-Width Modulation)
| Screen flickering / PWM waargenomen | 21370 Hz | ≤ 51 % helderheid instelling | 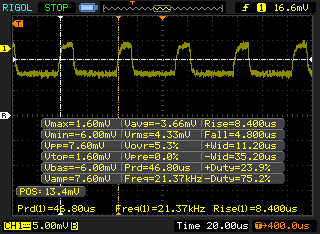 |
De achtergrondverlichting van het scherm flikkert op 21370 Hz (in het slechtste geval, bijvoorbeeld bij gebruik van PWM) aan een helderheid van 51 % en lager. Boven deze helderheid zou er geen flickering / PWM mogen optreden. De frequentie van 21370 Hz is redelijk hoog en de meeste mensen die gevoelig zijn aan flickering zouden dit dus niet mogen waarnemen of geïrriteerde ogen krijgen. Ter vergelijking: 52 % van alle geteste toestellen maakten geen gebruik van PWM om de schermhelderheid te verlagen. Als het wel werd gebruikt, werd een gemiddelde van 7754 (minimum: 5 - maximum: 343500) Hz waargenomen. | |||
| Cinebench R20 | |
| CPU (Single Core) | |
| MSI Prestige 15 A10SC | |
| Microsoft Surface Laptop 3 15 i7-1065G7 | |
| Walmart EVOO Gaming 17 | |
| Microsoft Surface Pro 7 Core i5-1035G4 | |
| Gemiddeld Intel Core i7-1065G7 (358 - 474, n=31) | |
| Dell G3 3590 | |
| Dell XPS 13 7390 2-in-1 Core i3 | |
| HP EliteBook x360 830 G6 | |
| Dynabook Portege A30-E-174 | |
| Microsoft Surface Laptop 3 15 Ryzen 5 3580U | |
| Dell Latitude 13 3390 | |
| Dell Inspiron 15 5000 5585 | |
| Dell Latitude 3400 | |
| CPU (Multi Core) | |
| Walmart EVOO Gaming 17 | |
| MSI Prestige 15 A10SC | |
| Dell G3 3590 | |
| Microsoft Surface Laptop 3 15 i7-1065G7 | |
| Microsoft Surface Laptop 3 15 Ryzen 5 3580U | |
| Gemiddeld Intel Core i7-1065G7 (1081 - 2024, n=31) | |
| Dell Inspiron 15 5000 5585 | |
| Microsoft Surface Pro 7 Core i5-1035G4 | |
| HP EliteBook x360 830 G6 | |
| Dynabook Portege A30-E-174 | |
| Dell Latitude 13 3390 | |
| Dell XPS 13 7390 2-in-1 Core i3 | |
| Dell Latitude 3400 | |
| Cinebench R15 | |
| CPU Single 64Bit | |
| MSI Prestige 15 A10SC | |
| Microsoft Surface Laptop 3 15 i7-1065G7 | |
| Walmart EVOO Gaming 17 | |
| Gemiddeld Intel Core i7-1065G7 (141 - 190, n=35) | |
| Dell G3 3590 | |
| Microsoft Surface Pro 7 Core i5-1035G4 | |
| HP EliteBook x360 830 G6 | |
| Dell XPS 13 7390 2-in-1 Core i3 | |
| Dynabook Portege A30-E-174 | |
| Dell Latitude 3400 | |
| Dell Latitude 13 3390 | |
| Microsoft Surface Laptop 3 15 Ryzen 5 3580U | |
| Dell Inspiron 15 5000 5585 | |
| CPU Multi 64Bit | |
| Walmart EVOO Gaming 17 | |
| MSI Prestige 15 A10SC | |
| Dell G3 3590 | |
| Microsoft Surface Laptop 3 15 i7-1065G7 | |
| Microsoft Surface Laptop 3 15 Ryzen 5 3580U | |
| Dell Inspiron 15 5000 5585 | |
| Gemiddeld Intel Core i7-1065G7 (288 - 836, n=36) | |
| Microsoft Surface Pro 7 Core i5-1035G4 | |
| Dell Latitude 13 3390 | |
| HP EliteBook x360 830 G6 | |
| Dynabook Portege A30-E-174 | |
| Dell XPS 13 7390 2-in-1 Core i3 | |
| Dell Latitude 3400 | |
| PCMark 8 Home Score Accelerated v2 | 3783 punten | |
| PCMark 8 Work Score Accelerated v2 | 4799 punten | |
| PCMark 10 Score | 4644 punten | |
Help | ||
| Microsoft Surface Laptop 3 15 i7-1065G7 Toshiba KBG40ZNS256G NVMe | Apple MacBook Pro 16 2019 i9 5500M Apple SSD AP1024 7171 | Asus ZenBook 15 UX534FT-DB77 Samsung SSD PM981 MZVLB1T0HALR | MSI Prestige 15 A10SC Samsung SSD PM981 MZVLB1T0HALR | Microsoft Surface Laptop 3 15 Ryzen 5 3580U SK hynix BC501 HFM256GDGTNG | Razer Blade Stealth 13, Core i7-1065G7 Lite-On CA3-8D512 | |
|---|---|---|---|---|---|---|
| AS SSD | 82% | 66% | 85% | -21% | 13% | |
| Seq Read (MB/s) | 1756 | 2531 44% | 1887 7% | 1274 -27% | 1122 -36% | 2666 52% |
| Seq Write (MB/s) | 818 | 2289 180% | 1432 75% | 1395 71% | 514 -37% | 1497 83% |
| 4K Read (MB/s) | 52.3 | 15.85 -70% | 52.3 0% | 50.3 -4% | 34.98 -33% | 53.7 3% |
| 4K Write (MB/s) | 112.2 | 39.88 -64% | 146 30% | 119.8 7% | 96.8 -14% | 133.7 19% |
| 4K-64 Read (MB/s) | 985 | 1267 29% | 969 -2% | 1599 62% | 492 -50% | 652 -34% |
| 4K-64 Write (MB/s) | 292.7 | 1749 498% | 1375 370% | 1455 397% | 339.9 16% | 272 -7% |
| Access Time Read * (ms) | 0.083 | 0.122 -47% | 0.034 59% | 0.044 47% | 0.056 33% | 0.075 10% |
| Access Time Write * (ms) | 0.619 | 0.095 85% | 0.075 88% | 0.092 85% | 0.11 82% | 0.032 95% |
| Score Read (Points) | 1213 | 1536 27% | 1210 0% | 1777 46% | 639 -47% | 972 -20% |
| Score Write (Points) | 487 | 2018 314% | 1664 242% | 1714 252% | 488 0% | 555 14% |
| Score Total (Points) | 2285 | 4317 89% | 3483 52% | 4411 93% | 1434 -37% | 1982 -13% |
| Copy ISO MB/s (MB/s) | 1192 | 1995 67% | 1375 15% | 2830 137% | 828 -31% | 1495 25% |
| Copy Program MB/s (MB/s) | 604 | 584 -3% | 468 -23% | 609 1% | 200.5 -67% | 458.4 -24% |
| Copy Game MB/s (MB/s) | 1136 | 1135 0% | 1287 13% | 1424 25% | 387.4 -66% | 964 -15% |
* ... kleiner is beter

| 3DMark 11 Performance | 4932 punten | |
| 3DMark Ice Storm Standard Score | 67987 punten | |
| 3DMark Cloud Gate Standard Score | 14347 punten | |
| 3DMark Fire Strike Score | 2865 punten | |
| 3DMark Time Spy Score | 960 punten | |
Help | ||
| Shadow of the Tomb Raider - 1280x720 Lowest Preset | |
| Acer Aspire 5 A515-52G-723L | |
| Acer Aspire 5 A515-52G-53PU | |
| Dell Inspiron 15 5000 5585 | |
| Microsoft Surface Laptop 3 15 i7-1065G7 | |
| Microsoft Surface Laptop 3 15 Ryzen 5 3580U | |
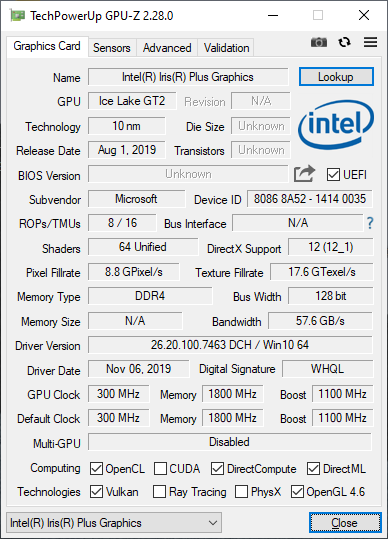
| Gemiddeld Intel Iris Plus Graphics G7 (Ice Lake 64 EU) (15.6 - 33, n=13) | |
| HP Pavilion 15-cw0003ng | |
| Dell XPS 13 7390 Core i7-10710U | |
| F1 2019 | |
| 1280x720 Ultra Low Preset | |
| Microsoft Surface Laptop 3 15 i7-1065G7 | |
| Microsoft Surface Laptop 3 15 Ryzen 5 3580U | |
| Gemiddeld Intel Iris Plus Graphics G7 (Ice Lake 64 EU) (35 - 63, n=5) | |
| 1920x1080 Medium Preset AA:T AF:16x | |
| Microsoft Surface Laptop 3 15 i7-1065G7 | |
| Gemiddeld Intel Iris Plus Graphics G7 (Ice Lake 64 EU) (22 - 31, n=5) | |
| Microsoft Surface Laptop 3 15 Ryzen 5 3580U | |
| 1920x1080 High Preset AA:T AF:16x | |
| Microsoft Surface Laptop 3 15 i7-1065G7 | |
| Gemiddeld Intel Iris Plus Graphics G7 (Ice Lake 64 EU) (19 - 27, n=4) | |
| Microsoft Surface Laptop 3 15 Ryzen 5 3580U | |
| 1920x1080 Ultra High Preset AA:T AF:16x | |
| Microsoft Surface Laptop 3 15 i7-1065G7 | |
| Gemiddeld Intel Iris Plus Graphics G7 (Ice Lake 64 EU) (12 - 21, n=4) | |
| Microsoft Surface Laptop 3 15 Ryzen 5 3580U | |
| Borderlands 3 | |
| 1280x720 Very Low Overall Quality (DX11) | |
| Microsoft Surface Laptop 3 15 i7-1065G7 | |
| Gemiddeld Intel Iris Plus Graphics G7 (Ice Lake 64 EU) (26.7 - 37, n=4) | |
| Microsoft Surface Laptop 3 15 Ryzen 5 3580U | |
| 1920x1080 Medium Overall Quality (DX11) | |
| Microsoft Surface Laptop 3 15 i7-1065G7 | |
| Gemiddeld Intel Iris Plus Graphics G7 (Ice Lake 64 EU) (11.7 - 16, n=3) | |
| Microsoft Surface Laptop 3 15 Ryzen 5 3580U | |
| 1920x1080 High Overall Quality (DX11) | |
| Microsoft Surface Laptop 3 15 i7-1065G7 | |
| Gemiddeld Intel Iris Plus Graphics G7 (Ice Lake 64 EU) (7.73 - 10, n=3) | |
| Microsoft Surface Laptop 3 15 Ryzen 5 3580U | |
| lage | gem. | hoge | ultra | |
|---|---|---|---|---|
| StarCraft II: Heart of the Swarm (2013) | 358.2 | 100.9 | 64.8 | |
| BioShock Infinite (2013) | 109.6 | 73 | 61.5 | 22.6 |
| The Witcher 3 (2015) | 56.4 | 36.8 | 20.1 | 10 |
| Overwatch (2016) | 90 | 64 | 32.9 | 19.7 |
| Rocket League (2017) | 96.1 | 61 | 42.8 | |
| Shadow of the Tomb Raider (2018) | 31 | |||
| F1 2019 (2019) | 63 | 31 | 27 | 17 |
| Borderlands 3 (2019) | 37 | 16 | 10 |
| Microsoft Surface Laptop 3 15 i7-1065G7 Iris Plus Graphics G7 (Ice Lake 64 EU), i7-1065G7, Toshiba KBG40ZNS256G NVMe | Apple MacBook Pro 16 2019 i9 5500M Radeon Pro 5500M, i9-9880H, Apple SSD AP1024 7171 | Dell XPS 15 7590 i5 iGPU FHD UHD Graphics 630, i5-9300H, Toshiba XG6 KXG60ZNV512G | Asus ZenBook 15 UX534FT-DB77 GeForce GTX 1650 Max-Q, i7-8565U, Samsung SSD PM981 MZVLB1T0HALR | Razer Blade Stealth i7-8565U GeForce MX150, i7-8565U, Lite-On CA3-8D256-Q11 | Microsoft Surface Laptop 3 15 Ryzen 5 3580U Vega 9, R5 3580U, SK hynix BC501 HFM256GDGTNG | |
|---|---|---|---|---|---|---|
| Noise | -13% | -2% | -2% | -8% | 2% | |
| uit / omgeving * (dB) | 28.5 | 29.8 -5% | 29.3 -3% | 28.4 -0% | 28.4 -0% | 28 2% |
| Idle Minimum * (dB) | 28.5 | 29.9 -5% | 29.3 -3% | 28.4 -0% | 28.5 -0% | 28 2% |
| Idle Average * (dB) | 28.5 | 29.9 -5% | 29.3 -3% | 28.4 -0% | 29 -2% | 28 2% |
| Idle Maximum * (dB) | 28.7 | 29.9 -4% | 29.8 -4% | 28.4 1% | 29.1 -1% | 28 2% |
| Load Average * (dB) | 30 | 43 -43% | 32.4 -8% | 33.9 -13% | 42.8 -43% | 29.2 3% |
| Witcher 3 ultra * (dB) | 39.2 | 45.4 -16% | 39.8 -2% | 41.4 -6% | 39 1% | |
| Load Maximum * (dB) | 41.2 | 46.1 -12% | 37.2 10% | 40.2 2% | 41.6 -1% | 41.4 -0% |
* ... kleiner is beter
Geluidsniveau
| Onbelast |
| 28.5 / 28.5 / 28.7 dB (A) |
| Belasting |
| 30 / 41.2 dB (A) |
 | ||
30 dB stil 40 dB(A) hoorbaar 50 dB(A) luid |
||
min: | ||
(±) De maximumtemperatuur aan de bovenzijde bedraagt 41.8 °C / 107 F, vergeleken met het gemiddelde van 34.3 °C / 94 F, variërend van 21.2 tot 62.5 °C voor de klasse Office.
(-) De bodem warmt op tot een maximum van 45.6 °C / 114 F, vergeleken met een gemiddelde van 36.8 °C / 98 F
(+) Bij onbelast gebruik bedraagt de gemiddelde temperatuur voor de bovenzijde 21.6 °C / 71 F, vergeleken met het apparaatgemiddelde van 29.5 °C / 85 F.
(±) Bij het spelen van The Witcher 3 is de gemiddelde temperatuur voor de bovenzijde 32.2 °C / 90 F, vergeleken met het apparaatgemiddelde van 29.5 °C / 85 F.
(+) De palmsteunen en het touchpad zijn met een maximum van ###max## °C / 84.2 F koeler dan de huidtemperatuur en voelen daarom koel aan.
(±) De gemiddelde temperatuur van de handpalmsteun van soortgelijke toestellen bedroeg 27.5 °C / 81.5 F (-1.5 °C / -2.7 F).
Microsoft Surface Laptop 3 15 i7-1065G7 audioanalyse
(±) | luidspreker luidheid is gemiddeld maar goed (80.5 dB)
Bas 100 - 315 Hz
(±) | verminderde zeebaars - gemiddeld 5.3% lager dan de mediaan
(±) | lineariteit van de lage tonen is gemiddeld (10.3% delta ten opzichte van de vorige frequentie)
Midden 400 - 2000 Hz
(+) | evenwichtige middens - slechts 2.7% verwijderd van de mediaan
(+) | de middentonen zijn lineair (6.7% delta ten opzichte van de vorige frequentie)
Hoog 2 - 16 kHz
(+) | evenwichtige hoogtepunten - slechts 2.7% verwijderd van de mediaan
(±) | lineariteit van de hoogtepunten is gemiddeld (8.5% delta ten opzichte van de vorige frequentie)
Algemeen 100 - 16.000 Hz
(+) | het totale geluid is lineair (11.7% verschil met de mediaan)
Vergeleken met dezelfde klasse
» 4% van alle geteste apparaten in deze klasse waren beter, 2% vergelijkbaar, 95% slechter
» De beste had een delta van 7%, het gemiddelde was 21%, de slechtste was 53%
Vergeleken met alle geteste toestellen
» 8% van alle geteste apparaten waren beter, 3% gelijk, 89% slechter
» De beste had een delta van 4%, het gemiddelde was 23%, de slechtste was 134%
Apple MacBook 12 (Early 2016) 1.1 GHz audioanalyse
(+) | luidsprekers kunnen relatief luid spelen (83.6 dB)
Bas 100 - 315 Hz
(±) | verminderde zeebaars - gemiddeld 11.3% lager dan de mediaan
(±) | lineariteit van de lage tonen is gemiddeld (14.2% delta ten opzichte van de vorige frequentie)
Midden 400 - 2000 Hz
(+) | evenwichtige middens - slechts 2.4% verwijderd van de mediaan
(+) | de middentonen zijn lineair (5.5% delta ten opzichte van de vorige frequentie)
Hoog 2 - 16 kHz
(+) | evenwichtige hoogtepunten - slechts 2% verwijderd van de mediaan
(+) | de hoge tonen zijn lineair (4.5% delta naar de vorige frequentie)
Algemeen 100 - 16.000 Hz
(+) | het totale geluid is lineair (10.2% verschil met de mediaan)
Vergeleken met dezelfde klasse
» 7% van alle geteste apparaten in deze klasse waren beter, 2% vergelijkbaar, 90% slechter
» De beste had een delta van 5%, het gemiddelde was 18%, de slechtste was 53%
Vergeleken met alle geteste toestellen
» 5% van alle geteste apparaten waren beter, 1% gelijk, 94% slechter
» De beste had een delta van 4%, het gemiddelde was 23%, de slechtste was 134%
| Uit / Standby | |
| Inactief | |
| Belasting |
|
Key:
min: | |
| Microsoft Surface Laptop 3 15 i7-1065G7 i7-1065G7, Iris Plus Graphics G7 (Ice Lake 64 EU), Toshiba KBG40ZNS256G NVMe, IPS, 2496x1664, 15" | Dell XPS 15 7590 i5 iGPU FHD i5-9300H, UHD Graphics 630, Toshiba XG6 KXG60ZNV512G, IPS, 1920x1080, 15.6" | Asus ZenBook 15 UX534FT-DB77 i7-8565U, GeForce GTX 1650 Max-Q, Samsung SSD PM981 MZVLB1T0HALR, IPS, 1920x1080, 15.6" | MSI Prestige 15 A10SC i7-10710U, GeForce GTX 1650 Max-Q, Samsung SSD PM981 MZVLB1T0HALR, IPS, 3840x2160, 15.6" | Razer Blade Stealth i7-8565U i7-8565U, GeForce MX150, Lite-On CA3-8D256-Q11, IPS, 1920x1080, 13.3" | Microsoft Surface Laptop 3 15 Ryzen 5 3580U R5 3580U, Vega 9, SK hynix BC501 HFM256GDGTNG, IPS, 2496x1664, 15" | |
|---|---|---|---|---|---|---|
| Power Consumption | -17% | -74% | -68% | -28% | 10% | |
| Idle Minimum * (Watt) | 4.4 | 3.79 14% | 5 -14% | 6.1 -39% | 6.7 -52% | 3.3 25% |
| Idle Average * (Watt) | 8.3 | 6.9 17% | 13.2 -59% | 13.2 -59% | 8.6 -4% | 7.1 14% |
| Idle Maximum * (Watt) | 8.6 | 9.2 -7% | 24 -179% | 19.2 -123% | 9.4 -9% | 7.2 16% |
| Load Average * (Watt) | 43.6 | 62 -42% | 70 -61% | 75 -72% | 64.1 -47% | 44.8 -3% |
| Witcher 3 ultra * (Watt) | 41.5 | 63.3 -53% | 74 -78% | 63.7 -53% | 45.1 -9% | |
| Load Maximum * (Watt) | 64.4 | 108 -68% | 114 -77% | 89.7 -39% | 64.1 -0% | 53 18% |
* ... kleiner is beter
| Microsoft Surface Laptop 3 15 i7-1065G7 i7-1065G7, Iris Plus Graphics G7 (Ice Lake 64 EU), 45 Wh | Apple MacBook Pro 16 2019 i9 5500M i9-9880H, Radeon Pro 5500M, 99.8 Wh | Dell XPS 15 7590 i5 iGPU FHD i5-9300H, UHD Graphics 630, 97 Wh | Lenovo Yoga C940-15IRH i7-9750H, GeForce GTX 1650 Max-Q, 69 Wh | HP Spectre x360 15-df0126ng i7-8750H, GeForce GTX 1050 Ti Max-Q, 84 Wh | Asus ZenBook 15 UX534FT-DB77 i7-8565U, GeForce GTX 1650 Max-Q, 71 Wh | MSI Prestige 15 A10SC i7-10710U, GeForce GTX 1650 Max-Q, 82 Wh | Microsoft Surface Laptop 3 15 Ryzen 5 3580U R5 3580U, Vega 9, 45 Wh | |
|---|---|---|---|---|---|---|---|---|
| Batterijduur | -1% | 31% | -26% | -6% | 5% | -14% | -16% | |
| Reader / Idle (h) | 35 | 18.2 -48% | 18.8 -46% | 21.5 -39% | 19.1 -45% | 18.7 -47% | ||
| WiFi v1.3 (h) | 8.2 | 12 46% | 14.1 72% | 9.7 18% | 8.8 7% | 8.4 2% | 7.6 -7% | 9.1 11% |
| Load (h) | 1.9 | 1 -47% | 1.7 -11% | 1 -47% | 2.3 21% | 2.9 53% | 2.1 11% | 1.7 -11% |
| Witcher 3 ultra (h) | 0.9 |
Pro
Contra
Voor het volledige, Engelse testrapport, klik hier.
De belangrijkste voordelen van onze Core i7 configuratie ten opzichte van de Ryzen 5 versie zijn Wi-Fi 6-compatibiliteit, snellere opslagprestaties, snellere CPU-prestaties, geïntegreerde AI-versnelling, snellere spelprestaties en hogere prestaties per Watt. Andere aspecten zoals het beeldscherm, de batterijlevensduur tijdens internetten, oppervlaktetemperaturen en het ventilatorgeluid zijn onderling hetzelfde of bijna identiek.
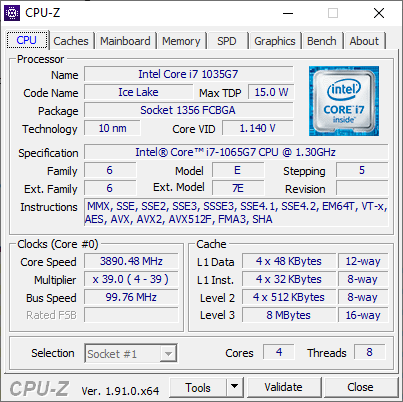
Hoewel het niet verwonderlijk is dat onze Core i7 configuratie beterpresteert dan onze goedkopere Ryzen 5 variant, zijn we vooral geïnteresseerd in de marge van toename. Ruwe CPU-prestaties zijn bijvoorbeeld niet zo veel sneller, wat betekent dat je niet Intel boven AMD zou moeten kiezen puur gebaseerd op processor-rekenkracht. De spelprestaties zijn ook grotendeels inconsistent: sommige games draaien beter op Intel en bij andere games scheelt het niet veel. Ondertussen blijft AI-versnelling een nieuwigheid voor de meeste kantoorgebruikers, omdat het geen directe invloed heeft op de dagelijkse taken. Intel kan zijn voordelen ten opzichte van AMD op het gebied van AI echt benutten, maar dat zal niet veel betekenen voor consumenten als applicaties niet zijn geoptimaliseerd om überhaupt AI-versnelling te ondersteunen.
Kortom, de dagelijkse prestatieverschillen tussen de Surface Laptop 3 Core i7 en Ryzen 5 configuraties zijn kleiner dan verwacht, vooral als je kijkt naar de meerprijs die Microsoft in rekening brengt voor zijn Intel-modellen. Als je een veeleisende gebruiker bent die het beste wil dat de Surface Laptop te bieden heeft, dan zijn de Intel-opties een vanzelfsprekende keuze. Anders is het moeilijk om het verschil te zien tussen een Intel en AMD Surface Laptop 3 als de werklast voornamelijk bestaat uit tekstverwerking, webbrowsen of videostreamen.
Microsoft Surface Laptop 3 15 i7-1065G7
- 23-02-2020 v7 (old)
Allen Ngo
Price comparison
