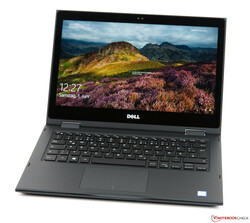
Kort testrapport Dell Latitude 3390 (Core i5-8250U, Full HD, 256 GB SSD) Convertible

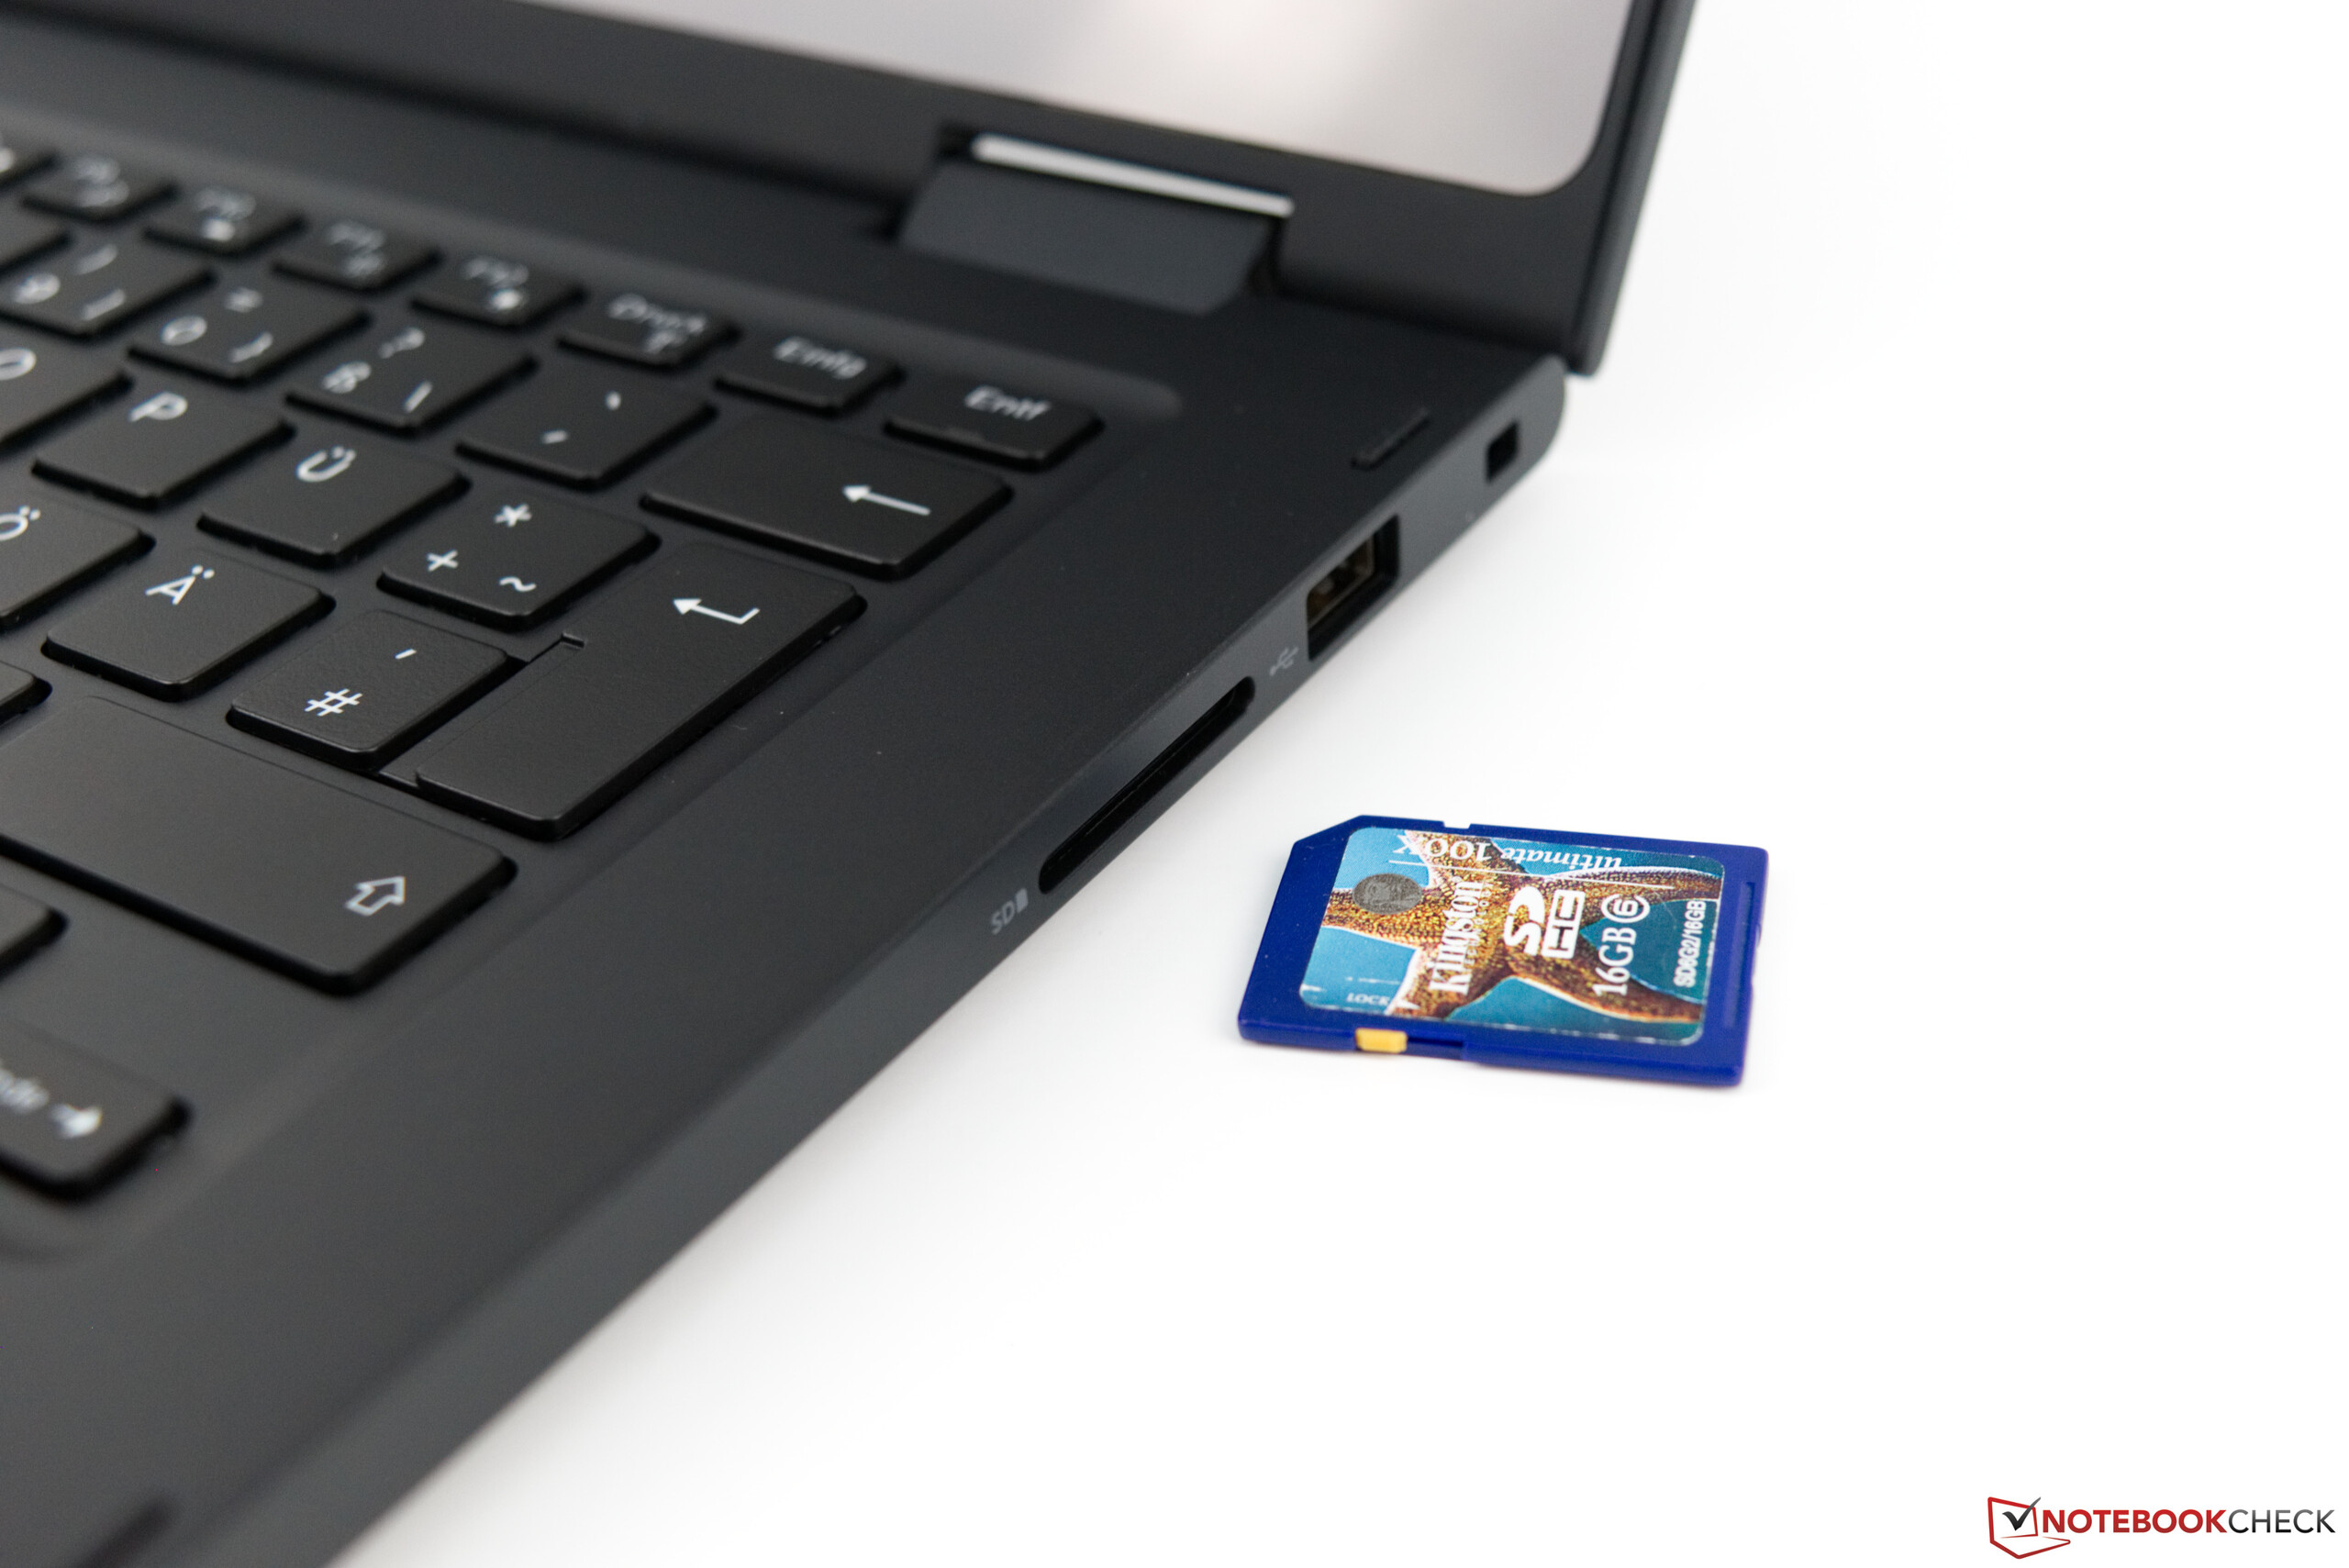
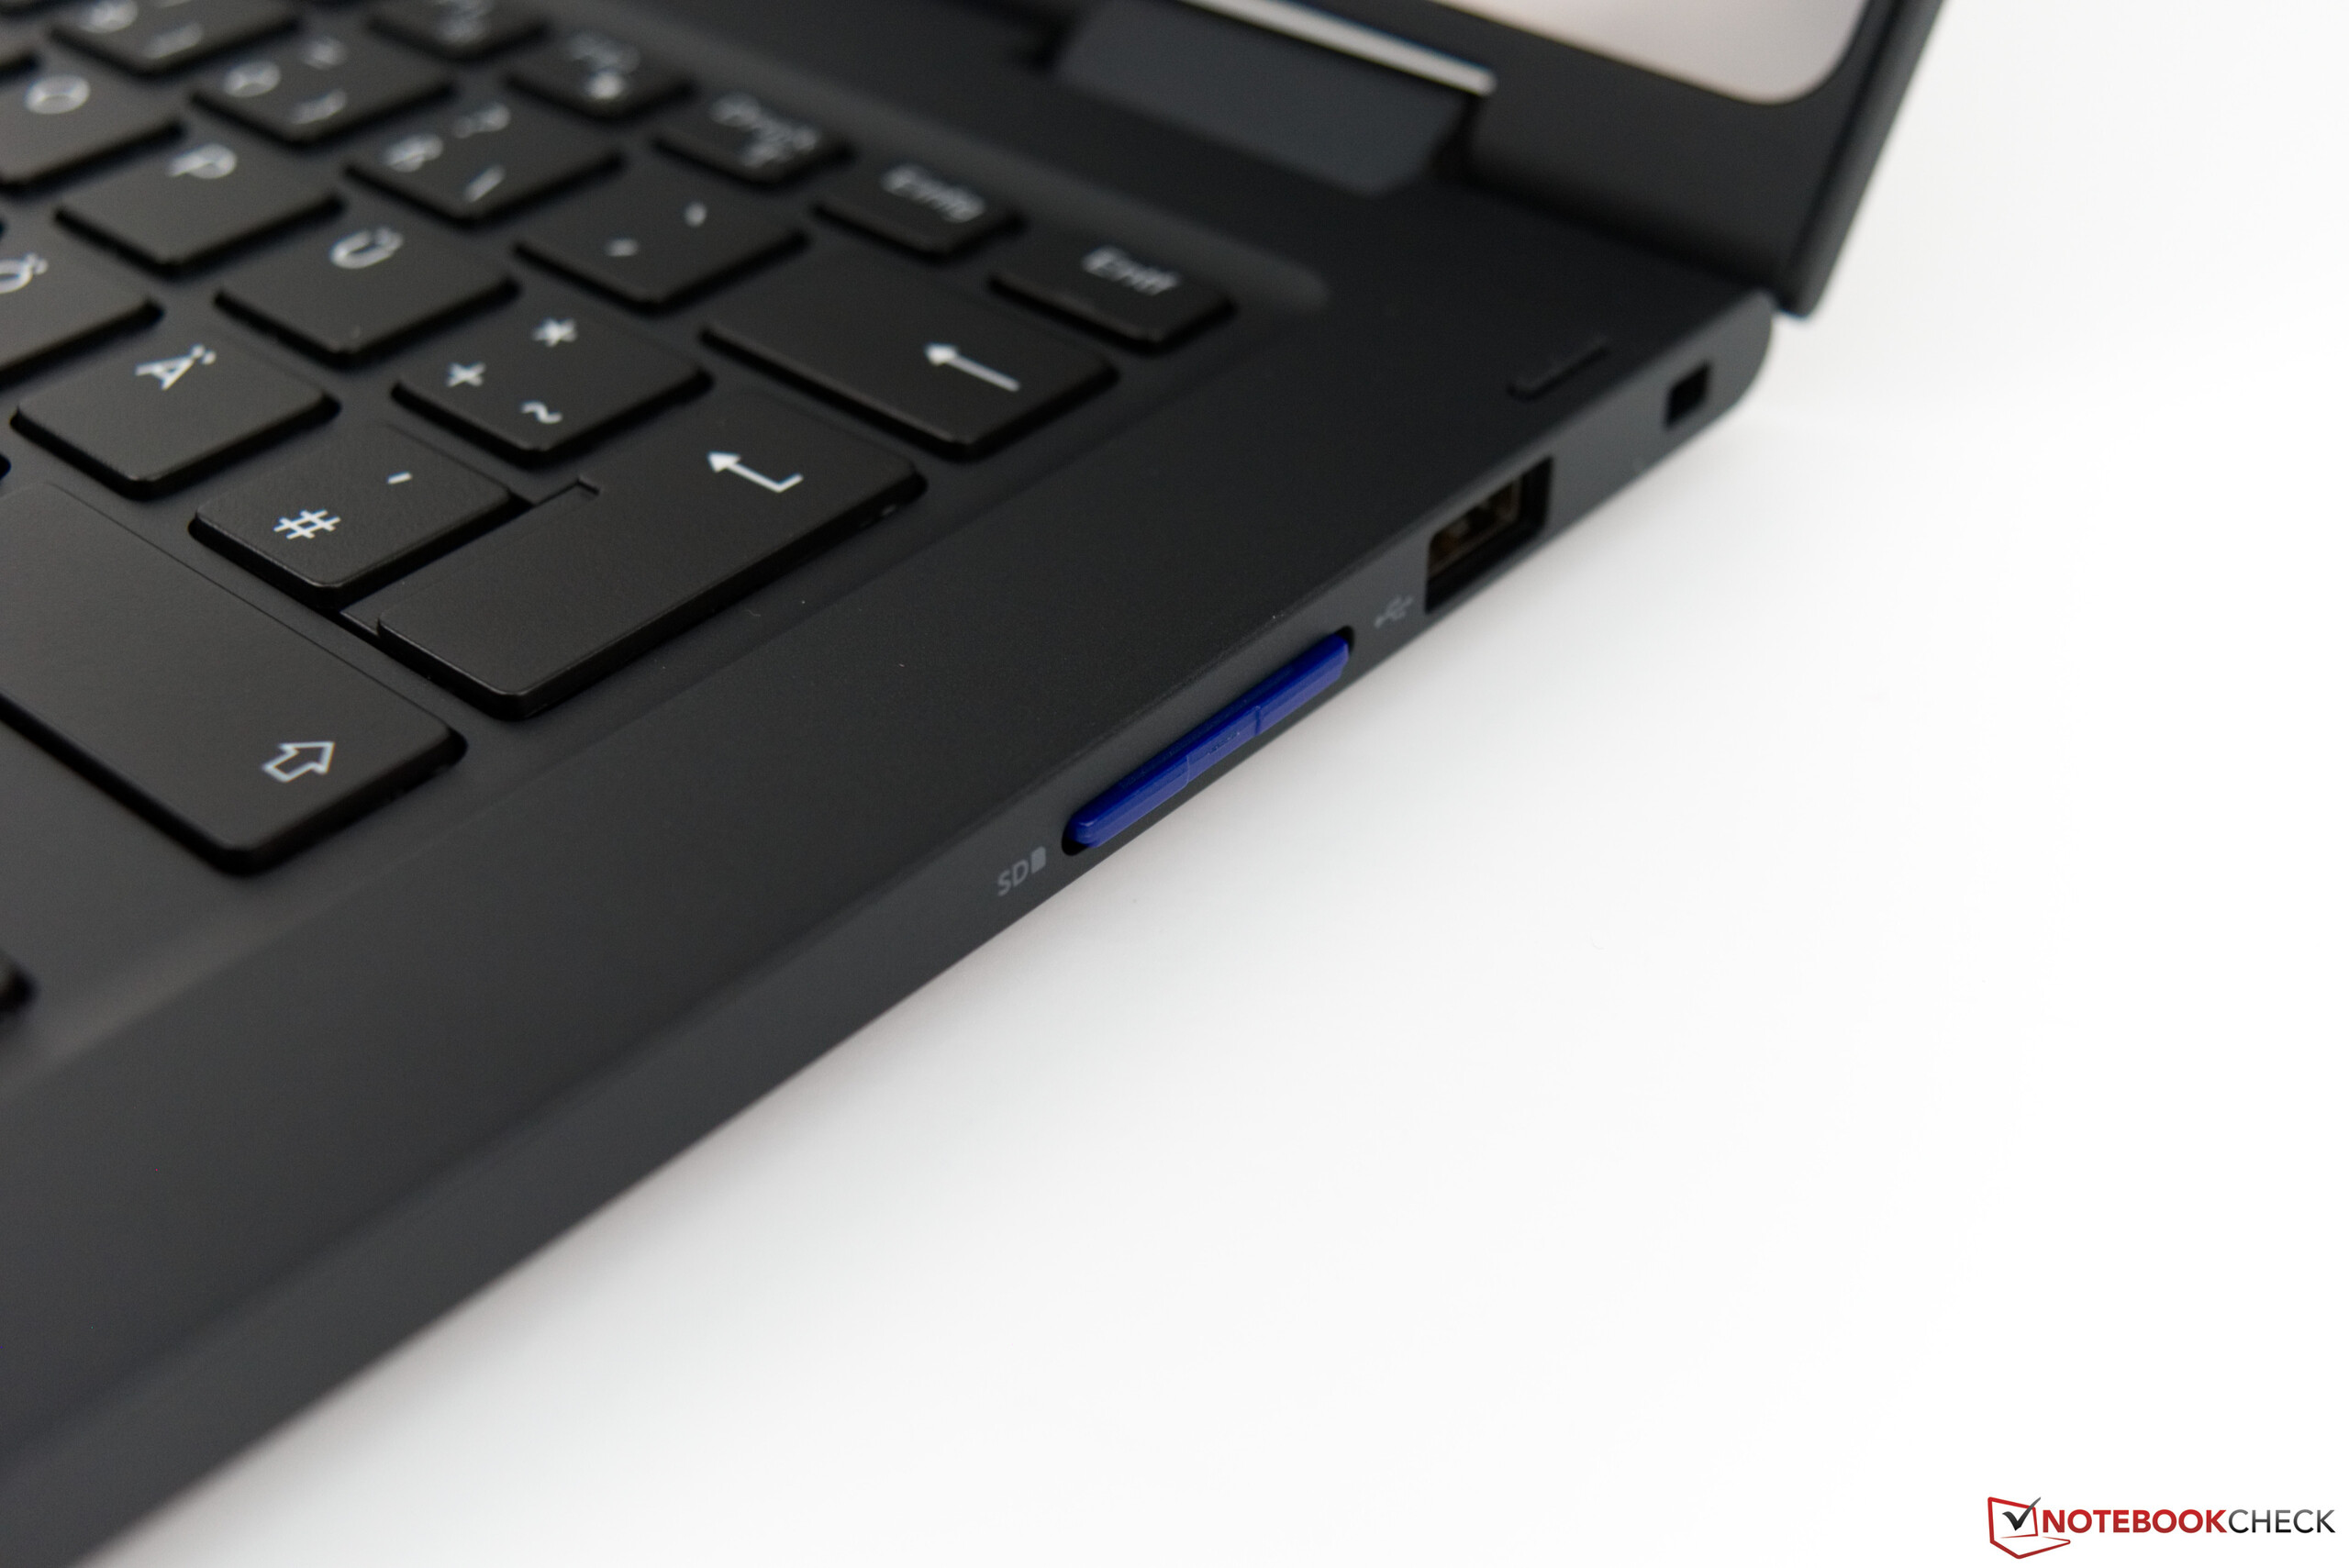
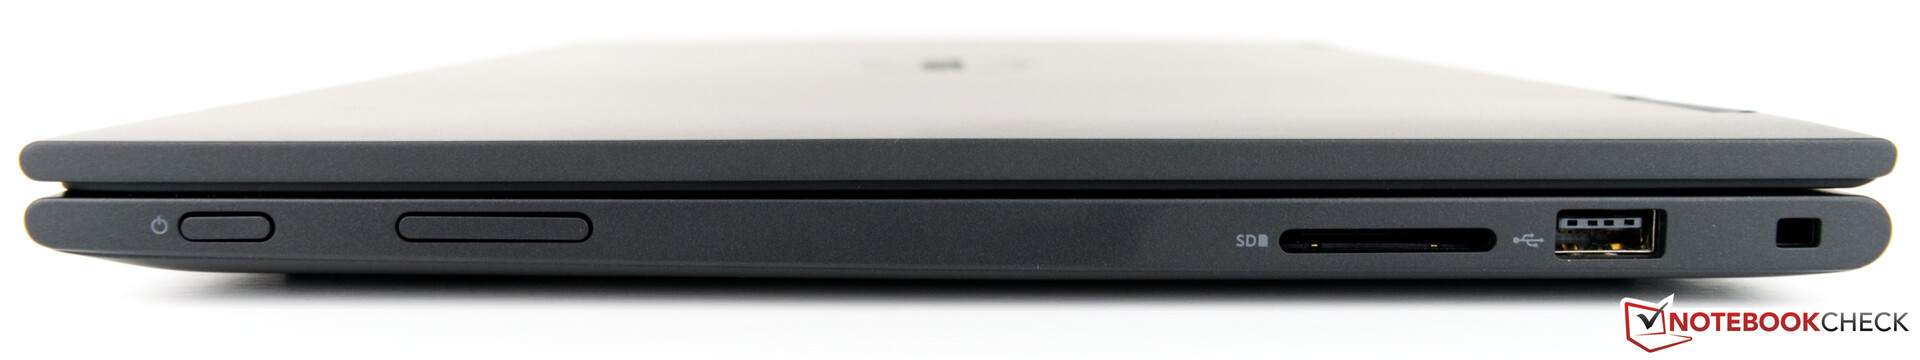
| SD Card Reader | |
| average JPG Copy Test (av. of 3 runs) | |
| HP ProBook x360 440 G1 (Toshiba Exceria Pro M501 microSDXC 64GB) | |
| Lenovo ThinkPad L390 Yoga-20NT000XGE (Toshiba Exceria Pro M501 UHS-II) | |
| Gemiddelde van klas Convertible (28.1 - 197, n=23, laatste 2 jaar) | |
| Asus ZenBook Flip 14 UX461UA (Toshiba Exceria Pro M501 microSDXC 64GB) | |
| Dell Latitude 13 3390 (Toshiba Exceria Pro SDXC 64 GB UHS-II) | |
| maximum AS SSD Seq Read Test (1GB) | |
| Gemiddelde van klas Convertible (28.9 - 254, n=22, laatste 2 jaar) | |
| Lenovo ThinkPad L390 Yoga-20NT000XGE (Toshiba Exceria Pro M501 UHS-II) | |
| HP ProBook x360 440 G1 (Toshiba Exceria Pro M501 microSDXC 64GB) | |
| Asus ZenBook Flip 14 UX461UA (Toshiba Exceria Pro M501 microSDXC 64GB) | |
| Dell Latitude 13 3390 (Toshiba Exceria Pro SDXC 64 GB UHS-II) | |
| |||||||||||||||||||||||||
Helderheidsverdeling: 82 %
Helderheid in Batterij-modus: 276 cd/m²
Contrast: 952:1 (Zwart: 0.29 cd/m²)
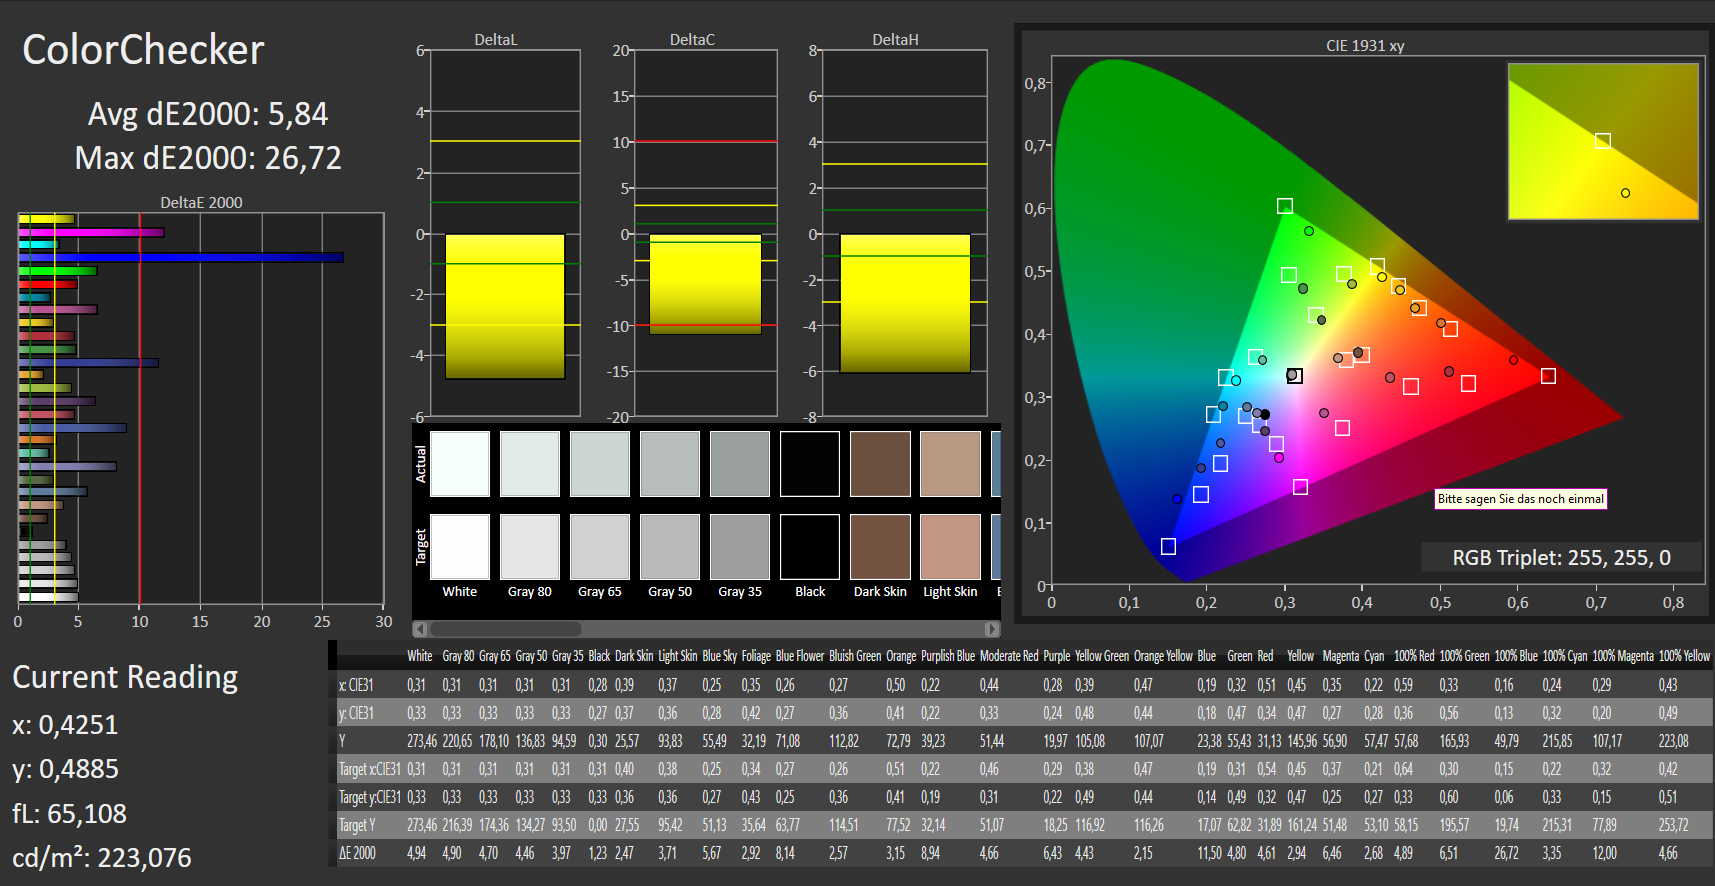
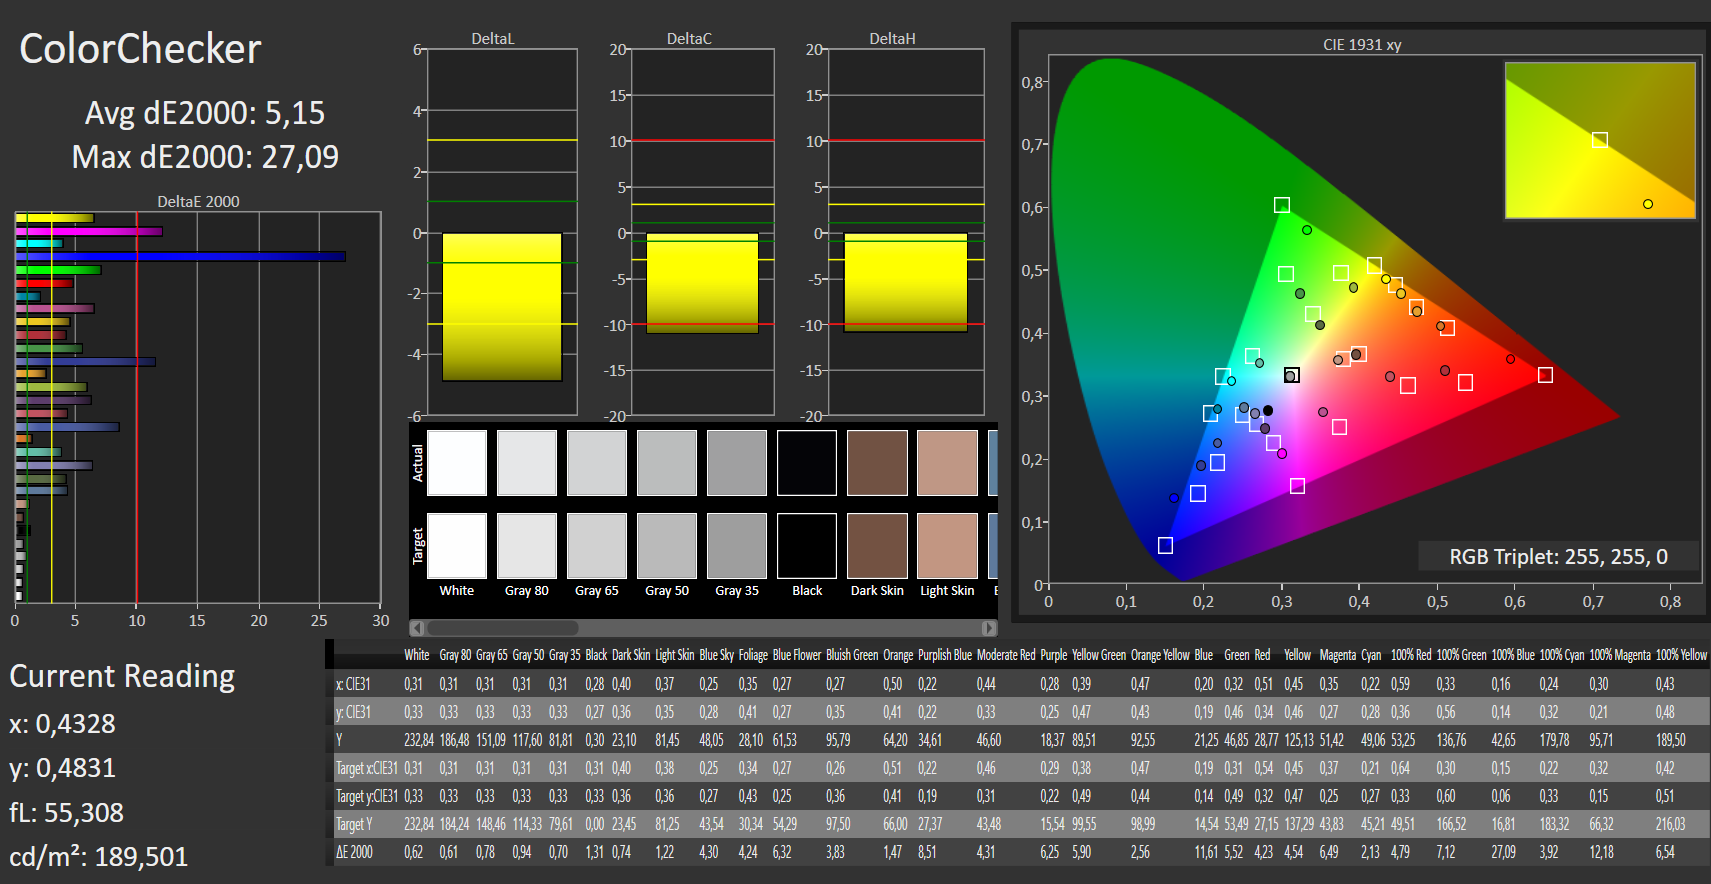
ΔE ColorChecker Calman: 5.84 | ∀{0.5-29.43 Ø4.72}
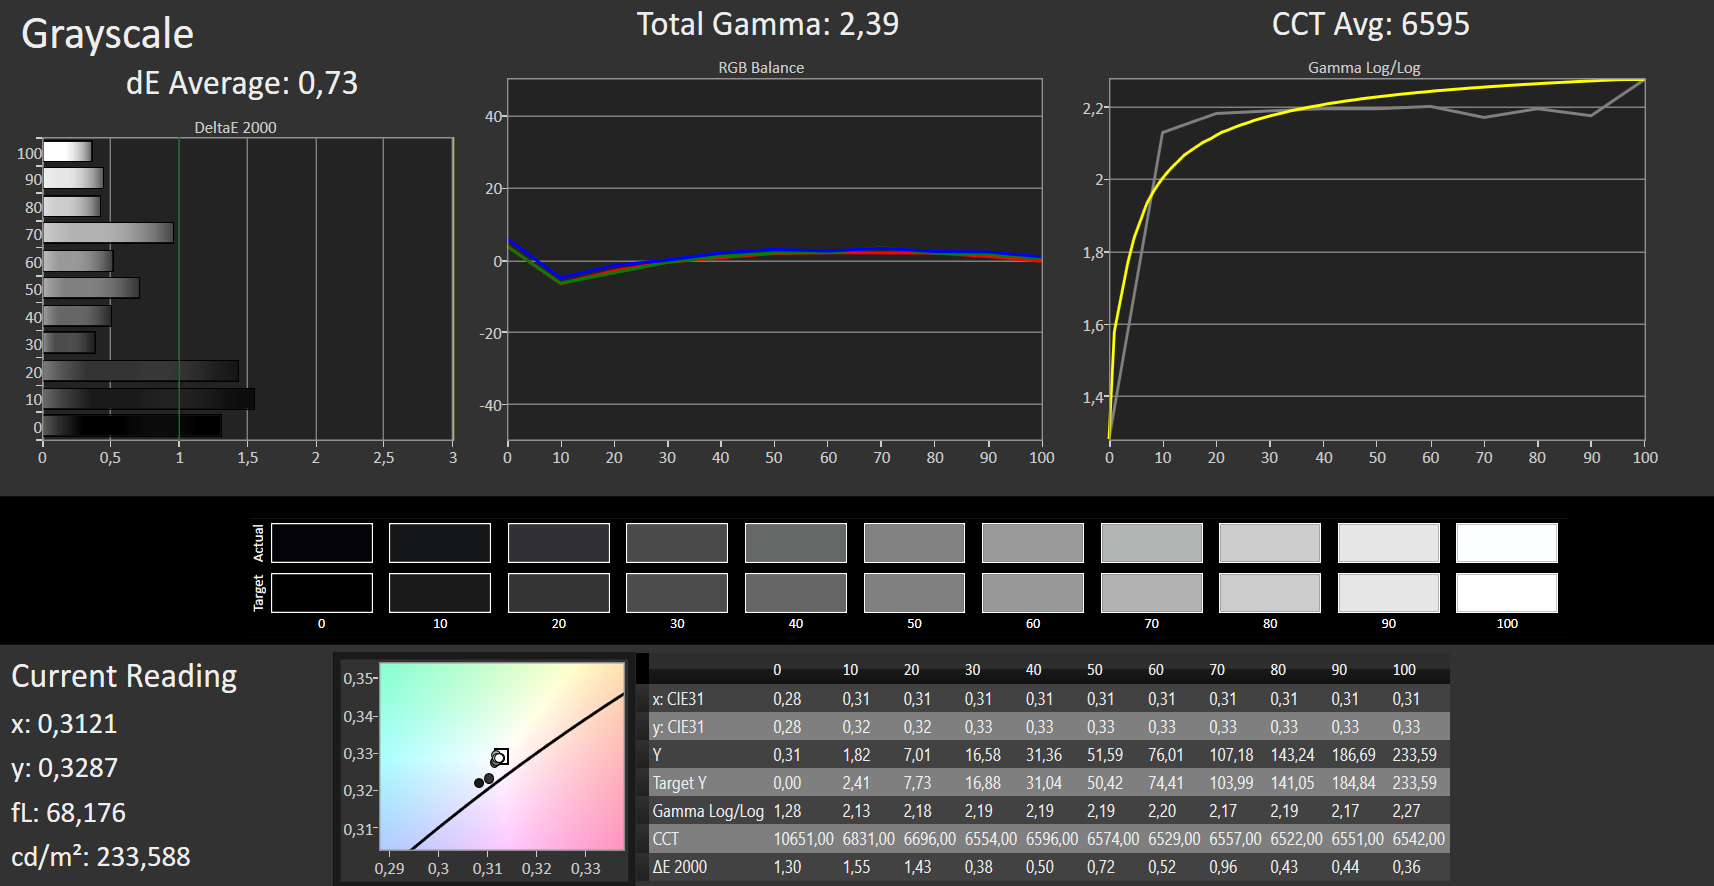
calibrated: 5.15
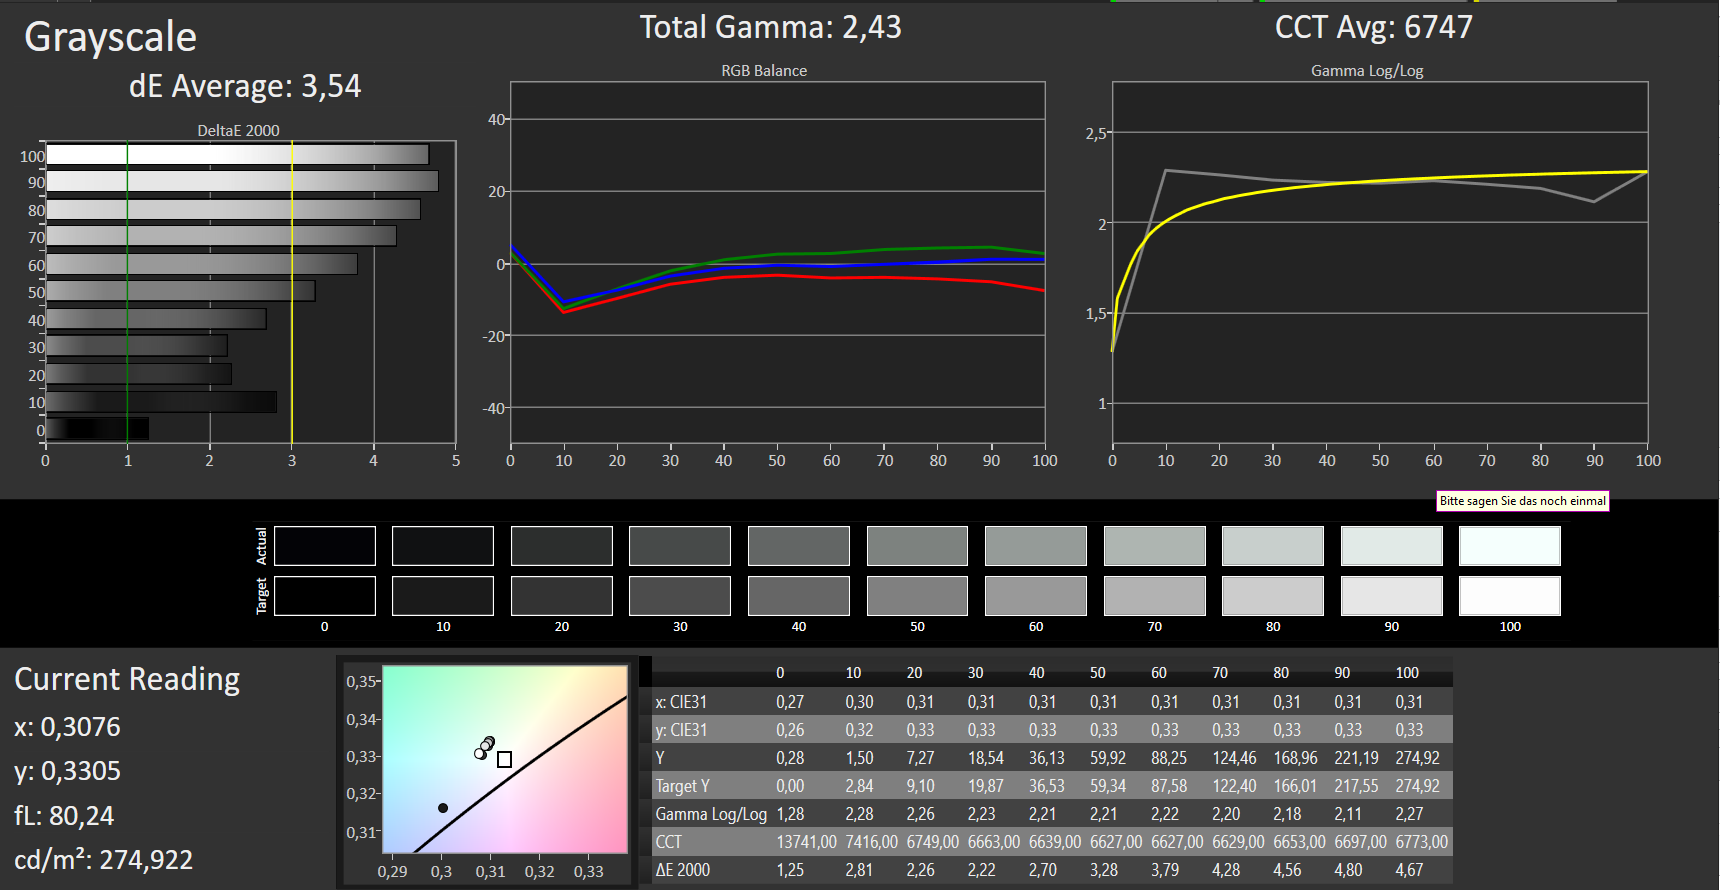
ΔE Greyscale Calman: 3.54 | ∀{0.09-98 Ø4.97}
61% sRGB (Argyll 1.6.3 3D)
39% AdobeRGB 1998 (Argyll 1.6.3 3D)
42.29% AdobeRGB 1998 (Argyll 3D)
61.3% sRGB (Argyll 3D)
40.9% Display P3 (Argyll 3D)
Gamma: 2.43
CCT: 6747 K
| Dell Latitude 13 3390 BOE06A7, NV13FHM, IPS, 1920x1080, 13.3" | Lenovo ThinkPad L390 Yoga-20NT000XGE LEN4094, NV133FHM-N5A, IPS LED, 1920x1080, 13.3" | Lenovo Yoga C930-13IKB B139HAN03_0, IPS, 1920x1080, 13.9" | Asus ZenBook Flip 14 UX461UA BOE NV140FHM-N62, IPS, 1920x1080, 14" | HP ProBook x360 440 G1 Chi MEi, CMN14E0, IPS, 1920x1080, 14" | |
|---|---|---|---|---|---|
| Display | 58% | 56% | 47% | 60% | |
| Display P3 Coverage (%) | 40.9 | 69.2 69% | 64.3 57% | 64.4 57% | 65.8 61% |
| sRGB Coverage (%) | 61.3 | 90.6 48% | 94.6 54% | 84.6 38% | 98.2 60% |
| AdobeRGB 1998 Coverage (%) | 42.29 | 66.3 57% | 66.2 57% | 61.8 46% | 67.8 60% |
| Response Times | -19% | 9% | -4% | 28% | |
| Response Time Grey 50% / Grey 80% * (ms) | 42 ? | 51.2 ? -22% | 40.8 ? 3% | 44 ? -5% | 34 ? 19% |
| Response Time Black / White * (ms) | 32 ? | 36.8 ? -15% | 27.6 ? 14% | 33 ? -3% | 20 ? 37% |
| PWM Frequency (Hz) | 208 ? | 1000 ? | 200 ? | 26000 ? | |
| Screen | 17% | 8% | 5% | 50% | |
| Brightness middle (cd/m²) | 276 | 313 13% | 316 14% | 302 9% | 408 48% |
| Brightness (cd/m²) | 274 | 295 8% | 291 6% | 288 5% | 375 37% |
| Brightness Distribution (%) | 82 | 90 10% | 83 1% | 90 10% | 87 6% |
| Black Level * (cd/m²) | 0.29 | 0.22 24% | 0.36 -24% | 0.57 -97% | 0.34 -17% |
| Contrast (:1) | 952 | 1423 49% | 878 -8% | 530 -44% | 1200 26% |
| Colorchecker dE 2000 * | 5.84 | 6.2 -6% | 5.9 -1% | 5.17 11% | 1.2 79% |
| Colorchecker dE 2000 max. * | 26.72 | 10.7 60% | 12.9 52% | 7.68 71% | 2.44 91% |
| Colorchecker dE 2000 calibrated * | 5.15 | 2.5 51% | 1.3 75% | 0.67 87% | |
| Greyscale dE 2000 * | 3.54 | 8 -126% | 8.6 -143% | 3.26 8% | 0.98 72% |
| Gamma | 2.43 91% | 2.38 92% | 2.1 105% | 2.45 90% | 2.32 95% |
| CCT | 6747 96% | 7100 92% | 6854 95% | 7142 91% | 6485 100% |
| Color Space (Percent of AdobeRGB 1998) (%) | 39 | 59.1 52% | 60.7 56% | 55 41% | 62 59% |
| Color Space (Percent of sRGB) (%) | 61 | 90.6 49% | 94.5 55% | 85 39% | 98 61% |
| Totaal Gemiddelde (Programma / Instellingen) | 19% /
20% | 24% /
17% | 16% /
12% | 46% /
49% |
* ... kleiner is beter
Responstijd Scherm
| ↔ Responstijd Zwart naar Wit | ||
|---|---|---|
| 32 ms ... stijging ↗ en daling ↘ gecombineerd | ↗ 18 ms stijging | 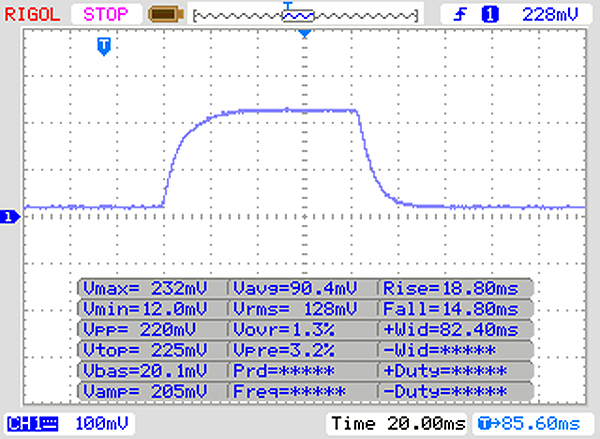 |
| ↘ 14 ms daling | ||
| Het scherm vertoonde trage responstijden in onze tests en is misschien te traag voor games. Ter vergelijking: alle testtoestellen variëren van 0.1 (minimum) tot 240 (maximum) ms. » 86 % van alle toestellen zijn beter. Dit betekent dat de gemeten responstijd slechter is dan het gemiddelde (19.8 ms) van alle geteste toestellen. | ||
| ↔ Responstijd 50% Grijs naar 80% Grijs | ||
| 42 ms ... stijging ↗ en daling ↘ gecombineerd | ↗ 22 ms stijging | 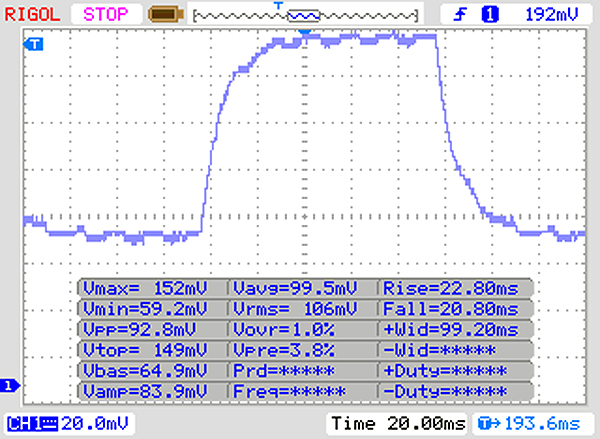 |
| ↘ 20 ms daling | ||
| Het scherm vertoonde trage responstijden in onze tests en is misschien te traag voor games. Ter vergelijking: alle testtoestellen variëren van 0.165 (minimum) tot 636 (maximum) ms. » 67 % van alle toestellen zijn beter. Dit betekent dat de gemeten responstijd slechter is dan het gemiddelde (31 ms) van alle geteste toestellen. | ||
Screen Flickering / PWM (Pulse-Width Modulation)
| Screen flickering / PWM waargenomen | 208 Hz | ≤ 90 % helderheid instelling | 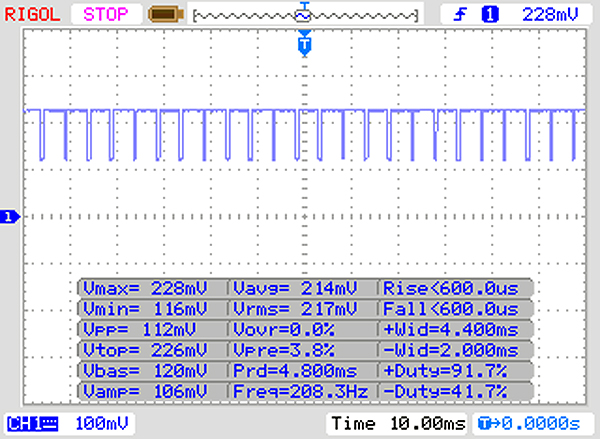 |
De achtergrondverlichting van het scherm flikkert op 208 Hz (in het slechtste geval, bijvoorbeeld bij gebruik van PWM) aan een helderheid van 90 % en lager. Boven deze helderheid zou er geen flickering / PWM mogen optreden. De frequentie van 208 Hz is redelijk laag en de meeste mensen die gevoelig zijn aan flickering kunnen dit dus waarnemen of geïrriteerde ogen krijgen (gebruikmakend van de vermelde helderheid en lager). Ter vergelijking: 52 % van alle geteste toestellen maakten geen gebruik van PWM om de schermhelderheid te verlagen. Als het wel werd gebruikt, werd een gemiddelde van 7763 (minimum: 5 - maximum: 343500) Hz waargenomen. | |||
| HWBOT x265 Benchmark v2.2 - 4k Preset | |
| Gemiddelde van klas Convertible (3.43 - 36.2, n=50, laatste 2 jaar) | |
| Lenovo ThinkPad L390 Yoga-20NT000XGE | |
| Gemiddeld Intel Core i5-8250U (3.02 - 4.78, n=8) | |
| Dell Latitude 13 3390 | |
| Blender - v2.79 BMW27 CPU | |
| Gemiddeld Intel Core i5-8250U (813 - 1209, n=8) | |
| Dell Latitude 13 3390 | |
| Lenovo ThinkPad L390 Yoga-20NT000XGE | |
| Gemiddelde van klas Convertible (105 - 1051, n=50, laatste 2 jaar) | |
* ... kleiner is beter
| PCMark 8 Home Score Accelerated v2 | 3797 punten | |
| PCMark 8 Work Score Accelerated v2 | 4799 punten | |
| PCMark 10 Score | 3541 punten | |
Help | ||
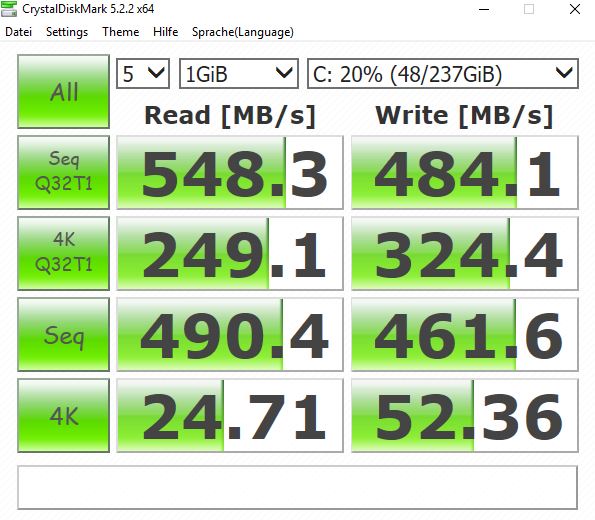
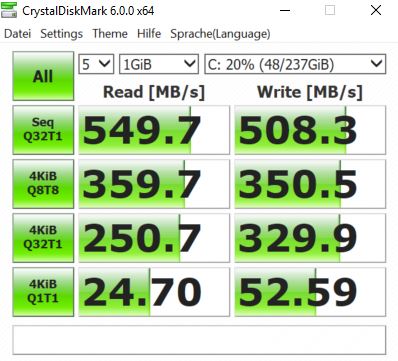
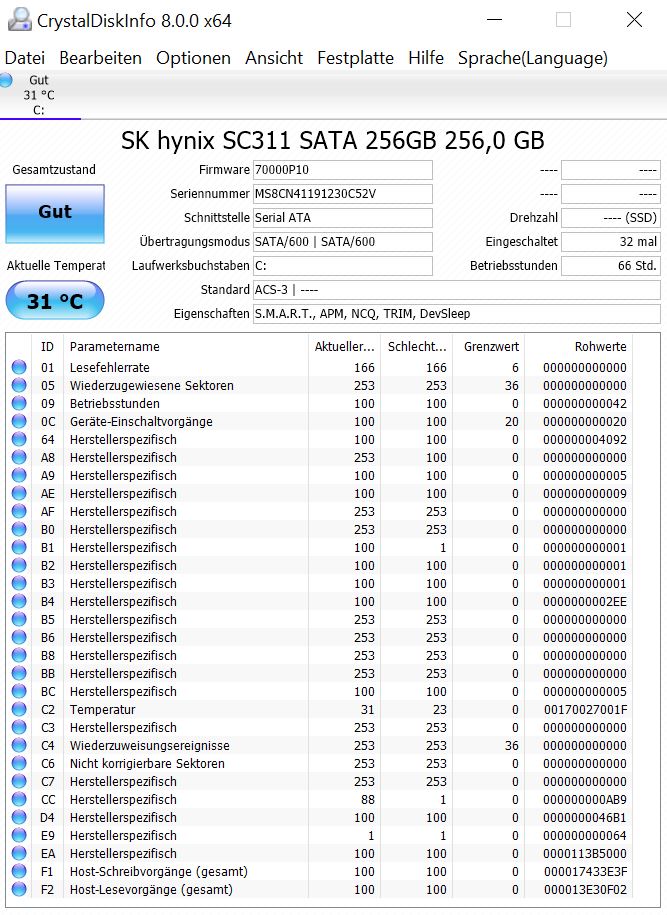
| Dell Latitude 13 3390 SK hynix SC311 SATA | Lenovo ThinkPad L390 Yoga-20NT000XGE Samsung SSD PM981 MZVLB256HAHQ | Lenovo Yoga C930-13IKB SK hynix PC401 HFS256GD9TNG | Asus ZenBook Flip 14 UX461UA SanDisk SD8SN8U256G1002 | HP ProBook x360 440 G1 Toshiba KBG30ZMV256G | Gemiddeld SK hynix SC311 SATA | |
|---|---|---|---|---|---|---|
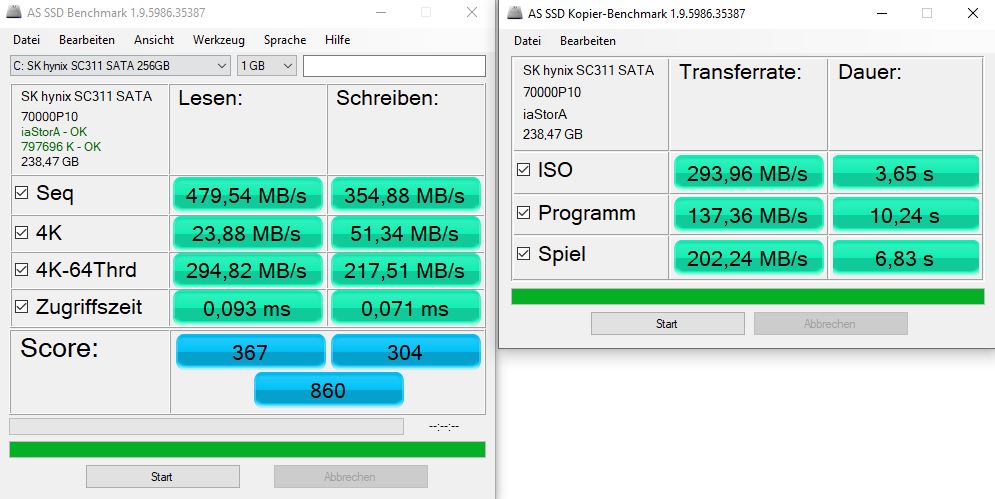
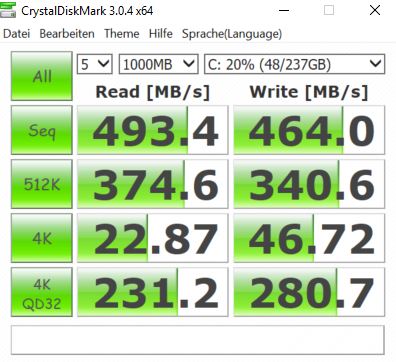
| AS SSD | 203% | 73% | -4% | 77% | -11% | |
| Seq Read (MB/s) | 479.5 | 1724 260% | 1850 286% | 459.9 -4% | 1255 162% | 499 ? 4% |
| Seq Write (MB/s) | 354.9 | 1123 216% | 661 86% | 388.2 9% | 625 76% | 296 ? -17% |
| 4K Read (MB/s) | 23.88 | 51.8 117% | 38.04 59% | 26.93 13% | 42.09 76% | 23.9 ? 0% |
| 4K Write (MB/s) | 51.3 | 133.8 161% | 95 85% | 50.7 -1% | 96.1 87% | 54.3 ? 6% |
| 4K-64 Read (MB/s) | 294.8 | 745 153% | 434.3 47% | 368.3 25% | 624 112% | 231 ? -22% |
| 4K-64 Write (MB/s) | 217.5 | 1193 449% | 266.3 22% | 146.4 -33% | 298.3 37% | 169.7 ? -22% |
| Access Time Read * (ms) | 0.093 | 0.041 56% | 0.069 26% | 0.123 -32% | 0.122 -31% | 0.133 ? -43% |
| Access Time Write * (ms) | 0.071 | 0.028 61% | 0.056 21% | 0.086 -21% | 0.224 -215% | 0.07075 ? -0% |
| Score Read (Points) | 367 | 969 164% | 657 79% | 441 20% | 791 116% | 305 ? -17% |
| Score Write (Points) | 304 | 1440 374% | 427 40% | 236 -22% | 457 50% | 254 ? -16% |
| Score Total (Points) | 860 | 2889 236% | 1373 60% | 908 6% | 1634 90% | 713 ? -17% |
| Copy ISO MB/s (MB/s) | 294 | 1025 249% | 539 83% | 324.1 10% | 983 234% | 303 ? 3% |
| Copy Program MB/s (MB/s) | 137.4 | 322.1 134% | 209.7 53% | 118.6 -14% | 274.5 100% | 132.6 ? -3% |
| Copy Game MB/s (MB/s) | 202.2 | 637 215% | 340 68% | 186.1 -8% | 572 183% | 195.3 ? -3% |
* ... kleiner is beter

| 3DMark 11 Performance | 1779 punten | |
| 3DMark Ice Storm Standard Score | 76683 punten | |
| 3DMark Cloud Gate Standard Score | 7687 punten | |
| 3DMark Fire Strike Score | 1016 punten | |
| 3DMark Fire Strike Extreme Score | 468 punten | |
| 3DMark Time Spy Score | 379 punten | |
Help | ||
| lage | gem. | hoge | ultra | |
|---|---|---|---|---|
| BioShock Infinite (2013) | 48 | 28.4 | 25.8 | 8.9 |
| Battlefield 4 (2013) | 44.7 | 31.4 | 22.1 | 7.3 |
| Dota 2 Reborn (2015) | 62.9 | 40.6 | 17.9 | 16.1 |
| Rise of the Tomb Raider (2016) | 19.2 | 11.6 | 6.2 | |
| X-Plane 11.11 (2018) | 24.1 | 15.4 | 13.9 |
Geluidsniveau
| Onbelast |
| 30.6 / 30.6 / 30.6 dB (A) |
| Belasting |
| 33.3 / 33 dB (A) |
 | ||
30 dB stil 40 dB(A) hoorbaar 50 dB(A) luid |
||
min: | ||
| Dell Latitude 13 3390 UHD Graphics 620, i5-8250U, SK hynix SC311 SATA | Lenovo ThinkPad L390 Yoga-20NT000XGE UHD Graphics 620, i5-8265U, Samsung SSD PM981 MZVLB256HAHQ | Lenovo Yoga C930-13IKB UHD Graphics 620, i5-8250U, SK hynix PC401 HFS256GD9TNG | Asus ZenBook Flip 14 UX461UA UHD Graphics 620, i5-8250U, SanDisk SD8SN8U256G1002 | HP ProBook x360 440 G1 UHD Graphics 620, i5-8250U, Toshiba KBG30ZMV256G | |
|---|---|---|---|---|---|
| Noise | 5% | 4% | -1% | -4% | |
| uit / omgeving * (dB) | 30.6 | 29.5 4% | 29.3 4% | 30.4 1% | 30.6 -0% |
| Idle Minimum * (dB) | 30.6 | 29.5 4% | 29.3 4% | 30.4 1% | 30.6 -0% |
| Idle Average * (dB) | 30.6 | 29.5 4% | 29.3 4% | 30.4 1% | 30.6 -0% |
| Idle Maximum * (dB) | 30.6 | 29.5 4% | 29.7 3% | 32 -5% | 32 -5% |
| Load Average * (dB) | 33.3 | 30.6 8% | 31.8 5% | 31.7 5% | 36.7 -10% |
| Load Maximum * (dB) | 33 | 30.6 7% | 32.7 1% | 35.9 -9% | 36.7 -11% |
* ... kleiner is beter
(±) De maximumtemperatuur aan de bovenzijde bedraagt 40 °C / 104 F, vergeleken met het gemiddelde van 35.4 °C / 96 F, variërend van 19.6 tot 60 °C voor de klasse Convertible.
(-) De bodem warmt op tot een maximum van 46.1 °C / 115 F, vergeleken met een gemiddelde van 36.9 °C / 98 F
(+) Bij onbelast gebruik bedraagt de gemiddelde temperatuur voor de bovenzijde 24.4 °C / 76 F, vergeleken met het apparaatgemiddelde van 30.3 °C / 87 F.
(+) De palmsteunen en het touchpad zijn met een maximum van ###max## °C / 81.7 F koeler dan de huidtemperatuur en voelen daarom koel aan.
(±) De gemiddelde temperatuur van de handpalmsteun van soortgelijke toestellen bedroeg 28 °C / 82.4 F (+0.4 °C / 0.7 F).
| Dell Latitude 13 3390 UHD Graphics 620, i5-8250U, SK hynix SC311 SATA | Lenovo ThinkPad L390 Yoga-20NT000XGE UHD Graphics 620, i5-8265U, Samsung SSD PM981 MZVLB256HAHQ | Lenovo Yoga C930-13IKB UHD Graphics 620, i5-8250U, SK hynix PC401 HFS256GD9TNG | Asus ZenBook Flip 14 UX461UA UHD Graphics 620, i5-8250U, SanDisk SD8SN8U256G1002 | HP ProBook x360 440 G1 UHD Graphics 620, i5-8250U, Toshiba KBG30ZMV256G | |
|---|---|---|---|---|---|
| Heat | -5% | 3% | 6% | -2% | |
| Maximum Upper Side * (°C) | 40 | 46.7 -17% | 41.8 -5% | 39 2% | 41.2 -3% |
| Maximum Bottom * (°C) | 46.1 | 50.7 -10% | 40.9 11% | 45.6 1% | 42.4 8% |
| Idle Upper Side * (°C) | 25.7 | 23.8 7% | 25.6 -0% | 23.3 9% | 26.9 -5% |
| Idle Bottom * (°C) | 26 | 25.6 2% | 24.5 6% | 23.1 11% | 28.4 -9% |
* ... kleiner is beter
Dell Latitude 13 3390 audioanalyse
(-) | niet erg luide luidsprekers (66.7 dB)
Bas 100 - 315 Hz
(-) | bijna geen lage tonen - gemiddeld 15.6% lager dan de mediaan
(±) | lineariteit van de lage tonen is gemiddeld (12.4% delta ten opzichte van de vorige frequentie)
Midden 400 - 2000 Hz
(+) | evenwichtige middens - slechts 4% verwijderd van de mediaan
(±) | lineariteit van de middentonen is gemiddeld (7.9% delta ten opzichte van de vorige frequentie)
Hoog 2 - 16 kHz
(+) | evenwichtige hoogtepunten - slechts 4.4% verwijderd van de mediaan
(±) | lineariteit van de hoogtepunten is gemiddeld (7% delta ten opzichte van de vorige frequentie)
Algemeen 100 - 16.000 Hz
(±) | lineariteit van het totale geluid is gemiddeld (22.6% verschil met de mediaan)
Vergeleken met dezelfde klasse
» 68% van alle geteste apparaten in deze klasse waren beter, 5% vergelijkbaar, 27% slechter
» De beste had een delta van 6%, het gemiddelde was 20%, de slechtste was 57%
Vergeleken met alle geteste toestellen
» 67% van alle geteste apparaten waren beter, 6% gelijk, 28% slechter
» De beste had een delta van 4%, het gemiddelde was 24%, de slechtste was 134%
Lenovo ThinkPad L390 Yoga-20NT000XGE audioanalyse
(±) | luidspreker luidheid is gemiddeld maar goed (76.3 dB)
Bas 100 - 315 Hz
(-) | bijna geen lage tonen - gemiddeld 17.9% lager dan de mediaan
(±) | lineariteit van de lage tonen is gemiddeld (12.9% delta ten opzichte van de vorige frequentie)
Midden 400 - 2000 Hz
(+) | evenwichtige middens - slechts 2.1% verwijderd van de mediaan
(+) | de middentonen zijn lineair (6.1% delta ten opzichte van de vorige frequentie)
Hoog 2 - 16 kHz
(±) | higher highs - on average 7.5% higher than median
(±) | lineariteit van de hoogtepunten is gemiddeld (9.1% delta ten opzichte van de vorige frequentie)
Algemeen 100 - 16.000 Hz
(±) | lineariteit van het totale geluid is gemiddeld (23% verschil met de mediaan)
Vergeleken met dezelfde klasse
» 69% van alle geteste apparaten in deze klasse waren beter, 5% vergelijkbaar, 26% slechter
» De beste had een delta van 6%, het gemiddelde was 20%, de slechtste was 57%
Vergeleken met alle geteste toestellen
» 69% van alle geteste apparaten waren beter, 5% gelijk, 26% slechter
» De beste had een delta van 4%, het gemiddelde was 24%, de slechtste was 134%
| Uit / Standby | |
| Inactief | |
| Belasting |
|
Key:
min: | |
| Dell Latitude 13 3390 i5-8250U, UHD Graphics 620, SK hynix SC311 SATA, IPS, 1920x1080, 13.3" | Lenovo ThinkPad L390 Yoga-20NT000XGE i5-8265U, UHD Graphics 620, Samsung SSD PM981 MZVLB256HAHQ, IPS LED, 1920x1080, 13.3" | Lenovo Yoga C930-13IKB i5-8250U, UHD Graphics 620, SK hynix PC401 HFS256GD9TNG, IPS, 1920x1080, 13.9" | Asus ZenBook Flip 14 UX461UA i5-8250U, UHD Graphics 620, SanDisk SD8SN8U256G1002, IPS, 1920x1080, 14" | HP ProBook x360 440 G1 i5-8250U, UHD Graphics 620, Toshiba KBG30ZMV256G, IPS, 1920x1080, 14" | Gemiddeld Intel UHD Graphics 620 | Gemiddelde van klas Convertible | |
|---|---|---|---|---|---|---|---|
| Power Consumption | -14% | -16% | -1% | -15% | -9% | -26% | |
| Idle Minimum * (Watt) | 3.9 | 4 -3% | 3.3 15% | 3.3 15% | 4.6 -18% | 3.81 ? 2% | 4.22 ? -8% |
| Idle Average * (Watt) | 6.5 | 7.1 -9% | 6.8 -5% | 6.3 3% | 7.5 -15% | 6.94 ? -7% | 6.97 ? -7% |
| Idle Maximum * (Watt) | 8.6 | 10.7 -24% | 9.5 -10% | 11 -28% | 9.6 -12% | 8.75 ? -2% | 8.63 ? -0% |
| Load Average * (Watt) | 25 | 33.8 -35% | 40.8 -63% | 30 -20% | 37 -48% | 35 ? -40% | 43.9 ? -76% |
| Load Maximum * (Watt) | 48.1 | 48.8 -1% | 57 -19% | 35.4 26% | 38.8 19% | 47.5 ? 1% | 67.1 ? -40% |
* ... kleiner is beter

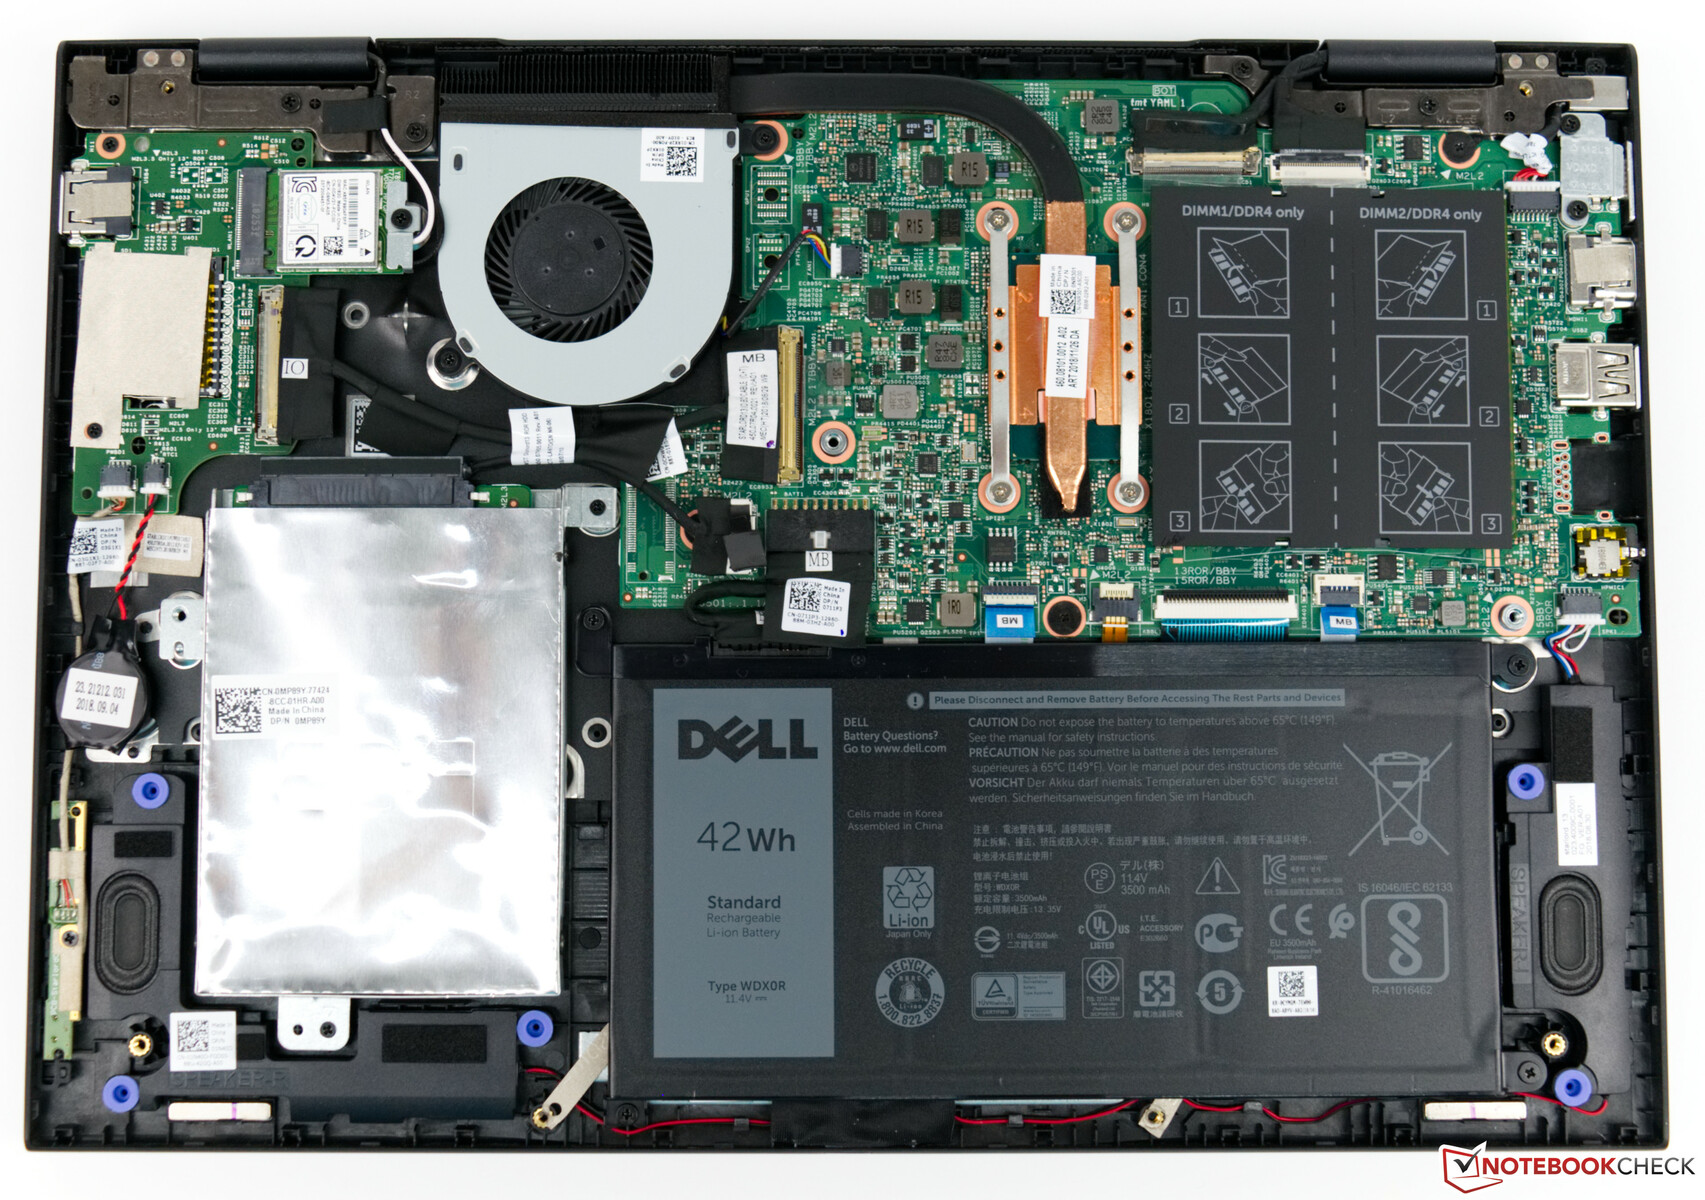
| Dell Latitude 13 3390 i5-8250U, UHD Graphics 620, 42 Wh | Lenovo ThinkPad L390 Yoga-20NT000XGE i5-8265U, UHD Graphics 620, 45 Wh | Lenovo Yoga C930-13IKB i5-8250U, UHD Graphics 620, 60 Wh | Asus ZenBook Flip 14 UX461UA i5-8250U, UHD Graphics 620, 57 Wh | HP ProBook x360 440 G1 i5-8250U, UHD Graphics 620, 48 Wh | Gemiddelde van klas Convertible | |
|---|---|---|---|---|---|---|
| Batterijduur | 3% | 44% | 29% | 32% | 76% | |
| Reader / Idle (h) | 16.7 | 15.8 -5% | 23.9 43% | 18.9 13% | 17.3 4% | 27.7 ? 66% |
| H.264 (h) | 5.9 | 7.4 25% | 10.5 78% | 8.6 46% | 8.3 41% | 15.3 ? 159% |
| WiFi v1.3 (h) | 6.7 | 7.2 7% | 9.2 37% | 9.4 40% | 8.9 33% | 12.1 ? 81% |
| Load (h) | 1.8 | 1.5 -17% | 2.1 17% | 2.1 17% | 2.7 50% | 1.779 ? -1% |
Pro
Contra
Dit is de verkorte versie van het originele artikel. Het volledige, Engelse testrapport vind je hier.
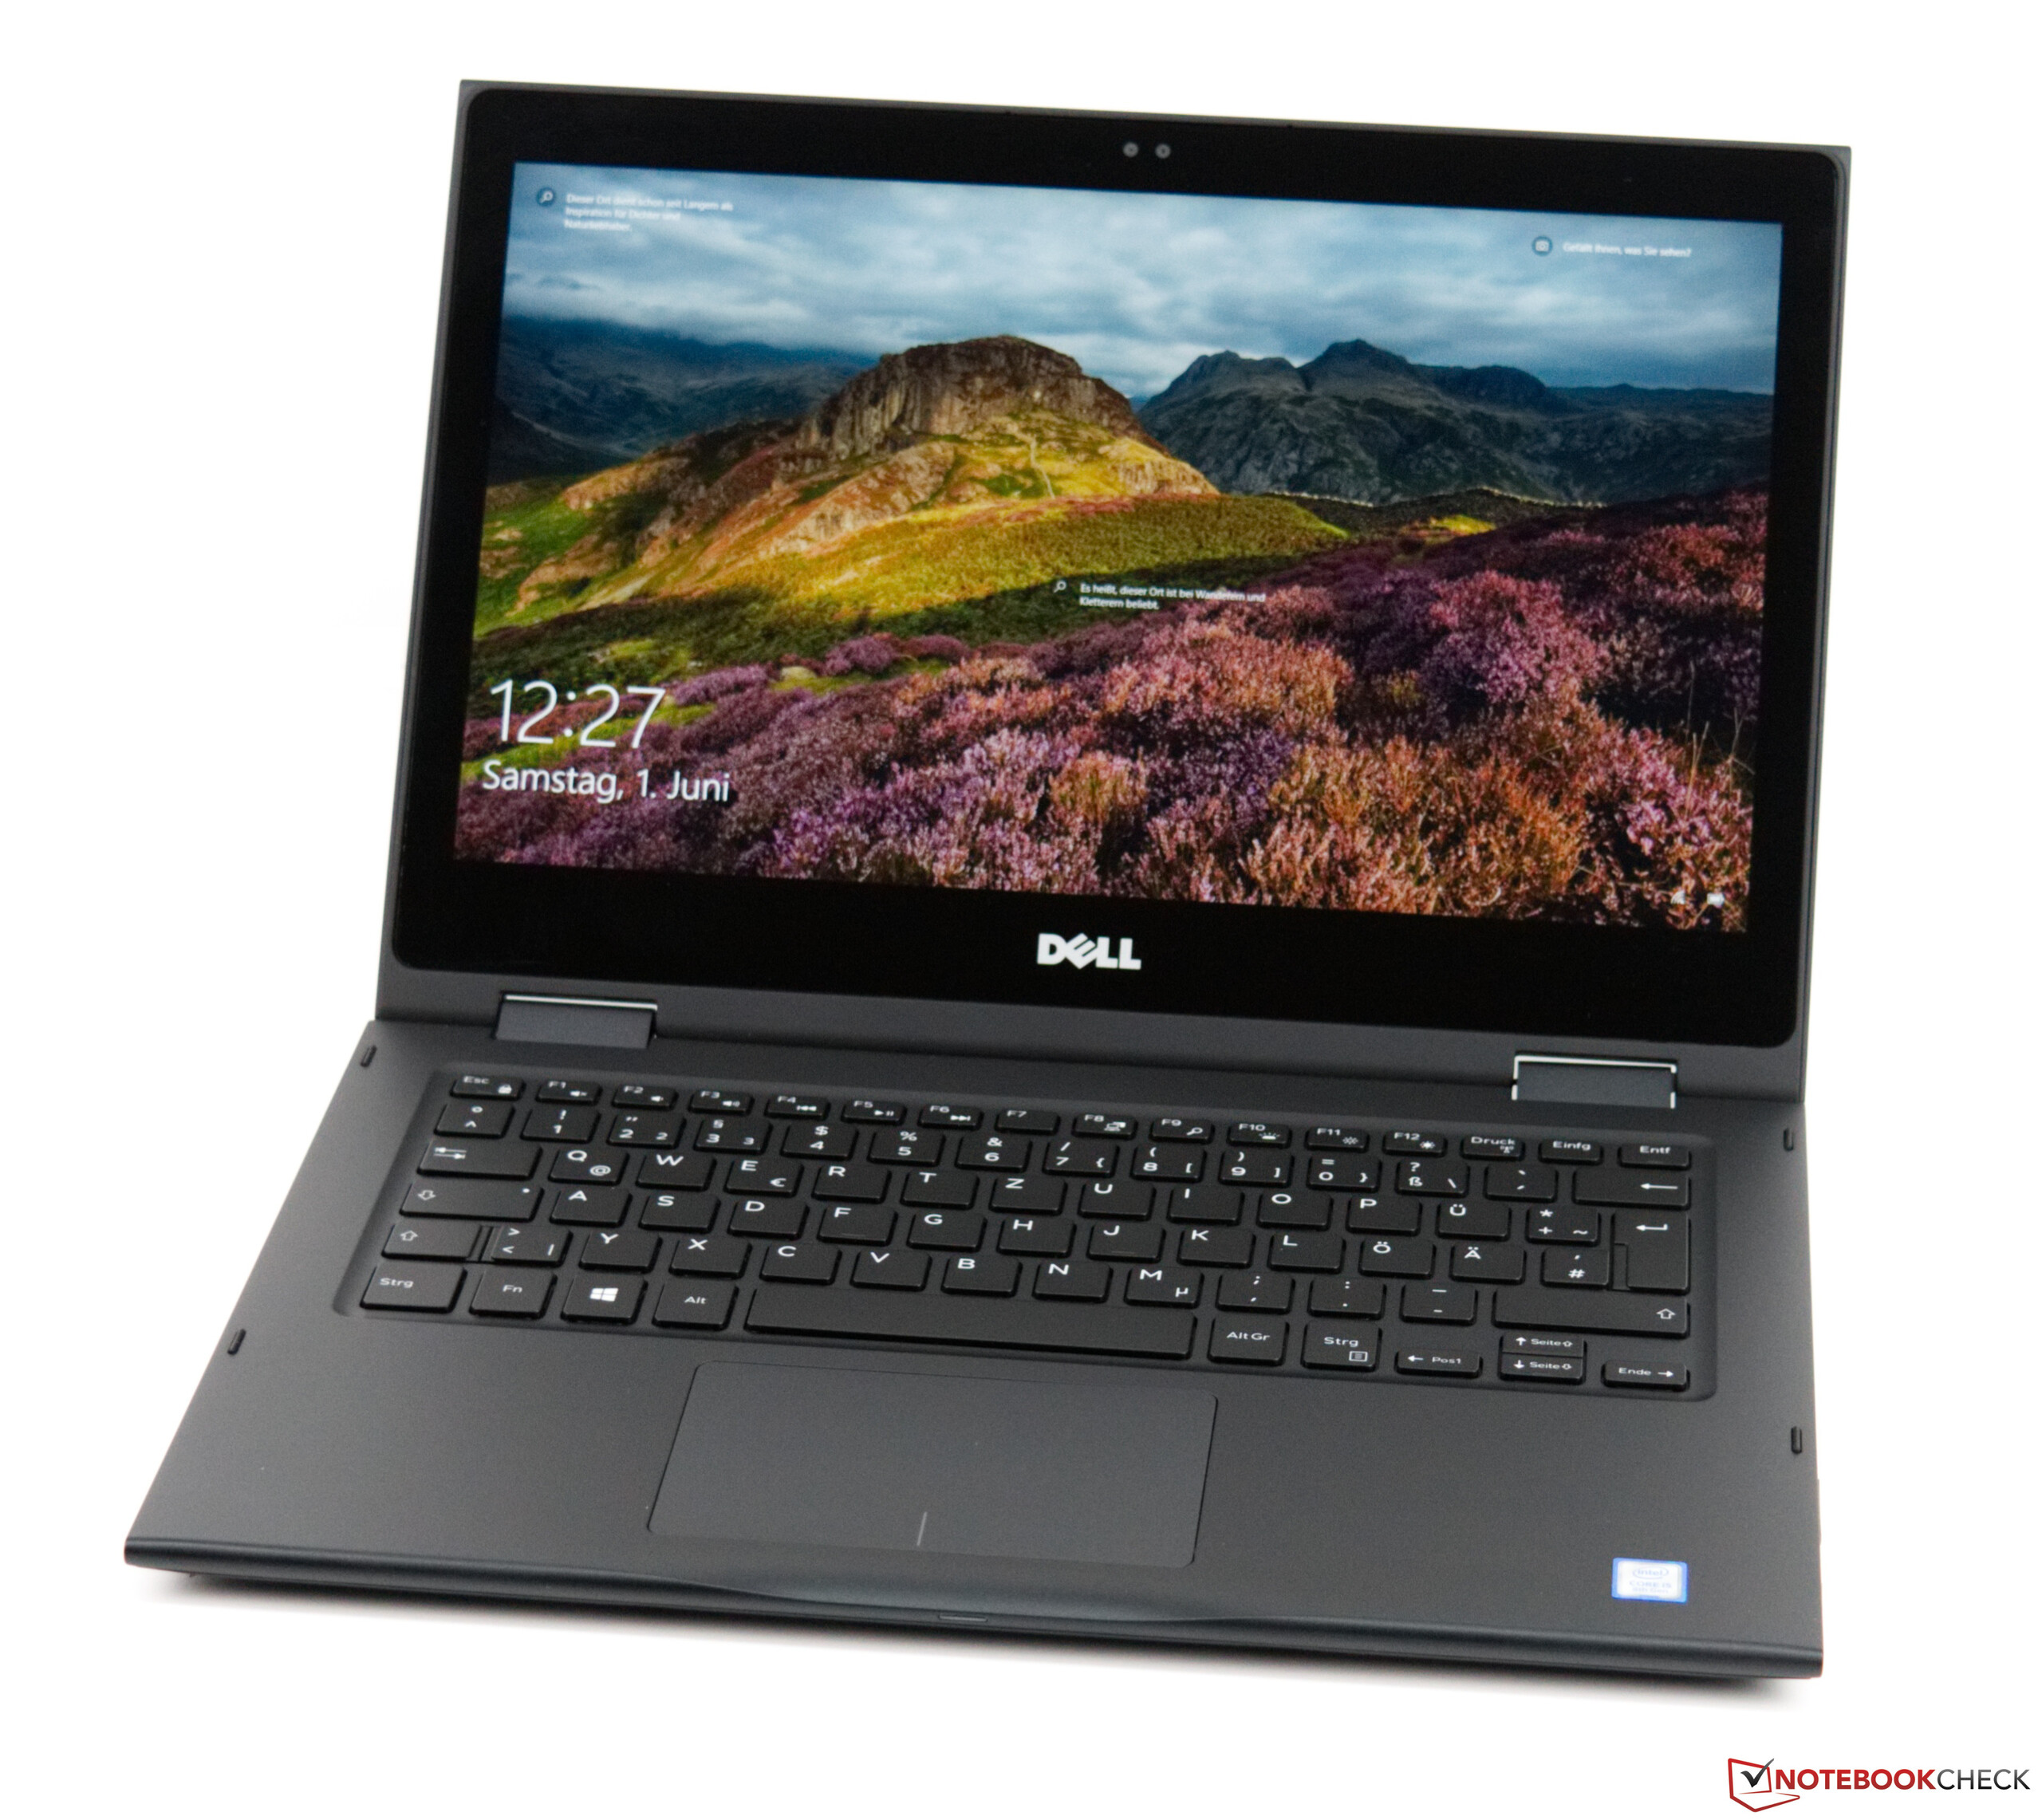
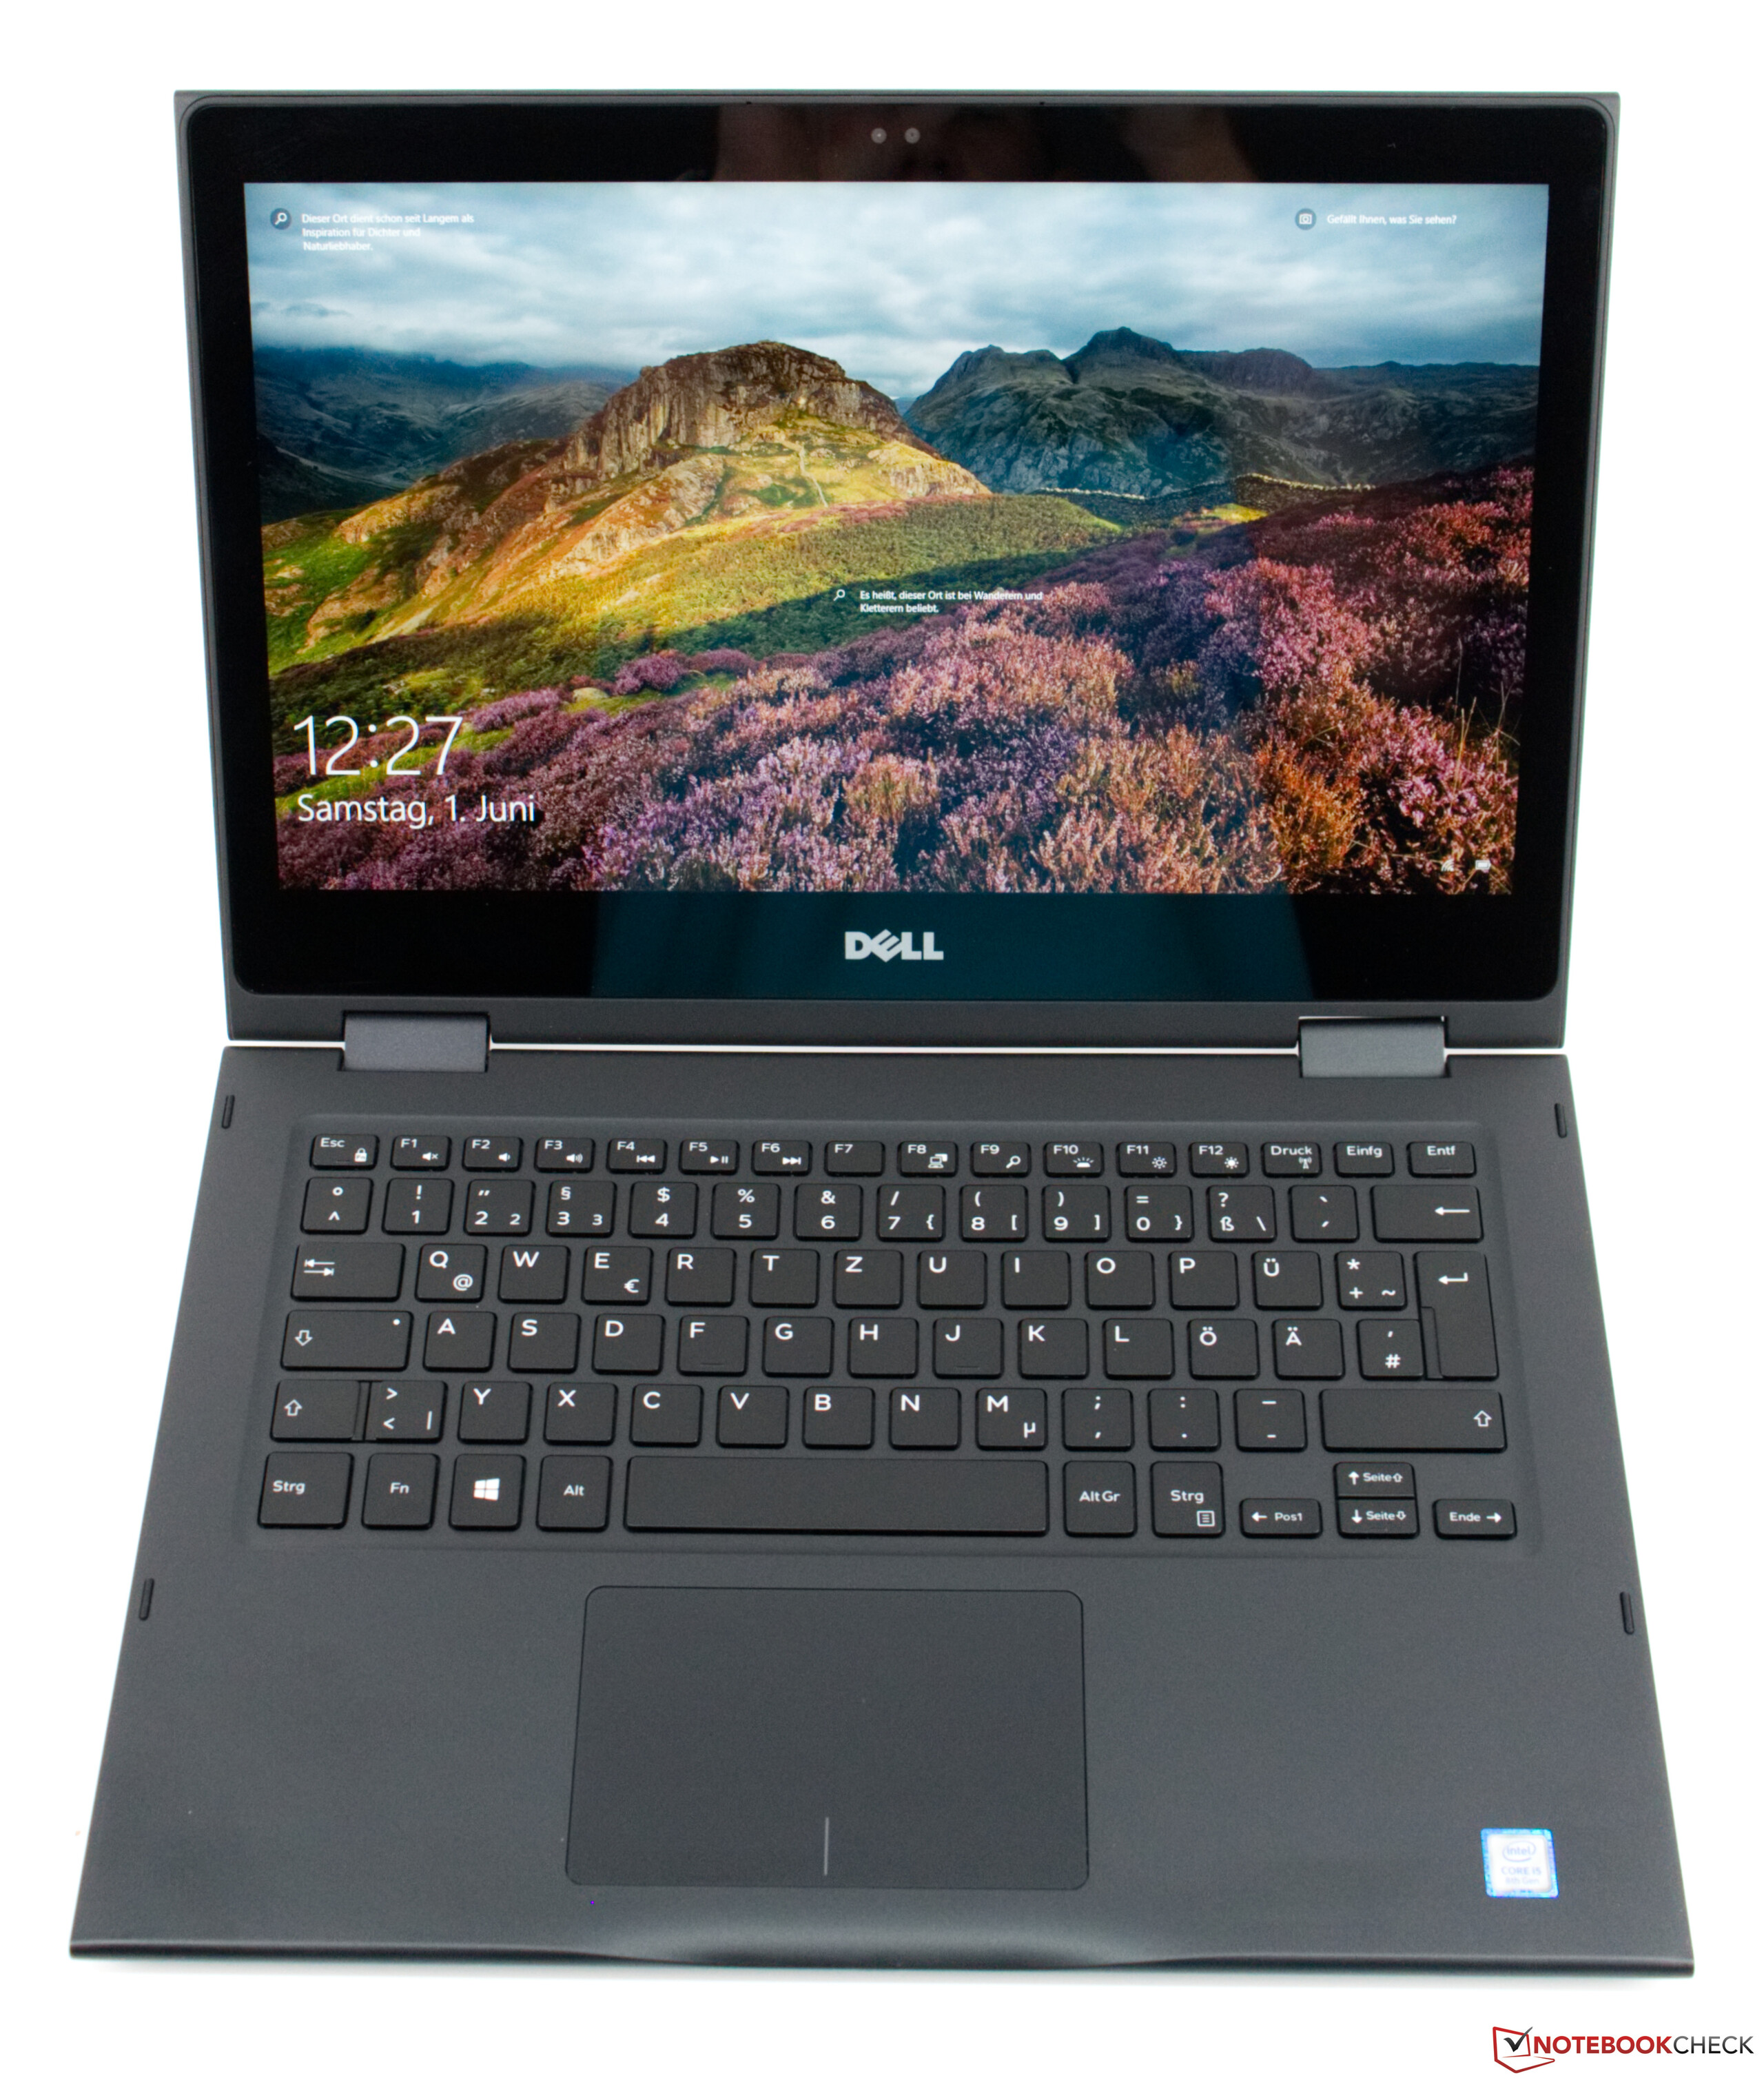
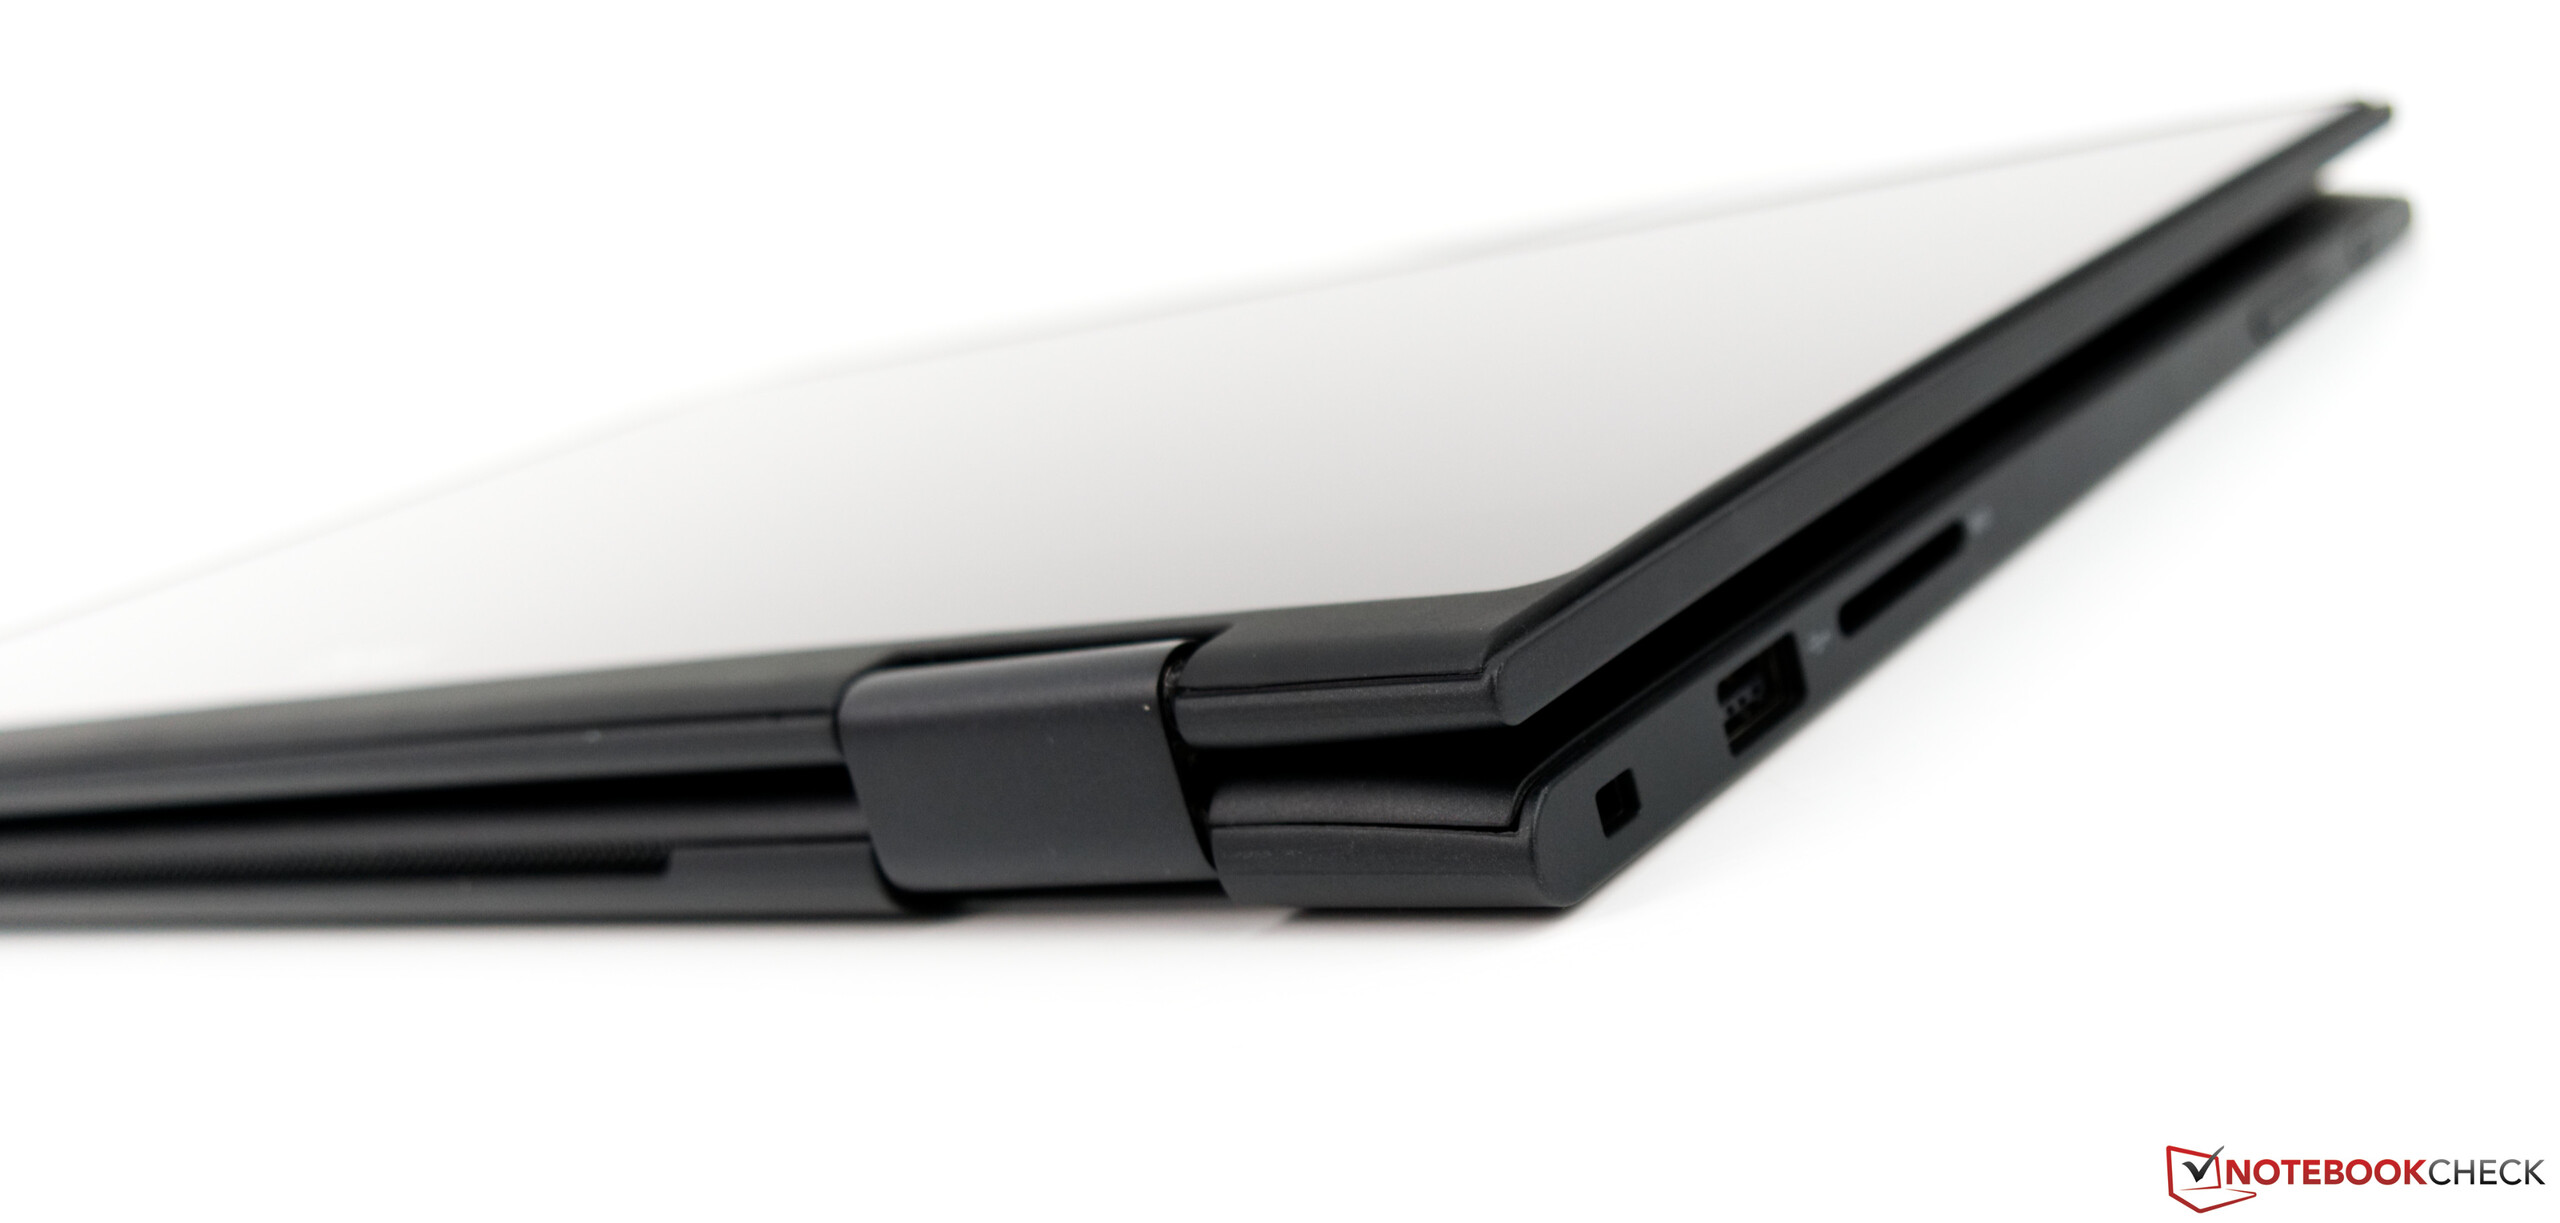
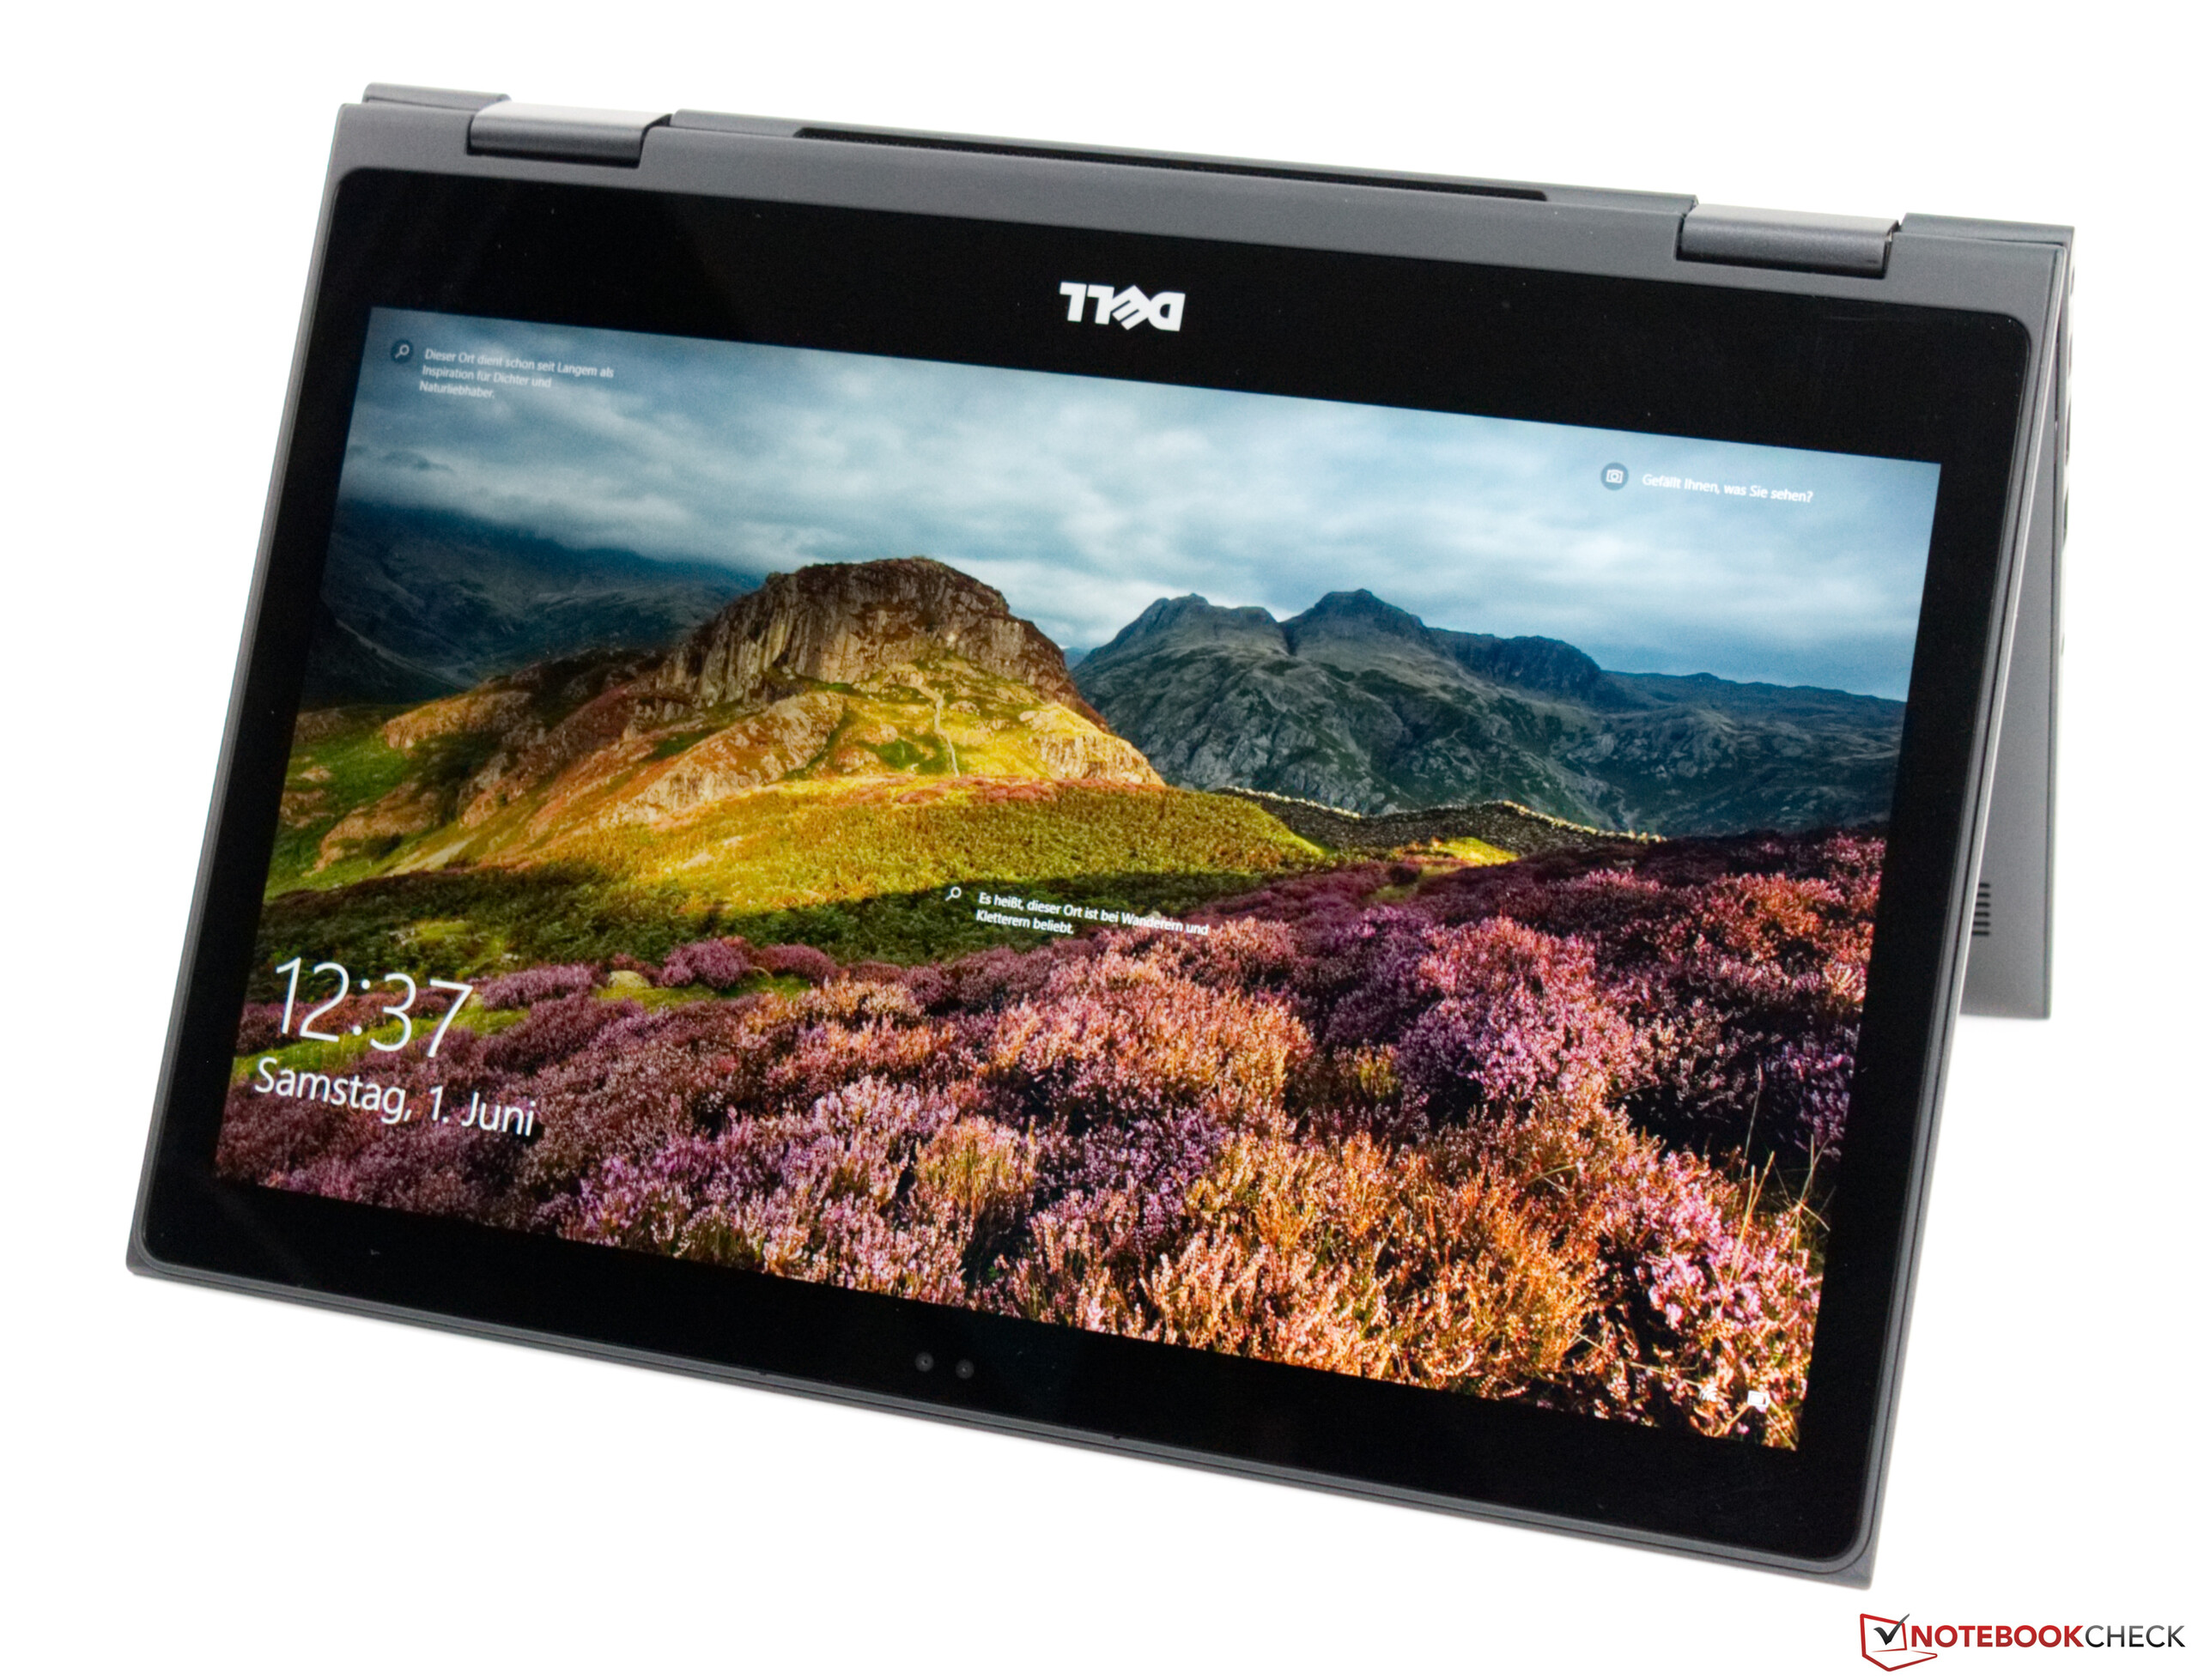
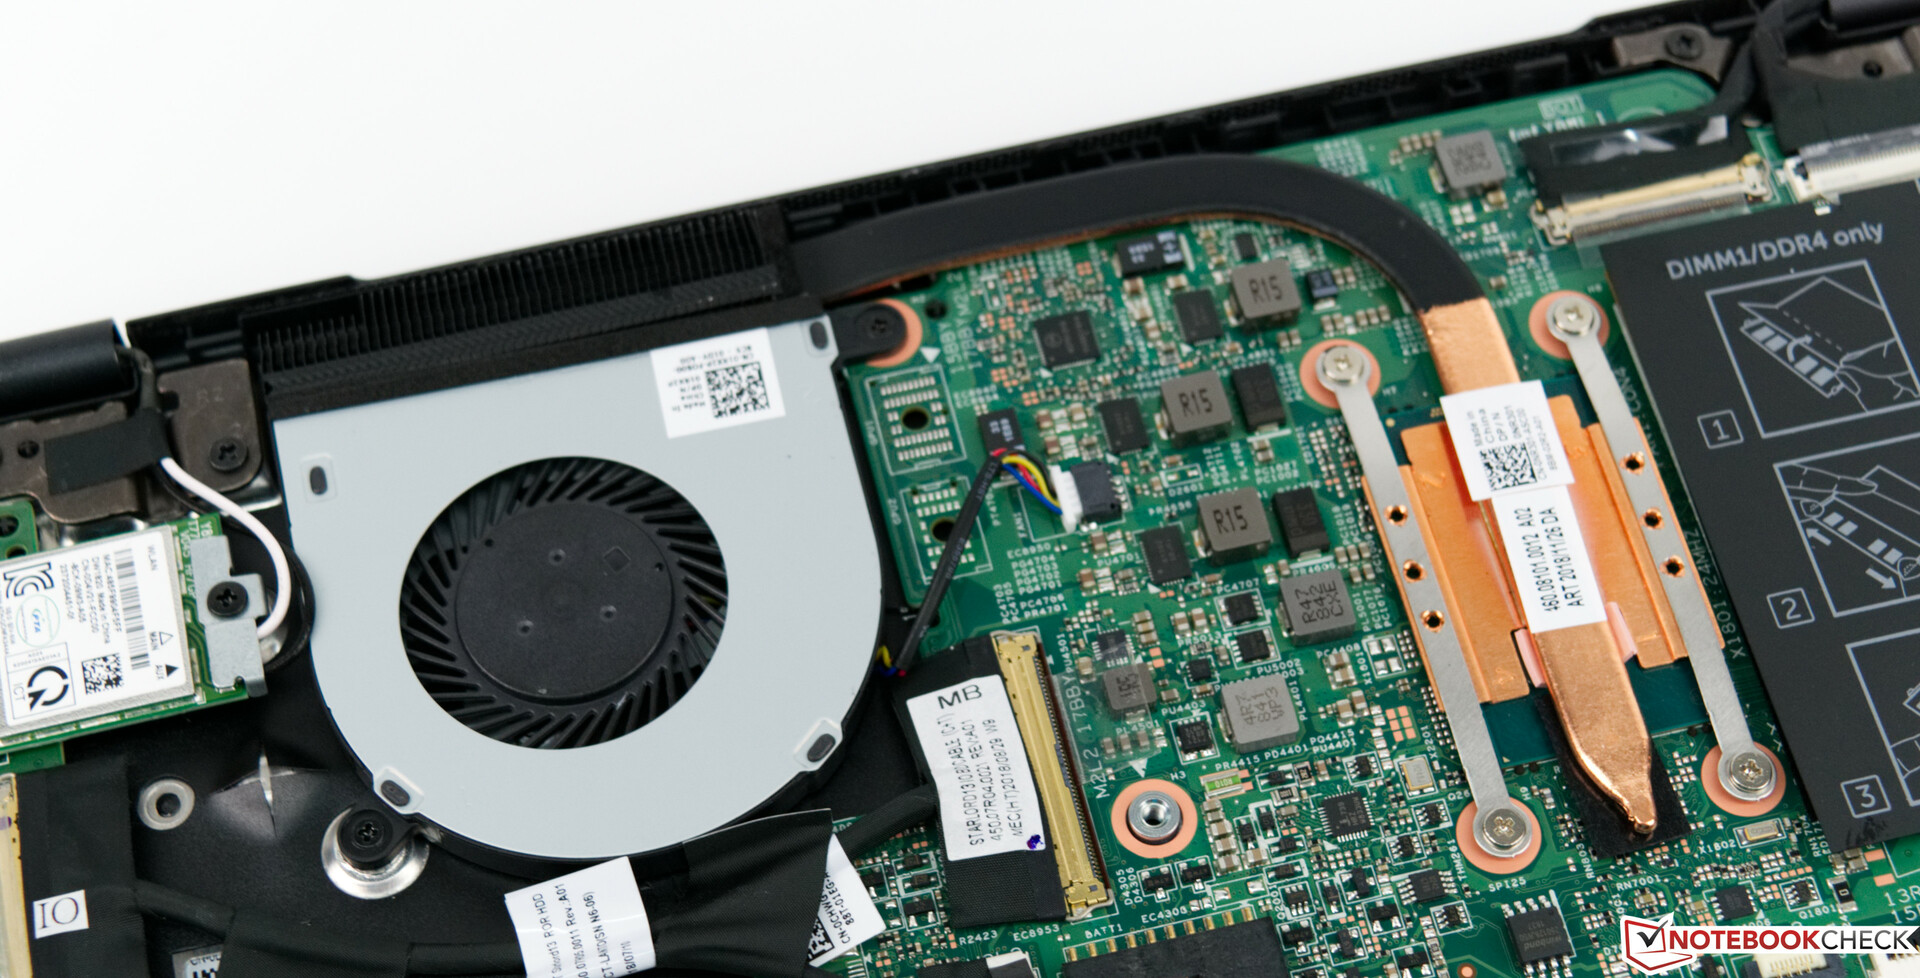
De Dell Latitude 3390 is een redelijk geprijsde 13.3-inch zakelijke convertible. Ons testmodel heeft een Intel Core i5-8250U processor, 8 GB RAM en een 256 GB SSD, wat gezien de € 999 verkoopprijs een goede configuratie is. Samengevat is de Latitude 3390 in de configuratie die we getest hebben relatief goedkoop voor een zakelijk notebook en is het ook een fatsoenlijk alternatief voor consumenten notebooks. Helaas ontbeert het de notebook aan enkele belangrijke zakelijke features zoals optie tot LTE en beveiligingsfeatures zoals een vingerafdruksensor. De Latitude 3390 zal voor professionals dan ook minder aantrekkelijk zijn.
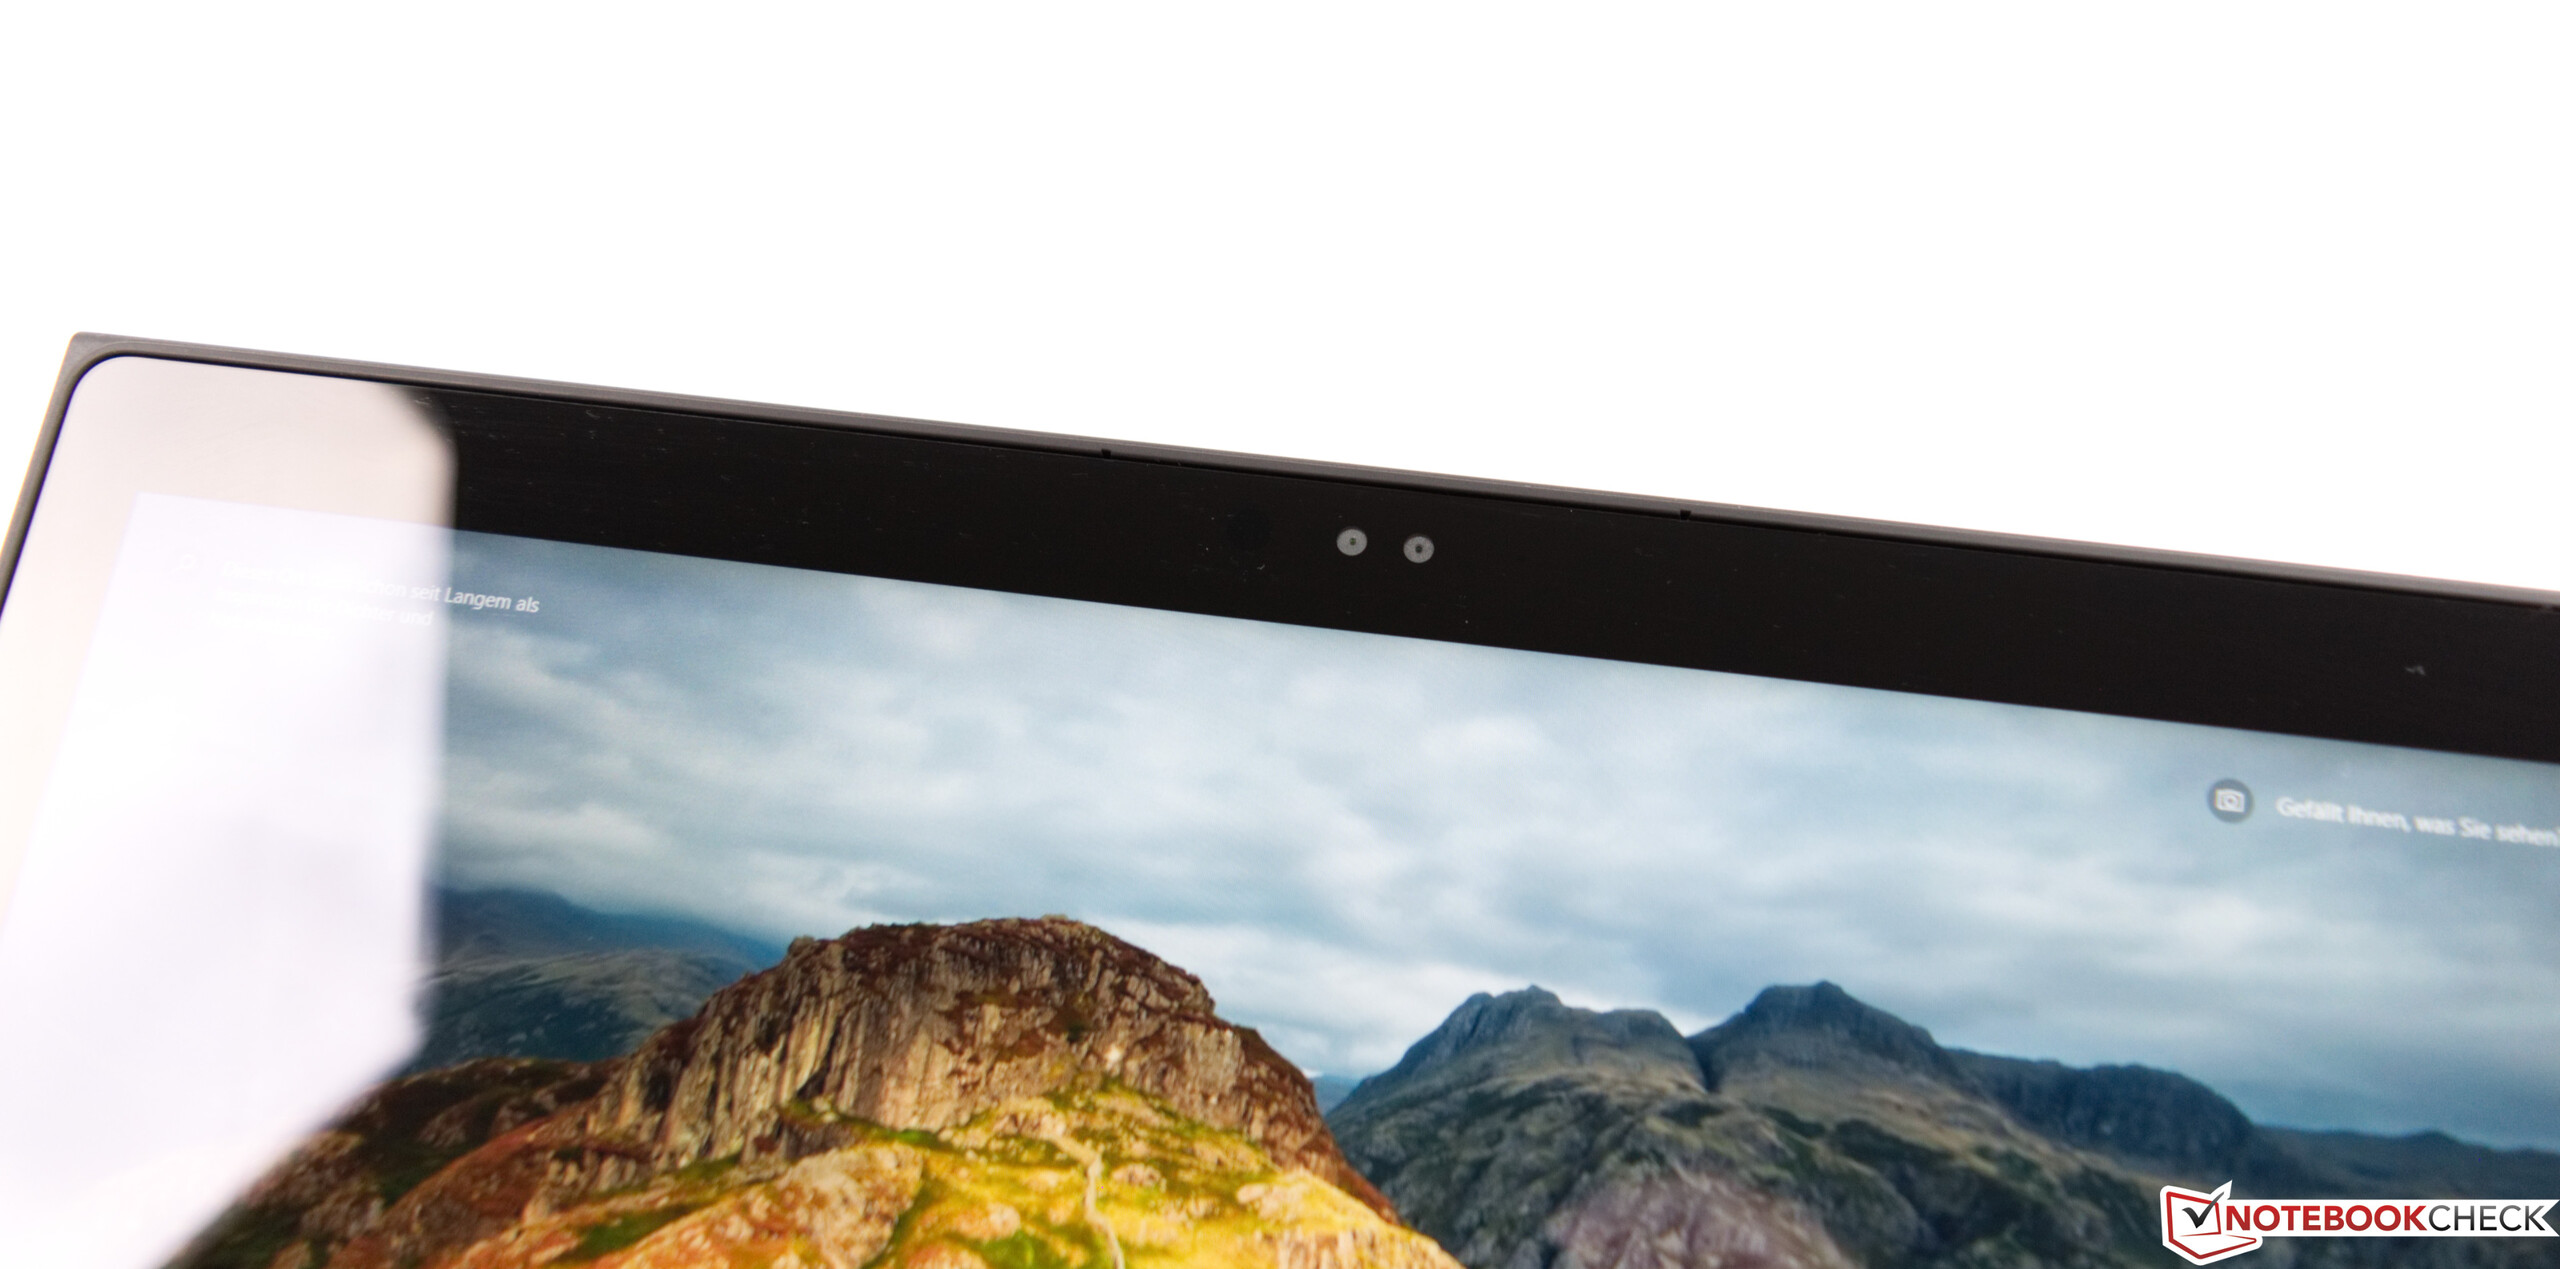
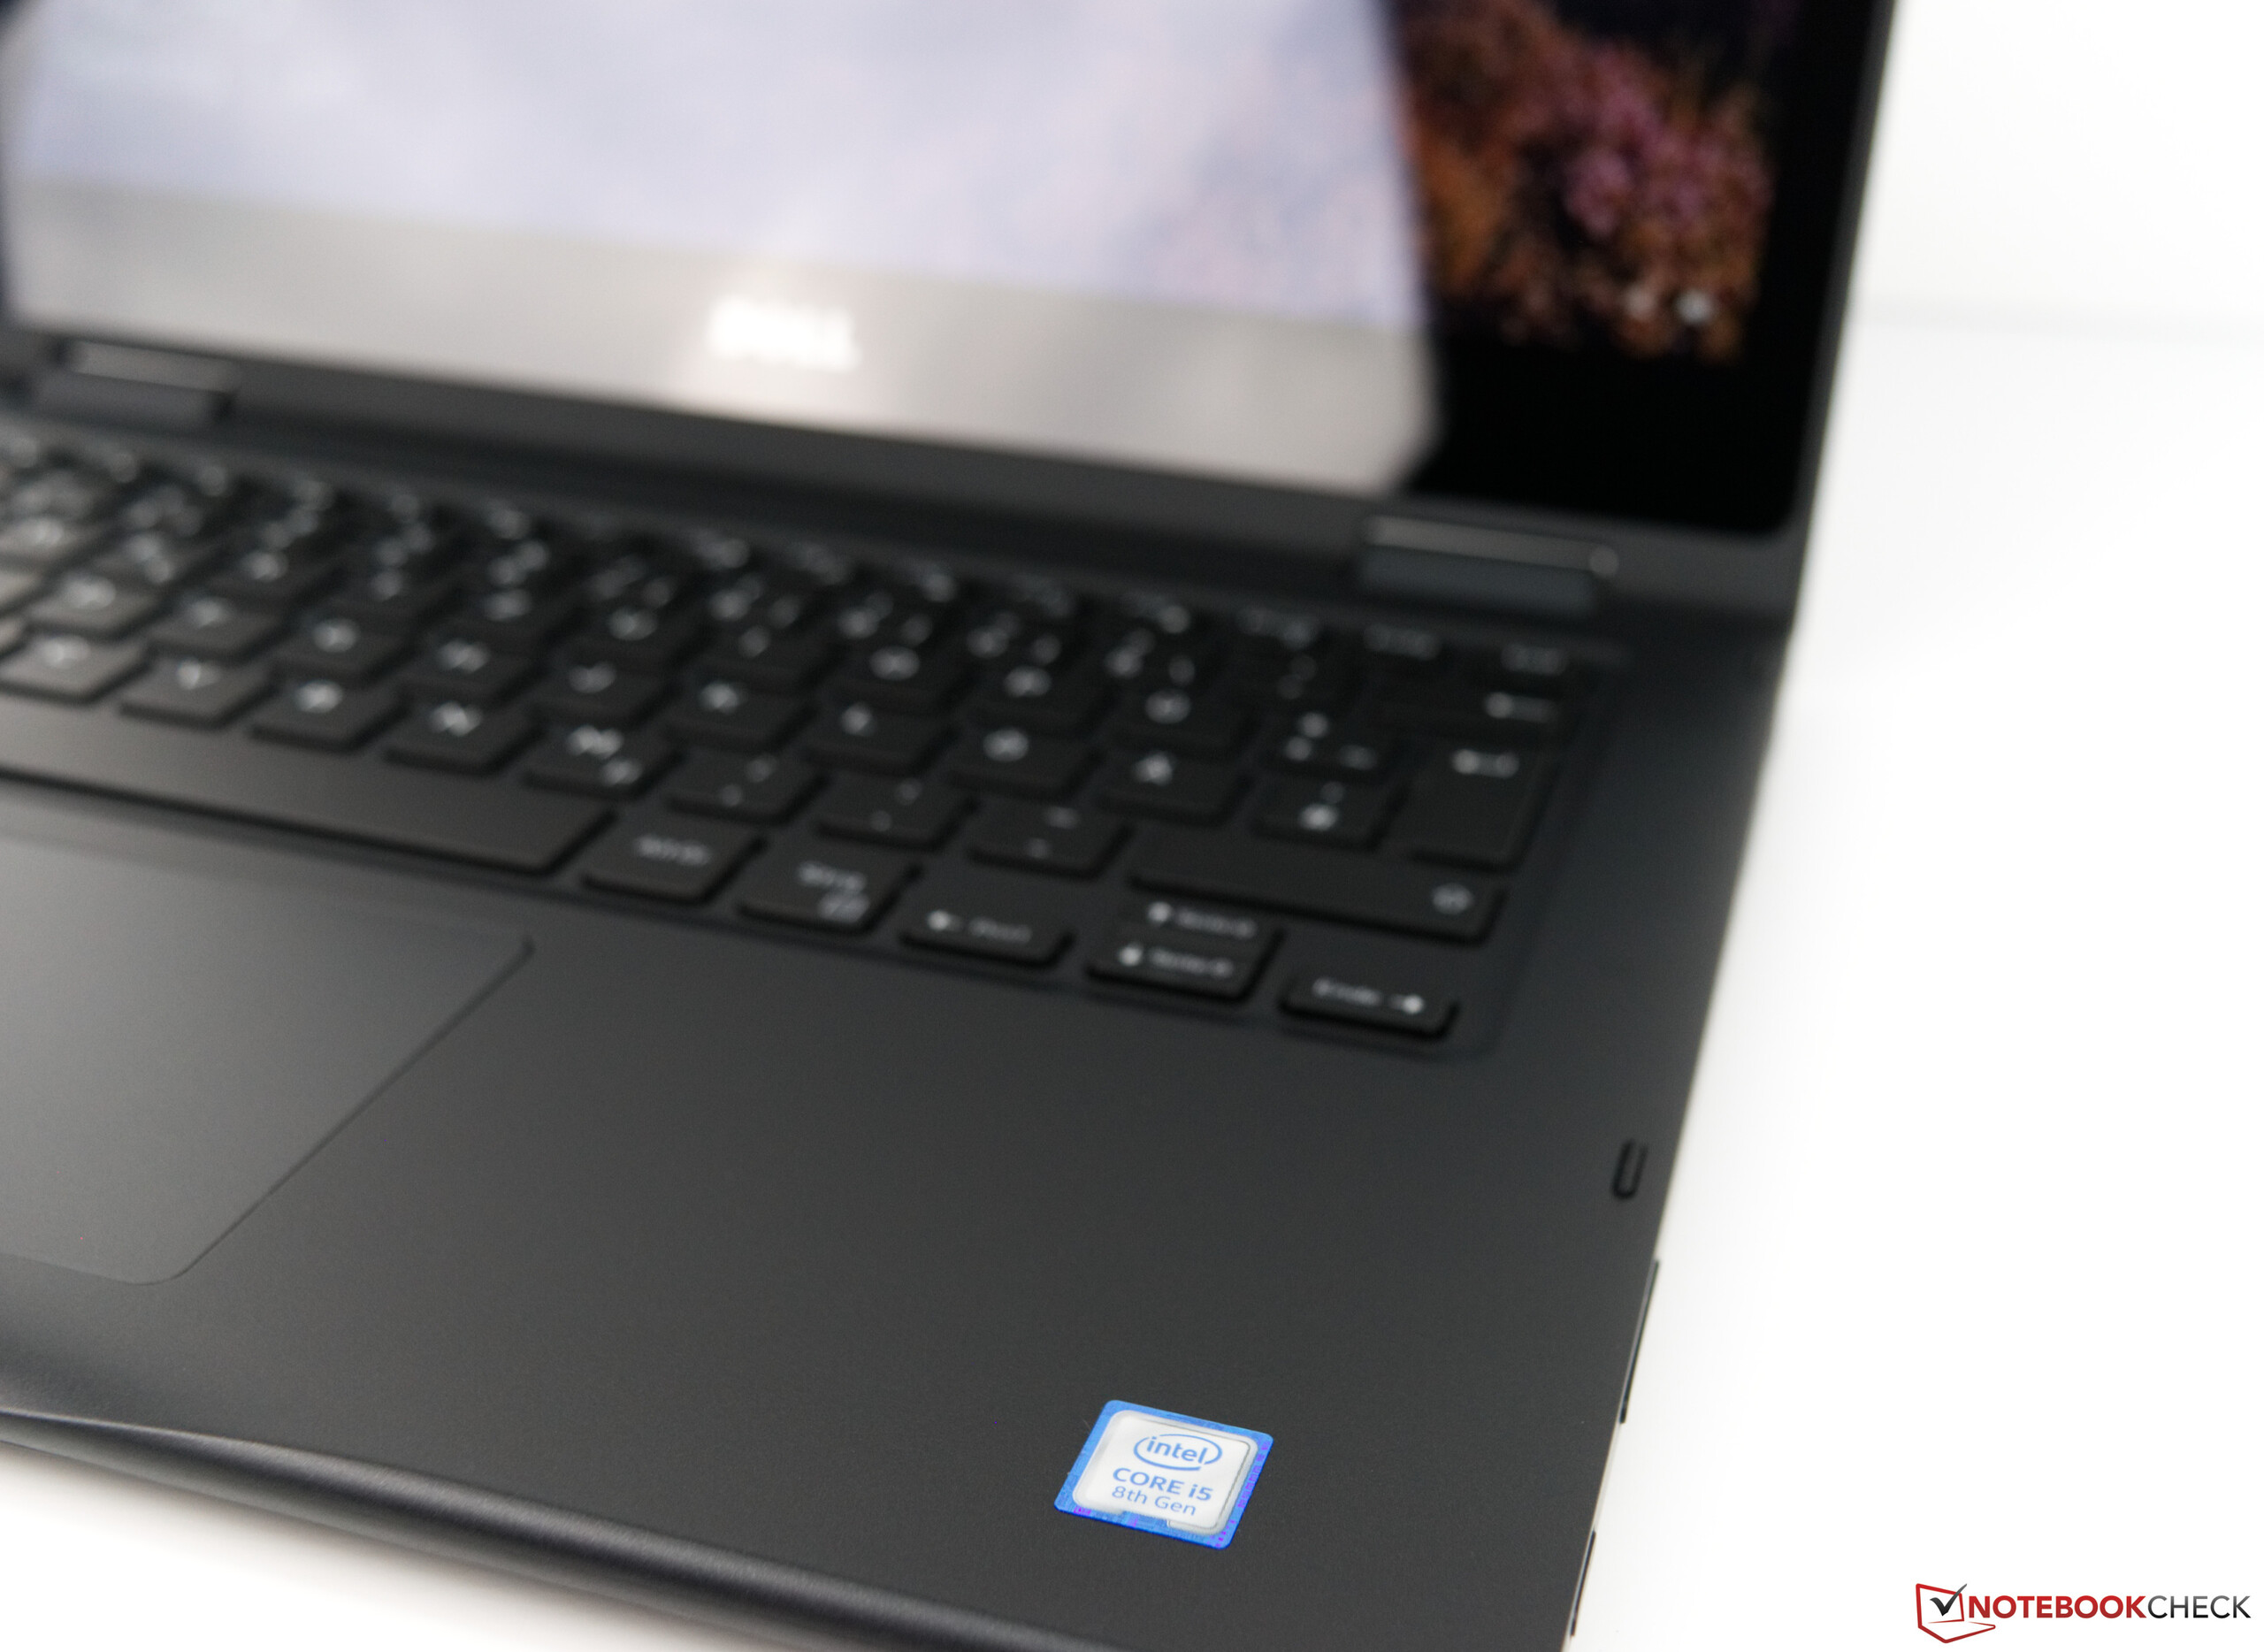
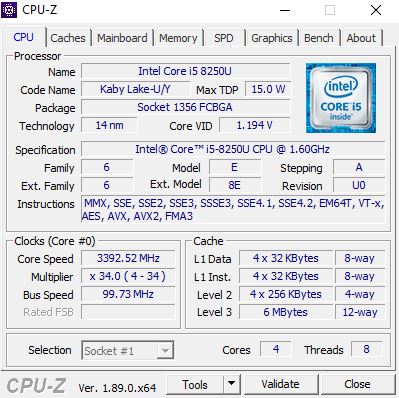
De quad-core Core i5-8250U is krachtig genoeg voor de meeste toepassingen, net als de 8 GB RAM. Beide zijn echter niet heel toekomstbestendig en geven de indruk dat Dell de Latitude 3390 een jaar te laat op de markt brengt. Het ontwerp draagt bij aan dat gevoel. Het simpele ontwerp zal er voor sommige mensen elegant uitzien, maar de dikke beeldschermranden zien er verouderd uit. Dell had de Latitude 3390 makkelijk met een 14-inch paneel kunnen uitrusten in dezelfde behuizing.
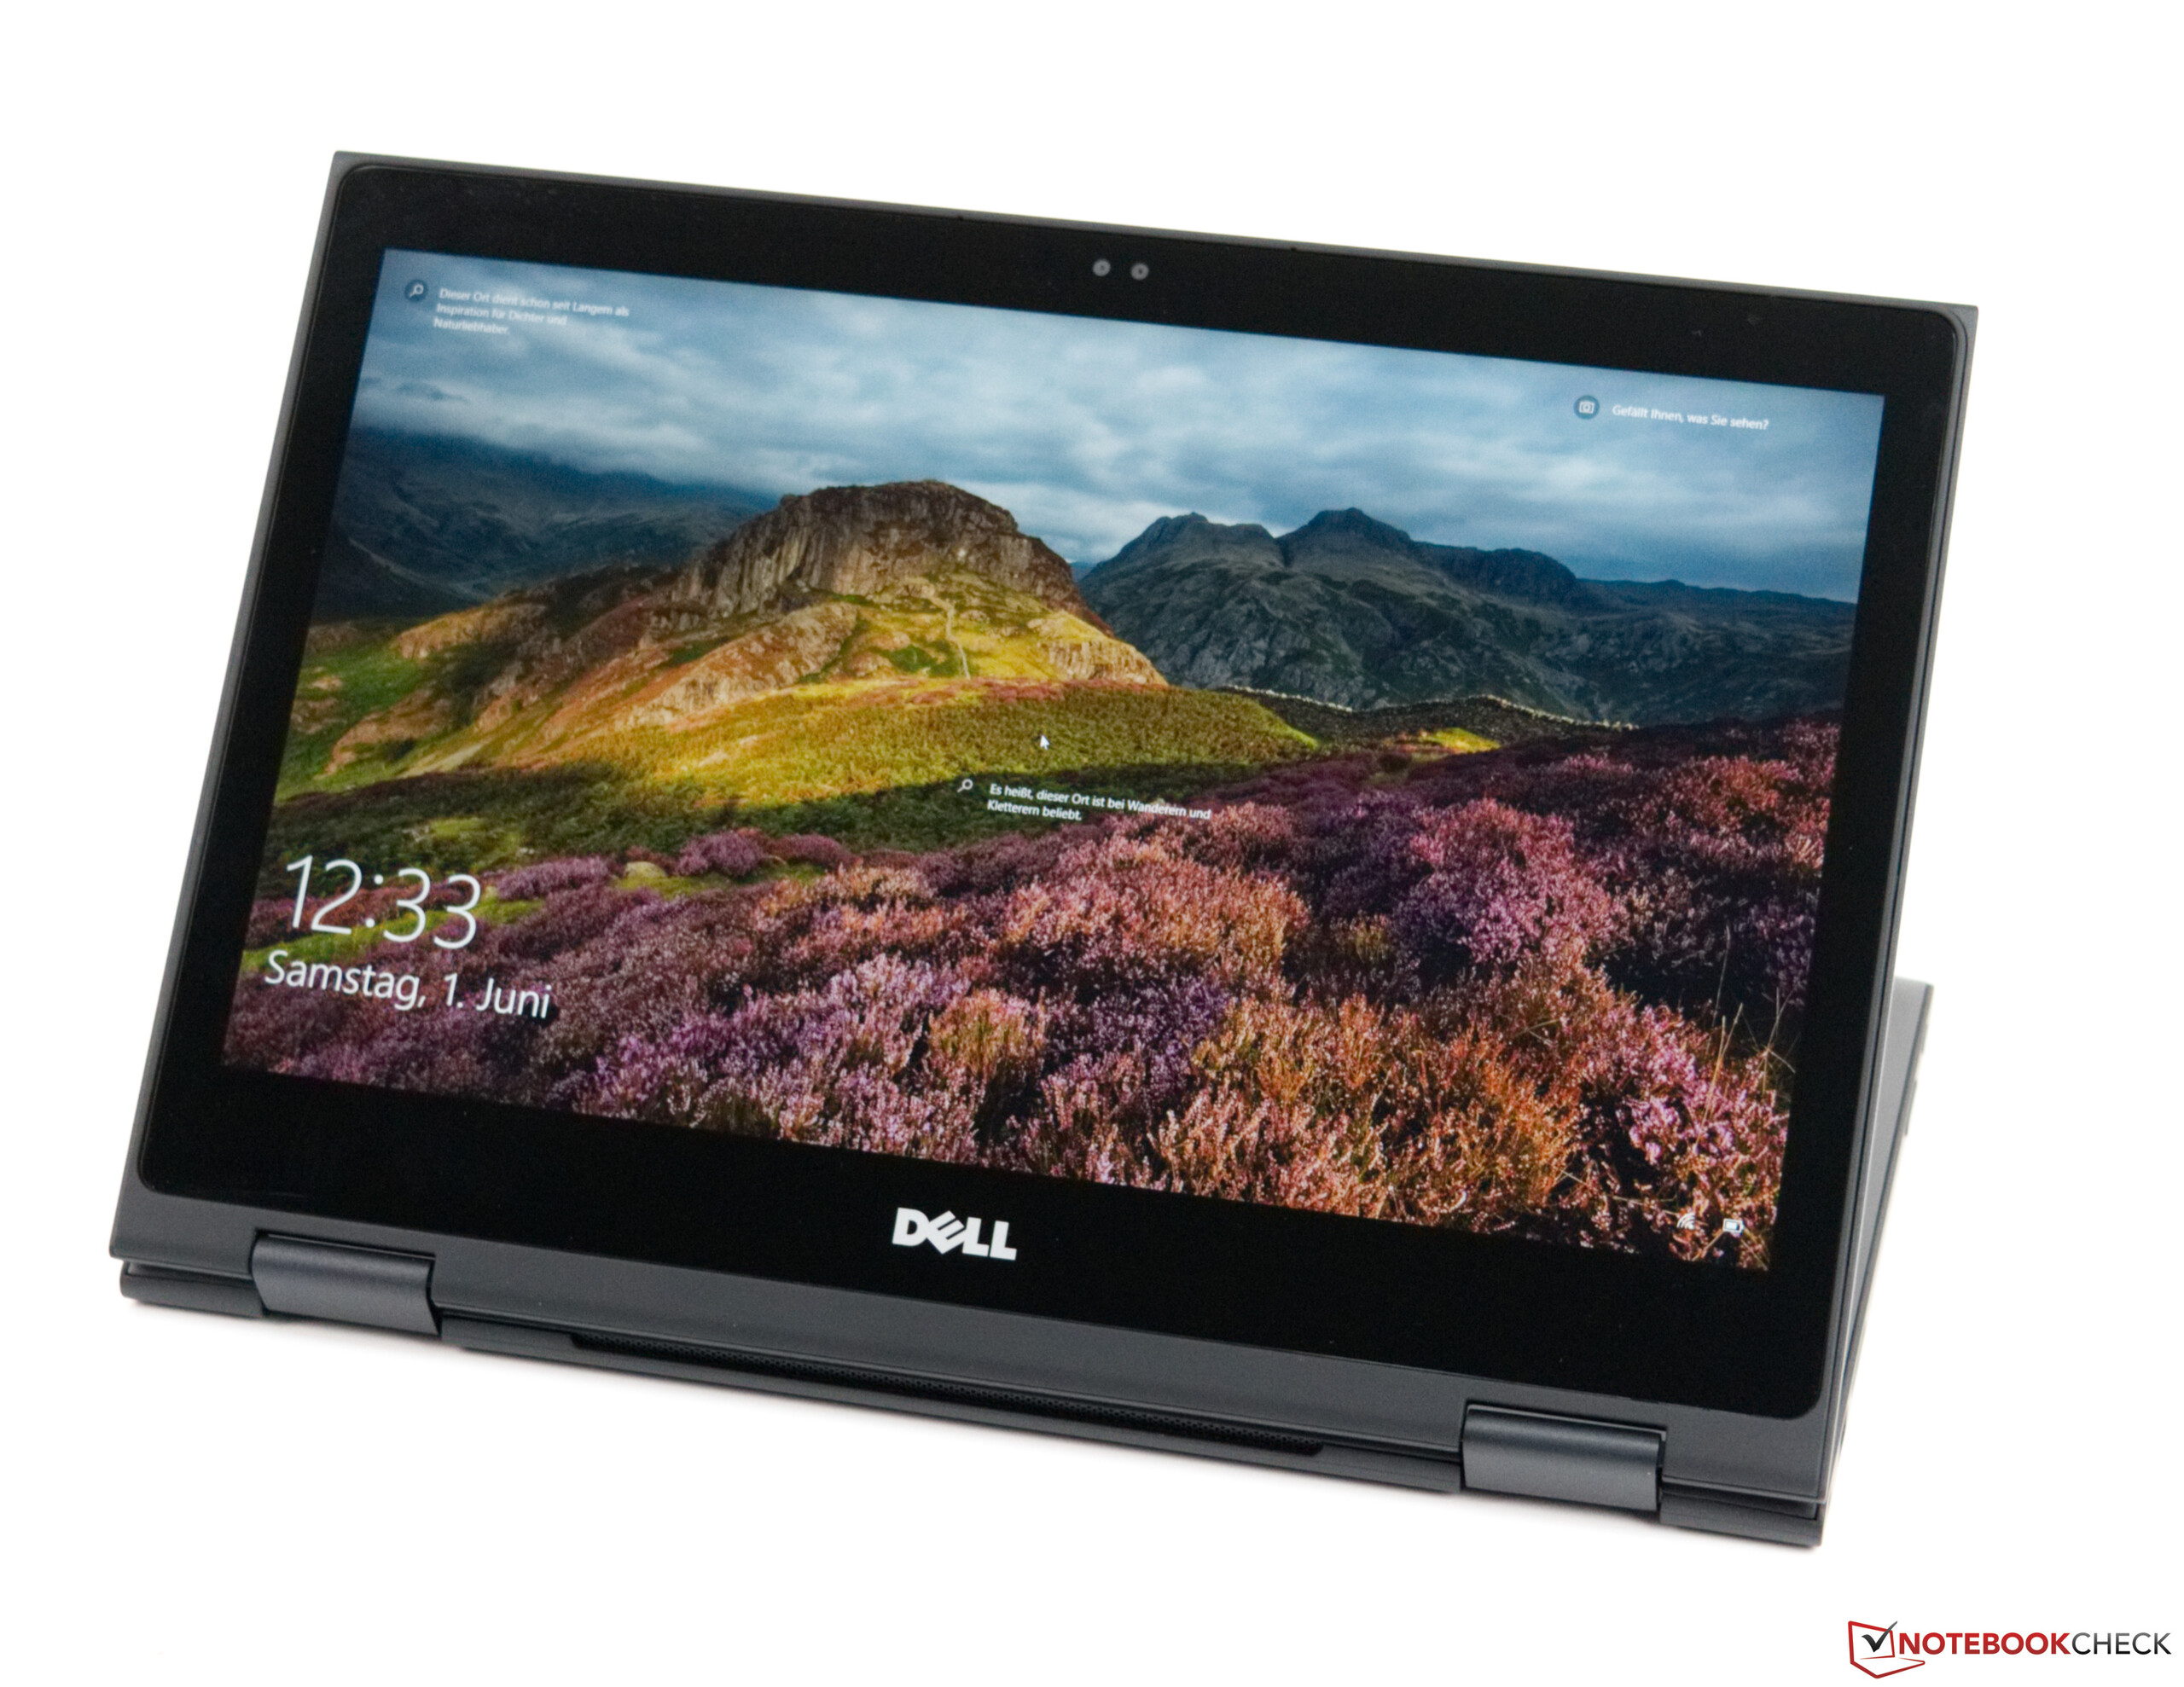
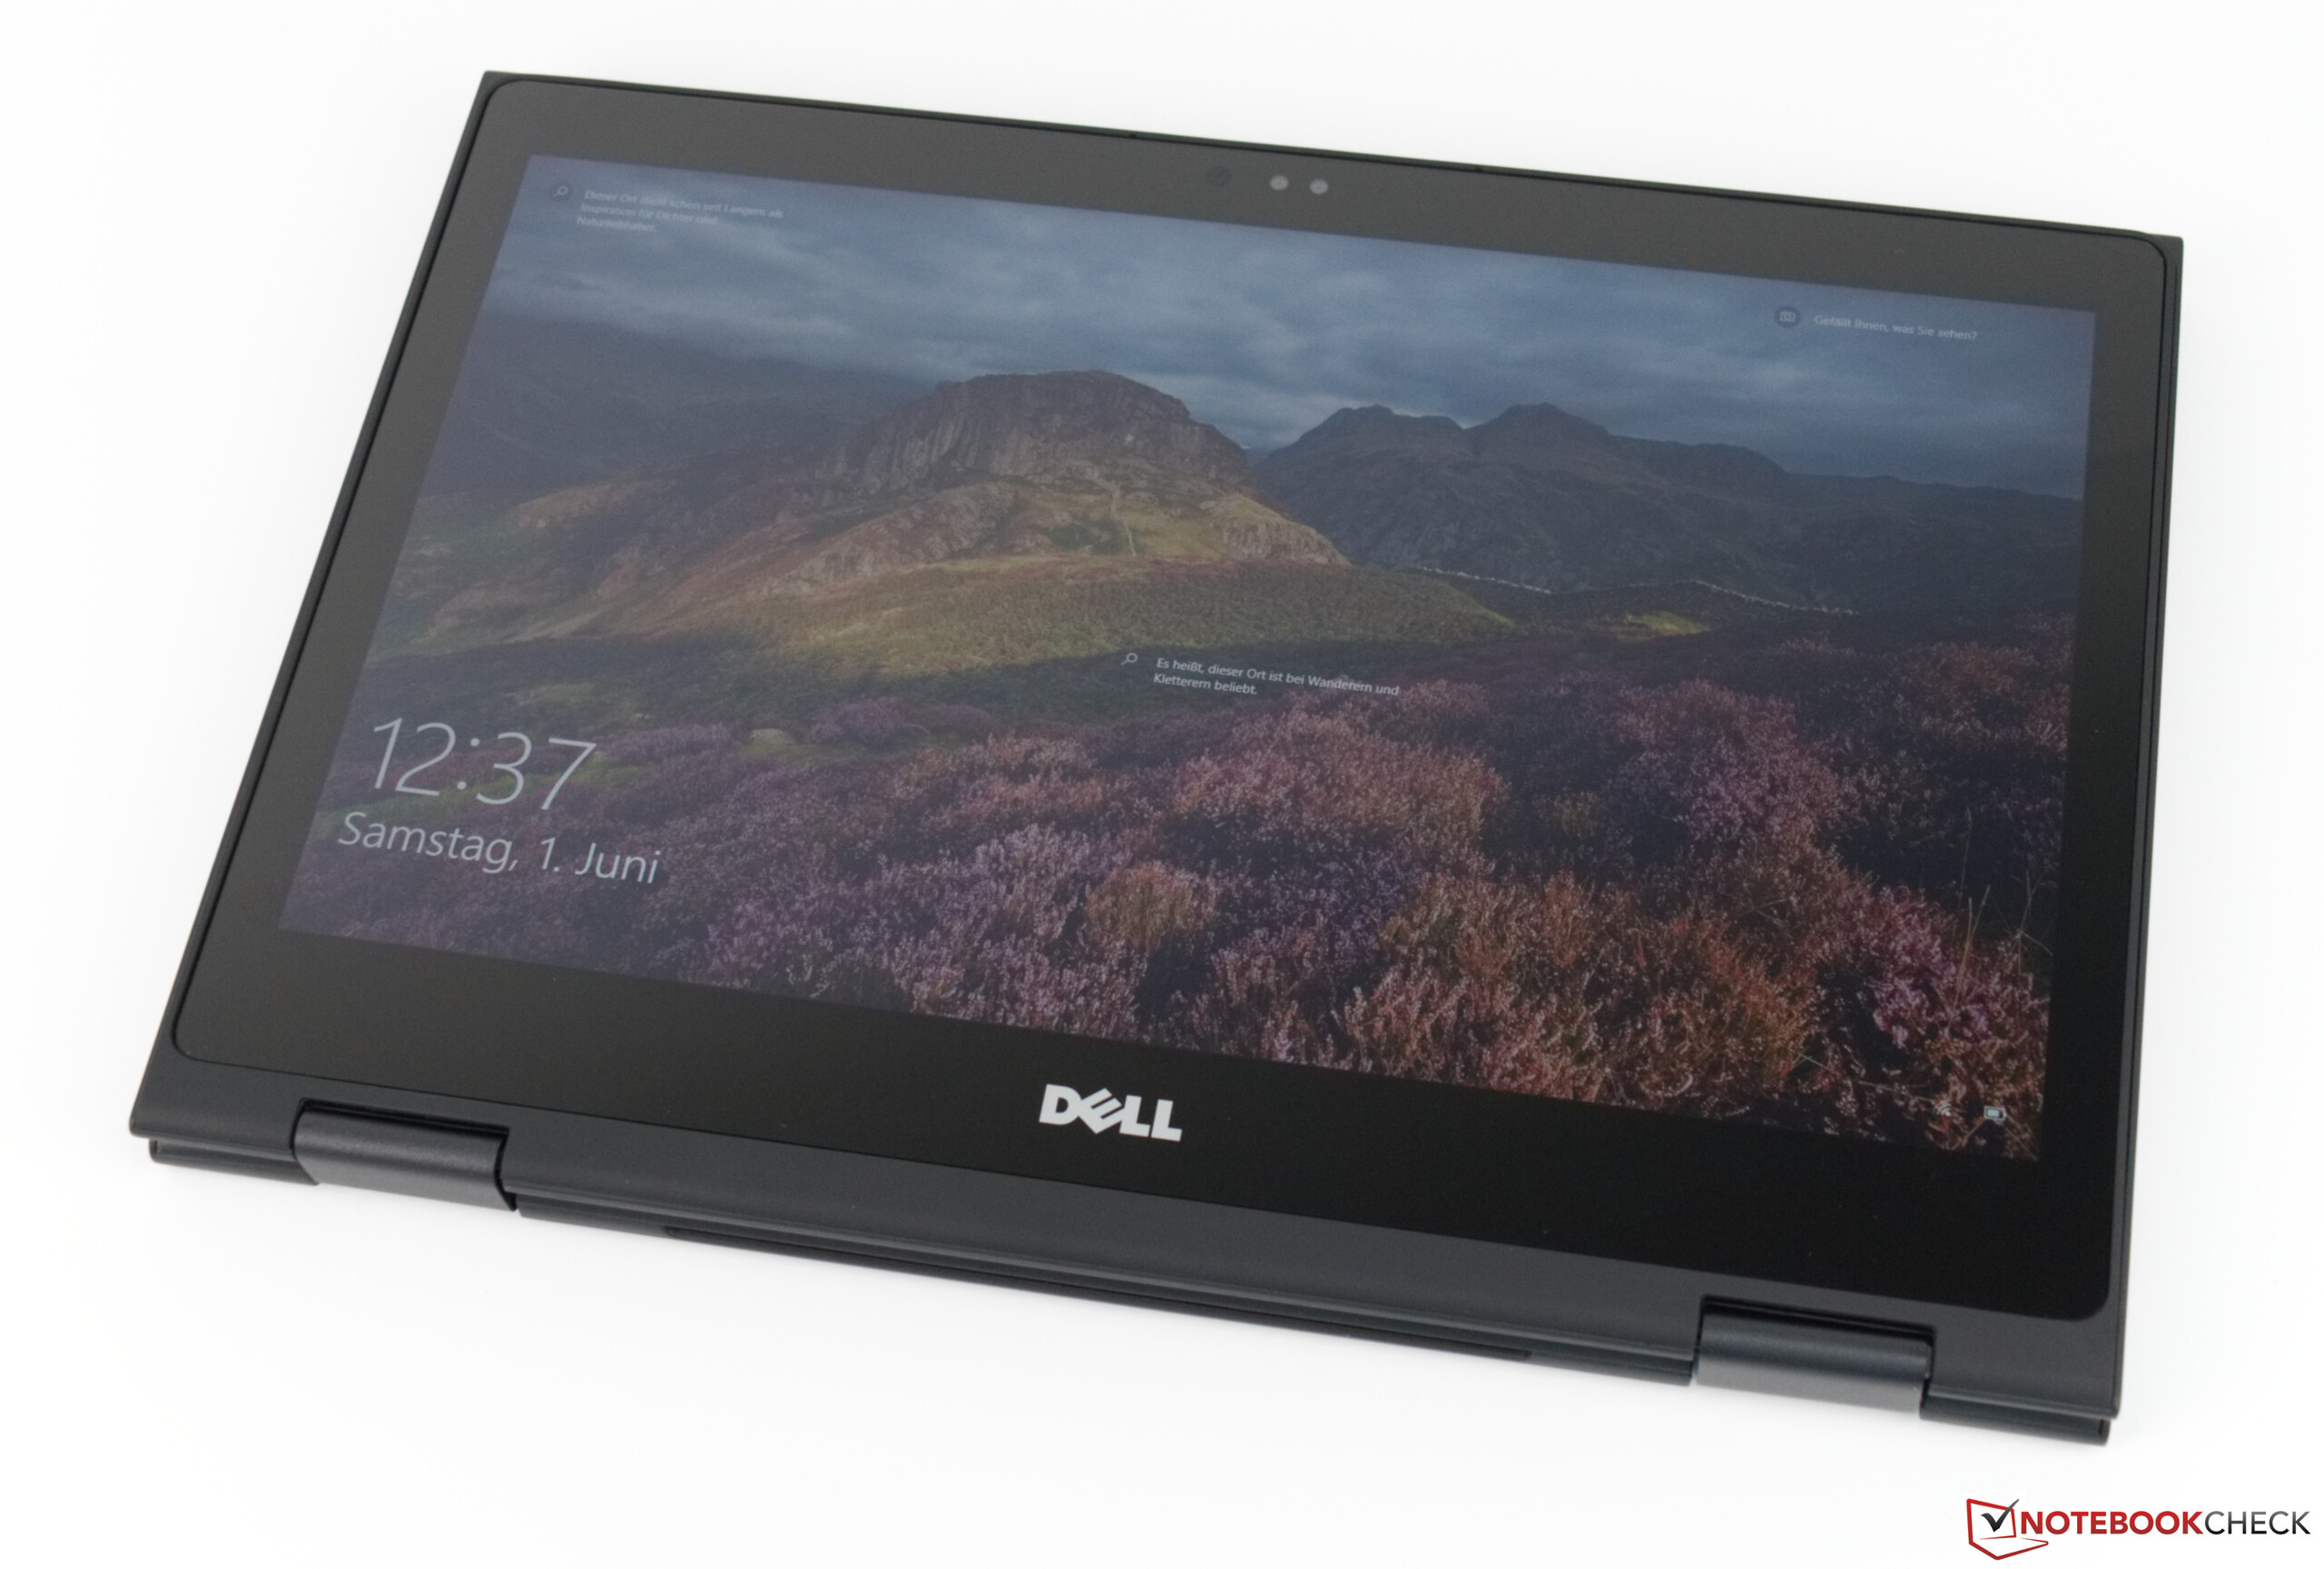
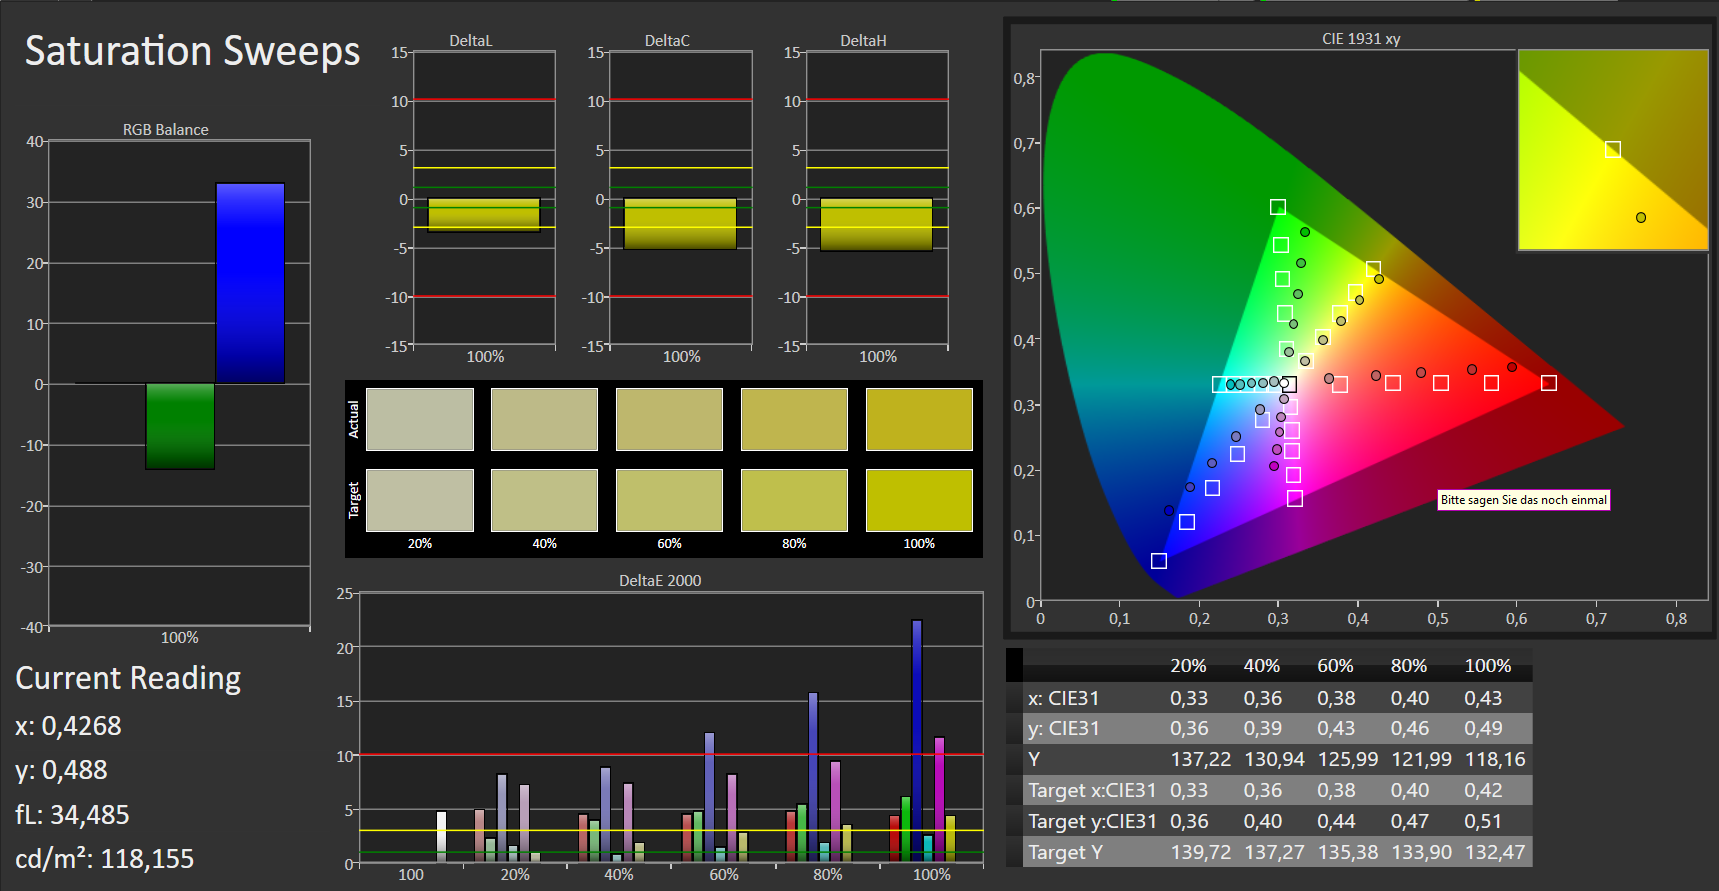
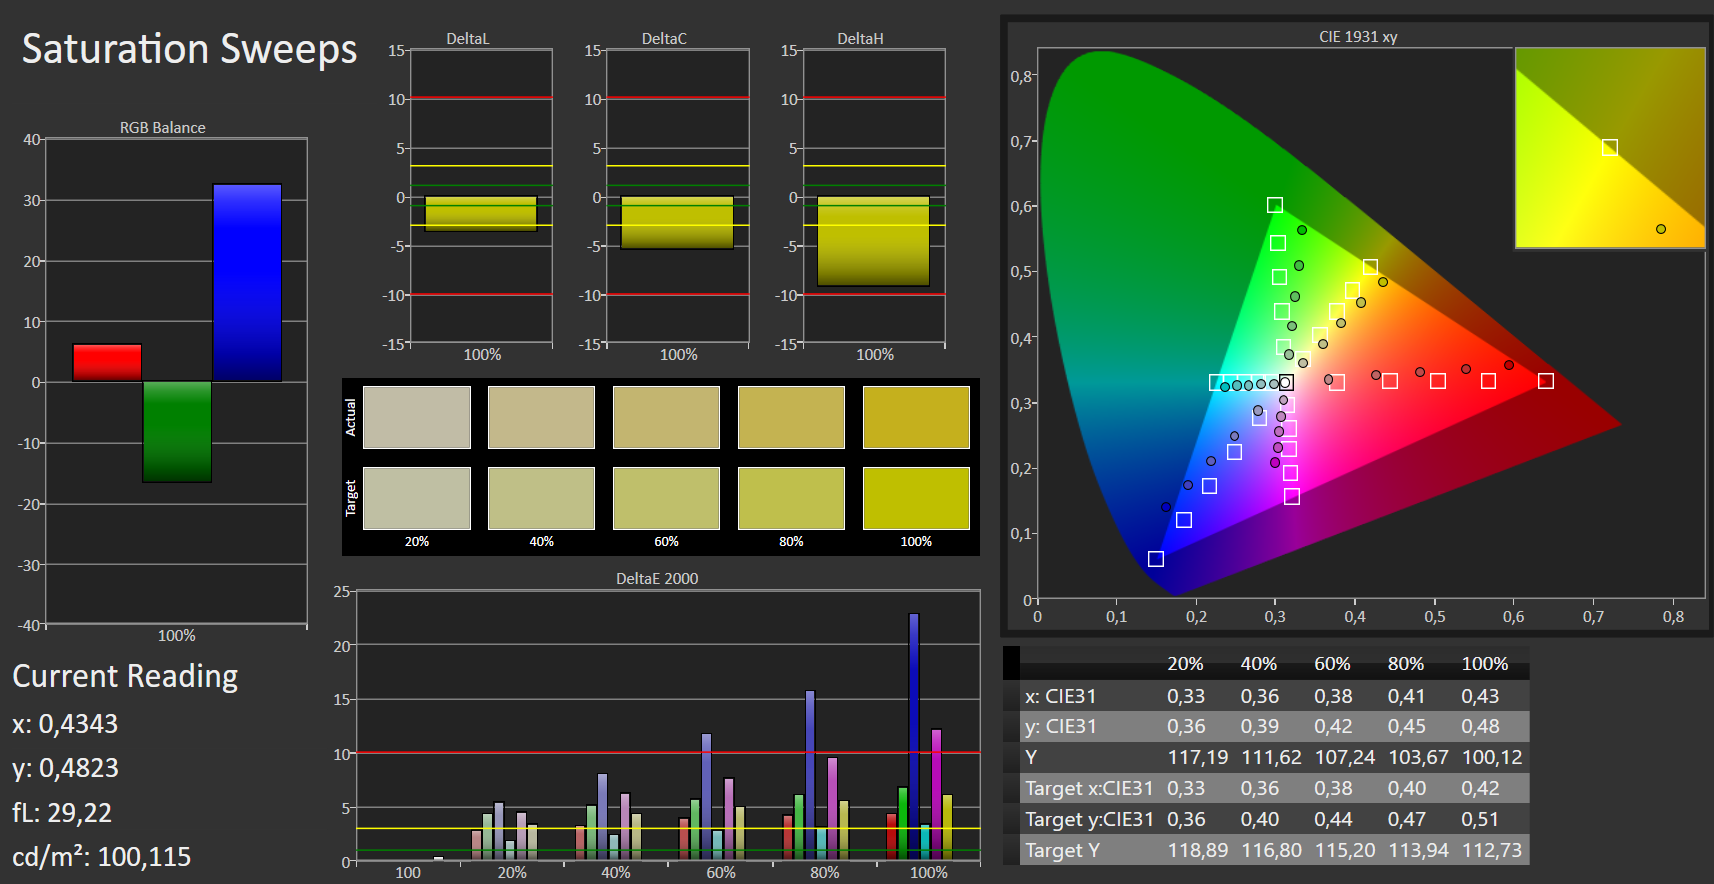
En als we het daar toch over hebben, het beeldscherm is een van de grote teleurstellingen van de Latitude 3390. Het is simpelweg te donker, waardoor buiten werken erg lastig wordt. Ook het kleurbereik is naar onze mening te laag voor een zakelijk notebook.
De Dell Latitude 3390 laat een dubbel gevoel achter. Het heeft geen unieke verkoopargumenten en voldoet niet helemaal aan de verwachtingen van een zakelijke convertible.
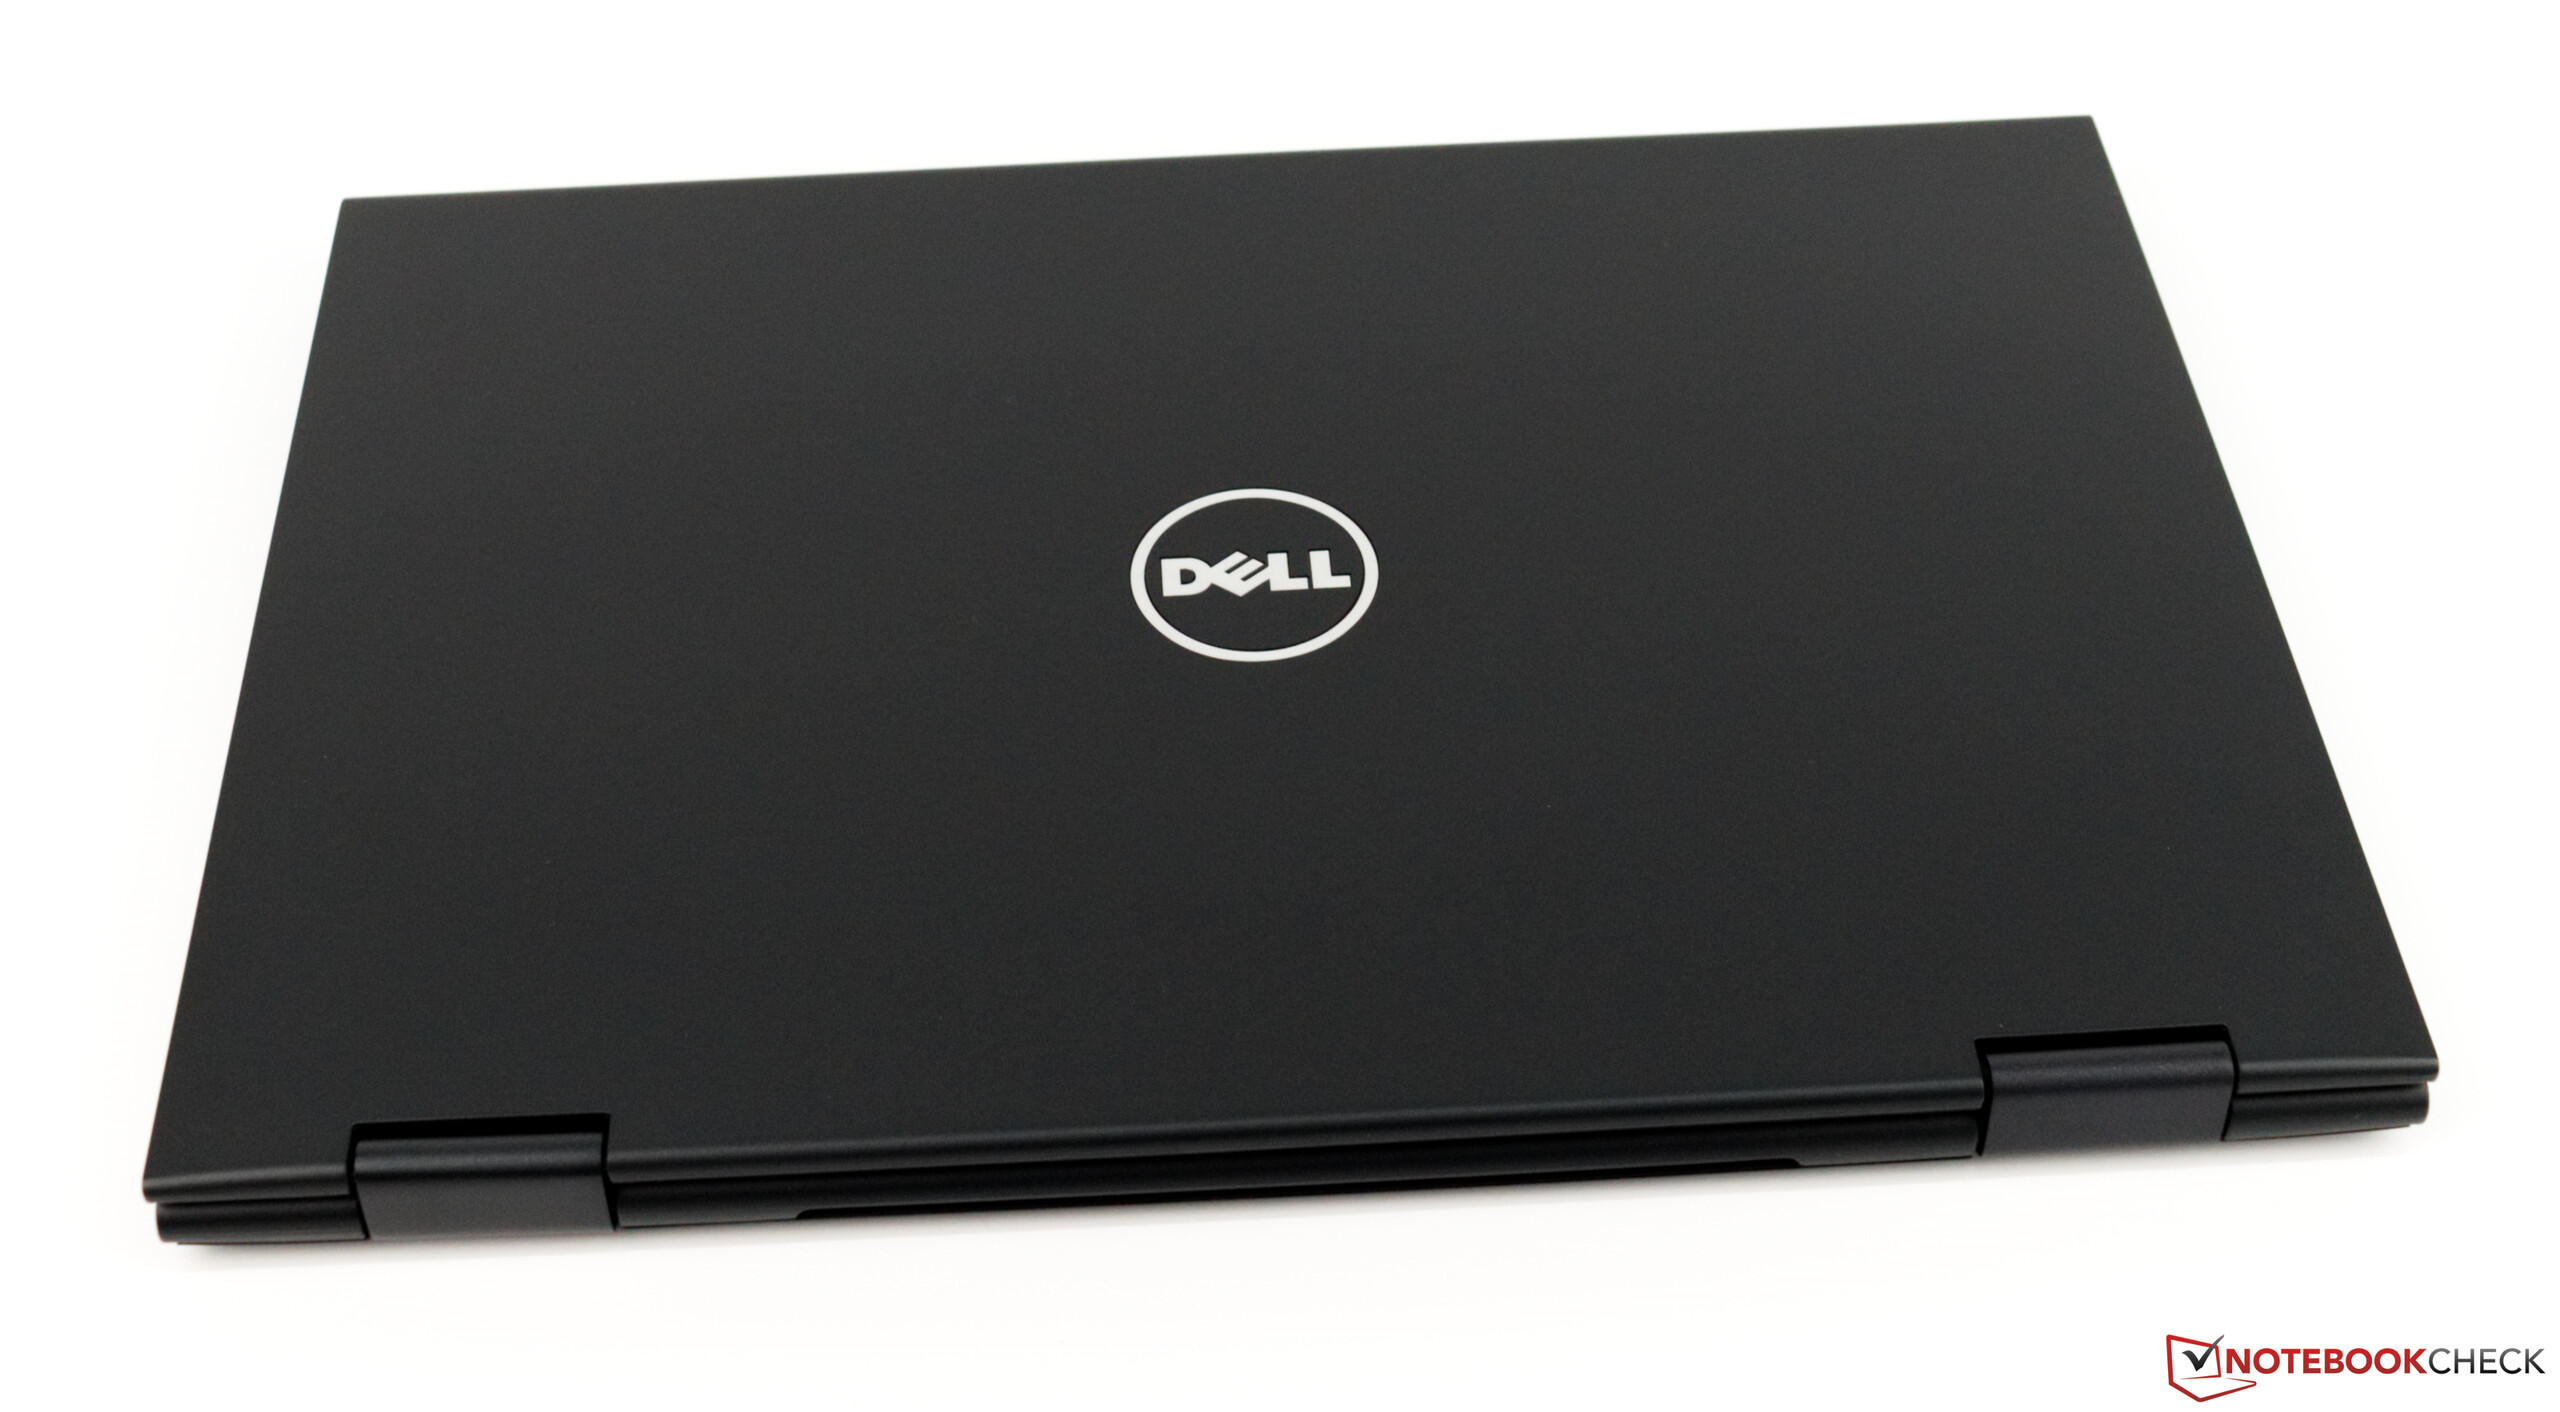
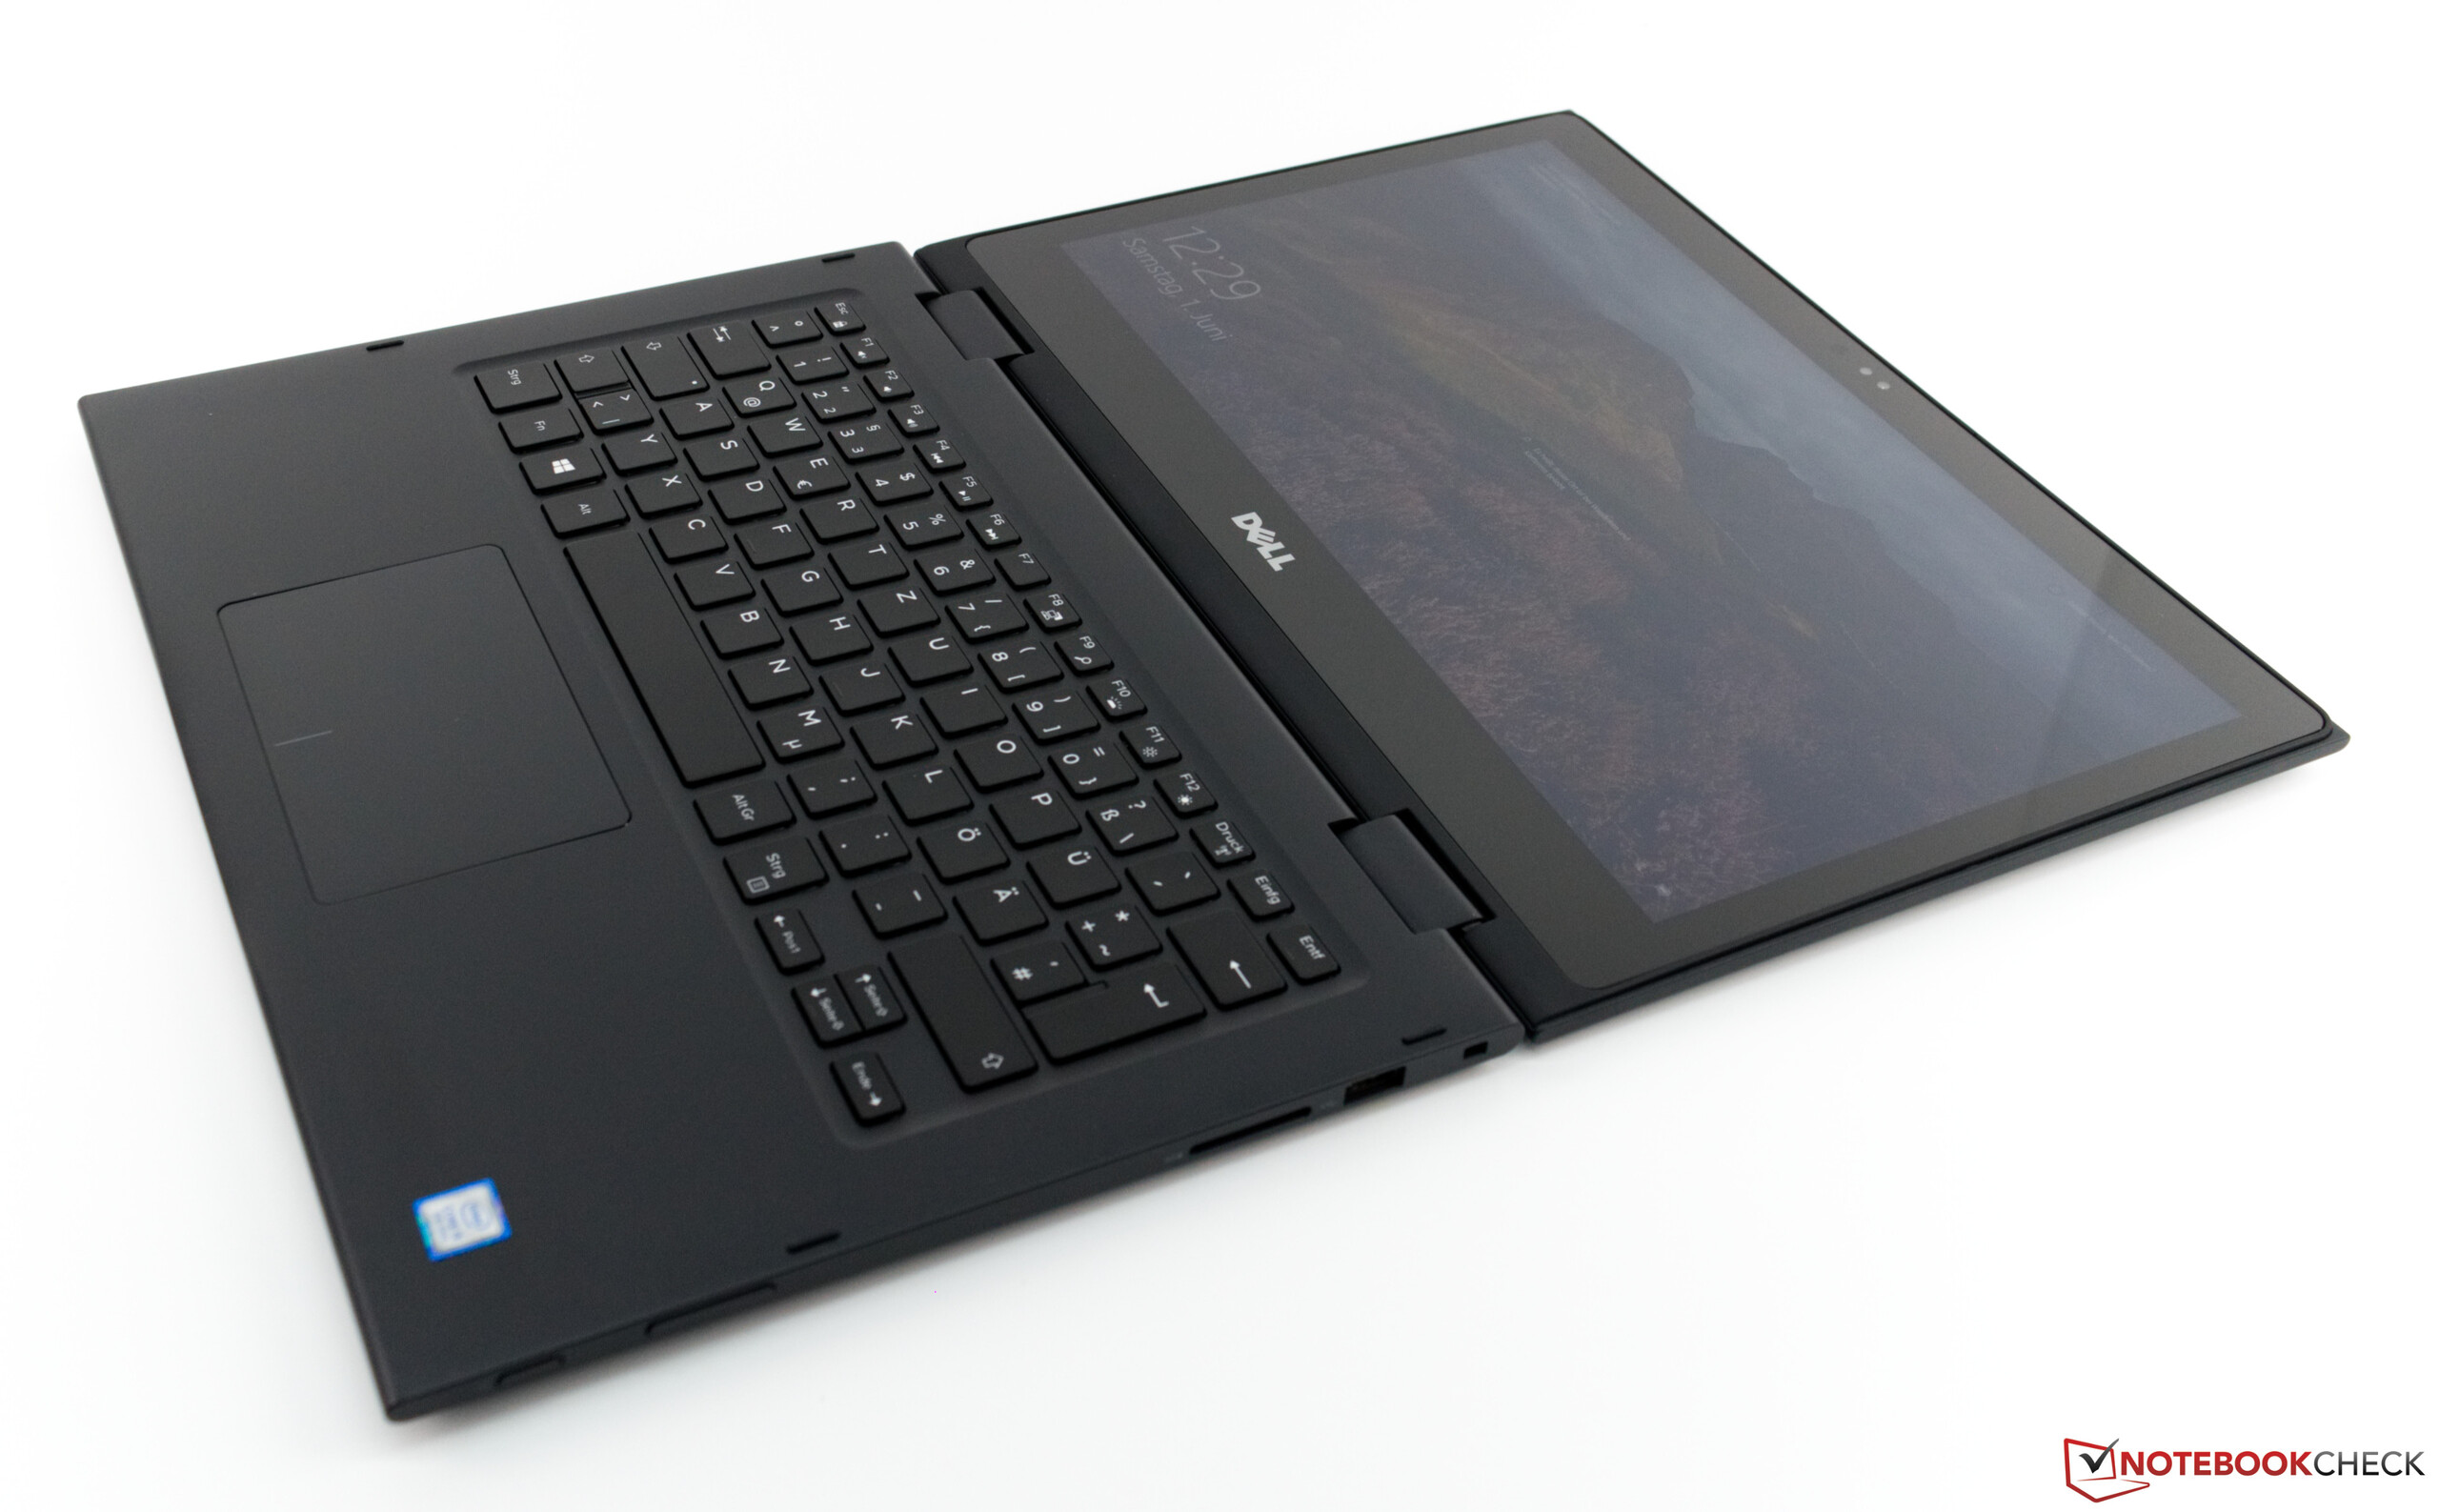
Er zijn ook pluspunten te benoemen. Dell heeft de Latitude 3390 gemaakt van gerecycled carbon fiber waardoor ons testmodel erg stevig aanvoelt. En tegelijkertijd wordt het gewicht onder de 1.6 kg gehouden. Het touchscherm, touchpad en toetsenbord zijn ook allen goed, hoewel deze laatste niet kan tippen aan de ThinkPad concurrentie. De Latitude 3390 is ook erg energiezuinig en heeft goede luidsprekers, maar dat zal waarschijnlijk vergeten worden zodra de minpunten van het beeldscherm opgemerkt worden.
The Dell Latitude 3390 is a reasonably priced 13.3-inch business convertible. Our review unit comes with an Intel Core i5-8250U processor, 8 GB of RAM and a 256 GB SSD, which makes it well equipped for its 999-Euro (~$1,130) retail price. In short, the Latitude 3390 in the configuration that we tested is comparatively cheap for a business device and is a decent alternative to consumer-grade laptops for private buyers too.
Unfortunately, the device lacks important business features like optional LTE connectivity and security features like a fingerprint sensor. Hence, the Latitude 3390 will probably prove an unattractive option for professionals.
The quad-core Core i5-8250U is powerful enough for most demanding tasks though, as is the 8 GB of RAM. However, they are not future-proofed and give the impression that Dell has brought the Latitude 3390 to market a year late. The design compounds this view too. The simple design will look elegant to some people, but the wide display bezels look outdated. Dell could have easily equipped the Latitude 3390 with a 14-inch panel within the same chassis.
While we are on the subject, the display is one of the big let-downs of the Latitude 3390. It is simply too dark, making outdoor use a chore. Likewise, the colour-space coverage is too low for a business device in our opinion.
The Dell Latitude 3390 leaves an ambiguous impression. It has no unique selling point and does not meet expectations of what a business convertible should be.
It is not all bad news though. Dell has built the Latitude 3390 with recycled carbon fibre, which makes our review unit feel sturdy. At the same time, it keeps the overall weight below 1.6 kg. The touchscreen, trackpad and keyboard are decent too, although the latter is not in the same league as its ThinkPad competitors. The Latitude 3390 is impressively energy-efficient too and has full-bodied speakers, but these are likely to be forgotten when people experience its display.
Dell Latitude 13 3390
- 11-06-2019 v6 (old)
Sebastian Bade
Price comparison
