Kort testrapport Lenovo Yoga C940-15IRH Convertible Review: De XPS 15 2-in-1 die Dell had moeten maken
Evaluatie | Datum | Model | Gewicht | Hoogte | Formaat | Resolutie | Beste prijs |
|---|---|---|---|---|---|---|---|
| 86 % v7 (old) | 12-2019 | Lenovo Yoga C940-15IRH i7-9750H, GeForce GTX 1650 Max-Q | 2 kg | 19.7 mm | 15.60" | 1920x1080 | |
| 87.8 % v7 (old) | 08-2019 | Dell XPS 15 7590 9980HK GTX 1650 i9-9980HK, GeForce GTX 1650 Mobile | 2 kg | 17 mm | 15.60" | 3840x2160 | |
| 83.1 % v7 (old) | 10-2019 | Asus ZenBook 15 UX534FT-DB77 i7-8565U, GeForce GTX 1650 Max-Q | 1.7 kg | 18.9 mm | 15.60" | 1920x1080 | |
| 83.9 % v7 (old) | 08-2019 | HP Gaming Pavilion 15-dk0009ng i7-9750H, GeForce GTX 1660 Ti Max-Q | 2.4 kg | 23.4 mm | 15.60" | 1920x1080 | |
| 85.2 % v7 (old) | 11-2019 | MSI Prestige 15 A10SC i7-10710U, GeForce GTX 1650 Max-Q | 1.7 kg | 16 mm | 15.60" | 3840x2160 |
| Networking | |
| iperf3 transmit AX12 | |
| MSI Prestige 15 A10SC | |
| Dell XPS 15 7590 9980HK GTX 1650 | |
| Asus ZenBook 15 UX534FT-DB77 | |
| iperf3 receive AX12 | |
| MSI Prestige 15 A10SC | |
| Asus ZenBook 15 UX534FT-DB77 | |
| Dell XPS 15 7590 9980HK GTX 1650 | |
| |||||||||||||||||||||||||
Helderheidsverdeling: 82 %
Helderheid in Batterij-modus: 484.8 cd/m²
Contrast: 1865:1 (Zwart: 0.26 cd/m²)
ΔE ColorChecker Calman: 4.5 | ∀{0.5-29.43 Ø4.73}
calibrated: 1.19
ΔE Greyscale Calman: 5.7 | ∀{0.09-98 Ø4.97}
92.8% sRGB (Argyll 1.6.3 3D)
58.7% AdobeRGB 1998 (Argyll 1.6.3 3D)
63.6% AdobeRGB 1998 (Argyll 3D)
92.7% sRGB (Argyll 3D)
61.5% Display P3 (Argyll 3D)
Gamma: 2.45
CCT: 6101 K
| Lenovo Yoga C940-15IRH LG Philips LP156WFC-SPU1, IPS, 15.6", 1920x1080 | Dell XPS 15 7590 9980HK GTX 1650 Samsung 156WR04, SDCA029, OLED, 15.6", 3840x2160 | Asus ZenBook 15 UX534FT-DB77 BOE NV156FHM-N63, IPS, 15.6", 1920x1080 | Lenovo Ideapad 720S-15IKB 81AC001AGE Chi Mei CMN15E8 / N156HCE-EN1 CMN, IPS, 15.6", 1920x1080 | HP Gaming Pavilion 15-dk0009ng LG Philips LGD05FE, IPS, 15.6", 1920x1080 | MSI GP65 Leopard 9SE-225US LG Philips LGD0625, IPS, 15.6", 1920x1080 | HP Spectre x360 15-df0126ng AU Optronics AUO30EB, IPS, 15.6", 3840x2160 | |
|---|---|---|---|---|---|---|---|
| Display | 31% | 1% | 0% | 3% | 4% | 7% | |
| Display P3 Coverage (%) | 61.5 | 88.1 43% | 66.6 8% | 63.6 3% | 64.2 4% | 64.8 5% | 68.1 11% |
| sRGB Coverage (%) | 92.7 | 99.6 7% | 87.7 -5% | 89.4 -4% | 95.1 3% | 96.2 4% | 94.2 2% |
| AdobeRGB 1998 Coverage (%) | 63.6 | 91.8 44% | 64.1 1% | 64.3 1% | 65.8 3% | 66.3 4% | 68.4 8% |
| Response Times | 94% | 12% | 31% | 69% | 76% | -2% | |
| Response Time Grey 50% / Grey 80% * (ms) | 48.4 ? | 2.3 ? 95% | 41.2 ? 15% | 34 ? 30% | 16.4 ? 66% | 9.6 ? 80% | 57 ? -18% |
| Response Time Black / White * (ms) | 36.4 ? | 2.4 ? 93% | 33.2 ? 9% | 25 ? 31% | 10.4 ? 71% | 10.4 ? 71% | 31 ? 15% |
| PWM Frequency (Hz) | 59.5 ? | 25000 ? | |||||
| Screen | -1% | -36% | -12% | 5% | 2% | -16% | |
| Brightness middle (cd/m²) | 484.8 | 421.2 -13% | 312.6 -36% | 332 -32% | 345 -29% | 348.3 -28% | 330 -32% |
| Brightness (cd/m²) | 463 | 417 -10% | 290 -37% | 301 -35% | 324 -30% | 327 -29% | 310 -33% |
| Brightness Distribution (%) | 82 | 94 15% | 85 4% | 83 1% | 86 5% | 85 4% | 87 6% |
| Black Level * (cd/m²) | 0.26 | 0.31 -19% | 0.29 -12% | 0.42 -62% | 0.4 -54% | 0.37 -42% | |
| Contrast (:1) | 1865 | 1008 -46% | 1145 -39% | 821 -56% | 871 -53% | 892 -52% | |
| Colorchecker dE 2000 * | 4.5 | 6.06 -35% | 5.78 -28% | 3.73 17% | 1.3 71% | 1.6 64% | 4.03 10% |
| Colorchecker dE 2000 max. * | 7.55 | 11.89 -57% | 8.86 -17% | 6.6 13% | 2.8 63% | 5.07 33% | 6.74 11% |
| Colorchecker dE 2000 calibrated * | 1.19 | 3.78 -218% | 2 -68% | 1.1 8% | 1 16% | 1.96 -65% | |
| Greyscale dE 2000 * | 5.7 | 2.8 51% | 5.4 5% | 3.96 31% | 1.2 79% | 2.3 60% | 4.49 21% |
| Gamma | 2.45 90% | 2.15 102% | 2.21 100% | 2.4 92% | 2.31 95% | 2.203 100% | 2.57 86% |
| CCT | 6101 107% | 6235 104% | 7864 83% | 6921 94% | 6476 100% | 6707 97% | 6744 96% |
| Color Space (Percent of AdobeRGB 1998) (%) | 58.7 | 81 38% | 57.1 -3% | 58 -1% | 60.5 3% | 61 4% | 61 4% |
| Color Space (Percent of sRGB) (%) | 92.8 | 99.6 7% | 87.4 -6% | 89 -4% | 94.9 2% | 96 3% | 94 1% |
| Totaal Gemiddelde (Programma / Instellingen) | 41% /
21% | -8% /
-23% | 6% /
-4% | 26% /
13% | 27% /
12% | -4% /
-10% |
* ... kleiner is beter
Responstijd Scherm
| ↔ Responstijd Zwart naar Wit | ||
|---|---|---|
| 36.4 ms ... stijging ↗ en daling ↘ gecombineerd | ↗ 21.2 ms stijging | 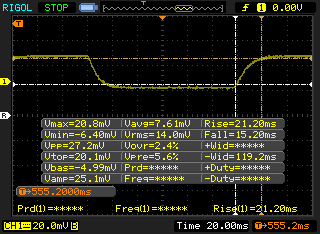 |
| ↘ 15.2 ms daling | ||
| Het scherm vertoonde trage responstijden in onze tests en is misschien te traag voor games. Ter vergelijking: alle testtoestellen variëren van 0.1 (minimum) tot 240 (maximum) ms. » 95 % van alle toestellen zijn beter. Dit betekent dat de gemeten responstijd slechter is dan het gemiddelde (19.9 ms) van alle geteste toestellen. | ||
| ↔ Responstijd 50% Grijs naar 80% Grijs | ||
| 48.4 ms ... stijging ↗ en daling ↘ gecombineerd | ↗ 24.4 ms stijging | 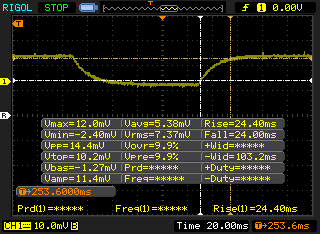 |
| ↘ 24 ms daling | ||
| Het scherm vertoonde trage responstijden in onze tests en is misschien te traag voor games. Ter vergelijking: alle testtoestellen variëren van 0.165 (minimum) tot 636 (maximum) ms. » 84 % van alle toestellen zijn beter. Dit betekent dat de gemeten responstijd slechter is dan het gemiddelde (31.1 ms) van alle geteste toestellen. | ||
Screen Flickering / PWM (Pulse-Width Modulation)
| Screen flickering / PWM niet waargenomen | 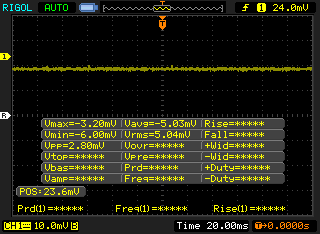 | ||
Ter vergelijking: 52 % van alle geteste toestellen maakten geen gebruik van PWM om de schermhelderheid te verlagen. Als het wel werd gebruikt, werd een gemiddelde van 7798 (minimum: 5 - maximum: 343500) Hz waargenomen. | |||
| PCMark 8 Home Score Accelerated v2 | 4069 punten | |
| PCMark 8 Work Score Accelerated v2 | 5359 punten | |
| PCMark 10 Score | 4887 punten | |
Help | ||
| Lenovo Yoga C940-15IRH Intel Optane Memory H10 with Solid State Storage 32GB + 512GB HBRPEKNX0202A(L/H) | Dell XPS 15 7590 9980HK GTX 1650 Toshiba XG6 KXG60ZNV1T02 | Asus ZenBook 15 UX534FT-DB77 Samsung SSD PM981 MZVLB1T0HALR | Lenovo Ideapad 720S-15IKB 81AC001AGE Samsung SSD PM981 MZVLB512HAJQ | HP Gaming Pavilion 15-dk0009ng Samsung SSD PM981 MZVLB256HAHQ | MSI GP65 Leopard 9SE-225US Toshiba KBG30ZMT512G | |
|---|---|---|---|---|---|---|
| AS SSD | 99% | 75% | 139% | 27% | -17% | |
| Seq Read (MB/s) | 769 | 1723 124% | 1887 145% | 2469 221% | 2088 172% | 1307 70% |
| Seq Write (MB/s) | 351.1 | 1386 295% | 1432 308% | 1991 467% | 1347 284% | 730 108% |
| 4K Read (MB/s) | 69.1 | 43.25 -37% | 52.3 -24% | 54.3 -21% | 36.14 -48% | 27.58 -60% |
| 4K Write (MB/s) | 100.9 | 98.3 -3% | 146 45% | 99.8 -1% | 96.5 -4% | 80.3 -20% |
| 4K-64 Read (MB/s) | 472 | 1078 128% | 969 105% | 1823 286% | 565 20% | 878 86% |
| 4K-64 Write (MB/s) | 948 | 1456 54% | 1375 45% | 1282 35% | 588 -38% | 246.8 -74% |
| Access Time Read * (ms) | 0.071 | 0.05 30% | 0.034 52% | 0.042 41% | 0.093 -31% | 0.231 -225% |
| Access Time Write * (ms) | 0.137 | 0.039 72% | 0.075 45% | 0.039 72% | 0.038 72% | 0.223 -63% |
| Score Read (Points) | 618 | 1294 109% | 1210 96% | 2125 244% | 810 31% | 1036 68% |
| Score Write (Points) | 1084 | 1693 56% | 1664 54% | 1581 46% | 819 -24% | 400 -63% |
| Score Total (Points) | 2024 | 3638 80% | 3483 72% | 4771 136% | 2014 0% | 1940 -4% |
| Copy ISO MB/s (MB/s) | 839 | 3182 279% | 1375 64% | 1043 24% | 993 18% | |
| Copy Program MB/s (MB/s) | 455.8 | 984 116% | 468 3% | 371.7 -18% | 309.5 -32% | |
| Copy Game MB/s (MB/s) | 969 | 1824 88% | 1287 33% | 399.9 -59% | 582 -40% | |
| CrystalDiskMark 5.2 / 6 | 50% | 63% | 59% | 14% | -26% | |
| Write 4K (MB/s) | 102.2 | 104.3 2% | 141.6 39% | 139.3 36% | 100 -2% | 99.3 -3% |
| Read 4K (MB/s) | 114.3 | 45.23 -60% | 45.28 -60% | 46.78 -59% | 31.39 -73% | 46.96 -59% |
| Write Seq (MB/s) | 468.3 | 1729 269% | 1975 322% | 2125 354% | 1308 179% | |
| Read Seq (MB/s) | 1236 | 1861 51% | 2272 84% | 2354 90% | 1083 -12% | |
| Write 4K Q32T1 (MB/s) | 556 | 509 -8% | 458.6 -18% | 298.4 -46% | 362.9 -35% | 240.1 -57% |
| Read 4K Q32T1 (MB/s) | 421.6 | 388.5 -8% | 391.4 -7% | 355.8 -16% | 425.7 1% | 581 38% |
| Write Seq Q32T1 (MB/s) | 1264 | 2813 123% | 2393 89% | 2128 68% | 1411 12% | 686 -46% |
| Read Seq Q32T1 (MB/s) | 2239 | 2906 30% | 3464 55% | 3324 48% | 3240 45% | 1581 -29% |
| Write 4K Q8T8 (MB/s) | 268.1 | |||||
| Read 4K Q8T8 (MB/s) | 977 | |||||
| Totaal Gemiddelde (Programma / Instellingen) | 75% /
81% | 69% /
70% | 99% /
105% | 21% /
23% | -22% /
-19% |
* ... kleiner is beter

| 3DMark 11 Performance | 11952 punten | |
| 3DMark Cloud Gate Standard Score | 29013 punten | |
| 3DMark Fire Strike Score | 7717 punten | |
| 3DMark Time Spy Score | 3494 punten | |
Help | ||
| Shadow of the Tomb Raider | |
| 1280x720 Lowest Preset | |
| Corsair One i160 | |
| Eurocom Nightsky RX15 | |
| MSI GE75 9SG | |
| MSI RTX 2060 Gaming Z 6G | |
| Walmart EVOO Gaming 17 | |
| Gainward GeForce GTX 1650 4 GB | |
| Gemiddeld NVIDIA GeForce GTX 1650 Max-Q (92 - 151, n=5) | |
| MSI Prestige 15 A10SC | |
| Asus Zephyrus S GX531GM | |
| Dell XPS 15 7590 9980HK GTX 1650 | |
| Lenovo Yoga C940-15IRH | |
| Lenovo ThinkPad X1 Extreme-20MF000XGE | |
| MSI GE63 Raider 8SG | |
| Asus TUF FX705GE-EW096T | |
| Asus ROG Zephyrus G15 GA502DU | |
| Dell XPS 13 7390 2-in-1 Core i7 | |
| 1920x1080 Highest Preset AA:T | |
| Corsair One i160 | |
| MSI GE75 9SG | |
| Eurocom Nightsky RX15 | |
| MSI RTX 2060 Gaming Z 6G | |
| Walmart EVOO Gaming 17 | |
| MSI GE63 Raider 8SG | |
| Asus ROG Zephyrus G15 GA502DU | |
| Lenovo Yoga C940-15IRH | |
| Gainward GeForce GTX 1650 4 GB | |
| Asus Zephyrus S GX531GM | |
| Gemiddeld NVIDIA GeForce GTX 1650 Max-Q (33 - 45, n=6) | |
| MSI Prestige 15 A10SC | |
| Dell XPS 15 7590 9980HK GTX 1650 | |
| Asus TUF FX705GE-EW096T | |
| Lenovo ThinkPad X1 Extreme-20MF000XGE | |
| lage | gem. | hoge | ultra | |
|---|---|---|---|---|
| BioShock Infinite (2013) | 317.2 | 231.2 | 215.2 | 84.3 |
| The Witcher 3 (2015) | 196 | 119.8 | 65.1 | 36.5 |
| Rocket League (2017) | 247.2 | 222.4 | 145.6 | |
| Shadow of the Tomb Raider (2018) | 105 | 58 | 51 | 45 |
| Lenovo Yoga C940-15IRH GeForce GTX 1650 Max-Q, i7-9750H, Intel Optane Memory H10 with Solid State Storage 32GB + 512GB HBRPEKNX0202A(L/H) | Dell XPS 15 7590 9980HK GTX 1650 GeForce GTX 1650 Mobile, i9-9980HK, Toshiba XG6 KXG60ZNV1T02 | Asus ZenBook 15 UX534FT-DB77 GeForce GTX 1650 Max-Q, i7-8565U, Samsung SSD PM981 MZVLB1T0HALR | Lenovo Ideapad 720S-15IKB 81AC001AGE GeForce GTX 1050 Ti Max-Q, i7-7700HQ, Samsung SSD PM981 MZVLB512HAJQ | HP Gaming Pavilion 15-dk0009ng GeForce GTX 1660 Ti Max-Q, i7-9750H, Samsung SSD PM981 MZVLB256HAHQ | MSI GP65 Leopard 9SE-225US GeForce RTX 2060 Mobile, i7-9750H, Toshiba KBG30ZMT512G | |
|---|---|---|---|---|---|---|
| Noise | -1% | 7% | 0% | 8% | -0% | |
| uit / omgeving * (dB) | 28.7 | 28.2 2% | 28.4 1% | 30.3 -6% | 28.2 2% | 28.2 2% |
| Idle Minimum * (dB) | 28.7 | 28.2 2% | 28.4 1% | 30.3 -6% | 29.3 -2% | 29.5 -3% |
| Idle Average * (dB) | 28.8 | 28.2 2% | 28.4 1% | 30.3 -5% | 29.3 -2% | 29.6 -3% |
| Idle Maximum * (dB) | 28.8 | 30.4 -6% | 28.4 1% | 30.3 -5% | 29.3 -2% | 29.6 -3% |
| Load Average * (dB) | 45 | 43.8 3% | 33.9 25% | 39.3 13% | 32.3 28% | 33 27% |
| Witcher 3 ultra * (dB) | 44.7 | 47.2 -6% | 39.8 11% | 34 24% | 47.2 -6% | |
| Load Maximum * (dB) | 44.7 | 47.2 -6% | 40.2 10% | 39.6 11% | 41.2 8% | 52 -16% |
* ... kleiner is beter
Geluidsniveau
| Onbelast |
| 28.7 / 28.8 / 28.8 dB (A) |
| Belasting |
| 45 / 44.7 dB (A) |
 | ||
30 dB stil 40 dB(A) hoorbaar 50 dB(A) luid |
||
min: | ||
(-) De maximumtemperatuur aan de bovenzijde bedraagt 46.2 °C / 115 F, vergeleken met het gemiddelde van 36.8 °C / 98 F, variërend van 21 tot 71 °C voor de klasse Multimedia.
(±) De bodem warmt op tot een maximum van 45 °C / 113 F, vergeleken met een gemiddelde van 39.1 °C / 102 F
(+) Bij onbelast gebruik bedraagt de gemiddelde temperatuur voor de bovenzijde 23.9 °C / 75 F, vergeleken met het apparaatgemiddelde van 31.3 °C / 88 F.
(±) Bij het spelen van The Witcher 3 is de gemiddelde temperatuur voor de bovenzijde 32 °C / 90 F, vergeleken met het apparaatgemiddelde van 31.3 °C / 88 F.
(+) De palmsteunen en het touchpad zijn met een maximum van ###max## °C / 87.8 F koeler dan de huidtemperatuur en voelen daarom koel aan.
(-) De gemiddelde temperatuur van de handpalmsteun van soortgelijke toestellen bedroeg 28.7 °C / 83.7 F (-2.3 °C / -4.1 F).
Lenovo Yoga C940-15IRH audioanalyse
(+) | luidsprekers kunnen relatief luid spelen (85.3 dB)
Bas 100 - 315 Hz
(±) | verminderde zeebaars - gemiddeld 9.8% lager dan de mediaan
(±) | lineariteit van de lage tonen is gemiddeld (14% delta ten opzichte van de vorige frequentie)
Midden 400 - 2000 Hz
(±) | hogere middens - gemiddeld 6.5% hoger dan de mediaan
(+) | de middentonen zijn lineair (5.1% delta ten opzichte van de vorige frequentie)
Hoog 2 - 16 kHz
(+) | evenwichtige hoogtepunten - slechts 3.4% verwijderd van de mediaan
(±) | lineariteit van de hoogtepunten is gemiddeld (8.5% delta ten opzichte van de vorige frequentie)
Algemeen 100 - 16.000 Hz
(±) | lineariteit van het totale geluid is gemiddeld (17.8% verschil met de mediaan)
Vergeleken met dezelfde klasse
» 52% van alle geteste apparaten in deze klasse waren beter, 7% vergelijkbaar, 41% slechter
» De beste had een delta van 5%, het gemiddelde was 17%, de slechtste was 45%
Vergeleken met alle geteste toestellen
» 36% van alle geteste apparaten waren beter, 8% gelijk, 56% slechter
» De beste had een delta van 4%, het gemiddelde was 24%, de slechtste was 134%
Apple MacBook 12 (Early 2016) 1.1 GHz audioanalyse
(+) | luidsprekers kunnen relatief luid spelen (83.6 dB)
Bas 100 - 315 Hz
(±) | verminderde zeebaars - gemiddeld 11.3% lager dan de mediaan
(±) | lineariteit van de lage tonen is gemiddeld (14.2% delta ten opzichte van de vorige frequentie)
Midden 400 - 2000 Hz
(+) | evenwichtige middens - slechts 2.4% verwijderd van de mediaan
(+) | de middentonen zijn lineair (5.5% delta ten opzichte van de vorige frequentie)
Hoog 2 - 16 kHz
(+) | evenwichtige hoogtepunten - slechts 2% verwijderd van de mediaan
(+) | de hoge tonen zijn lineair (4.5% delta naar de vorige frequentie)
Algemeen 100 - 16.000 Hz
(+) | het totale geluid is lineair (10.2% verschil met de mediaan)
Vergeleken met dezelfde klasse
» 7% van alle geteste apparaten in deze klasse waren beter, 2% vergelijkbaar, 91% slechter
» De beste had een delta van 5%, het gemiddelde was 18%, de slechtste was 53%
Vergeleken met alle geteste toestellen
» 5% van alle geteste apparaten waren beter, 1% gelijk, 94% slechter
» De beste had een delta van 4%, het gemiddelde was 24%, de slechtste was 134%
| Uit / Standby | |
| Inactief | |
| Belasting |
|
Key:
min: | |
| Lenovo Yoga C940-15IRH i7-9750H, GeForce GTX 1650 Max-Q, Intel Optane Memory H10 with Solid State Storage 32GB + 512GB HBRPEKNX0202A(L/H), IPS, 1920x1080, 15.6" | Dell XPS 15 7590 9980HK GTX 1650 i9-9980HK, GeForce GTX 1650 Mobile, Toshiba XG6 KXG60ZNV1T02, OLED, 3840x2160, 15.6" | Asus ZenBook 15 UX534FT-DB77 i7-8565U, GeForce GTX 1650 Max-Q, Samsung SSD PM981 MZVLB1T0HALR, IPS, 1920x1080, 15.6" | HP Gaming Pavilion 15-dk0009ng i7-9750H, GeForce GTX 1660 Ti Max-Q, Samsung SSD PM981 MZVLB256HAHQ, IPS, 1920x1080, 15.6" | MSI GP65 Leopard 9SE-225US i7-9750H, GeForce RTX 2060 Mobile, Toshiba KBG30ZMT512G, IPS, 1920x1080, 15.6" | HP Pavilion Gaming 15-cx0003ng i7-8750H, GeForce GTX 1050 Ti Mobile, Intel Optane 16 GB MEMPEK1J016GAH + HGST HTS721010A9E630 1 TB HDD, IPS, 1920x1080, 15.6" | |
|---|---|---|---|---|---|---|
| Power Consumption | -4% | 7% | -11% | -61% | 9% | |
| Idle Minimum * (Watt) | 5.2 | 6.2 -19% | 5 4% | 6.8 -31% | 13.6 -162% | 5.5 -6% |
| Idle Average * (Watt) | 10.7 | 9.6 10% | 13.2 -23% | 10.7 -0% | 17.9 -67% | 8.5 21% |
| Idle Maximum * (Watt) | 24.3 | 21.2 13% | 24 1% | 12.5 49% | 20.6 15% | 11.9 51% |
| Load Average * (Watt) | 84.4 | 104.3 -24% | 70 17% | 87.2 -3% | 96 -14% | 94 -11% |
| Witcher 3 ultra * (Watt) | 83.9 | 91.7 -9% | 63.3 25% | 121 -44% | 154.6 -84% | 86 -3% |
| Load Maximum * (Watt) | 142.8 | 135.3 5% | 114 20% | 191.4 -34% | 218.6 -53% | 144 -1% |
* ... kleiner is beter
| Lenovo Yoga C940-15IRH i7-9750H, GeForce GTX 1650 Max-Q, 69 Wh | Dell XPS 15 7590 9980HK GTX 1650 i9-9980HK, GeForce GTX 1650 Mobile, 97 Wh | Asus ZenBook 15 UX534FT-DB77 i7-8565U, GeForce GTX 1650 Max-Q, 71 Wh | Lenovo Ideapad 720S-15IKB 81AC001AGE i7-7700HQ, GeForce GTX 1050 Ti Max-Q, 79 Wh | HP Gaming Pavilion 15-dk0009ng i7-9750H, GeForce GTX 1660 Ti Max-Q, 52.5 Wh | MSI GP65 Leopard 9SE-225US i7-9750H, GeForce RTX 2060 Mobile, 51 Wh | Dell XPS 15 9575 i7-8705G i7-8705G, Vega M GL / 870, 75 Wh | |
|---|---|---|---|---|---|---|---|
| Batterijduur | 65% | 65% | 32% | -24% | -39% | -19% | |
| Reader / Idle (h) | 18.2 | 15.2 -16% | 21.5 18% | 22.6 24% | 8.7 -52% | 6 -67% | 11.2 -38% |
| WiFi v1.3 (h) | 9.7 | 7.8 -20% | 8.4 -13% | 9.8 1% | 4.8 -51% | 3.9 -60% | 7 -28% |
| Load (h) | 1 | 3.3 230% | 2.9 190% | 1.7 70% | 1.3 30% | 1.1 10% | 1.1 10% |
| Witcher 3 ultra (h) | 1 |
Pro
Contra
Dit is de verkorte versie van het originele artikel. Het volledige, Engelse testrapport vind je hier.
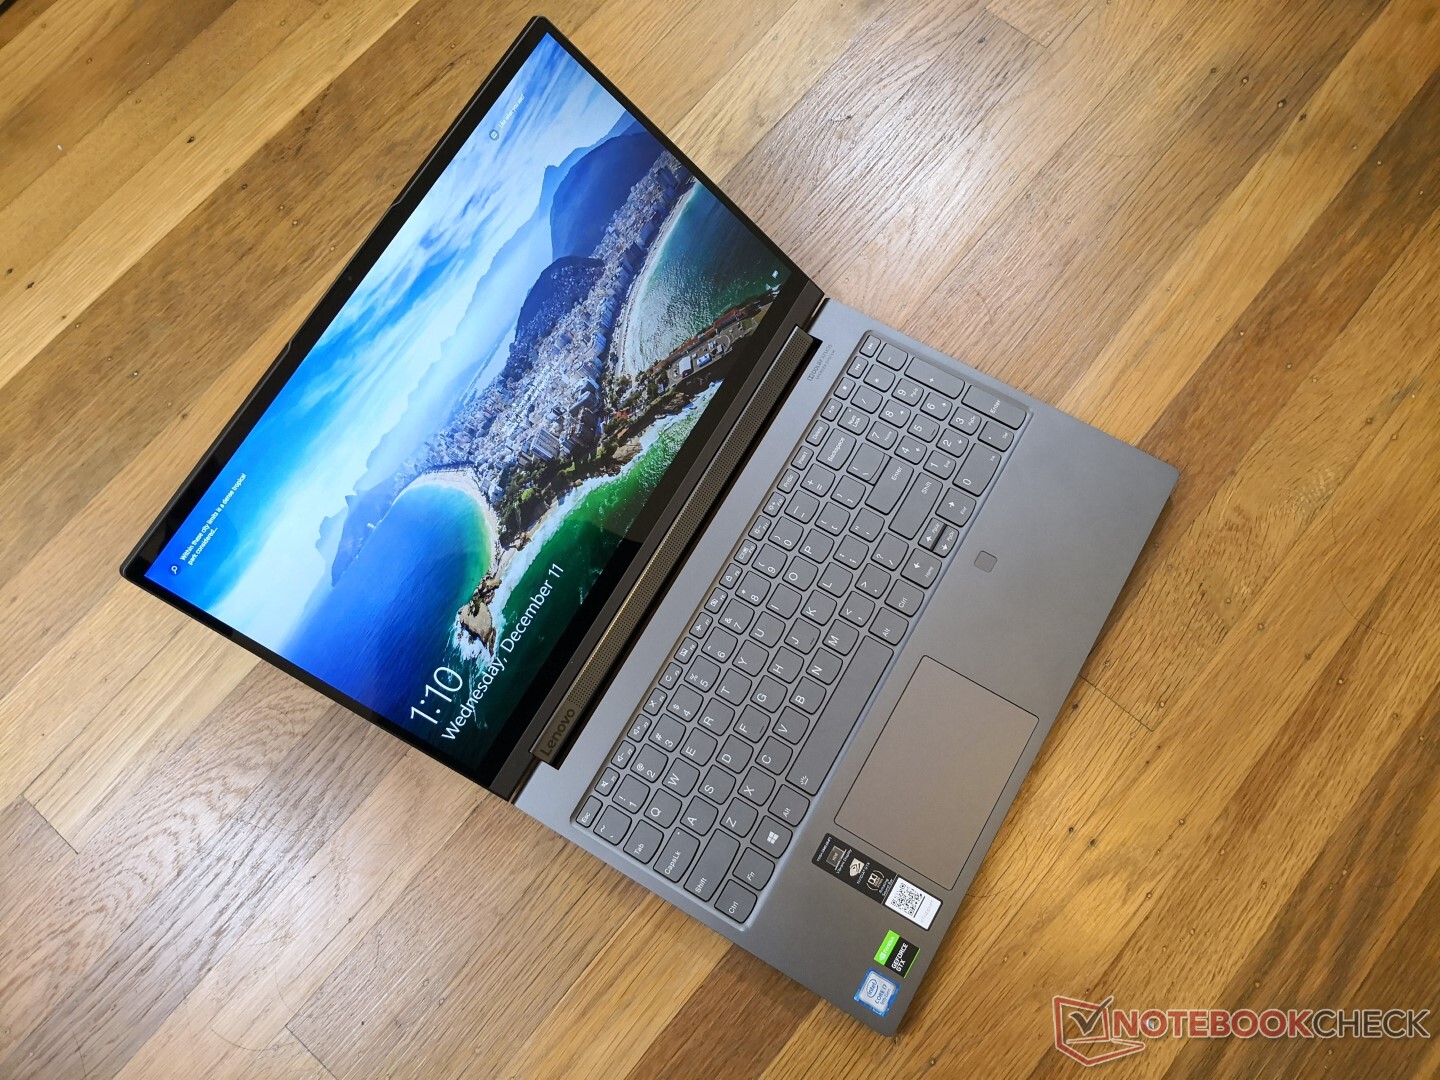
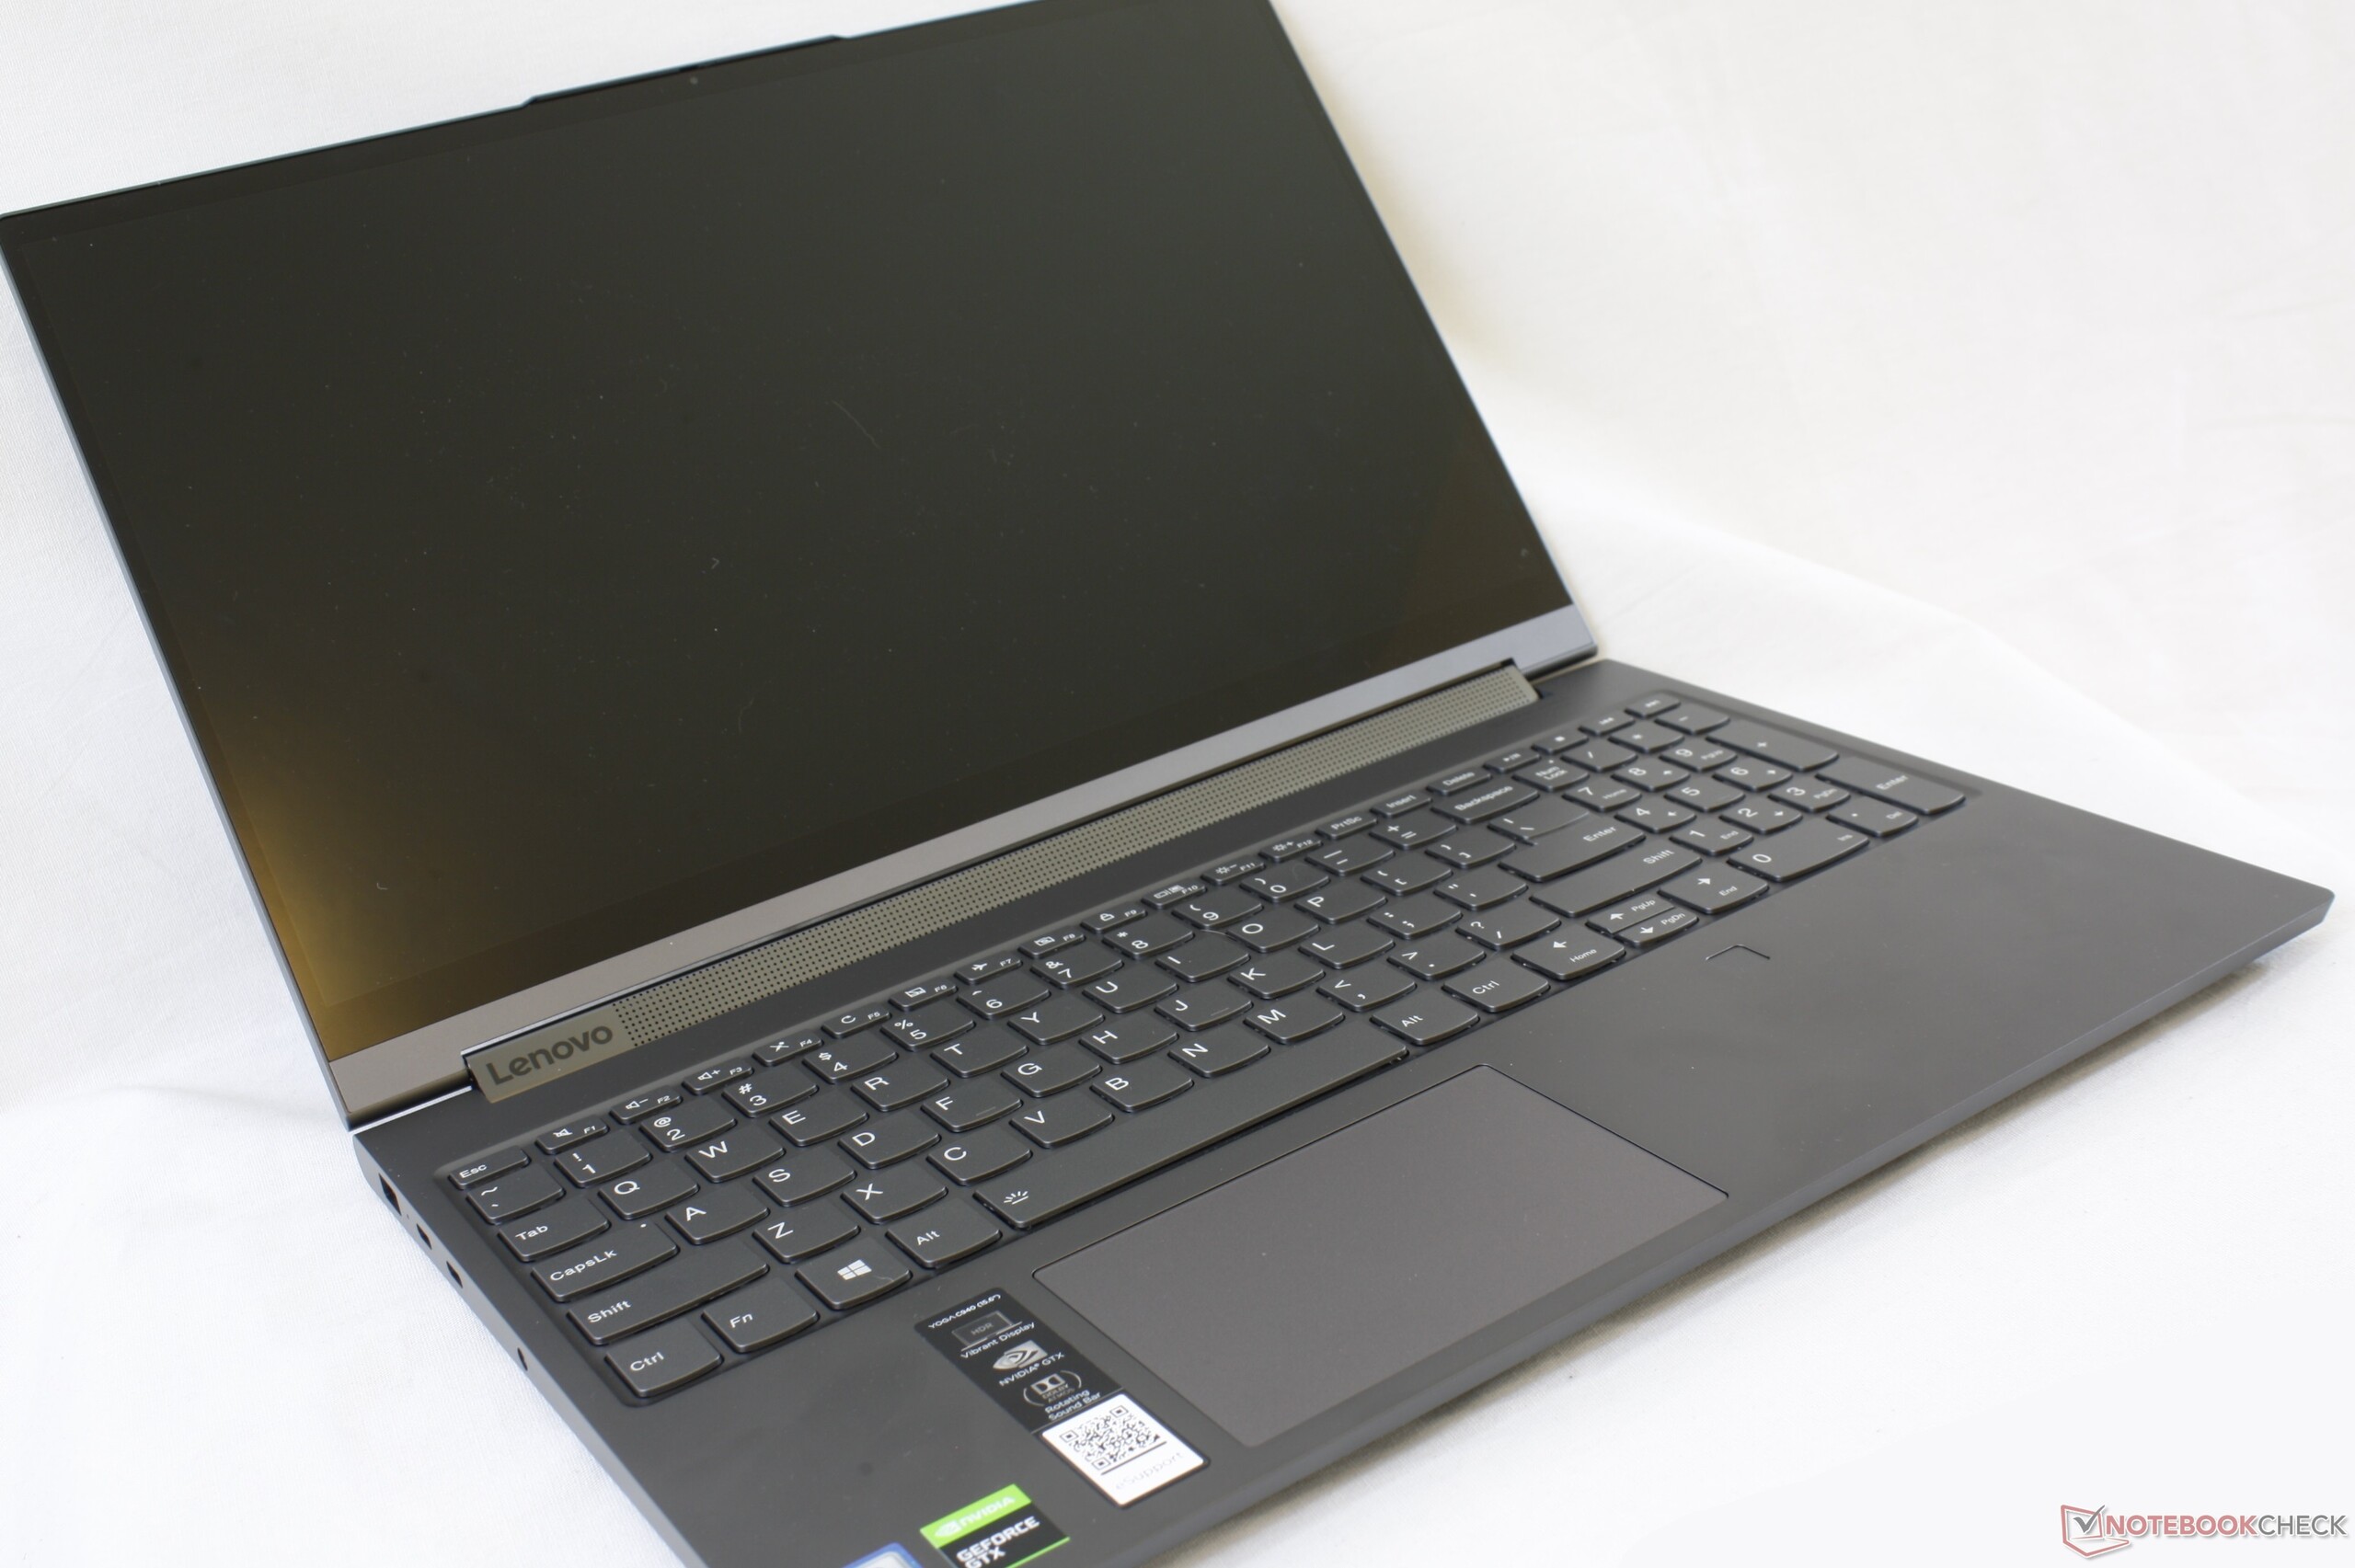
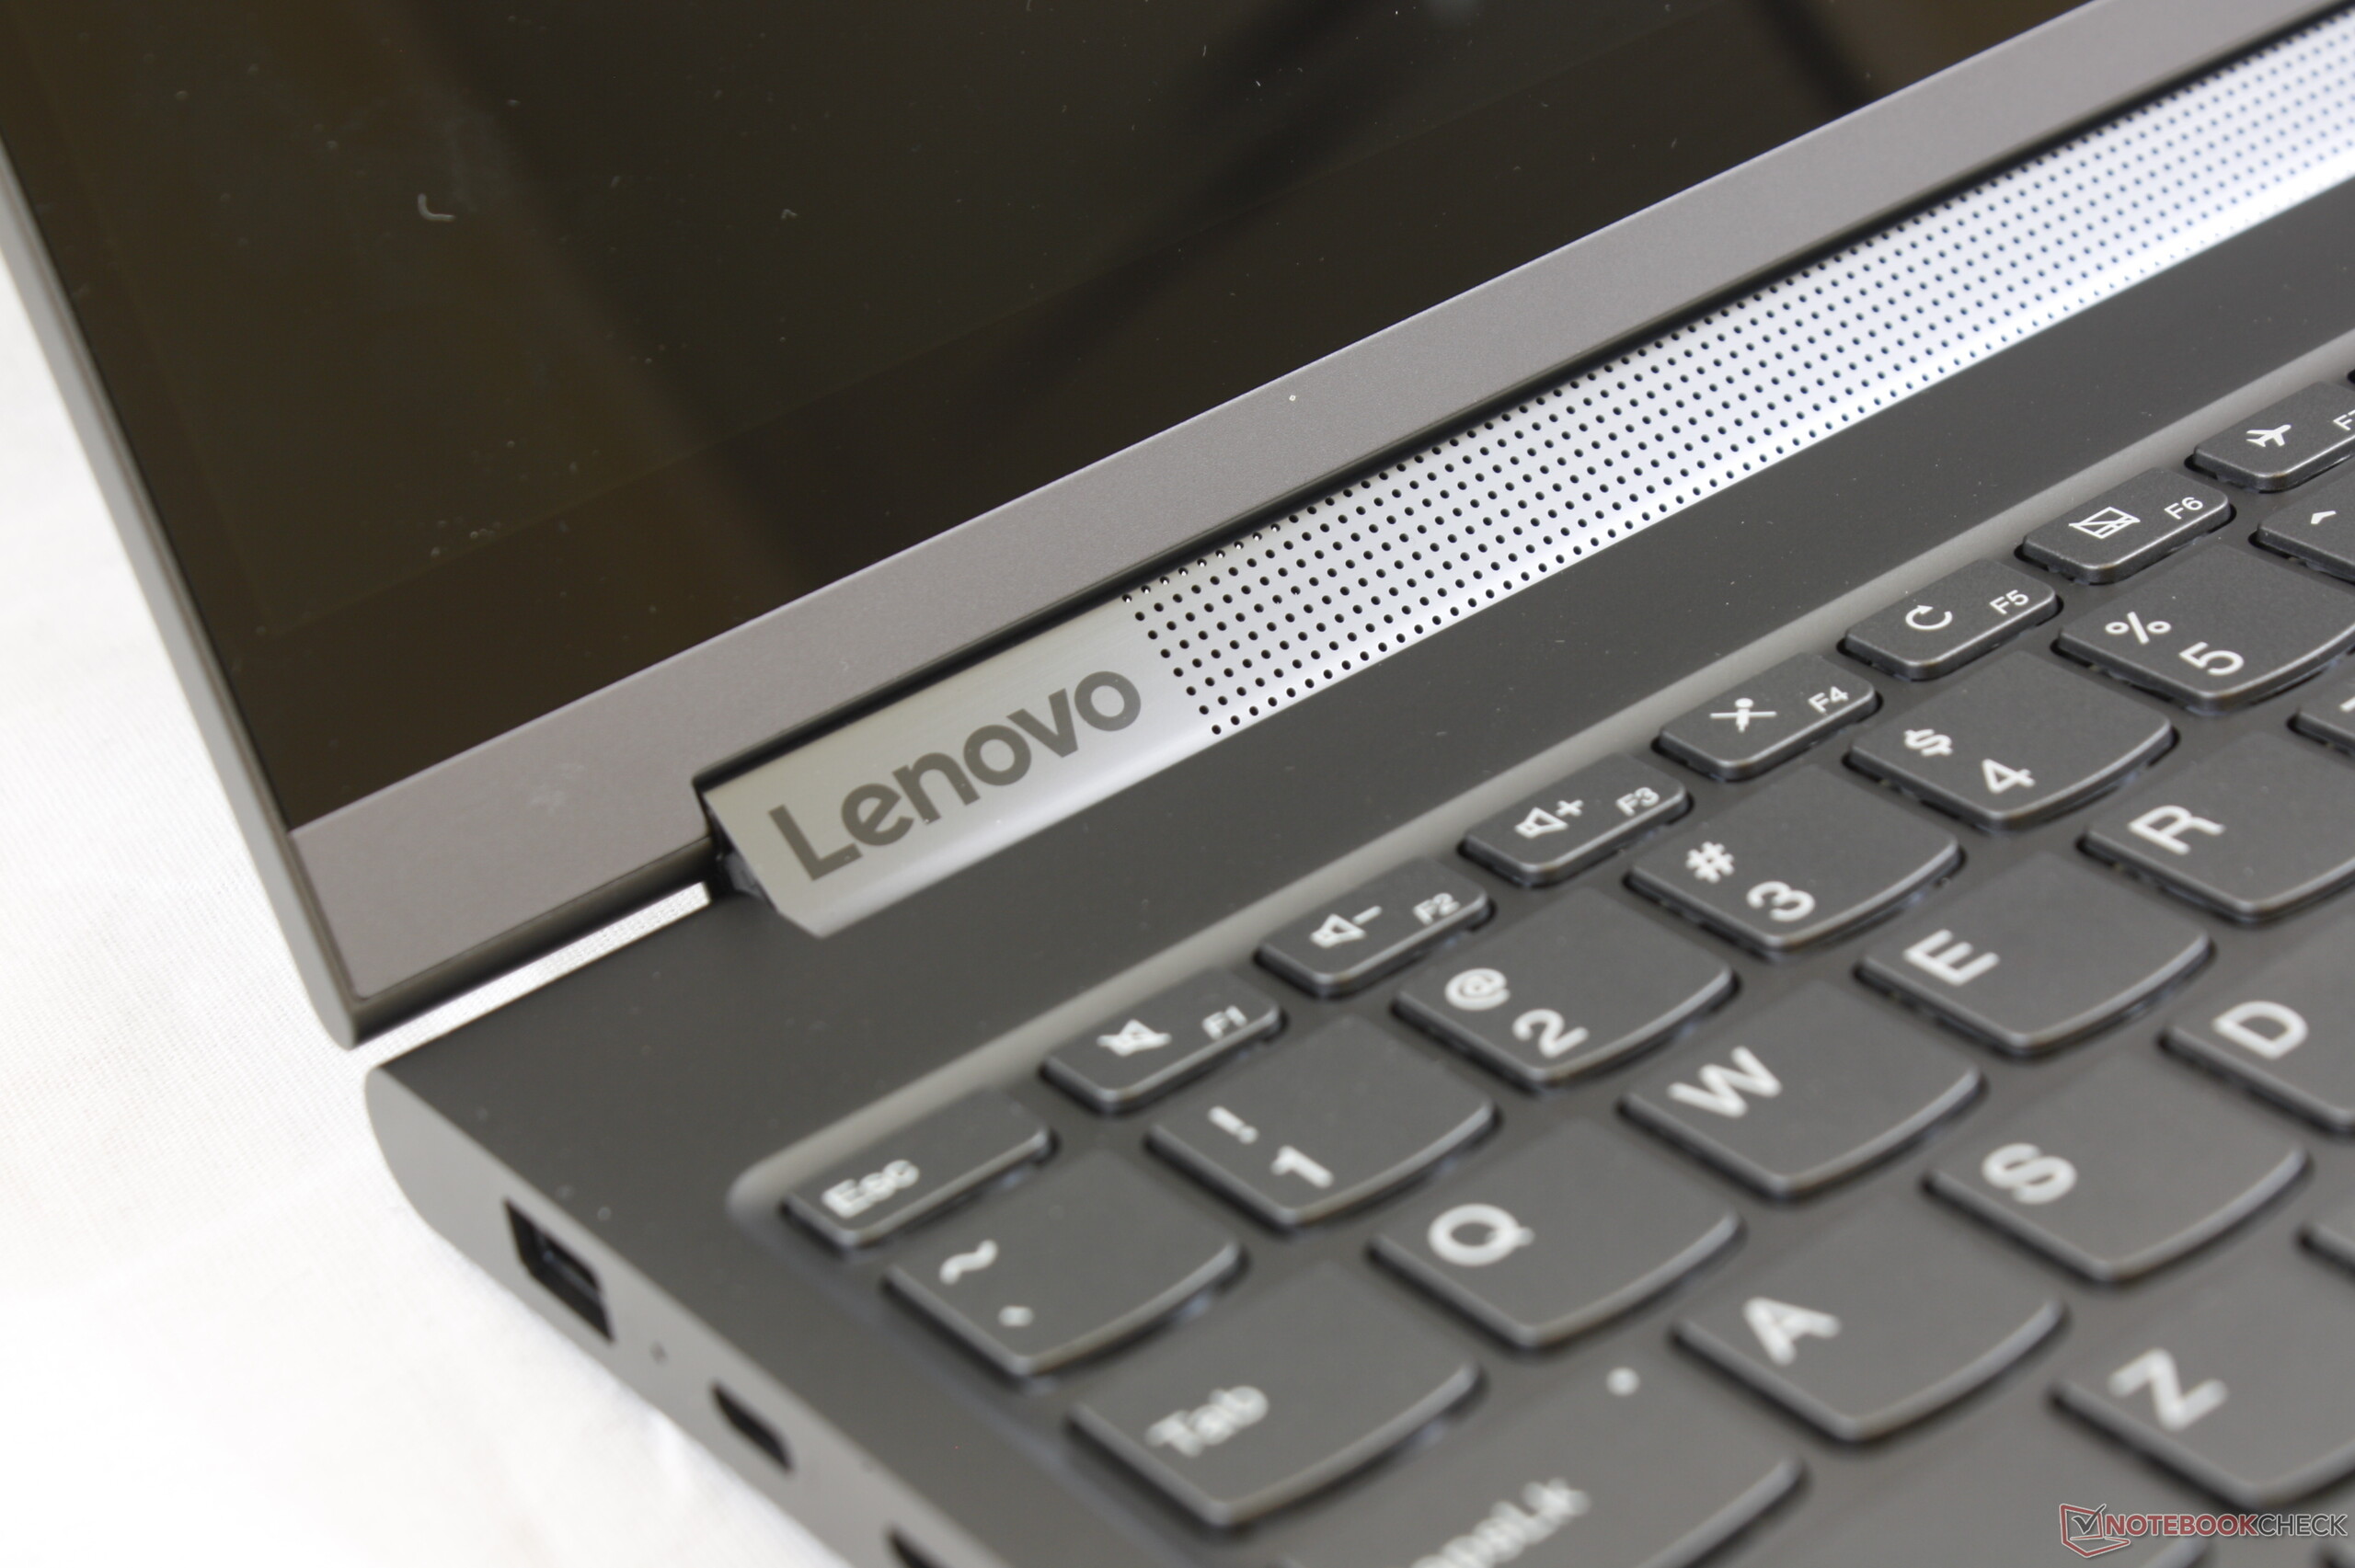
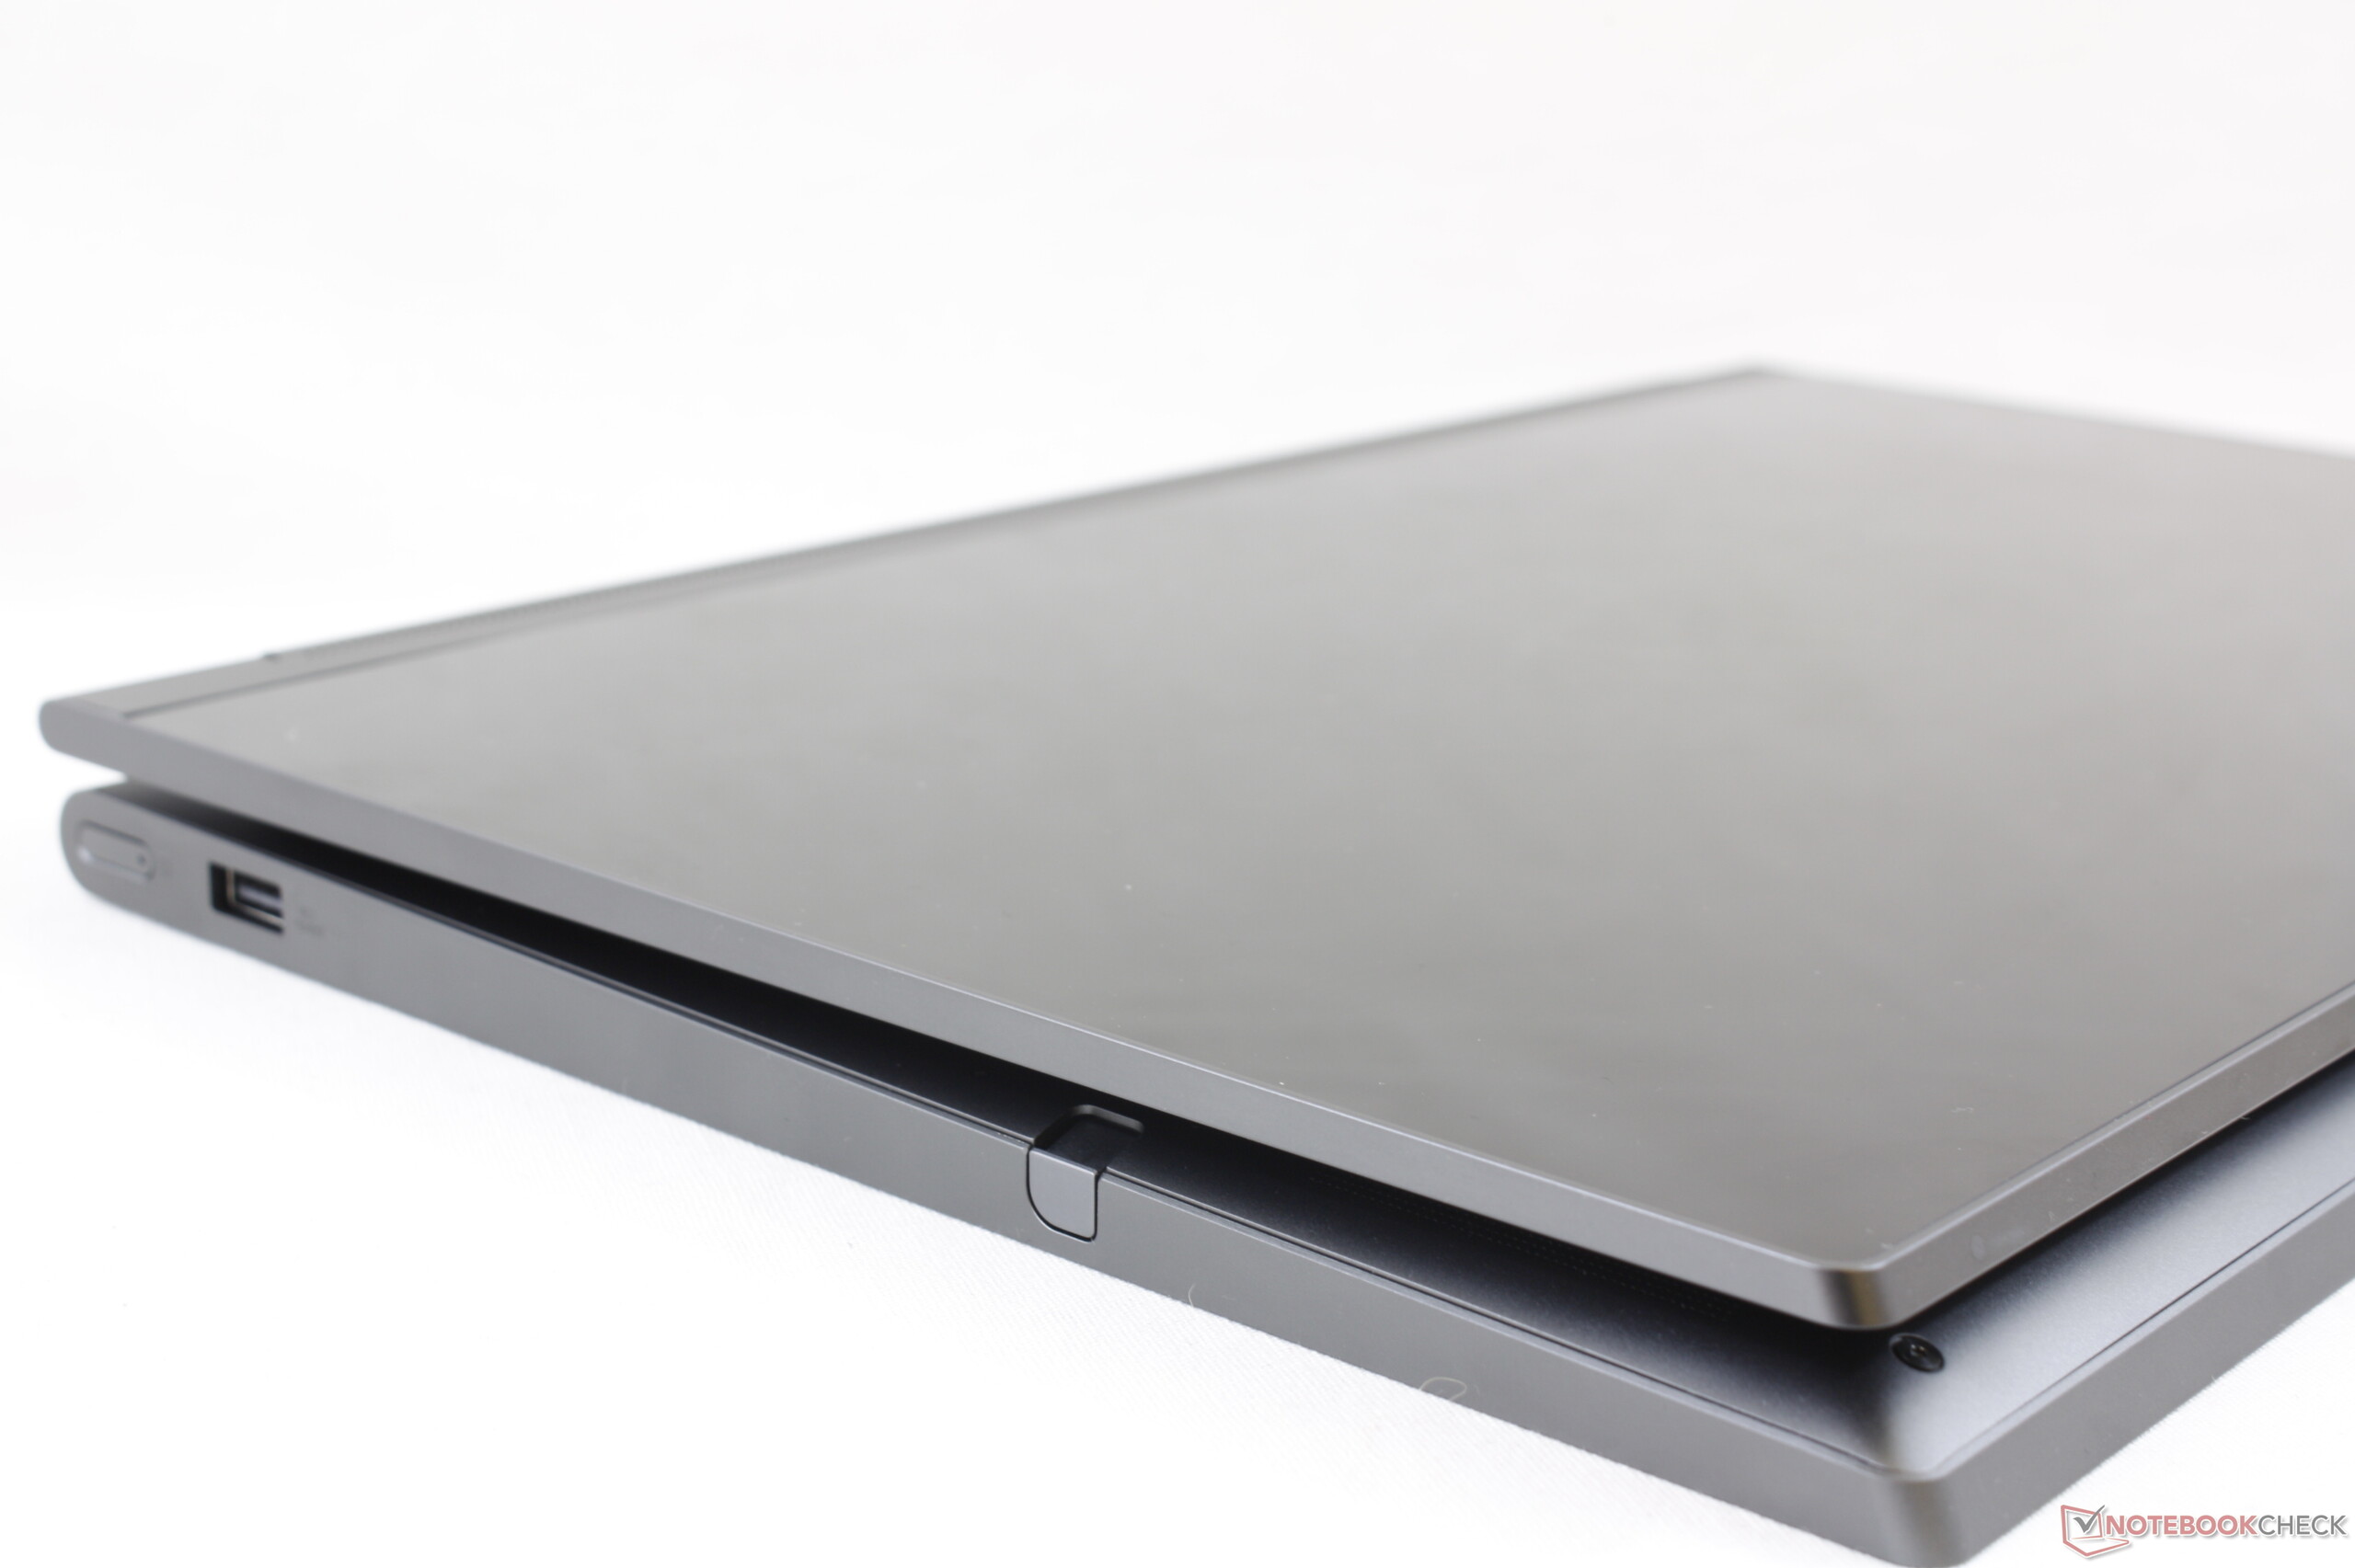
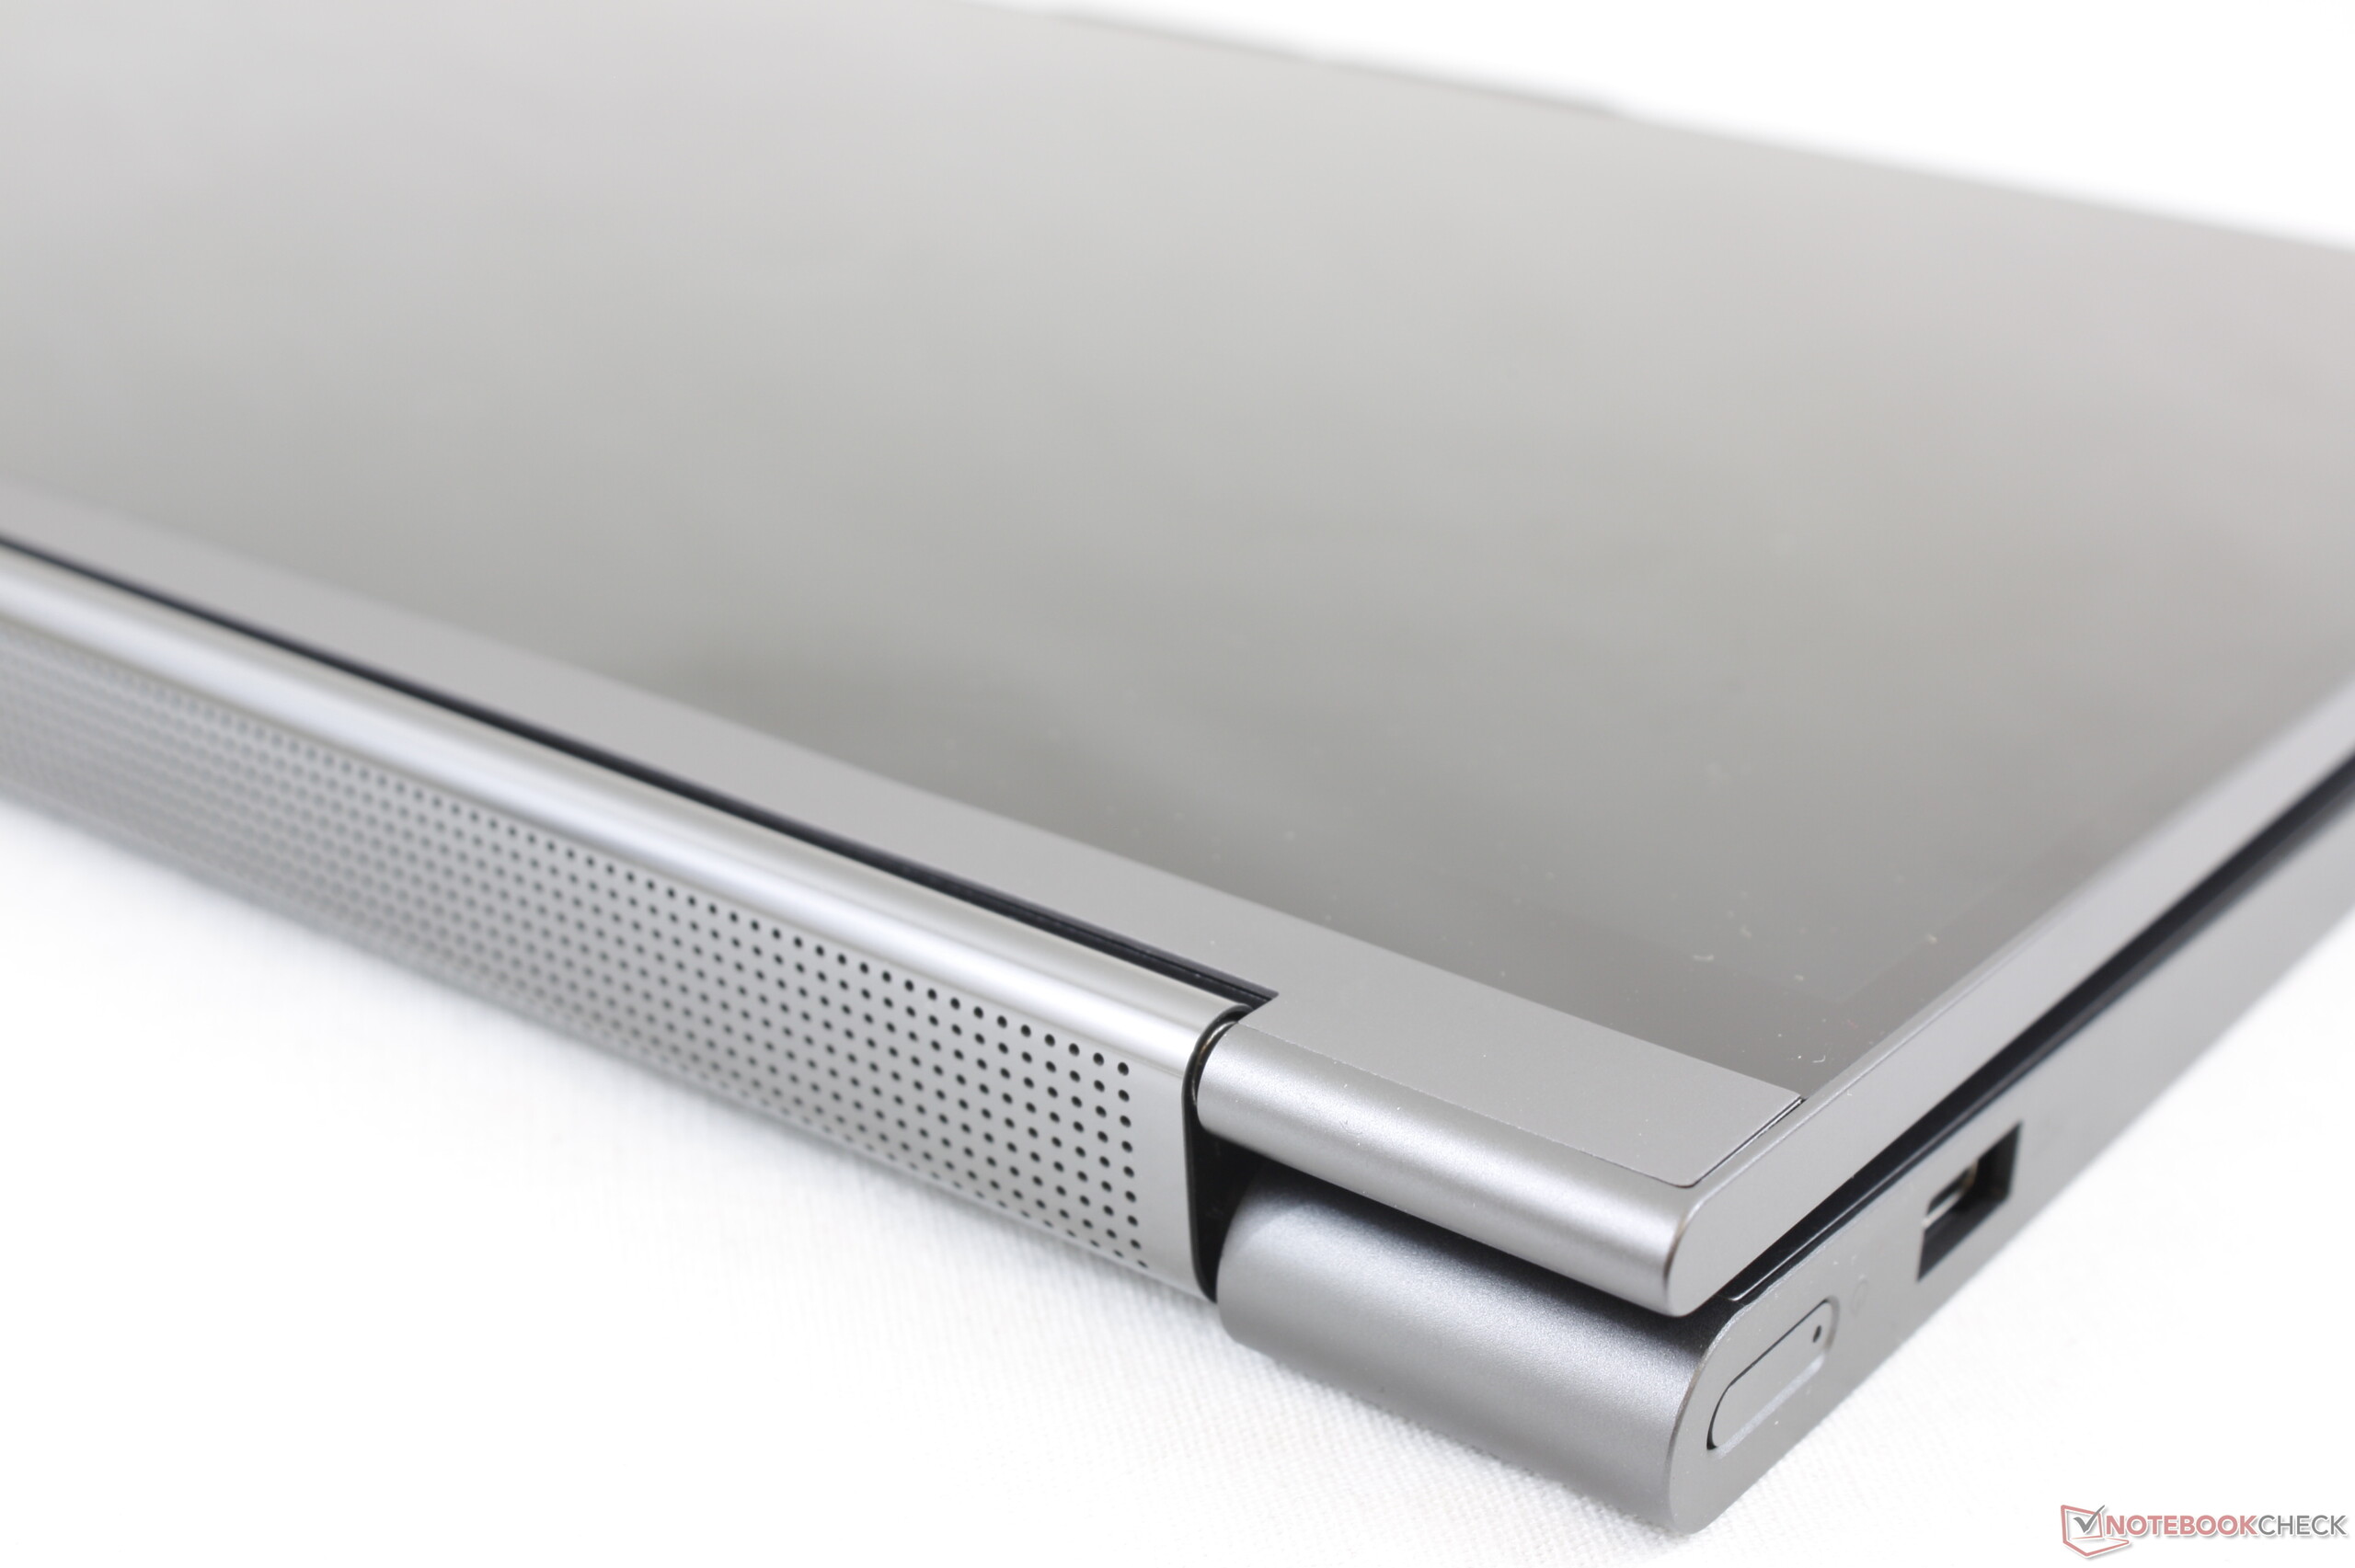
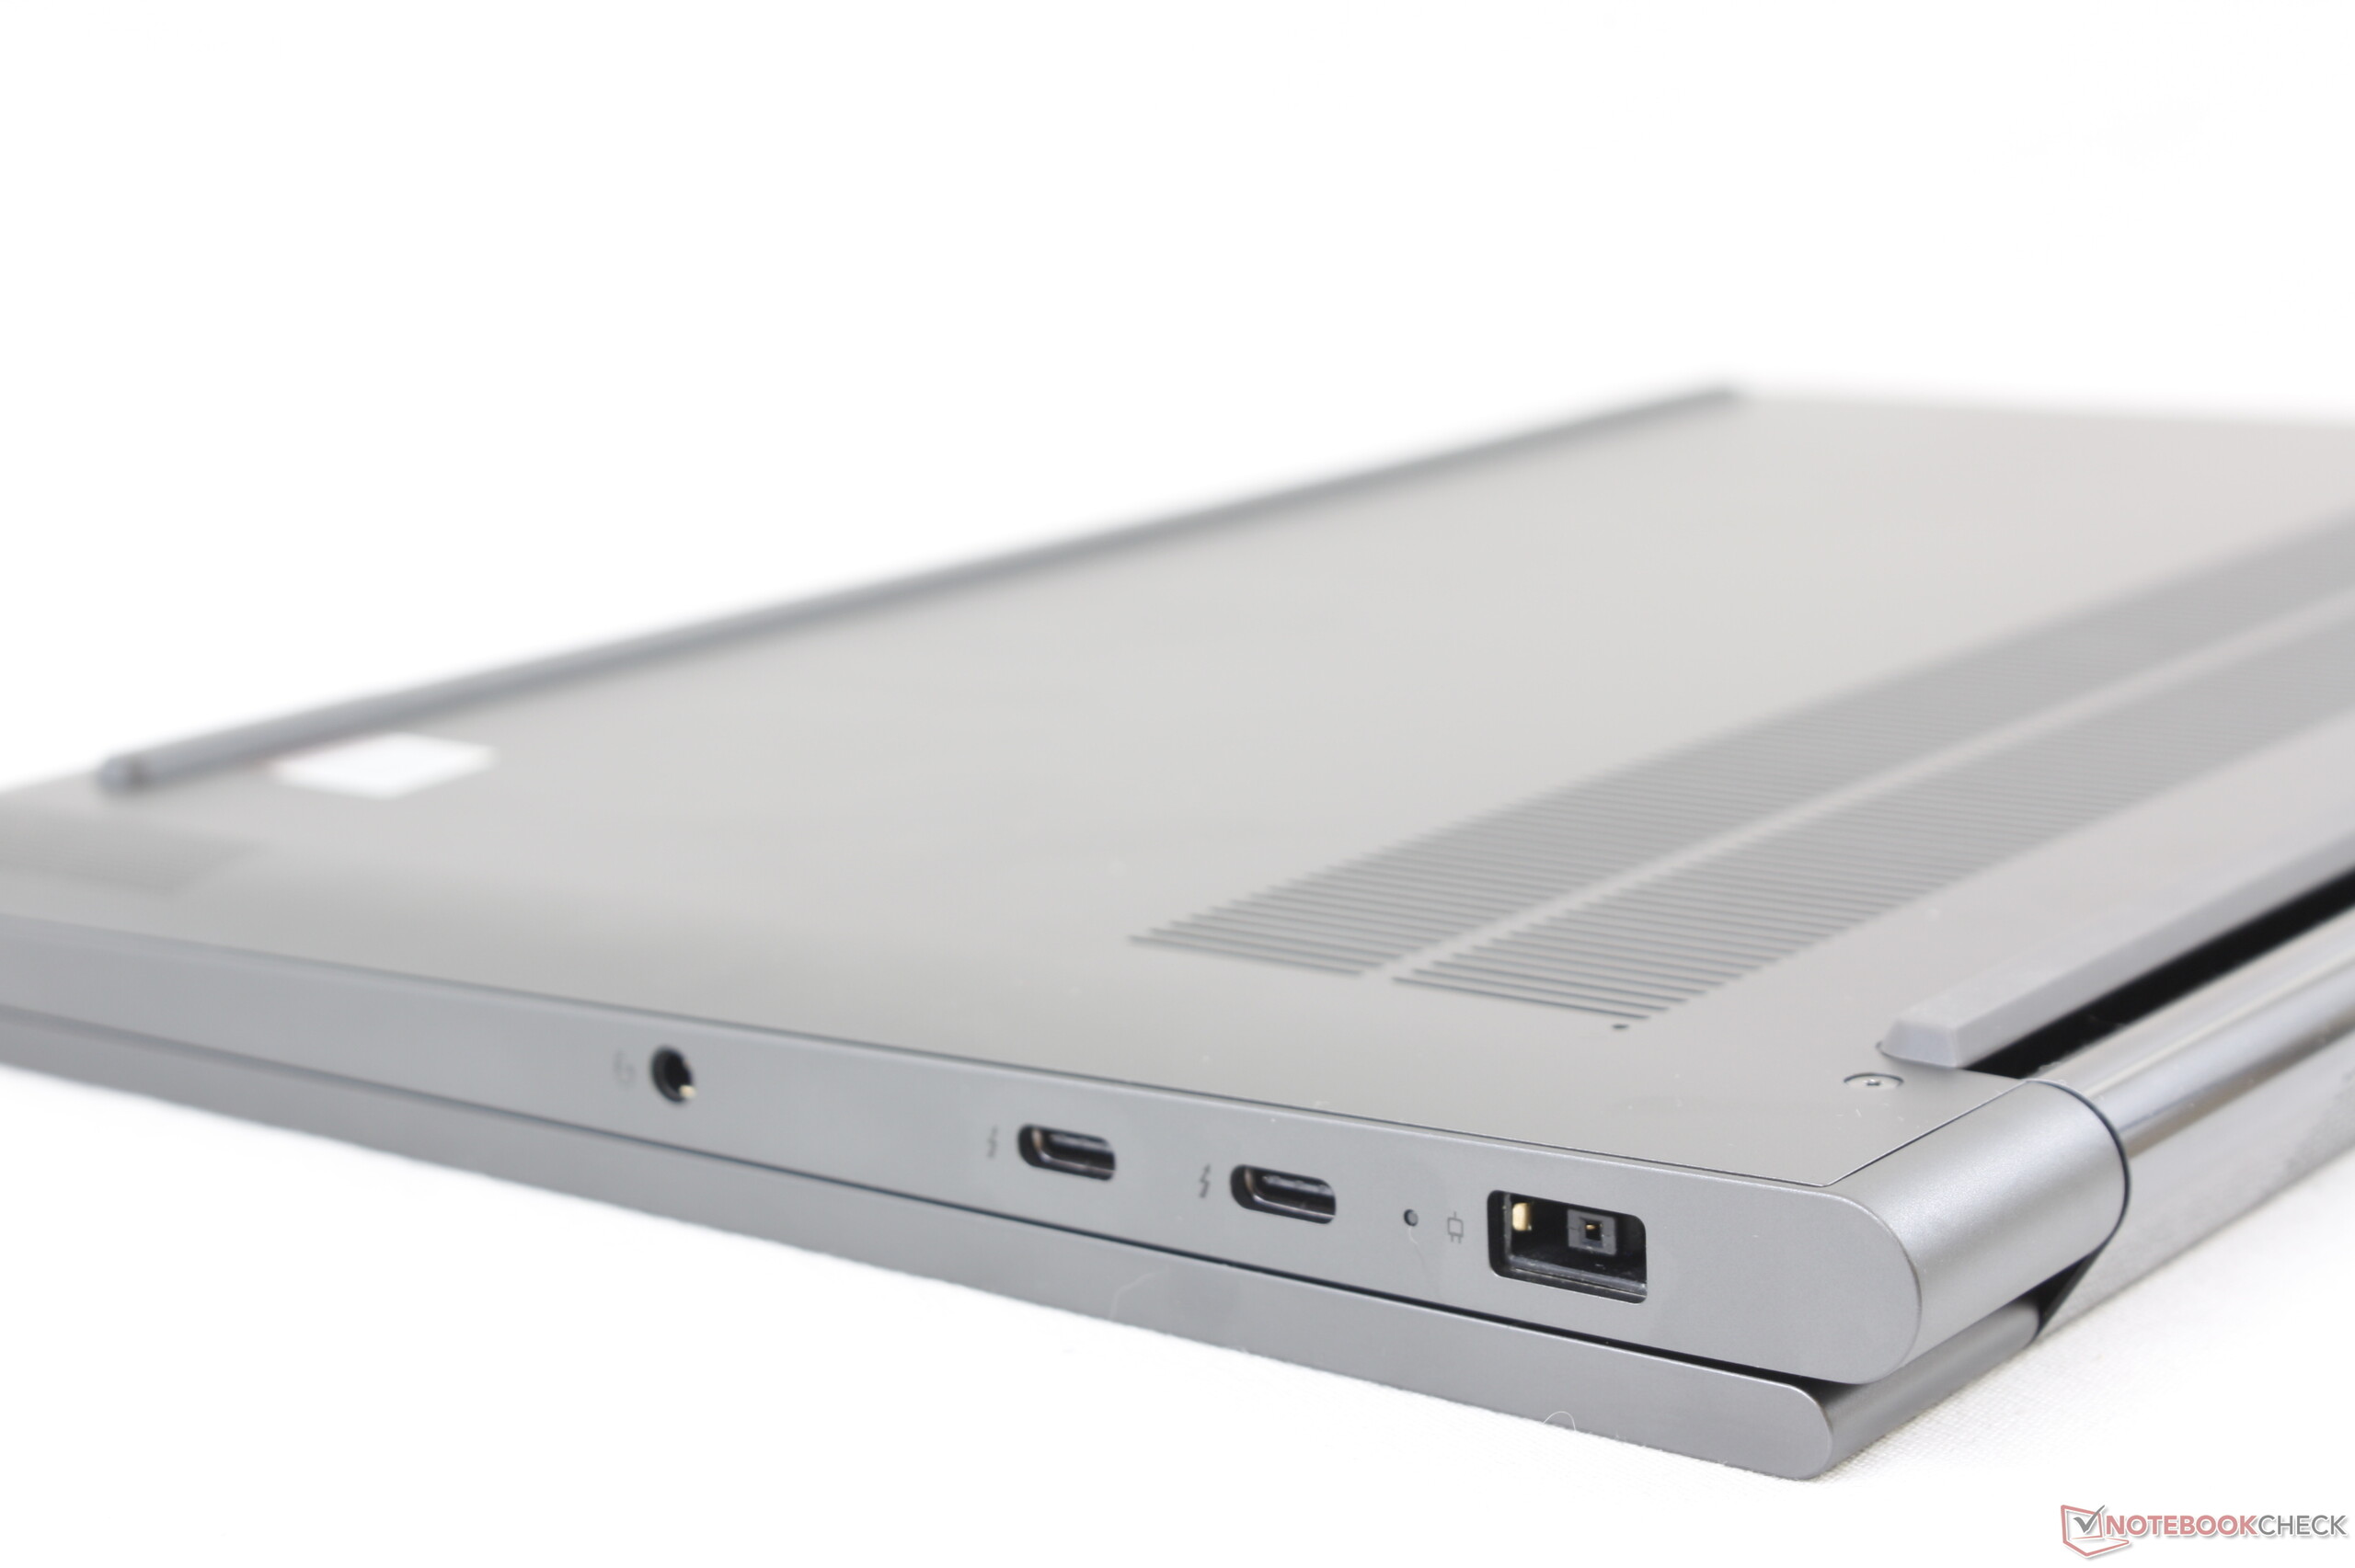
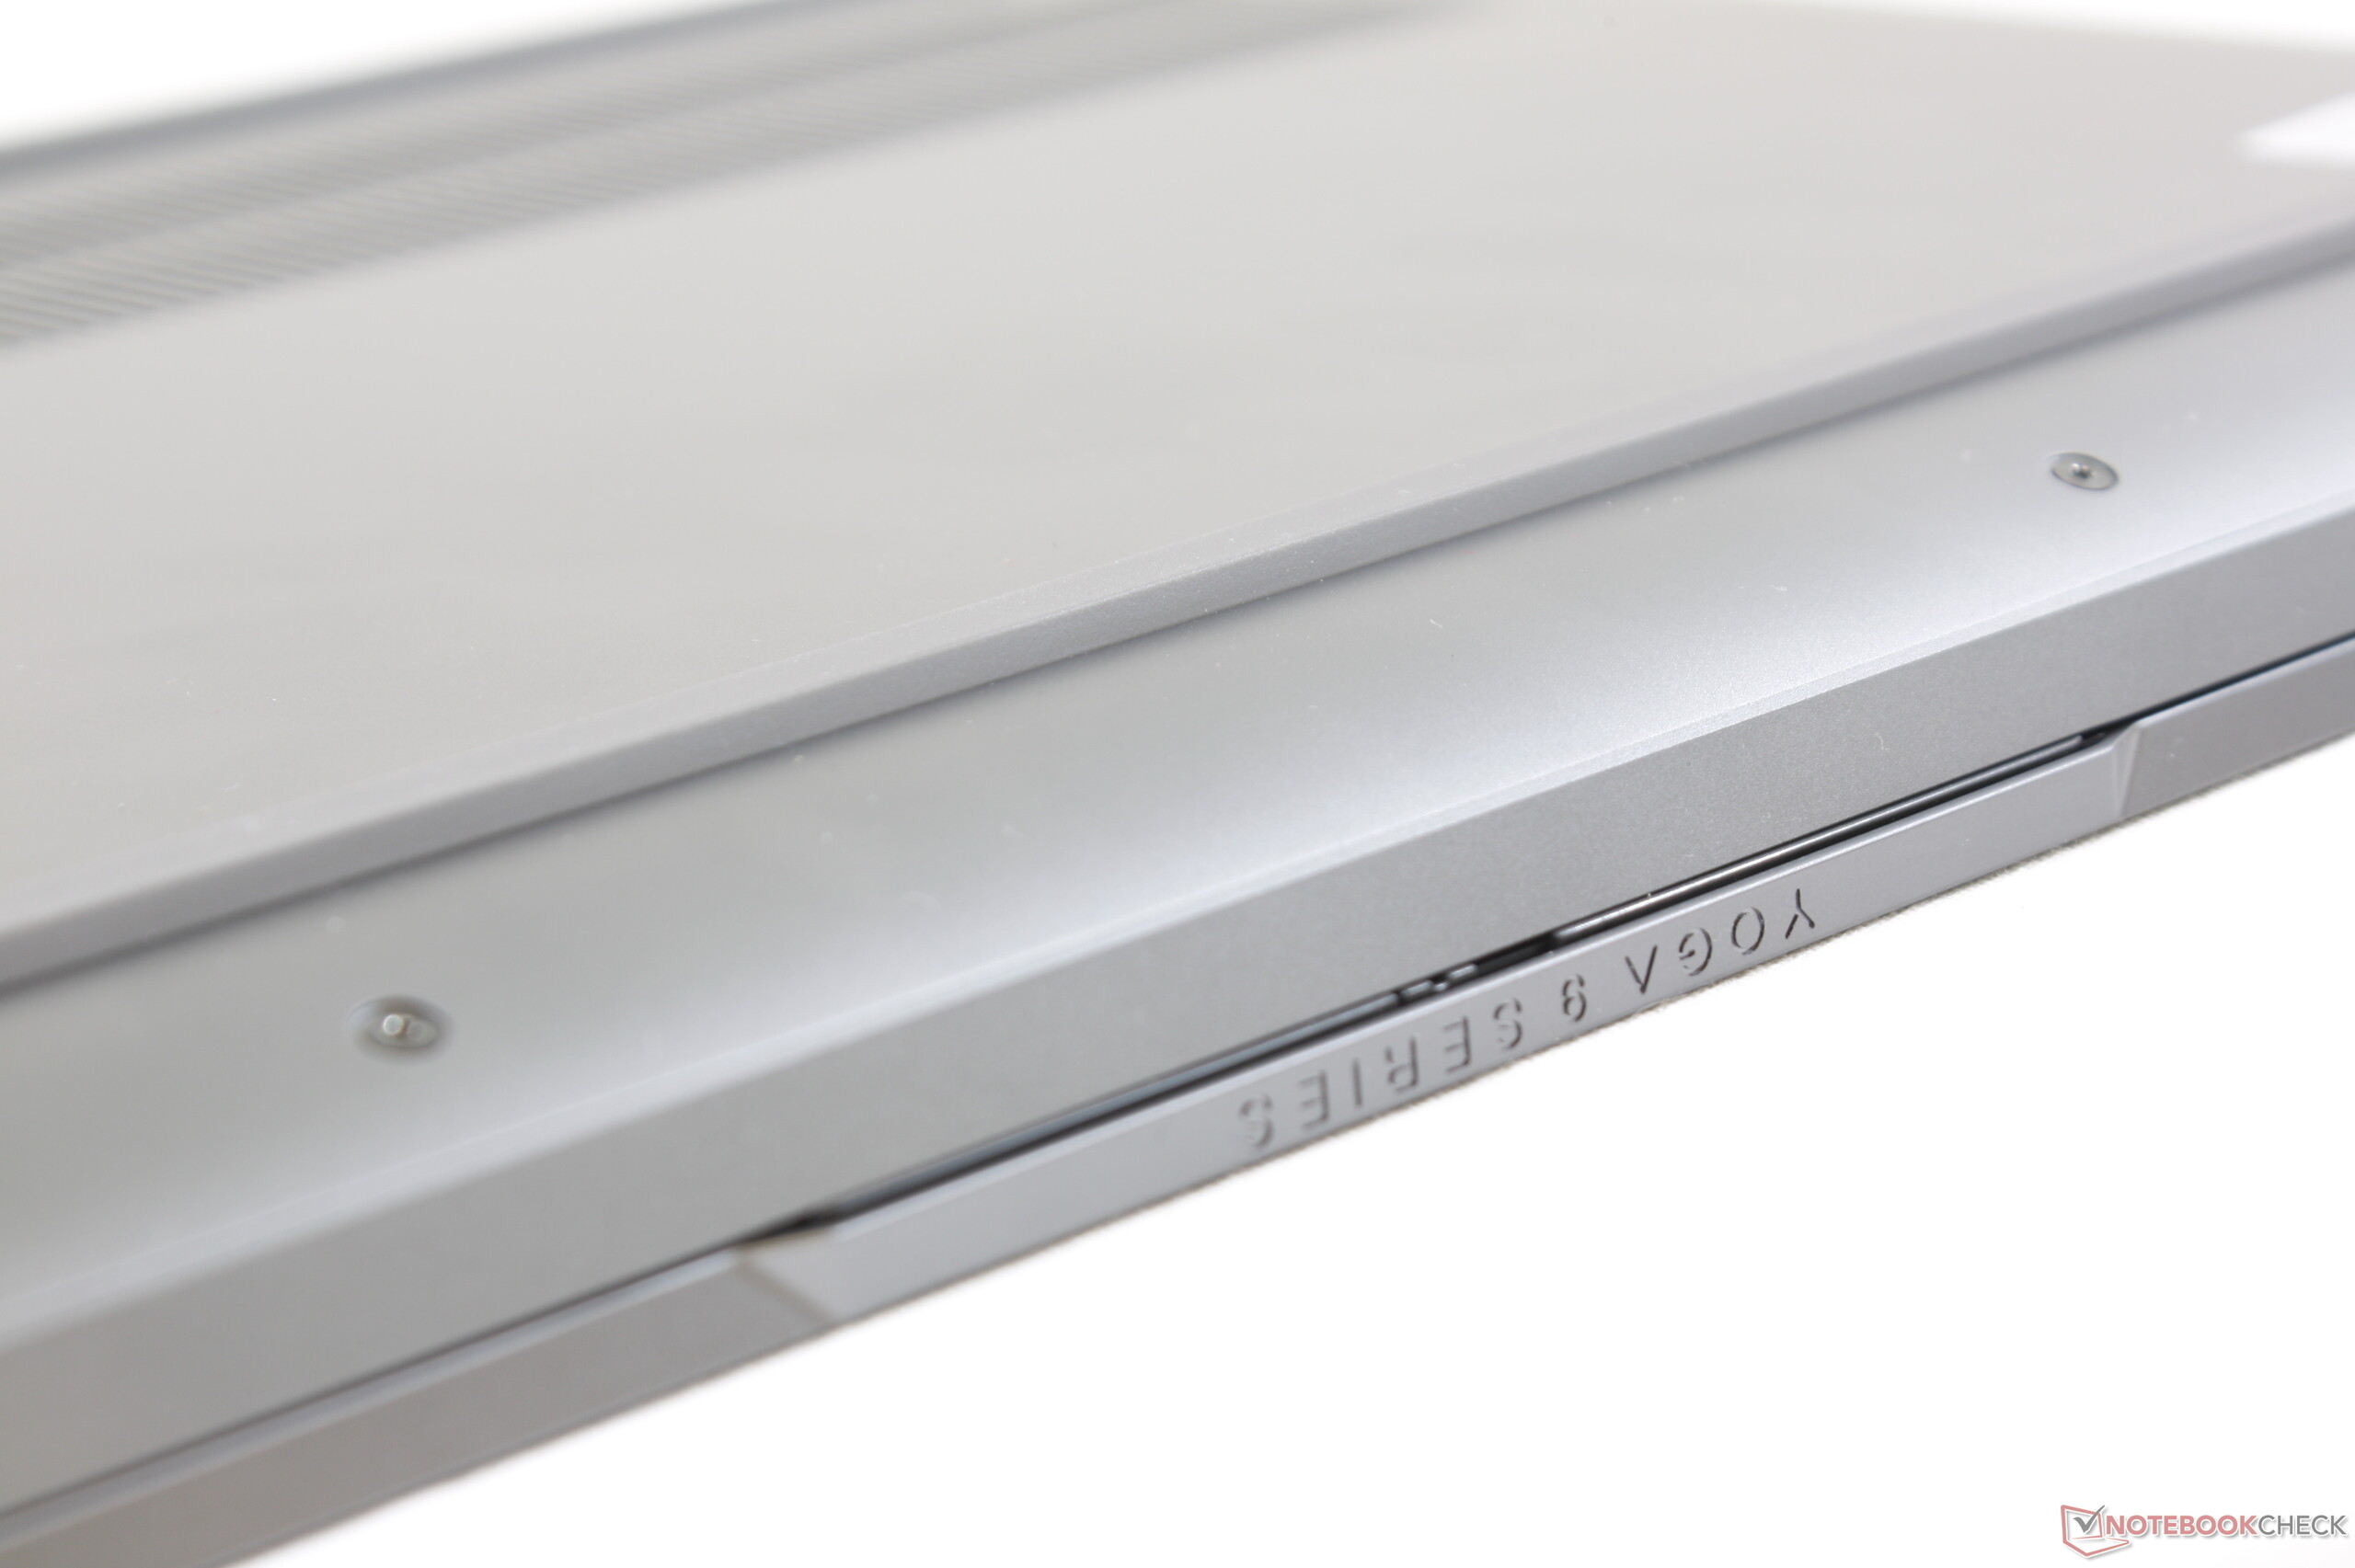
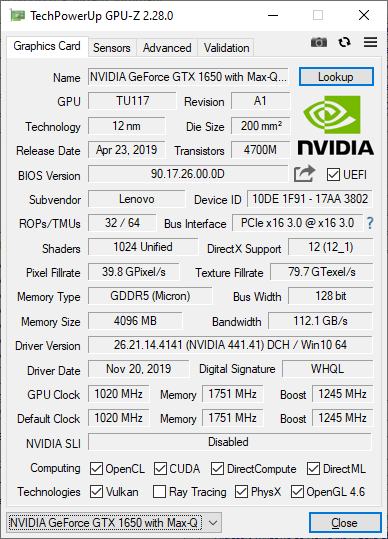
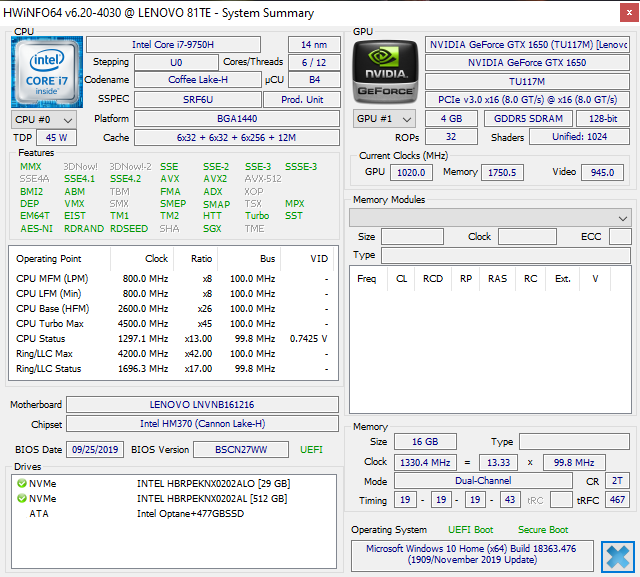
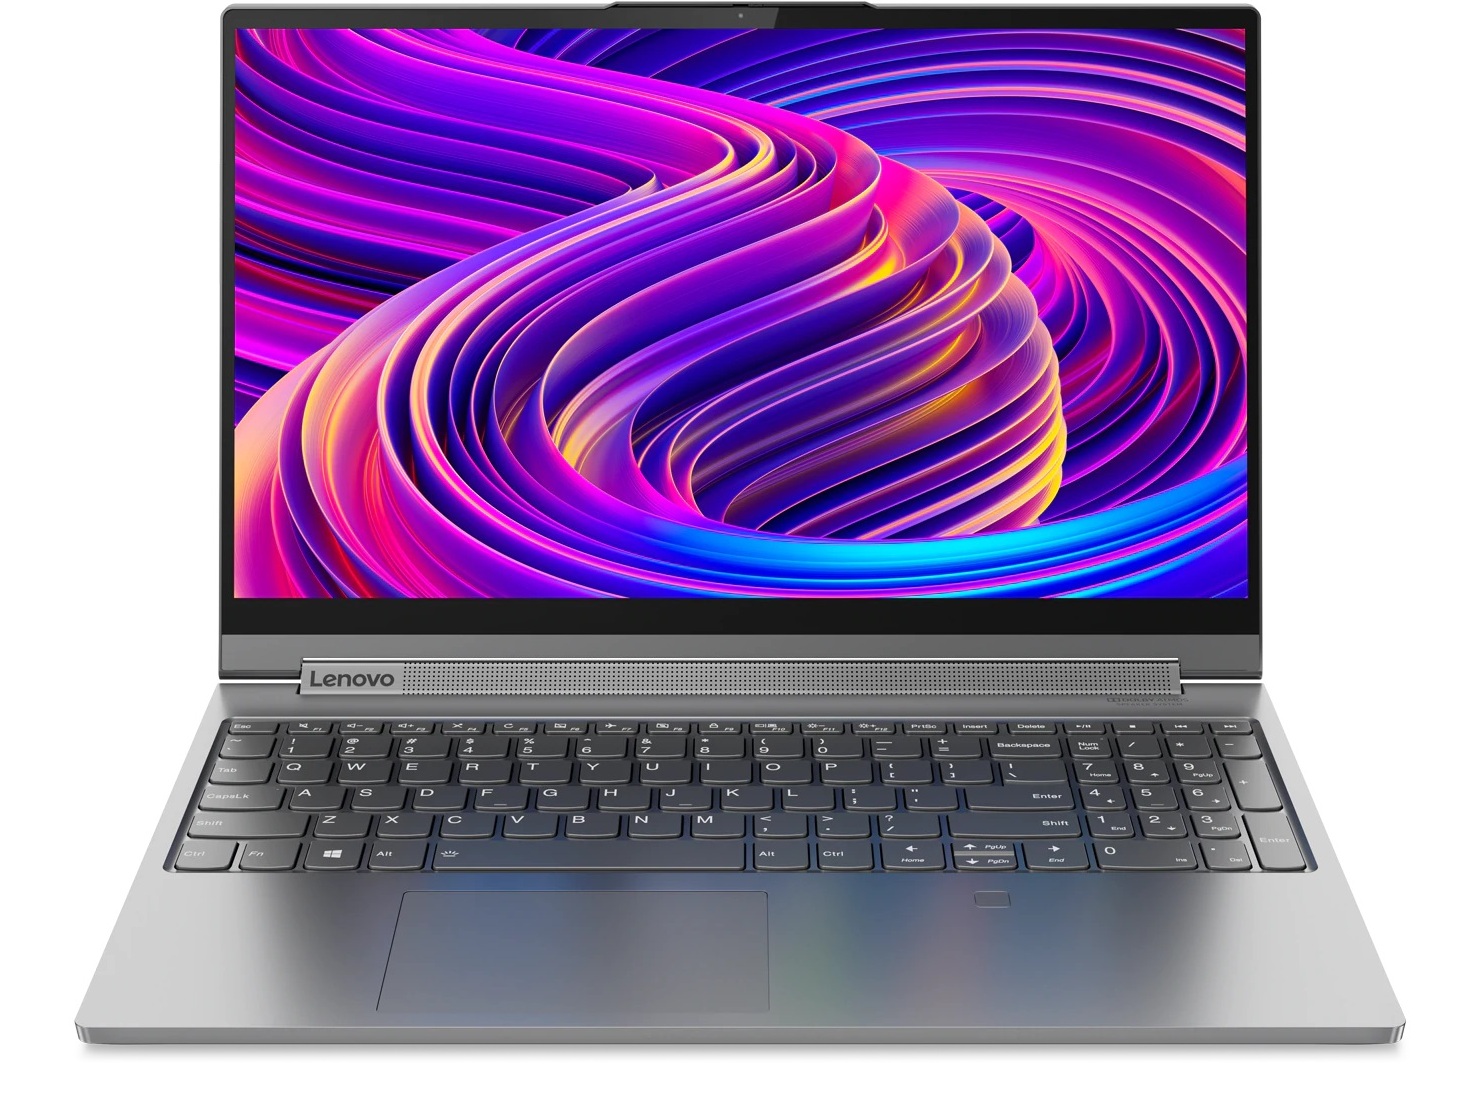
Toen Dell zijn XPS 15 2-in-1 aankondigde, verwachtten gebruikers een standaard XPS 15-laptop, maar met een 360-graden-scharnier. Wat we in de plaats kregen, was een compleet verschillende behuizing met een exotische combinatie van CPU en GPU, die een vervreemdend effect had op de trouwe fans van de XPS 15. De Lenovo Yoga C940-15 leunt in principe veel dichter aan bij wat men van de XPS 15 2-in-1 had verwacht: een convertible met een touchscreen, een traditioneel chiclet-toetsenbord, Intel Core H-CPU, GeForce GTX-GPU, eenvoudig toegankelijke opslag en een veilige opslagsleuf voor een stylus in plaats van een onhandige, magnetische oplossing.
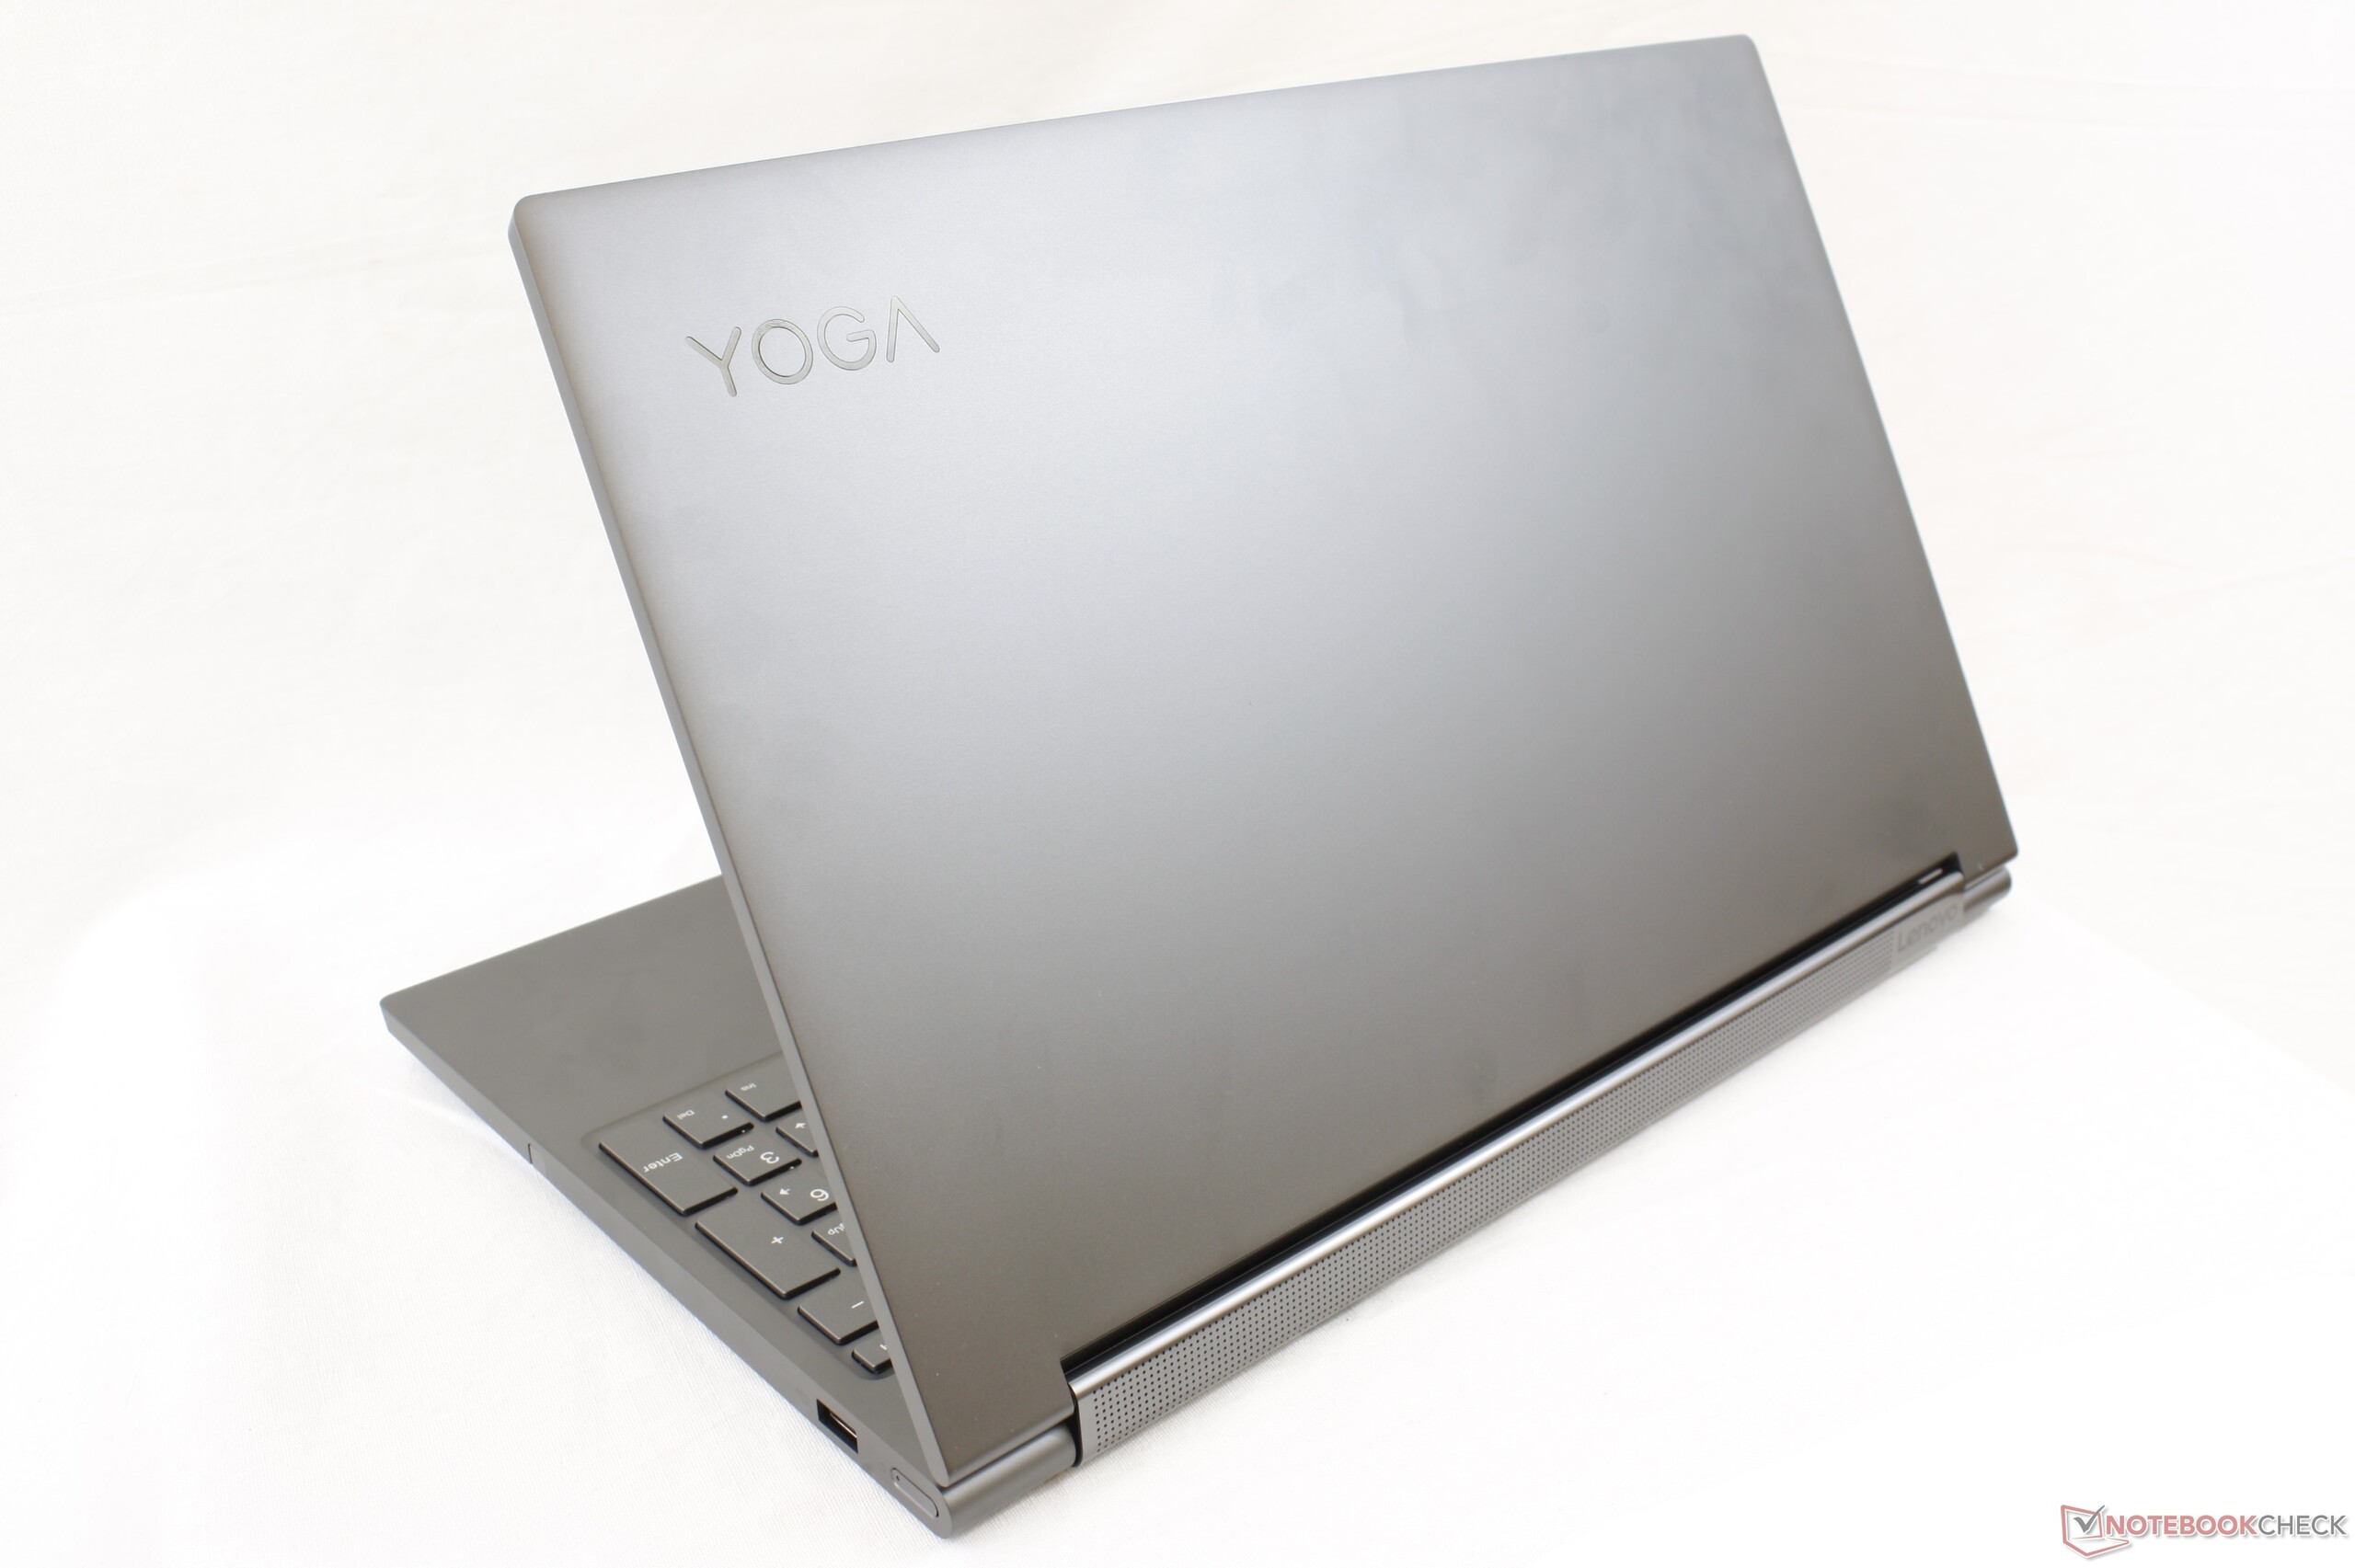
Een gaming-GPU in een 15.6-inch-convertible brengt ook wat nadelen met zich mee. Zo kan je door het grote gewicht en formaat van het toestel maar beter spaarzaam gebruik maken van de tablet-modus. Zelfs dan blijft de Yoga C940 lichter, helderder, compacter en krachtiger dan de concurrerende 2019 HP Spectre x360 15, wat hem over het algemeen een betere keuze maakt in deze categorie. De XPS 15 9575 2-in-1 is juist iets kleiner, maar moet op bijna alle andere vlakken onderdoen, inclusief prestaties, batterijduur, schermhelderheid en audio. We hopen dat toekomstige versies het hoge gewicht en de zwakke feedback van het toetsenbord en clickpad zullen verbeteren.
De Lenovo Yoga C940-15 biedt voor een compacte 15.6-inch-convertible erg veel prestaties per volume. Hoewel hij met een prijskaartje van zo'n 1500 euro niet goedkoop is, is het toestel superieur aan de XPS 15 2-in-1 of HP Spectre x360 15.
Lenovo Yoga C940-15IRH
- 15-12-2019 v7 (old)
Allen Ngo
Price comparison
