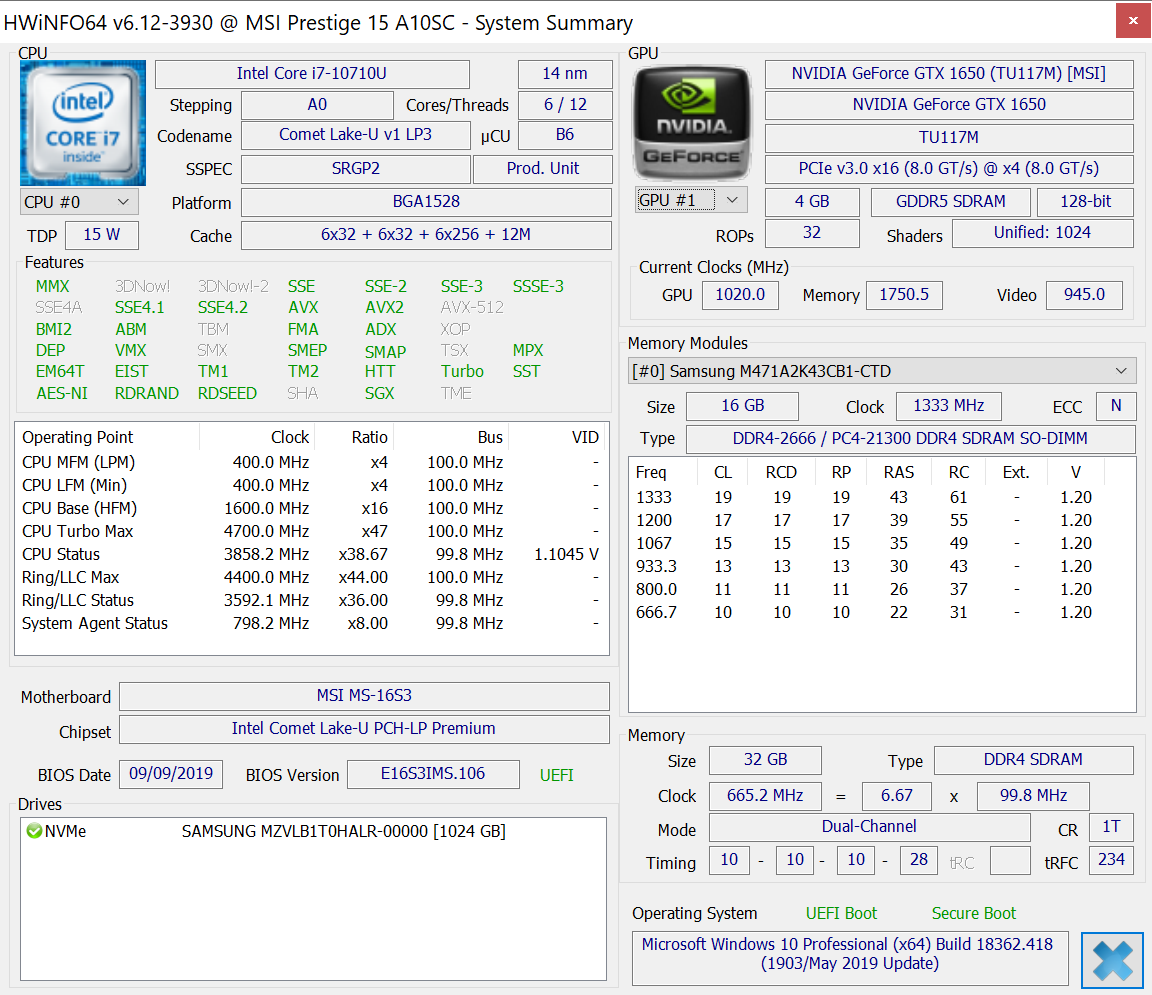
Kort testrapport MSI Prestige 15 A10SC Laptop: een van de beste Dell XPS 15-alternatieven
Evaluatie | Datum | Model | Gewicht | Hoogte | Formaat | Resolutie | Beste prijs |
|---|---|---|---|---|---|---|---|
| 85.2 % v7 (old) | 11-2019 | MSI Prestige 15 A10SC i7-10710U, GeForce GTX 1650 Max-Q | 1.7 kg | 16 mm | 15.60" | 3840x2160 | |
| 82.9 % v7 (old) | 10-2019 | Microsoft Surface Laptop 3 15 Ryzen 5 3580U R5 3580U, Vega 9 | 1.5 kg | 14.7 mm | 15.00" | 2496x1664 | |
| 86.6 % v7 (old) | 07-2019 | Lenovo ThinkPad T590-20N4002VGE i7-8565U, GeForce MX250 | 1.9 kg | 19.95 mm | 15.60" | 1920x1080 | |
| 83.1 % v7 (old) | 10-2019 | Asus ZenBook 15 UX534FT-DB77 i7-8565U, GeForce GTX 1650 Max-Q | 1.7 kg | 18.9 mm | 15.60" | 1920x1080 | |
| 86.3 % v7 (old) | 09-2019 | Dell XPS 15 7590 i5 iGPU FHD i5-9300H, UHD Graphics 630 | 1.9 kg | 17 mm | 15.60" | 1920x1080 |
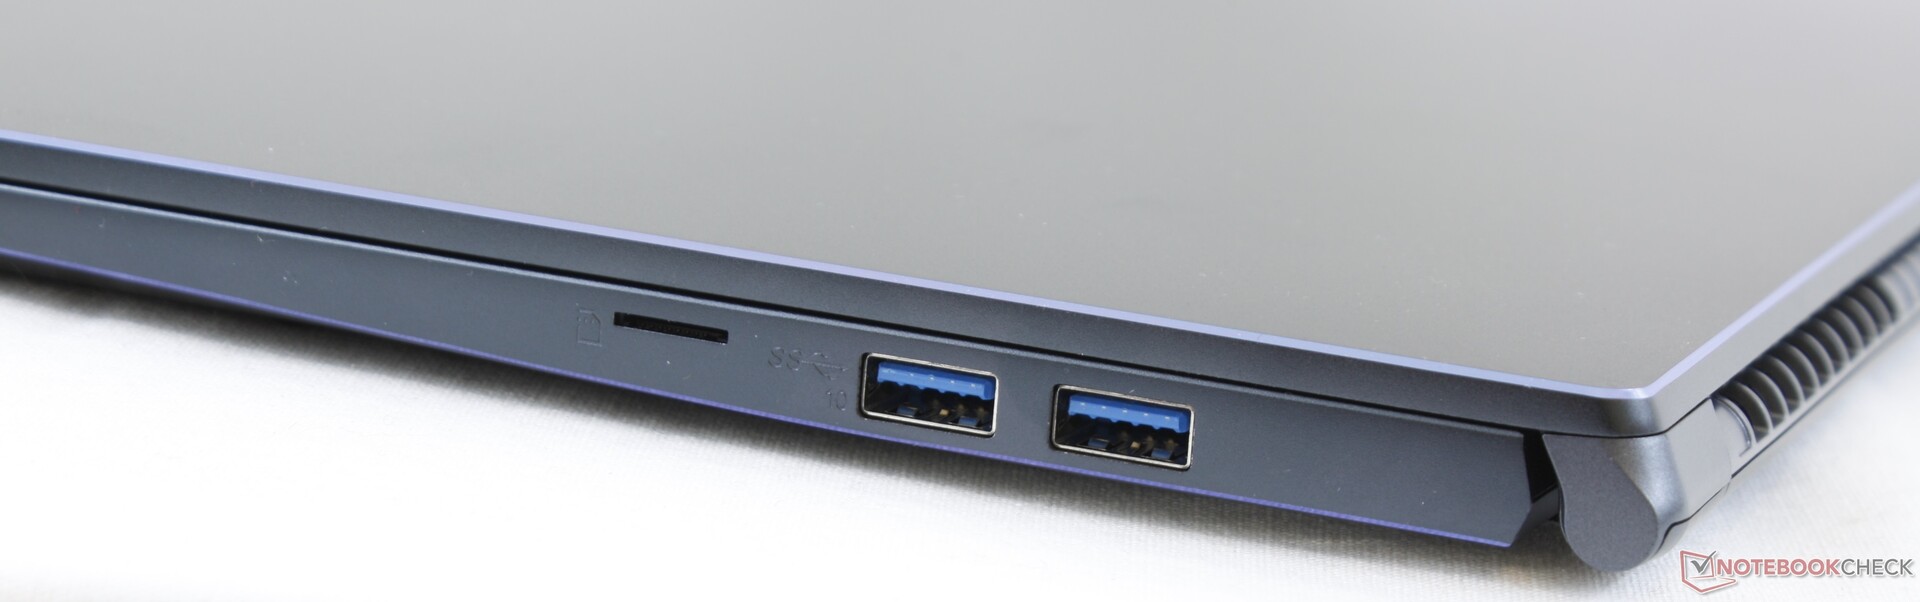

| SD Card Reader | |
| average JPG Copy Test (av. of 3 runs) | |
| Dell Latitude 5500 (Toshiba Exceria Pro M501 64 GB UHS-II) | |
| Dell Precision 5530 Xeon E-2176M (Toshiba Exceria Pro SDXC 64 GB UHS-II) | |
| MSI Prestige 15 A10SC (Toshiba Exceria Pro M501 UHS-II) | |
| Lenovo ThinkPad T590-20N4002VGE (Toshiba Exceria Pro M501 UHS-II) | |
| maximum AS SSD Seq Read Test (1GB) | |
| Dell Latitude 5500 (Toshiba Exceria Pro M501 64 GB UHS-II) | |
| MSI Prestige 15 A10SC (Toshiba Exceria Pro M501 UHS-II) | |
| Dell Precision 5530 Xeon E-2176M (Toshiba Exceria Pro SDXC 64 GB UHS-II) | |
| Lenovo ThinkPad T590-20N4002VGE (Toshiba Exceria Pro M501 UHS-II) | |
| |||||||||||||||||||||||||
Helderheidsverdeling: 92 %
Helderheid in Batterij-modus: 464.5 cd/m²
Contrast: 929:1 (Zwart: 0.5 cd/m²)
ΔE ColorChecker Calman: 3.36 | ∀{0.5-29.43 Ø4.72}
calibrated: 3.42
ΔE Greyscale Calman: 1.3 | ∀{0.09-98 Ø4.97}
98.3% sRGB (Argyll 1.6.3 3D)
84.8% AdobeRGB 1998 (Argyll 1.6.3 3D)
96.2% AdobeRGB 1998 (Argyll 3D)
98.3% sRGB (Argyll 3D)
82% Display P3 (Argyll 3D)
Gamma: 2.14
CCT: 6596 K
| MSI Prestige 15 A10SC Sharp LQ156D1JW42, IPS, 15.6", 3840x2160 | Microsoft Surface Laptop 3 15 Ryzen 5 3580U Sharp LQ150P1JX51, IPS, 15", 2496x1664 | MSI P65 Creator 9SF-657 AU Optronics AUO41EB, IPS, 15.6", 3840x2160 | Dell Precision 5530 Xeon E-2176M Sharp SHP148D / LQ156D1, IGZO, 15.6", 3840x2160 | Dell Latitude 5500 LGD05FF 156WFD, IPS, 15.6", 1920x1080 | Lenovo ThinkPad T590-20N4002VGE LP156WFC-SPD1, aSi IPS LED, 15.6", 1920x1080 | |
|---|---|---|---|---|---|---|
| Display | -17% | 2% | -9% | -52% | -51% | |
| Display P3 Coverage (%) | 82 | 66.9 -18% | 84.4 3% | 76.5 -7% | 38.07 -54% | 38.79 -53% |
| sRGB Coverage (%) | 98.3 | 99.3 1% | 100 2% | 98.4 0% | 57.3 -42% | 58.3 -41% |
| AdobeRGB 1998 Coverage (%) | 96.2 | 63.7 -34% | 98.5 2% | 76.4 -21% | 39.33 -59% | 40.11 -58% |
| Response Times | 16% | 20% | 19% | 34% | 36% | |
| Response Time Grey 50% / Grey 80% * (ms) | 60 ? | 47.2 ? 21% | 51 ? 15% | 48 ? 20% | 37.6 ? 37% | 37.2 ? 38% |
| Response Time Black / White * (ms) | 41.2 ? | 36.8 ? 11% | 31 ? 25% | 33.6 ? 18% | 28.4 ? 31% | 27.2 ? 34% |
| PWM Frequency (Hz) | 26040 ? | 21370 ? | 1000 | |||
| Screen | 4% | -31% | -16% | -39% | -43% | |
| Brightness middle (cd/m²) | 464.5 | 416.9 -10% | 445 -4% | 451.7 -3% | 234 -50% | 276 -41% |
| Brightness (cd/m²) | 451 | 389 -14% | 462 2% | 440 -2% | 229 -49% | 262 -42% |
| Brightness Distribution (%) | 92 | 86 -7% | 83 -10% | 90 -2% | 93 1% | 88 -4% |
| Black Level * (cd/m²) | 0.5 | 0.4 20% | 0.5 -0% | 0.4 20% | 0.23 54% | 0.23 54% |
| Contrast (:1) | 929 | 1042 12% | 890 -4% | 1129 22% | 1017 9% | 1200 29% |
| Colorchecker dE 2000 * | 3.36 | 2.75 18% | 4.75 -41% | 3.11 7% | 5.2 -55% | 5.6 -67% |
| Colorchecker dE 2000 max. * | 7.06 | 6.64 6% | 7.79 -10% | 8.62 -22% | 14.7 -108% | 16.4 -132% |
| Colorchecker dE 2000 calibrated * | 3.42 | 0.71 79% | 3.07 10% | 4.6 -35% | 4.7 -37% | |
| Greyscale dE 2000 * | 1.3 | 1.8 -38% | 4.49 -245% | 3.7 -185% | 2.5 -92% | 3 -131% |
| Gamma | 2.14 103% | 2.09 105% | 2.49 88% | 2.11 104% | 2.44 90% | 2.18 101% |
| CCT | 6596 99% | 6646 98% | 7374 88% | 6492 100% | 6649 98% | 7075 92% |
| Color Space (Percent of AdobeRGB 1998) (%) | 84.8 | 63.4 -25% | 87 3% | 69 -19% | 36.2 -57% | 36.9 -56% |
| Color Space (Percent of sRGB) (%) | 98.3 | 99.4 1% | 100 2% | 98 0% | 57 -42% | 58.1 -41% |
| Totaal Gemiddelde (Programma / Instellingen) | 1% /
1% | -3% /
-17% | -2% /
-10% | -19% /
-32% | -19% /
-34% |
* ... kleiner is beter
Responstijd Scherm
| ↔ Responstijd Zwart naar Wit | ||
|---|---|---|
| 41.2 ms ... stijging ↗ en daling ↘ gecombineerd | ↗ 22.8 ms stijging | 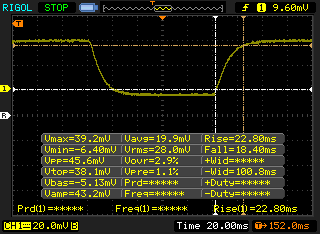 |
| ↘ 18.4 ms daling | ||
| Het scherm vertoonde trage responstijden in onze tests en is misschien te traag voor games. Ter vergelijking: alle testtoestellen variëren van 0.1 (minimum) tot 240 (maximum) ms. » 98 % van alle toestellen zijn beter. Dit betekent dat de gemeten responstijd slechter is dan het gemiddelde (19.9 ms) van alle geteste toestellen. | ||
| ↔ Responstijd 50% Grijs naar 80% Grijs | ||
| 60 ms ... stijging ↗ en daling ↘ gecombineerd | ↗ 29.2 ms stijging | 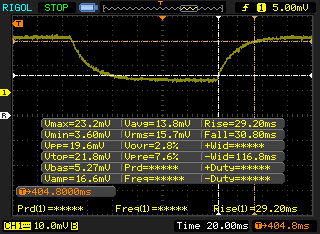 |
| ↘ 30.8 ms daling | ||
| Het scherm vertoonde trage responstijden in onze tests en is misschien te traag voor games. Ter vergelijking: alle testtoestellen variëren van 0.165 (minimum) tot 636 (maximum) ms. » 96 % van alle toestellen zijn beter. Dit betekent dat de gemeten responstijd slechter is dan het gemiddelde (31.1 ms) van alle geteste toestellen. | ||
Screen Flickering / PWM (Pulse-Width Modulation)
| Screen flickering / PWM waargenomen | 26040 Hz | ≤ 24 % helderheid instelling | 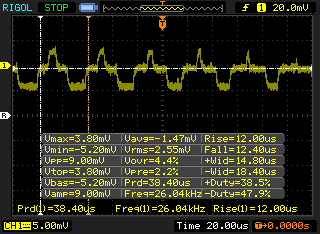 |
De achtergrondverlichting van het scherm flikkert op 26040 Hz (in het slechtste geval, bijvoorbeeld bij gebruik van PWM) aan een helderheid van 24 % en lager. Boven deze helderheid zou er geen flickering / PWM mogen optreden. De frequentie van 26040 Hz is redelijk hoog en de meeste mensen die gevoelig zijn aan flickering zouden dit dus niet mogen waarnemen of geïrriteerde ogen krijgen. Ter vergelijking: 52 % van alle geteste toestellen maakten geen gebruik van PWM om de schermhelderheid te verlagen. Als het wel werd gebruikt, werd een gemiddelde van 7784 (minimum: 5 - maximum: 343500) Hz waargenomen. | |||
| wPrime 2.10 - 1024m | |
| Dell XPS 13 7390 2-in-1 Core i7 | |
| Gemiddeld Intel Core i7-10710U (171.1 - 177.4, n=2) | |
| MSI GE75 9SG | |
* ... kleiner is beter
| PCMark 8 Home Score Accelerated v2 | 3546 punten | |
| PCMark 8 Work Score Accelerated v2 | 4483 punten | |
| PCMark 10 Score | 5009 punten | |
Help | ||
| MSI Prestige 15 A10SC Samsung SSD PM981 MZVLB1T0HALR | Microsoft Surface Laptop 3 15 Ryzen 5 3580U SK hynix BC501 HFM256GDGTNG | Lenovo ThinkPad T590-20N4002VGE Toshiba XG6 KXG60ZNV512G | Dell Latitude 5500 Toshiba XG6 KXG60ZNV1T02 | HP EliteBook 755 G5 3UN79EA Toshiba XG5 KXG50ZNV512G | Dell Precision 5530 Xeon E-2176M SK hynix PC400 512 GB | MSI P65 Creator 9SF-657 2x Samsung SSD PM981 MZVLB512HAJQ (RAID 0) | |
|---|---|---|---|---|---|---|---|
| AS SSD | -52% | 13% | 2% | -149% | -18% | 20% | |
| Seq Read (MB/s) | 1274 | 1122 -12% | 2551 100% | 1287 1% | 1810 42% | 2169 70% | 2860 124% |
| Seq Write (MB/s) | 1395 | 514 -63% | 2376 70% | 1280 -8% | 261.4 -81% | 1022 -27% | 2604 87% |
| 4K Read (MB/s) | 50.3 | 34.98 -30% | 52.7 5% | 49.57 -1% | 24.38 -52% | 38.43 -24% | 45.15 -10% |
| 4K Write (MB/s) | 119.8 | 96.8 -19% | 153 28% | 158 32% | 5.77 -95% | 92.8 -23% | 100.2 -16% |
| 4K-64 Read (MB/s) | 1599 | 492 -69% | 1406 -12% | 1043 -35% | 528 -67% | 970 -39% | 1428 -11% |
| 4K-64 Write (MB/s) | 1455 | 339.9 -77% | 1439 -1% | 1415 -3% | 90.7 -94% | 926 -36% | 1401 -4% |
| Access Time Read * (ms) | 0.044 | 0.056 -27% | 0.067 -52% | 0.039 11% | 0.2 -355% | 0.073 -66% | 0.049 -11% |
| Access Time Write * (ms) | 0.092 | 0.11 -20% | 0.027 71% | 0.027 71% | 0.748 -713% | 0.053 42% | 0.037 60% |
| Score Read (Points) | 1777 | 639 -64% | 1714 -4% | 1221 -31% | 733 -59% | 1226 -31% | 1759 -1% |
| Score Write (Points) | 1714 | 488 -72% | 1829 7% | 1701 -1% | 123 -93% | 1121 -35% | 1762 3% |
| Score Total (Points) | 4411 | 1434 -67% | 4418 0% | 3558 -19% | 1157 -74% | 2922 -34% | 4411 0% |
| Copy ISO MB/s (MB/s) | 2830 | 828 -71% | 2625 -7% | ||||
| Copy Program MB/s (MB/s) | 609 | 200.5 -67% | 495.9 -19% | ||||
| Copy Game MB/s (MB/s) | 1424 | 387.4 -73% | 1384 -3% |
* ... kleiner is beter

| 3DMark | |
| 1280x720 Cloud Gate Standard Graphics | |
| Lenovo Legion Y740-17IRH | |
| Razer Blade 15 GTX 1660 Ti | |
| Asus FX503VM-EH73 | |
| MSI GT72S-6QEG16SR421BW | |
| Acer Nitro 5 AN515-54-78TL | |
| Gainward GeForce GTX 1650 4 GB | |
| HP Pavilion Gaming 15-cx0003ng | |
| Gemiddeld NVIDIA GeForce GTX 1650 Max-Q (21759 - 53981, n=12) | |
| Lenovo Yoga 730-15IKB | |
| MSI Prestige 15 A10SC | |
| 1920x1080 Fire Strike Graphics | |
| Lenovo Legion Y740-17IRH | |
| Razer Blade 15 GTX 1660 Ti | |
| Asus FX503VM-EH73 | |
| MSI GT72S-6QEG16SR421BW | |
| Acer Nitro 5 AN515-54-78TL | |
| Gainward GeForce GTX 1650 4 GB | |
| Gemiddeld NVIDIA GeForce GTX 1650 Max-Q (6985 - 8618, n=12) | |
| MSI Prestige 15 A10SC | |
| HP Pavilion Gaming 15-cx0003ng | |
| Lenovo Yoga 730-15IKB | |
| 2560x1440 Time Spy Graphics | |
| Lenovo Legion Y740-17IRH | |
| Razer Blade 15 GTX 1660 Ti | |
| Asus FX503VM-EH73 | |
| Gainward GeForce GTX 1650 4 GB | |
| Acer Nitro 5 AN515-54-78TL | |
| MSI Prestige 15 A10SC | |
| Gemiddeld NVIDIA GeForce GTX 1650 Max-Q (2836 - 3238, n=10) | |
| MSI GT72S-6QEG16SR421BW | |
| HP Pavilion Gaming 15-cx0003ng | |
| Lenovo Yoga 730-15IKB | |
| 3DMark 11 | |
| 1280x720 Performance GPU | |
| Lenovo Legion Y740-17IRH | |
| Razer Blade 15 GTX 1660 Ti | |
| Asus FX503VM-EH73 | |
| Gainward GeForce GTX 1650 4 GB | |
| MSI GT72S-6QEG16SR421BW | |
| MSI Prestige 15 A10SC | |
| Gemiddeld NVIDIA GeForce GTX 1650 Max-Q (10248 - 12259, n=14) | |
| HP Pavilion Gaming 15-cx0003ng | |
| Lenovo Yoga 730-15IKB | |
| 1280x720 Performance Combined | |
| Lenovo Legion Y740-17IRH | |
| Gainward GeForce GTX 1650 4 GB | |
| Razer Blade 15 GTX 1660 Ti | |
| MSI Prestige 15 A10SC | |
| MSI GT72S-6QEG16SR421BW | |
| Gemiddeld NVIDIA GeForce GTX 1650 Max-Q (6409 - 10846, n=13) | |
| HP Pavilion Gaming 15-cx0003ng | |
| Asus FX503VM-EH73 | |
| Lenovo Yoga 730-15IKB | |
| 3DMark 11 Performance | 11613 punten | |
| 3DMark Cloud Gate Standard Score | 17802 punten | |
| 3DMark Fire Strike Score | 7103 punten | |
| 3DMark Time Spy Score | 3282 punten | |
Help | ||
| Shadow of the Tomb Raider | |
| 1280x720 Lowest Preset | |
| MSI GE75 9SG | |
| Gainward GeForce GTX 1650 4 GB | |
| Razer Blade Pro 17 4K UHD 120 Hz | |
| Lenovo Legion Y740-17IRH | |
| Alienware m15 P79F | |
| Gemiddeld NVIDIA GeForce GTX 1650 Max-Q (92 - 151, n=5) | |
| Razer Blade 15 GTX 1660 Ti | |
| MSI Prestige 15 A10SC | |
| Dell G3 3590 | |
| Asus GL753VD | |
| Asus TUF FX705GE-EW096T | |
| Dell Inspiron 15 5000 5585 | |
| Microsoft Surface Laptop 3 15 Ryzen 5 3580U | |
| Dell XPS 13 7390 2-in-1 Core i7 | |
| 1920x1080 Highest Preset AA:T | |
| MSI GE75 9SG | |
| Razer Blade Pro 17 4K UHD 120 Hz | |
| Alienware m15 P79F | |
| Lenovo Legion Y740-17IRH | |
| Razer Blade 15 GTX 1660 Ti | |
| Gainward GeForce GTX 1650 4 GB | |
| Gemiddeld NVIDIA GeForce GTX 1650 Max-Q (33 - 45, n=6) | |
| MSI Prestige 15 A10SC | |
| Asus TUF FX705GE-EW096T | |
| Asus GL753VD | |
| lage | gem. | hoge | ultra | |
|---|---|---|---|---|
| BioShock Infinite (2013) | 296.3 | 215.1 | 188.4 | 77 |
| The Witcher 3 (2015) | 155.4 | 94.1 | 54.8 | 30.8 |
| Rocket League (2017) | 196 | 128.2 | 88 | |
| Shadow of the Tomb Raider (2018) | 113 | 51 | 42 | 35 |
| MSI Prestige 15 A10SC GeForce GTX 1650 Max-Q, i7-10710U, Samsung SSD PM981 MZVLB1T0HALR | Microsoft Surface Laptop 3 15 Ryzen 5 3580U Vega 9, R5 3580U, SK hynix BC501 HFM256GDGTNG | MSI P65 Creator 9SF-657 GeForce RTX 2070 Max-Q, i9-9880H, 2x Samsung SSD PM981 MZVLB512HAJQ (RAID 0) | Lenovo ThinkPad T590-20N4002VGE GeForce MX250, i7-8565U, Toshiba XG6 KXG60ZNV512G | Dell Latitude 5500 UHD Graphics 620, i7-8665U, Toshiba XG6 KXG60ZNV1T02 | HP EliteBook 755 G5 3UN79EA Vega 10, R7 2700U, Toshiba XG5 KXG50ZNV512G | Dell Precision 5530 Xeon E-2176M Quadro P2000, E-2176M, SK hynix PC400 512 GB | |
|---|---|---|---|---|---|---|---|
| Noise | 6% | -9% | 4% | 9% | 0% | -7% | |
| uit / omgeving * (dB) | 29.3 | 28 4% | 30.2 -3% | 29.4 -0% | 28.8 2% | 30.5 -4% | 28.4 3% |
| Idle Minimum * (dB) | 30.1 | 28 7% | 32.8 -9% | 29.3 3% | 28.8 4% | 30.5 -1% | 28.4 6% |
| Idle Average * (dB) | 30.2 | 28 7% | 32.8 -9% | 29.3 3% | 28.8 5% | 30.5 -1% | 28.4 6% |
| Idle Maximum * (dB) | 30.2 | 28 7% | 33.6 -11% | 31.8 -5% | 28.8 5% | 30.5 -1% | 28.4 6% |
| Load Average * (dB) | 31.5 | 29.2 7% | 40.9 -30% | 33.5 -6% | 30.3 4% | 37.5 -19% | 46.5 -48% |
| Witcher 3 ultra * (dB) | 37 | 39 -5% | 33.5 9% | 46.5 -26% | |||
| Load Maximum * (dB) | 47 | 41.4 12% | 42.7 9% | 35.8 24% | 32.6 31% | 35 26% | 46.5 1% |
* ... kleiner is beter
Geluidsniveau
| Onbelast |
| 30.1 / 30.2 / 30.2 dB (A) |
| Belasting |
| 31.5 / 47 dB (A) |
 | ||
30 dB stil 40 dB(A) hoorbaar 50 dB(A) luid |
||
min: | ||
(-) De maximumtemperatuur aan de bovenzijde bedraagt 56 °C / 133 F, vergeleken met het gemiddelde van 36.8 °C / 98 F, variërend van 21 tot 71 °C voor de klasse Multimedia.
(-) De bodem warmt op tot een maximum van 60.6 °C / 141 F, vergeleken met een gemiddelde van 39.1 °C / 102 F
(+) Bij onbelast gebruik bedraagt de gemiddelde temperatuur voor de bovenzijde 27.2 °C / 81 F, vergeleken met het apparaatgemiddelde van 31.3 °C / 88 F.
(-) Bij het spelen van The Witcher 3 is de gemiddelde temperatuur voor de bovenzijde 39.4 °C / 103 F, vergeleken met het apparaatgemiddelde van 31.3 °C / 88 F.
(+) De handpalmsteunen en het touchpad bereiken maximaal de huidtemperatuur (34.6 °C / 94.3 F) en zijn dus niet heet.
(-) De gemiddelde temperatuur van de handpalmsteun van soortgelijke toestellen bedroeg 28.7 °C / 83.7 F (-5.9 °C / -10.6 F).
MSI Prestige 15 A10SC audioanalyse
(±) | luidspreker luidheid is gemiddeld maar goed (80.1 dB)
Bas 100 - 315 Hz
(±) | verminderde zeebaars - gemiddeld 12.8% lager dan de mediaan
(+) | de lage tonen zijn lineair (6.4% delta naar de vorige frequentie)
Midden 400 - 2000 Hz
(+) | evenwichtige middens - slechts 4.6% verwijderd van de mediaan
(±) | lineariteit van de middentonen is gemiddeld (10% delta ten opzichte van de vorige frequentie)
Hoog 2 - 16 kHz
(+) | evenwichtige hoogtepunten - slechts 2.4% verwijderd van de mediaan
(+) | de hoge tonen zijn lineair (6.4% delta naar de vorige frequentie)
Algemeen 100 - 16.000 Hz
(±) | lineariteit van het totale geluid is gemiddeld (20.2% verschil met de mediaan)
Vergeleken met dezelfde klasse
» 68% van alle geteste apparaten in deze klasse waren beter, 8% vergelijkbaar, 24% slechter
» De beste had een delta van 5%, het gemiddelde was 17%, de slechtste was 45%
Vergeleken met alle geteste toestellen
» 52% van alle geteste apparaten waren beter, 8% gelijk, 39% slechter
» De beste had een delta van 4%, het gemiddelde was 24%, de slechtste was 134%
Apple MacBook 12 (Early 2016) 1.1 GHz audioanalyse
(+) | luidsprekers kunnen relatief luid spelen (83.6 dB)
Bas 100 - 315 Hz
(±) | verminderde zeebaars - gemiddeld 11.3% lager dan de mediaan
(±) | lineariteit van de lage tonen is gemiddeld (14.2% delta ten opzichte van de vorige frequentie)
Midden 400 - 2000 Hz
(+) | evenwichtige middens - slechts 2.4% verwijderd van de mediaan
(+) | de middentonen zijn lineair (5.5% delta ten opzichte van de vorige frequentie)
Hoog 2 - 16 kHz
(+) | evenwichtige hoogtepunten - slechts 2% verwijderd van de mediaan
(+) | de hoge tonen zijn lineair (4.5% delta naar de vorige frequentie)
Algemeen 100 - 16.000 Hz
(+) | het totale geluid is lineair (10.2% verschil met de mediaan)
Vergeleken met dezelfde klasse
» 7% van alle geteste apparaten in deze klasse waren beter, 2% vergelijkbaar, 91% slechter
» De beste had een delta van 5%, het gemiddelde was 18%, de slechtste was 53%
Vergeleken met alle geteste toestellen
» 5% van alle geteste apparaten waren beter, 1% gelijk, 94% slechter
» De beste had een delta van 4%, het gemiddelde was 24%, de slechtste was 134%
| Uit / Standby | |
| Inactief | |
| Belasting |
|
Key:
min: | |
| MSI Prestige 15 A10SC i7-10710U, GeForce GTX 1650 Max-Q, Samsung SSD PM981 MZVLB1T0HALR, IPS, 3840x2160, 15.6" | Microsoft Surface Laptop 3 15 Ryzen 5 3580U R5 3580U, Vega 9, SK hynix BC501 HFM256GDGTNG, IPS, 2496x1664, 15" | Lenovo ThinkPad T590-20N4002VGE i7-8565U, GeForce MX250, Toshiba XG6 KXG60ZNV512G, aSi IPS LED, 1920x1080, 15.6" | Dell Latitude 5500 i7-8665U, UHD Graphics 620, Toshiba XG6 KXG60ZNV1T02, IPS, 1920x1080, 15.6" | HP EliteBook 755 G5 3UN79EA R7 2700U, Vega 10, Toshiba XG5 KXG50ZNV512G, IPS, 1920x1080, 15.6" | MSI P65 Creator 9SF-657 i9-9880H, GeForce RTX 2070 Max-Q, 2x Samsung SSD PM981 MZVLB512HAJQ (RAID 0), IPS, 3840x2160, 15.6" | Dell Precision 5530 Xeon E-2176M E-2176M, Quadro P2000, SK hynix PC400 512 GB, IGZO, 3840x2160, 15.6" | |
|---|---|---|---|---|---|---|---|
| Power Consumption | 46% | 29% | 40% | 33% | -53% | -24% | |
| Idle Minimum * (Watt) | 6.1 | 3.3 46% | 4.1 33% | 4.4 28% | 5 18% | 9.4 -54% | 9.8 -61% |
| Idle Average * (Watt) | 13.2 | 7.1 46% | 8.3 37% | 6.9 48% | 10.6 20% | 17.4 -32% | 16.8 -27% |
| Idle Maximum * (Watt) | 19.2 | 7.2 62% | 11.8 39% | 7.7 60% | 12.9 33% | 19.6 -2% | 16.9 12% |
| Load Average * (Watt) | 75 | 44.8 40% | 61.6 18% | 43.6 42% | 40.6 46% | 103 -37% | 102.3 -36% |
| Witcher 3 ultra * (Watt) | 74 | 45.1 39% | 54.4 26% | 76.5 -3% | |||
| Load Maximum * (Watt) | 89.7 | 53 41% | 69.4 23% | 69.1 23% | 46.6 48% | 216 -141% | 114.5 -28% |
* ... kleiner is beter
| MSI Prestige 15 A10SC i7-10710U, GeForce GTX 1650 Max-Q, 82 Wh | Microsoft Surface Laptop 3 15 Ryzen 5 3580U R5 3580U, Vega 9, 45 Wh | Lenovo ThinkPad T590-20N4002VGE i7-8565U, GeForce MX250, 57 Wh | Dell Latitude 5500 i7-8665U, UHD Graphics 620, 68 Wh | HP EliteBook 755 G5 3UN79EA R7 2700U, Vega 10, 56 Wh | MSI P65 Creator 9SF-657 i9-9880H, GeForce RTX 2070 Max-Q, 82 Wh | Dell Precision 5530 Xeon E-2176M E-2176M, Quadro P2000, 97 Wh | |
|---|---|---|---|---|---|---|---|
| Batterijduur | -0% | 53% | 62% | -16% | -40% | -6% | |
| Reader / Idle (h) | 19.1 | 18.7 -2% | 11.9 -38% | 9.6 -50% | 16.5 -14% | ||
| WiFi v1.3 (h) | 7.6 | 9.1 20% | 10.5 38% | 12.3 62% | 8.3 9% | 6 -21% | 8.4 11% |
| Load (h) | 2.1 | 1.7 -19% | 3.5 67% | 1.7 -19% | 1.1 -48% | 1.8 -14% |
Pro
Contra
Verdict - Awesome with a Few Nicks
Dit is de verkorte versie van het originele artikel. Het volledige, Engelse testrapport vind je hier.
(November 14, 2019 update: we kunnen het CPU throttlen op een tweede Prestige 15 testmodel niet reproduceren. Kloksnelheden en interne temperaturen stabiliseren op respectievelijk 2.8 GHz en 95 C in het tweede testmodel. Deze interne temperaturen zijn nog steeds hoger dan we graag zien. We raden dan ook aan om het systeem up-to-date te houden met de MSI Drivers en App Center en zo een oogje op de CPU temperaturen te kunnen houden bij belasting.)
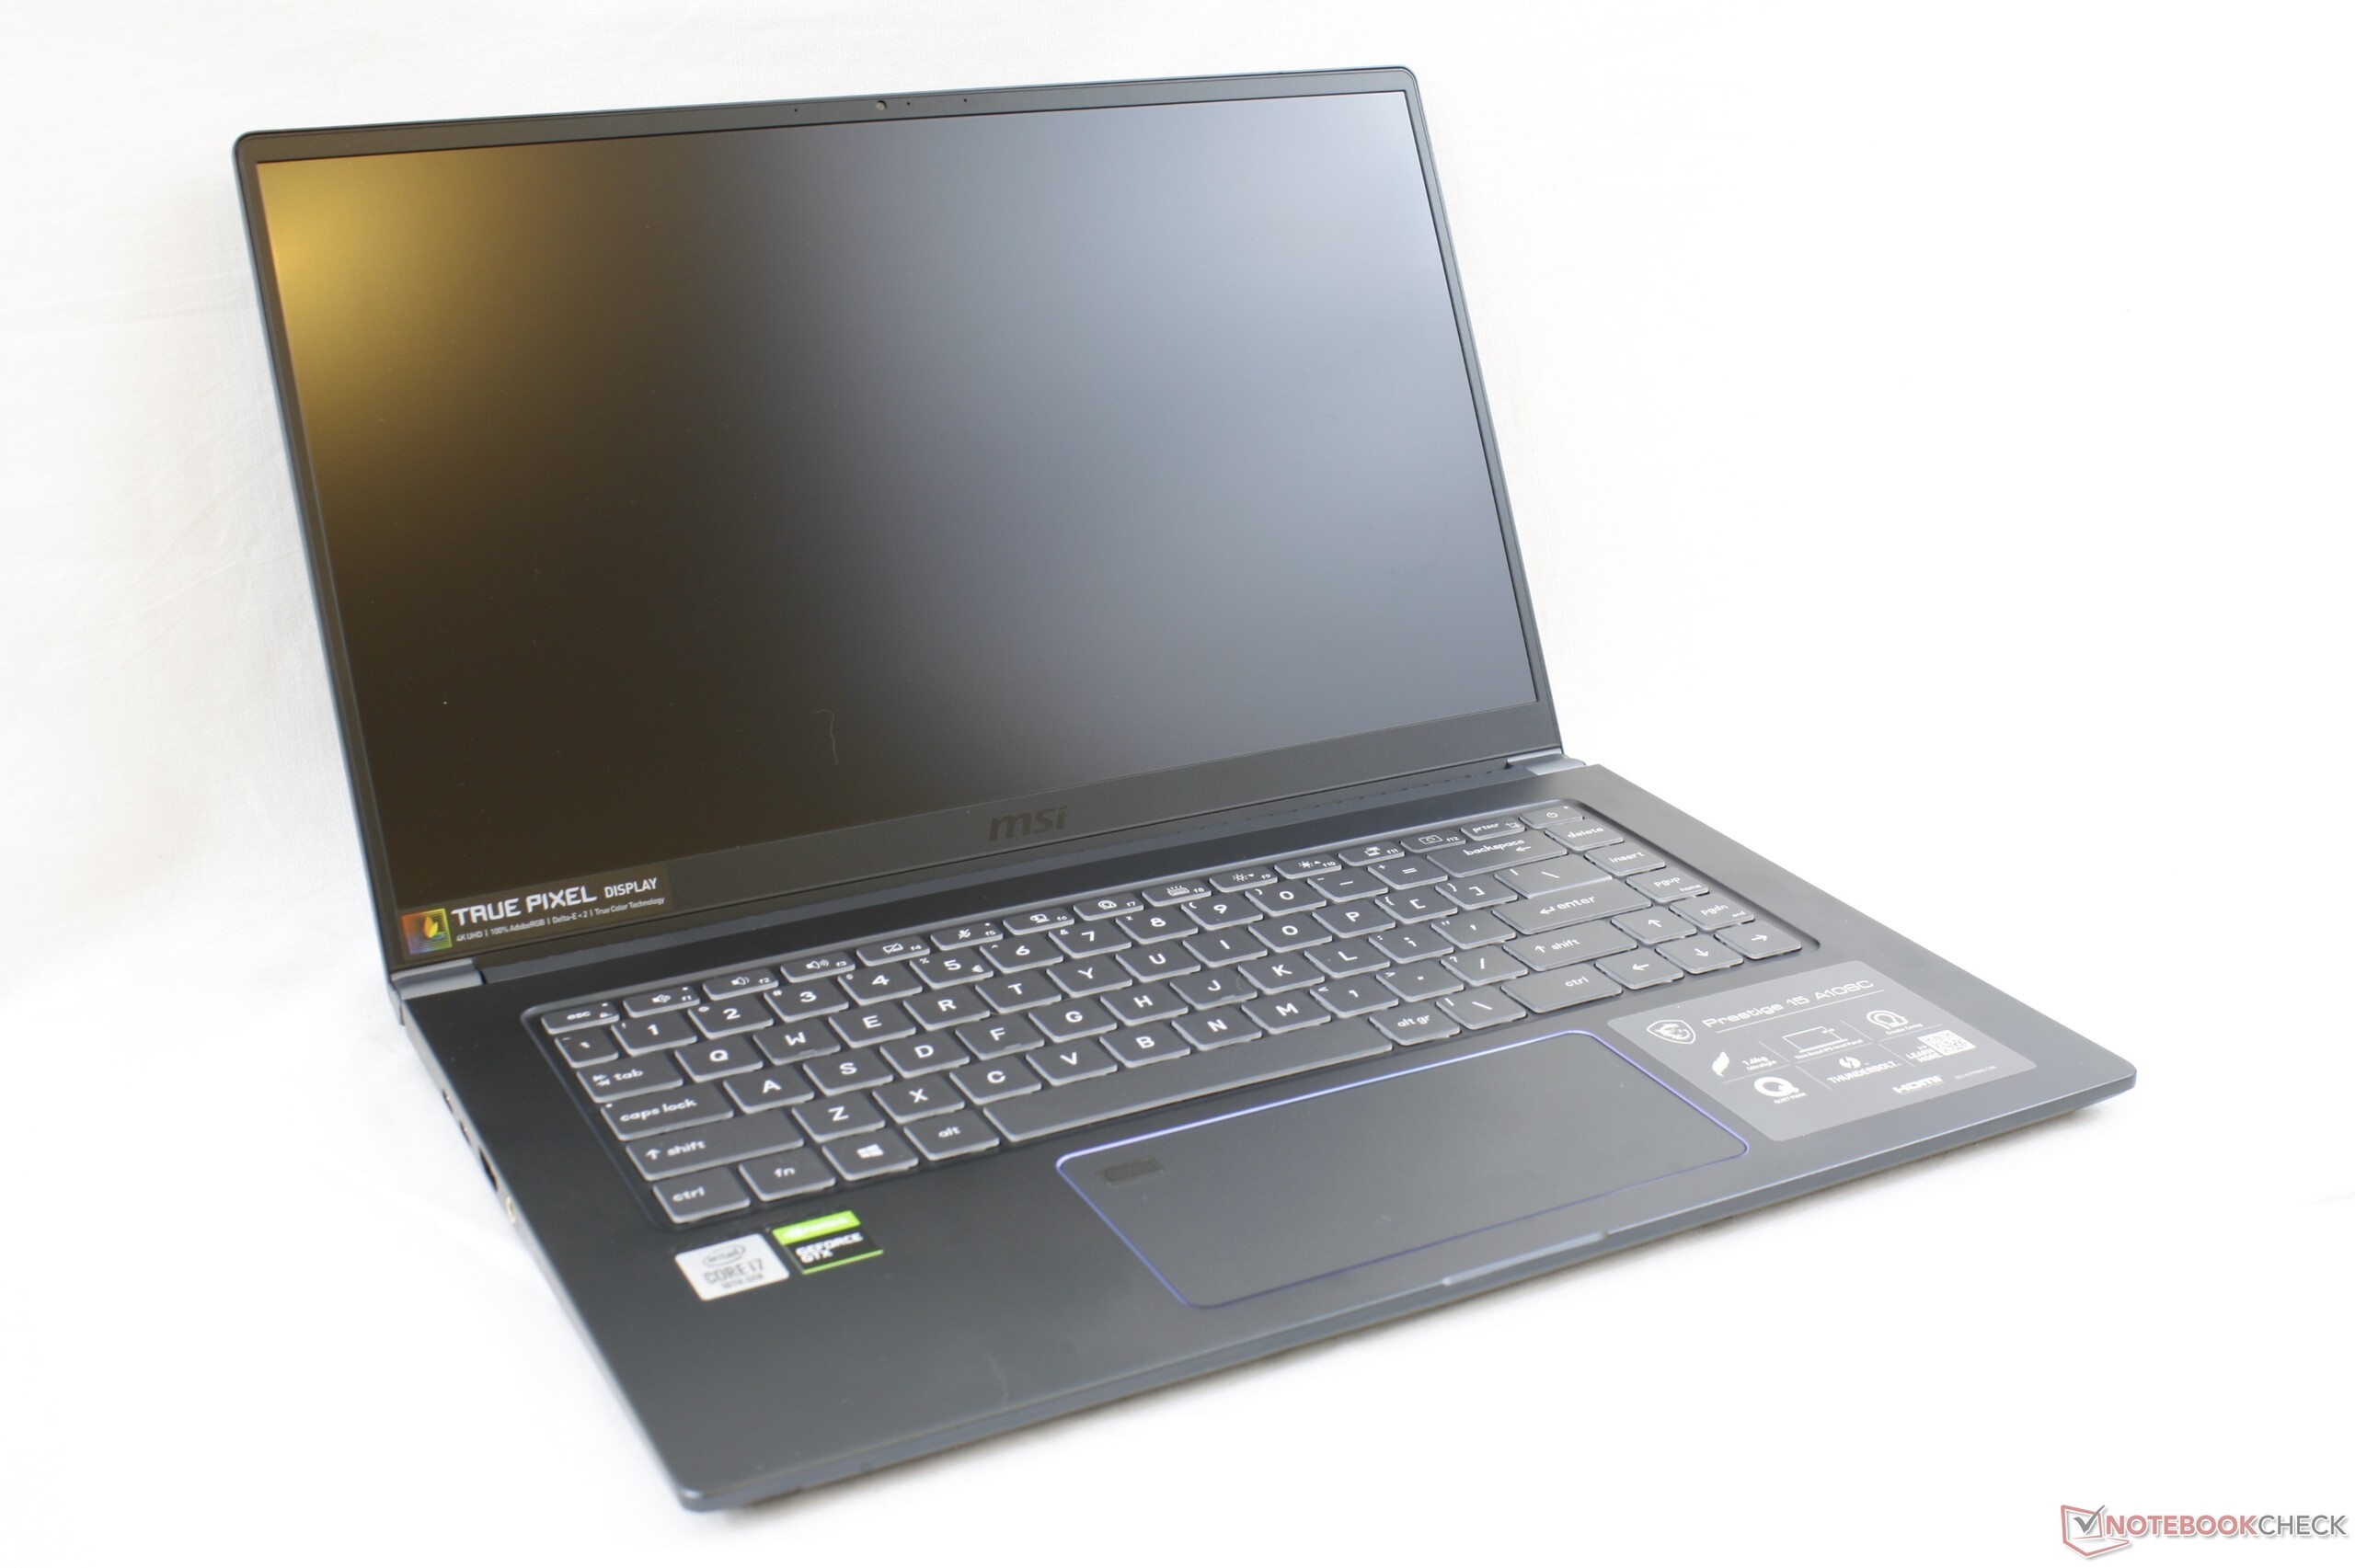
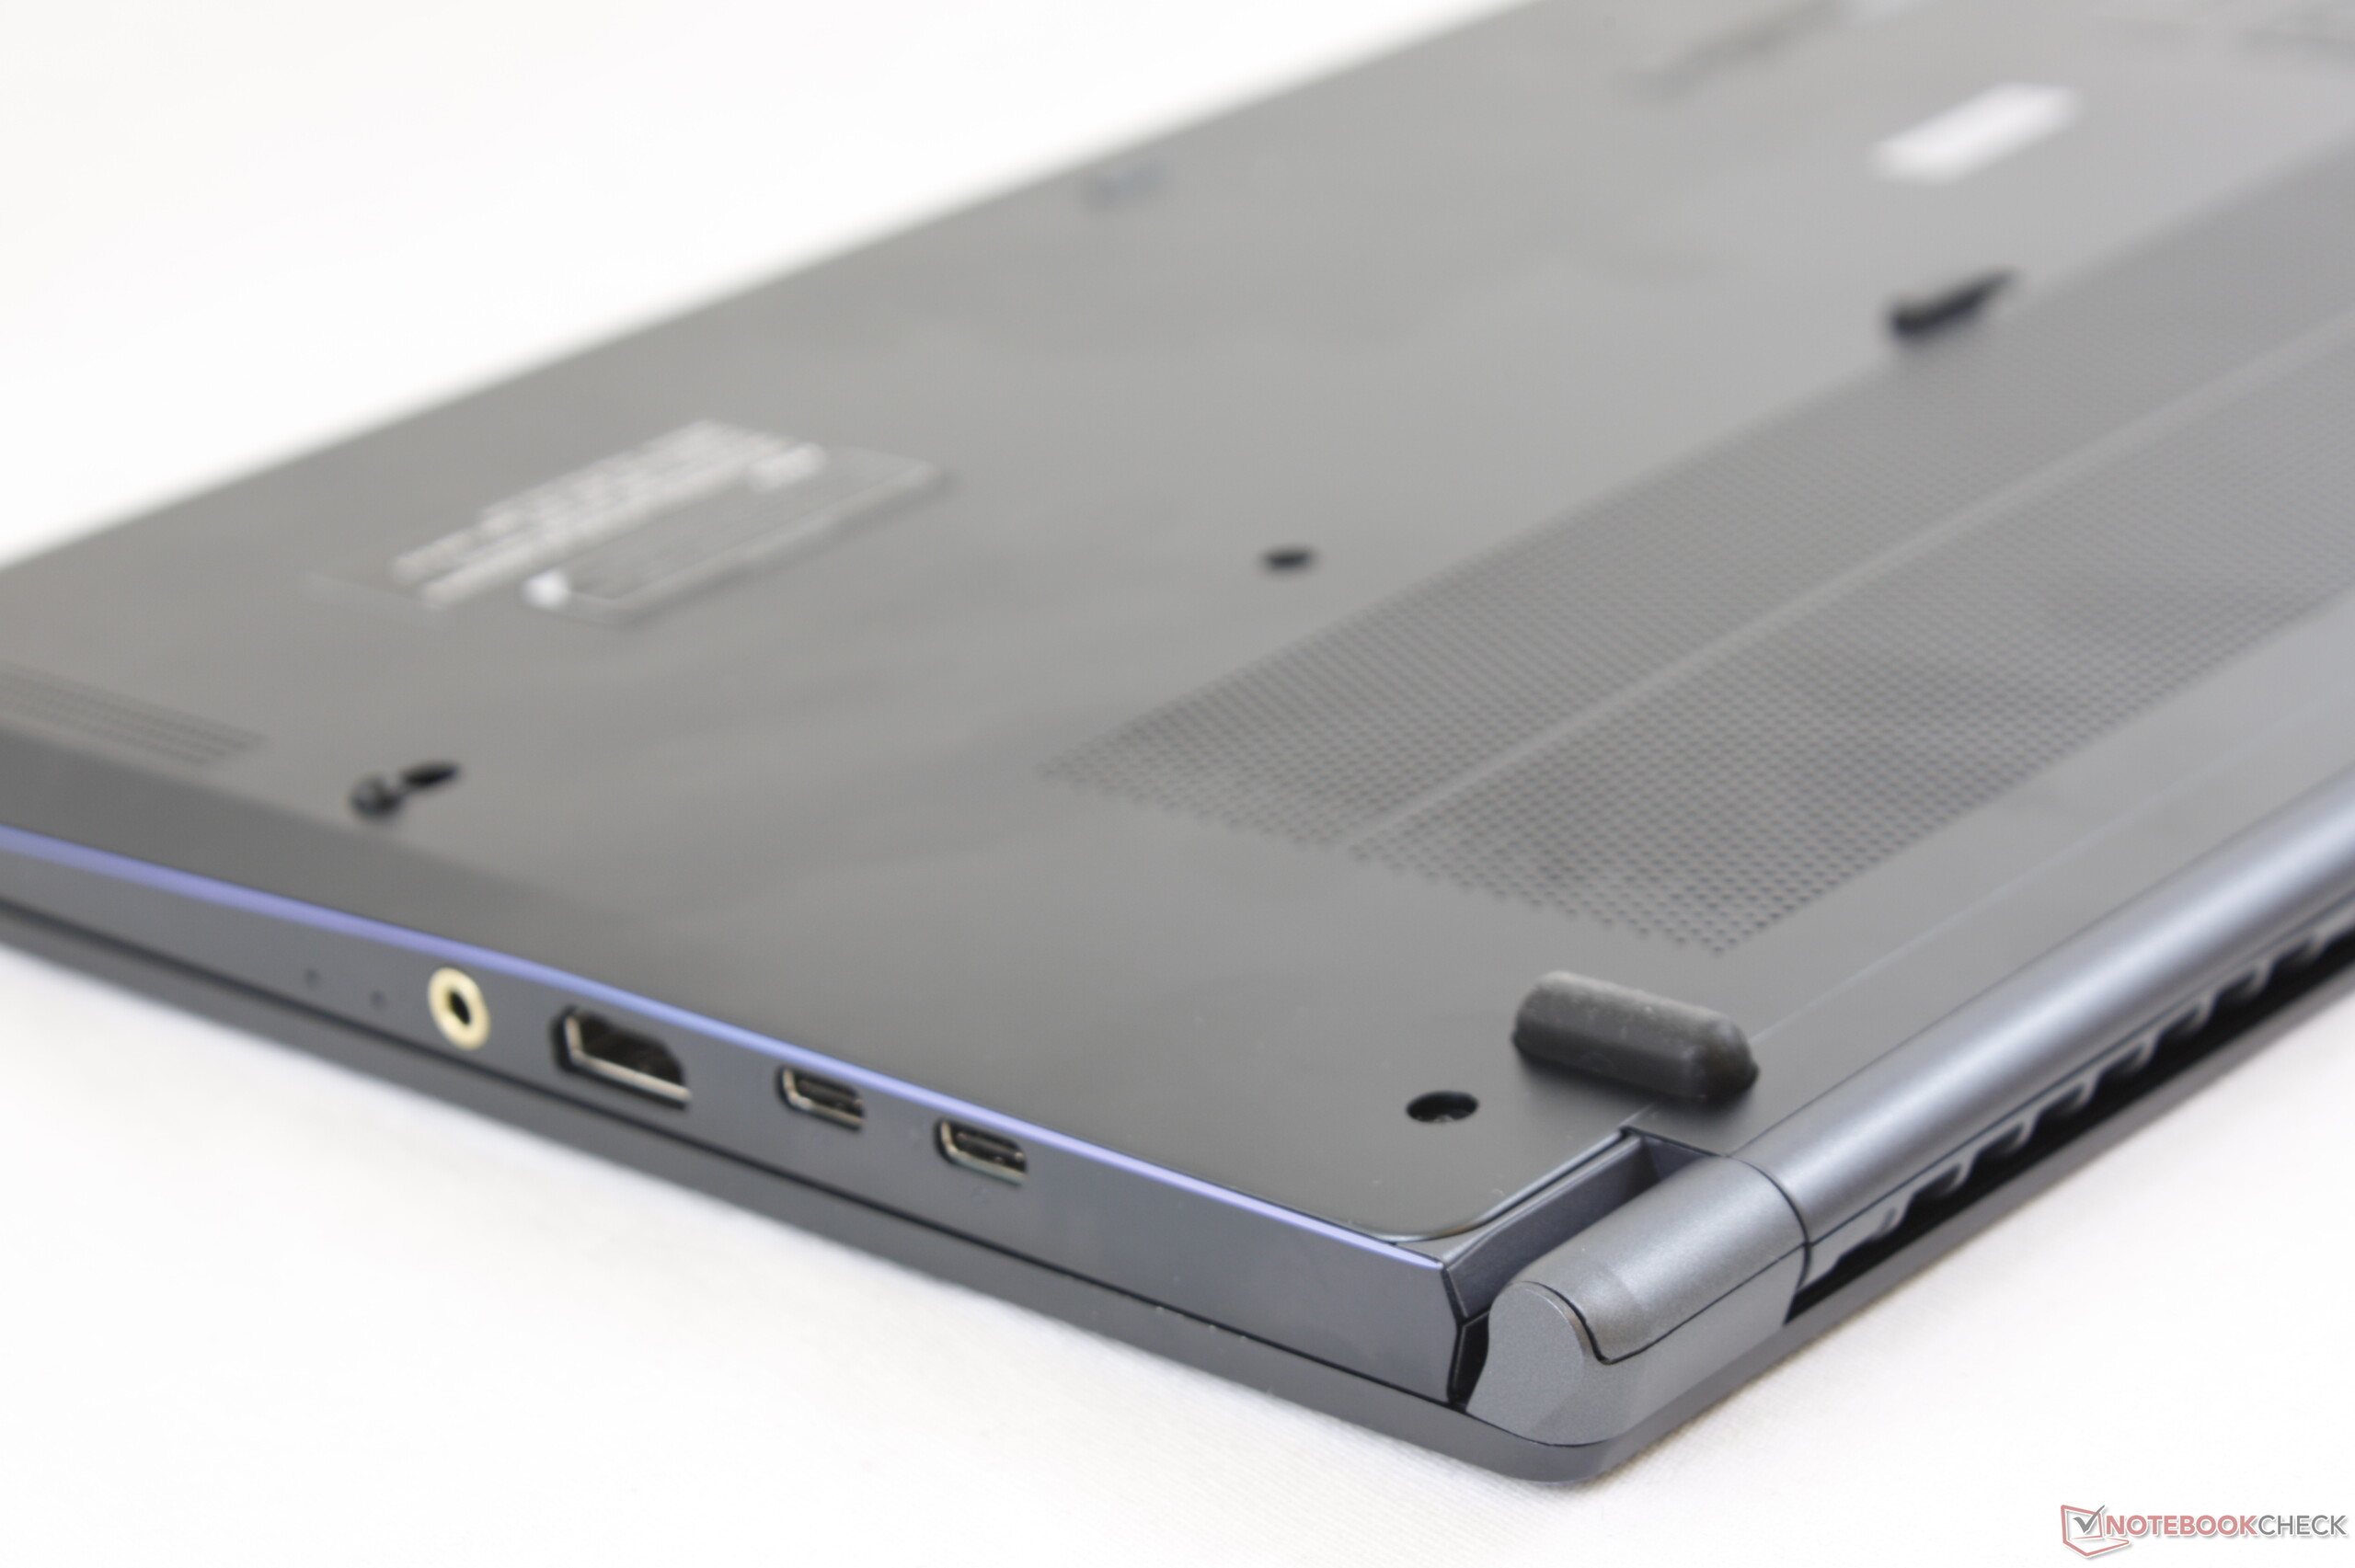
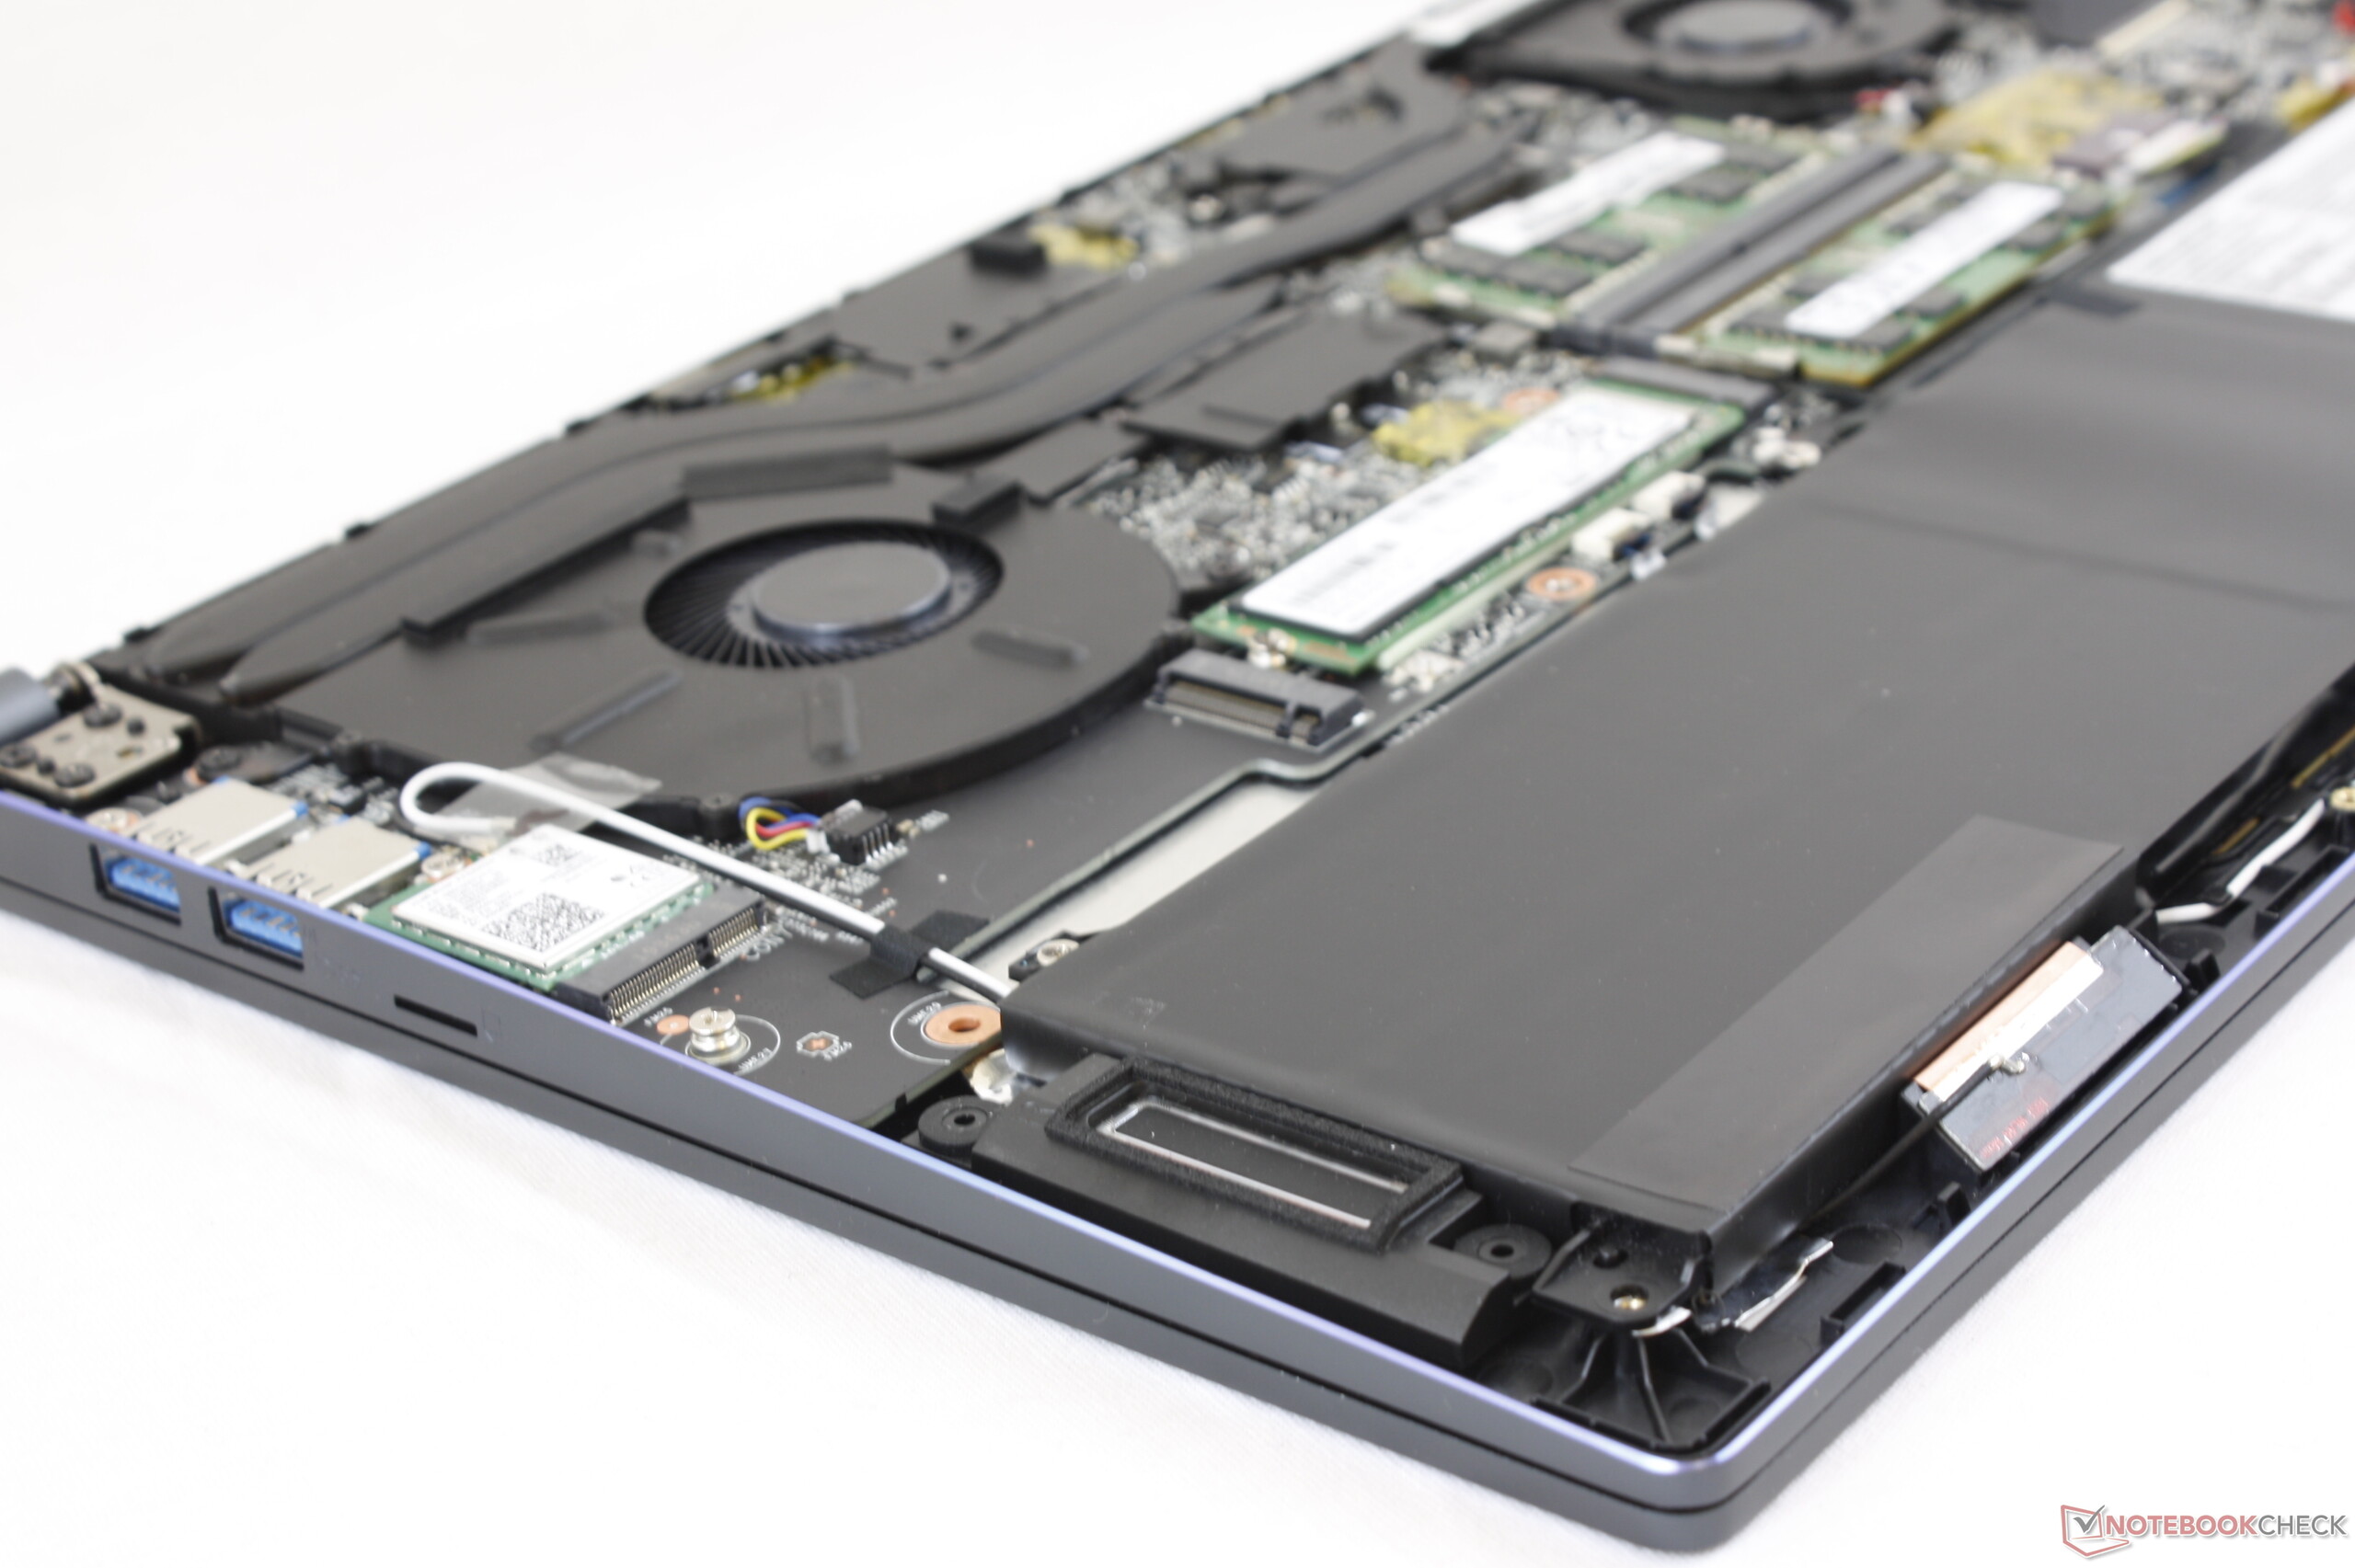
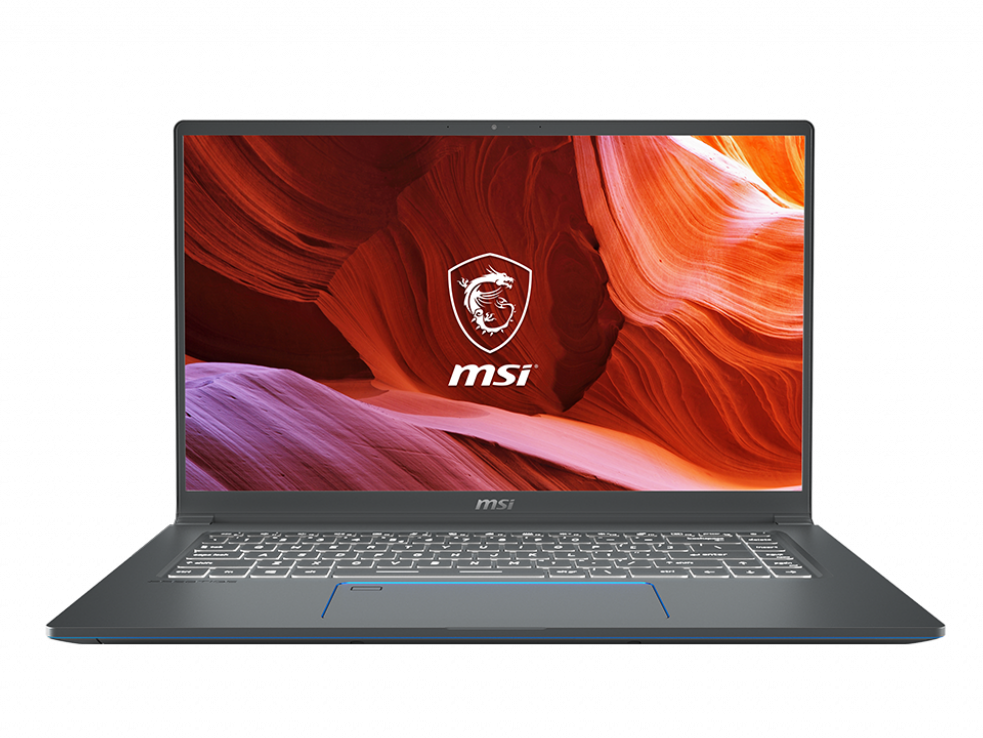
De Prestige 15 is bewijs dat MSI meer kan het produceren van game producten. De laptop is qua uiterlijk net zo aantrekkelijk als de XPS 15, ZenBook 15 of Spectre x360 15 terwijl het wel lichter is en over het algemeen flexibeler. De laptop is met name voor mobiel gebruik erg handig vanwege zijn USB Type-C oplader. De hexa-core Comet Lake-U CPU is een erg goed alternatief voor de quad-core Coffee Lake-H. Ondertussen is het 4K UHD paneel helderder en heeft fabriekaf een hogere kleurechtheid dan wat de meeste 15.6-inch Ultrabooks aanbieden, inclusief de eerder genoemde Asus en HP. Fluctuerende ventilatorgeluiden zijn ook minder waarschijnlijk bij zware ladingen dan Ultrabooks met veeleisender Intel H-serie processoren.
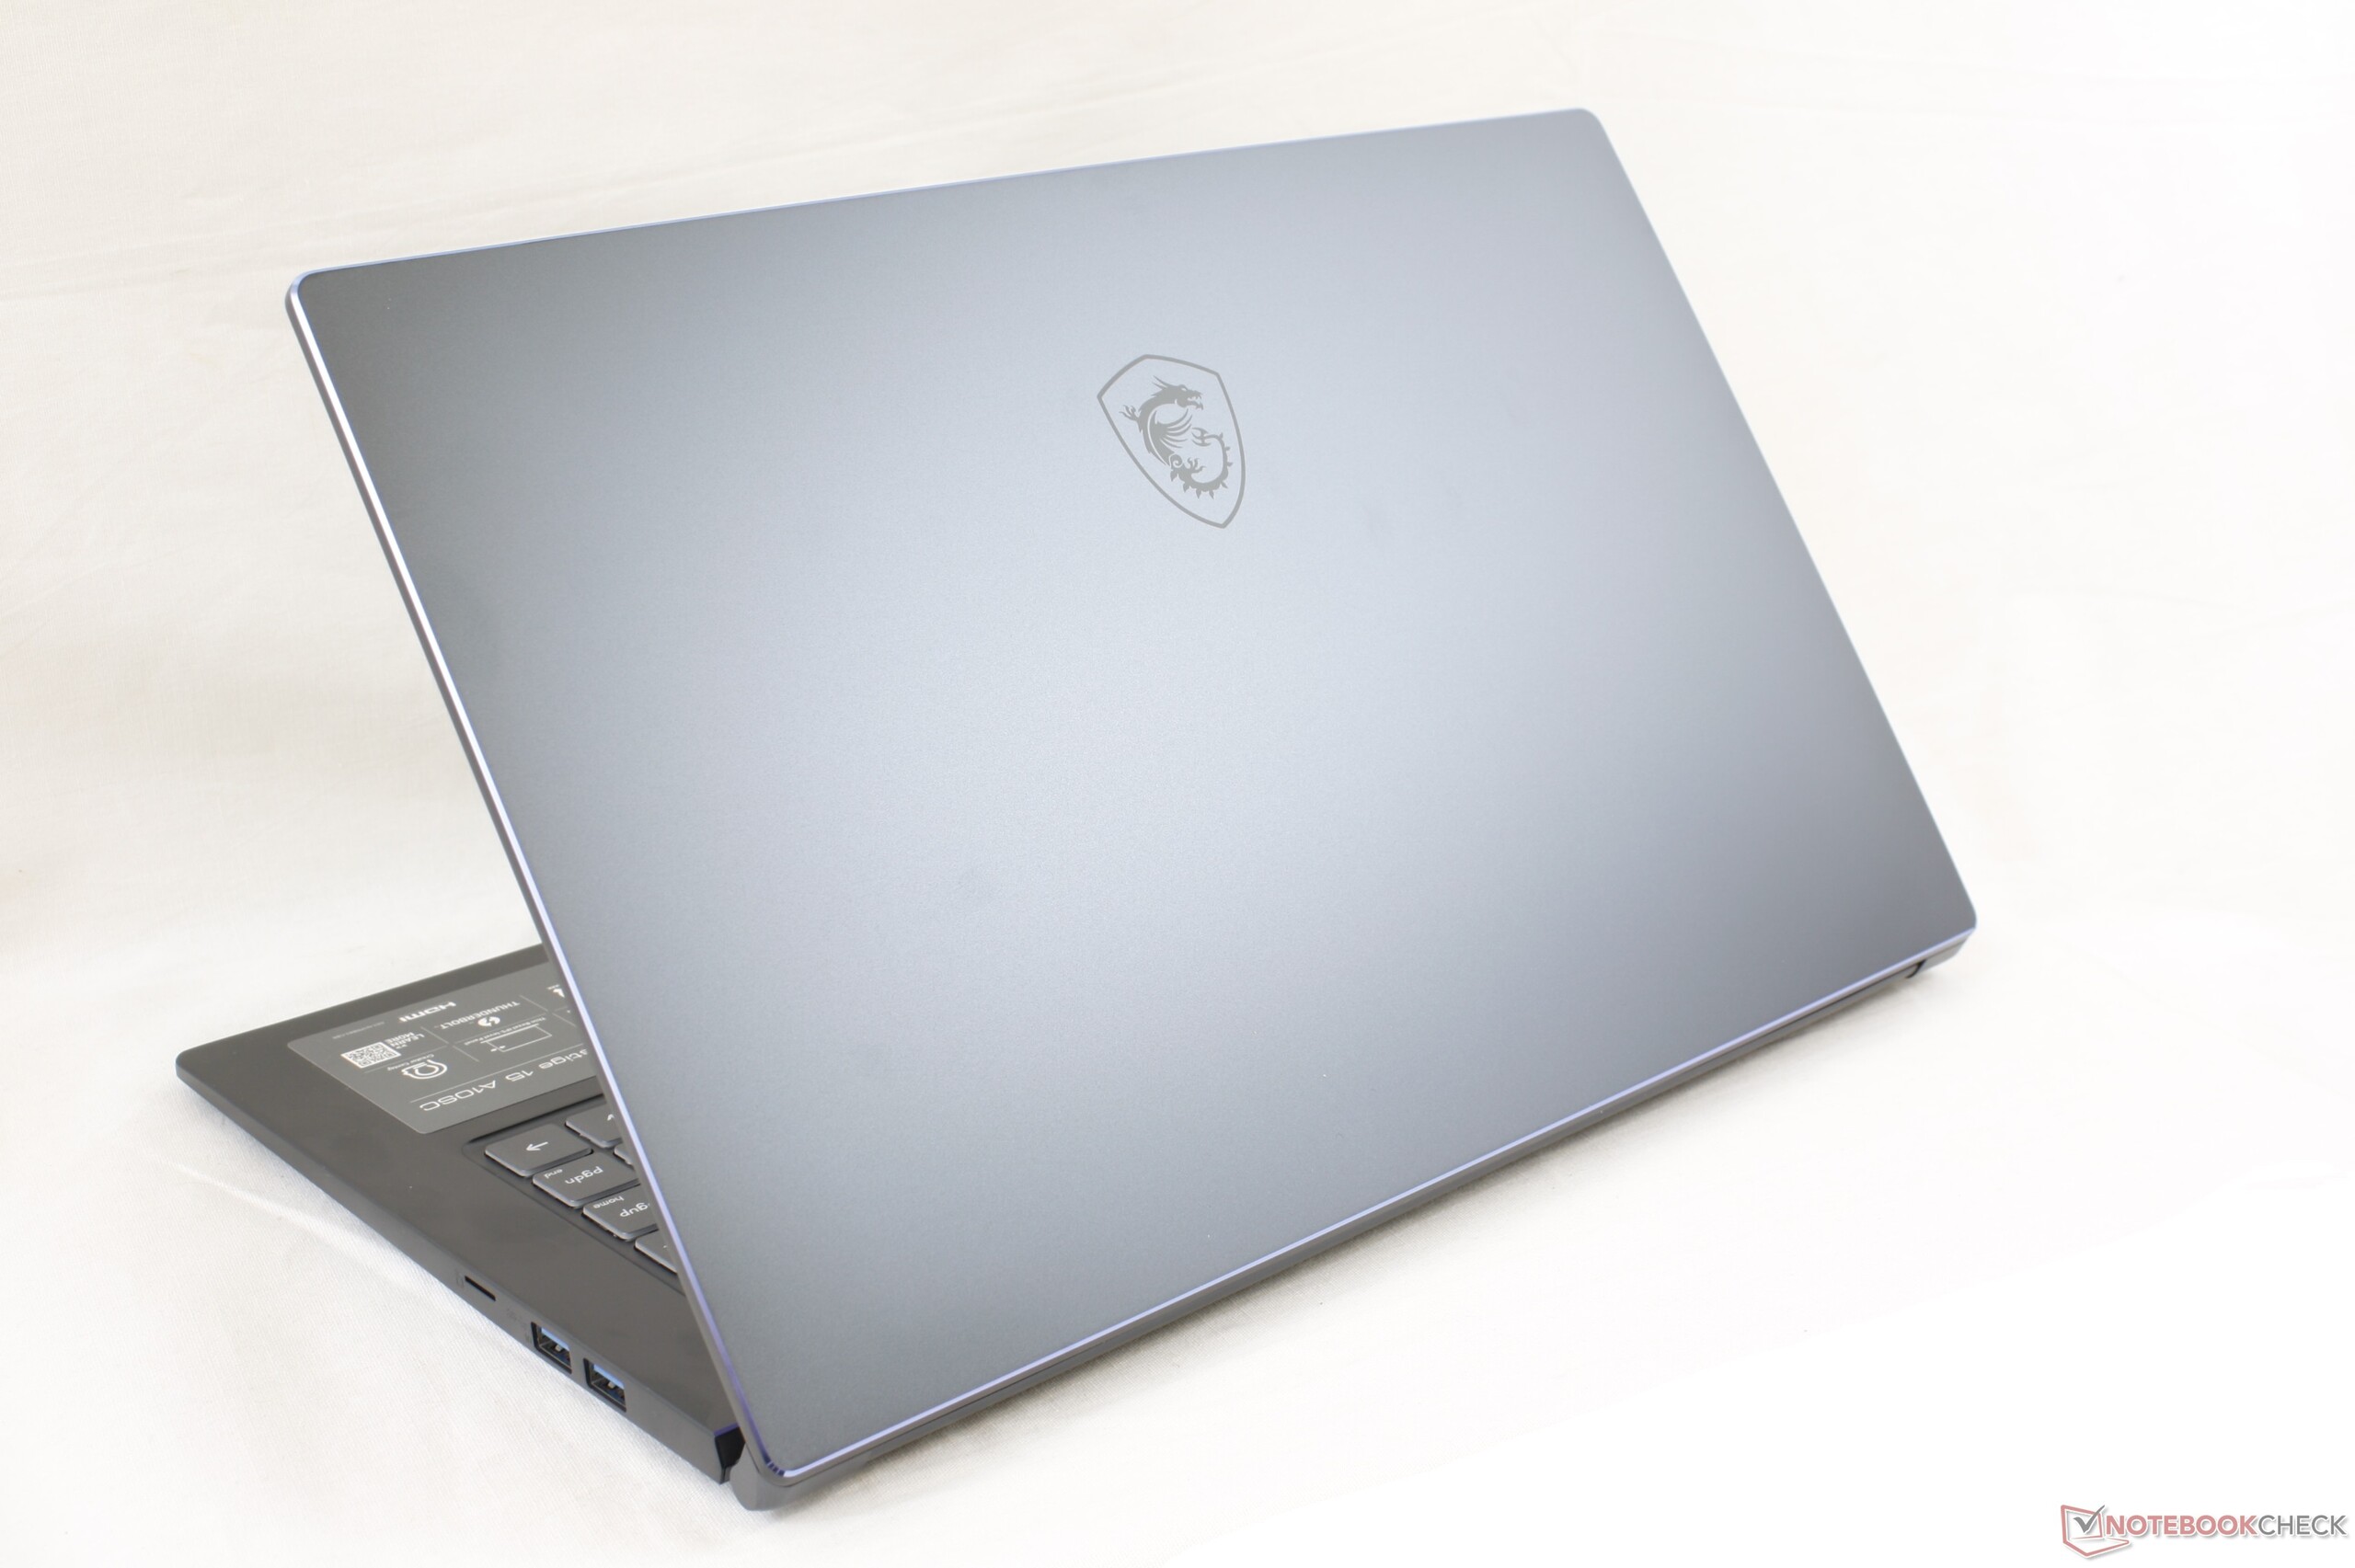
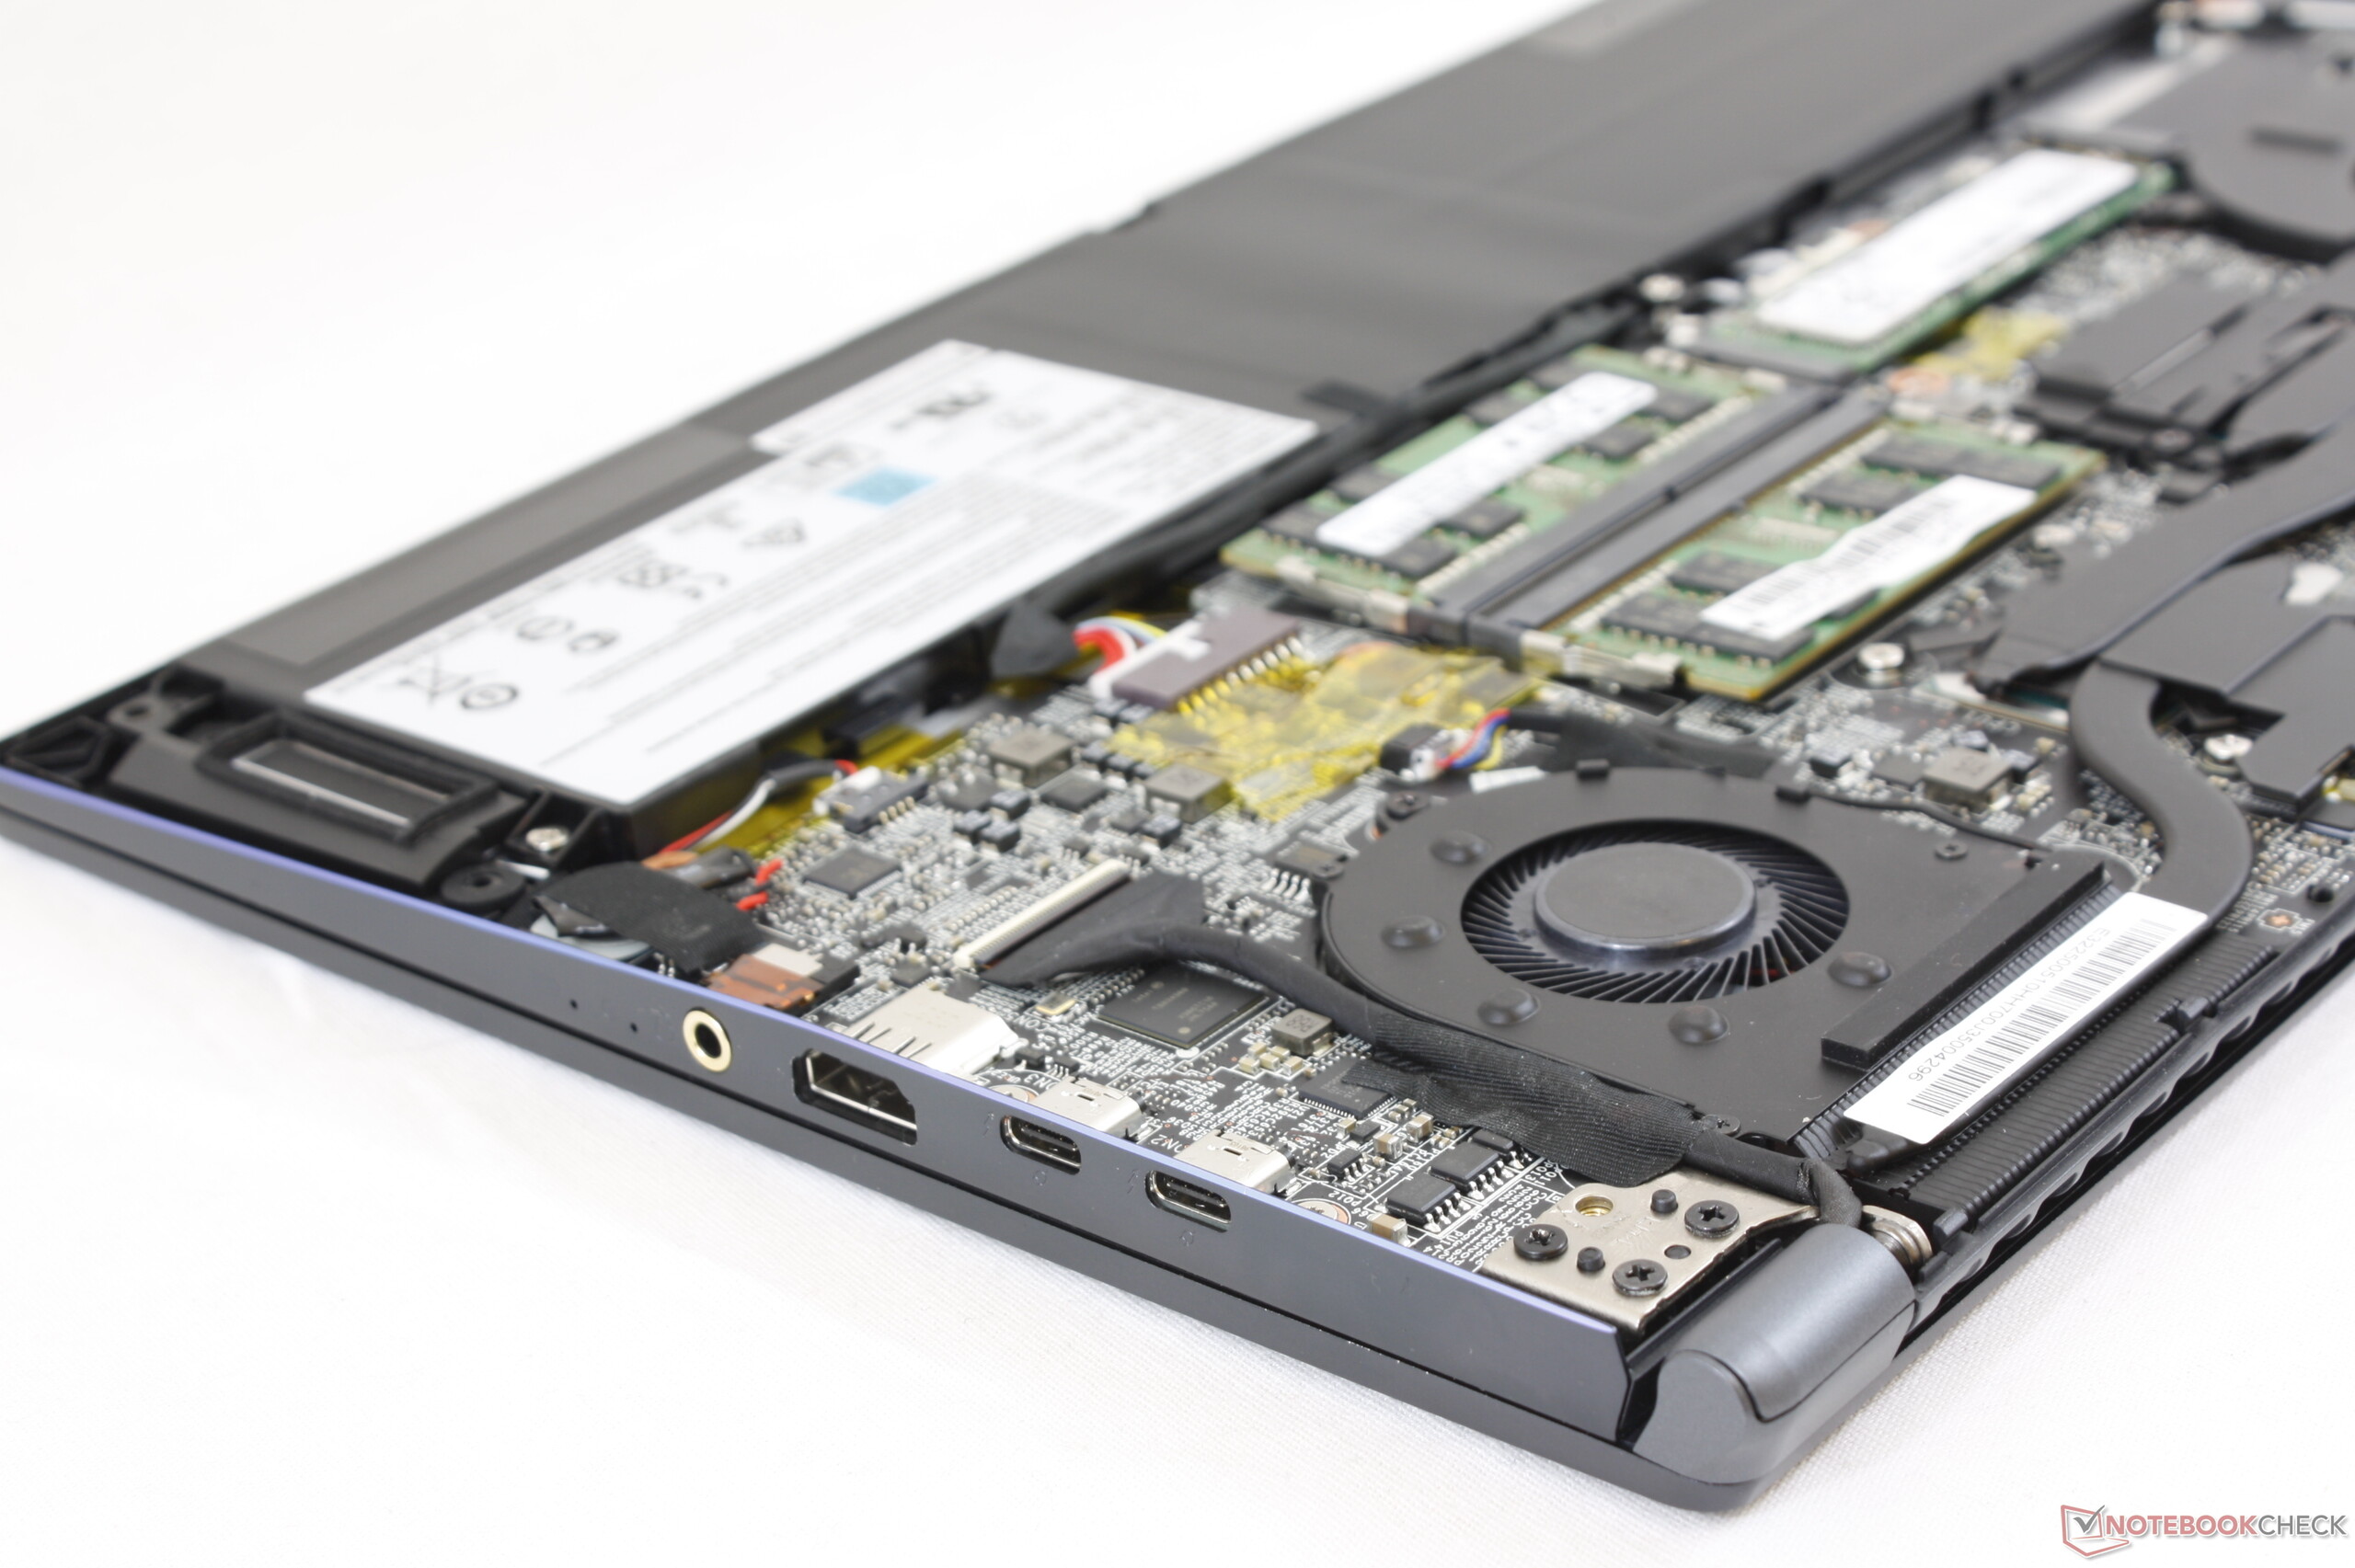
Er is zeker veel dat MSI kan doen om de Prestig 15 te verbeteren. Het ontbreken van een Kensington Lock en IR camera zijn merkwaardige tekortkomingen op een high-end zakelijk notebook. De behuizing kan wat robuuster zijn aangezien deze niet zo stevig aanvoelt als een vlaggenschip van Dell of HP. CPU throttling onder 100% CPU belasting kan beter worden behandeld. Hoewel het systeem gebruik maakt van een ULV Intel CPU en Max-Q Nvidia GPU zijn temperaturen nog steeds hoog onder ladingen. Het toetsenbord en touchpad knoppen voelen wat sponzig aan en kunnen wat steviger zijn.
De MSI Prestige 15 heeft een goed balans gevonden tussen gewicht, schermkwaliteit, CPU prestaties, GPU prestaties en poort opties. De robuustheid van de behuizing, de feedback van het toetsenbord en touchpad, CPU throttling en wat andere beveiligingsfuncties worden hopelijk aangepast bij toekomstige modellen.
MSI Prestige 15 A10SC
- 14-11-2019 v7 (old)
Allen Ngo
Price comparison
