Kort testrapport Surface Laptop 3 15 Ryzen 5: Microsoft kan beter
Evaluatie | Datum | Model | Gewicht | Hoogte | Formaat | Resolutie | Beste prijs |
|---|---|---|---|---|---|---|---|
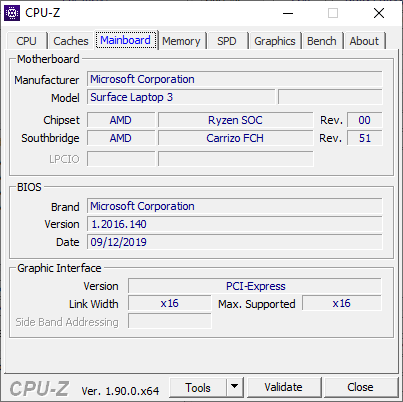
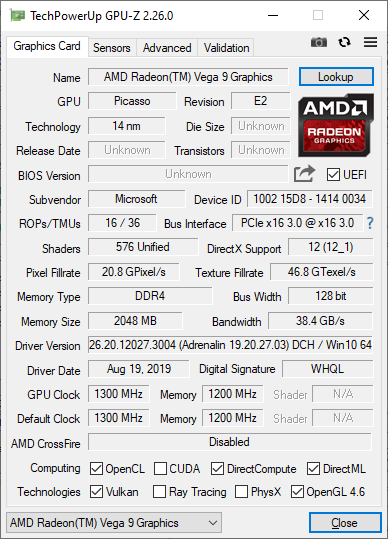
| 82.9 % v7 (old) | 10-2019 | Microsoft Surface Laptop 3 15 Ryzen 5 3580U R5 3580U, Vega 9 | 1.5 kg | 14.7 mm | 15.00" | 2496x1664 | |
| 86.3 % v7 (old) | 09-2019 | Dell XPS 15 7590 i5 iGPU FHD i5-9300H, UHD Graphics 630 | 1.9 kg | 17 mm | 15.60" | 1920x1080 | |
| 87.9 % v7 (old) | 07-2018 | Apple MacBook Pro 15 2018 (2.6 GHz, 560X) i7-8850H, Radeon Pro 560X | 1.8 kg | 15.5 mm | 15.40" | 2880x1800 | |
| 83.9 % v7 (old) | 03-2019 | HP Spectre x360 15-df0126ng i7-8750H, GeForce GTX 1050 Ti Max-Q | 2.2 kg | 19.3 mm | 15.60" | 3840x2160 | |
| 90 % v6 (old) | Lenovo ThinkPad X1 Carbon 2018-20KGS5DU00 i5-8550U, UHD Graphics 620 | 1.1 kg | 15.95 mm | 14.00" | 2560x1440 |
| |||||||||||||||||||||||||
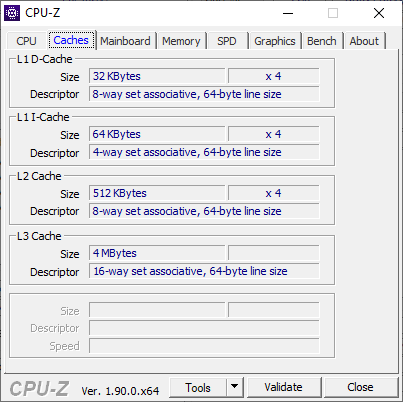
Helderheidsverdeling: 86 %
Helderheid in Batterij-modus: 403.4 cd/m²
Contrast: 1042:1 (Zwart: 0.4 cd/m²)
ΔE ColorChecker Calman: 2.75 | ∀{0.5-29.43 Ø4.71}
calibrated: 0.71
ΔE Greyscale Calman: 1.8 | ∀{0.09-98 Ø4.96}
99.4% sRGB (Argyll 1.6.3 3D)
63.4% AdobeRGB 1998 (Argyll 1.6.3 3D)
63.7% AdobeRGB 1998 (Argyll 3D)
99.3% sRGB (Argyll 3D)
66.9% Display P3 (Argyll 3D)
Gamma: 2.09
CCT: 6646 K
| Microsoft Surface Laptop 3 15 Ryzen 5 3580U Sharp LQ150P1JX51, IPS, 15", 2496x1664 | Microsoft Surface Laptop 2-LQN-00004 VVX14T092N00, IPS, 13.5", 2256x1504 | Microsoft Surface Laptop i5 ID: MEI96A2, Name: Panasonic VVX14T092N00, IPS, 13.5", 2256x1504 | Dell XPS 15 7590 i5 iGPU FHD LQ156M1, IPS, 15.6", 1920x1080 | HP Spectre x360 15-df0126ng AU Optronics AUO30EB, IPS, 15.6", 3840x2160 | Apple MacBook Pro 15 2018 (2.6 GHz, 560X) APPA040, IPS, 15.4", 2880x1800 | |
|---|---|---|---|---|---|---|
| Display | 2% | 2% | 2% | 1% | 28% | |
| Display P3 Coverage (%) | 66.9 | 68 2% | 67.8 1% | 66.5 -1% | 68.1 2% | 98.7 48% |
| sRGB Coverage (%) | 99.3 | 94.7 -5% | 94.3 -5% | 98 -1% | 94.2 -5% | 99.9 1% |
| AdobeRGB 1998 Coverage (%) | 63.7 | 69.2 9% | 69.5 9% | 68.4 7% | 68.4 7% | 86.6 36% |
| Response Times | -37% | -5% | 1% | -3% | 12% | |
| Response Time Grey 50% / Grey 80% * (ms) | 47.2 ? | 69.2 ? -47% | 50.8 ? -8% | 52.8 ? -12% | 57 ? -21% | 43.2 ? 8% |
| Response Time Black / White * (ms) | 36.8 ? | 46.4 ? -26% | 37.2 ? -1% | 32 ? 13% | 31 ? 16% | 31.2 ? 15% |
| PWM Frequency (Hz) | 21370 ? | 1020 ? | 117000 ? | |||
| Screen | -15% | 11% | 1% | -39% | 29% | |
| Brightness middle (cd/m²) | 416.9 | 392 -6% | 384.2 -8% | 588 41% | 330 -21% | 520 25% |
| Brightness (cd/m²) | 389 | 390 0% | 378 -3% | 555 43% | 310 -20% | 492 26% |
| Brightness Distribution (%) | 86 | 89 3% | 90 5% | 89 3% | 87 1% | 88 2% |
| Black Level * (cd/m²) | 0.4 | 0.24 40% | 0.36 10% | 0.4 -0% | 0.37 7% | 0.39 2% |
| Contrast (:1) | 1042 | 1633 57% | 1067 2% | 1470 41% | 892 -14% | 1333 28% |
| Colorchecker dE 2000 * | 2.75 | 3.2 -16% | 1.8 35% | 2.5 9% | 4.03 -47% | 1.2 56% |
| Colorchecker dE 2000 max. * | 6.64 | 6.3 5% | 4.2 37% | 6.3 5% | 6.74 -2% | 2.3 65% |
| Colorchecker dE 2000 calibrated * | 0.71 | 1.4 -97% | 0.6 15% | 1.96 -176% | ||
| Greyscale dE 2000 * | 1.8 | 4.5 -150% | 1.2 33% | 4.5 -150% | 4.49 -149% | 1.3 28% |
| Gamma | 2.09 105% | 2.2 100% | 2.21 100% | 2.2 100% | 2.57 86% | 2.18 101% |
| CCT | 6646 98% | 7556 86% | 6708 97% | 6836 95% | 6744 96% | 6738 96% |
| Color Space (Percent of AdobeRGB 1998) (%) | 63.4 | 63.9 1% | 63.7 0% | 63.2 0% | 61 -4% | |
| Color Space (Percent of sRGB) (%) | 99.4 | 95 -4% | 94.2 -5% | 98 -1% | 94 -5% | |
| Totaal Gemiddelde (Programma / Instellingen) | -17% /
-15% | 3% /
7% | 1% /
1% | -14% /
-27% | 23% /
26% |
* ... kleiner is beter
Responstijd Scherm
| ↔ Responstijd Zwart naar Wit | ||
|---|---|---|
| 36.8 ms ... stijging ↗ en daling ↘ gecombineerd | ↗ 20.4 ms stijging | 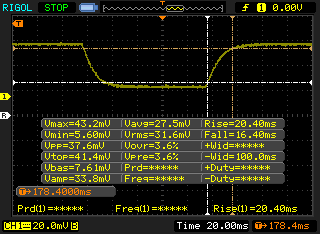 |
| ↘ 16.4 ms daling | ||
| Het scherm vertoonde trage responstijden in onze tests en is misschien te traag voor games. Ter vergelijking: alle testtoestellen variëren van 0.1 (minimum) tot 240 (maximum) ms. » 95 % van alle toestellen zijn beter. Dit betekent dat de gemeten responstijd slechter is dan het gemiddelde (19.8 ms) van alle geteste toestellen. | ||
| ↔ Responstijd 50% Grijs naar 80% Grijs | ||
| 47.2 ms ... stijging ↗ en daling ↘ gecombineerd | ↗ 23.2 ms stijging | 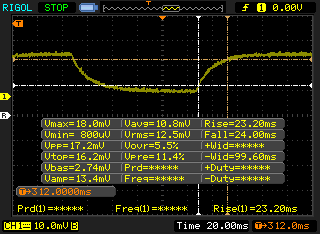 |
| ↘ 24 ms daling | ||
| Het scherm vertoonde trage responstijden in onze tests en is misschien te traag voor games. Ter vergelijking: alle testtoestellen variëren van 0.165 (minimum) tot 636 (maximum) ms. » 82 % van alle toestellen zijn beter. Dit betekent dat de gemeten responstijd slechter is dan het gemiddelde (30.9 ms) van alle geteste toestellen. | ||
Screen Flickering / PWM (Pulse-Width Modulation)
| Screen flickering / PWM waargenomen | 21370 Hz | ≤ 51 % helderheid instelling | 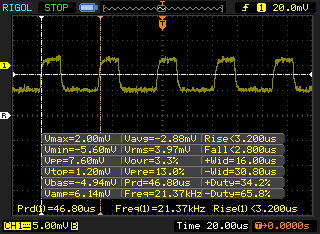 |
De achtergrondverlichting van het scherm flikkert op 21370 Hz (in het slechtste geval, bijvoorbeeld bij gebruik van PWM) aan een helderheid van 51 % en lager. Boven deze helderheid zou er geen flickering / PWM mogen optreden. De frequentie van 21370 Hz is redelijk hoog en de meeste mensen die gevoelig zijn aan flickering zouden dit dus niet mogen waarnemen of geïrriteerde ogen krijgen. Ter vergelijking: 52 % van alle geteste toestellen maakten geen gebruik van PWM om de schermhelderheid te verlagen. Als het wel werd gebruikt, werd een gemiddelde van 7744 (minimum: 5 - maximum: 343500) Hz waargenomen. | |||
| PCMark 8 Home Score Accelerated v2 | 3348 punten | |
| PCMark 8 Work Score Accelerated v2 | 4246 punten | |
| PCMark 10 Score | 4056 punten | |
Help | ||
| Microsoft Surface Laptop 3 15 Ryzen 5 3580U SK hynix BC501 HFM256GDGTNG | Microsoft Surface Laptop 2-LQN-00004 SK Hynix BC501 NVMe 256 GB | Microsoft Surface Laptop i5 Toshiba THNSN0128GTYA | Dell XPS 15 7590 i5 iGPU FHD Toshiba XG6 KXG60ZNV512G | Apple MacBook Pro 15 2018 (2.6 GHz, 560X) Apple SSD AP0512 | HP Spectre x360 15-df0126ng Toshiba XG5-P KXG50PNV2T04 | |
|---|---|---|---|---|---|---|
| AS SSD | 10% | -89% | 133% | 2% | 55% | |
| Seq Read (MB/s) | 1122 | 826 -26% | 561 -50% | 2357 110% | 2239 100% | 2018 80% |
| Seq Write (MB/s) | 514 | 555 8% | 117.2 -77% | 1235 140% | 1644 220% | 773 50% |
| 4K Read (MB/s) | 34.98 | 33.39 -5% | 20.15 -42% | 43.29 24% | 9.46 -73% | 24.62 -30% |
| 4K Write (MB/s) | 96.8 | 95.3 -2% | 39.07 -60% | 99.7 3% | 18.78 -81% | 92.8 -4% |
| 4K-64 Read (MB/s) | 492 | 447 -9% | 80.4 -84% | 1020 107% | 965 96% | 845 72% |
| 4K-64 Write (MB/s) | 339.9 | 370.4 9% | 35.48 -90% | 1502 342% | 163.5 -52% | 957 182% |
| Access Time Read * (ms) | 0.056 | 0.048 14% | 0.128 -129% | 0.07 -25% | 0.225 -302% | 0.147 -163% |
| Access Time Write * (ms) | 0.11 | 0.048 56% | 0.369 -235% | 0.039 65% | 0.057 48% | |
| Score Read (Points) | 639 | 563 -12% | 157 -75% | 1299 103% | 1199 88% | 1071 68% |
| Score Write (Points) | 488 | 521 7% | 86 -82% | 1726 254% | 347 -29% | 1127 131% |
| Score Total (Points) | 1434 | 1369 -5% | 309 -78% | 3640 154% | 2119 48% | 2684 87% |
| Copy ISO MB/s (MB/s) | 828 | 755 -9% | 87.1 -89% | 2145 159% | 1652 100% | |
| Copy Program MB/s (MB/s) | 200.5 | 325.1 62% | 62.7 -69% | 565 182% | 328.5 64% | |
| Copy Game MB/s (MB/s) | 387.4 | 577 49% | 80.5 -79% | 1320 241% | 700 81% |
* ... kleiner is beter

| 3DMark 11 | |
| 1280x720 Performance GPU | |
| Microsoft Surface Book 2 15 | |
| Dell G3 3590 | |
| Microsoft Surface Book 2 | |
| MSI PL62 MX150 7700HQ | |
| Acer Aspire 5 A515-52G-723L | |
| Dell XPS 13 7390 2-in-1 Core i7 | |
| Microsoft Surface Laptop 3 15 Ryzen 5 3580U | |
| Dell Inspiron 15 5000 5585 | |
| Lenovo Yoga 530-14ARR-81H9000VGE | |
| Lenovo Ideapad L340-17API-81LY0004GE | |
| Lenovo ThinkPad A285-20MX0002GE | |
| Microsoft Surface Laptop i7 | |
| Microsoft Surface Laptop i7 | |
| Dell Latitude 7400-8N6DH | |
| Dell XPS 15 7590 i5 iGPU FHD | |
| 1280x720 Performance Combined | |
| Dell G3 3590 | |
| Microsoft Surface Book 2 15 | |
| Microsoft Surface Book 2 | |
| Acer Aspire 5 A515-52G-723L | |
| MSI PL62 MX150 7700HQ | |
| Dell XPS 13 7390 2-in-1 Core i7 | |
| Dell Inspiron 15 5000 5585 | |
| Microsoft Surface Laptop 3 15 Ryzen 5 3580U | |
| Lenovo Yoga 530-14ARR-81H9000VGE | |
| Lenovo Ideapad L340-17API-81LY0004GE | |
| Lenovo ThinkPad A285-20MX0002GE | |
| Microsoft Surface Laptop i7 | |
| Microsoft Surface Laptop i7 | |
| Dell XPS 15 7590 i5 iGPU FHD | |
| Dell Latitude 7400-8N6DH | |
| 3DMark 06 Standard Score | 13365 punten | |
| 3DMark Vantage P Result | 12628 punten | |
| 3DMark 11 Performance | 4424 punten | |
| 3DMark Ice Storm Standard Score | 77533 punten | |
| 3DMark Cloud Gate Standard Score | 13582 punten | |
| 3DMark Fire Strike Score | 2524 punten | |
| 3DMark Time Spy Score | 974 punten | |
Help | ||
| Shadow of the Tomb Raider - 1280x720 Lowest Preset | |
| Apple MacBook Pro 15 2018 (2.9 GHz, Vega 20) | |
| Dell G3 3590 | |
| Apple MacBook Pro 15 2018 (2.6 GHz, 560X) | |
| Asus ROG Zephyrus G15 GA502DU | |
| Acer Aspire 5 A515-52G-723L | |
| Dell Inspiron 15 5000 5585 | |
| Razer Blade Stealth i7-1065G7 Iris Plus | |
| Microsoft Surface Laptop 3 15 Ryzen 5 3580U | |
| Dell XPS 13 7390 2-in-1 Core i7 | |
| Microsoft Surface Pro 6, Core i7, 512 GB | |
| Fortnite | |
| 1280x720 Low Preset | |
| Apple MacBook Pro 15 2018 (2.6 GHz, 560X) | |
| Asus ROG Zephyrus G15 GA502DU | |
| Razer Blade Stealth i7-1065G7 Iris Plus | |
| Honor Magicbook | |
| Microsoft Surface Laptop 3 15 Ryzen 5 3580U | |
| 1920x1080 Medium Preset | |
| MSI PS63 Modern 8SC | |
| Asus ROG Zephyrus G15 GA502DU | |
| Apple MacBook Pro 15 2018 (2.6 GHz, 560X) | |
| Razer Blade Stealth i7-1065G7 Iris Plus | |
| Honor Magicbook | |
| Microsoft Surface Laptop 3 15 Ryzen 5 3580U | |
| lage | gem. | hoge | ultra | |
|---|---|---|---|---|
| BioShock Infinite (2013) | 117.9 | 20.5 | ||
| The Witcher 3 (2015) | 41.9 | 13.3 | 8.1 | |
| Overwatch (2016) | 92.3 | 36.3 | 19.3 | |
| Rocket League (2017) | 100.7 | 46.2 | 30.4 | |
| Fortnite (2018) | 48 | 22.3 | 15.7 | 9.1 |
| Shadow of the Tomb Raider (2018) | 29 | 8 | ||
| Apex Legends (2019) | 60.7 | 20.9 | 18 | 14.5 |
| F1 2019 (2019) | 51 | 21 | 18 | 12 |
| Borderlands 3 (2019) | 28.3 | 13.5 | 7.8 |
| Microsoft Surface Laptop 3 15 Ryzen 5 3580U Vega 9, R5 3580U, SK hynix BC501 HFM256GDGTNG | Microsoft Surface Laptop 2-LQN-00004 UHD Graphics 620, i5-8250U, SK Hynix BC501 NVMe 256 GB | Microsoft Surface Laptop i5 HD Graphics 620, i5-7200U, Toshiba THNSN0128GTYA | Dell XPS 15 7590 i5 iGPU FHD UHD Graphics 630, i5-9300H, Toshiba XG6 KXG60ZNV512G | Apple MacBook Pro 15 2018 (2.6 GHz, 560X) Radeon Pro 560X, i7-8850H, Apple SSD AP0512 | HP Spectre x360 15-df0126ng GeForce GTX 1050 Ti Max-Q, i7-8750H, Toshiba XG5-P KXG50PNV2T04 | |
|---|---|---|---|---|---|---|
| Noise | 2% | -1% | -4% | -14% | -14% | |
| uit / omgeving * (dB) | 28 | 28.7 -2% | 28.2 -1% | 29.3 -5% | 29.6 -6% | 30.4 -9% |
| Idle Minimum * (dB) | 28 | 28.7 -2% | 28.2 -1% | 29.3 -5% | 30.1 -8% | 30.4 -9% |
| Idle Average * (dB) | 28 | 28.7 -2% | 28.2 -1% | 29.3 -5% | 30.1 -8% | 30.4 -9% |
| Idle Maximum * (dB) | 28 | 28.7 -2% | 29 -4% | 29.8 -6% | 30.1 -8% | 31.6 -13% |
| Load Average * (dB) | 29.2 | 30 -3% | 30.3 -4% | 32.4 -11% | 46.8 -60% | 43.2 -48% |
| Witcher 3 ultra * (dB) | 39 | 36 8% | ||||
| Load Maximum * (dB) | 41.4 | 32.9 21% | 39.3 5% | 37.2 10% | 46.8 -13% | 38.3 7% |
* ... kleiner is beter
Geluidsniveau
| Onbelast |
| 28 / 28 / 28 dB (A) |
| Belasting |
| 29.2 / 41.4 dB (A) |
 | ||
30 dB stil 40 dB(A) hoorbaar 50 dB(A) luid |
||
min: | ||
(±) De maximumtemperatuur aan de bovenzijde bedraagt 43.6 °C / 110 F, vergeleken met het gemiddelde van 34.3 °C / 94 F, variërend van 21.2 tot 62.5 °C voor de klasse Office.
(-) De bodem warmt op tot een maximum van 49.4 °C / 121 F, vergeleken met een gemiddelde van 36.8 °C / 98 F
(+) Bij onbelast gebruik bedraagt de gemiddelde temperatuur voor de bovenzijde 26.6 °C / 80 F, vergeleken met het apparaatgemiddelde van 29.5 °C / 85 F.
(±) Bij het spelen van The Witcher 3 is de gemiddelde temperatuur voor de bovenzijde 37.6 °C / 100 F, vergeleken met het apparaatgemiddelde van 29.5 °C / 85 F.
(+) De handpalmsteunen en het touchpad bereiken maximaal de huidtemperatuur (35.8 °C / 96.4 F) en zijn dus niet heet.
(-) De gemiddelde temperatuur van de handpalmsteun van soortgelijke toestellen bedroeg 27.6 °C / 81.7 F (-8.2 °C / -14.7 F).
Microsoft Surface Laptop 3 15 Ryzen 5 3580U audioanalyse
(±) | luidspreker luidheid is gemiddeld maar goed (79.9 dB)
Bas 100 - 315 Hz
(+) | goede baars - slechts 4.8% verwijderd van de mediaan
(±) | lineariteit van de lage tonen is gemiddeld (8.2% delta ten opzichte van de vorige frequentie)
Midden 400 - 2000 Hz
(+) | evenwichtige middens - slechts 4% verwijderd van de mediaan
(±) | lineariteit van de middentonen is gemiddeld (8.5% delta ten opzichte van de vorige frequentie)
Hoog 2 - 16 kHz
(+) | evenwichtige hoogtepunten - slechts 3.5% verwijderd van de mediaan
(±) | lineariteit van de hoogtepunten is gemiddeld (9.1% delta ten opzichte van de vorige frequentie)
Algemeen 100 - 16.000 Hz
(+) | het totale geluid is lineair (14.7% verschil met de mediaan)
Vergeleken met dezelfde klasse
» 13% van alle geteste apparaten in deze klasse waren beter, 4% vergelijkbaar, 83% slechter
» De beste had een delta van 7%, het gemiddelde was 21%, de slechtste was 53%
Vergeleken met alle geteste toestellen
» 19% van alle geteste apparaten waren beter, 4% gelijk, 76% slechter
» De beste had een delta van 4%, het gemiddelde was 23%, de slechtste was 134%
Apple MacBook 12 (Early 2016) 1.1 GHz audioanalyse
(+) | luidsprekers kunnen relatief luid spelen (83.6 dB)
Bas 100 - 315 Hz
(±) | verminderde zeebaars - gemiddeld 11.3% lager dan de mediaan
(±) | lineariteit van de lage tonen is gemiddeld (14.2% delta ten opzichte van de vorige frequentie)
Midden 400 - 2000 Hz
(+) | evenwichtige middens - slechts 2.4% verwijderd van de mediaan
(+) | de middentonen zijn lineair (5.5% delta ten opzichte van de vorige frequentie)
Hoog 2 - 16 kHz
(+) | evenwichtige hoogtepunten - slechts 2% verwijderd van de mediaan
(+) | de hoge tonen zijn lineair (4.5% delta naar de vorige frequentie)
Algemeen 100 - 16.000 Hz
(+) | het totale geluid is lineair (10.2% verschil met de mediaan)
Vergeleken met dezelfde klasse
» 7% van alle geteste apparaten in deze klasse waren beter, 2% vergelijkbaar, 90% slechter
» De beste had een delta van 5%, het gemiddelde was 18%, de slechtste was 53%
Vergeleken met alle geteste toestellen
» 5% van alle geteste apparaten waren beter, 1% gelijk, 94% slechter
» De beste had een delta van 4%, het gemiddelde was 23%, de slechtste was 134%
| Uit / Standby | |
| Inactief | |
| Belasting |
|
Key:
min: | |
| Microsoft Surface Laptop 3 15 Ryzen 5 3580U R5 3580U, Vega 9, SK hynix BC501 HFM256GDGTNG, IPS, 2496x1664, 15" | Microsoft Surface Laptop 2-LQN-00004 i5-8250U, UHD Graphics 620, SK Hynix BC501 NVMe 256 GB, IPS, 2256x1504, 13.5" | Dell XPS 15 7590 i5 iGPU FHD i5-9300H, UHD Graphics 630, Toshiba XG6 KXG60ZNV512G, IPS, 1920x1080, 15.6" | Asus VivoBook S15 S530UN-BQ097T i5-8550U, GeForce MX150, SanDisk SD9SN8W256G1027, IPS LED, 1920x1080, 15.6" | Dell Inspiron 15 5000 5585 R7 3700U, Vega 10, WDC PC SN520 SDAPNUW-512G, IPS, 1920x1080, 15.6" | HP EliteBook 755 G5 3UN79EA R7 2700U, Vega 10, Toshiba XG5 KXG50ZNV512G, IPS, 1920x1080, 15.6" | |
|---|---|---|---|---|---|---|
| Power Consumption | 7% | -36% | -8% | 5% | -32% | |
| Idle Minimum * (Watt) | 3.3 | 3 9% | 3.79 -15% | 3.1 6% | 4.2 -27% | 5 -52% |
| Idle Average * (Watt) | 7.1 | 6.8 4% | 6.9 3% | 6.3 11% | 6.8 4% | 10.6 -49% |
| Idle Maximum * (Watt) | 7.2 | 8.76 -22% | 9.2 -28% | 8.6 -19% | 7 3% | 12.9 -79% |
| Load Average * (Watt) | 44.8 | 35.1 22% | 62 -38% | 56.4 -26% | 36.5 19% | 40.6 9% |
| Witcher 3 ultra * (Watt) | 45.1 | 45 -0% | 37.9 16% | |||
| Load Maximum * (Watt) | 53 | 42.6 20% | 108 -104% | 62.7 -18% | 44 17% | 46.6 12% |
* ... kleiner is beter
| Microsoft Surface Laptop 3 15 Ryzen 5 3580U R5 3580U, Vega 9, 45 Wh | Microsoft Surface Laptop 2-LQN-00004 i5-8250U, UHD Graphics 620, 45 Wh | Microsoft Surface Laptop i5 i5-7200U, HD Graphics 620, 45 Wh | Dell XPS 15 7590 i5 iGPU FHD i5-9300H, UHD Graphics 630, 97 Wh | Apple MacBook Pro 15 2018 (2.6 GHz, 560X) i7-8850H, Radeon Pro 560X, 83 Wh | HP Spectre x360 15-df0126ng i7-8750H, GeForce GTX 1050 Ti Max-Q, 84 Wh | |
|---|---|---|---|---|---|---|
| Batterijduur | 2% | 18% | 28% | 12% | 11% | |
| Reader / Idle (h) | 18.7 | 20.8 11% | 22.5 20% | 18.8 1% | ||
| WiFi v1.3 (h) | 9.1 | 9.1 0% | 10 10% | 14.1 55% | 10.2 12% | 8.8 -3% |
| Load (h) | 1.7 | 1.6 -6% | 2.1 24% | 1.7 0% | 2.3 35% | |
| Witcher 3 ultra (h) | 1.5 |
Pro
Contra
Dit is de verkorte versie van het originele artikel. Het volledige, Engelse testrapport vind je hier.
De Surface Laptop 3 15 heeft een aantal grote pluspunten. Eerst en vooral is het feit dat de goedkopere Ryzen 5 3580U op een steenworp van de duurdere Core i7-1065G7 komt op het vlak van CPU-prestaties een hele verwezenlijking voor AMD. Factoren zoals batterijduur en ventilatorgeluid zijn nauwelijks veranderd ten opzichte van de Surface Laptop 2, wat betekent dat de AMD-gebaseerde Surface Laptop 3 snellere prestaties neerzet ten opzichte van het model van de vorige generatie zonder schadelijke neveneffecten. Merk op dat hoewel we de Surface Laptop 3 15 met Core i7 nog niet getest hebben, deze heel wat indruk op ons moet maken om de meerprijs van bijna 500 euro (!) te kunnen verantwoorden.
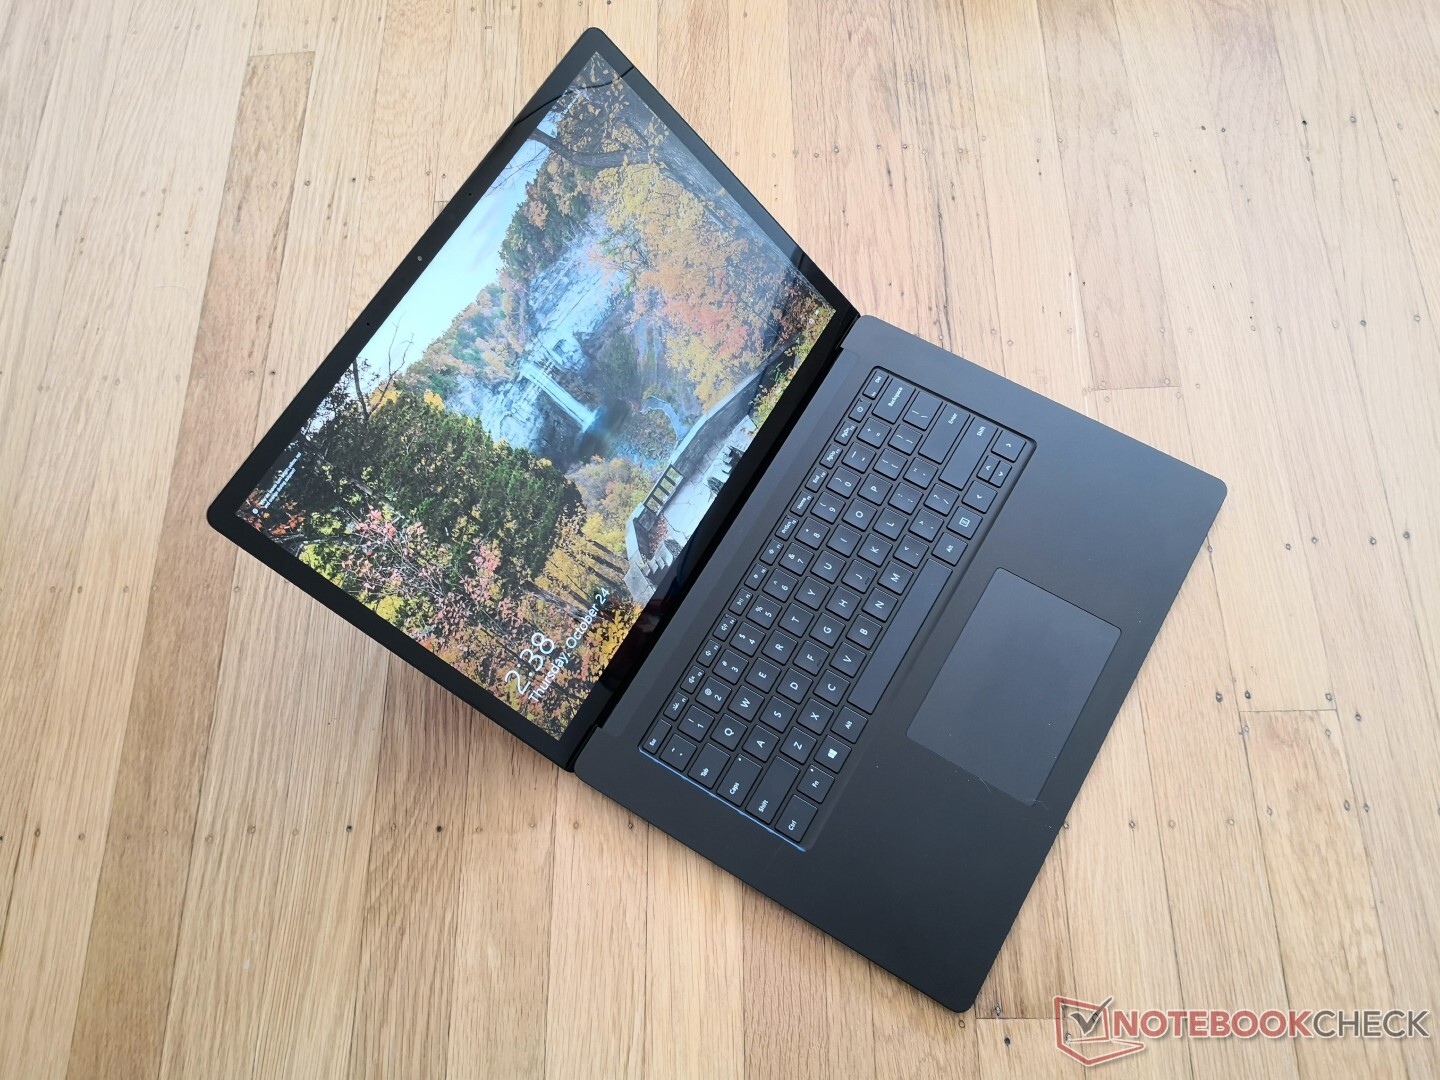
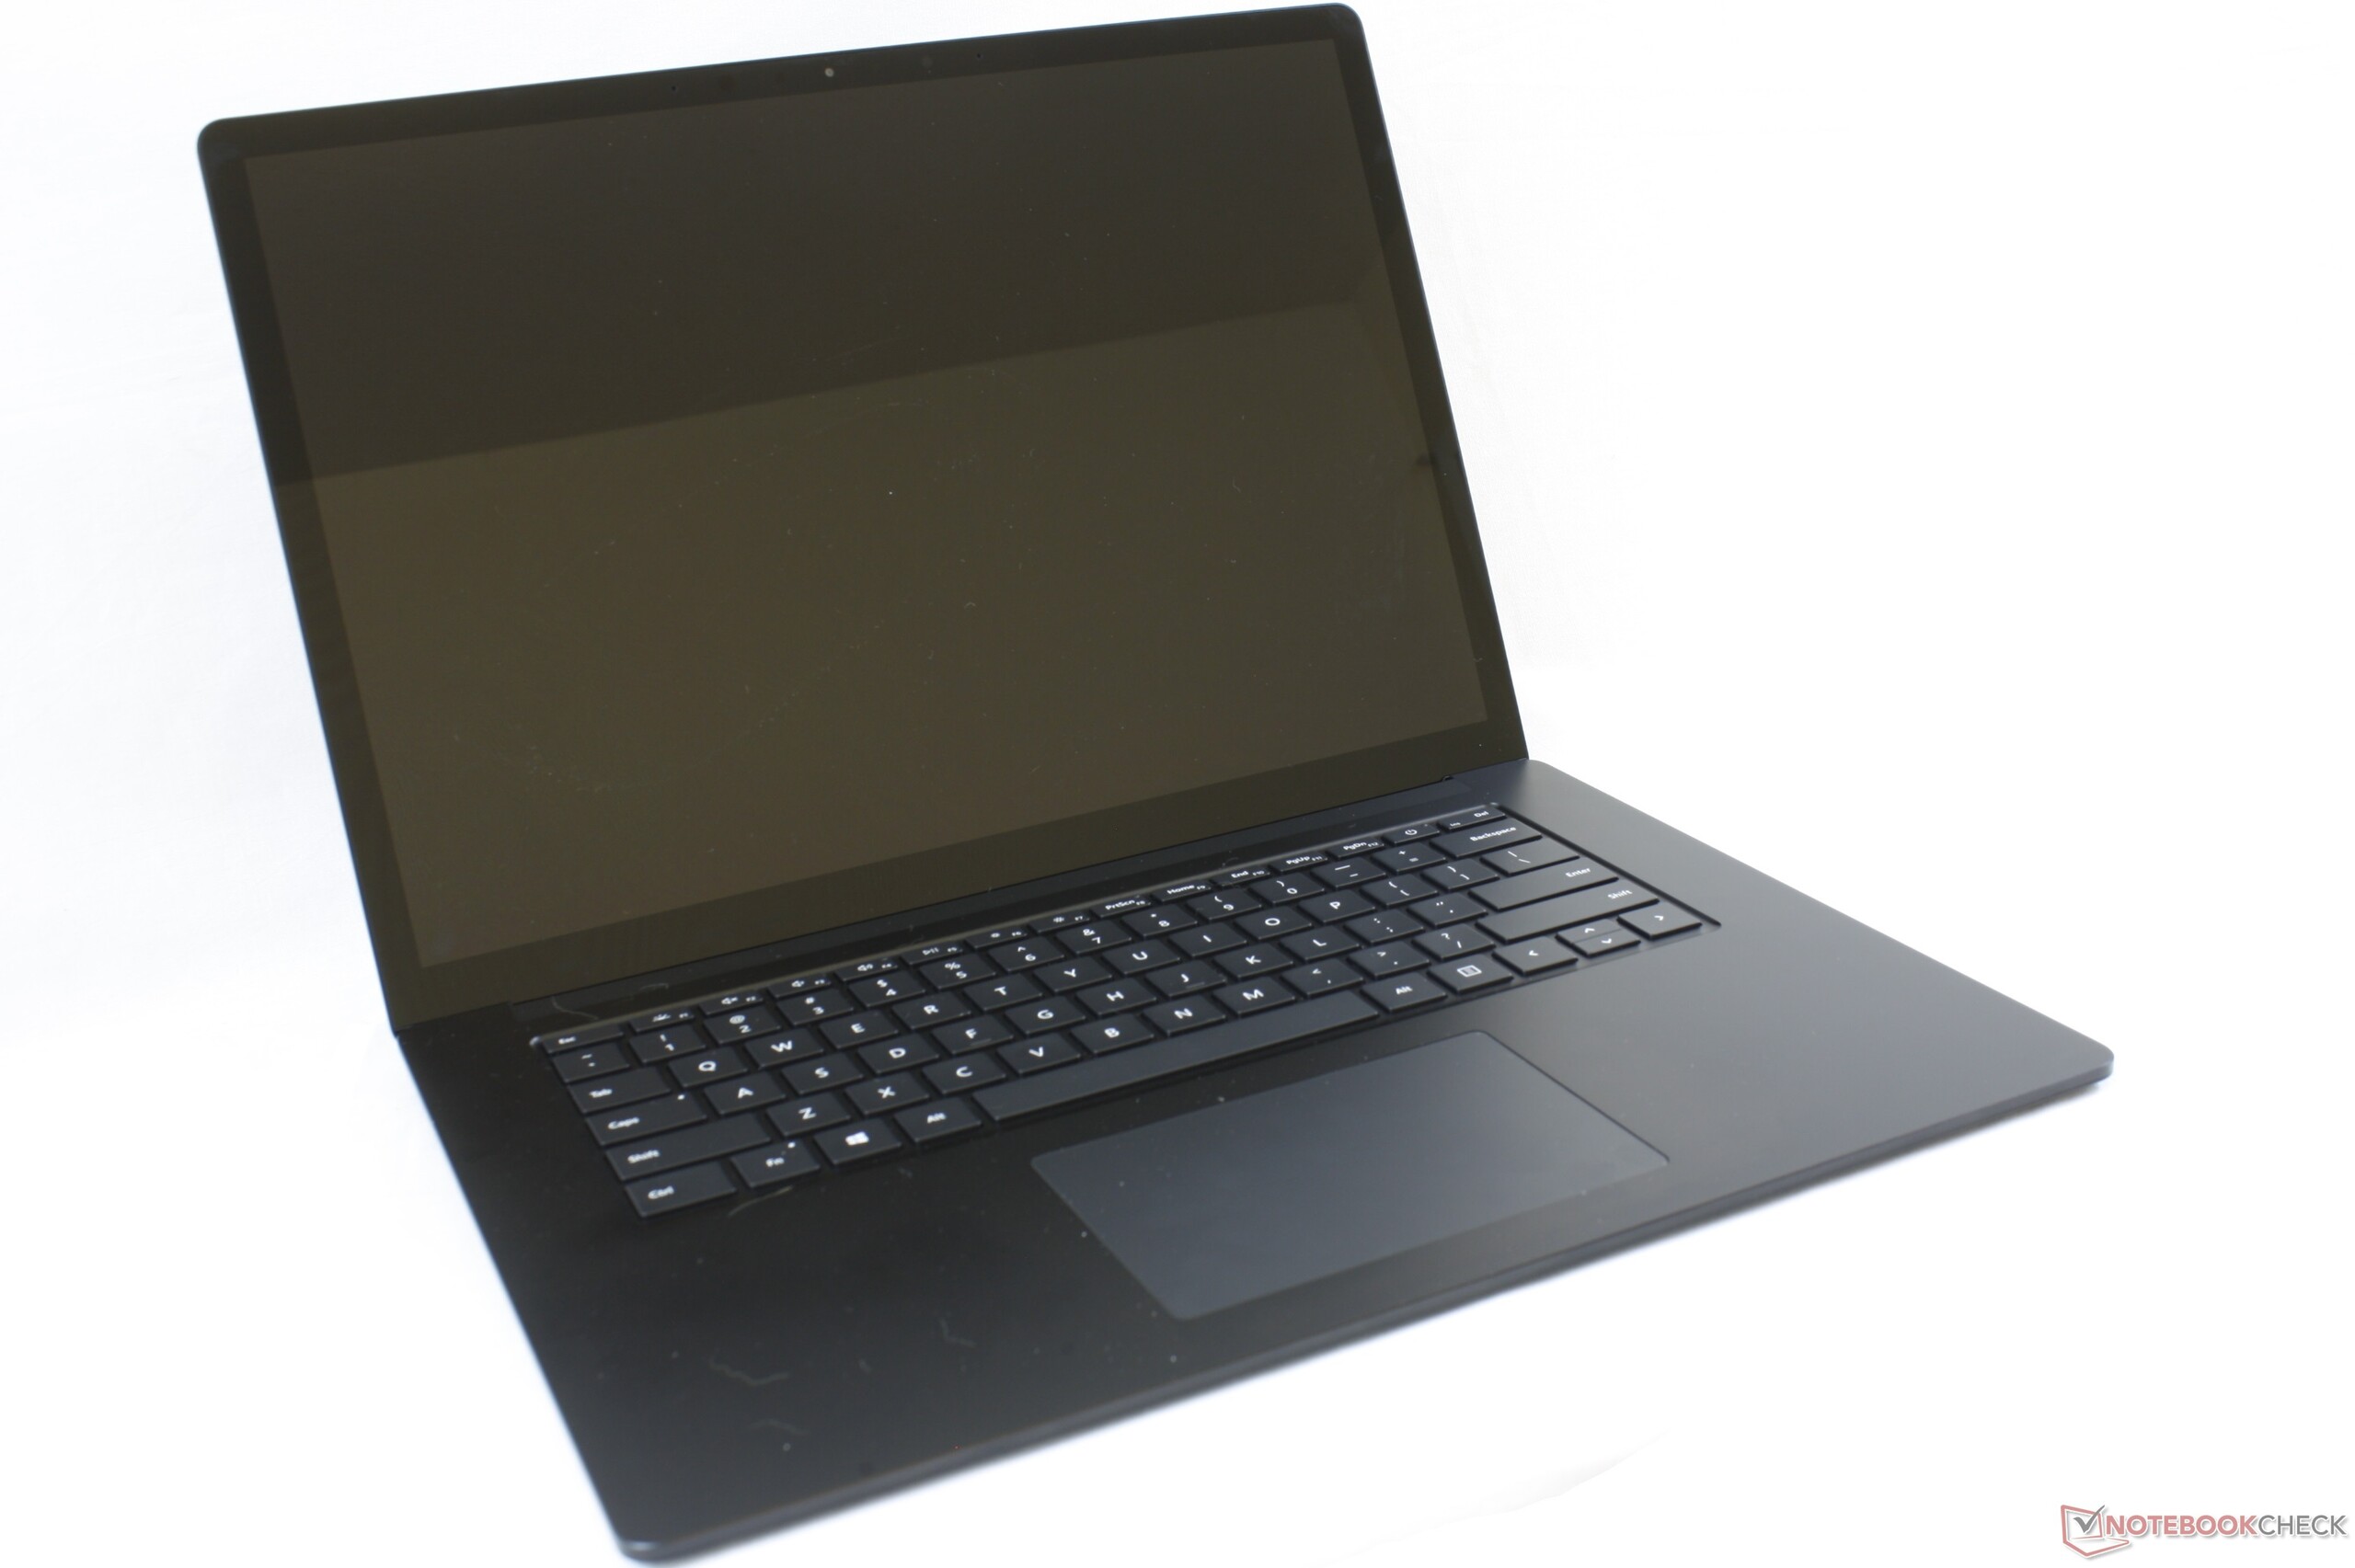
Het tweede hoogtepunt is het ongewone 3:2-touchscreen. Het paneel is scherm en relatief helder met volledige sRGB-dekking. Helaas biedt Microsoft niet hetzelfde soort kalibratie-opties als bij de Gigabyte Aero 15 of Razer Blade en zal je het scherm zelf moeten kalibreren als je het meeste uit het scherm wilt halen.
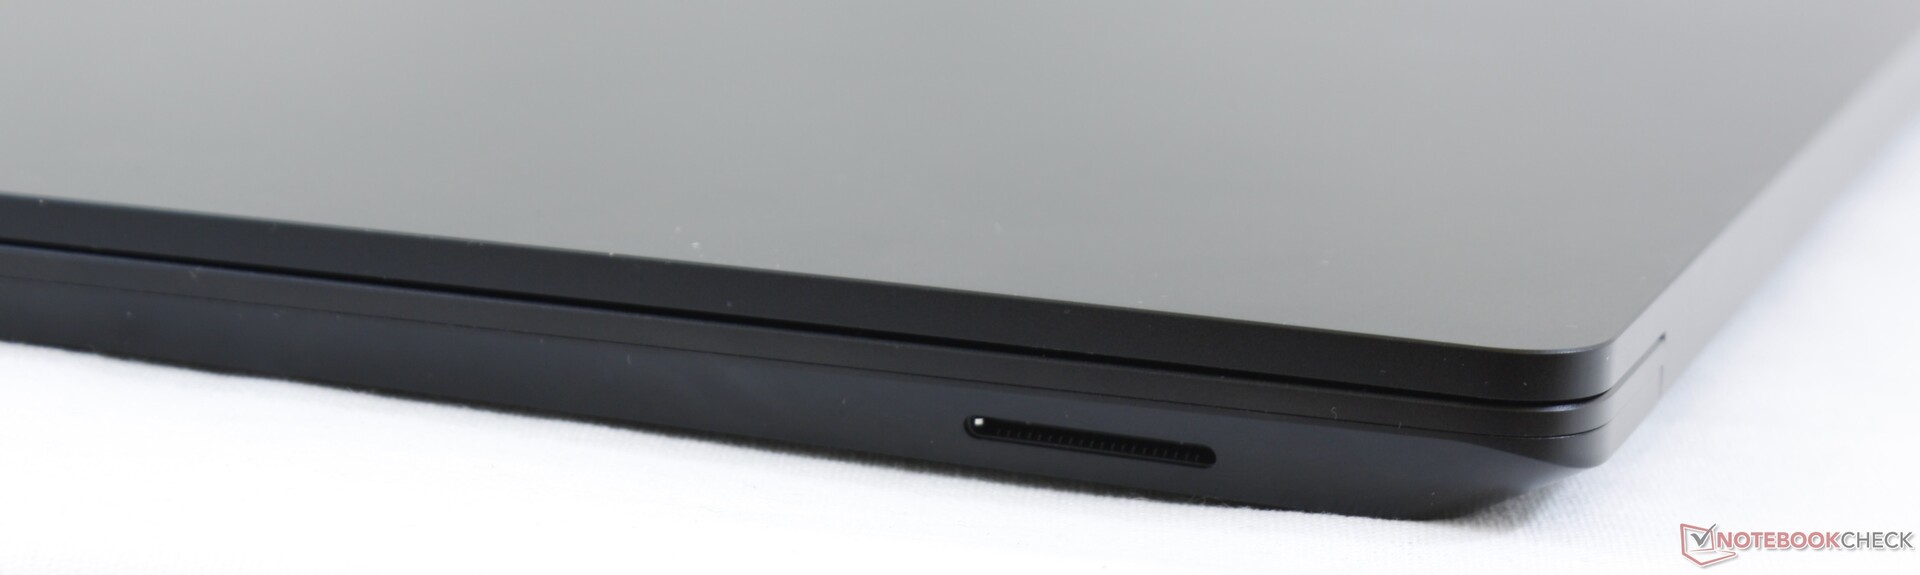
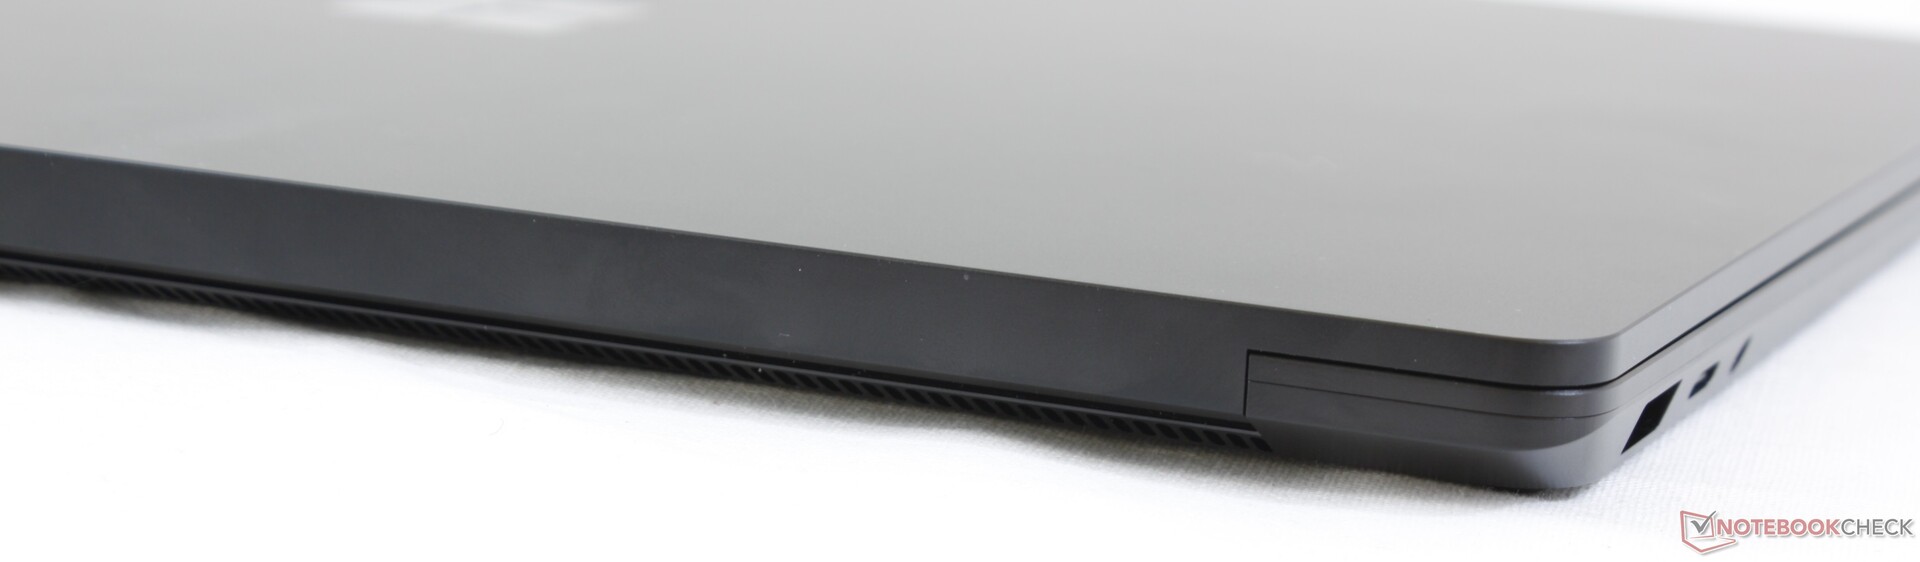
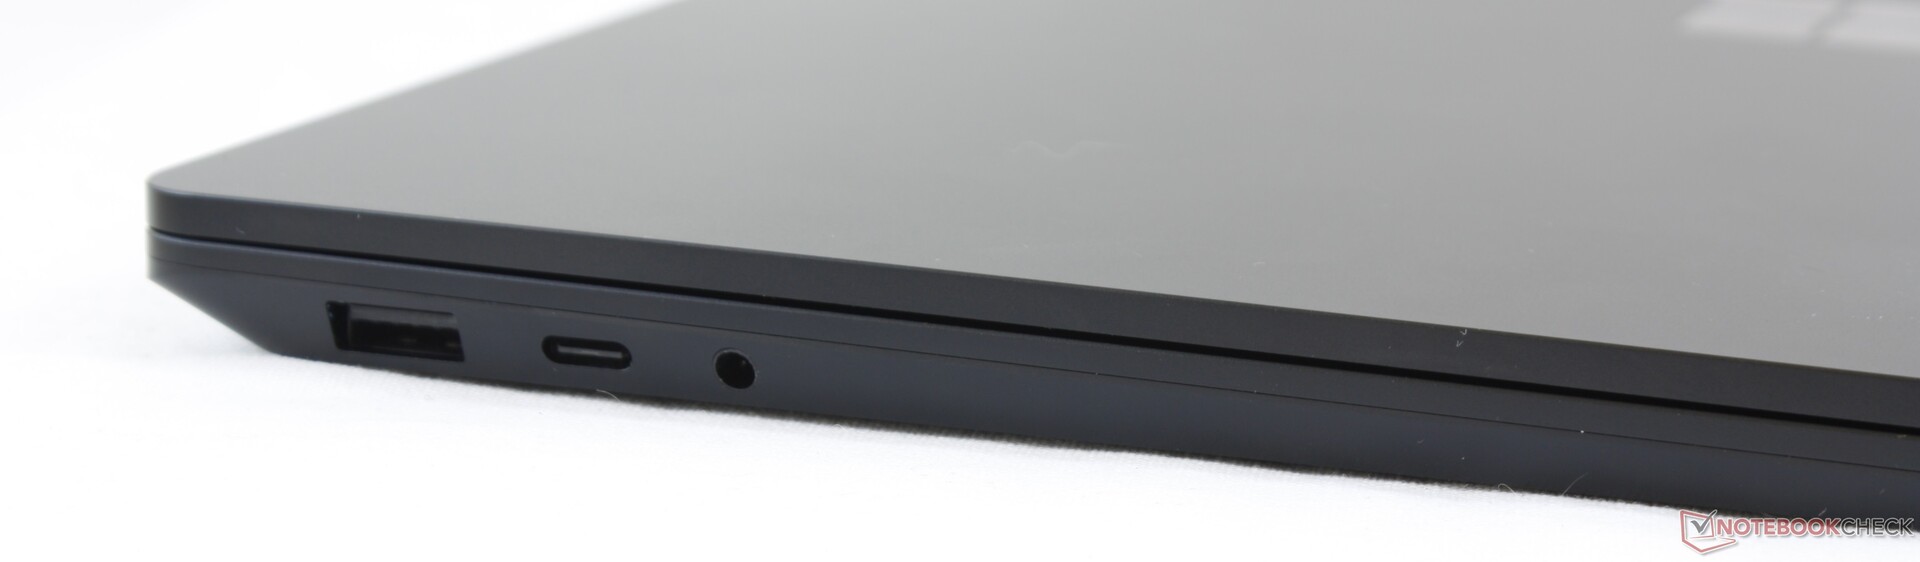
Bijna alle andere aspecten van de Surface Laptop 3 zijn slechts matig of gewoonweg teleurstellend voor de hoge prijs van het toestel. Deze grotere 15-inch Surface Laptop was een kans voor Microsoft om de zwakke connectiviteit van de 13.5 Surface Laptop te corrigeren, maar niets werd echt verbeterd. De mini DisplayPort is nu verdwenen, waardoor gebruikers aangespoord worden om te investeren in de aparte Surface Dock van 200 euro. De USB Type-C-poort mist zowel Thunderbolt 3 en Power Delivery. Dit betekent dat je de voeding steeds moet meesleuren met de laptop. Gebruikers kunnen echter met één universele USB Type-C-lader diverse toestellen opladen zoals de Dell XPS 13, XPS 15, Huawei MateBook X Pro, HP Spectre x360 13, smartphones of tablets, wat veel veelzijdiger is.
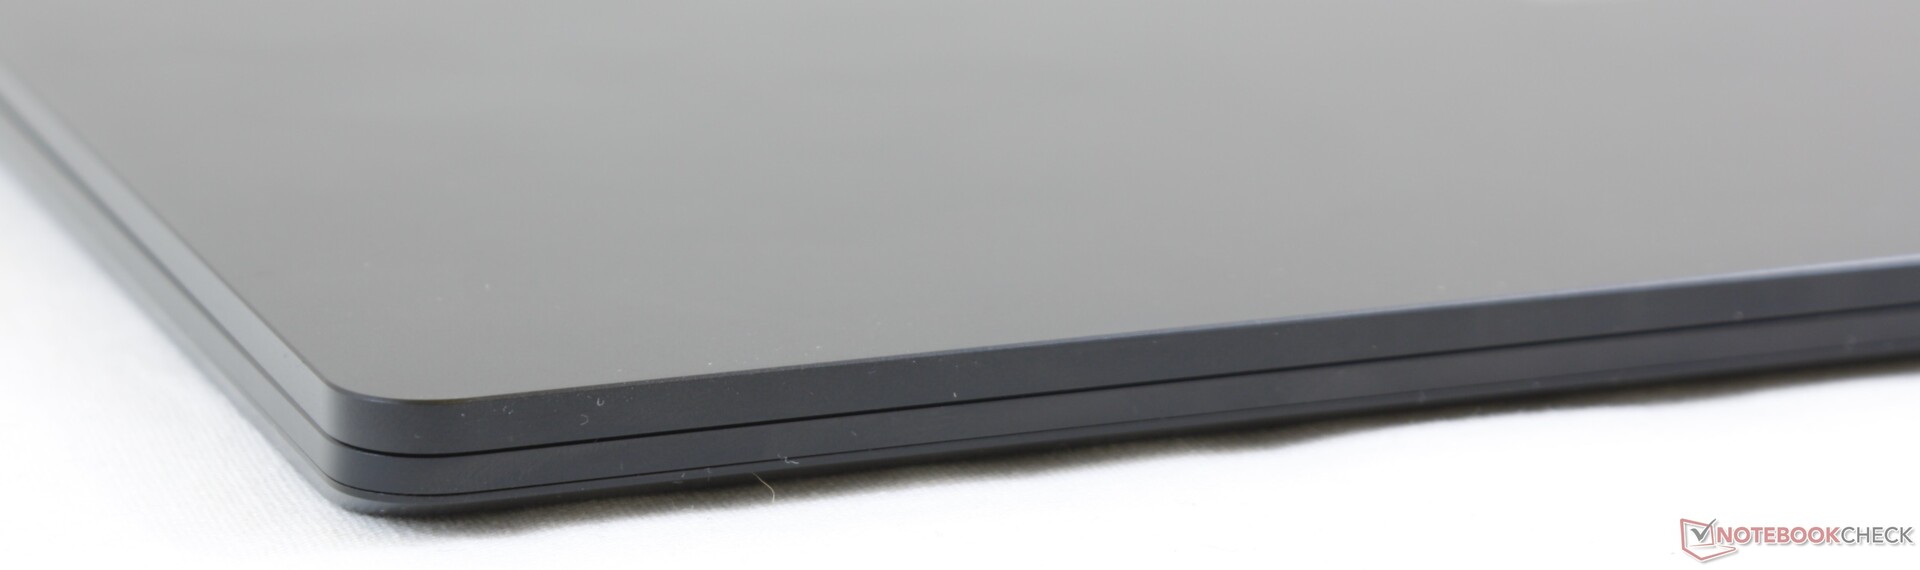
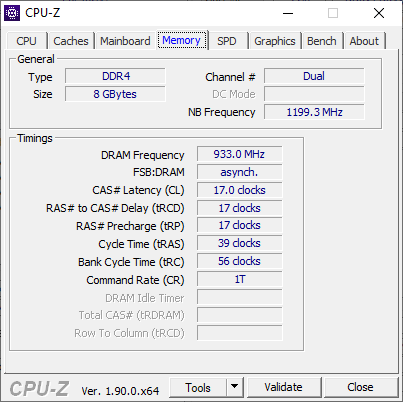
De dikke schermraden, het single-channel-RAM, de trage NVMe-SSD, trage zwart-zit-responstijden en het ontbreken van Wi-Fi-6, LTE, vingerafdruklezer en privacy-klepje voor de webcam dragen stuk voor stuk bij tot de indruk van een toestel dat magertjes en verouderd aanvoelt, ondanks het uitstekende scherm en de CPU-prestaties. De Surface Laptop 3 15 kan echter een interessante optie zijn als je veel waarde hecht aan zijn vederlichte 3:2-vormfactor en geen problemen hebt met de beperkte connectiviteit. Hoe dan ook kan je meer waar voor je 1500 euro krijgen.
Hij ziet er mooi uit en presteert zelfs met de goedkopere AMD-processor uitstekend, maar het ontbreken van features en poorten zal zich snel laten opmerken. Meer traditionele Ultrabooks bieden voor deze prijs veel meer op het vlak van prestaties en connectiviteit.
Microsoft Surface Laptop 3 15 Ryzen 5 3580U
- 27-10-2019 v7 (old)
Allen Ngo
Price comparison
