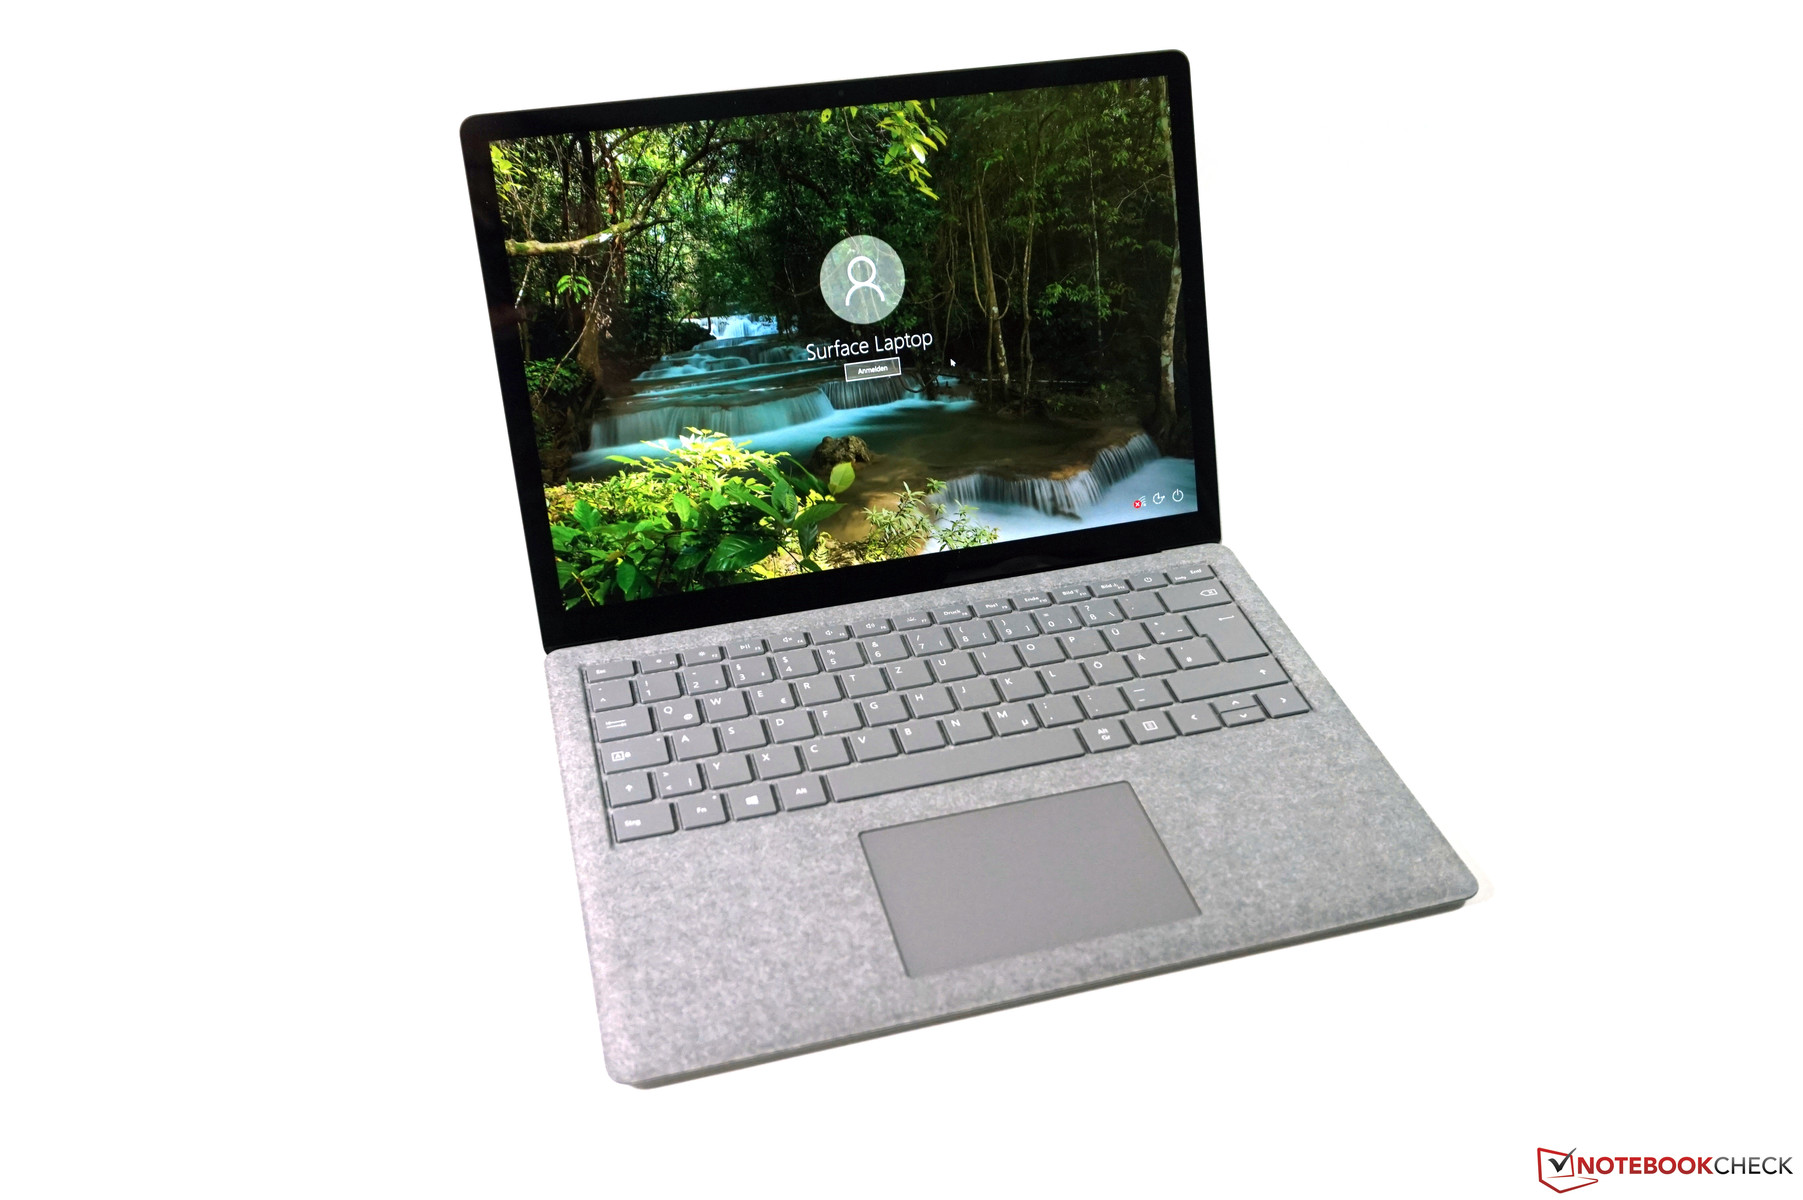
Kort testrapport Microsoft Surface Laptop 2 (Core i5, 256 GB) Laptop

| |||||||||||||||||||||||||
Helderheidsverdeling: 89 %
Helderheid in Batterij-modus: 392 cd/m²
Contrast: 1633:1 (Zwart: 0.24 cd/m²)
ΔE ColorChecker Calman: 3.2 | ∀{0.5-29.43 Ø4.73}
calibrated: 1.4
ΔE Greyscale Calman: 4.5 | ∀{0.09-98 Ø4.97}
95% sRGB (Argyll 1.6.3 3D)
63.9% AdobeRGB 1998 (Argyll 1.6.3 3D)
69.2% AdobeRGB 1998 (Argyll 3D)
94.7% sRGB (Argyll 3D)
68% Display P3 (Argyll 3D)
Gamma: 2.2
CCT: 7556 K
| Microsoft Surface Laptop 2-LQN-00004 VVX14T092N00, , 2256x1504, 13.5" | Microsoft Surface Laptop i5 ID: MEI96A2, Name: Panasonic VVX14T092N00, , 2256x1504, 13.5" | Microsoft Surface Pro 6, Core i7, 512 GB LGPhilips LP123WQ112604, , 2736x1824, 12.3" | Dell XPS 13 9370 i5 UHD ID: Sharp SHP148B, Name: LQ133D1, Dell P/N: 8XDHY, , 3840x2160, 13.3" | Apple MacBook Air 2018 APPA039, , 2560x1600, 13.3" | Asus ZenBook S UX391U AUO B133HAN04.9, , 1920x1080, 13.3" | |
|---|---|---|---|---|---|---|
| Display | 0% | -1% | 2% | 1% | -5% | |
| Display P3 Coverage (%) | 68 | 67.8 0% | 67.1 -1% | 68.9 1% | 67.8 0% | 64.4 -5% |
| sRGB Coverage (%) | 94.7 | 94.3 0% | 95.5 1% | 98.4 4% | 96.1 1% | 90.5 -4% |
| AdobeRGB 1998 Coverage (%) | 69.2 | 69.5 0% | 67.9 -2% | 69.5 0% | 69.8 1% | 65.2 -6% |
| Response Times | 24% | 42% | 7% | 42% | 36% | |
| Response Time Grey 50% / Grey 80% * (ms) | 69.2 ? | 50.8 ? 27% | 43 ? 38% | 67.2 ? 3% | 39.6 ? 43% | 44.8 ? 35% |
| Response Time Black / White * (ms) | 46.4 ? | 37.2 ? 20% | 25 ? 46% | 41.6 ? 10% | 28 ? 40% | 29.2 ? 37% |
| PWM Frequency (Hz) | 22000 ? | 2500 ? | 113600 ? | |||
| Screen | 6% | -3% | -6% | 16% | -29% | |
| Brightness middle (cd/m²) | 392 | 384.2 -2% | 484 23% | 496.4 27% | 320 -18% | 299 -24% |
| Brightness (cd/m²) | 390 | 378 -3% | 473 21% | 469 20% | 315 -19% | 300 -23% |
| Brightness Distribution (%) | 89 | 90 1% | 91 2% | 84 -6% | 95 7% | 92 3% |
| Black Level * (cd/m²) | 0.24 | 0.36 -50% | 0.33 -38% | 0.5 -108% | 0.29 -21% | 0.26 -8% |
| Contrast (:1) | 1633 | 1067 -35% | 1467 -10% | 993 -39% | 1103 -32% | 1150 -30% |
| Colorchecker dE 2000 * | 3.2 | 1.8 44% | 4.29 -34% | 2.9 9% | 1.2 63% | 5.6 -75% |
| Colorchecker dE 2000 max. * | 6.3 | 4.2 33% | 6.46 -3% | 5.26 17% | 3.2 49% | 9.1 -44% |
| Colorchecker dE 2000 calibrated * | 1.4 | 1.34 4% | 0.5 64% | 2.6 -86% | ||
| Greyscale dE 2000 * | 4.5 | 1.2 73% | 4.3 4% | 3.9 13% | 0.8 82% | 5.5 -22% |
| Gamma | 2.2 100% | 2.21 100% | 2.51 88% | 2.066 106% | 2.2 100% | 2.47 89% |
| CCT | 7556 86% | 6708 97% | 7315 89% | 7169 91% | 6548 99% | 7533 86% |
| Color Space (Percent of AdobeRGB 1998) (%) | 63.9 | 63.7 0% | 62 -3% | 63.9 0% | 62.1 -3% | 58.9 -8% |
| Color Space (Percent of sRGB) (%) | 95 | 94.2 -1% | 95 0% | 98.2 3% | 96 1% | 90.3 -5% |
| Totaal Gemiddelde (Programma / Instellingen) | 10% /
7% | 13% /
3% | 1% /
-3% | 20% /
16% | 1% /
-17% |
* ... kleiner is beter
Responstijd Scherm
| ↔ Responstijd Zwart naar Wit | ||
|---|---|---|
| 46.4 ms ... stijging ↗ en daling ↘ gecombineerd | ↗ 26 ms stijging | 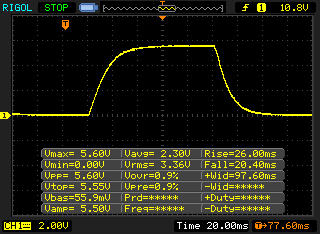 |
| ↘ 20.4 ms daling | ||
| Het scherm vertoonde trage responstijden in onze tests en is misschien te traag voor games. Ter vergelijking: alle testtoestellen variëren van 0.1 (minimum) tot 240 (maximum) ms. » 99 % van alle toestellen zijn beter. Dit betekent dat de gemeten responstijd slechter is dan het gemiddelde (19.9 ms) van alle geteste toestellen. | ||
| ↔ Responstijd 50% Grijs naar 80% Grijs | ||
| 69.2 ms ... stijging ↗ en daling ↘ gecombineerd | ↗ 34.8 ms stijging | 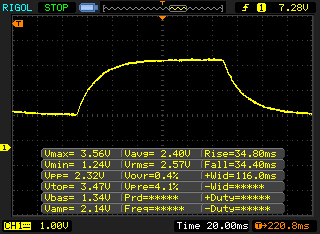 |
| ↘ 34.4 ms daling | ||
| Het scherm vertoonde trage responstijden in onze tests en is misschien te traag voor games. Ter vergelijking: alle testtoestellen variëren van 0.165 (minimum) tot 636 (maximum) ms. » 99 % van alle toestellen zijn beter. Dit betekent dat de gemeten responstijd slechter is dan het gemiddelde (31.1 ms) van alle geteste toestellen. | ||
Screen Flickering / PWM (Pulse-Width Modulation)
| Screen flickering / PWM niet waargenomen | 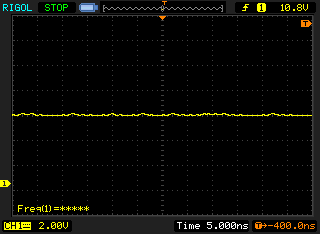 | ||
Ter vergelijking: 52 % van alle geteste toestellen maakten geen gebruik van PWM om de schermhelderheid te verlagen. Als het wel werd gebruikt, werd een gemiddelde van 7794 (minimum: 5 - maximum: 343500) Hz waargenomen. | |||
| PCMark 8 Home Score Accelerated v2 | 3153 punten | |
| PCMark 8 Creative Score Accelerated v2 | 3927 punten | |
| PCMark 8 Work Score Accelerated v2 | 4923 punten | |
| PCMark 10 Score | 0 punten | |
Help | ||
| Microsoft Surface Laptop 2-LQN-00004 SK Hynix BC501 NVMe 256 GB | Microsoft Surface Pro 6, Core i7, 512 GB Toshiba KBG30ZPZ512G | Dell XPS 13 9370 i5 UHD Toshiba XG5 KXG50ZNV256G | Apple MacBook Air 2018 Apple SSD AP0256 | Asus ZenBook S UX391U Samsung PM961 NVMe MZVLW512HMJP | Gemiddeld SK Hynix BC501 NVMe 256 GB | |
|---|---|---|---|---|---|---|
| CrystalDiskMark 5.2 / 6 | -5% | 29% | 17% | 41% | 10% | |
| Write 4K (MB/s) | 87.3 | 83.2 -5% | 121.4 39% | 118 35% | 98.9 13% | 110 ? 26% |
| Read 4K (MB/s) | 36.52 | 43.84 20% | 33.42 -8% | 29.97 -18% | 38.33 5% | 36.6 ? 0% |
| Write Seq (MB/s) | 716 | 636 -11% | 385.3 -46% | 1000 40% | 1414 97% | 699 ? -2% |
| Read Seq (MB/s) | 1009 | 900 -11% | 1958 94% | 1218 21% | 1051 4% | 1057 ? 5% |
| Write 4K Q32T1 (MB/s) | 324.1 | 192.9 -40% | 375.7 16% | 232.1 -28% | 370.7 14% | 359 ? 11% |
| Read 4K Q32T1 (MB/s) | 249 | 247.4 -1% | 364.1 46% | 254 2% | 251.4 1% | 339 ? 36% |
| Write Seq Q32T1 (MB/s) | 811 | 861 6% | 1069 32% | 1001 23% | 1606 98% | 813 ? 0% |
| Read Seq Q32T1 (MB/s) | 1631 | 1615 -1% | 2564 57% | 2555 57% | 3218 97% | 1670 ? 2% |

| 3DMark 11 Performance | 2065 punten | |
| 3DMark Cloud Gate Standard Score | 8910 punten | |
| 3DMark Fire Strike Score | 1162 punten | |
| 3DMark Time Spy Score | 446 punten | |
Help | ||
| lage | gem. | hoge | ultra | |
|---|---|---|---|---|
| BioShock Infinite (2013) | 55.6 | 34.1 | 29.5 | 9.2 |
| The Witcher 3 (2015) | 16.6 | |||
| Rocket League (2017) | 93.9 | 34.8 | 21.6 |
Geluidsniveau
| Onbelast |
| 28.7 / 28.7 / 28.7 dB (A) |
| Belasting |
| 30 / 32.9 dB (A) |
 | ||
30 dB stil 40 dB(A) hoorbaar 50 dB(A) luid |
||
min: | ||
| Microsoft Surface Laptop 2-LQN-00004 UHD Graphics 620, i5-8250U, SK Hynix BC501 NVMe 256 GB | Microsoft Surface Laptop i5 HD Graphics 620, i5-7200U, Toshiba THNSN0128GTYA | Microsoft Surface Pro 6, Core i7, 512 GB UHD Graphics 620, i7-8650U, Toshiba KBG30ZPZ512G | Dell XPS 13 9370 i5 UHD UHD Graphics 620, i5-8250U, Toshiba XG5 KXG50ZNV256G | Apple MacBook Air 2018 UHD Graphics 617, i5-8210Y, Apple SSD AP0256 | Asus ZenBook S UX391U UHD Graphics 620, i5-8550U, Samsung PM961 NVMe MZVLW512HMJP | |
|---|---|---|---|---|---|---|
| Noise | -3% | -6% | -6% | -4% | -8% | |
| uit / omgeving * (dB) | 28.7 | 28.2 2% | 30.3 -6% | 29 -1% | 28.5 1% | 29.7 -3% |
| Idle Minimum * (dB) | 28.7 | 28.2 2% | 30.3 -6% | 29 -1% | 28.5 1% | 29.7 -3% |
| Idle Average * (dB) | 28.7 | 28.2 2% | 30.3 -6% | 29 -1% | 28.5 1% | 29.7 -3% |
| Idle Maximum * (dB) | 28.7 | 29 -1% | 30.3 -6% | 29 -1% | 28.5 1% | 30.1 -5% |
| Load Average * (dB) | 30 | 30.3 -1% | 33.5 -12% | 32 -7% | 30 -0% | 36.8 -23% |
| Load Maximum * (dB) | 32.9 | 39.3 -19% | 33.5 -2% | 40.1 -22% | 41.8 -27% | 36.8 -12% |
* ... kleiner is beter
(+) De maximumtemperatuur aan de bovenzijde bedraagt 39.3 °C / 103 F, vergeleken met het gemiddelde van 35.9 °C / 97 F, variërend van 21.4 tot 59 °C voor de klasse Subnotebook.
(±) De bodem warmt op tot een maximum van 42 °C / 108 F, vergeleken met een gemiddelde van 39.2 °C / 103 F
(+) Bij onbelast gebruik bedraagt de gemiddelde temperatuur voor de bovenzijde 23 °C / 73 F, vergeleken met het apparaatgemiddelde van 30.8 °C / 87 F.
(+) De palmsteunen en het touchpad zijn met een maximum van ###max## °C / 84.6 F koeler dan de huidtemperatuur en voelen daarom koel aan.
(±) De gemiddelde temperatuur van de handpalmsteun van soortgelijke toestellen bedroeg 28.2 °C / 82.8 F (-1 °C / -1.8 F).
Microsoft Surface Laptop 2-LQN-00004 audioanalyse
(±) | luidspreker luidheid is gemiddeld maar goed (72 dB)
Bas 100 - 315 Hz
(±) | verminderde zeebaars - gemiddeld 10.5% lager dan de mediaan
(±) | lineariteit van de lage tonen is gemiddeld (12.2% delta ten opzichte van de vorige frequentie)
Midden 400 - 2000 Hz
(+) | evenwichtige middens - slechts 2.7% verwijderd van de mediaan
(+) | de middentonen zijn lineair (4.2% delta ten opzichte van de vorige frequentie)
Hoog 2 - 16 kHz
(+) | evenwichtige hoogtepunten - slechts 1.4% verwijderd van de mediaan
(+) | de hoge tonen zijn lineair (4.7% delta naar de vorige frequentie)
Algemeen 100 - 16.000 Hz
(+) | het totale geluid is lineair (14.5% verschil met de mediaan)
Vergeleken met dezelfde klasse
» 29% van alle geteste apparaten in deze klasse waren beter, 6% vergelijkbaar, 65% slechter
» De beste had een delta van 5%, het gemiddelde was 18%, de slechtste was 53%
Vergeleken met alle geteste toestellen
» 18% van alle geteste apparaten waren beter, 4% gelijk, 78% slechter
» De beste had een delta van 4%, het gemiddelde was 24%, de slechtste was 134%
Apple MacBook Air 2018 audioanalyse
(±) | luidspreker luidheid is gemiddeld maar goed (75 dB)
Bas 100 - 315 Hz
(±) | verminderde zeebaars - gemiddeld 8.1% lager dan de mediaan
(±) | lineariteit van de lage tonen is gemiddeld (10% delta ten opzichte van de vorige frequentie)
Midden 400 - 2000 Hz
(+) | evenwichtige middens - slechts 2.9% verwijderd van de mediaan
(+) | de middentonen zijn lineair (5.6% delta ten opzichte van de vorige frequentie)
Hoog 2 - 16 kHz
(+) | evenwichtige hoogtepunten - slechts 2.2% verwijderd van de mediaan
(+) | de hoge tonen zijn lineair (4.5% delta naar de vorige frequentie)
Algemeen 100 - 16.000 Hz
(+) | het totale geluid is lineair (12.3% verschil met de mediaan)
Vergeleken met dezelfde klasse
» 16% van alle geteste apparaten in deze klasse waren beter, 5% vergelijkbaar, 80% slechter
» De beste had een delta van 5%, het gemiddelde was 18%, de slechtste was 53%
Vergeleken met alle geteste toestellen
» 10% van alle geteste apparaten waren beter, 3% gelijk, 87% slechter
» De beste had een delta van 4%, het gemiddelde was 24%, de slechtste was 134%
| Uit / Standby | |
| Inactief | |
| Belasting |
|
Key:
min: | |
| Microsoft Surface Laptop 2-LQN-00004 i5-8250U, UHD Graphics 620, SK Hynix BC501 NVMe 256 GB, IPS, 2256x1504, 13.5" | Microsoft Surface Laptop i5 i5-7200U, HD Graphics 620, Toshiba THNSN0128GTYA, IPS, 2256x1504, 13.5" | Microsoft Surface Pro 6, Core i7, 512 GB i7-8650U, UHD Graphics 620, Toshiba KBG30ZPZ512G, IPS, 2736x1824, 12.3" | Dell XPS 13 9370 i5 UHD i5-8250U, UHD Graphics 620, Toshiba XG5 KXG50ZNV256G, IPS, 3840x2160, 13.3" | Apple MacBook Air 2018 i5-8210Y, UHD Graphics 617, Apple SSD AP0256, IPS, 2560x1600, 13.3" | Asus ZenBook S UX391U i5-8550U, UHD Graphics 620, Samsung PM961 NVMe MZVLW512HMJP, IPS, 1920x1080, 13.3" | Gemiddeld Intel UHD Graphics 620 | Gemiddelde van klas Subnotebook | |
|---|---|---|---|---|---|---|---|---|
| Power Consumption | 11% | -7% | -21% | 16% | -7% | -8% | -17% | |
| Idle Minimum * (Watt) | 3 | 3.2 -7% | 3.2 -7% | 4.3 -43% | 2.2 27% | 3.24 -8% | 3.81 ? -27% | 3.82 ? -27% |
| Idle Average * (Watt) | 6.8 | 6.5 4% | 8.7 -28% | 8 -18% | 5.7 16% | 6.1 10% | 6.94 ? -2% | 6.61 ? 3% |
| Idle Maximum * (Watt) | 8.76 | 6.8 22% | 10.4 -19% | 8.1 8% | 10.3 -18% | 9.2 -5% | 8.75 ? -0% | 7.99 ? 9% |
| Load Average * (Watt) | 35.1 | 28.2 20% | 29.2 17% | 46.6 -33% | 25.6 27% | 38.8 -11% | 35 ? -0% | 41.9 ? -19% |
| Load Maximum * (Watt) | 42.6 | 36 15% | 40.8 4% | 49.8 -17% | 30.6 28% | 52.6 -23% | 47.5 ? -12% | 64.1 ? -50% |
* ... kleiner is beter
| Microsoft Surface Laptop 2-LQN-00004 i5-8250U, UHD Graphics 620, 45 Wh | Microsoft Surface Laptop i5 i5-7200U, HD Graphics 620, 45 Wh | Microsoft Surface Pro 6, Core i7, 512 GB i7-8650U, UHD Graphics 620, 45 Wh | Dell XPS 13 9370 i5 UHD i5-8250U, UHD Graphics 620, 52 Wh | Apple MacBook Air 2018 i5-8210Y, UHD Graphics 617, 50.3 Wh | Asus ZenBook S UX391U i5-8550U, UHD Graphics 620, 50 Wh | Gemiddelde van klas Subnotebook | |
|---|---|---|---|---|---|---|---|
| Batterijduur | 16% | 6% | -14% | 17% | -2% | 32% | |
| Reader / Idle (h) | 20.8 | 22.5 8% | 18.1 -13% | 14.5 -30% | 22.3 7% | 28.6 ? 38% | |
| H.264 (h) | 13.6 | 12.3 -10% | 10.4 -24% | 15.6 ? 15% | |||
| WiFi v1.3 (h) | 9.1 | 10 10% | 8.5 -7% | 6.8 -25% | 11.1 22% | 8.2 -10% | 14 ? 54% |
| Load (h) | 1.6 | 2.1 31% | 2.2 38% | 1.8 13% | 2.2 38% | 1.9 19% | 1.946 ? 22% |
Pro
Contra
Dit is de verkorte versie van het originele artikel. Het volledige, Engelse testrapport vind je hier.
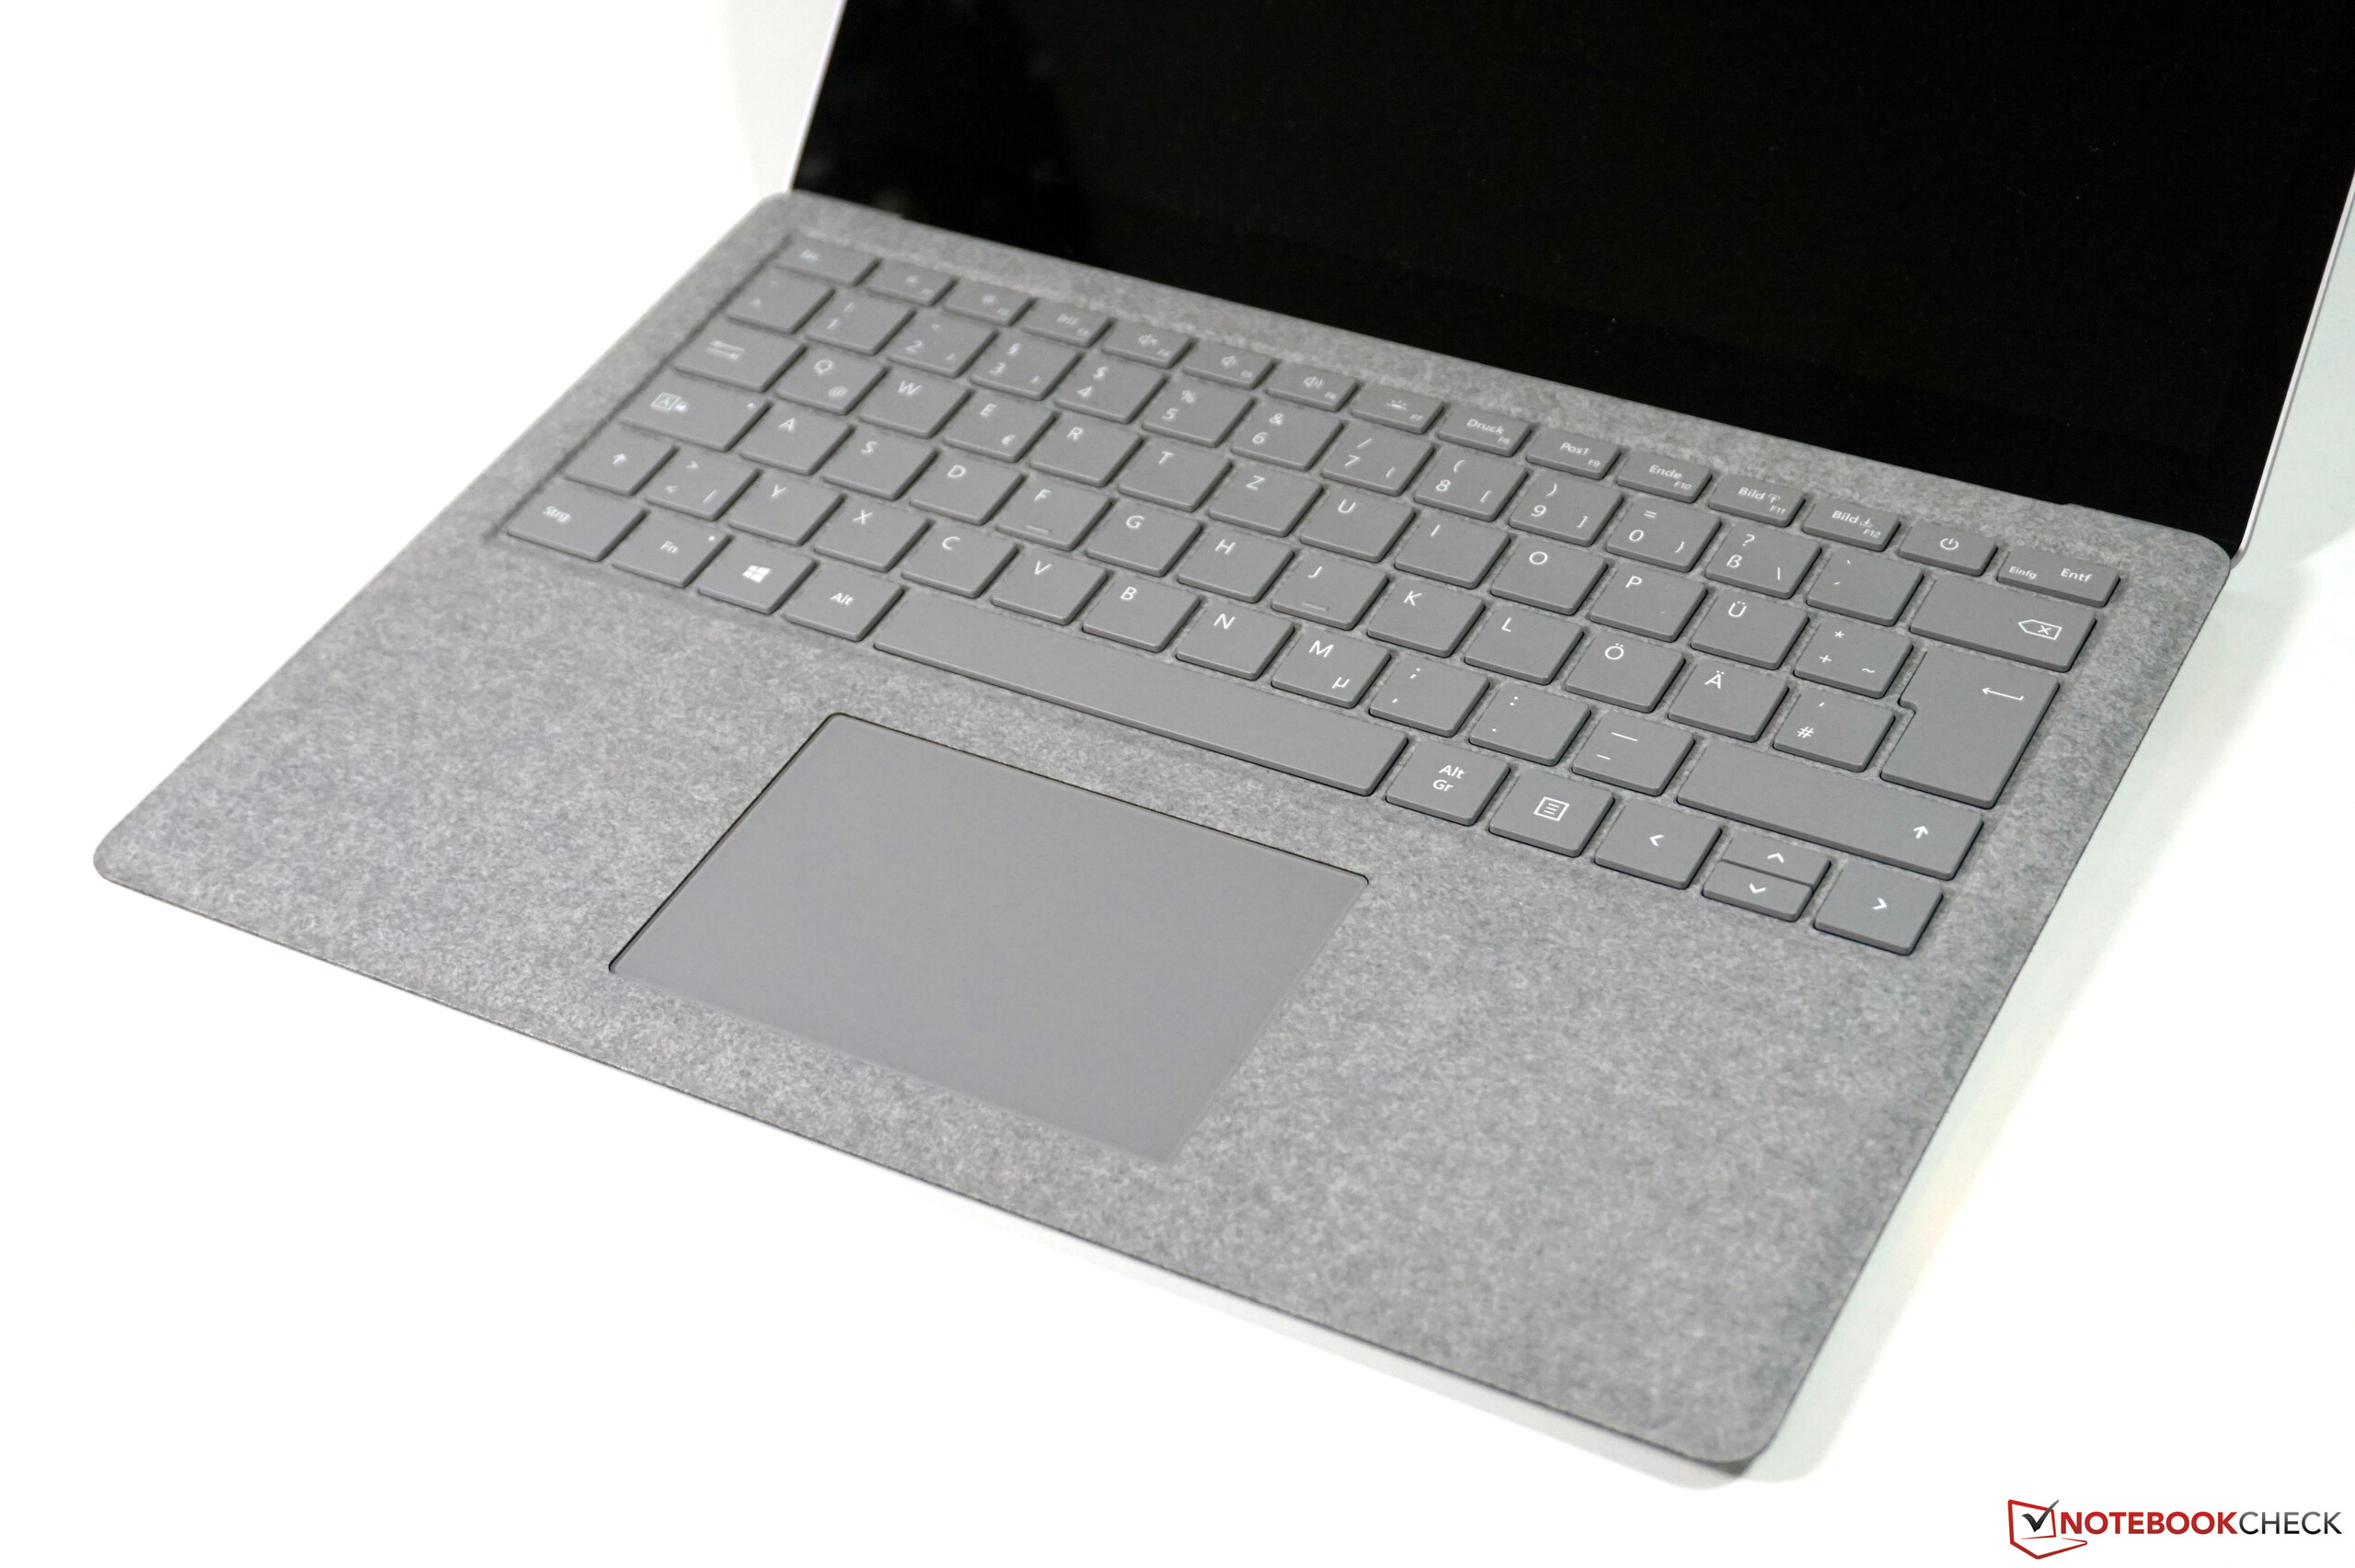
Zoals eerder vermeld heeft Microsoft slechts een update aan het oude Surface-model doorgevoerd. De Surface Laptop 2 biedt een geüpdatete processor met vier cores, een stillere koeling, ietwat verbeterde luidsprekers en een nieuwe kleurvariant. Het scherm is nog altijd het hoogtepunt van het toestel en maakt indruk met zijn nauwkeurige kleuren, goede helderheid en hoog contrast. Hoewel 4K-schermen een hogere resolutie hebben, is het beeld van de Surface Laptop 2 levensecht en van prima kwaliteit. De 3:2-verhouding is voordelig voor de productiviteit van applicaties. Gebruikers die vooral geïnteresseerd zijn in het kijken van video's hebben wellicht meer baat bij een 16:9-scherm. De invoerapparatuur is ook erg overtuigend en het toetsenbord biedt relatief veel feedback voor hoe dun het toestel is. Bijgevolg is het typen erg comfortabel.
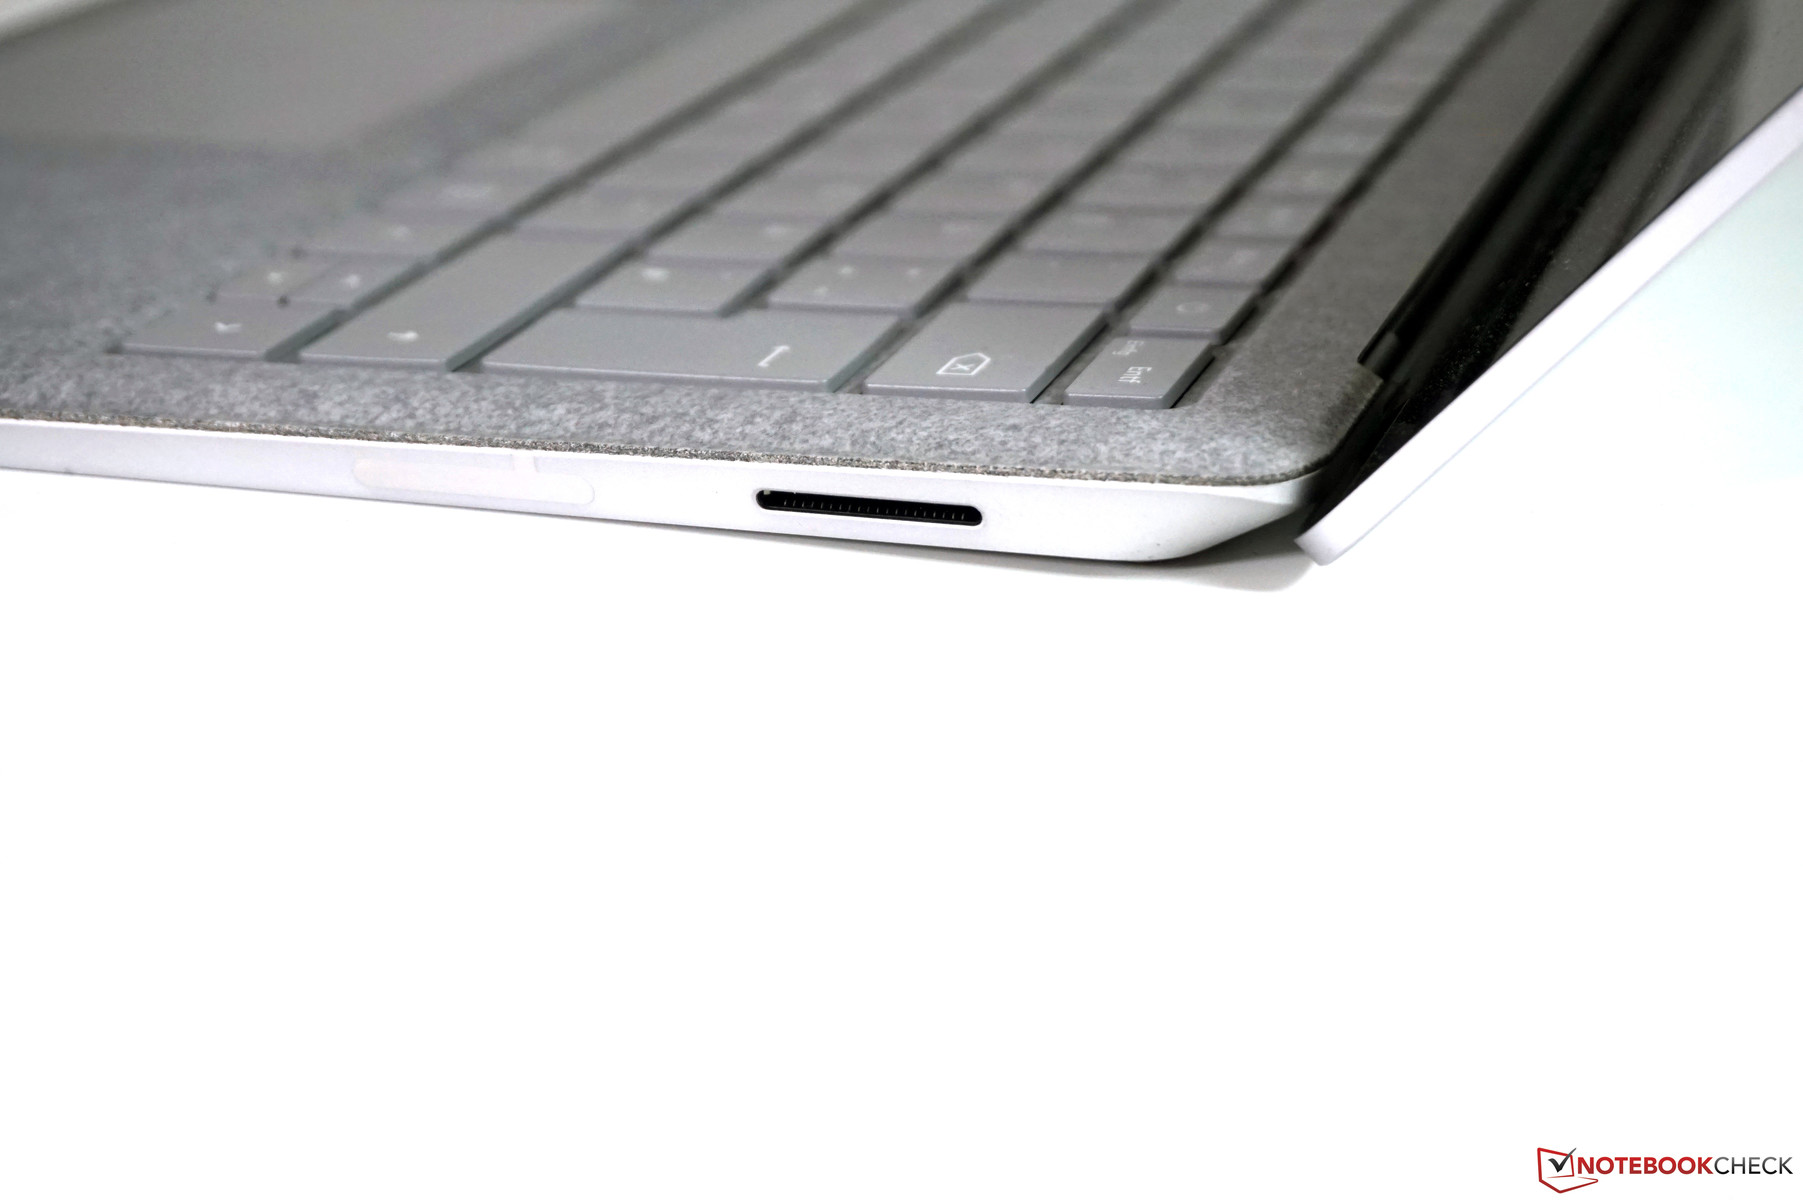
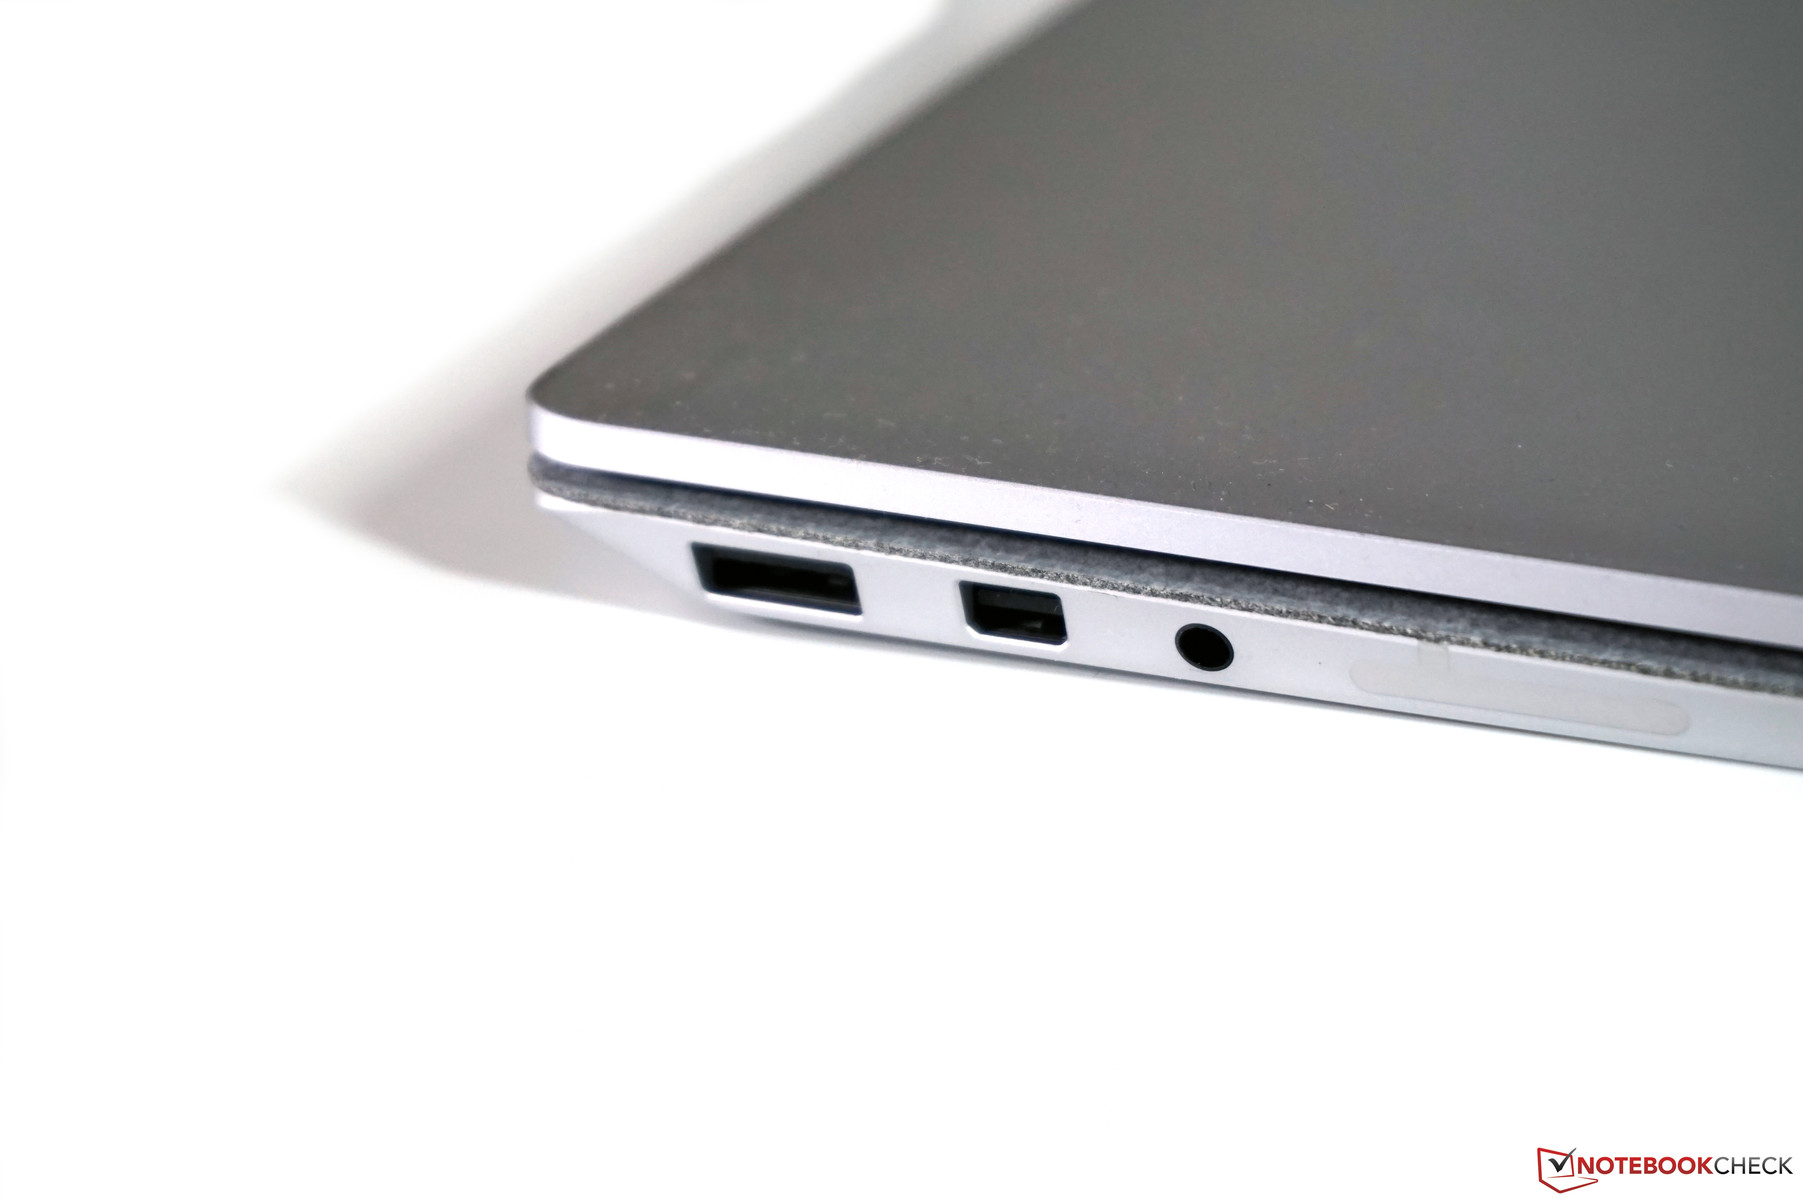
We hebben ook wat punten van kritiek op dit toestel. Het eerste heeft betrekking op de behuizing zelf, die ondanks zijn hoge kwaliteit bijna onmogelijk open te maken valt. Dit betekent dat gebruikers zelfs niet de ventilator kunnen schoonmaken. Een tweede probleem is het ontbreken van een Thunderbolt 3-poort. In de plaats daarvan beschikt het toestel over een Surface Connect-poort waarvoor Microsoft een serie toestellen biedt om erop aan te sluiten. Het is logisch dat Microsoft deze connector wilt behouden, maar de fabrikant had wel Thunderbolt 3 kunnen implementeren in plaats van de aanwezige miniDisaplayPort. Dit zou het toestel futureproof hebben gemaakt en de gebruikers toelaten om eGPU's aan te sluiten. Een ander nadeel is het ontbreken van een SD-kaartlezer - vooral aangezien het paneel erg geschikt zou zijn voor fotobewerking.
Als je op zoek bent naar een hoogwaardige en stille laptop met een goed scherm, prima invoerapparatuur, is de Surface Laptop 2 een uitstekende keuze. Hoewel het teleurstellend en zelfs onbegrijpelijk is dat Thunderbolt 3 ontbreekt, heeft dit momenteel geen grote impact op alledaags gebruik.
Niettemin biedt de Surface Laptop 2 een uitstekend totaalpakket, vooral gezien zijn doelgroep, die vooral bestaat uit "gewone" gebruikers en mensen die vooral nood hebben aan een goed scherm en touchscreen. De prijs/prestaties-verhouding is prima, al rekent Microsoft helaas een erg hoge meerprijs aan voor meer RAM en SSD-opslagruimte en maken de configuratielimieten (afhankelijk van kleur, RAM, etc.) de zaken er zeker niet gemakkelijker op. De Surface Laptop 2 verslaat in onze vergelijking de nieuwe MacBook Air en is wellicht het betere (en goedkopere) alternatief voor veel gebruikers, het besturingssysteem buiten beschouwing gelaten. Gebruikers die op zoek zijn naar een nog compacter toestel kunnen ook de XPS 13, met zijn uitgebreidere hardware- en onderhoudsopties, in beschouwing nemen.
Microsoft Surface Laptop 2-LQN-00004
- 22-10-2019 v7 (old)
Andreas Osthoff
Price comparison
