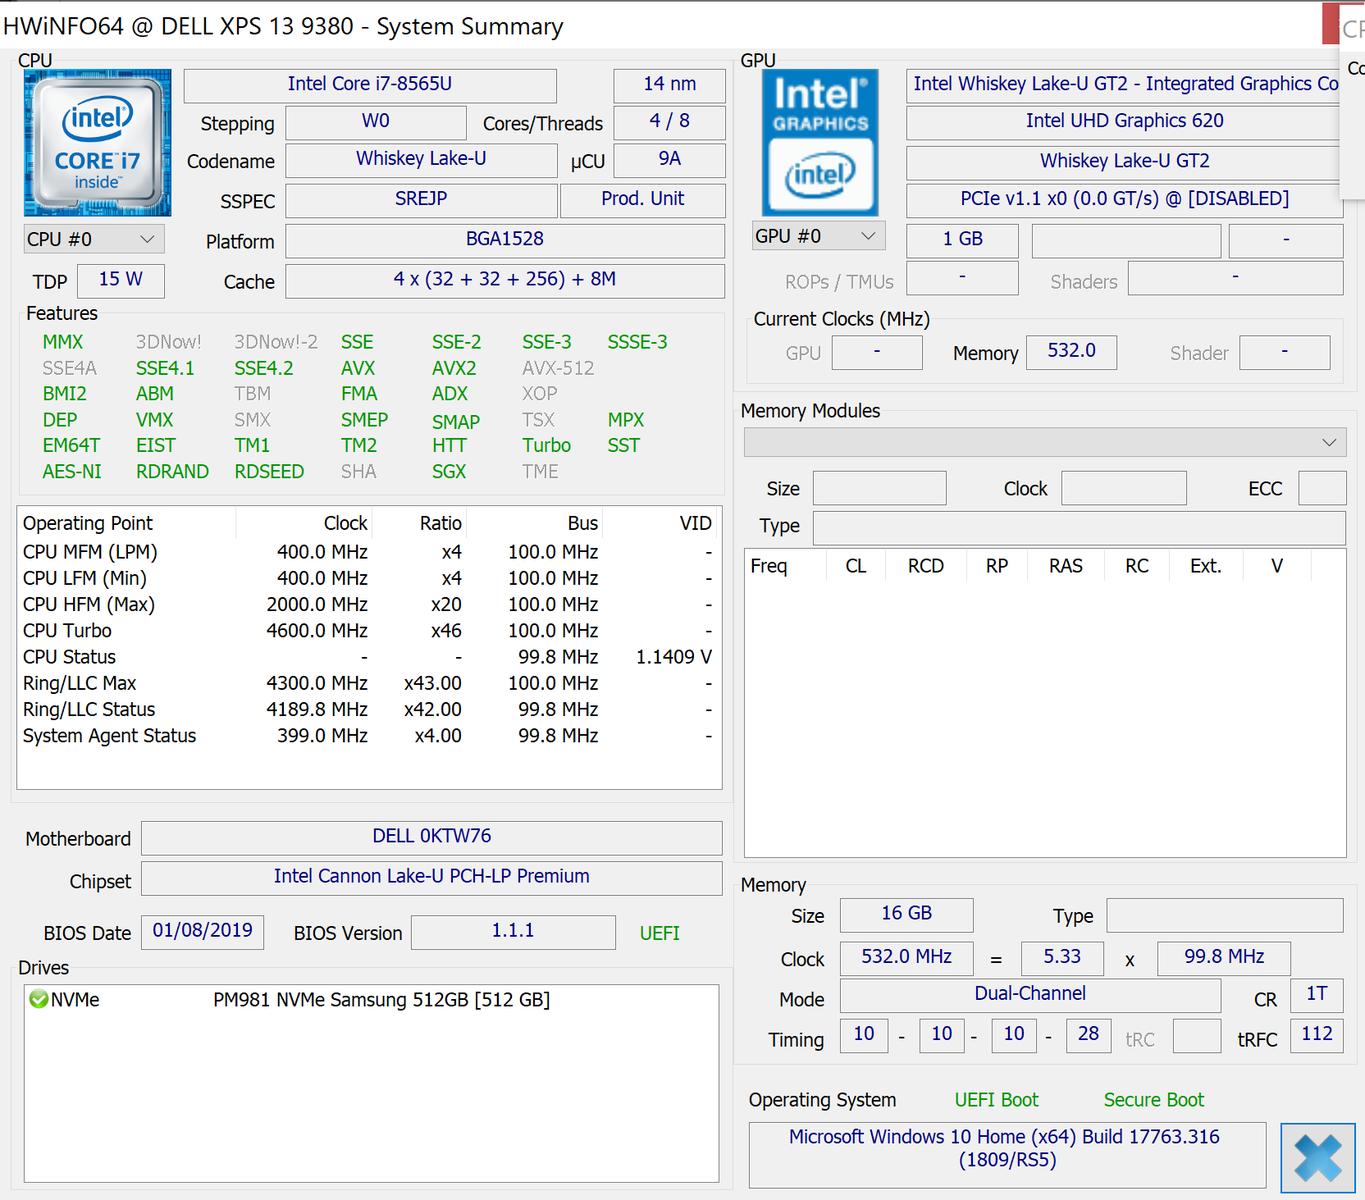
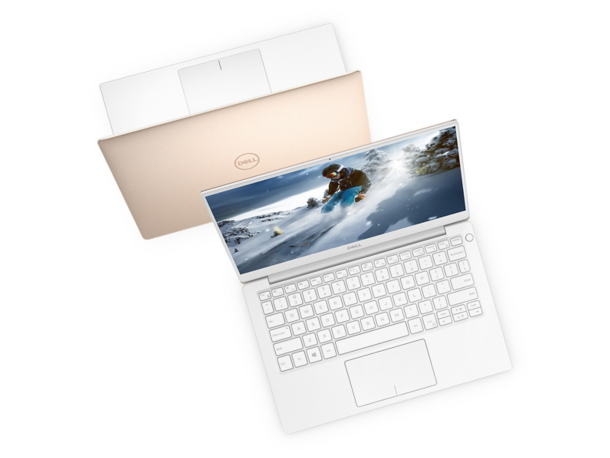
Kort testrapport Dell XPS 13 9380 (i7-8565U, 4K UHD) Laptop
| SD Card Reader | |
| average JPG Copy Test (av. of 3 runs) | |
| Dell XPS 15 9570 Core i9 UHD (Toshiba Exceria Pro SDXC 64 GB UHS-II) | |
| Dell XPS 13 9380 i7 4K (Toshiba Exceria Pro M501 64 GB UHS-II) | |
| HP Spectre x360 15-ch011nr (Toshiba Exceria Pro SDXC 64 GB UHS-II) | |
| Samsung Notebook 9 NP930QAA (Toshiba Exceria Pro M501 microSDXC 64GB) | |
| Asus ZenBook 13 UX333FA (Toshiba Exceria Pro M501 microSDXC 64GB) | |
| maximum AS SSD Seq Read Test (1GB) | |
| HP Spectre x360 15-ch011nr (Toshiba Exceria Pro SDXC 64 GB UHS-II) | |
| Dell XPS 15 9570 Core i9 UHD (Toshiba Exceria Pro SDXC 64 GB UHS-II) | |
| Dell XPS 13 9380 i7 4K (Toshiba Exceria Pro M501 64 GB UHS-II) | |
| Samsung Notebook 9 NP930QAA (Toshiba Exceria Pro M501 microSDXC 64GB) | |
| Asus ZenBook 13 UX333FA (Toshiba Exceria Pro M501 microSDXC 64GB) | |
| |||||||||||||||||||||||||
Helderheidsverdeling: 88 %
Helderheid in Batterij-modus: 370.2 cd/m²
Contrast: 1586:1 (Zwart: 0.27 cd/m²)
ΔE ColorChecker Calman: 2.69 | ∀{0.5-29.43 Ø4.71}
calibrated: 2.01
ΔE Greyscale Calman: 3.7 | ∀{0.09-98 Ø4.96}
93.5% sRGB (Argyll 1.6.3 3D)
60.4% AdobeRGB 1998 (Argyll 1.6.3 3D)
65.8% AdobeRGB 1998 (Argyll 3D)
93.6% sRGB (Argyll 3D)
64.8% Display P3 (Argyll 3D)
Gamma: 2.1
CCT: 6706 K
| Dell XPS 13 9380 i7 4K ID: AUO 282B B133ZAN Dell: 90NTH, IPS, 13.3", 3840x2160 | Apple MacBook Pro 13 2018 Touchbar i5 APPA03E, IPS, 13.3", 2560x1600 | Asus ZenBook 13 UX333FA AU Optronics B133HAN05.C, IPS, 13.3", 1920x1080 | Dell XPS 13 9370 i7 UHD ID: Sharp SHP148B, Name: LQ133D1, Dell P/N: 8XDHY, IPS, 13.3", 3840x2160 | Dell XPS 13 9370 FHD i5 SHP1484, IPS, 13.3", 1920x1080 | Huawei MateBook 13 i7 Chi Mei CMN8201, IPS, 13", 2160x1440 | |
|---|---|---|---|---|---|---|
| Display | 31% | 5% | 6% | 5% | 5% | |
| Display P3 Coverage (%) | 64.8 | 98.5 52% | 67.9 5% | 68.9 6% | 68.9 6% | 68.1 5% |
| sRGB Coverage (%) | 93.6 | 99.9 7% | 97.4 4% | 98.4 5% | 96.6 3% | 97.7 4% |
| AdobeRGB 1998 Coverage (%) | 65.8 | 87.3 33% | 69.2 5% | 69.5 6% | 69.6 6% | 69.2 5% |
| Response Times | 23% | 9% | -12% | -8% | 25% | |
| Response Time Grey 50% / Grey 80% * (ms) | 64.8 ? | 46 ? 29% | 54.4 ? 16% | 69.6 ? -7% | 62.4 ? 4% | 43.2 ? 33% |
| Response Time Black / White * (ms) | 38 ? | 32 ? 16% | 37.6 ? 1% | 44 ? -16% | 45.6 ? -20% | 32 ? 16% |
| PWM Frequency (Hz) | 118000 ? | 3759 ? | 1008 ? | |||
| Screen | 21% | -19% | -2% | -6% | -8% | |
| Brightness middle (cd/m²) | 428.3 | 519 21% | 276 -36% | 478.5 12% | 428 0% | 366.6 -14% |
| Brightness (cd/m²) | 414 | 504 22% | 263 -36% | 466 13% | 405 -2% | 360 -13% |
| Brightness Distribution (%) | 88 | 95 8% | 89 1% | 86 -2% | 87 -1% | 93 6% |
| Black Level * (cd/m²) | 0.27 | 0.33 -22% | 0.21 22% | 0.43 -59% | 0.26 4% | 0.39 -44% |
| Contrast (:1) | 1586 | 1573 -1% | 1314 -17% | 1113 -30% | 1646 4% | 940 -41% |
| Colorchecker dE 2000 * | 2.69 | 1.4 48% | 4.85 -80% | 3.09 -15% | 3.8 -41% | 2.76 -3% |
| Colorchecker dE 2000 max. * | 6.19 | 2.8 55% | 8.24 -33% | 5.94 4% | 7.2 -16% | 6.19 -0% |
| Colorchecker dE 2000 calibrated * | 2.01 | 1.6 20% | 2.06 -2% | 1.53 24% | ||
| Greyscale dE 2000 * | 3.7 | 2.2 41% | 5.7 -54% | 2.4 35% | 4.4 -19% | 4.2 -14% |
| Gamma | 2.1 105% | 2.22 99% | 2.08 106% | 2.063 107% | 2.21 100% | 2.22 99% |
| CCT | 6706 97% | 6908 94% | 7424 88% | 6883 94% | 7067 92% | 6271 104% |
| Color Space (Percent of AdobeRGB 1998) (%) | 60.4 | 77.3 28% | 63 4% | 69.47 15% | 62.8 4% | 63.2 5% |
| Color Space (Percent of sRGB) (%) | 93.5 | 99.99 7% | 98 5% | 98.36 5% | 96.4 3% | 97.6 4% |
| Totaal Gemiddelde (Programma / Instellingen) | 25% /
23% | -2% /
-11% | -3% /
-2% | -3% /
-4% | 7% /
-2% |
* ... kleiner is beter
Responstijd Scherm
| ↔ Responstijd Zwart naar Wit | ||
|---|---|---|
| 38 ms ... stijging ↗ en daling ↘ gecombineerd | ↗ 19.2 ms stijging | 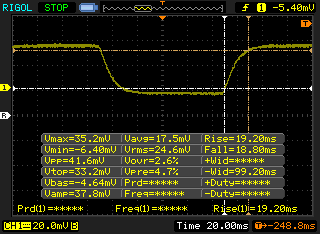 |
| ↘ 18.8 ms daling | ||
| Het scherm vertoonde trage responstijden in onze tests en is misschien te traag voor games. Ter vergelijking: alle testtoestellen variëren van 0.1 (minimum) tot 240 (maximum) ms. » 96 % van alle toestellen zijn beter. Dit betekent dat de gemeten responstijd slechter is dan het gemiddelde (19.8 ms) van alle geteste toestellen. | ||
| ↔ Responstijd 50% Grijs naar 80% Grijs | ||
| 64.8 ms ... stijging ↗ en daling ↘ gecombineerd | ↗ 31.6 ms stijging | 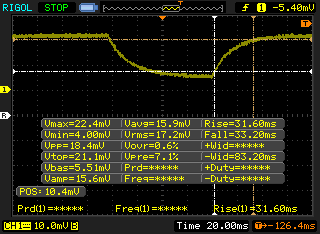 |
| ↘ 33.2 ms daling | ||
| Het scherm vertoonde trage responstijden in onze tests en is misschien te traag voor games. Ter vergelijking: alle testtoestellen variëren van 0.165 (minimum) tot 636 (maximum) ms. » 98 % van alle toestellen zijn beter. Dit betekent dat de gemeten responstijd slechter is dan het gemiddelde (30.9 ms) van alle geteste toestellen. | ||
Screen Flickering / PWM (Pulse-Width Modulation)
| Screen flickering / PWM niet waargenomen | 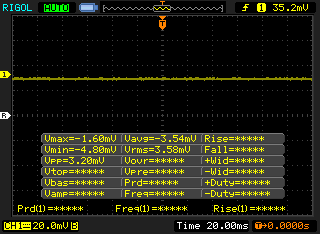 | ||
Ter vergelijking: 52 % van alle geteste toestellen maakten geen gebruik van PWM om de schermhelderheid te verlagen. Als het wel werd gebruikt, werd een gemiddelde van 7748 (minimum: 5 - maximum: 343500) Hz waargenomen. | |||
| Cinebench R15 | |
| CPU Single 64Bit | |
| Dell XPS 15 9570 Core i9 UHD | |
| Dell XPS 13 9380 i7 4K | |
| Gemiddeld Intel Core i7-8565U (138.3 - 193, n=51) | |
| Dell G3 15 3579 | |
| Dell XPS 13 9370 i7 UHD | |
| Dell XPS 13 9380 2019 | |
| HP EliteBook 735 G5 3UN62EA | |
| Lenovo ThinkPad 13 20J1005TPB | |
| Dell Latitude 3490 | |
| CPU Multi 64Bit | |
| Dell XPS 15 9570 Core i9 UHD | |
| Dell G3 15 3579 | |
| Dell XPS 13 9380 i7 4K | |
| Dell XPS 13 9380 i7 4K | |
| Dell XPS 13 9380 2019 | |
| Dell Latitude 3490 | |
| HP EliteBook 735 G5 3UN62EA | |
| Dell XPS 13 9370 i7 UHD | |
| Gemiddeld Intel Core i7-8565U (452 - 815, n=52) | |
| Lenovo ThinkPad 13 20J1005TPB | |
| PCMark 8 Home Score Accelerated v2 | 3296 punten | |
| PCMark 8 Work Score Accelerated v2 | 4304 punten | |
| PCMark 10 Score | 4172 punten | |
Help | ||
| Dell XPS 13 9380 i7 4K Samsung SSD PM981 MZVLB512HAJQ | Samsung Notebook 9 NP930QAA Samsung PM961 MZVLW256HEHP | Asus ZenBook 13 UX333FA WDC PC SN520 SDAPNUW-256G | Huawei MateBook 13 i7 Samsung SSD PM981 MZVLB512HAJQ | Dell XPS 15 9570 Core i9 UHD Samsung SSD PM981 MZVLB1T0HALR | HP Spectre x360 15-ch011nr SK hynix PC401 NVMe 500 GB | |
|---|---|---|---|---|---|---|
| AS SSD | -29% | -40% | -4% | -8% | -34% | |
| Seq Read (MB/s) | 1981 | 1824 -8% | 1186 -40% | 1889 -5% | 1320 -33% | 1739 -12% |
| Seq Write (MB/s) | 1473 | 986 -33% | 809 -45% | 1812 23% | 1500 2% | 1189 -19% |
| 4K Read (MB/s) | 53.3 | 41.84 -22% | 39.69 -26% | 55.5 4% | 30.73 -42% | 38.76 -27% |
| 4K Write (MB/s) | 127.4 | 104.1 -18% | 114 -11% | 118.4 -7% | 94.4 -26% | 93.2 -27% |
| 4K-64 Read (MB/s) | 1179 | 1196 1% | 618 -48% | 1257 7% | 1453 23% | 646 -45% |
| 4K-64 Write (MB/s) | 2105 | 739 -65% | 510 -76% | 1571 -25% | 1815 -14% | 545 -74% |
| Access Time Read * (ms) | 0.036 | 0.061 -69% | 0.068 -89% | 0.041 -14% | 0.061 -69% | 0.054 -50% |
| Access Time Write * (ms) | 0.029 | 0.036 -24% | 0.032 -10% | 0.032 -10% | 0.044 -52% | 0.051 -76% |
| Score Read (Points) | 1430 | 1420 -1% | 776 -46% | 1502 5% | 1616 13% | 859 -40% |
| Score Write (Points) | 2379 | 941 -60% | 705 -70% | 1871 -21% | 2059 -13% | 757 -68% |
| Score Total (Points) | 4526 | 3051 -33% | 1870 -59% | 4147 -8% | 4507 0% | 2037 -55% |
| Copy ISO MB/s (MB/s) | 1294 | 1103 -15% | 1090 -16% | 1800 39% | 2577 99% | 1668 29% |
| Copy Program MB/s (MB/s) | 503 | 541 8% | 714 42% | 385.6 -23% | 515 2% | 486.8 -3% |
| Copy Game MB/s (MB/s) | 1148 | 418.6 -64% | 413 -64% | 982 -14% | 1120 -2% | 1042 -9% |
* ... kleiner is beter

| 3DMark - 1280x720 Cloud Gate Standard Graphics | |
| Dell XPS 15 9570 Core i9 UHD | |
| Huawei MateBook 13 i7 | |
| Acer TravelMate X3410-M-50DD | |
| Dell XPS 13 9360 FHD i7 Iris | |
| Dell XPS 13 9380 2019 | |
| Dell XPS 13 9380 i7 4K | |
| Lenovo Ideapad 720S-13ARR | |
| Gemiddeld Intel UHD Graphics 620 (6205 - 16400, n=225) | |
| Apple MacBook 12 (Early 2016) 1.1 GHz | |
| 3DMark 11 Performance | 2117 punten | |
| 3DMark Cloud Gate Standard Score | 9160 punten | |
Help | ||
| lage | gem. | hoge | ultra | |
|---|---|---|---|---|
| BioShock Infinite (2013) | 81.5 | 39.1 | 32.5 | 10 |
| Dell XPS 13 9380 i7 4K UHD Graphics 620, i7-8565U, Samsung SSD PM981 MZVLB512HAJQ | Huawei Matebook X Pro i5 GeForce MX150, i5-8250U, Samsung PM961 MZVLW256HEHP | Dell XPS 13 9370 i7 UHD UHD Graphics 620, i5-8550U, Toshiba XG5 KXG50ZNV512G | Apple MacBook Pro 13 2018 Touchbar i5 Iris Plus Graphics 655, i5-8259U | Razer Blade Stealth i7-8565U GeForce MX150, i7-8565U, Lite-On CA3-8D256-Q11 | Dell XPS 13 9380 2019 UHD Graphics 620, i5-8265U, SK hynix PC401 HFS256GD9TNG | |
|---|---|---|---|---|---|---|
| Noise | 3% | 5% | -2% | -1% | 2% | |
| uit / omgeving * (dB) | 28.4 | 27.9 2% | 28 1% | 29.6 -4% | 28.4 -0% | 30.4 -7% |
| Idle Minimum * (dB) | 29.4 | 27.9 5% | 28 5% | 29.6 -1% | 28.5 3% | 30.4 -3% |
| Idle Average * (dB) | 29.4 | 27.9 5% | 28 5% | 29.6 -1% | 29 1% | 30.4 -3% |
| Idle Maximum * (dB) | 29.4 | 27.9 5% | 28 5% | 29.6 -1% | 29.1 1% | 30.4 -3% |
| Load Average * (dB) | 34.6 | 36.2 -5% | 32.5 6% | 36.7 -6% | 42.8 -24% | 31.7 8% |
| Load Maximum * (dB) | 46.8 | 45.2 3% | 42.2 10% | 46.7 -0% | 41.6 11% | 38.1 19% |
| Witcher 3 ultra * (dB) | 45 | 32.5 | 41.4 |
* ... kleiner is beter
Geluidsniveau
| Onbelast |
| 29.4 / 29.4 / 29.4 dB (A) |
| Belasting |
| 34.6 / 46.8 dB (A) |
 | ||
30 dB stil 40 dB(A) hoorbaar 50 dB(A) luid |
||
min: | ||
(-) De maximumtemperatuur aan de bovenzijde bedraagt 46.2 °C / 115 F, vergeleken met het gemiddelde van 35.9 °C / 97 F, variërend van 21.4 tot 59 °C voor de klasse Subnotebook.
(-) De bodem warmt op tot een maximum van 46.2 °C / 115 F, vergeleken met een gemiddelde van 39.2 °C / 103 F
(+) Bij onbelast gebruik bedraagt de gemiddelde temperatuur voor de bovenzijde 23.3 °C / 74 F, vergeleken met het apparaatgemiddelde van 30.8 °C / 87 F.
(+) De palmsteunen en het touchpad zijn met een maximum van ###max## °C / 78.8 F koeler dan de huidtemperatuur en voelen daarom koel aan.
(+) De gemiddelde temperatuur van de handpalmsteun van soortgelijke toestellen bedroeg 28.2 °C / 82.8 F (+2.2 °C / 4 F).
Dell XPS 13 9380 i7 4K audioanalyse
(±) | luidspreker luidheid is gemiddeld maar goed (75.3 dB)
Bas 100 - 315 Hz
(-) | bijna geen lage tonen - gemiddeld 18.5% lager dan de mediaan
(±) | lineariteit van de lage tonen is gemiddeld (8.1% delta ten opzichte van de vorige frequentie)
Midden 400 - 2000 Hz
(±) | hogere middens - gemiddeld 7.7% hoger dan de mediaan
(±) | lineariteit van de middentonen is gemiddeld (11.5% delta ten opzichte van de vorige frequentie)
Hoog 2 - 16 kHz
(±) | higher highs - on average 6.2% higher than median
(±) | lineariteit van de hoogtepunten is gemiddeld (10.5% delta ten opzichte van de vorige frequentie)
Algemeen 100 - 16.000 Hz
(±) | lineariteit van het totale geluid is gemiddeld (28.5% verschil met de mediaan)
Vergeleken met dezelfde klasse
» 90% van alle geteste apparaten in deze klasse waren beter, 2% vergelijkbaar, 7% slechter
» De beste had een delta van 5%, het gemiddelde was 18%, de slechtste was 53%
Vergeleken met alle geteste toestellen
» 86% van alle geteste apparaten waren beter, 3% gelijk, 11% slechter
» De beste had een delta van 4%, het gemiddelde was 23%, de slechtste was 134%
Apple MacBook 12 (Early 2016) 1.1 GHz audioanalyse
(+) | luidsprekers kunnen relatief luid spelen (83.6 dB)
Bas 100 - 315 Hz
(±) | verminderde zeebaars - gemiddeld 11.3% lager dan de mediaan
(±) | lineariteit van de lage tonen is gemiddeld (14.2% delta ten opzichte van de vorige frequentie)
Midden 400 - 2000 Hz
(+) | evenwichtige middens - slechts 2.4% verwijderd van de mediaan
(+) | de middentonen zijn lineair (5.5% delta ten opzichte van de vorige frequentie)
Hoog 2 - 16 kHz
(+) | evenwichtige hoogtepunten - slechts 2% verwijderd van de mediaan
(+) | de hoge tonen zijn lineair (4.5% delta naar de vorige frequentie)
Algemeen 100 - 16.000 Hz
(+) | het totale geluid is lineair (10.2% verschil met de mediaan)
Vergeleken met dezelfde klasse
» 7% van alle geteste apparaten in deze klasse waren beter, 2% vergelijkbaar, 90% slechter
» De beste had een delta van 5%, het gemiddelde was 18%, de slechtste was 53%
Vergeleken met alle geteste toestellen
» 5% van alle geteste apparaten waren beter, 1% gelijk, 94% slechter
» De beste had een delta van 4%, het gemiddelde was 23%, de slechtste was 134%
| Uit / Standby | |
| Inactief | |
| Belasting |
|
Key:
min: | |
| Dell XPS 13 9380 i7 4K i7-8565U, UHD Graphics 620, Samsung SSD PM981 MZVLB512HAJQ, IPS, 3840x2160, 13.3" | Samsung Notebook 9 NP930QAA i5-8550U, UHD Graphics 620, Samsung PM961 MZVLW256HEHP, IPS, 1920x1080, 13.3" | Asus ZenBook 13 UX333FA i5-8265U, UHD Graphics 620, WDC PC SN520 SDAPNUW-256G, IPS, 1920x1080, 13.3" | Dell XPS 13 9370 i7 UHD i5-8550U, UHD Graphics 620, Toshiba XG5 KXG50ZNV512G, IPS, 3840x2160, 13.3" | Huawei MateBook 13 i7 i7-8565U, GeForce MX150, Samsung SSD PM981 MZVLB512HAJQ, IPS, 2160x1440, 13" | Apple MacBook Pro 13 2018 Touchbar i5 i5-8259U, Iris Plus Graphics 655, , IPS, 2560x1600, 13.3" | |
|---|---|---|---|---|---|---|
| Power Consumption | -8% | 33% | 3% | -11% | -3% | |
| Idle Minimum * (Watt) | 5.2 | 4.4 15% | 1.6 69% | 5 4% | 3.5 33% | 2.3 56% |
| Idle Average * (Watt) | 8.6 | 11.8 -37% | 4.6 47% | 8.3 3% | 7.5 13% | 8.7 -1% |
| Idle Maximum * (Watt) | 10.5 | 15.5 -48% | 7.3 30% | 8.8 16% | 12.4 -18% | 12.2 -16% |
| Load Average * (Watt) | 44.2 | 38 14% | 37.9 14% | 46.4 -5% | 64.2 -45% | 53.3 -21% |
| Load Maximum * (Watt) | 47.5 | 39.8 16% | 44.8 6% | 48.6 -2% | 65.7 -38% | 64 -35% |
| Witcher 3 ultra * (Watt) | 52.5 |
* ... kleiner is beter
| Dell XPS 13 9380 i7 4K i7-8565U, UHD Graphics 620, 52 Wh | Asus ZenBook 13 UX333FA i5-8265U, UHD Graphics 620, 50 Wh | Huawei MateBook 13 i7 i7-8565U, GeForce MX150, 41.7 Wh | Apple MacBook Pro 13 2018 Touchbar i5 i5-8259U, Iris Plus Graphics 655, 58 Wh | Dell XPS 13 9370 i7 UHD i5-8550U, UHD Graphics 620, 52 Wh | Samsung Notebook 9 NP930QAA i5-8550U, UHD Graphics 620, 39 Wh | |
|---|---|---|---|---|---|---|
| Batterijduur | 29% | -1% | 26% | 1% | -14% | |
| WiFi v1.3 (h) | 7.7 | 9.9 29% | 7.6 -1% | 9.7 26% | 7.8 1% | 6.6 -14% |
| Reader / Idle (h) | 27.8 | 15.4 | 13.7 | 14.6 | ||
| Load (h) | 2.2 | 0.9 | 1.8 | 1.2 | ||
| Witcher 3 ultra (h) | 1.6 |
Pro
Contra
Dit is de verkorte versie van het originele artikel. Het volledige, Engelse testrapport vind je hier.
De XPS 13 9380 is een degelijke subnotebook die de klachten over de webcam van de 9360- en 9370-serie rechtstreeks aanpakt. Alle goede en minder goede kanten van de 9370-serie blijven voor de rest zoals ze waren. We zijn echter vooral geïnteresseerd in het antwoord op de volgende vraag: is de versie met de Core i7 de meerprijs waard in vergelijking met het alternatief met Core i5?
Een keuze voor de Core i7 gaat gepaard met een prestatiesprong van slechts 10 procent ten opzichte van de Core i5 voor zo'n 250 euro meer. Dit zou niet zo ongunstig geweest zijn als Dell het RAM en/of de opslagcapaciteit eveneens had verhoogd, maar dit is niet het geval. We raden dan ook aan om de versie met Core i5 te nemen en vervolgens - indien mogelijk - te investeren in langere garantie of meer RAM.
Gebruikers die toch de Core i7 verkiezen, zullen ontdekken dat de batterijduur en temperaturen niet zo gek veel verschillen van de versie met Core i5. De ventilator klinkt wel luider, al wordt dit alleen duidelijk bij zwaardere belastingen. De kleine CPU-prestatieverhoging heeft dus gelukkig weinig grote nadelen.
De duurste XPS 13 is sneller dan de mid-range configuratie, al is het verschil relatief klein - in tegenstelling tot de grote prijskloof tussen de twee varianten. We raden aan om die dollars te investeren in meer tastbare systeemeigenschappen zoals extra RAM, opslagruimte of een 4K-touchscreen.
Dell XPS 13 9380 i7 4K
- 12-03-2019 v6 (old)
Allen Ngo
Price comparison
