Kort testrapport Dell XPS 13 9380 2019 (i5-8265U, 256GB, UHD) Subnotebook
| SD Card Reader | |
| average JPG Copy Test (av. of 3 runs) | |
| Dell XPS 13 9380 2019 (Toshiba Exceria Pro SDXC 64 GB UHS-II) | |
| Dell XPS 13 9370 FHD i5 (Toshiba Exceria Pro M501 64 GB UHS-II) | |
| Dell XPS 13 9370 i7 UHD (Toshiba Exceria Pro UHS-II) | |
| Fujitsu Lifebook U938 (Toshiba Exceria Pro SDXC 64 GB UHS-II) | |
| HP Envy 13-ah0003ng (Toshiba Exceria Pro M501 microSDXC 64GB) | |
| Lenovo ThinkPad X280-20KES01S00 (Toshiba Excerie Pro M501) | |
| Gemiddelde van klas Subnotebook (23.7 - 188, n=9, laatste 2 jaar) | |
| maximum AS SSD Seq Read Test (1GB) | |
| Dell XPS 13 9370 i7 UHD (Toshiba Exceria Pro UHS-II) | |
| Dell XPS 13 9370 FHD i5 (Toshiba Exceria Pro M501 64 GB UHS-II) | |
| Dell XPS 13 9380 2019 (Toshiba Exceria Pro SDXC 64 GB UHS-II) | |
| Fujitsu Lifebook U938 (Toshiba Exceria Pro SDXC 64 GB UHS-II) | |
| Gemiddelde van klas Subnotebook (24.9 - 195, n=8, laatste 2 jaar) | |
| Lenovo ThinkPad X280-20KES01S00 (Toshiba Excerie Pro M501) | |
| HP Envy 13-ah0003ng (Toshiba Exceria Pro M501 microSDXC 64GB) | |
| |||||||||||||||||||||||||
Helderheidsverdeling: 85 %
Helderheid in Batterij-modus: 404 cd/m²
Contrast: 1092:1 (Zwart: 0.37 cd/m²)
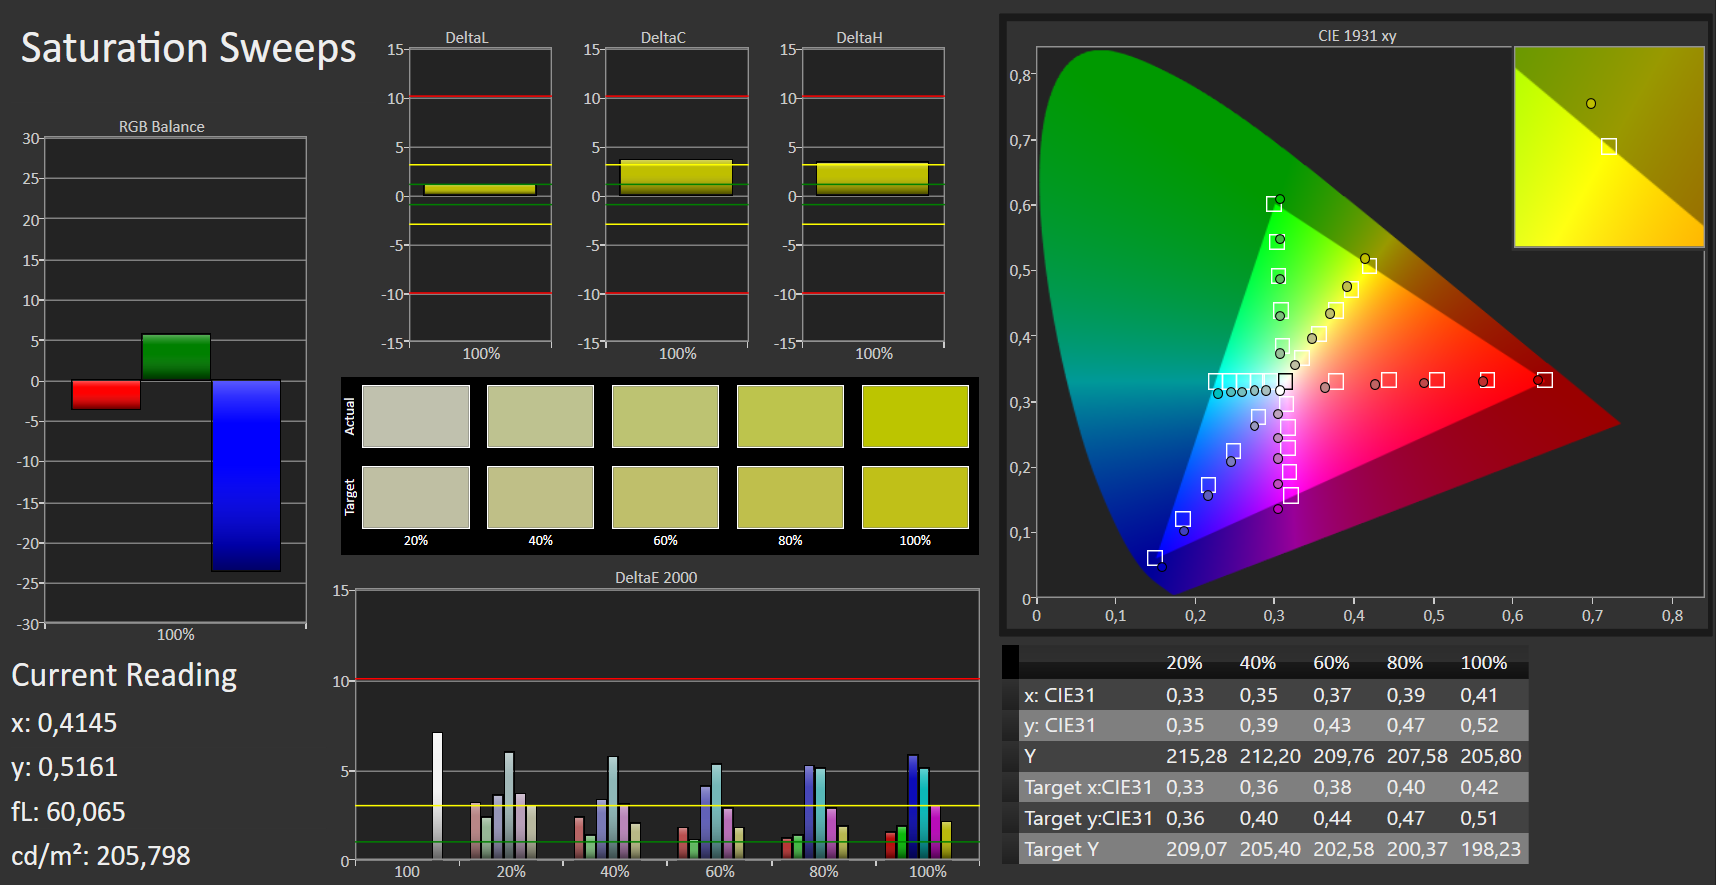
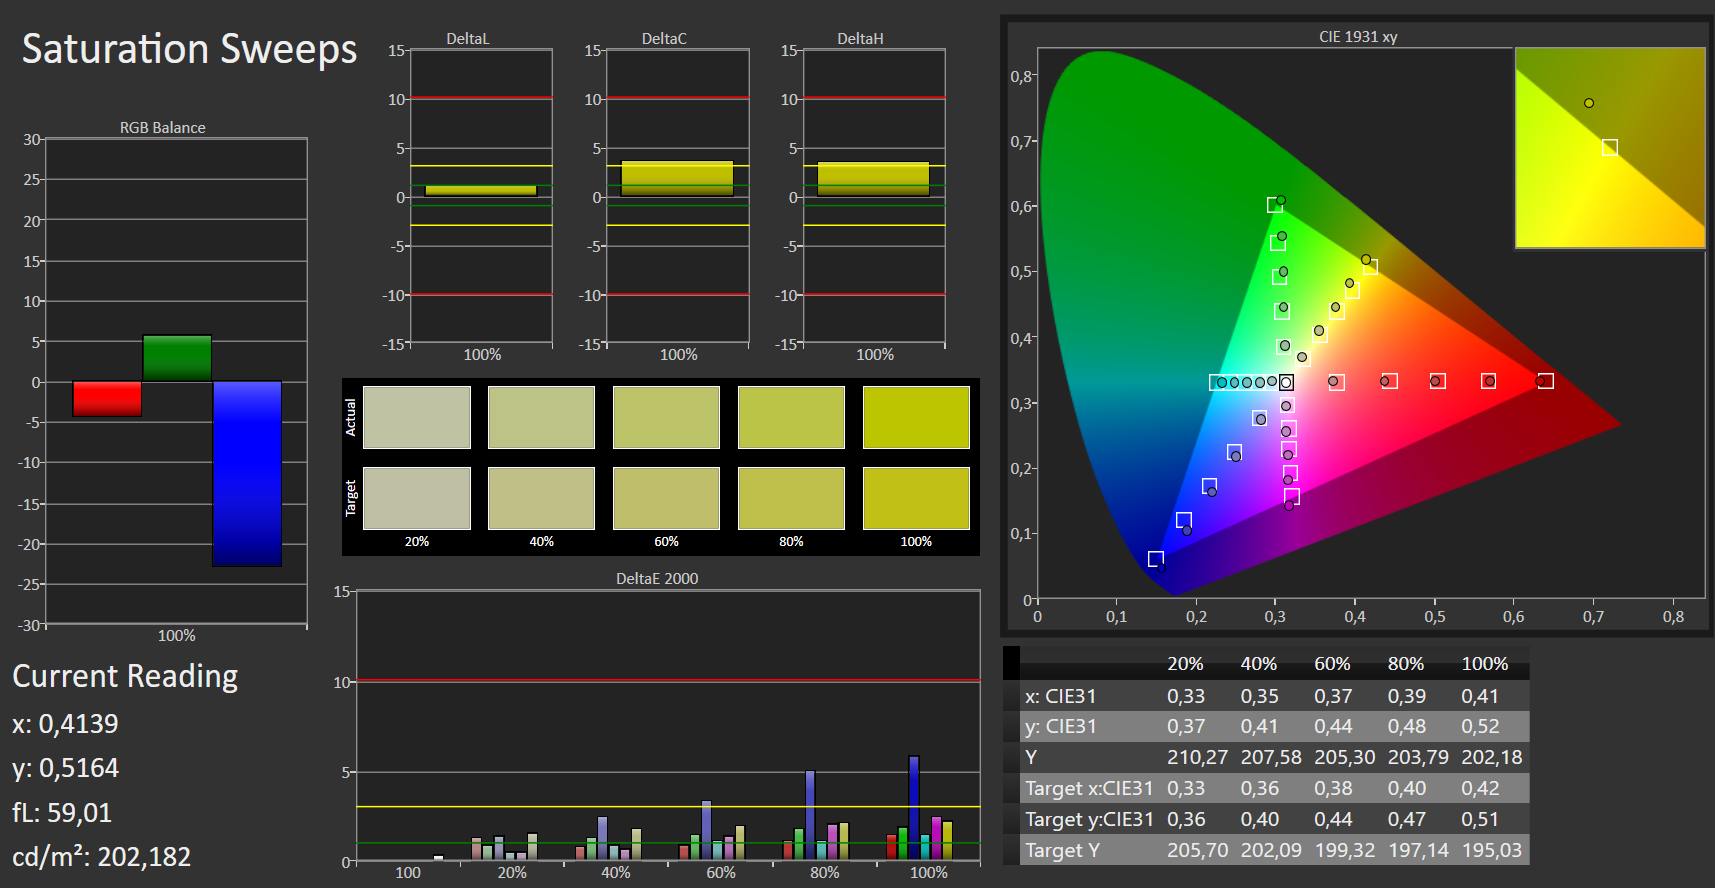
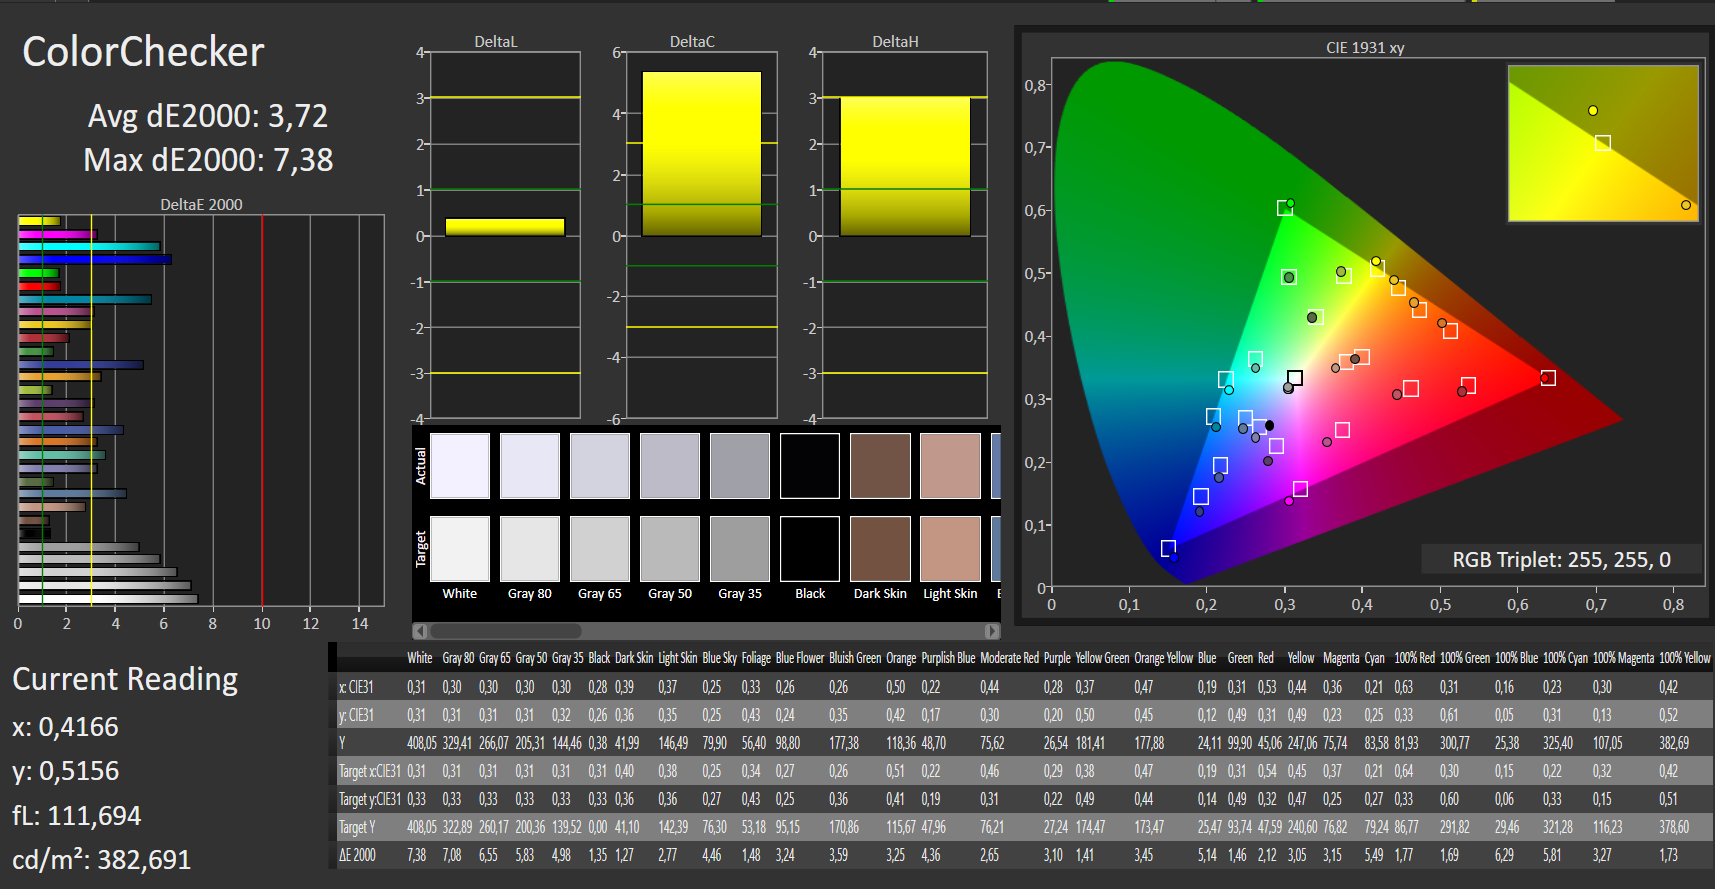
ΔE ColorChecker Calman: 3.72 | ∀{0.5-29.43 Ø4.71}
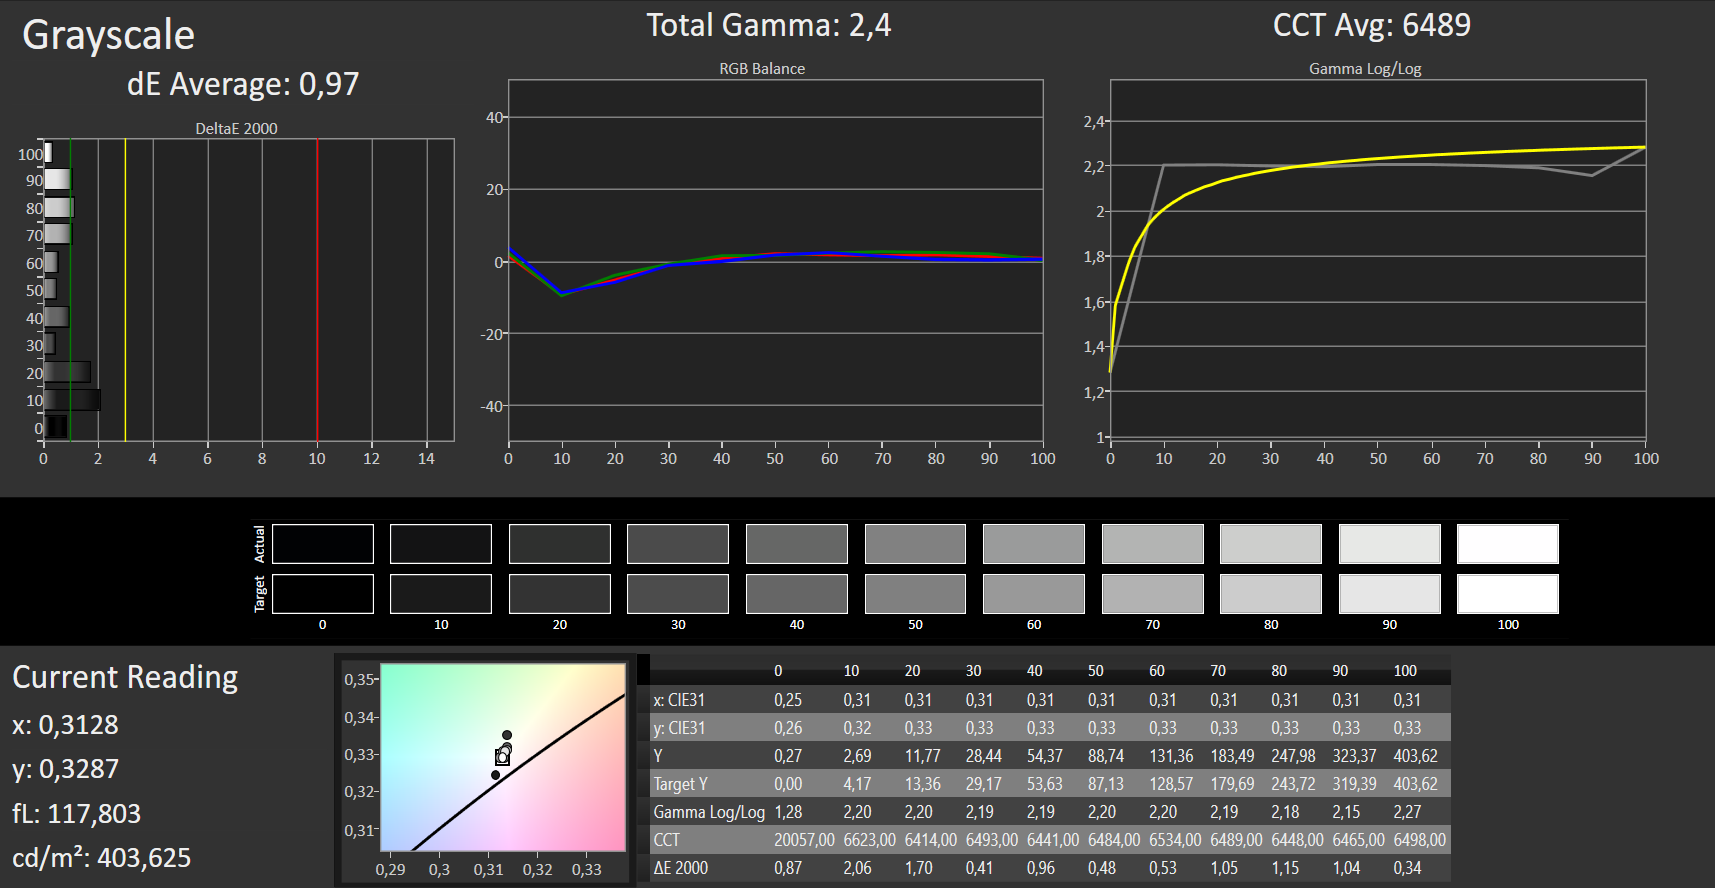
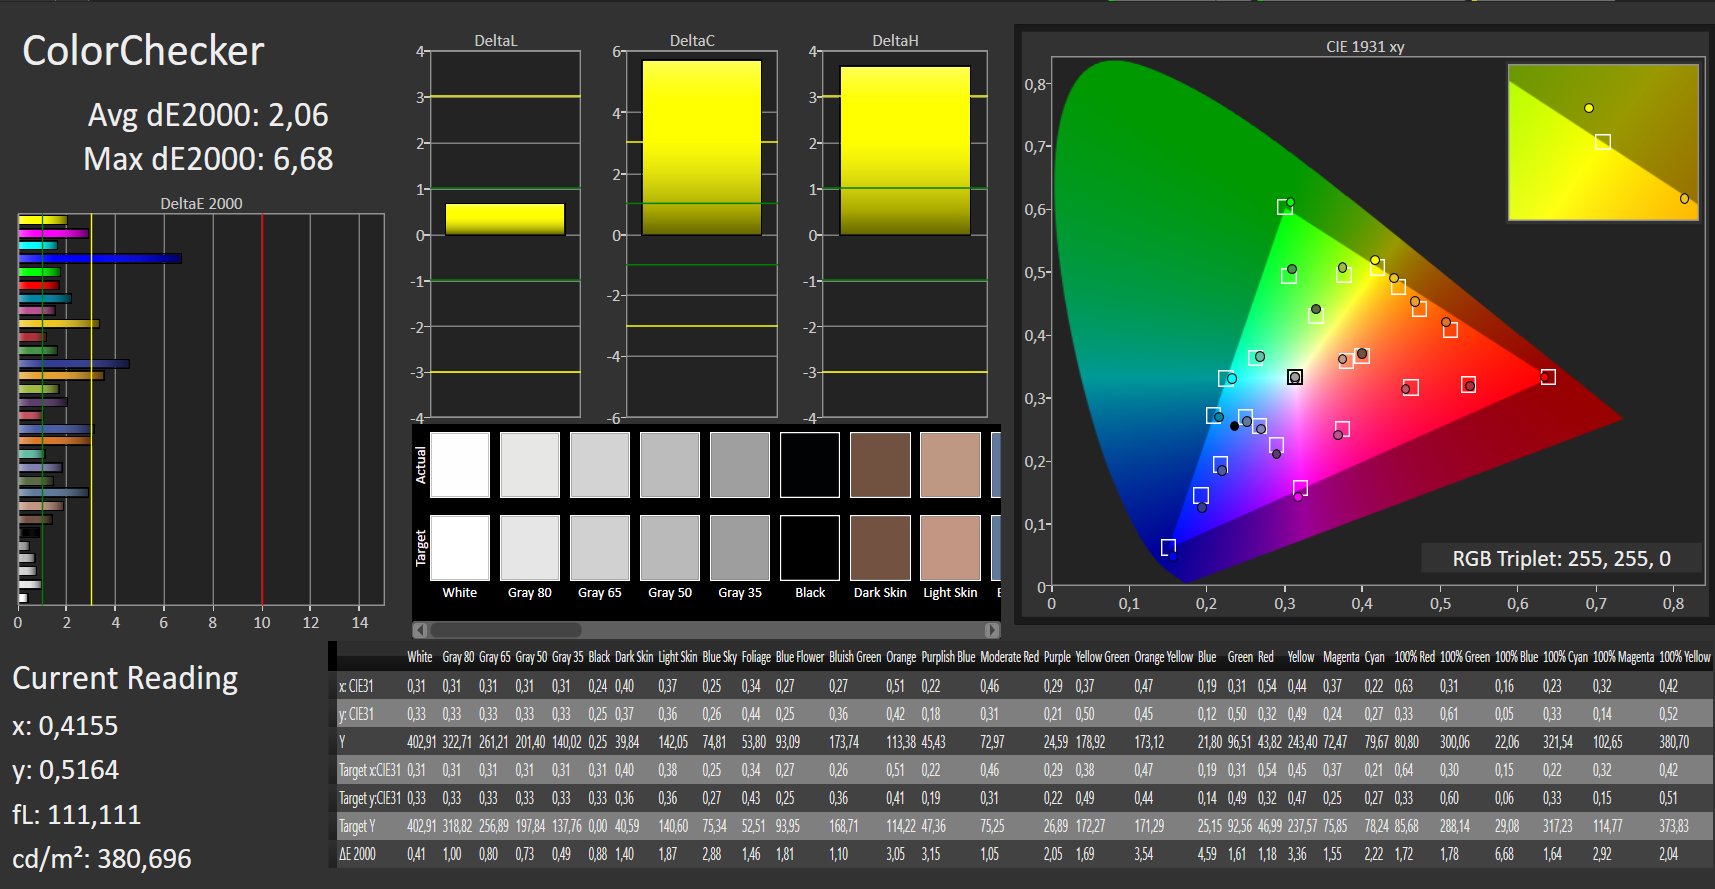
calibrated: 2.06
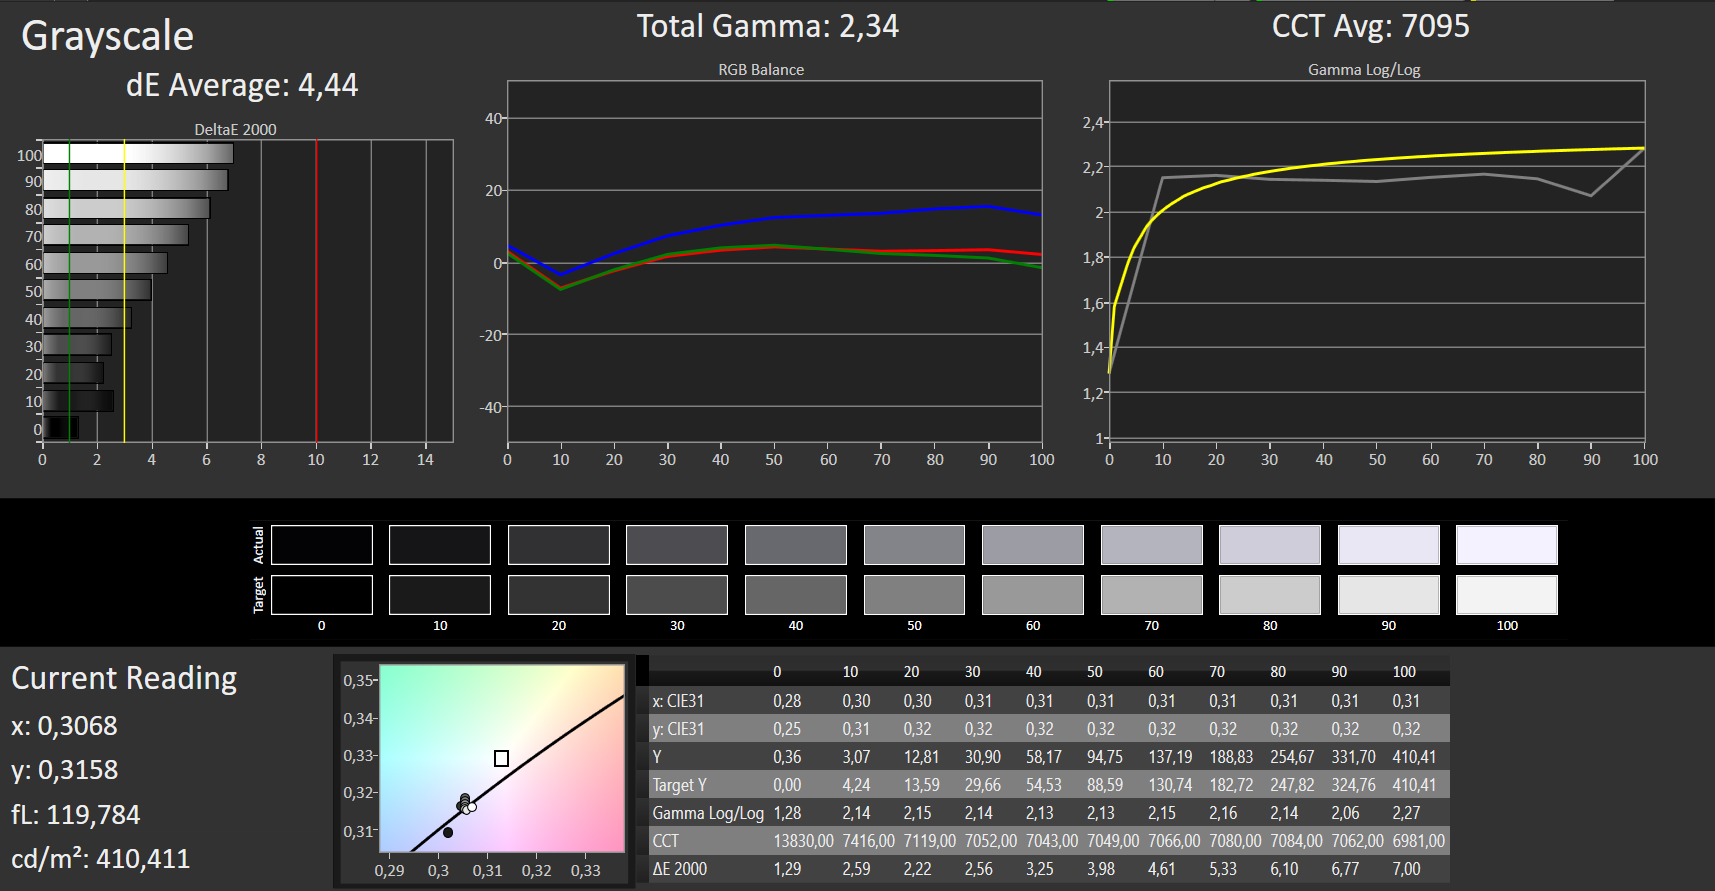
ΔE Greyscale Calman: 4.44 | ∀{0.09-98 Ø4.96}
93% sRGB (Argyll 1.6.3 3D)
60% AdobeRGB 1998 (Argyll 1.6.3 3D)
65.3% AdobeRGB 1998 (Argyll 3D)
93.1% sRGB (Argyll 3D)
64.7% Display P3 (Argyll 3D)
Gamma: 2.34
CCT: 7095 K
| Dell XPS 13 9380 2019 ID: AUO 282B B133ZAN Dell: 90NTH, , 3840x2160, 13.3" | Dell XPS 13 9370 i7 UHD ID: Sharp SHP148B, Name: LQ133D1, Dell P/N: 8XDHY, , 3840x2160, 13.3" | Dell XPS 13 9370 FHD i5 SHP1484, , 1920x1080, 13.3" | Apple MacBook Pro 13 2018 Touchbar i5 APPA03E, , 2560x1600, 13.3" | Lenovo ThinkPad X280-20KES01S00 B125HAN02.2, , 1920x1080, 12.5" | Fujitsu Lifebook U938 Sharp LQ133M1JW28, , 1920x1080, 13.3" | HP EliteBook 830 G5-3JX74EA IVO M133NVF3-R0, , 1920x1080, 13.3" | HP Envy 13-ah0003ng M133NVF3 R0, , 1920x1080, 13.3" | Huawei MateBook 13 i7 Chi Mei CMN8201, , 2160x1440, 13" | |
|---|---|---|---|---|---|---|---|---|---|
| Display | 6% | 6% | 31% | -31% | 4% | -2% | -13% | 5% | |
| Display P3 Coverage (%) | 64.7 | 68.9 6% | 68.9 6% | 98.5 52% | 44 -32% | 67.5 4% | 64.2 -1% | 54.8 -15% | 68.1 5% |
| sRGB Coverage (%) | 93.1 | 98.4 6% | 96.6 4% | 99.9 7% | 64.5 -31% | 94.5 2% | 89.2 -4% | 82.5 -11% | 97.7 5% |
| AdobeRGB 1998 Coverage (%) | 65.3 | 69.5 6% | 69.6 7% | 87.3 34% | 45.45 -30% | 68.7 5% | 65.2 0% | 56.6 -13% | 69.2 6% |
| Response Times | -21% | -18% | 16% | 25% | 23% | 35% | 40% | 19% | |
| Response Time Grey 50% / Grey 80% * (ms) | 58 ? | 69.6 ? -20% | 62.4 ? -8% | 46 ? 21% | 40 ? 31% | 43 ? 26% | 36 ? 38% | 31 ? 47% | 43.2 ? 26% |
| Response Time Black / White * (ms) | 36 ? | 44 ? -22% | 45.6 ? -27% | 32 ? 11% | 29.6 ? 18% | 29 ? 19% | 24.8 ? 31% | 24 ? 33% | 32 ? 11% |
| PWM Frequency (Hz) | 3759 ? | 1008 ? | 118000 ? | 217 ? | 1020 ? | 1000 ? | |||
| Screen | 12% | 10% | 34% | -18% | 6% | -8% | 19% | 5% | |
| Brightness middle (cd/m²) | 404 | 478.5 18% | 428 6% | 519 28% | 344 -15% | 344 -15% | 316 -22% | 289 -28% | 366.6 -9% |
| Brightness (cd/m²) | 389 | 466 20% | 405 4% | 504 30% | 313 -20% | 320 -18% | 326 -16% | 310 -20% | 360 -7% |
| Brightness Distribution (%) | 85 | 86 1% | 87 2% | 95 12% | 82 -4% | 77 -9% | 85 0% | 85 0% | 93 9% |
| Black Level * (cd/m²) | 0.37 | 0.43 -16% | 0.26 30% | 0.33 11% | 0.25 32% | 0.31 16% | 0.19 49% | 0.23 38% | 0.39 -5% |
| Contrast (:1) | 1092 | 1113 2% | 1646 51% | 1573 44% | 1376 26% | 1110 2% | 1663 52% | 1257 15% | 940 -14% |
| Colorchecker dE 2000 * | 3.72 | 3.09 17% | 3.8 -2% | 1.4 62% | 4.7 -26% | 2.72 27% | 4.5 -21% | 1.64 56% | 2.76 26% |
| Colorchecker dE 2000 max. * | 7.38 | 5.94 20% | 7.2 2% | 2.8 62% | 19.4 -163% | 5.92 20% | 12.1 -64% | 3.31 55% | 6.19 16% |
| Colorchecker dE 2000 calibrated * | 2.06 | 2.06 -0% | 2.9 -41% | 0.99 52% | 1.53 26% | ||||
| Greyscale dE 2000 * | 4.44 | 2.4 46% | 4.4 1% | 2.2 50% | 2.2 50% | 2.74 38% | 5 -13% | 1.71 61% | 4.2 5% |
| Gamma | 2.34 94% | 2.063 107% | 2.21 100% | 2.22 99% | 2.16 102% | 2.38 92% | 2.22 99% | 2.32 95% | 2.22 99% |
| CCT | 7095 92% | 6883 94% | 7067 92% | 6908 94% | 6252 104% | 6794 96% | 6018 108% | 6291 103% | 6271 104% |
| Color Space (Percent of AdobeRGB 1998) (%) | 60 | 69.47 16% | 62.8 5% | 77.3 29% | 41.2 -31% | 61 2% | 57.9 -3% | 52 -13% | 63.2 5% |
| Color Space (Percent of sRGB) (%) | 93 | 98.36 6% | 96.4 4% | 99.99 8% | 64.1 -31% | 94 1% | 87.3 -6% | 82 -12% | 97.6 5% |
| Totaal Gemiddelde (Programma / Instellingen) | -1% /
7% | -1% /
6% | 27% /
31% | -8% /
-15% | 11% /
8% | 8% /
-1% | 15% /
15% | 10% /
7% |
* ... kleiner is beter
Responstijd Scherm
| ↔ Responstijd Zwart naar Wit | ||
|---|---|---|
| 36 ms ... stijging ↗ en daling ↘ gecombineerd | ↗ 20 ms stijging | 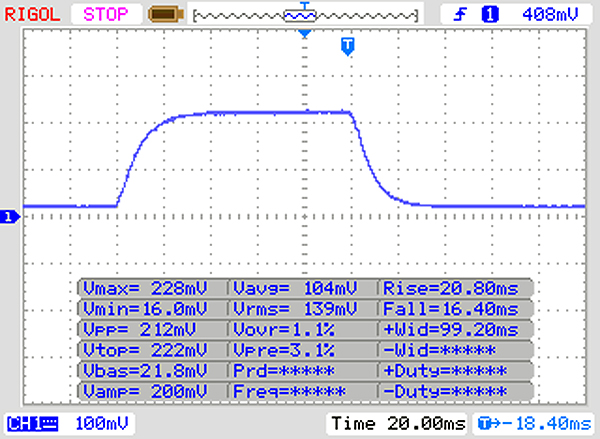 |
| ↘ 16 ms daling | ||
| Het scherm vertoonde trage responstijden in onze tests en is misschien te traag voor games. Ter vergelijking: alle testtoestellen variëren van 0.1 (minimum) tot 240 (maximum) ms. » 94 % van alle toestellen zijn beter. Dit betekent dat de gemeten responstijd slechter is dan het gemiddelde (19.8 ms) van alle geteste toestellen. | ||
| ↔ Responstijd 50% Grijs naar 80% Grijs | ||
| 58 ms ... stijging ↗ en daling ↘ gecombineerd | ↗ 26 ms stijging | 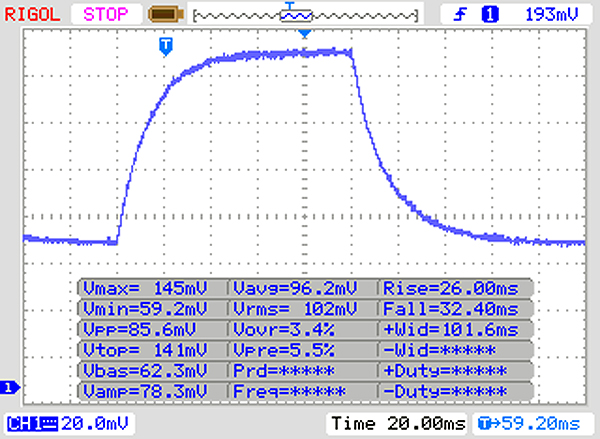 |
| ↘ 32 ms daling | ||
| Het scherm vertoonde trage responstijden in onze tests en is misschien te traag voor games. Ter vergelijking: alle testtoestellen variëren van 0.165 (minimum) tot 636 (maximum) ms. » 94 % van alle toestellen zijn beter. Dit betekent dat de gemeten responstijd slechter is dan het gemiddelde (30.9 ms) van alle geteste toestellen. | ||
Screen Flickering / PWM (Pulse-Width Modulation)
| Screen flickering / PWM niet waargenomen | 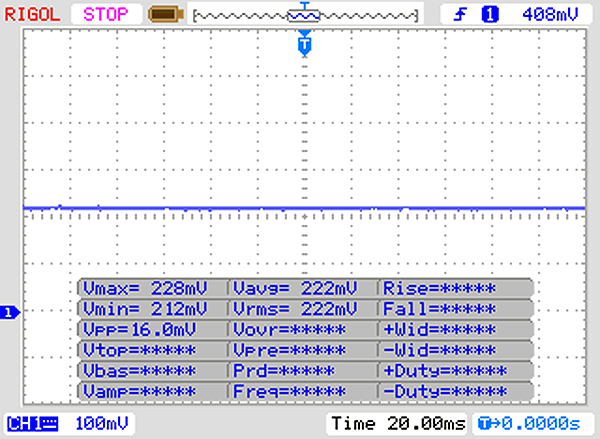 | ||
Ter vergelijking: 52 % van alle geteste toestellen maakten geen gebruik van PWM om de schermhelderheid te verlagen. Als het wel werd gebruikt, werd een gemiddelde van 7741 (minimum: 5 - maximum: 343500) Hz waargenomen. | |||
| PCMark 8 Home Score Accelerated v2 | 3519 punten | |
| PCMark 8 Work Score Accelerated v2 | 4302 punten | |
| PCMark 10 Score | 3835 punten | |
Help | ||
| Dell XPS 13 9380 2019 SK hynix PC401 HFS256GD9TNG | Dell XPS 13 9370 FHD i5 Toshiba XG5 KXG50ZNV256G | Apple MacBook Pro 13 2018 Touchbar i5 | Lenovo ThinkPad X280-20KES01S00 Samsung SSD PM981 MZVLB512HAJQ | Fujitsu Lifebook U938 Micron 1100 MTFDDAV256TBN | HP EliteBook 830 G5-3JX74EA Samsung SSD PM961 1TB M.2 PCIe 3.0 x4 NVMe (MZVLW1T0) | HP Envy 13-ah0003ng SK Hynix BC501 HFM512GDJTNG | Huawei MateBook 13 i7 Samsung SSD PM981 MZVLB512HAJQ | Gemiddeld SK hynix PC401 HFS256GD9TNG | |
|---|---|---|---|---|---|---|---|---|---|
| CrystalDiskMark 5.2 / 6 | 47% | 3% | 58% | -32% | 56% | 6% | 100% | 12% | |
| Write 4K (MB/s) | 84.6 | 128.2 52% | 43.24 -49% | 125.3 48% | 80.5 -5% | 108.5 28% | 112.9 33% | 159.4 88% | 101.8 ? 20% |
| Read 4K (MB/s) | 38.52 | 48.09 25% | 14.07 -63% | 43.5 13% | 26.14 -32% | 40.53 5% | 38.69 0% | 47.31 23% | 40.9 ? 6% |
| Write Seq (MB/s) | 557 | 1088 95% | 887 59% | 112 -80% | 396.8 -29% | 1026 84% | 654 17% | 1899 241% | 673 ? 21% |
| Read Seq (MB/s) | 1393 | 1877 35% | 1515 9% | 2273 63% | 473.1 -66% | 2080 49% | 642 -54% | 2173 56% | 1464 ? 5% |
| Write 4K Q32T1 (MB/s) | 339.5 | 367.1 8% | 225.3 -34% | 641 89% | 264.2 -22% | 451 33% | 305.9 -10% | 368.1 8% | 294 ? -13% |
| Read 4K Q32T1 (MB/s) | 255.4 | 411.9 61% | 346.5 36% | 392 53% | 244 -4% | 269.7 6% | 351.6 38% | 526 106% | 302 ? 18% |
| Write Seq Q32T1 (MB/s) | 558 | 1078 93% | 859 54% | 1903 241% | 464.6 -17% | 1770 217% | 869 56% | 1914 243% | 760 ? 36% |
| Read Seq Q32T1 (MB/s) | 2541 | 2771 9% | 2915 15% | 3398 34% | 525 -79% | 3214 26% | 1683 -34% | 3487 37% | 2561 ? 1% |
| AS SSD | 6% | 90% | -41% | 114% | 12% | 119% | -19% | ||
| Seq Read (MB/s) | 2035 | 1442 -29% | 2316 14% | 455.5 -78% | 2423 19% | 494.3 -76% | 1889 -7% | 1882 ? -8% | |
| Seq Write (MB/s) | 658 | 1694 157% | 1385 110% | 364.5 -45% | 1141 73% | 720 9% | 1812 175% | 593 ? -10% | |
| 4K Read (MB/s) | 39.74 | 9.7 -76% | 47.2 19% | 24.41 -39% | 47.17 19% | 38.35 -3% | 55.5 40% | 38.9 ? -2% | |
| 4K Write (MB/s) | 105.7 | 20 -81% | 105.3 0% | 73.8 -30% | 115.6 9% | 98.4 -7% | 118.4 12% | 100.2 ? -5% | |
| 4K-64 Read (MB/s) | 461 | 957 108% | 1218 164% | 235.7 -49% | 1144 148% | 611 33% | 1257 173% | 452 ? -2% | |
| 4K-64 Write (MB/s) | 300.1 | 162 -46% | 1309 336% | 308.8 3% | 1571 423% | 712 137% | 1571 423% | 290 ? -3% | |
| Access Time Read * (ms) | 0.061 | 0.041 33% | 0.099 -62% | 0.04 34% | 0.061 -0% | 0.041 33% | 0.1118 ? -83% | ||
| Access Time Write * (ms) | 0.051 | 0.036 29% | 0.057 -12% | 0.031 39% | 0.037 27% | 0.032 37% | 0.1111 ? -118% | ||
| Score Read (Points) | 704 | 1497 113% | 306 -57% | 1433 104% | 698 -1% | 1502 113% | 679 ? -4% | ||
| Score Write (Points) | 471 | 1553 230% | 419 -11% | 1801 282% | 883 87% | 1871 297% | 450 ? -4% | ||
| Score Total (Points) | 1479 | 3774 155% | 885 -40% | 3910 164% | 1961 33% | 4147 180% | 1423 ? -4% | ||
| Copy ISO MB/s (MB/s) | 893 | 1068 20% | 442.4 -50% | 2452 175% | 860 -4% | 1800 102% | 748 ? -16% | ||
| Copy Program MB/s (MB/s) | 287.9 | 327.5 14% | 163.9 -43% | 421.9 47% | 244 -15% | 385.6 34% | 358 ? 24% | ||
| Copy Game MB/s (MB/s) | 618 | 717 16% | 275.8 -55% | 991 60% | 282 -54% | 982 59% | 423 ? -32% | ||
| Totaal Gemiddelde (Programma / Instellingen) | 47% /
47% | 5% /
4% | 74% /
78% | -37% /
-37% | 85% /
93% | 9% /
10% | 110% /
112% | -4% /
-8% |
* ... kleiner is beter

| 3DMark 11 Performance | 2053 punten | |
| 3DMark Cloud Gate Standard Score | 9514 punten | |
Help | ||
| Thief - 1024x768 Very Low Preset | |
| Gemiddeld Intel UHD Graphics 620 (16.3 - 34.3, n=10) | |
| Dell XPS 13 9380 2019 | |
| F1 2018 - 1280x720 Ultra Low Preset | |
| HP Envy 13-ah0003ng | |
| Apple MacBook Pro 13 2018 Touchbar i5 | |
| Dell XPS 13 9380 2019 | |
| Gemiddeld Intel UHD Graphics 620 (31 - 35.8, n=5) | |
| Shadow of the Tomb Raider - 1280x720 Lowest Preset | |
| Gemiddelde van klas Subnotebook (41 - 109, n=7, laatste 2 jaar) | |
| HP Envy 13-ah0003ng | |
| Apple MacBook Pro 13 2018 Touchbar i5 | |
| Dell XPS 13 9380 2019 | |
| Gemiddeld Intel UHD Graphics 620 (12 - 21.7, n=13) | |
| FIFA 19 - 1920x1080 High Preset AA:2x MS | |
| Dell XPS 13 9380 2019 | |
| HP Envy 13-ah0003ng | |
| Gemiddeld Intel UHD Graphics 620 (20.7 - 51, n=2) | |
| Darksiders III - 1280x720 Low | |
| Dell XPS 13 9380 2019 | |
| Gemiddeld Intel UHD Graphics 620 (16.5 - 30.4, n=4) | |
| lage | gem. | hoge | ultra | |
|---|---|---|---|---|
| BioShock Infinite (2013) | 71.3 | 37.4 | 31.2 | 9.8 |
| Thief (2014) | 23.9 | 12.8 | ||
| Rise of the Tomb Raider (2016) | 20.5 | 17.4 | 6.9 | |
| F1 2018 (2018) | 33 | 15 | 14 | |
| Shadow of the Tomb Raider (2018) | 15 | 10 | ||
| FIFA 19 (2018) | 48 | 53.4 | 51 | |
| Darksiders III (2018) | 26.3 | 7.3 |
Geluidsniveau
| Onbelast |
| 30.4 / 30.4 / 30.4 dB (A) |
| Belasting |
| 31.7 / 38.1 dB (A) |
 | ||
30 dB stil 40 dB(A) hoorbaar 50 dB(A) luid |
||
min: | ||
(-) De maximumtemperatuur aan de bovenzijde bedraagt 47.2 °C / 117 F, vergeleken met het gemiddelde van 35.9 °C / 97 F, variërend van 21.4 tot 59 °C voor de klasse Subnotebook.
(±) De bodem warmt op tot een maximum van 43.3 °C / 110 F, vergeleken met een gemiddelde van 39.2 °C / 103 F
(+) Bij onbelast gebruik bedraagt de gemiddelde temperatuur voor de bovenzijde 26.4 °C / 80 F, vergeleken met het apparaatgemiddelde van 30.8 °C / 87 F.
(+) De handpalmsteunen en het touchpad bereiken maximaal de huidtemperatuur (32.4 °C / 90.3 F) en zijn dus niet heet.
(-) De gemiddelde temperatuur van de handpalmsteun van soortgelijke toestellen bedroeg 28.2 °C / 82.8 F (-4.2 °C / -7.5 F).
Dell XPS 13 9380 2019 audioanalyse
(-) | niet erg luide luidsprekers (70 dB)
Bas 100 - 315 Hz
(-) | bijna geen lage tonen - gemiddeld 20.4% lager dan de mediaan
(±) | lineariteit van de lage tonen is gemiddeld (9.4% delta ten opzichte van de vorige frequentie)
Midden 400 - 2000 Hz
(±) | hogere middens - gemiddeld 6.9% hoger dan de mediaan
(±) | lineariteit van de middentonen is gemiddeld (10.2% delta ten opzichte van de vorige frequentie)
Hoog 2 - 16 kHz
(+) | evenwichtige hoogtepunten - slechts 3.6% verwijderd van de mediaan
(+) | de hoge tonen zijn lineair (5% delta naar de vorige frequentie)
Algemeen 100 - 16.000 Hz
(±) | lineariteit van het totale geluid is gemiddeld (26.6% verschil met de mediaan)
Vergeleken met dezelfde klasse
» 88% van alle geteste apparaten in deze klasse waren beter, 1% vergelijkbaar, 10% slechter
» De beste had een delta van 5%, het gemiddelde was 18%, de slechtste was 53%
Vergeleken met alle geteste toestellen
» 82% van alle geteste apparaten waren beter, 3% gelijk, 15% slechter
» De beste had een delta van 4%, het gemiddelde was 23%, de slechtste was 134%
Apple MacBook Pro 13 2018 Touchbar i5 audioanalyse
(+) | luidsprekers kunnen relatief luid spelen (83.4 dB)
Bas 100 - 315 Hz
(±) | verminderde zeebaars - gemiddeld 6.9% lager dan de mediaan
(+) | de lage tonen zijn lineair (6.7% delta naar de vorige frequentie)
Midden 400 - 2000 Hz
(+) | evenwichtige middens - slechts 1.9% verwijderd van de mediaan
(+) | de middentonen zijn lineair (3.8% delta ten opzichte van de vorige frequentie)
Hoog 2 - 16 kHz
(+) | evenwichtige hoogtepunten - slechts 3.6% verwijderd van de mediaan
(+) | de hoge tonen zijn lineair (6.3% delta naar de vorige frequentie)
Algemeen 100 - 16.000 Hz
(+) | het totale geluid is lineair (9.5% verschil met de mediaan)
Vergeleken met dezelfde klasse
» 5% van alle geteste apparaten in deze klasse waren beter, 2% vergelijkbaar, 93% slechter
» De beste had een delta van 5%, het gemiddelde was 18%, de slechtste was 53%
Vergeleken met alle geteste toestellen
» 4% van alle geteste apparaten waren beter, 1% gelijk, 95% slechter
» De beste had een delta van 4%, het gemiddelde was 23%, de slechtste was 134%
HP Envy 13-ah0003ng audioanalyse
(-) | niet erg luide luidsprekers (71.9 dB)
Bas 100 - 315 Hz
(-) | bijna geen lage tonen - gemiddeld 23.3% lager dan de mediaan
(±) | lineariteit van de lage tonen is gemiddeld (12.4% delta ten opzichte van de vorige frequentie)
Midden 400 - 2000 Hz
(+) | evenwichtige middens - slechts 2.2% verwijderd van de mediaan
(+) | de middentonen zijn lineair (4.8% delta ten opzichte van de vorige frequentie)
Hoog 2 - 16 kHz
(+) | evenwichtige hoogtepunten - slechts 1.3% verwijderd van de mediaan
(+) | de hoge tonen zijn lineair (4.4% delta naar de vorige frequentie)
Algemeen 100 - 16.000 Hz
(±) | lineariteit van het totale geluid is gemiddeld (16.8% verschil met de mediaan)
Vergeleken met dezelfde klasse
» 43% van alle geteste apparaten in deze klasse waren beter, 8% vergelijkbaar, 49% slechter
» De beste had een delta van 5%, het gemiddelde was 18%, de slechtste was 53%
Vergeleken met alle geteste toestellen
» 30% van alle geteste apparaten waren beter, 7% gelijk, 63% slechter
» De beste had een delta van 4%, het gemiddelde was 23%, de slechtste was 134%
| Uit / Standby | |
| Inactief | |
| Belasting |
|
Key:
min: | |
| Dell XPS 13 9380 2019 i5-8265U, UHD Graphics 620, SK hynix PC401 HFS256GD9TNG, IPS, 3840x2160, 13.3" | Dell XPS 13 9370 FHD i5 i5-8250U, UHD Graphics 620, Toshiba XG5 KXG50ZNV256G, IPS, 1920x1080, 13.3" | Dell XPS 13 9370 i7 UHD i5-8550U, UHD Graphics 620, Toshiba XG5 KXG50ZNV512G, IPS, 3840x2160, 13.3" | Apple MacBook Pro 13 2018 Touchbar i5 i5-8259U, Iris Plus Graphics 655, , IPS, 2560x1600, 13.3" | Lenovo ThinkPad X280-20KES01S00 i5-8250U, UHD Graphics 620, Samsung SSD PM981 MZVLB512HAJQ, IPS LED, 1920x1080, 12.5" | Fujitsu Lifebook U938 i5-8250U, UHD Graphics 620, Micron 1100 MTFDDAV256TBN, IPS, 1920x1080, 13.3" | HP EliteBook 830 G5-3JX74EA i5-8550U, UHD Graphics 620, Samsung SSD PM961 1TB M.2 PCIe 3.0 x4 NVMe (MZVLW1T0), IPS LED, 1920x1080, 13.3" | HP Envy 13-ah0003ng i5-8550U, GeForce MX150, SK Hynix BC501 HFM512GDJTNG, IPS, 1920x1080, 13.3" | Huawei MateBook 13 i7 i7-8565U, GeForce MX150, Samsung SSD PM981 MZVLB512HAJQ, IPS, 2160x1440, 13" | Gemiddeld Intel UHD Graphics 620 | Gemiddelde van klas Subnotebook | |
|---|---|---|---|---|---|---|---|---|---|---|---|
| Power Consumption | 22% | -2% | -8% | 15% | 36% | 3% | 4% | -17% | 13% | 5% | |
| Idle Minimum * (Watt) | 4.8 | 3.14 35% | 5 -4% | 2.3 52% | 3.11 35% | 2.4 50% | 4.5 6% | 5.3 -10% | 3.5 27% | 3.81 ? 21% | 3.73 ? 22% |
| Idle Average * (Watt) | 8.6 | 5.22 39% | 8.3 3% | 8.7 -1% | 5.01 42% | 5.5 36% | 6.4 26% | 7.3 15% | 7.5 13% | 6.94 ? 19% | 6.57 ? 24% |
| Idle Maximum * (Watt) | 10.4 | 6 42% | 8.8 15% | 12.2 -17% | 8.11 22% | 6 42% | 9.2 12% | 9.3 11% | 12.4 -19% | 8.75 ? 16% | 7.93 ? 24% |
| Load Average * (Watt) | 37.9 | 38.5 -2% | 46.4 -22% | 53.3 -41% | 44.6 -18% | 31 18% | 35.7 6% | 39 -3% | 64.2 -69% | 35 ? 8% | 42.1 ? -11% |
| Load Maximum * (Watt) | 48.5 | 50.4 -4% | 48.6 -0% | 64 -32% | 51.7 -7% | 32.6 33% | 65.4 -35% | 46 5% | 65.7 -35% | 47.5 ? 2% | 65.1 ? -34% |
| Witcher 3 ultra * (Watt) | 52.5 |
* ... kleiner is beter
| Dell XPS 13 9380 2019 i5-8265U, UHD Graphics 620, 52 Wh | Dell XPS 13 9370 FHD i5 i5-8250U, UHD Graphics 620, 52 Wh | Apple MacBook Pro 13 2018 Touchbar i5 i5-8259U, Iris Plus Graphics 655, 58 Wh | Lenovo ThinkPad X280-20KES01S00 i5-8250U, UHD Graphics 620, 50 Wh | Fujitsu Lifebook U938 i5-8250U, UHD Graphics 620, 50 Wh | HP EliteBook 830 G5-3JX74EA i5-8550U, UHD Graphics 620, 49 Wh | HP Envy 13-ah0003ng i5-8550U, GeForce MX150, 53.2 Wh | Huawei MateBook 13 i7 i7-8565U, GeForce MX150, 41.7 Wh | Gemiddelde van klas Subnotebook | |
|---|---|---|---|---|---|---|---|---|---|
| Batterijduur | 16% | 17% | 2% | 1% | -15% | -12% | -27% | 35% | |
| Reader / Idle (h) | 17.2 | 23.6 37% | 20.2 17% | 19.5 13% | 12.8 -26% | 15.5 -10% | 15.4 -10% | 26.4 ? 53% | |
| WiFi v1.3 (h) | 8.3 | 10.7 29% | 9.7 17% | 8.9 7% | 8.4 1% | 7.1 -14% | 8 -4% | 7.6 -8% | 13.9 ? 67% |
| Load (h) | 2.4 | 2 -17% | 2 -17% | 2.1 -12% | 2.3 -4% | 1.9 -21% | 0.9 -62% | 2.04 ? -15% | |
| H.264 (h) | 13.9 | 10.9 | 9.5 | 7.2 | 8 | 6.3 | 15.3 ? | ||
| Witcher 3 ultra (h) | 1.6 |
Pro
Contra
Dit is de verkorte versie van het originele artikel. Het volledige, Engelse testrapport vind je hier.
Dell lanceert de volgende versie van de XPS 13, maar de wijzigingen zijn klein en rechtvaardigen niet een upgrade van de voorganger, de XPS 13 9370 (2018). Voor de 9360 (2016) is een upgrade echter wel te rechtvaardigen. Diens Kaby Lake dual-core processor is aanzienlijk langzamer dan de huidige quad-cores.
Dell heeft merkbaar gewerkt aan de warmteontwikkeling. Vergeleken met de quad-core processor uit 2018 zijn de prestaties beter, maar wel enkel bij langere belasting. Vele Ultrabooks reduceren de CPU snelheid bij langere belasting om de temperatuur binnen de perken te houden; de XPS blijft op hoge snelheid draaien. De 2019 XPS 13 reduceert de CPU frequentie gemiddeld met slechts 8% (in vergelijking met de maximale Turbo Boost frequentie!) en is sneller dan de Kaby Lake-R quad-core in de 2018 XPS 13 9370.
De 2019 XPS 13 reduceert de CPU frequentie slechts 8% bij langere belasting en is sneller dan de Kaby Lake-R quad-core in the 2018 XPS 13.
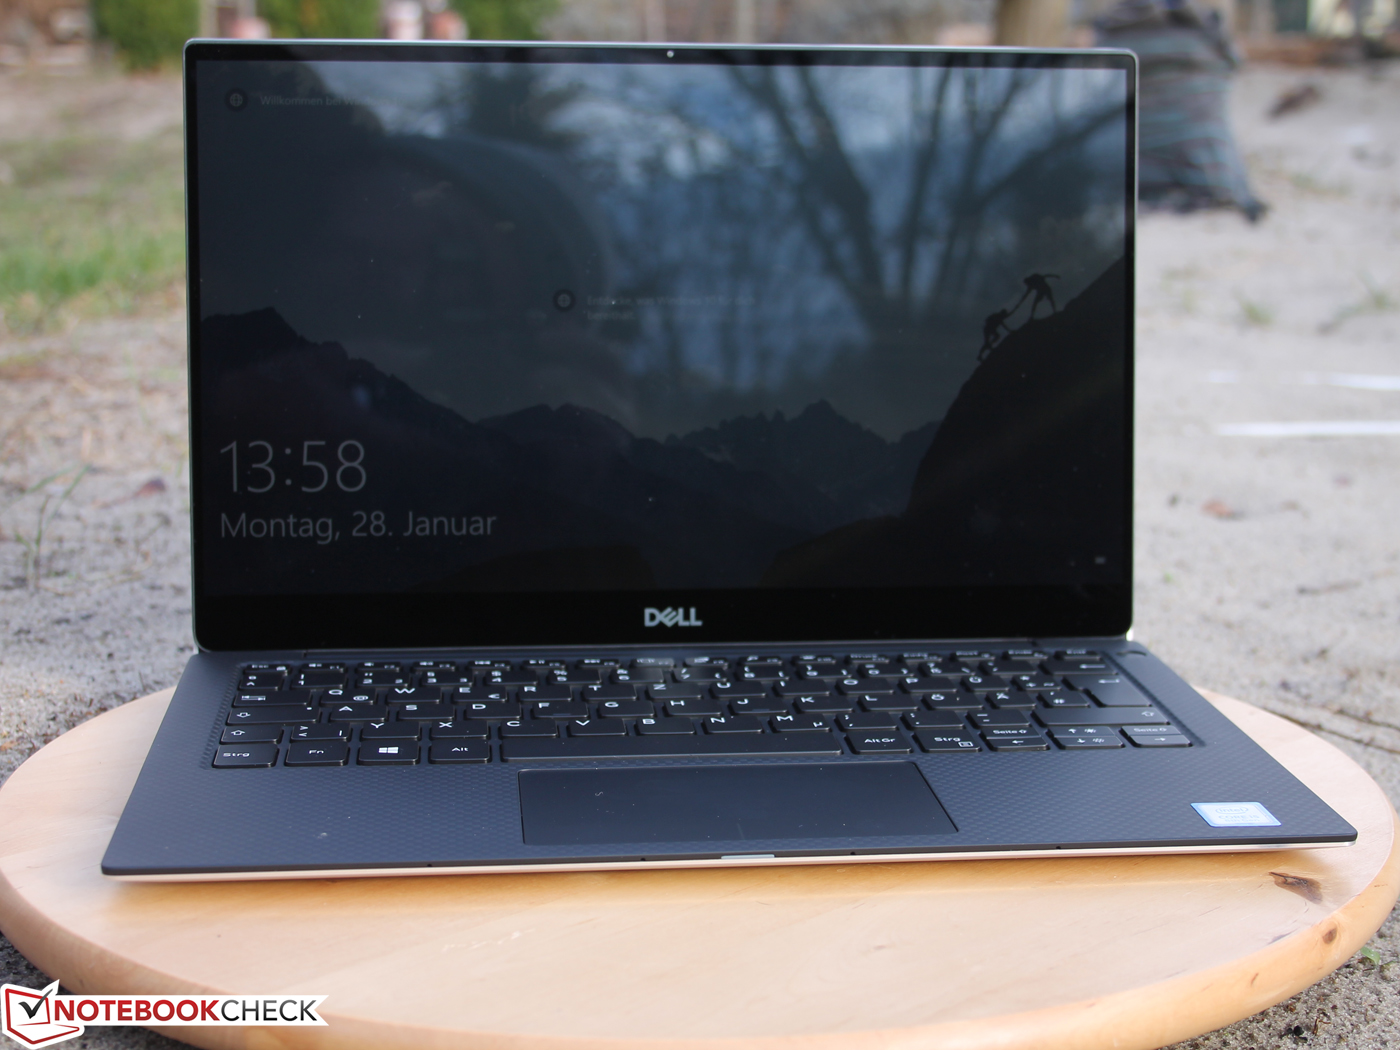
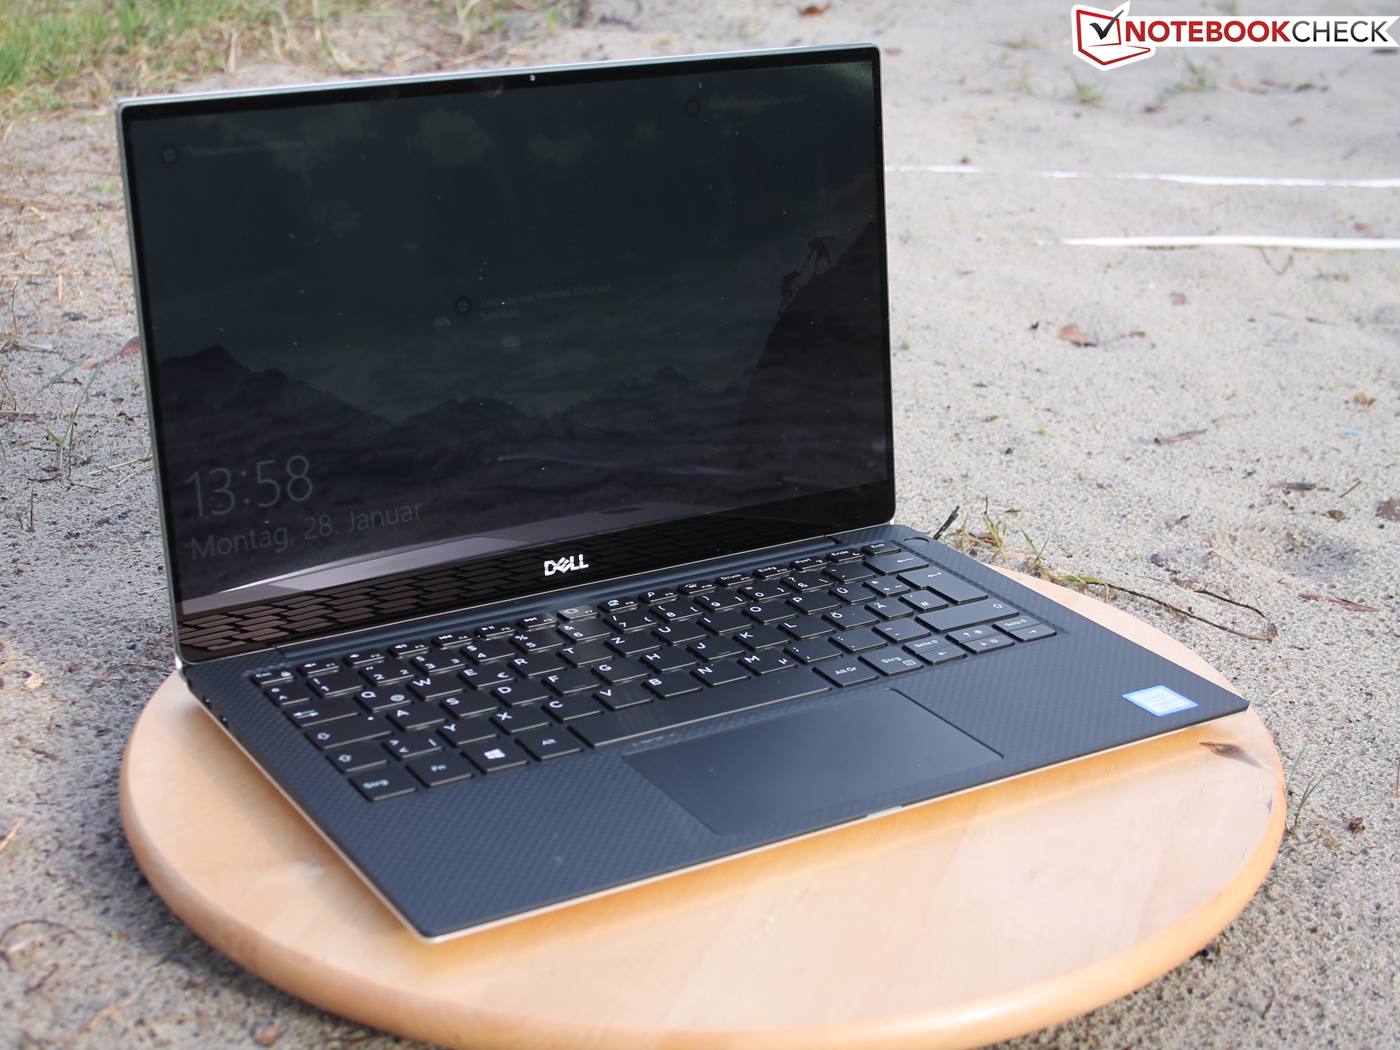
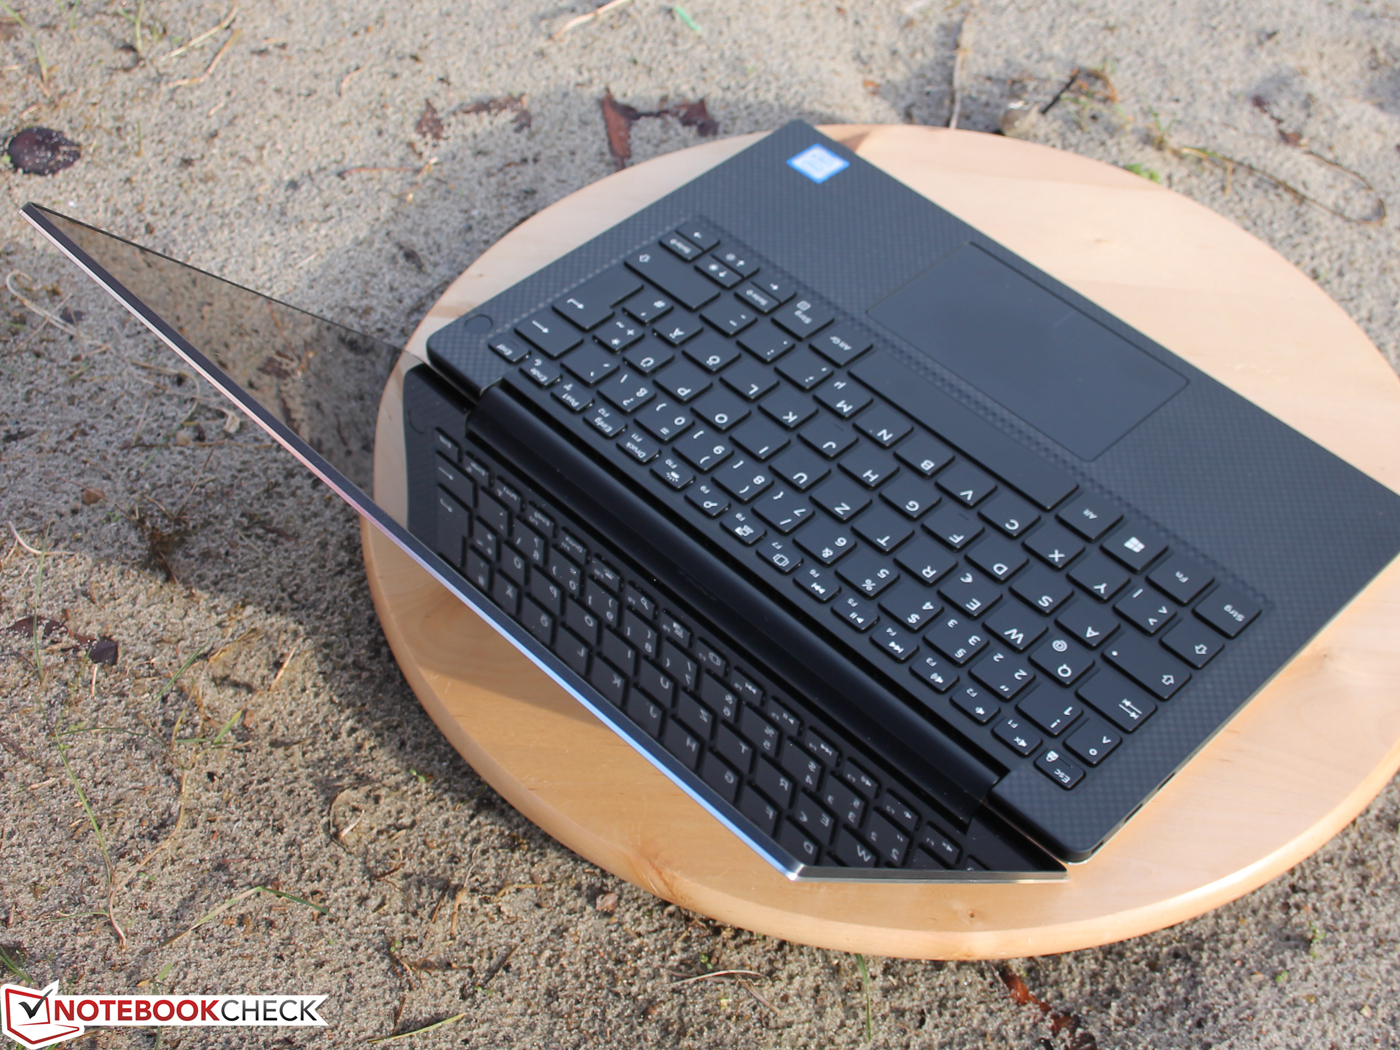
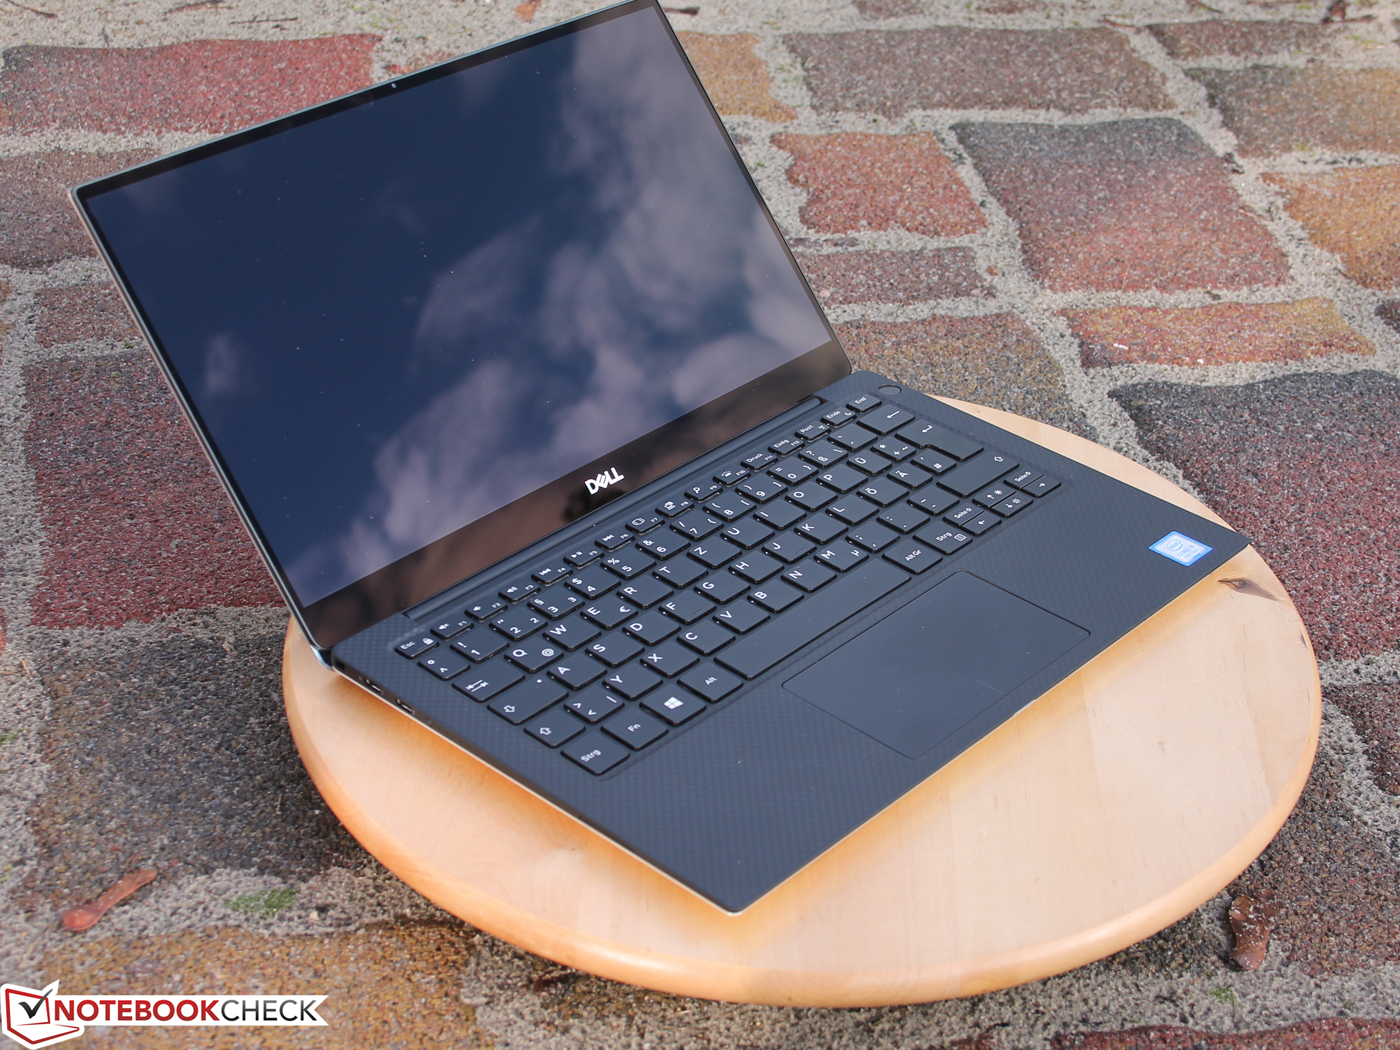
Het design van de behuizing is nog steeds erg aantrekkelijk met de dunne randen. De aangepast positionering van de webcam (nu weer boven het beeldscherm) is zeker een welkome aanpassing. Dell gebruikt nu 4K panelen van AUO in plaats van Sharp. We meten vergelijkbare licht-waarden, maar het contrast is lager en de sRGB dekking is kleiner.
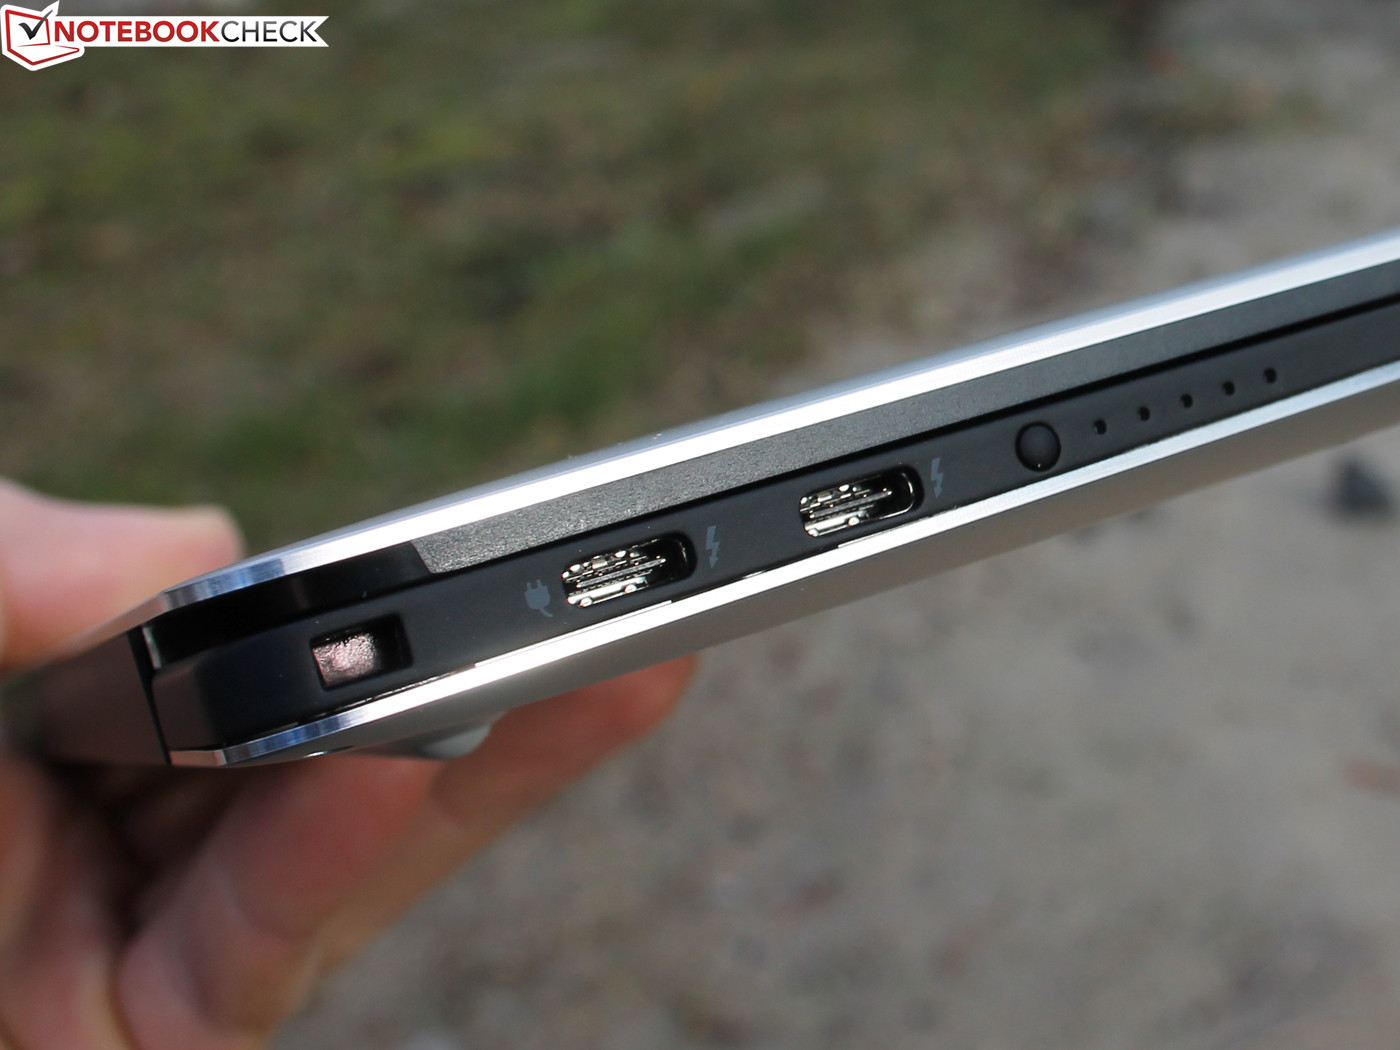
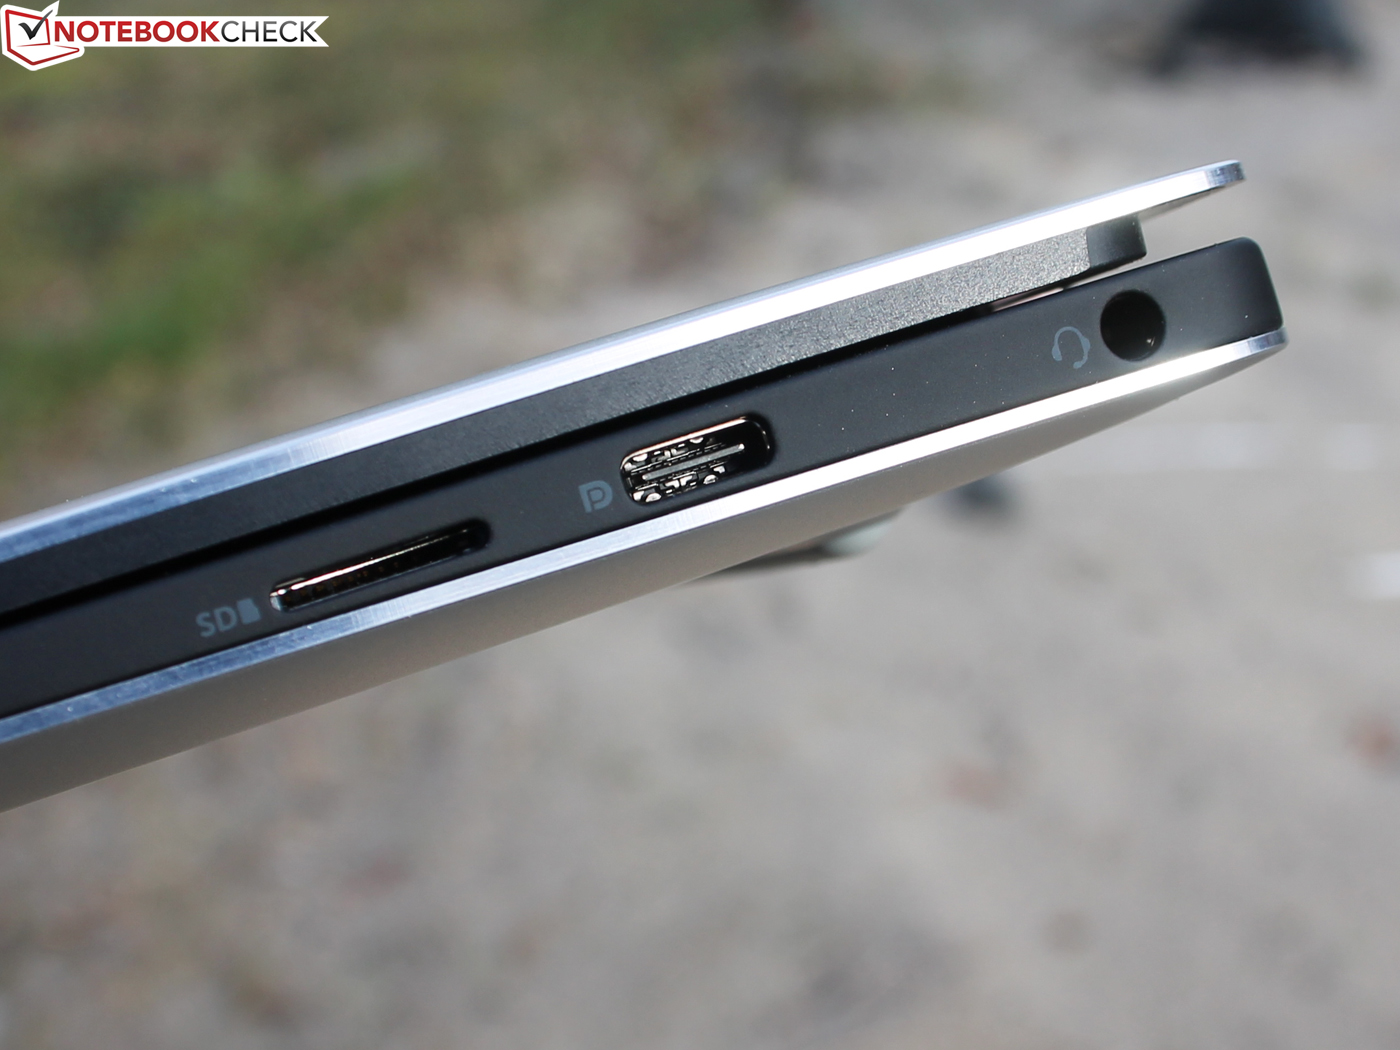
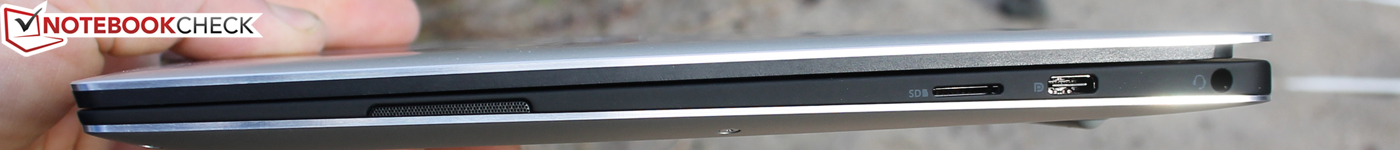
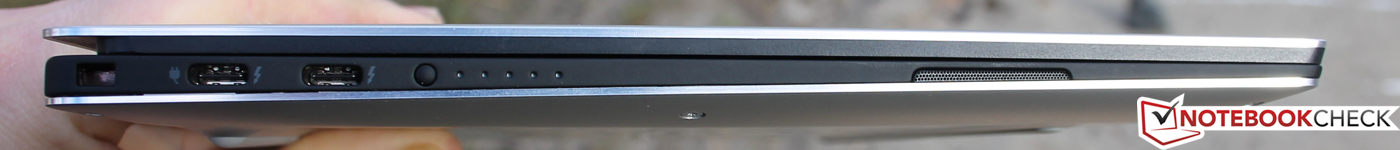
De poorten blijven ongewijzigd: twee Thunderbolt 3 poorten en de USB-C poort (met DisplayPort) zijn geschikt om professionele randapparatuur aan te sluiten.
We zijn ook blij met de batterijduur: 8 uur is erg vergelijkbaar met de 2018 XPS 13 9370 UHD. We kijken nu al vol verwachting uit naar de 1080p SKU van de XPS 13 9380 om te zien of deze nog langer meegaat. De 9370 FHD haalde 11 uur in plaats van 8 uur (Wi-Fi test, +29%).
Elke gebruiker die teleurgesteld is door de lage GPU prestaties van de XPS 13 - maar ook andere populaire 13-inch Ultrabooks zoals de Spectre 13, Gram 13 of ZenBook 13 - moeten de Huawei MateBook 13 i7 of de HP Envy 13-ah0003ng met GeForce MX150 overwegen. Deze GPU is veel krachtiger dan de geïntegreerde UHD Graphics 620 en kan zelfs gebruikt worden om te gamen.
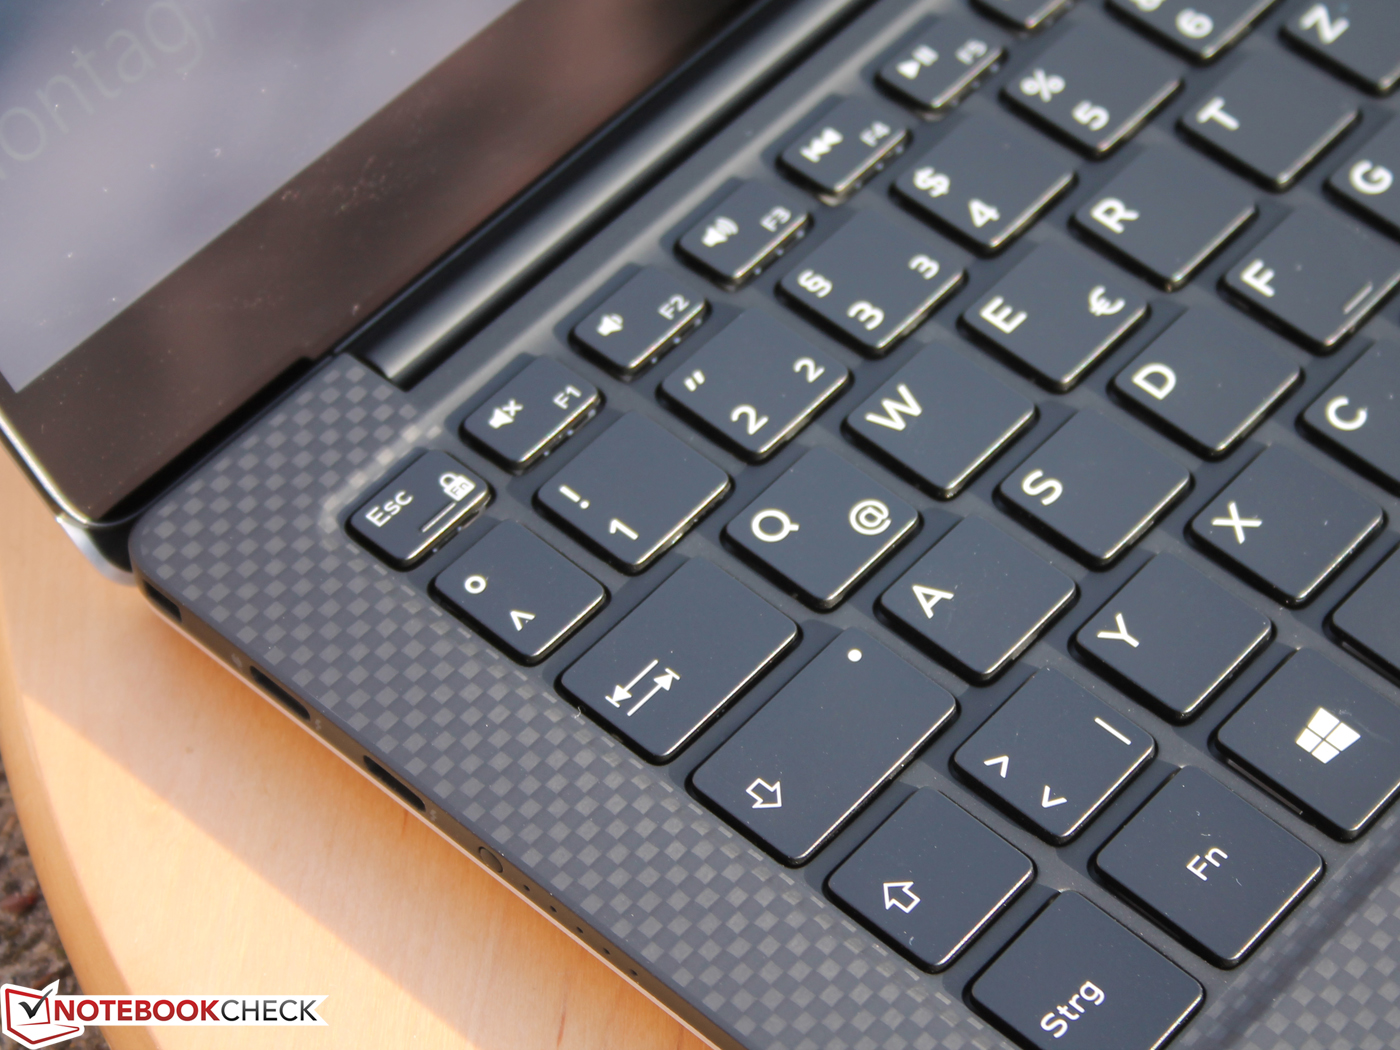
Dit betekend dat de XPS 13 voor gebruikers is die geen krachtige GPU nodig hebben en die de voorkeur geven aan superieure invoerapparaten en groot aantal aansluitingen. De UHD touchscherm-versie heeft wel last van een relatief kortere batterijduur en lager contrast. Voor de beste mobiele ervaring raden we aan om de 1080p SKU af te wachten. We zullen ook deze versie in de nabije toekomst testen.
Dell XPS 13 9380 2019
- 02-02-2019 v6 (old)
Sebastian Jentsch
Price comparison
