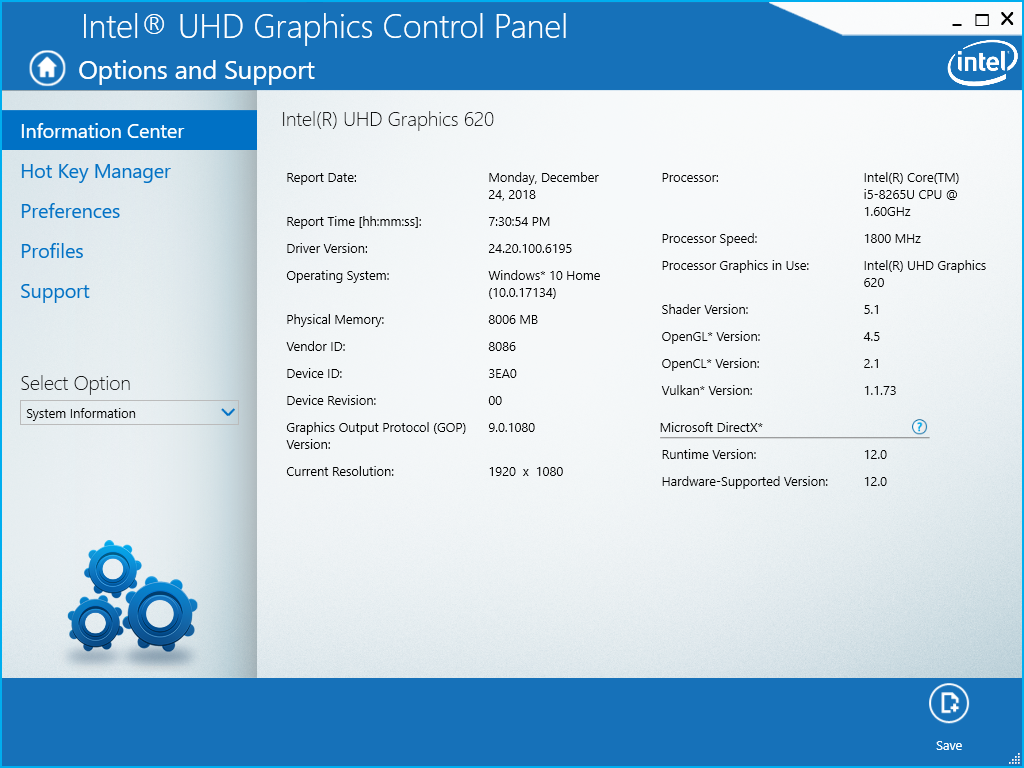
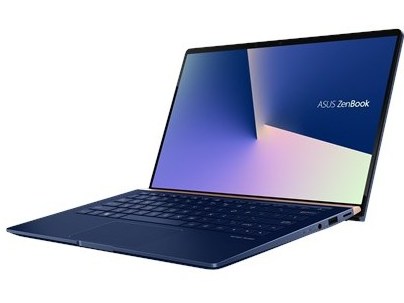
Kort testrapport Asus ZenBook 13 UX333FA (i5-8265U) Laptop
| SD Card Reader | |
| average JPG Copy Test (av. of 3 runs) | |
| Dell XPS 13 9370 i5 UHD (Toshiba Exceria Pro M501 64 GB UHS-II) | |
| Asus ZenBook 13 UX331UN (Toshiba Exceria Pro M501 microSDXC 64GB) | |
| Asus ZenBook 13 UX333FA (Toshiba Exceria Pro M501 microSDXC 64GB) | |
| maximum AS SSD Seq Read Test (1GB) | |
| Dell XPS 13 9370 i5 UHD (Toshiba Exceria Pro M501 64 GB UHS-II) | |
| Asus ZenBook 13 UX331UN (Toshiba Exceria Pro M501 microSDXC 64GB) | |
| Asus ZenBook 13 UX333FA (Toshiba Exceria Pro M501 microSDXC 64GB) | |
| Networking | |
| iperf3 transmit AX12 | |
| Asus ZenBook 13 UX331UN | |
| Dell XPS 13 9370 i5 UHD | |
| Asus ZenBook 13 UX333FA | |
| iperf3 receive AX12 | |
| Asus ZenBook 13 UX333FA | |
| Dell XPS 13 9370 i5 UHD | |
| Asus ZenBook 13 UX331UN | |
| |||||||||||||||||||||||||
Helderheidsverdeling: 89 %
Helderheid in Batterij-modus: 276 cd/m²
Contrast: 1314:1 (Zwart: 0.21 cd/m²)
ΔE ColorChecker Calman: 4.85 | ∀{0.5-29.43 Ø4.72}
calibrated: 1.6
ΔE Greyscale Calman: 5.7 | ∀{0.09-98 Ø4.97}
98% sRGB (Argyll 1.6.3 3D)
63% AdobeRGB 1998 (Argyll 1.6.3 3D)
69.2% AdobeRGB 1998 (Argyll 3D)
97.4% sRGB (Argyll 3D)
67.9% Display P3 (Argyll 3D)
Gamma: 2.08
CCT: 7424 K
| Asus ZenBook 13 UX333FA AU Optronics B133HAN05.C, IPS, 13.3", 1920x1080 | Asus ZenBook 13 UX331UN AU Optronics B133HAN04.9, IPS, 13.3", 1920x1080 | Dell XPS 13 9370 i5 UHD ID: Sharp SHP148B, Name: LQ133D1, Dell P/N: 8XDHY, IPS, 13.3", 3840x2160 | Huawei Matebook X Pro i5 Tianma XM, IPS, 13.9", 3000x2000 | HP Spectre 13-af033ng AU Optronics AUO422D, IPS, 13.3", 1920x1080 | Lenovo Yoga C930-13IKB 81C4 AUO B139HAN03_0, IPS, 13.9", 1920x1080 | |
|---|---|---|---|---|---|---|
| Display | -9% | 1% | -2% | -6% | -7% | |
| Display P3 Coverage (%) | 67.9 | 63.3 -7% | 68.9 1% | 65.9 -3% | 64 -6% | 62.7 -8% |
| sRGB Coverage (%) | 97.4 | 86.7 -11% | 98.4 1% | 95.2 -2% | 90.7 -7% | 92.6 -5% |
| AdobeRGB 1998 Coverage (%) | 69.2 | 63.4 -8% | 69.5 0% | 67.6 -2% | 65.1 -6% | 64.7 -7% |
| Response Times | 28% | -18% | 29% | 43% | 35% | |
| Response Time Grey 50% / Grey 80% * (ms) | 54.4 ? | 44 ? 19% | 67.2 ? -24% | 40.4 ? 26% | 27 ? 50% | 34.4 ? 37% |
| Response Time Black / White * (ms) | 37.6 ? | 24 ? 36% | 41.6 ? -11% | 25.6 ? 32% | 24 ? 36% | 25.6 ? 32% |
| PWM Frequency (Hz) | 2500 ? | |||||
| Screen | 3% | 10% | 9% | 10% | -32% | |
| Brightness middle (cd/m²) | 276 | 329 19% | 496.4 80% | 442.7 60% | 304 10% | 312 13% |
| Brightness (cd/m²) | 263 | 306 16% | 469 78% | 428 63% | 287 9% | 295 12% |
| Brightness Distribution (%) | 89 | 86 -3% | 84 -6% | 84 -6% | 80 -10% | 87 -2% |
| Black Level * (cd/m²) | 0.21 | 0.3 -43% | 0.5 -138% | 0.31 -48% | 0.21 -0% | 0.43 -105% |
| Contrast (:1) | 1314 | 1097 -17% | 993 -24% | 1428 9% | 1448 10% | 726 -45% |
| Colorchecker dE 2000 * | 4.85 | 4.07 16% | 2.9 40% | 2.24 54% | 3.66 25% | 7.6 -57% |
| Colorchecker dE 2000 max. * | 8.24 | 7.05 14% | 5.26 36% | 7.19 13% | 5.66 31% | 15.06 -83% |
| Colorchecker dE 2000 calibrated * | 1.6 | 1.11 31% | 1.96 -22% | |||
| Greyscale dE 2000 * | 5.7 | 2.76 52% | 3.9 32% | 9.7 -70% | 3.51 38% | 8.8 -54% |
| Gamma | 2.08 106% | 2.56 86% | 2.066 106% | 1.42 155% | 2.55 86% | 2.01 109% |
| CCT | 7424 88% | 6915 94% | 7169 91% | 6227 104% | 6955 93% | 6874 95% |
| Color Space (Percent of AdobeRGB 1998) (%) | 63 | 56 -11% | 63.9 1% | 61.6 -2% | 59 -6% | 59.1 -6% |
| Color Space (Percent of sRGB) (%) | 98 | 86 -12% | 98.2 0% | 95 -3% | 91 -7% | 92.3 -6% |
| Totaal Gemiddelde (Programma / Instellingen) | 7% /
4% | -2% /
4% | 12% /
10% | 16% /
11% | -1% /
-19% |
* ... kleiner is beter
Responstijd Scherm
| ↔ Responstijd Zwart naar Wit | ||
|---|---|---|
| 37.6 ms ... stijging ↗ en daling ↘ gecombineerd | ↗ 18.8 ms stijging | 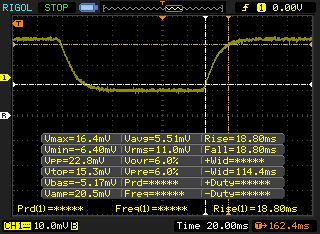 |
| ↘ 18.8 ms daling | ||
| Het scherm vertoonde trage responstijden in onze tests en is misschien te traag voor games. Ter vergelijking: alle testtoestellen variëren van 0.1 (minimum) tot 240 (maximum) ms. » 95 % van alle toestellen zijn beter. Dit betekent dat de gemeten responstijd slechter is dan het gemiddelde (19.8 ms) van alle geteste toestellen. | ||
| ↔ Responstijd 50% Grijs naar 80% Grijs | ||
| 54.4 ms ... stijging ↗ en daling ↘ gecombineerd | ↗ 24.4 ms stijging | 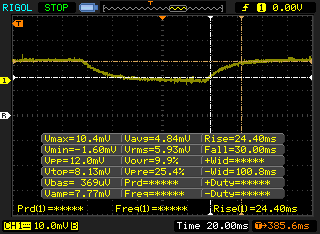 |
| ↘ 30 ms daling | ||
| Het scherm vertoonde trage responstijden in onze tests en is misschien te traag voor games. Ter vergelijking: alle testtoestellen variëren van 0.165 (minimum) tot 636 (maximum) ms. » 91 % van alle toestellen zijn beter. Dit betekent dat de gemeten responstijd slechter is dan het gemiddelde (31 ms) van alle geteste toestellen. | ||
Screen Flickering / PWM (Pulse-Width Modulation)
| Screen flickering / PWM niet waargenomen | 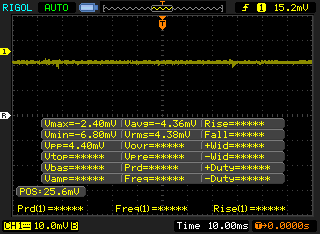 | ||
Ter vergelijking: 52 % van alle geteste toestellen maakten geen gebruik van PWM om de schermhelderheid te verlagen. Als het wel werd gebruikt, werd een gemiddelde van 7763 (minimum: 5 - maximum: 343500) Hz waargenomen. | |||
| Cinebench R10 | |
| Rendering Multiple CPUs 32Bit | |
| Asus ZenBook 13 UX331UN | |
| Gemiddeld Intel Core i5-8265U (16318 - 22962, n=9) | |
| Huawei Matebook X Pro i5 | |
| HP x2 210 G2 | |
| Rendering Single 32Bit | |
| Asus ZenBook 13 UX331UN | |
| Gemiddeld Intel Core i5-8265U (5841 - 6209, n=9) | |
| Huawei Matebook X Pro i5 | |
| HP x2 210 G2 | |
| wPrime 2.10 - 1024m | |
| Gemiddeld Intel Core i5-8265U (371 - 433, n=2) | |
| Huawei Matebook X Pro i5 | |
* ... kleiner is beter
| PCMark 8 Home Score Accelerated v2 | 3150 punten | |
| PCMark 8 Work Score Accelerated v2 | 4341 punten | |
| PCMark 10 Score | 3787 punten | |
Help | ||
| Asus ZenBook 13 UX333FA WDC PC SN520 SDAPNUW-256G | Asus ZenBook 13 UX331UN SK Hynix HFS256G39TND-N210A | Dell XPS 13 9370 i5 UHD Toshiba XG5 KXG50ZNV256G | Huawei Matebook X Pro i5 Samsung PM961 MZVLW256HEHP | Lenovo Yoga C930-13IKB 81C4 SK hynix PC401 HFS256GD9TNG | HP Elite x2 1013 G3 LTE i7 Samsung SSD PM981 MZVLB1T0HALR | |
|---|---|---|---|---|---|---|
| CrystalDiskMark 5.2 / 6 | -44% | 21% | 23% | 12% | 72% | |
| Write 4K (MB/s) | 113.7 | 78.4 -31% | 121.4 7% | 116.5 2% | 108.7 -4% | 100 -12% |
| Read 4K (MB/s) | 43.18 | 30.77 -29% | 33.42 -23% | 42.18 -2% | 40.91 -5% | 40.23 -7% |
| Write Seq (MB/s) | 970 | 264.5 -73% | 385.3 -60% | 1079 11% | 798 -18% | 1839 90% |
| Read Seq (MB/s) | 1085 | 465.7 -57% | 1958 80% | 1030 -5% | 1610 48% | 2024 87% |
| Write 4K Q32T1 (MB/s) | 396.8 | 262.8 -34% | 375.7 -5% | 225.7 -43% | 385.1 -3% | 314.9 -21% |
| Read 4K Q32T1 (MB/s) | 317.8 | 283.8 -11% | 364.1 15% | 302.9 -5% | 305.8 -4% | 269.8 -15% |
| Write Seq Q32T1 (MB/s) | 518 | 262.7 -49% | 1069 106% | 1174 127% | 779 50% | 2402 364% |
| Read Seq Q32T1 (MB/s) | 1741 | 559 -68% | 2564 47% | 3394 95% | 2359 35% | 3306 90% |

| 3DMark 11 | |
| 1280x720 Performance GPU | |
| Razer Blade Stealth i7-8565U | |
| Asus ZenBook 13 UX331UN | |
| Intel NUC8i7BE | |
| HP EliteBook 735 G5 3UN62EA | |
| Dell XPS 13 9360 FHD i7 Iris | |
| Lenovo Yoga C930-13IKB 81C4 | |
| Gemiddeld Intel UHD Graphics 620 (1144 - 3432, n=244) | |
| Asus ZenBook 13 UX333FA | |
| Fujitsu Lifebook A357-A3570MPH06DE | |
| HP x2 210 G2 | |
| 1280x720 Performance Combined | |
| Razer Blade Stealth i7-8565U | |
| Asus ZenBook 13 UX331UN | |
| Intel NUC8i7BE | |
| HP EliteBook 735 G5 3UN62EA | |
| Lenovo Yoga C930-13IKB 81C4 | |
| Dell XPS 13 9360 FHD i7 Iris | |
| Asus ZenBook 13 UX333FA | |
| Gemiddeld Intel UHD Graphics 620 (927 - 2505, n=244) | |
| Fujitsu Lifebook A357-A3570MPH06DE | |
| HP x2 210 G2 | |
| 3DMark | |
| 1280x720 Cloud Gate Standard Graphics | |
| Razer Blade Stealth i7-8565U | |
| Asus ZenBook 13 UX331UN | |
| Intel NUC8i7BE | |
| Dell XPS 13 9360 FHD i7 Iris | |
| Asus ZenBook 13 UX333FA | |
| Lenovo Yoga C930-13IKB 81C4 | |
| HP EliteBook 735 G5 3UN62EA | |
| Gemiddeld Intel UHD Graphics 620 (6205 - 16400, n=225) | |
| Fujitsu Lifebook A357-A3570MPH06DE | |
| HP x2 210 G2 | |
| 1920x1080 Fire Strike Graphics | |
| Razer Blade Stealth i7-8565U | |
| Asus ZenBook 13 UX331UN | |
| Intel NUC8i7BE | |
| HP EliteBook 735 G5 3UN62EA | |
| Dell XPS 13 9360 FHD i7 Iris | |
| Gemiddeld Intel UHD Graphics 620 (557 - 2608, n=213) | |
| Fujitsu Lifebook A357-A3570MPH06DE | |
| HP x2 210 G2 | |
| 1920x1080 Ice Storm Extreme Graphics | |
| Gemiddeld Intel UHD Graphics 620 (26409 - 59483, n=71) | |
| Fujitsu Lifebook A357-A3570MPH06DE | |
| 2560x1440 Time Spy Graphics | |
| Razer Blade Stealth i7-8565U | |
| Asus ZenBook 13 UX331UN | |
| Intel NUC8i7BE | |
| Dell XPS 13 9360 FHD i7 Iris | |
| Gemiddeld Intel UHD Graphics 620 (299 - 797, n=88) | |
| 3DMark 11 Performance | 1941 punten | |
| 3DMark Cloud Gate Standard Score | 9235 punten | |
Help | ||
| lage | gem. | hoge | ultra | |
|---|---|---|---|---|
| BioShock Infinite (2013) | 63.4 | 35.8 | 31 | 9.6 |
| Rise of the Tomb Raider (2016) | 21.5 | 13.7 | 7.3 | 6.2 |
| Rocket League (2017) | 73.9 | 36.4 | 22.5 |
Geluidsniveau
| Onbelast |
| 28.6 / 28.6 / 28.6 dB (A) |
| Belasting |
| 28.6 / 42.4 dB (A) |
 | ||
30 dB stil 40 dB(A) hoorbaar 50 dB(A) luid |
||
min: | ||
| Asus ZenBook 13 UX333FA UHD Graphics 620, i5-8265U, WDC PC SN520 SDAPNUW-256G | Asus ZenBook 13 UX331UN GeForce MX150, i5-8550U, SK Hynix HFS256G39TND-N210A | Dell XPS 13 9370 i5 UHD UHD Graphics 620, i5-8250U, Toshiba XG5 KXG50ZNV256G | Huawei Matebook X Pro i5 GeForce MX150, i5-8250U, Samsung PM961 MZVLW256HEHP | HP Spectre 13-af033ng UHD Graphics 620, i5-8550U, Samsung PM961 NVMe MZVLW512HMJP | Lenovo Yoga C930-13IKB 81C4 UHD Graphics 620, i5-8550U, SK hynix PC401 HFS256GD9TNG | |
|---|---|---|---|---|---|---|
| Noise | -9% | -2% | -4% | -2% | -0% | |
| uit / omgeving * (dB) | 28.6 | 30.13 -5% | 29 -1% | 27.9 2% | 30.13 -5% | 27.9 2% |
| Idle Minimum * (dB) | 28.6 | 30.13 -5% | 29 -1% | 27.9 2% | 30.13 -5% | 27.9 2% |
| Idle Average * (dB) | 28.6 | 30.3 -6% | 29 -1% | 27.9 2% | 30.13 -5% | 27.9 2% |
| Idle Maximum * (dB) | 28.6 | 30.3 -6% | 29 -1% | 27.9 2% | 30.13 -5% | 29.3 -2% |
| Load Average * (dB) | 28.6 | 39.2 -37% | 32 -12% | 36.2 -27% | 31.5 -10% | 32 -12% |
| Load Maximum * (dB) | 42.4 | 41 3% | 40.1 5% | 45.2 -7% | 33.5 21% | 39.3 7% |
| Witcher 3 ultra * (dB) | 45 |
* ... kleiner is beter
(+) De maximumtemperatuur aan de bovenzijde bedraagt 37 °C / 99 F, vergeleken met het gemiddelde van 35.9 °C / 97 F, variërend van 21.4 tot 59 °C voor de klasse Subnotebook.
(±) De bodem warmt op tot een maximum van 44 °C / 111 F, vergeleken met een gemiddelde van 39.2 °C / 103 F
(+) Bij onbelast gebruik bedraagt de gemiddelde temperatuur voor de bovenzijde 23.8 °C / 75 F, vergeleken met het apparaatgemiddelde van 30.8 °C / 87 F.
(+) De palmsteunen en het touchpad zijn met een maximum van ###max## °C / 81.3 F koeler dan de huidtemperatuur en voelen daarom koel aan.
(±) De gemiddelde temperatuur van de handpalmsteun van soortgelijke toestellen bedroeg 28.2 °C / 82.8 F (+0.8 °C / 1.5 F).
Asus ZenBook 13 UX333FA audioanalyse
(-) | niet erg luide luidsprekers (66 dB)
Bas 100 - 315 Hz
(±) | verminderde zeebaars - gemiddeld 14.6% lager dan de mediaan
(±) | lineariteit van de lage tonen is gemiddeld (12.2% delta ten opzichte van de vorige frequentie)
Midden 400 - 2000 Hz
(+) | evenwichtige middens - slechts 3.3% verwijderd van de mediaan
(+) | de middentonen zijn lineair (6.4% delta ten opzichte van de vorige frequentie)
Hoog 2 - 16 kHz
(+) | evenwichtige hoogtepunten - slechts 3.7% verwijderd van de mediaan
(±) | lineariteit van de hoogtepunten is gemiddeld (8.7% delta ten opzichte van de vorige frequentie)
Algemeen 100 - 16.000 Hz
(±) | lineariteit van het totale geluid is gemiddeld (21.2% verschil met de mediaan)
Vergeleken met dezelfde klasse
» 72% van alle geteste apparaten in deze klasse waren beter, 5% vergelijkbaar, 23% slechter
» De beste had een delta van 5%, het gemiddelde was 18%, de slechtste was 53%
Vergeleken met alle geteste toestellen
» 59% van alle geteste apparaten waren beter, 7% gelijk, 34% slechter
» De beste had een delta van 4%, het gemiddelde was 24%, de slechtste was 134%
Apple MacBook 12 (Early 2016) 1.1 GHz audioanalyse
(+) | luidsprekers kunnen relatief luid spelen (83.6 dB)
Bas 100 - 315 Hz
(±) | verminderde zeebaars - gemiddeld 11.3% lager dan de mediaan
(±) | lineariteit van de lage tonen is gemiddeld (14.2% delta ten opzichte van de vorige frequentie)
Midden 400 - 2000 Hz
(+) | evenwichtige middens - slechts 2.4% verwijderd van de mediaan
(+) | de middentonen zijn lineair (5.5% delta ten opzichte van de vorige frequentie)
Hoog 2 - 16 kHz
(+) | evenwichtige hoogtepunten - slechts 2% verwijderd van de mediaan
(+) | de hoge tonen zijn lineair (4.5% delta naar de vorige frequentie)
Algemeen 100 - 16.000 Hz
(+) | het totale geluid is lineair (10.2% verschil met de mediaan)
Vergeleken met dezelfde klasse
» 7% van alle geteste apparaten in deze klasse waren beter, 2% vergelijkbaar, 91% slechter
» De beste had een delta van 5%, het gemiddelde was 18%, de slechtste was 53%
Vergeleken met alle geteste toestellen
» 5% van alle geteste apparaten waren beter, 1% gelijk, 94% slechter
» De beste had een delta van 4%, het gemiddelde was 24%, de slechtste was 134%
| Uit / Standby | |
| Inactief | |
| Belasting |
|
Key:
min: | |
| Asus ZenBook 13 UX333FA i5-8265U, UHD Graphics 620, WDC PC SN520 SDAPNUW-256G, IPS, 1920x1080, 13.3" | Asus ZenBook 13 UX331UN i5-8550U, GeForce MX150, SK Hynix HFS256G39TND-N210A, IPS, 1920x1080, 13.3" | Dell XPS 13 9370 i5 UHD i5-8250U, UHD Graphics 620, Toshiba XG5 KXG50ZNV256G, IPS, 3840x2160, 13.3" | Huawei Matebook X Pro i5 i5-8250U, GeForce MX150, Samsung PM961 MZVLW256HEHP, IPS, 3000x2000, 13.9" | HP Spectre 13-af033ng i5-8550U, UHD Graphics 620, Samsung PM961 NVMe MZVLW512HMJP, IPS, 1920x1080, 13.3" | HP EliteBook 735 G5 3UN62EA R7 2700U, Vega 10, Toshiba KBG30ZMV256G, IPS, 1920x1080, 13.3" | |
|---|---|---|---|---|---|---|
| Power Consumption | -11% | -58% | -68% | -21% | -82% | |
| Idle Minimum * (Watt) | 1.6 | 2.2 -38% | 4.3 -169% | 3.5 -119% | 2.8 -75% | 5.5 -244% |
| Idle Average * (Watt) | 4.6 | 5 -9% | 8 -74% | 8.9 -93% | 6.2 -35% | 9.4 -104% |
| Idle Maximum * (Watt) | 7.3 | 8 -10% | 8.1 -11% | 12.3 -68% | 9.4 -29% | 11.6 -59% |
| Load Average * (Watt) | 37.9 | 33 13% | 46.6 -23% | 54.2 -43% | 32.2 15% | 39 -3% |
| Load Maximum * (Watt) | 44.8 | 49.4 -10% | 49.8 -11% | 52.1 -16% | 36.6 18% | 45.6 -2% |
| Witcher 3 ultra * (Watt) | 42.4 |
* ... kleiner is beter
| Asus ZenBook 13 UX333FA i5-8265U, UHD Graphics 620, 50 Wh | Asus ZenBook 13 UX331UN i5-8550U, GeForce MX150, 50 Wh | Dell XPS 13 9370 i5 UHD i5-8250U, UHD Graphics 620, 52 Wh | Huawei Matebook X Pro i5 i5-8250U, GeForce MX150, 57.4 Wh | HP Spectre 13-af033ng i5-8550U, UHD Graphics 620, 43 Wh | Lenovo Yoga C930-13IKB 81C4 i5-8550U, UHD Graphics 620, 60 Wh | |
|---|---|---|---|---|---|---|
| Batterijduur | -18% | -32% | -11% | -32% | 12% | |
| Reader / Idle (h) | 27.8 | 20.7 -26% | 14.5 -48% | 20.7 -26% | ||
| WiFi v1.3 (h) | 9.9 | 9 -9% | 6.8 -31% | 9.3 -6% | 5.9 -40% | 11.1 12% |
| Load (h) | 2.2 | 1.8 -18% | 1.8 -18% | 2.2 0% | 1.7 -23% |
Pro
Contra
Dit is de verkorte versie van het originele artikel. Het volledige, Engelse testrapport vind je hier.
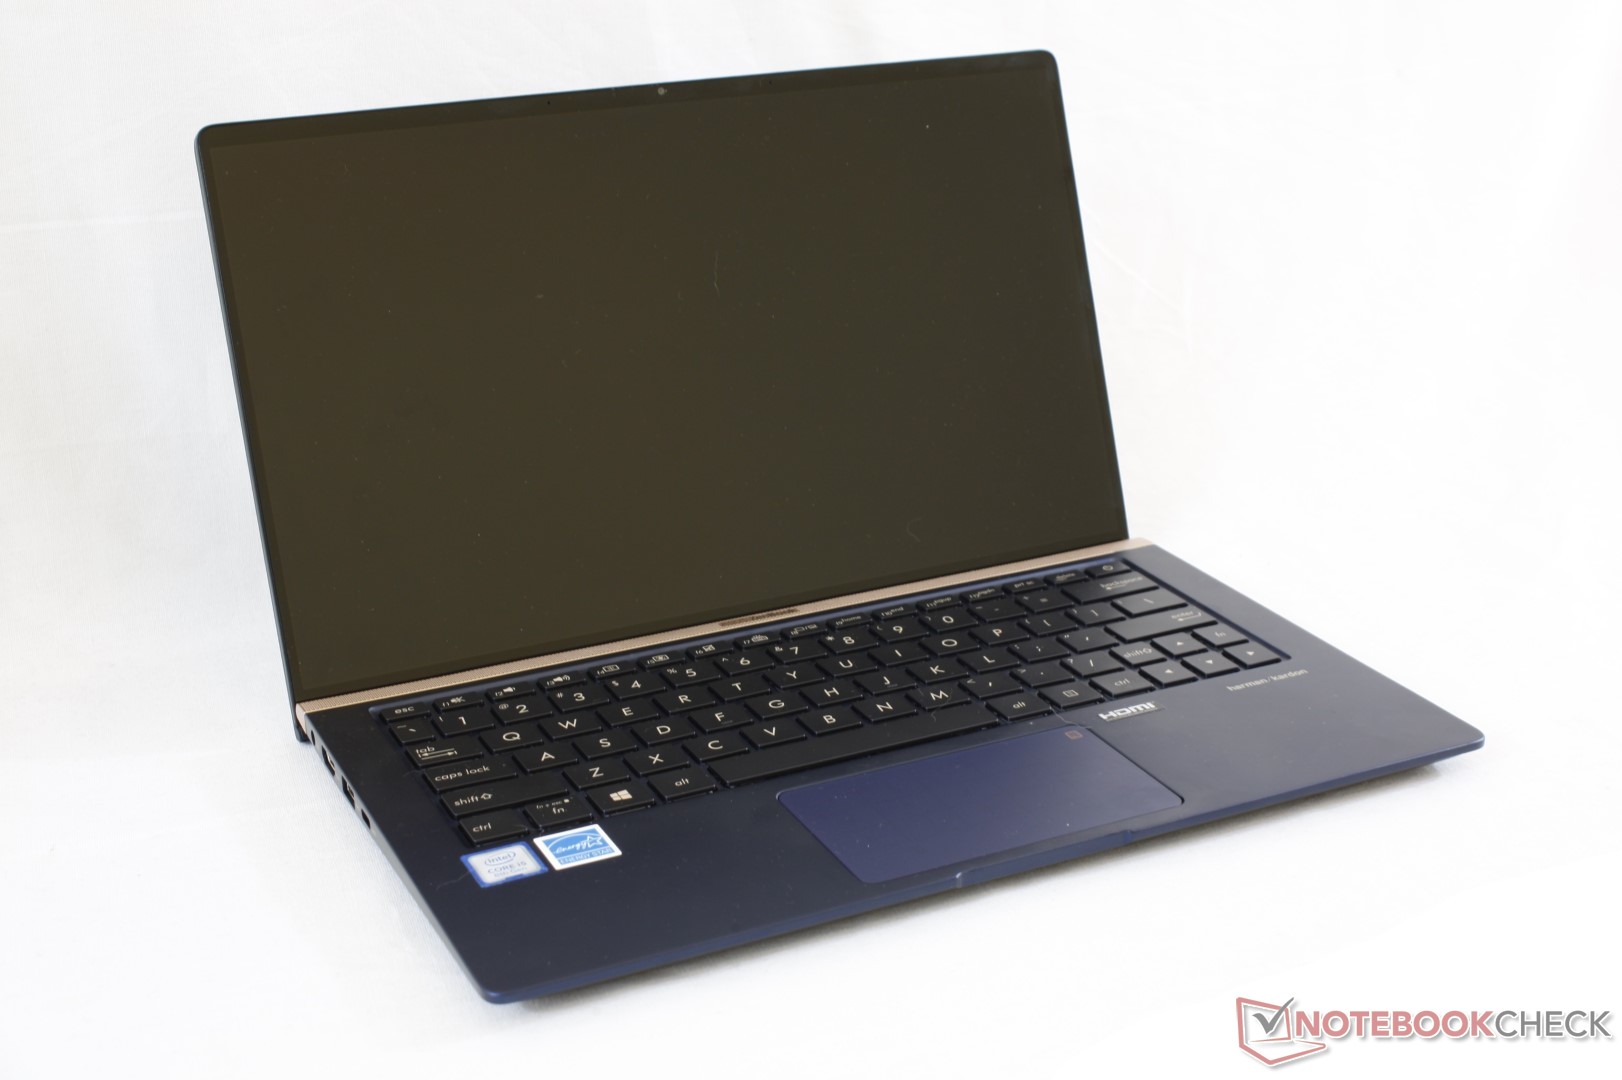
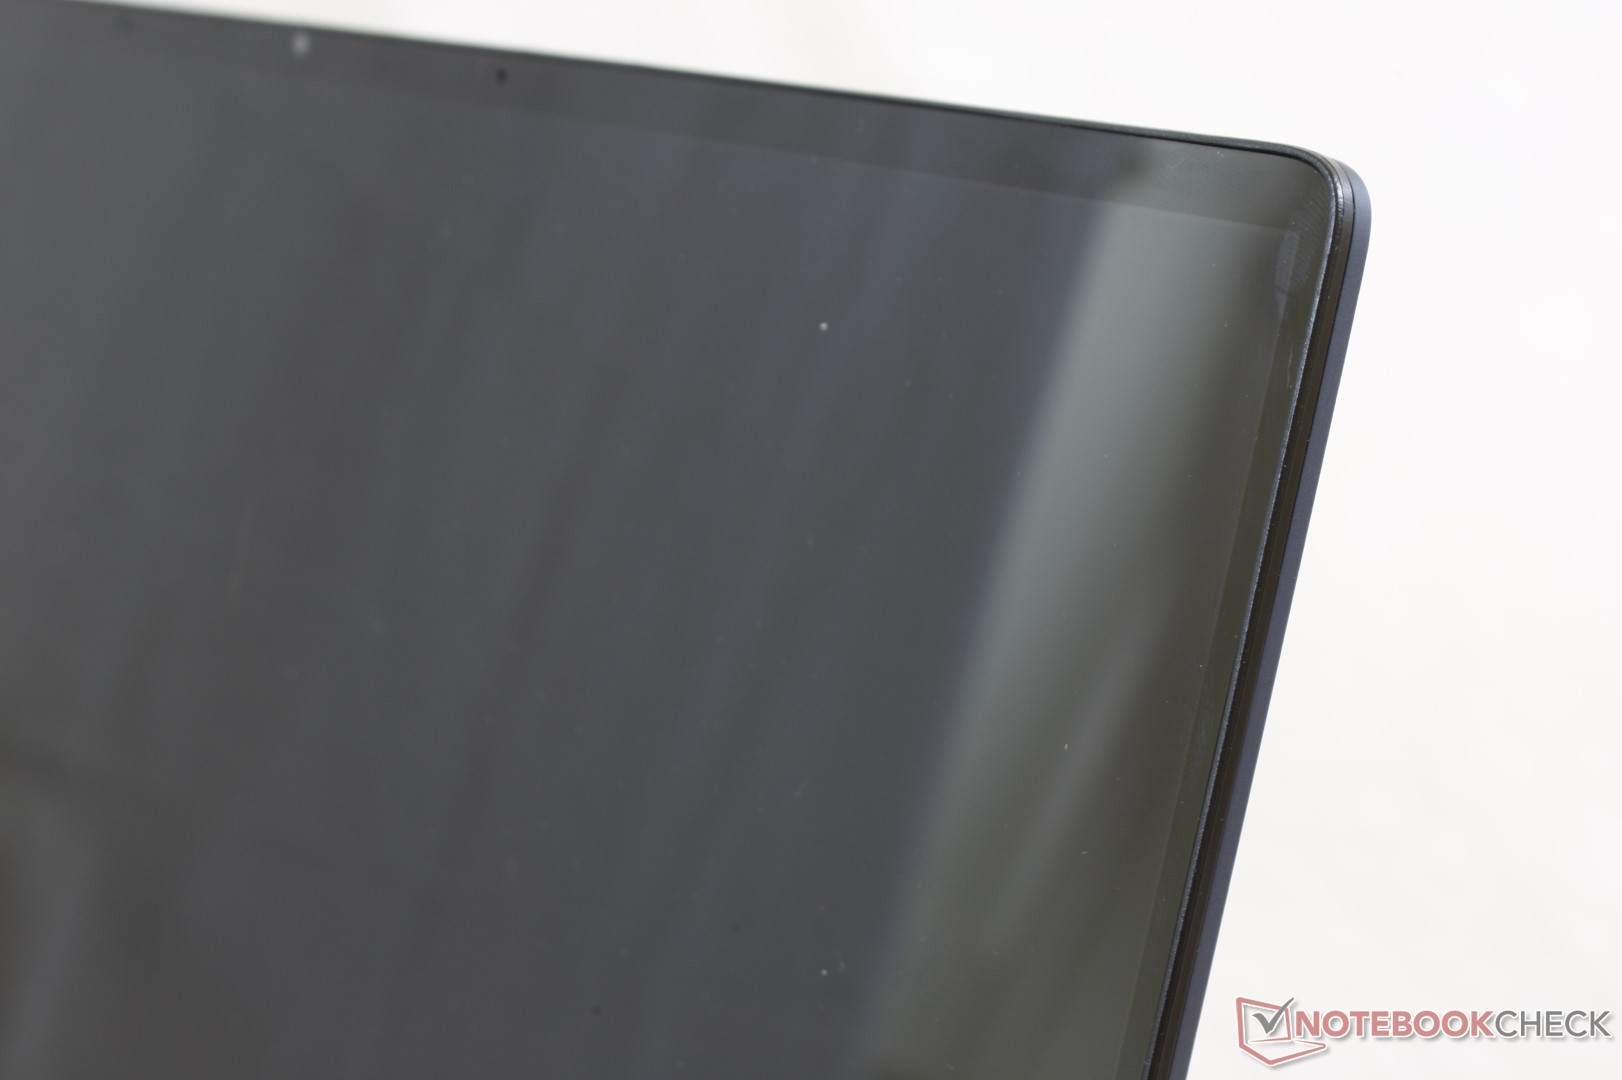
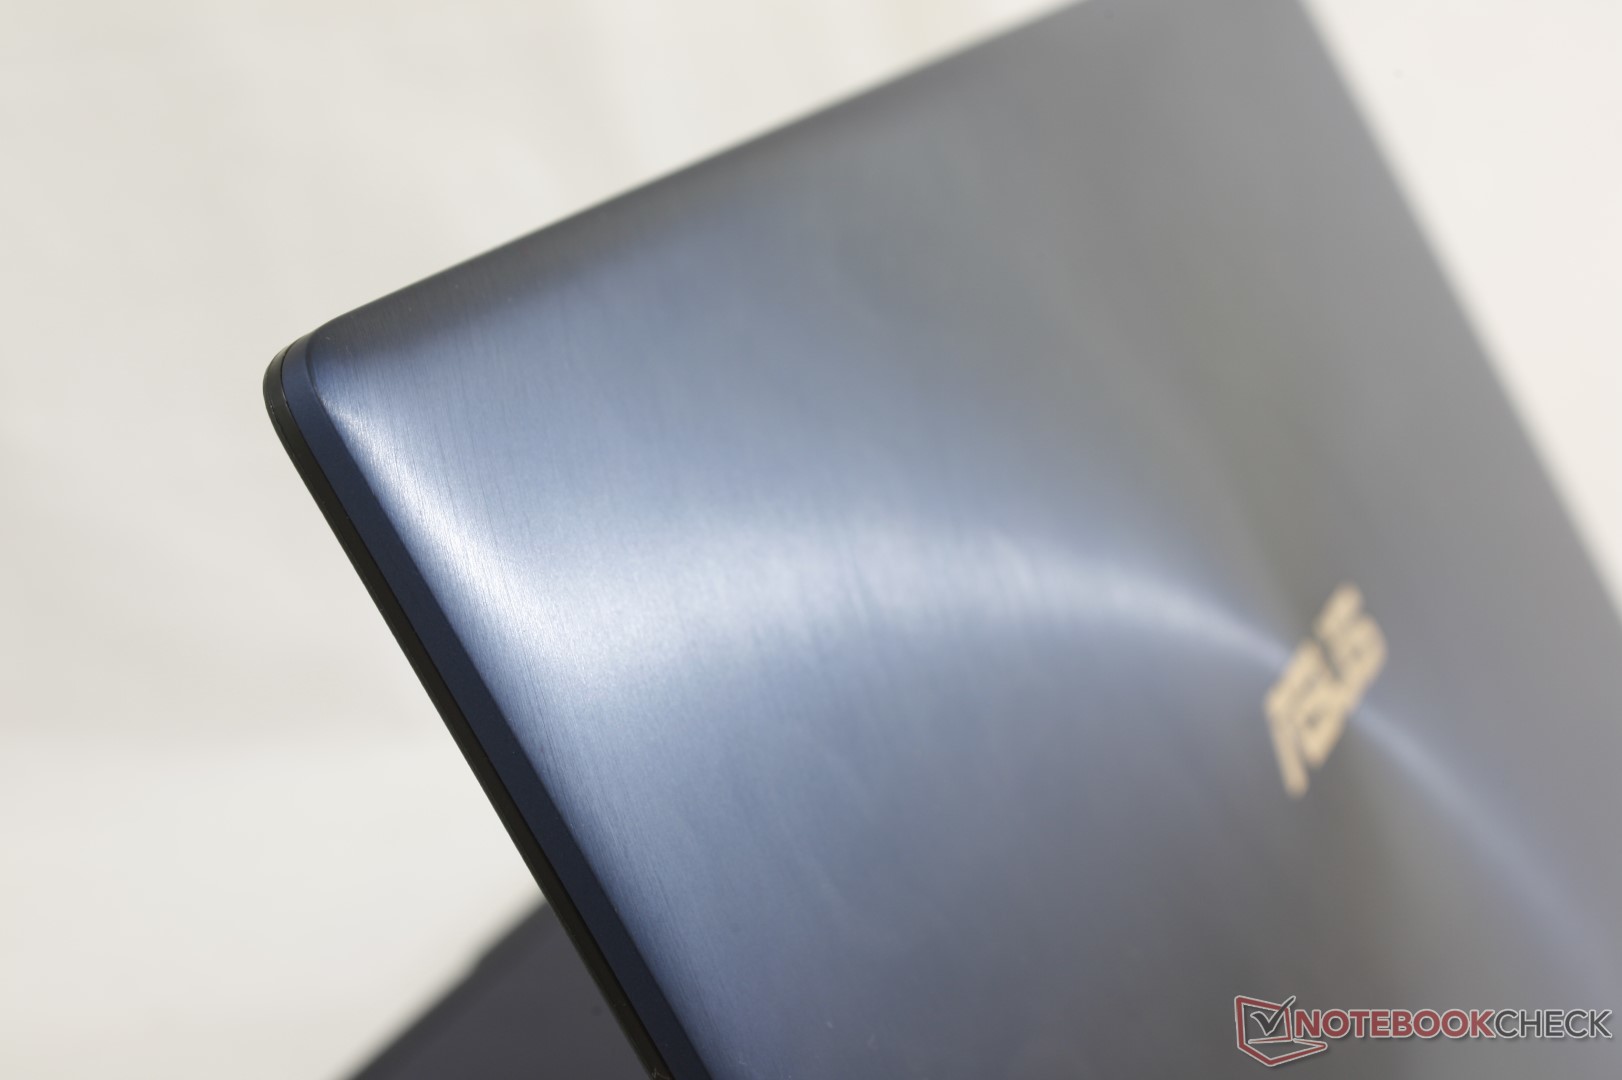
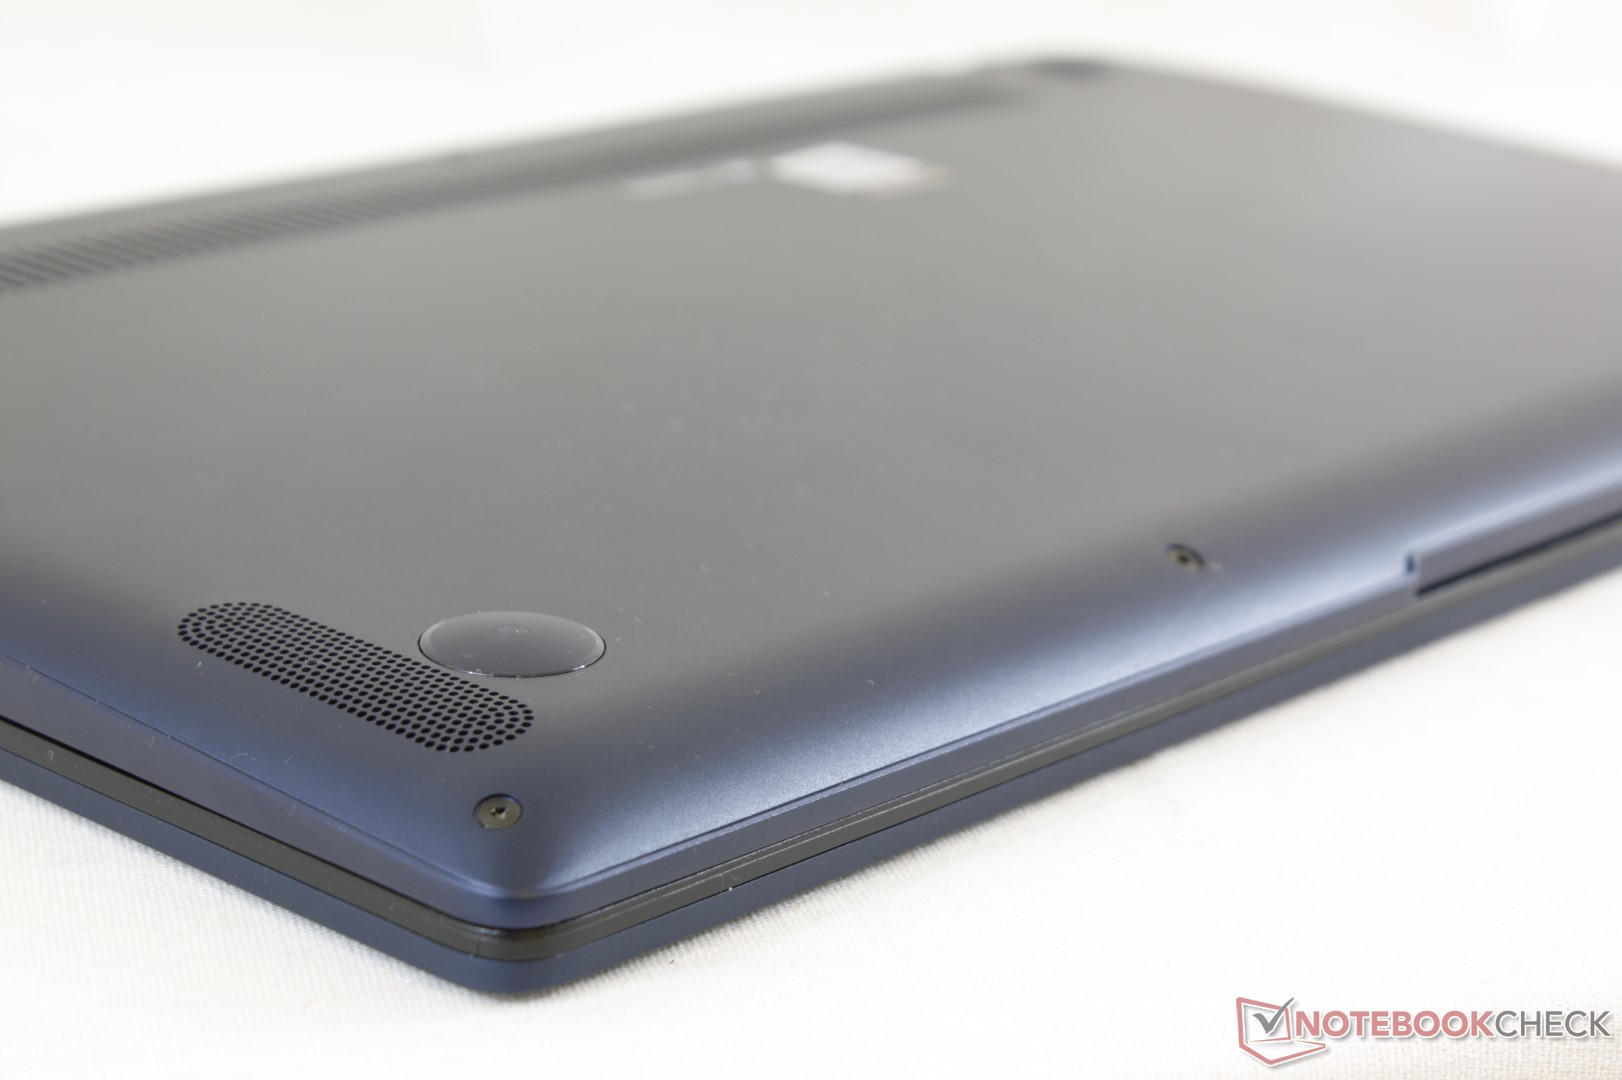
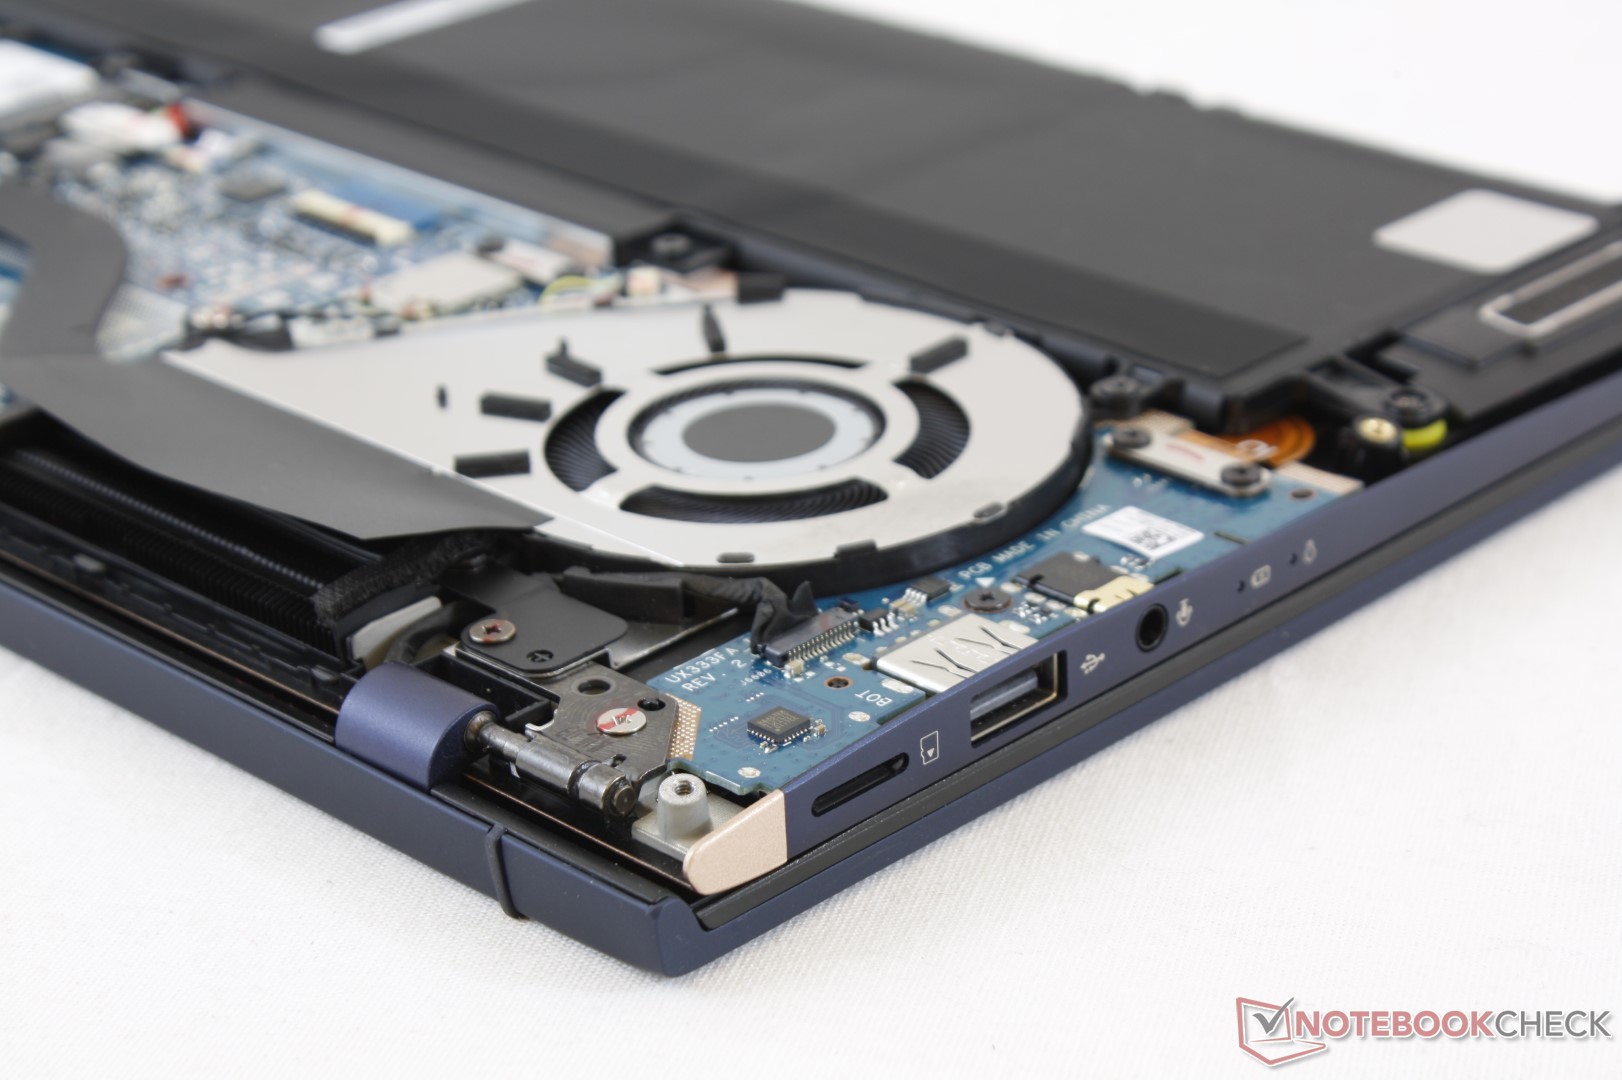
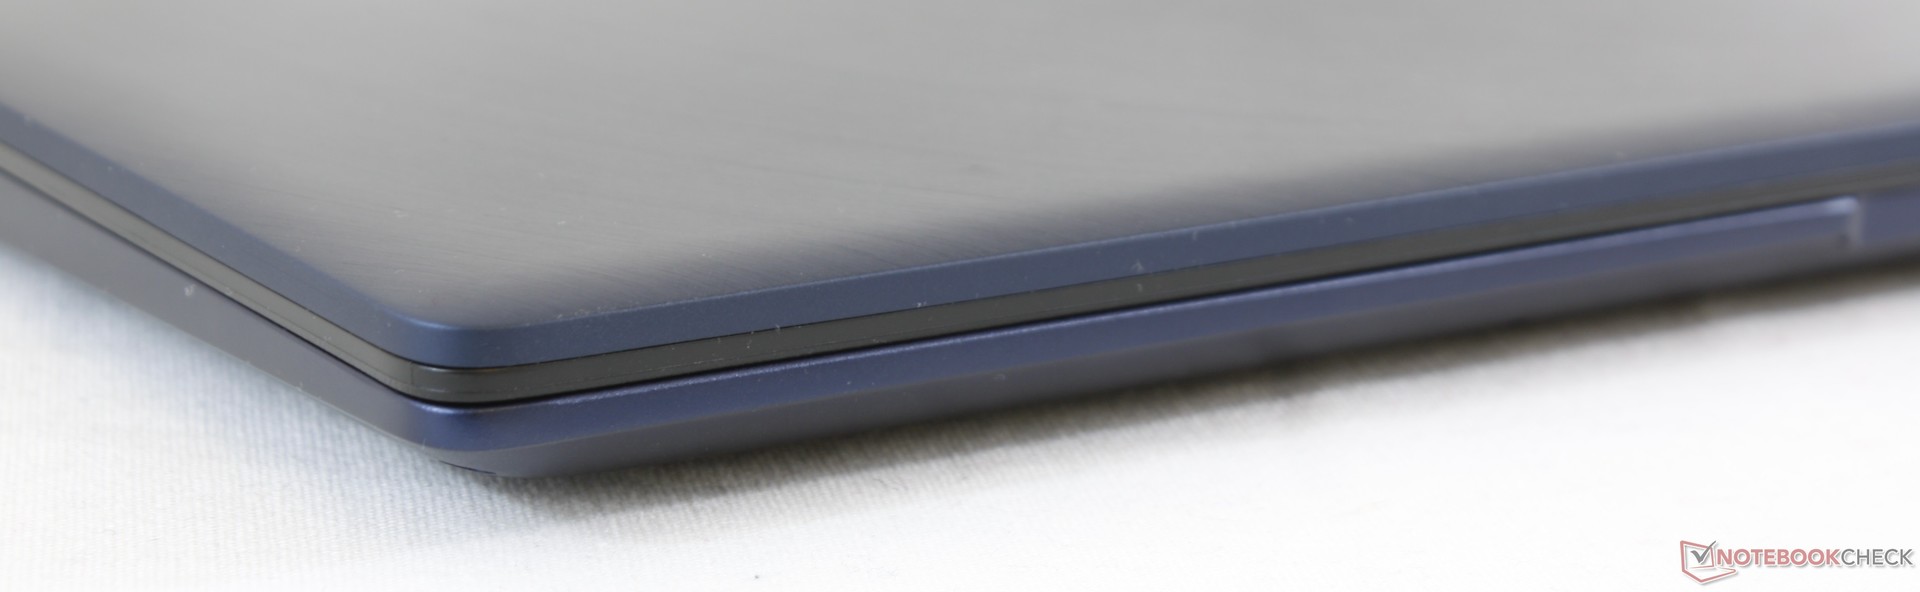
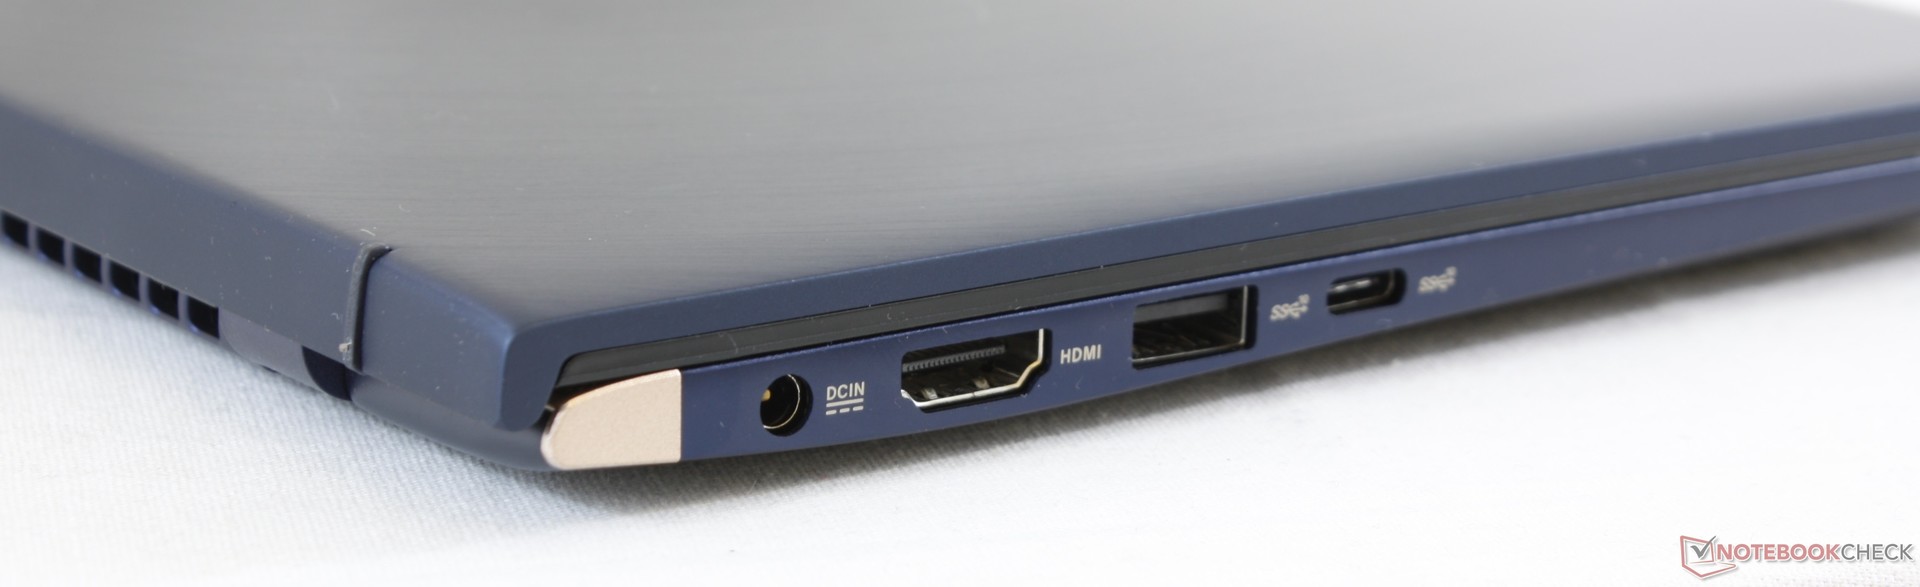
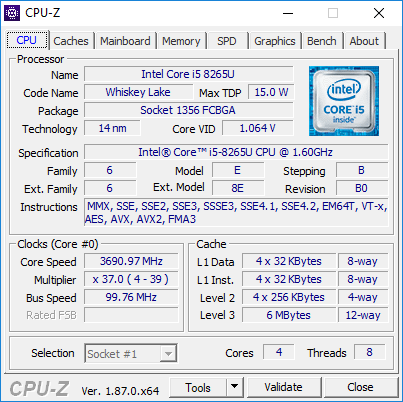
Qua design is de nieuwe behuizing een stap voorwaarts ten opzichte van de vorige generatie ZenBooks, de UX331. De UX333 durft dikker te zijn om de stevigheid te verbeteren en tegelijkertijd alle randen rond het beeldscherm dunner te maken. De visuele verandering tussen de twee generaties en de redelijke startprijzen zijn wellicht belangrijkere redenen om een ZenBook UX333 aan te schaffen dan de sprong van Kaby Lake-R naar de nieuwste Intel 8e generatie Core Whiskey Lake-U.
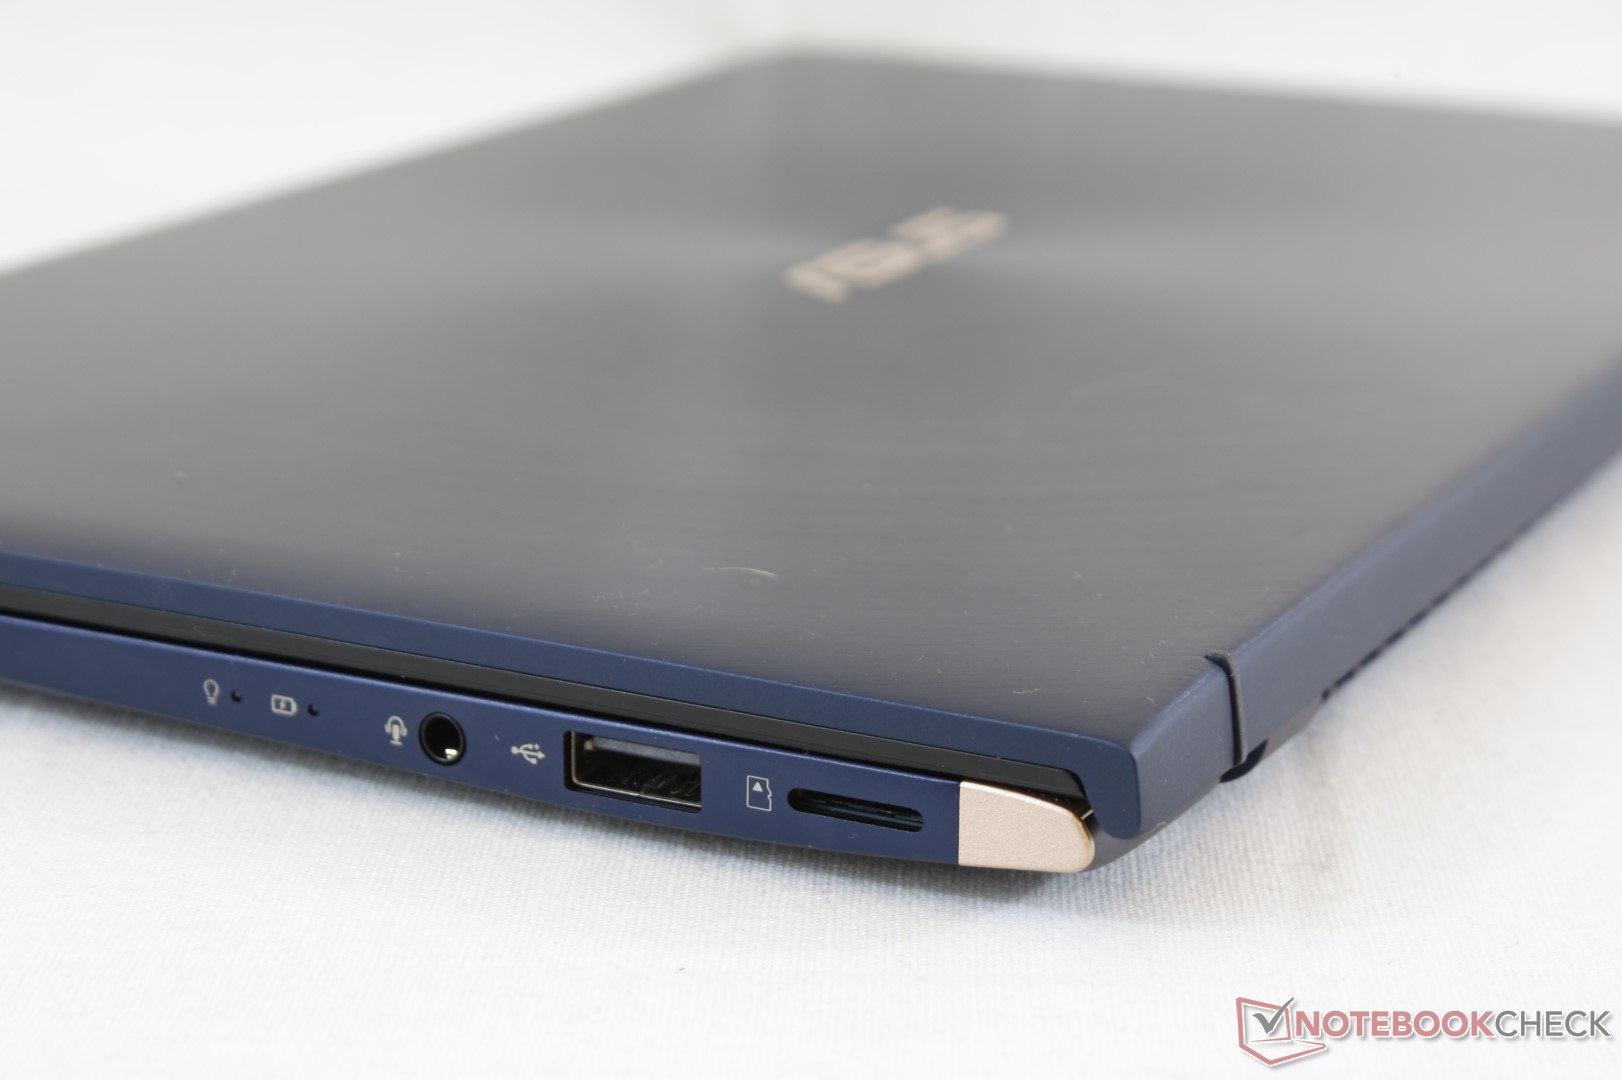
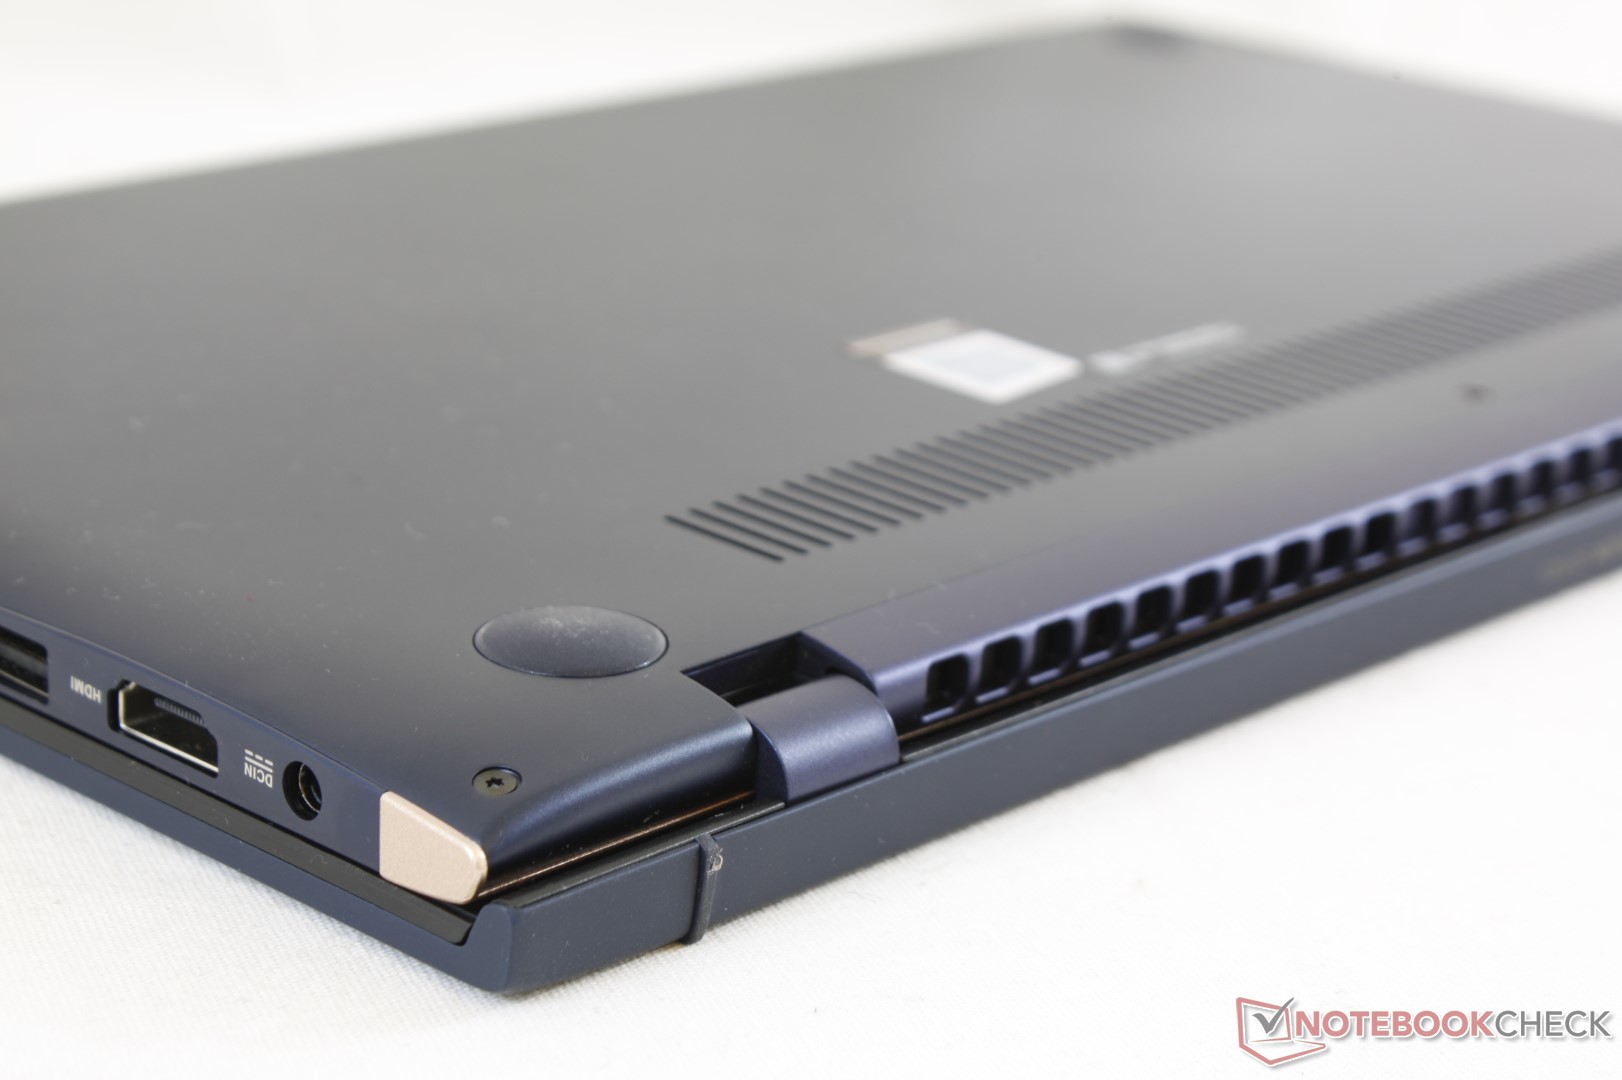
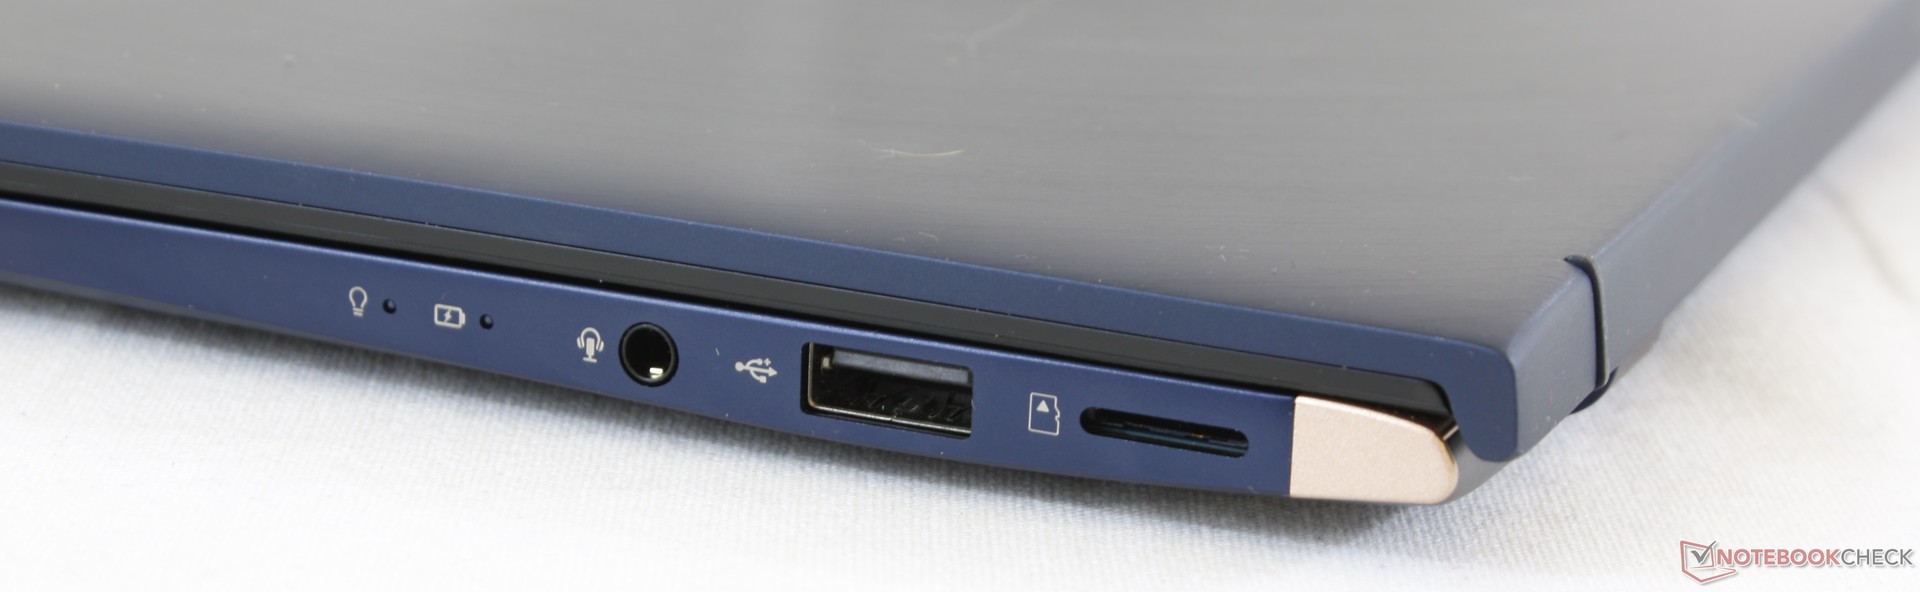
De meeste gebruikers die op zoek zijn naar een 13-inch Ultrabook zullen deze notebook vergelijken met een Dell XPS 13 9370. Vanuit dat perspectief heeft de UX333 enkele voor- en nadelen waar je rekening mee moet houden. Het kleinere formaat, geïntegreerde USB Type-A en HDMI-poorten, snellere GeForce MX150 GPU opties en een lagere prijs voor dezelfde Core i5 CPU spreken allen in het voordeel van Asus. Aan de andere kant heeft de Dell een helderder beeldscherm, optioneel touchscherm, Thunderbolt 3, veelzijdiger USB Type-C opladen, snellere MicroSD-kaartlezer en een groter touchpad. De keuze hangt dan ook voornamelijk af van de persoonlijke voorkeuren van de koper.
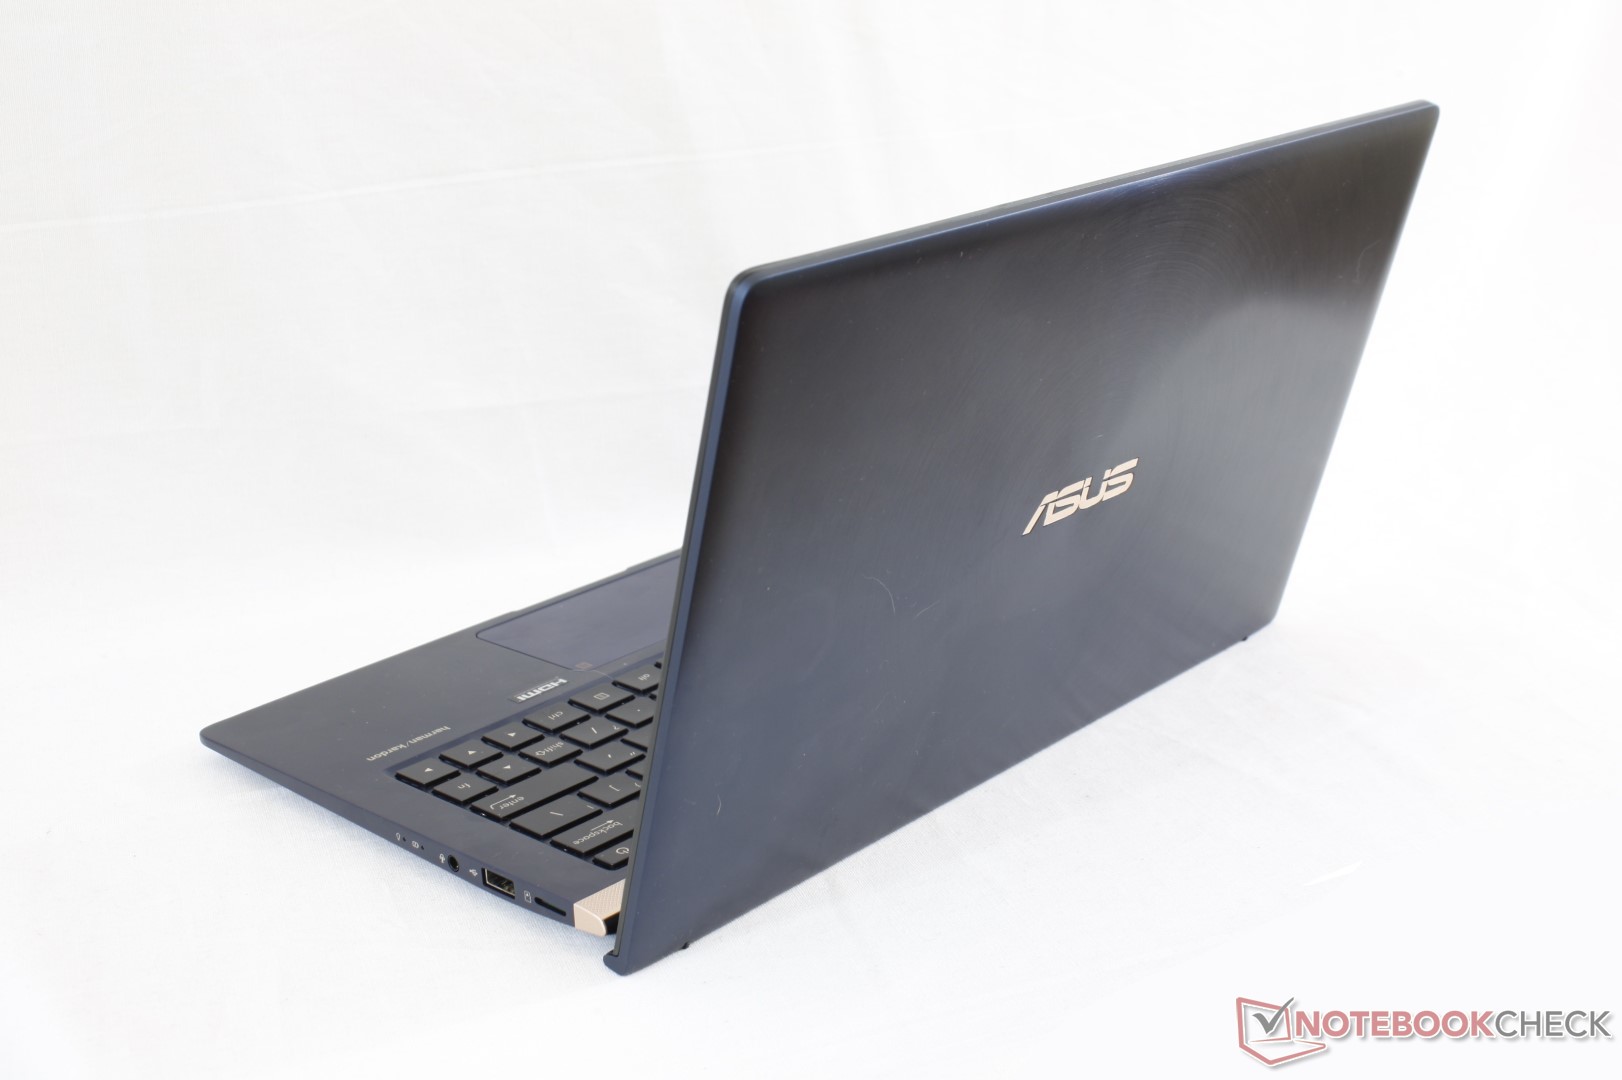
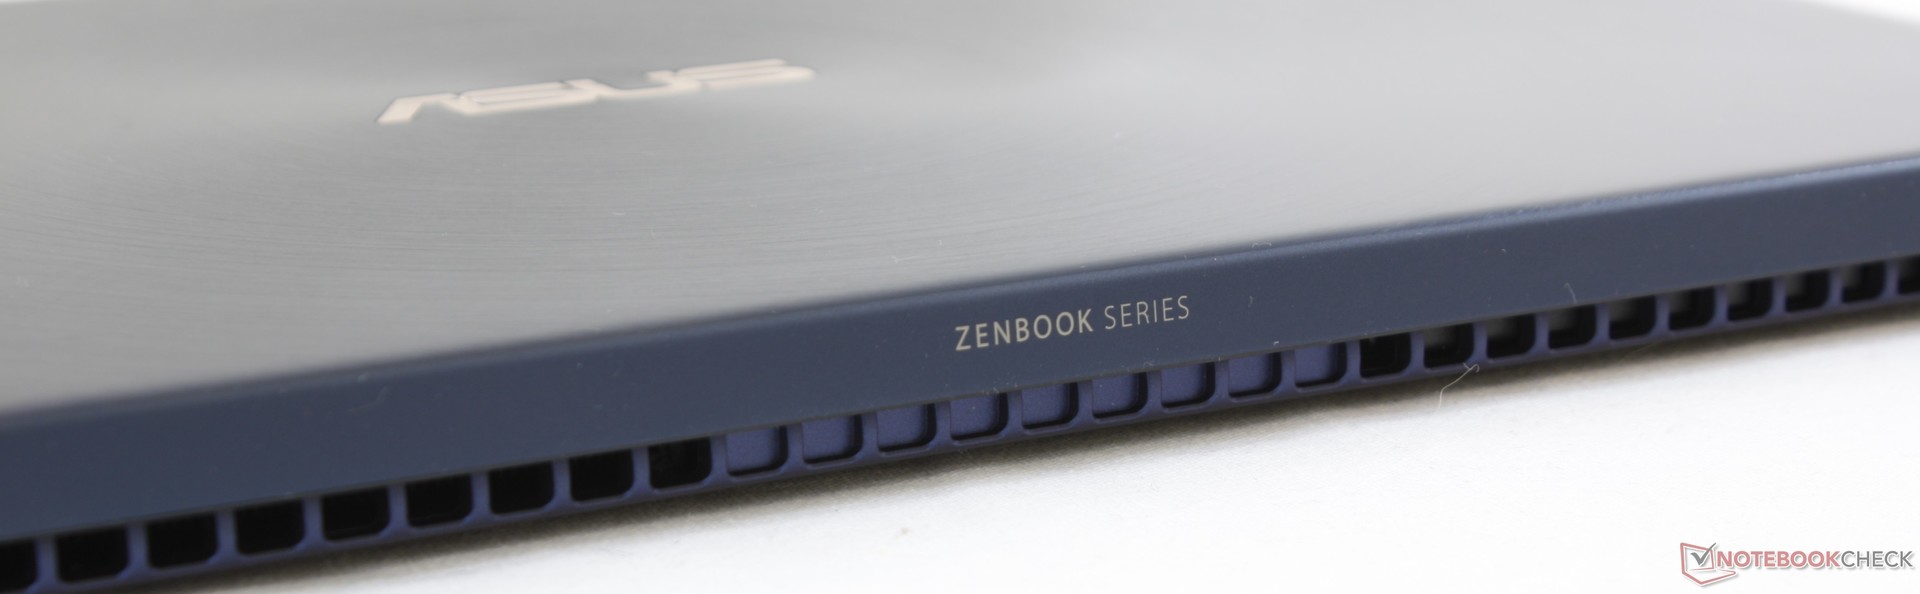
De ZenBook UX333 laat de oudere UX331 er ouderwets uitzien. De UX333 komt langszij met de vlaggenschepen van de concurrentie zoals de XPS 13 en de Spectre 13 voor een prijs die een paar honderd euro lager is. Het ontbreken van Thunderbolt 3, USB Type-C opladen en touchscherm kunnen echter dealbrekers zijn voor reizigers.
Asus ZenBook 13 UX333FA
- 28-12-2018 v6 (old)
Allen Ngo
Price comparison
