Kort testrapport Huawei MateBook 13 (i7-8565U, GeForce MX150) Laptop
| |||||||||||||||||||||||||
Helderheidsverdeling: 93 %
Helderheid in Batterij-modus: 366.7 cd/m²
Contrast: 940:1 (Zwart: 0.39 cd/m²)
ΔE ColorChecker Calman: 2.76 | ∀{0.5-29.43 Ø4.72}
calibrated: 1.53
ΔE Greyscale Calman: 4.2 | ∀{0.09-98 Ø4.97}
97.6% sRGB (Argyll 1.6.3 3D)
63.2% AdobeRGB 1998 (Argyll 1.6.3 3D)
69.2% AdobeRGB 1998 (Argyll 3D)
97.7% sRGB (Argyll 3D)
68.1% Display P3 (Argyll 3D)
Gamma: 2.22
CCT: 6271 K
| Huawei MateBook 13 i7 Chi Mei CMN8201, IPS, 13", 2160x1440 | Dell XPS 13 9370 i7 UHD ID: Sharp SHP148B, Name: LQ133D1, Dell P/N: 8XDHY, IPS, 13.3", 3840x2160 | Apple MacBook Pro 13 2018 Touchbar i5 APPA03E, IPS, 13.3", 2560x1600 | HP Spectre x360 13t-ae000 LGD0588, IPS, 13.3", 3840x2160 | Lenovo Yoga C930-13IKB B139HAN03_0, IPS, 13.9", 1920x1080 | Huawei Matebook X Pro i5 Tianma XM, IPS, 13.9", 3000x2000 | |
|---|---|---|---|---|---|---|
| Display | 1% | 24% | 4% | -4% | -3% | |
| Display P3 Coverage (%) | 68.1 | 68.9 1% | 98.5 45% | 71.9 6% | 64.3 -6% | 65.9 -3% |
| sRGB Coverage (%) | 97.7 | 98.4 1% | 99.9 2% | 98.1 0% | 94.6 -3% | 95.2 -3% |
| AdobeRGB 1998 Coverage (%) | 69.2 | 69.5 0% | 87.3 26% | 73.1 6% | 66.2 -4% | 67.6 -2% |
| Response Times | -50% | -3% | -10% | 10% | 13% | |
| Response Time Grey 50% / Grey 80% * (ms) | 43.2 ? | 69.6 ? -61% | 46 ? -6% | 51.6 ? -19% | 40.8 ? 6% | 40.4 ? 6% |
| Response Time Black / White * (ms) | 32 ? | 44 ? -38% | 32 ? -0% | 32.4 ? -1% | 27.6 ? 14% | 25.6 ? 20% |
| PWM Frequency (Hz) | 3759 ? | 118000 ? | ||||
| Screen | 6% | 34% | 12% | -33% | -0% | |
| Brightness middle (cd/m²) | 366.6 | 478.5 31% | 519 42% | 329.8 -10% | 316 -14% | 442.7 21% |
| Brightness (cd/m²) | 360 | 466 29% | 504 40% | 318 -12% | 291 -19% | 428 19% |
| Brightness Distribution (%) | 93 | 86 -8% | 95 2% | 74 -20% | 83 -11% | 84 -10% |
| Black Level * (cd/m²) | 0.39 | 0.43 -10% | 0.33 15% | 0.25 36% | 0.36 8% | 0.31 21% |
| Contrast (:1) | 940 | 1113 18% | 1573 67% | 1319 40% | 878 -7% | 1428 52% |
| Colorchecker dE 2000 * | 2.76 | 3.09 -12% | 1.4 49% | 2.37 14% | 5.9 -114% | 2.24 19% |
| Colorchecker dE 2000 max. * | 6.19 | 5.94 4% | 2.8 55% | 4.08 34% | 12.9 -108% | 7.19 -16% |
| Colorchecker dE 2000 calibrated * | 1.53 | 2.06 -35% | 1.3 15% | 1.11 27% | ||
| Greyscale dE 2000 * | 4.2 | 2.4 43% | 2.2 48% | 2.8 33% | 8.6 -105% | 9.7 -131% |
| Gamma | 2.22 99% | 2.063 107% | 2.22 99% | 2.145 103% | 2.1 105% | 1.42 155% |
| CCT | 6271 104% | 6883 94% | 6908 94% | 6441 101% | 6854 95% | 6227 104% |
| Color Space (Percent of AdobeRGB 1998) (%) | 63.2 | 69.47 10% | 77.3 22% | 67 6% | 60.7 -4% | 61.6 -3% |
| Color Space (Percent of sRGB) (%) | 97.6 | 98.36 1% | 99.99 2% | 98 0% | 94.5 -3% | 95 -3% |
| Totaal Gemiddelde (Programma / Instellingen) | -14% /
-2% | 18% /
27% | 2% /
8% | -9% /
-22% | 3% /
1% |
* ... kleiner is beter
Responstijd Scherm
| ↔ Responstijd Zwart naar Wit | ||
|---|---|---|
| 32 ms ... stijging ↗ en daling ↘ gecombineerd | ↗ 18 ms stijging | 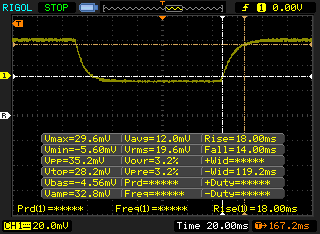 |
| ↘ 14 ms daling | ||
| Het scherm vertoonde trage responstijden in onze tests en is misschien te traag voor games. Ter vergelijking: alle testtoestellen variëren van 0.1 (minimum) tot 240 (maximum) ms. » 86 % van alle toestellen zijn beter. Dit betekent dat de gemeten responstijd slechter is dan het gemiddelde (19.8 ms) van alle geteste toestellen. | ||
| ↔ Responstijd 50% Grijs naar 80% Grijs | ||
| 43.2 ms ... stijging ↗ en daling ↘ gecombineerd | ↗ 22 ms stijging | 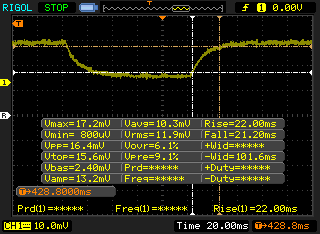 |
| ↘ 21.2 ms daling | ||
| Het scherm vertoonde trage responstijden in onze tests en is misschien te traag voor games. Ter vergelijking: alle testtoestellen variëren van 0.165 (minimum) tot 636 (maximum) ms. » 72 % van alle toestellen zijn beter. Dit betekent dat de gemeten responstijd slechter is dan het gemiddelde (31 ms) van alle geteste toestellen. | ||
Screen Flickering / PWM (Pulse-Width Modulation)
| Screen flickering / PWM niet waargenomen | 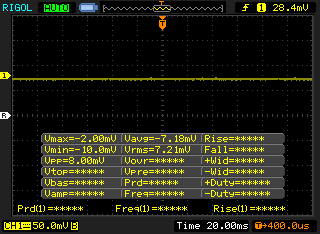 | ||
Ter vergelijking: 52 % van alle geteste toestellen maakten geen gebruik van PWM om de schermhelderheid te verlagen. Als het wel werd gebruikt, werd een gemiddelde van 7778 (minimum: 5 - maximum: 343500) Hz waargenomen. | |||
| PCMark 8 Home Score Accelerated v2 | 3616 punten | |
| PCMark 8 Work Score Accelerated v2 | 4709 punten | |
| PCMark 10 Score | 4344 punten | |
Help | ||
| Huawei MateBook 13 i7 Samsung SSD PM981 MZVLB512HAJQ | Dell XPS 13 9370 i7 UHD Toshiba XG5 KXG50ZNV512G | HP Spectre x360 13t-ae000 Lite-On CA1-8D256-HP | Lenovo Yoga C930-13IKB SK hynix PC401 HFS256GD9TNG | Huawei Matebook X Pro i5 Samsung PM961 MZVLW256HEHP | |
|---|---|---|---|---|---|
| AS SSD | -41% | -67% | -56% | -30% | |
| Seq Read (MB/s) | 1889 | 2205 17% | 2133 13% | 1850 -2% | 2416 28% |
| Seq Write (MB/s) | 1812 | 435.8 -76% | 945 -48% | 661 -64% | 1170 -35% |
| 4K Read (MB/s) | 55.5 | 29.36 -47% | 29.84 -46% | 38.04 -31% | 48.33 -13% |
| 4K Write (MB/s) | 118.4 | 107.4 -9% | 91.4 -23% | 95 -20% | 103.1 -13% |
| 4K-64 Read (MB/s) | 1257 | 678 -46% | 725 -42% | 434.3 -65% | 1039 -17% |
| 4K-64 Write (MB/s) | 1571 | 444.8 -72% | 404.1 -74% | 266.3 -83% | 399.6 -75% |
| Access Time Read * (ms) | 0.041 | 0.059 -44% | 0.121 -195% | 0.069 -68% | 0.058 -41% |
| Access Time Write * (ms) | 0.032 | 0.055 -72% | 0.13 -306% | 0.056 -75% | 0.036 -13% |
| Score Read (Points) | 1502 | 926 -38% | 968 -36% | 657 -56% | 1329 -12% |
| Score Write (Points) | 1871 | 596 -68% | 590 -68% | 427 -77% | 620 -67% |
| Score Total (Points) | 4147 | 1911 -54% | 1998 -52% | 1373 -67% | 2575 -38% |
| Copy ISO MB/s (MB/s) | 1800 | 585 -67% | 1492 -17% | 539 -70% | 739 -59% |
| Copy Program MB/s (MB/s) | 385.6 | 570 48% | 300.9 -22% | 209.7 -46% | 312.3 -19% |
| Copy Game MB/s (MB/s) | 982 | 503 -49% | 839 -15% | 340 -65% | 486.3 -50% |
* ... kleiner is beter

| 3DMark 11 Performance | 4796 punten | |
| 3DMark Cloud Gate Standard Score | 14722 punten | |
| 3DMark Fire Strike Score | 3235 punten | |
Help | ||
| lage | gem. | hoge | ultra | |
|---|---|---|---|---|
| BioShock Infinite (2013) | 195 | 110.3 | 93.4 | 34.3 |
| The Witcher 3 (2015) | 70.5 | 39.7 | 22.1 | 11.9 |
| Rocket League (2017) | 156 | 76.1 | 47.4 |
| Huawei MateBook 13 i7 GeForce MX150, i7-8565U, Samsung SSD PM981 MZVLB512HAJQ | Huawei Matebook X Pro i5 GeForce MX150, i5-8250U, Samsung PM961 MZVLW256HEHP | Dell XPS 13 9370 i7 UHD UHD Graphics 620, i5-8550U, Toshiba XG5 KXG50ZNV512G | Apple MacBook Pro 13 2018 Touchbar i5 Iris Plus Graphics 655, i5-8259U | Razer Blade Stealth i7-8565U GeForce MX150, i7-8565U, Lite-On CA3-8D256-Q11 | |
|---|---|---|---|---|---|
| Noise | 0% | 4% | 1% | -2% | |
| uit / omgeving * (dB) | 28.6 | 27.9 2% | 28 2% | 29.6 -3% | 28.4 1% |
| Idle Minimum * (dB) | 28.6 | 27.9 2% | 28 2% | 29.6 -3% | 28.5 -0% |
| Idle Average * (dB) | 28.6 | 27.9 2% | 28 2% | 29.6 -3% | 29 -1% |
| Idle Maximum * (dB) | 28.6 | 27.9 2% | 28 2% | 29.6 -3% | 29.1 -2% |
| Load Average * (dB) | 34.2 | 36.2 -6% | 32.5 5% | 36.7 -7% | 42.8 -25% |
| Witcher 3 ultra * (dB) | 43 | 45 -5% | 32.5 24% | 41.4 4% | |
| Load Maximum * (dB) | 47 | 45.2 4% | 42.2 10% | 46.7 1% | 41.6 11% |
* ... kleiner is beter
Geluidsniveau
| Onbelast |
| 28.6 / 28.6 / 28.6 dB (A) |
| Belasting |
| 34.2 / 47 dB (A) |
 | ||
30 dB stil 40 dB(A) hoorbaar 50 dB(A) luid |
||
min: | ||
(±) De maximumtemperatuur aan de bovenzijde bedraagt 44.2 °C / 112 F, vergeleken met het gemiddelde van 35.9 °C / 97 F, variërend van 21.4 tot 59 °C voor de klasse Subnotebook.
(-) De bodem warmt op tot een maximum van 48 °C / 118 F, vergeleken met een gemiddelde van 39.2 °C / 103 F
(+) Bij onbelast gebruik bedraagt de gemiddelde temperatuur voor de bovenzijde 24 °C / 75 F, vergeleken met het apparaatgemiddelde van 30.8 °C / 87 F.
(±) Bij het spelen van The Witcher 3 is de gemiddelde temperatuur voor de bovenzijde 36 °C / 97 F, vergeleken met het apparaatgemiddelde van 30.8 °C / 87 F.
(+) De handpalmsteunen en het touchpad bereiken maximaal de huidtemperatuur (33.2 °C / 91.8 F) en zijn dus niet heet.
(-) De gemiddelde temperatuur van de handpalmsteun van soortgelijke toestellen bedroeg 28.2 °C / 82.8 F (-5 °C / -9 F).
Huawei MateBook 13 i7 audioanalyse
(-) | niet erg luide luidsprekers (70.7 dB)
Bas 100 - 315 Hz
(-) | bijna geen lage tonen - gemiddeld 16.3% lager dan de mediaan
(-) | de lage tonen zijn niet lineair (15.7% delta naar de vorige frequentie)
Midden 400 - 2000 Hz
(+) | evenwichtige middens - slechts 4.9% verwijderd van de mediaan
(±) | lineariteit van de middentonen is gemiddeld (7.3% delta ten opzichte van de vorige frequentie)
Hoog 2 - 16 kHz
(+) | evenwichtige hoogtepunten - slechts 3.5% verwijderd van de mediaan
(±) | lineariteit van de hoogtepunten is gemiddeld (7.5% delta ten opzichte van de vorige frequentie)
Algemeen 100 - 16.000 Hz
(±) | lineariteit van het totale geluid is gemiddeld (21.7% verschil met de mediaan)
Vergeleken met dezelfde klasse
» 73% van alle geteste apparaten in deze klasse waren beter, 6% vergelijkbaar, 21% slechter
» De beste had een delta van 5%, het gemiddelde was 18%, de slechtste was 53%
Vergeleken met alle geteste toestellen
» 61% van alle geteste apparaten waren beter, 7% gelijk, 31% slechter
» De beste had een delta van 4%, het gemiddelde was 24%, de slechtste was 134%
Apple MacBook 12 (Early 2016) 1.1 GHz audioanalyse
(+) | luidsprekers kunnen relatief luid spelen (83.6 dB)
Bas 100 - 315 Hz
(±) | verminderde zeebaars - gemiddeld 11.3% lager dan de mediaan
(±) | lineariteit van de lage tonen is gemiddeld (14.2% delta ten opzichte van de vorige frequentie)
Midden 400 - 2000 Hz
(+) | evenwichtige middens - slechts 2.4% verwijderd van de mediaan
(+) | de middentonen zijn lineair (5.5% delta ten opzichte van de vorige frequentie)
Hoog 2 - 16 kHz
(+) | evenwichtige hoogtepunten - slechts 2% verwijderd van de mediaan
(+) | de hoge tonen zijn lineair (4.5% delta naar de vorige frequentie)
Algemeen 100 - 16.000 Hz
(+) | het totale geluid is lineair (10.2% verschil met de mediaan)
Vergeleken met dezelfde klasse
» 7% van alle geteste apparaten in deze klasse waren beter, 2% vergelijkbaar, 91% slechter
» De beste had een delta van 5%, het gemiddelde was 18%, de slechtste was 53%
Vergeleken met alle geteste toestellen
» 5% van alle geteste apparaten waren beter, 1% gelijk, 94% slechter
» De beste had een delta van 4%, het gemiddelde was 24%, de slechtste was 134%
| Uit / Standby | |
| Inactief | |
| Belasting |
|
Key:
min: | |
| Huawei MateBook 13 i7 i7-8565U, GeForce MX150, Samsung SSD PM981 MZVLB512HAJQ, IPS, 2160x1440, 13" | Dell XPS 13 9370 i7 UHD i5-8550U, UHD Graphics 620, Toshiba XG5 KXG50ZNV512G, IPS, 3840x2160, 13.3" | Apple MacBook Pro 13 2018 Touchbar i5 i5-8259U, Iris Plus Graphics 655, , IPS, 2560x1600, 13.3" | HP Spectre x360 13t-ae000 i5-8550U, UHD Graphics 620, Lite-On CA1-8D256-HP, IPS, 3840x2160, 13.3" | Lenovo Yoga C930-13IKB i5-8250U, UHD Graphics 620, SK hynix PC401 HFS256GD9TNG, IPS, 1920x1080, 13.9" | Huawei Matebook X Pro i5 i5-8250U, GeForce MX150, Samsung PM961 MZVLW256HEHP, IPS, 3000x2000, 13.9" | |
|---|---|---|---|---|---|---|
| Power Consumption | 6% | 8% | 1% | 17% | 6% | |
| Idle Minimum * (Watt) | 3.5 | 5 -43% | 2.3 34% | 5.9 -69% | 3.3 6% | 3.5 -0% |
| Idle Average * (Watt) | 7.5 | 8.3 -11% | 8.7 -16% | 9.8 -31% | 6.8 9% | 8.9 -19% |
| Idle Maximum * (Watt) | 12.4 | 8.8 29% | 12.2 2% | 10.6 15% | 9.5 23% | 12.3 1% |
| Load Average * (Watt) | 64.2 | 46.4 28% | 53.3 17% | 36.6 43% | 40.8 36% | 54.2 16% |
| Witcher 3 ultra * (Watt) | 52.5 | 42.4 19% | ||||
| Load Maximum * (Watt) | 65.7 | 48.6 26% | 64 3% | 34.3 48% | 57 13% | 52.1 21% |
* ... kleiner is beter
| Huawei MateBook 13 i7 i7-8565U, GeForce MX150, 41.7 Wh | Dell XPS 13 9370 i7 UHD i5-8550U, UHD Graphics 620, 52 Wh | Apple MacBook Pro 13 2018 Touchbar i5 i5-8259U, Iris Plus Graphics 655, 58 Wh | HP Spectre x360 13t-ae000 i5-8550U, UHD Graphics 620, 60 Wh | Lenovo Yoga C930-13IKB i5-8250U, UHD Graphics 620, 60 Wh | Huawei Matebook X Pro i5 i5-8250U, GeForce MX150, 57.4 Wh | |
|---|---|---|---|---|---|---|
| Batterijduur | 31% | 28% | 58% | 70% | 67% | |
| Reader / Idle (h) | 15.4 | 13.7 -11% | 23.9 55% | 20.7 34% | ||
| WiFi v1.3 (h) | 7.6 | 7.8 3% | 9.7 28% | 7.1 -7% | 9.2 21% | 9.3 22% |
| Load (h) | 0.9 | 1.8 100% | 2 122% | 2.1 133% | 2.2 144% | |
| Witcher 3 ultra (h) | 1.6 |
Pro
Contra
Dit is de verkorte versie van het originele artikel. Het volledige, Engelse testrapport vind je hier.
De MateBook 13 is iets lager geprijsd dan het MateBook X Pro vlaggenschip omdat het gericht is op een klasse lager. In de praktijk presteert het notebook echter beter dan de X Pro onderwijl superdun en aantrekkelijk blijvend. We hebben het ook niet over kleine verschillen doordat de MateBook 13 superieur throttling beheer heeft en een krachtiger GPU die gemiddeld 25 tot 30 procent sneller is. En dan is er ook nog het snellere Wi-Fi en betere webcam.
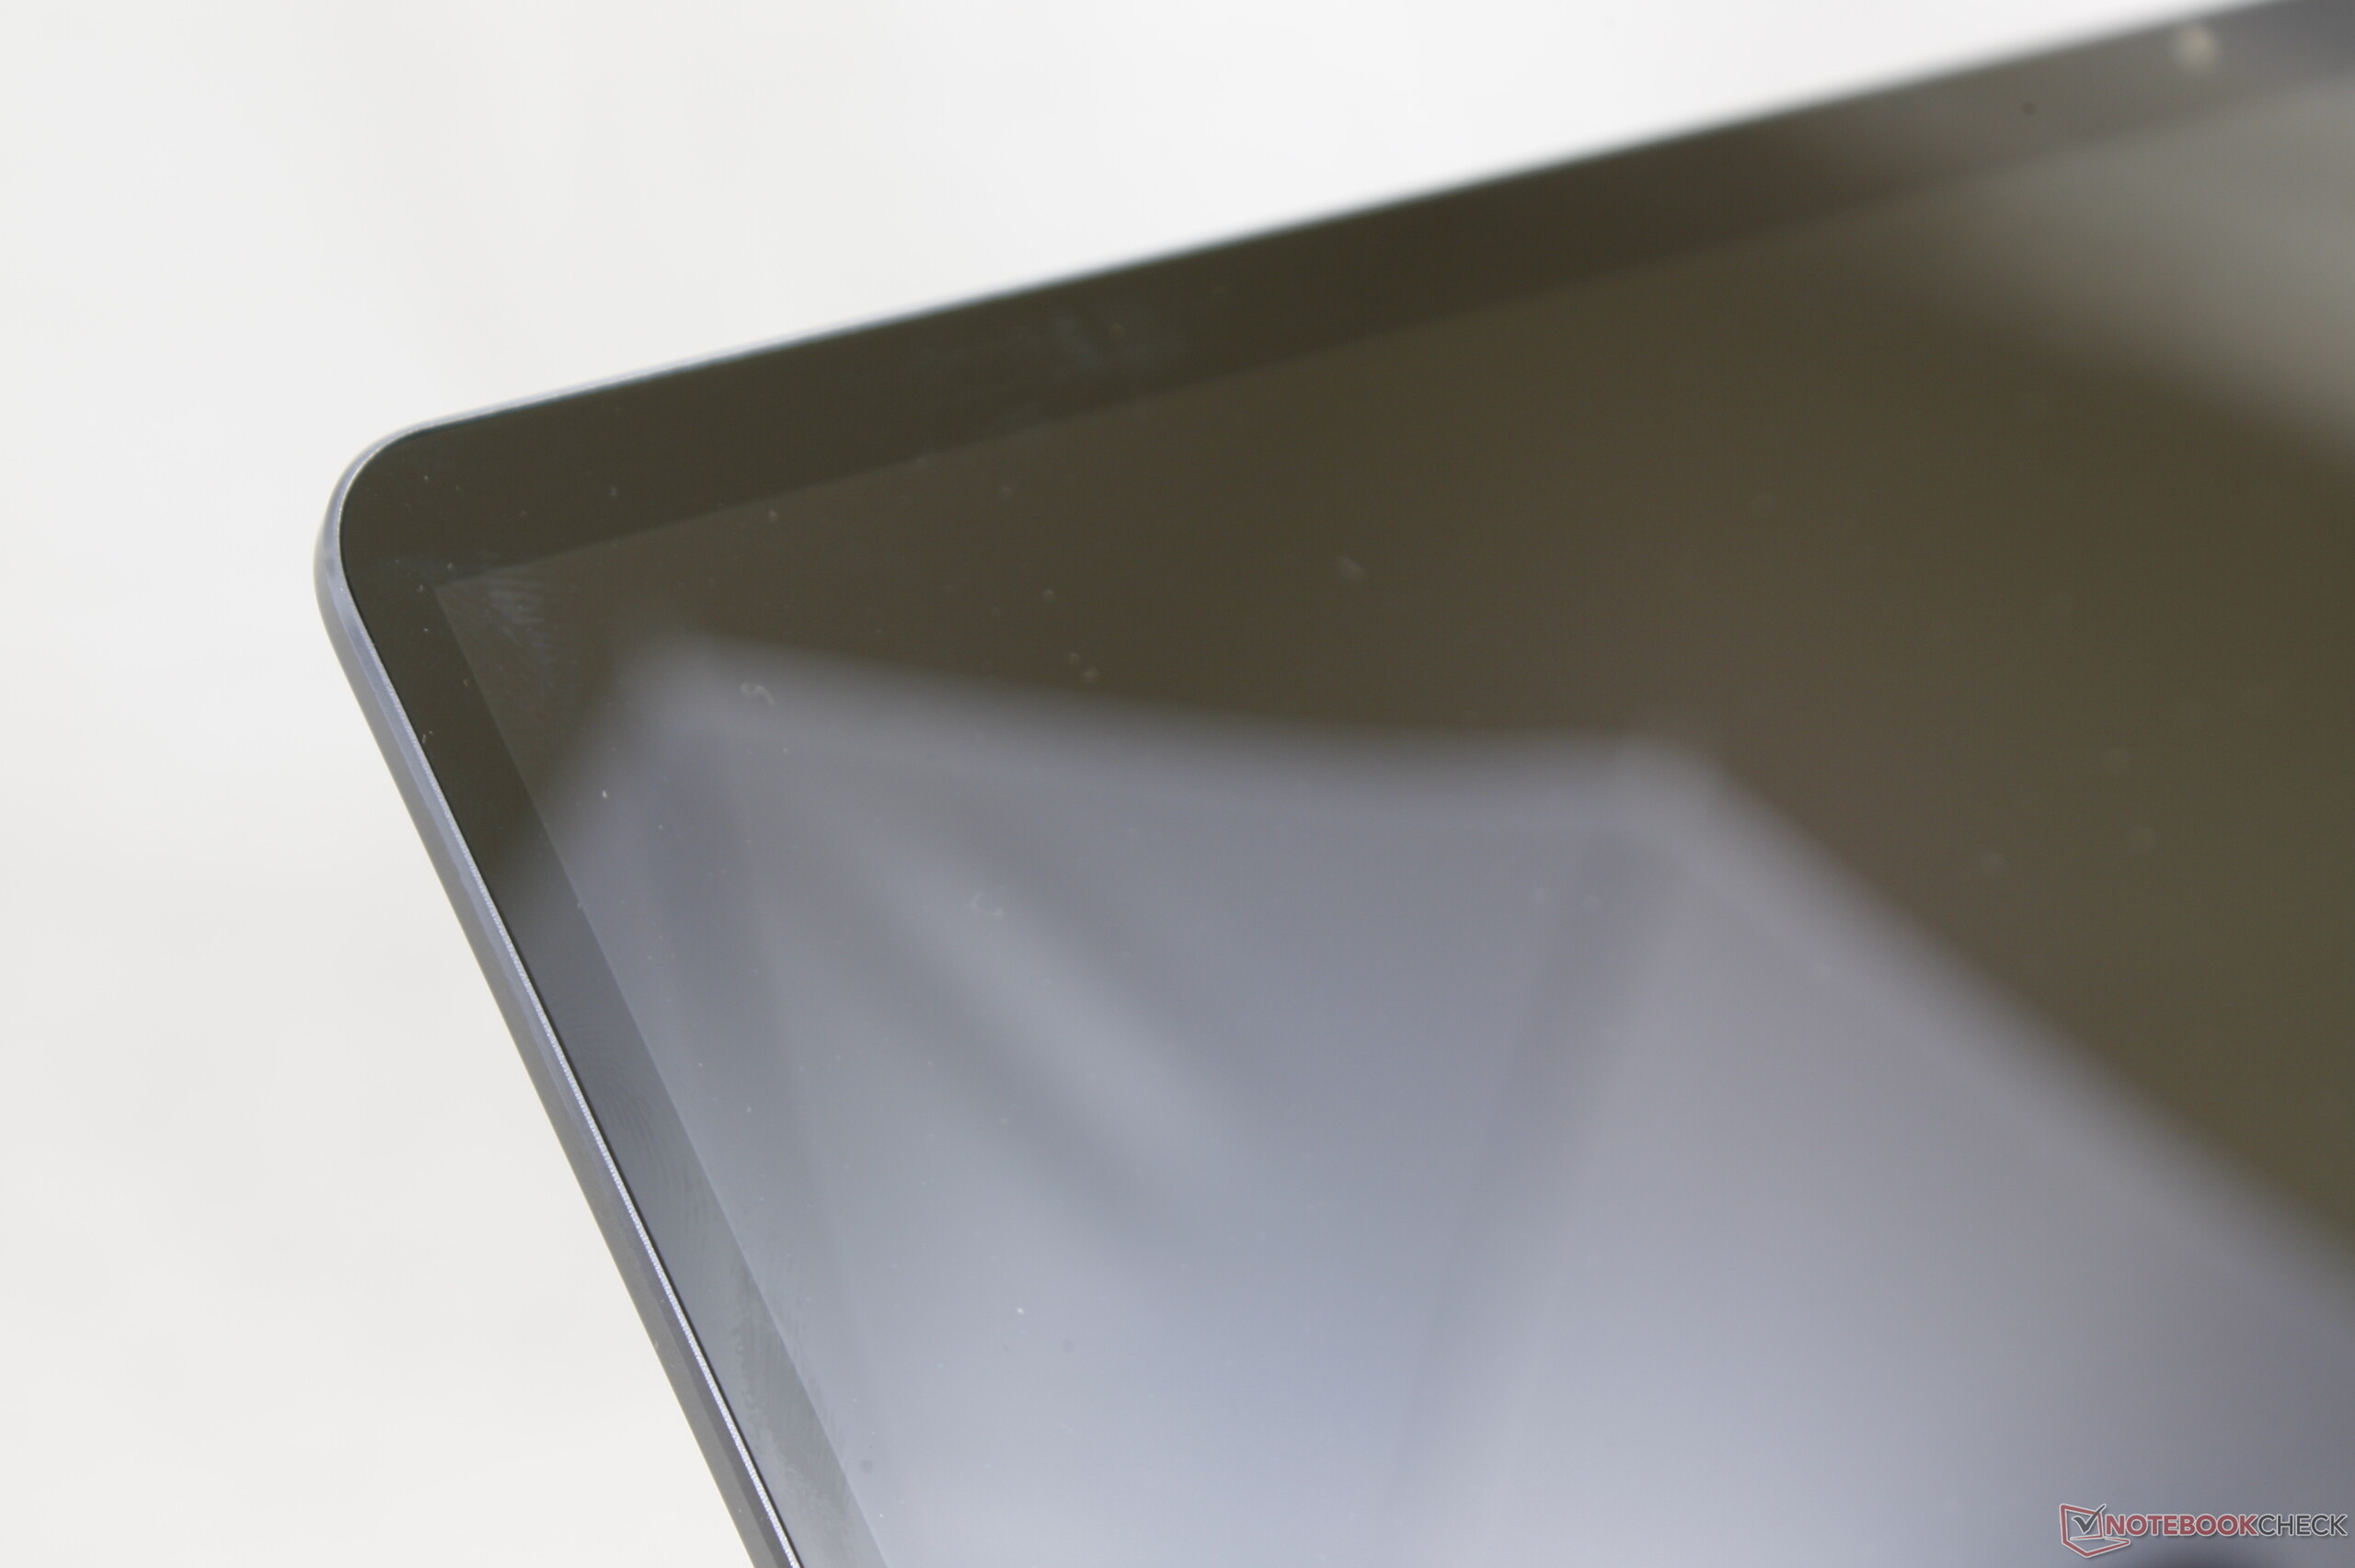
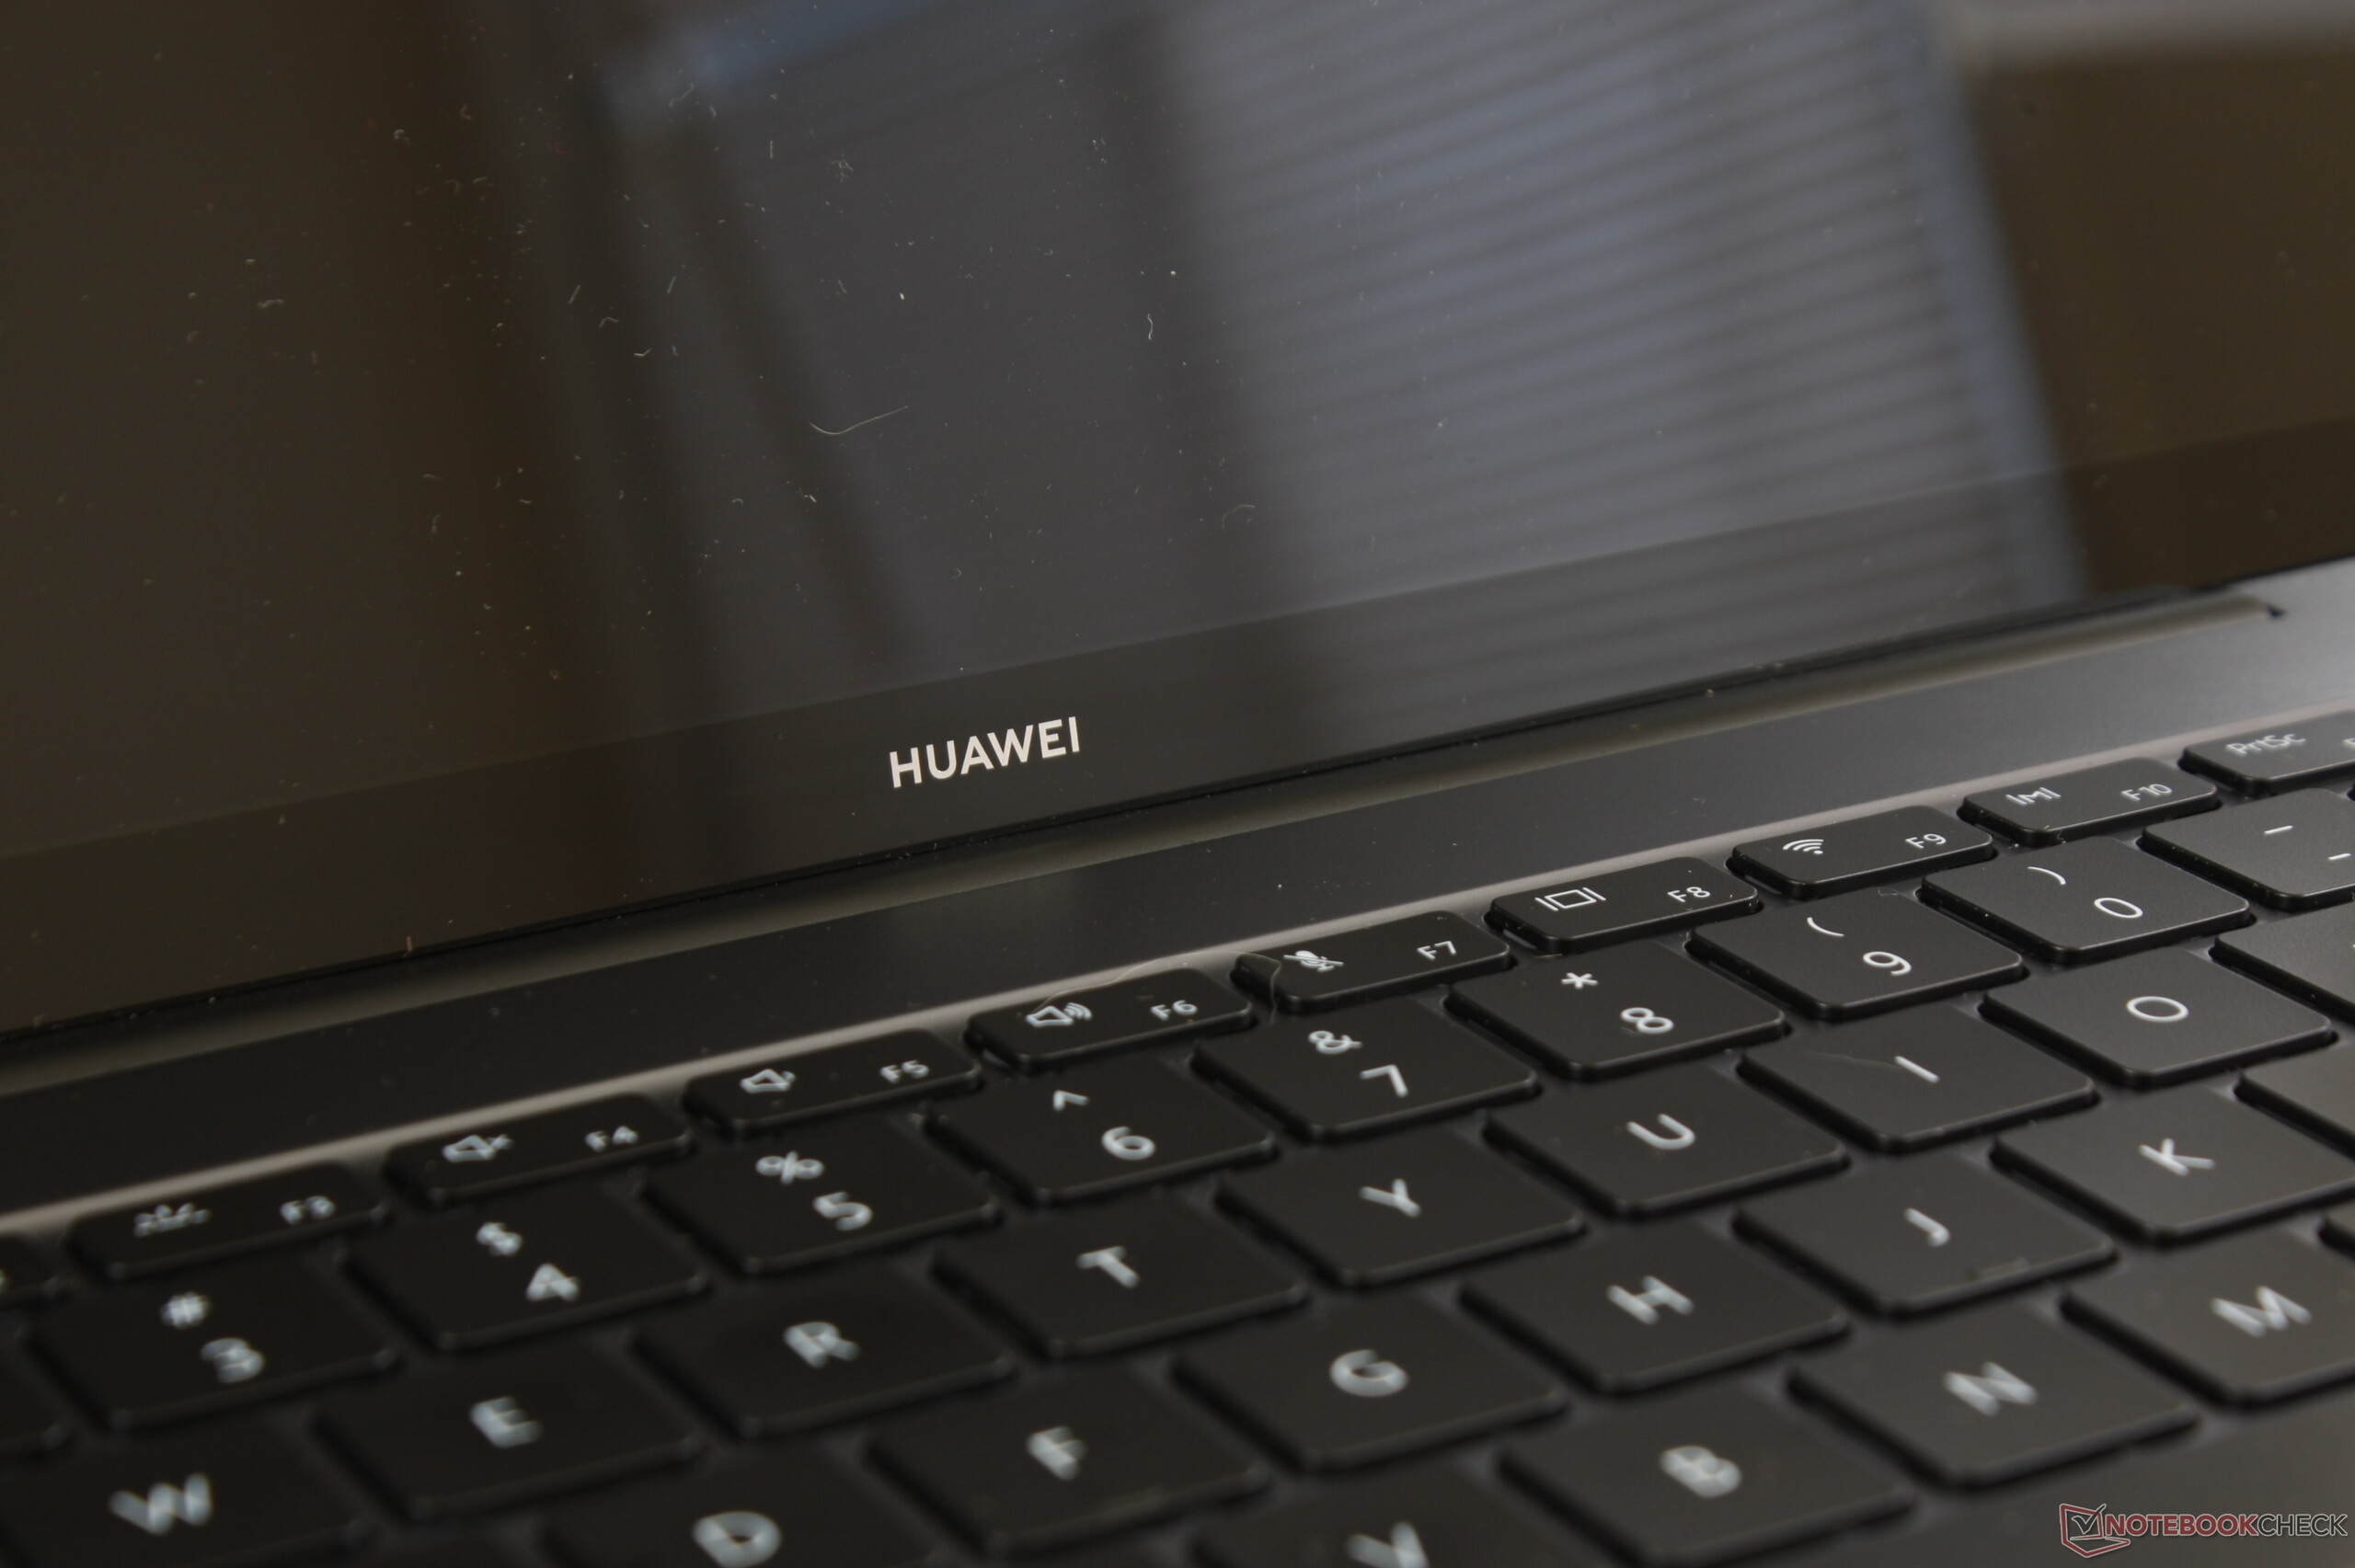
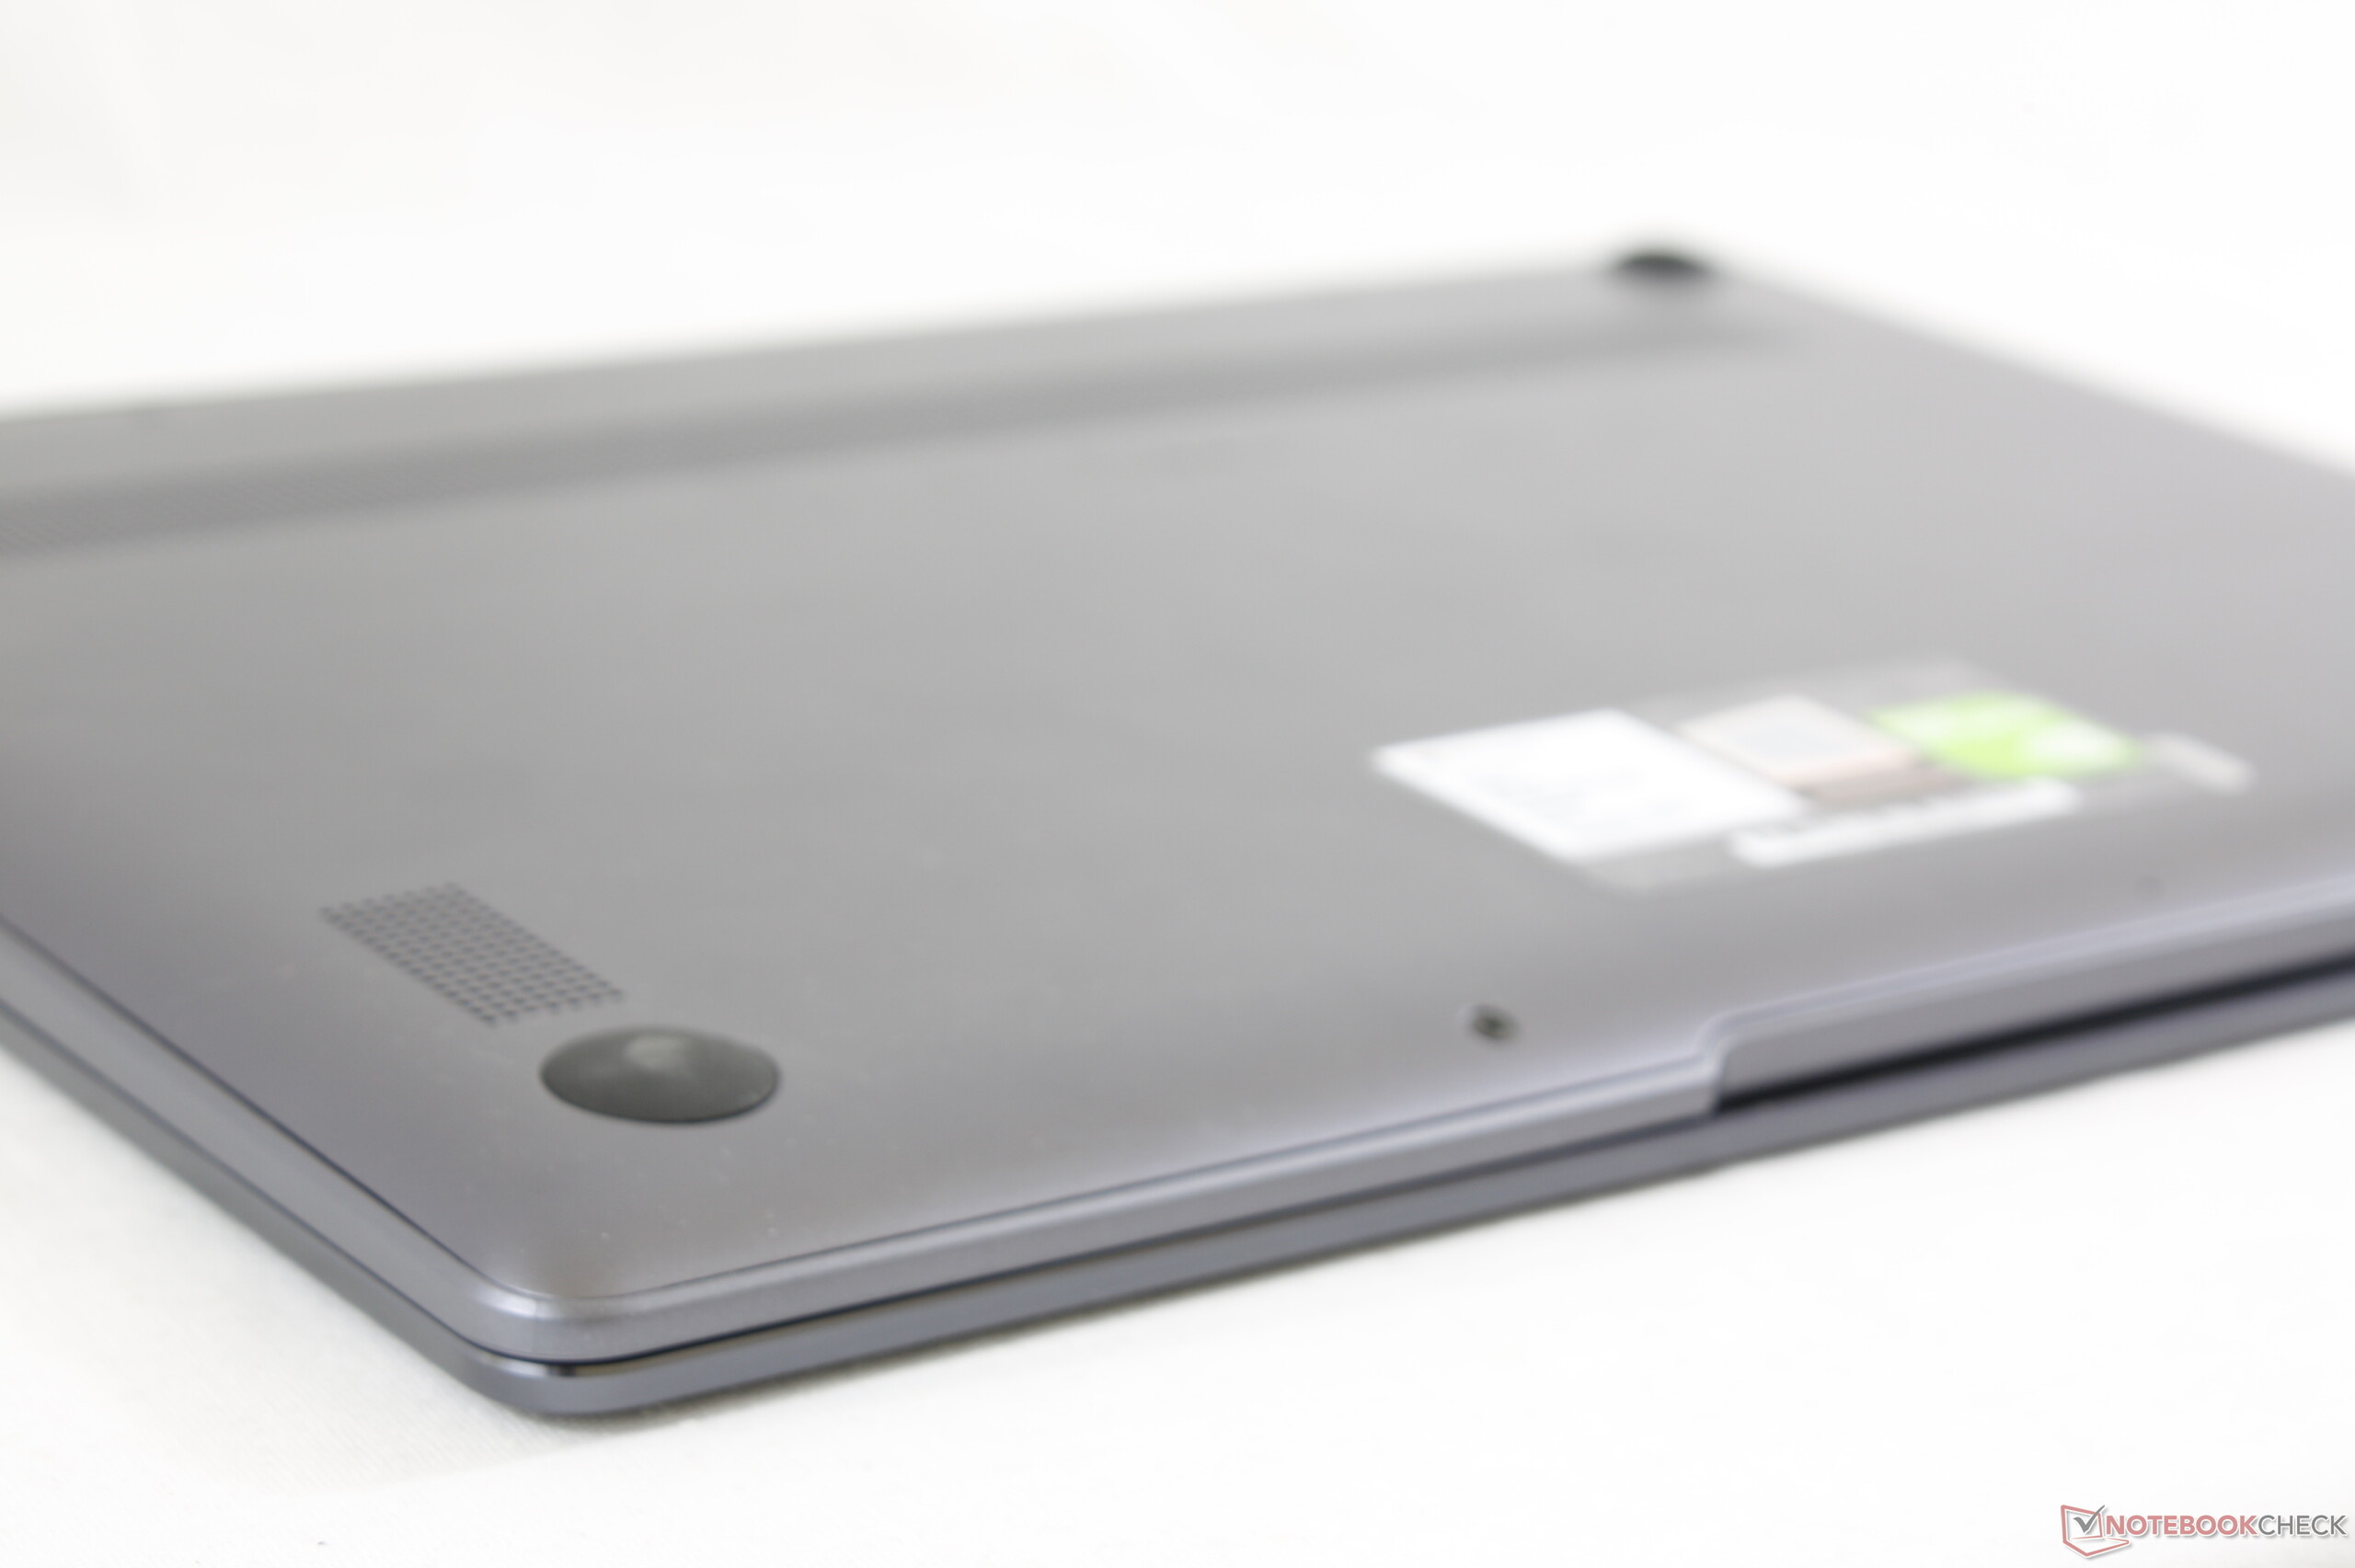
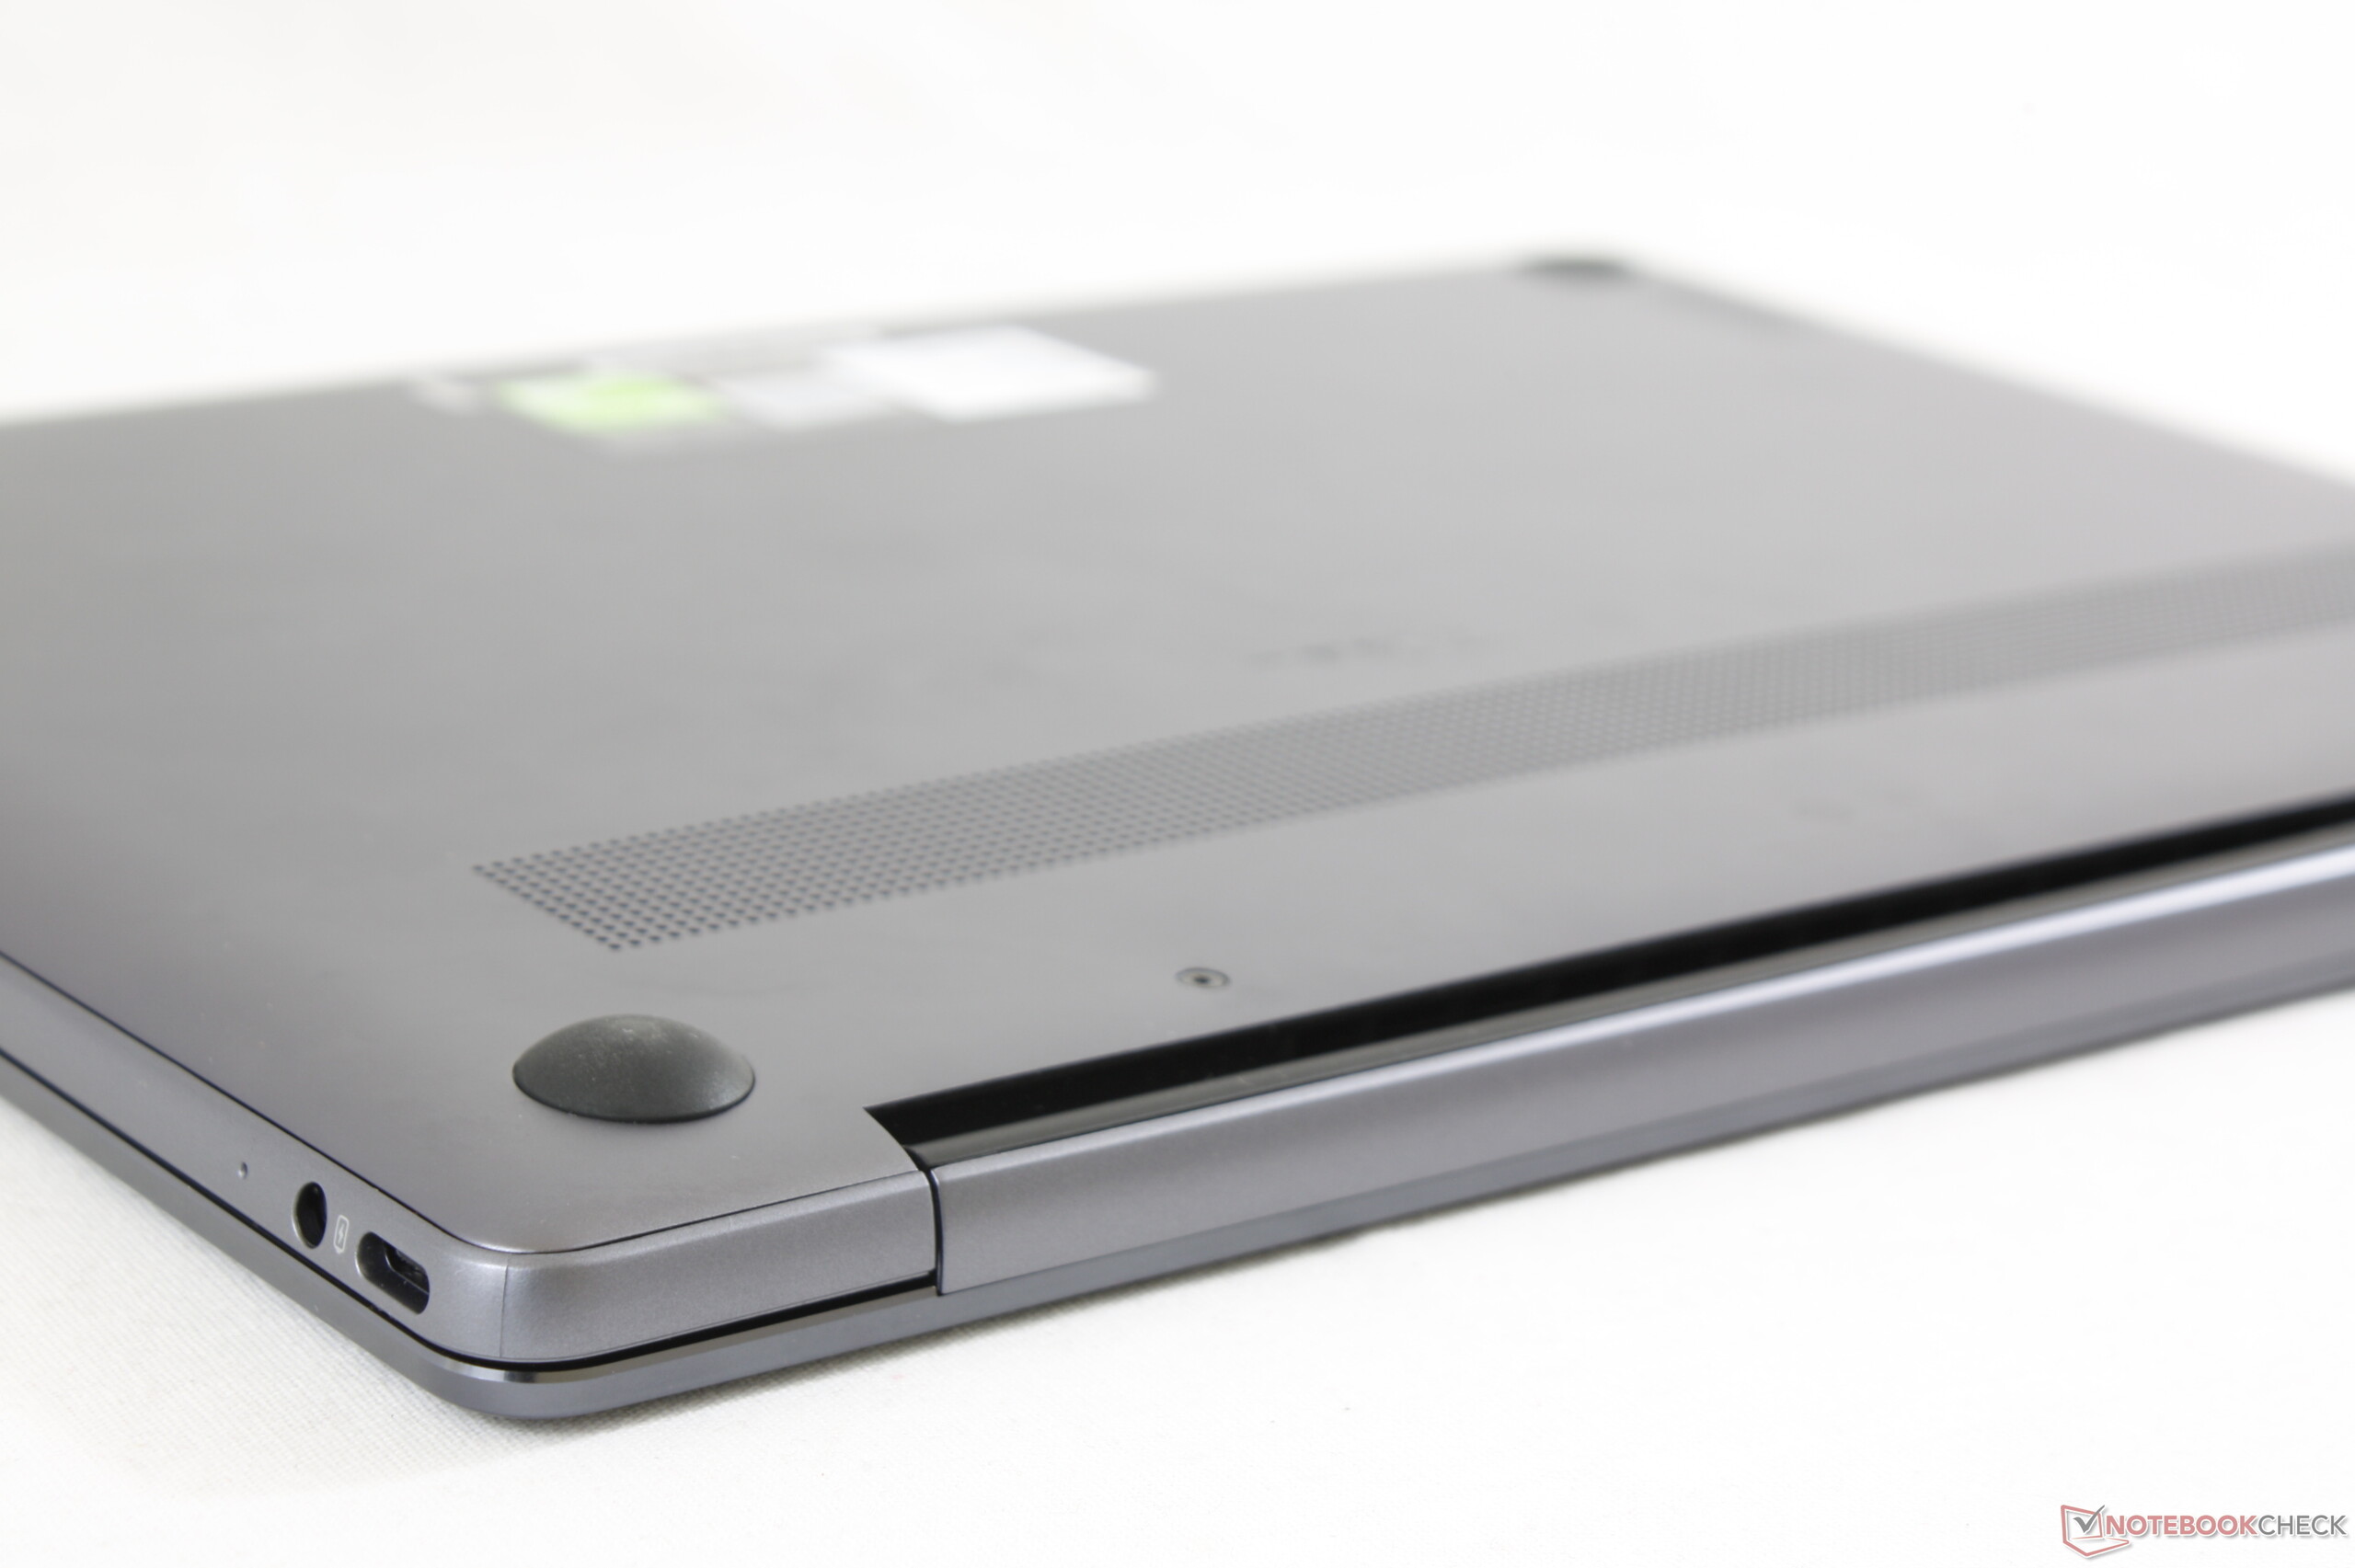
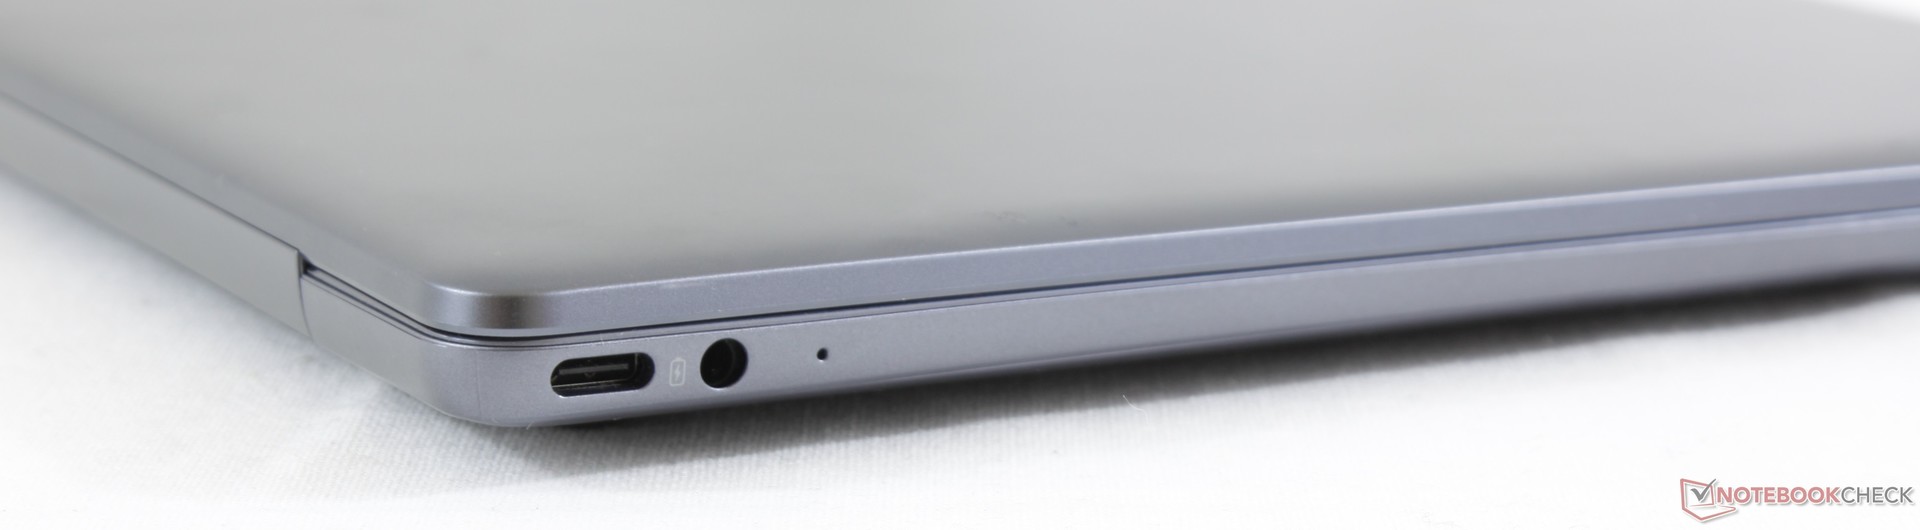
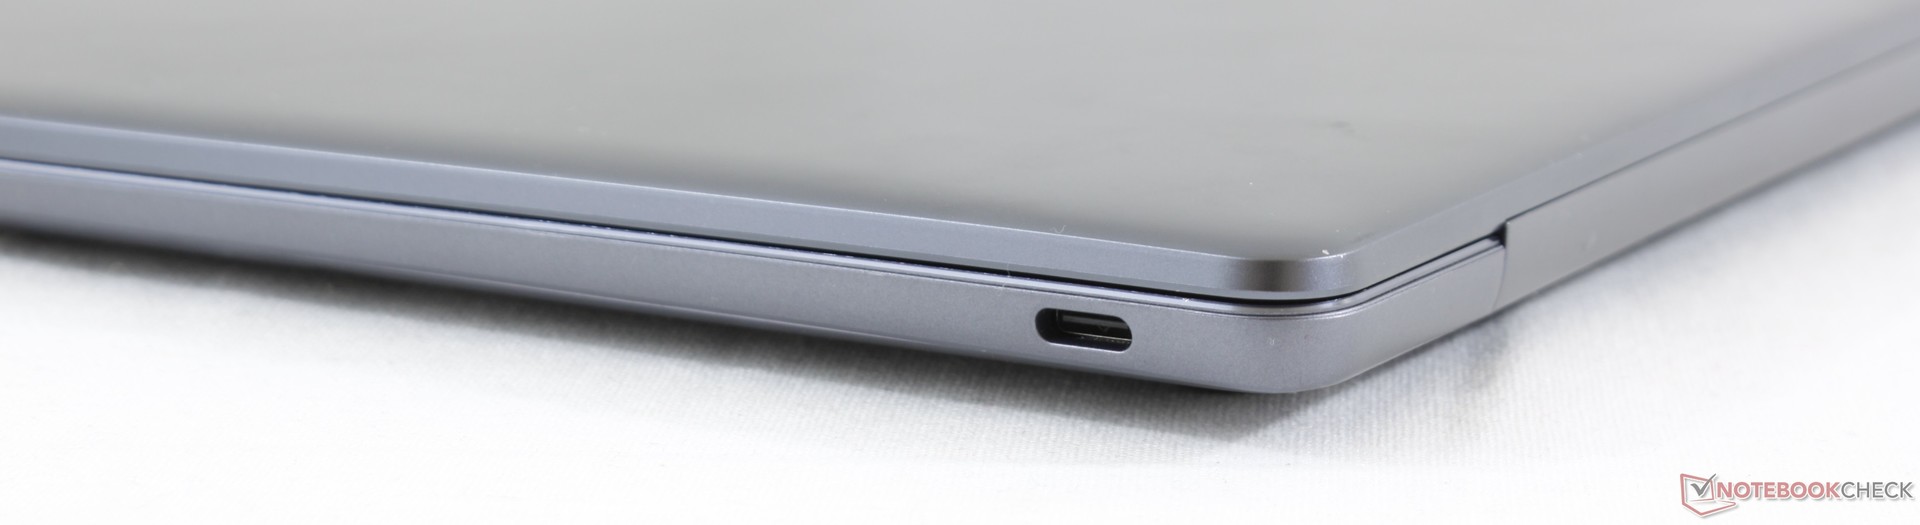
De voornaamste eigenschap die voorkomt dat de MateBook 13 op alle vlakken beter is dan de MateBook X Pro is het beeldscherm. Hoewel deze uitstekend is met goede kleurechtheid, is deze iets kleiner en dimmer, met een lager contrast en resolutie. De Pro versie heeft op al deze vlakken superieure scores. Andere nadelen van de MateBook 13 in vergelijking met zijn duurdere broer zijn de kleinere batterij, ontbreken van Thunderbolt 3 en het ontbreken van USB Type-A.
De MateBook 13 is een goede optie voor gebruikers die afknappen op de zwakkere grafische prestaties van populaire 13-inch Ultrabooks zoals de XPS 13, Spectre 13, Gram 13 of ZenBook 13. Als de krachtige GPU niet aantrekt, dan kunnen gebruikers beter kiezen voor de XPS 13 of Spectre 13, omdat deze steviger zijn, een bredere selectie poorten hebben en argumenteerbaar betere toetsenborden.
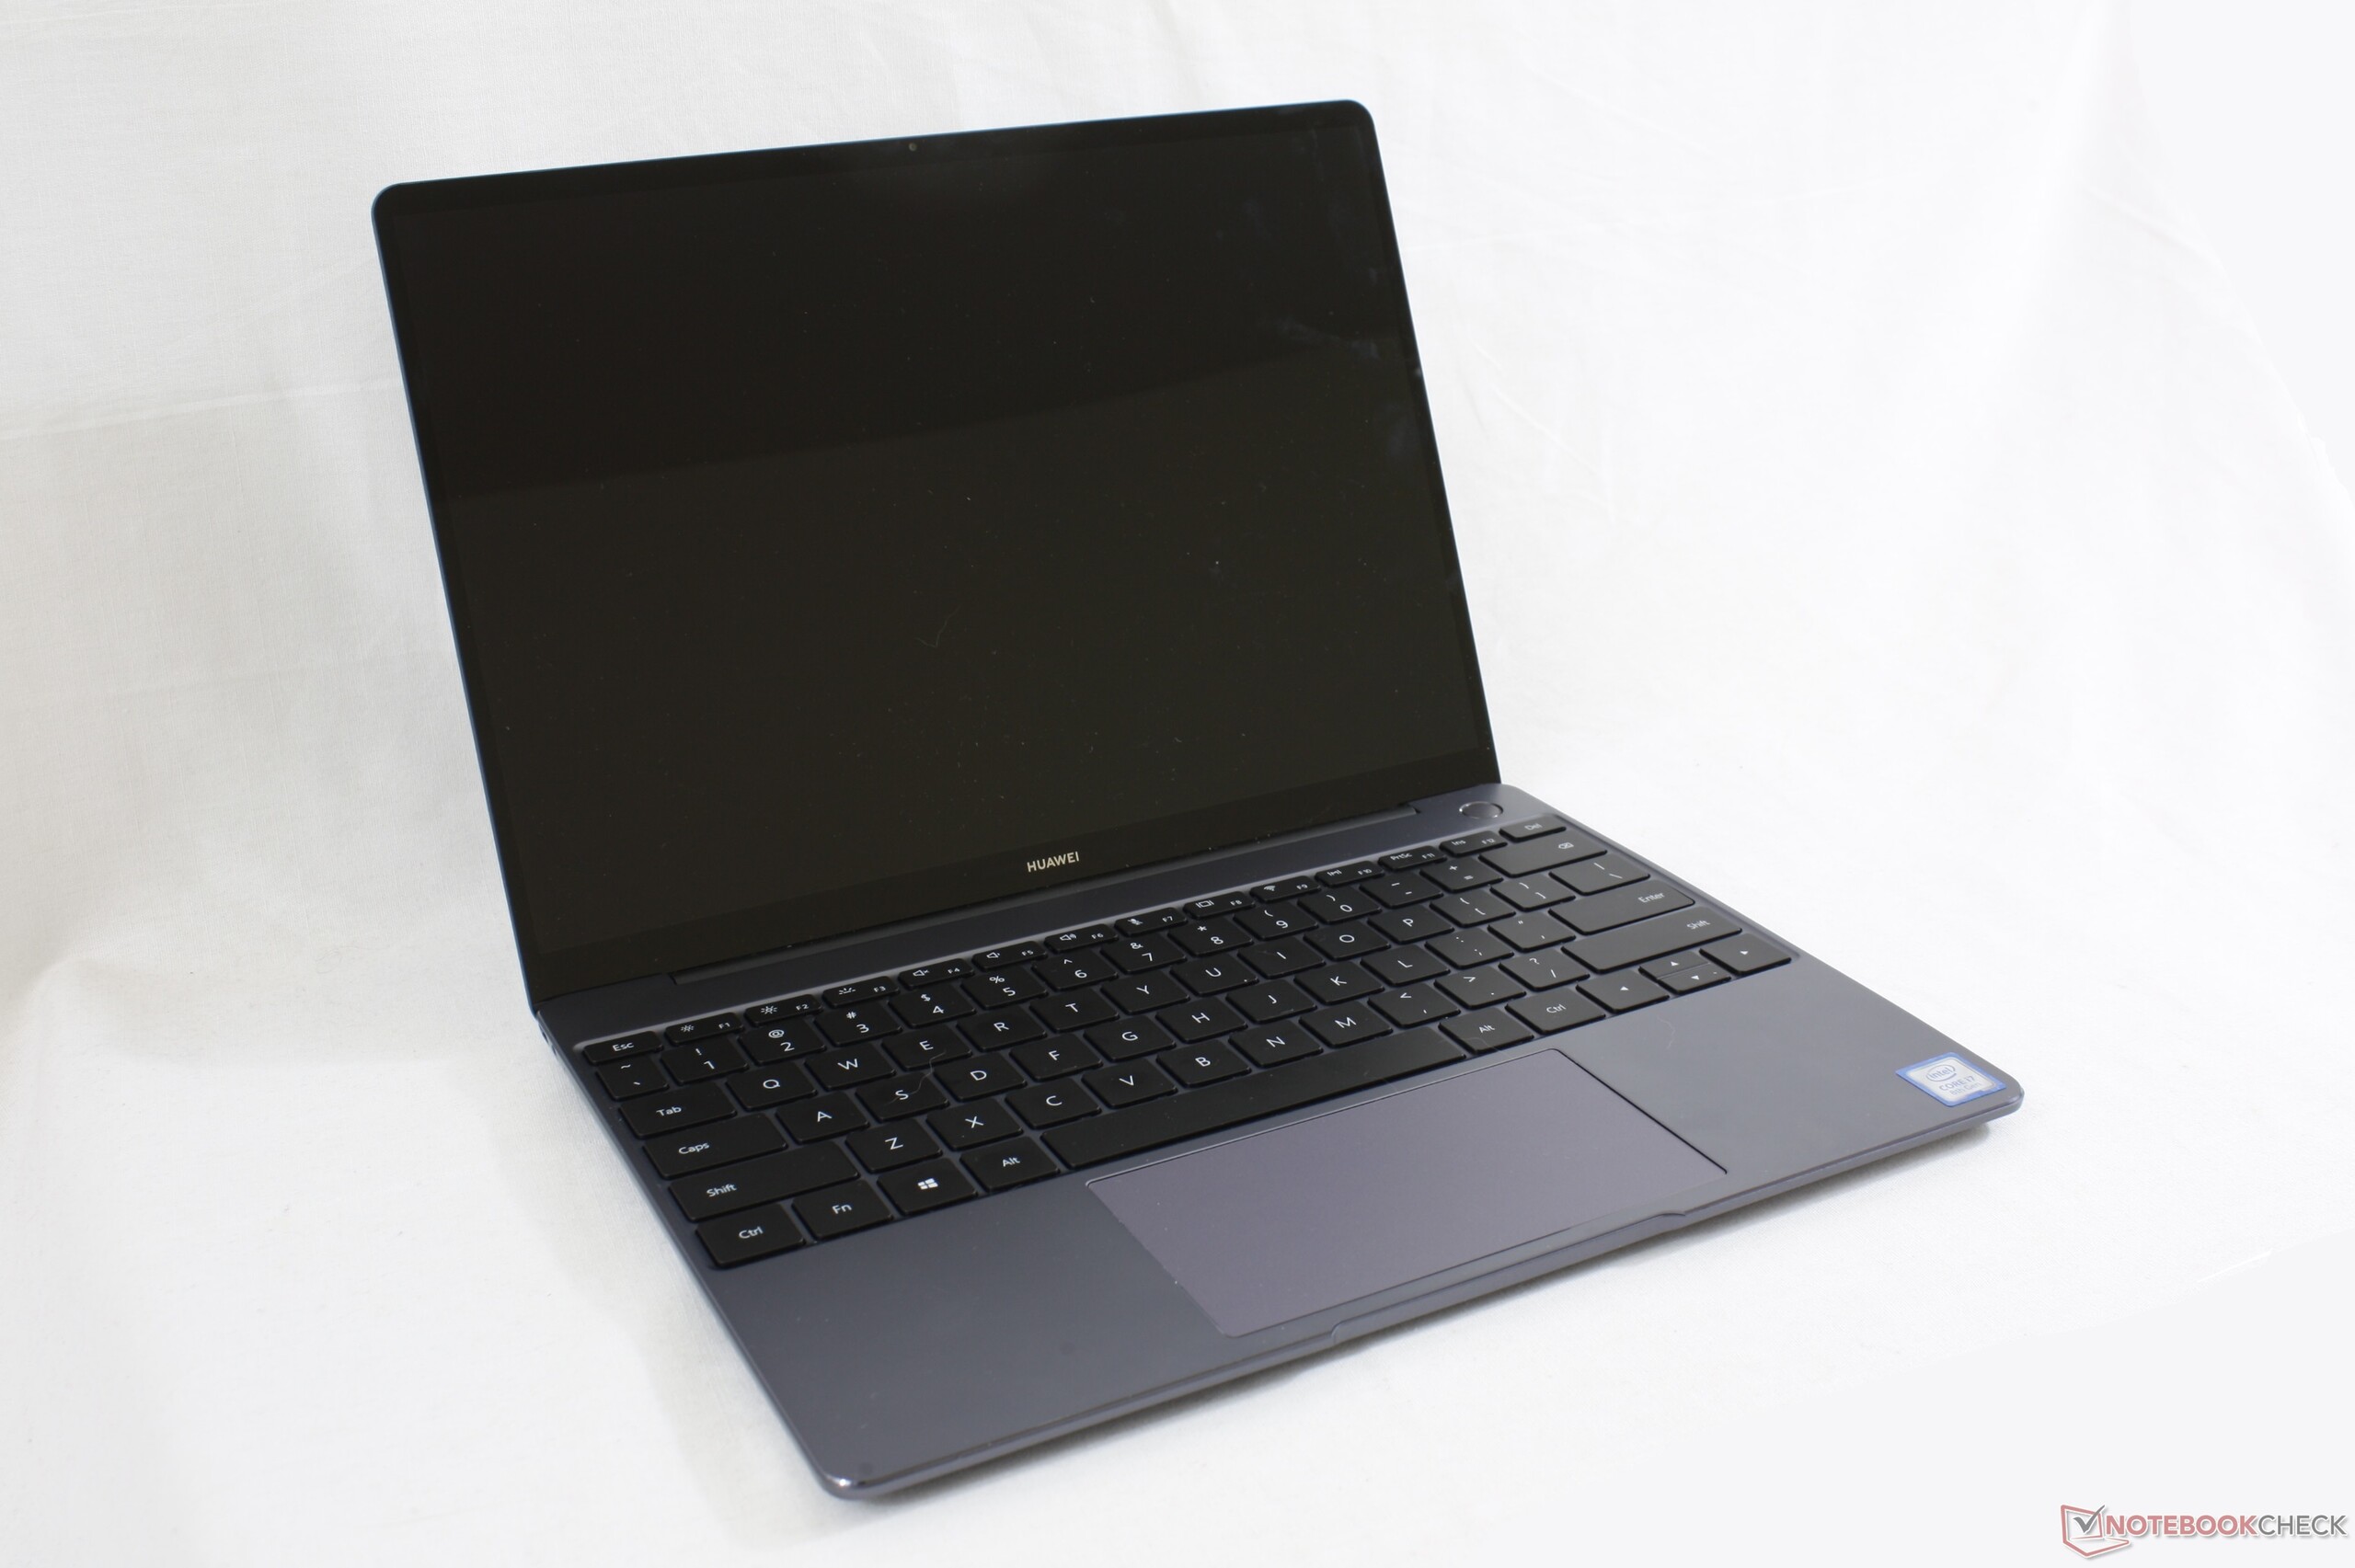
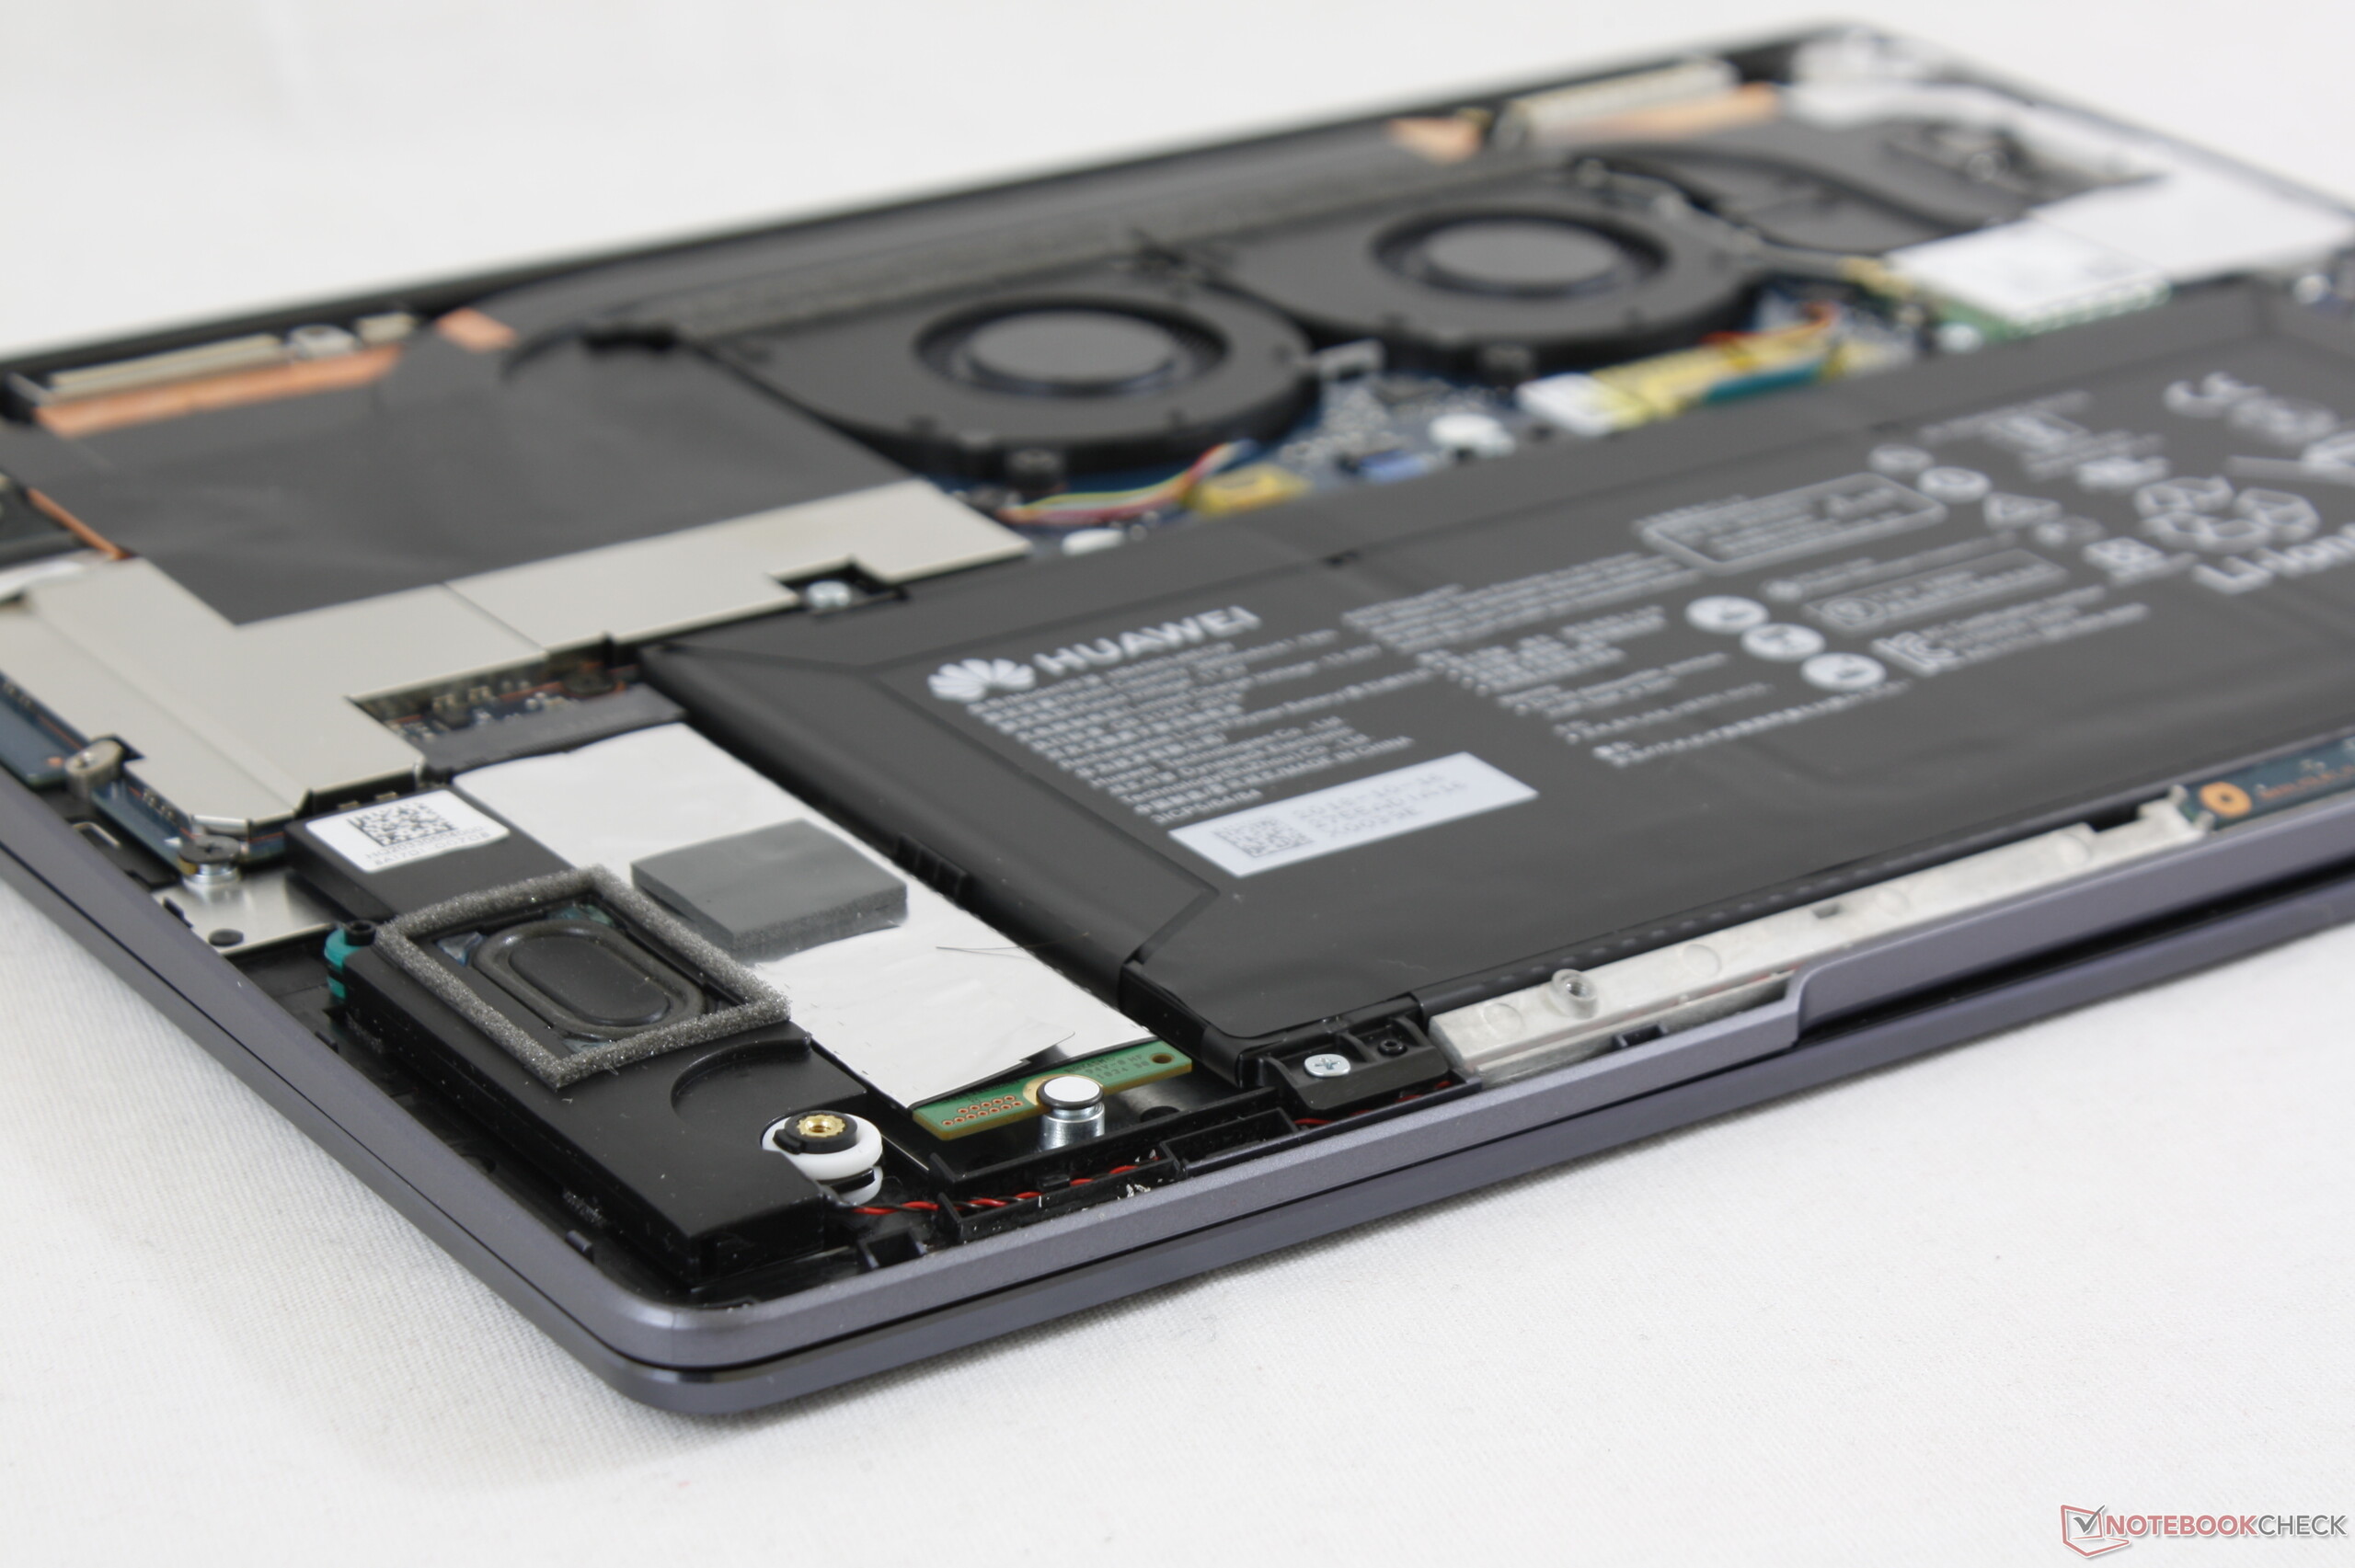
De enige Ultrabook tot nu toe met een 13-inch 3:2 beeldscherm en een volwaardige 25 watt GeForce MX150 voor game-waardige prestaties. De MateBook 13 heeft enorm veel rekenkracht voor zijn formaat die zowel gamers als traditionele Ultrabook gebruikers zullen kunnen waarderen.
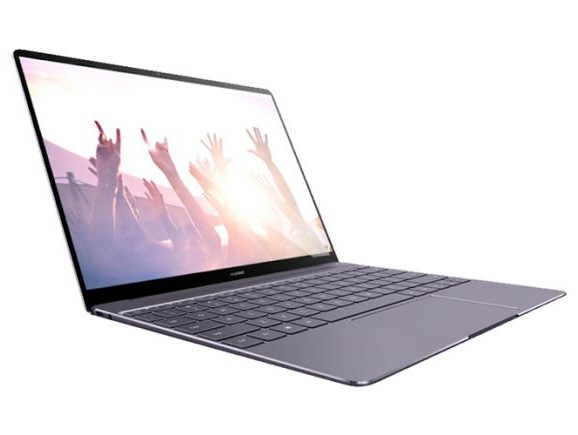
Huawei MateBook 13 i7
- 19-01-2019 v6 (old)
Allen Ngo
Price comparison
