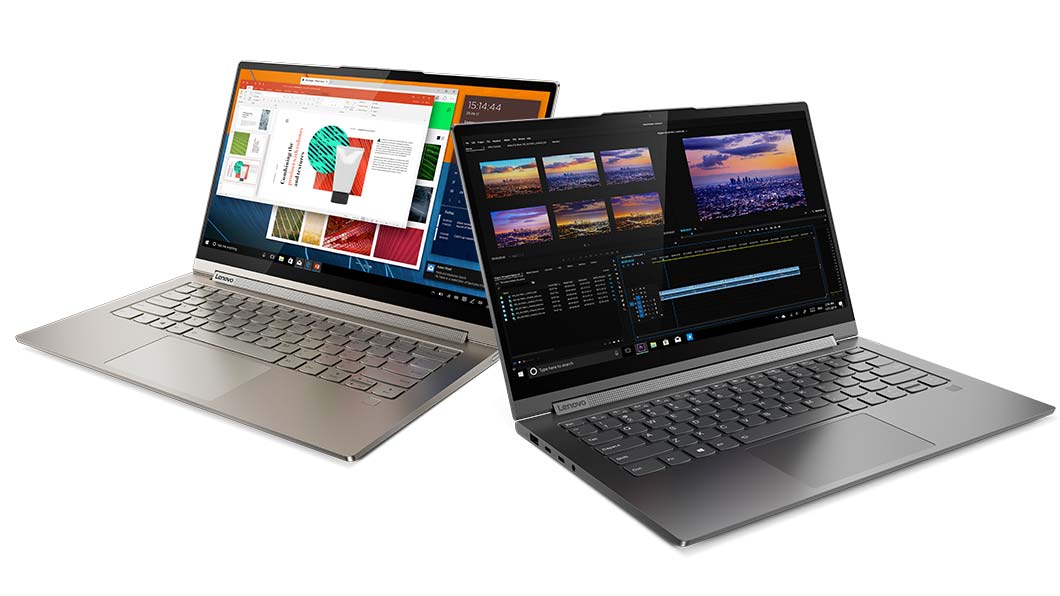
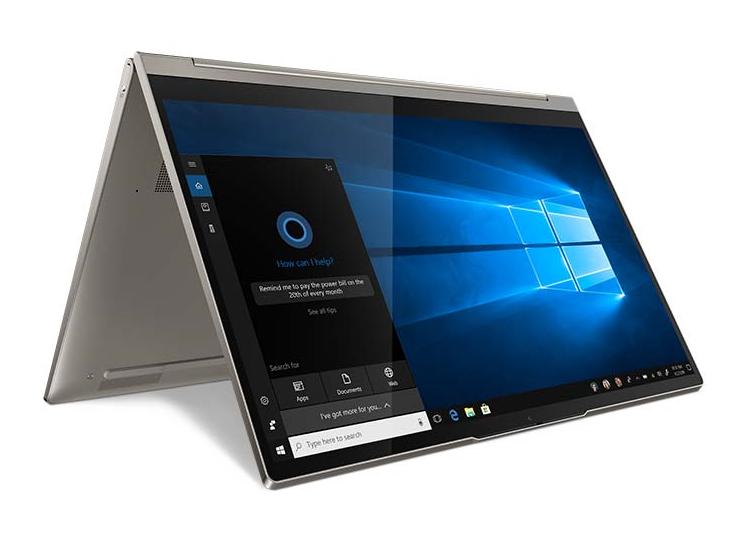
Kort testrapport Lenovo Yoga C940-14IIL: De 14-inch Top Consumenten Convertible
Evaluatie | Datum | Model | Gewicht | Hoogte | Formaat | Resolutie | Beste prijs |
|---|---|---|---|---|---|---|---|
| 87 % v7 (old) | 12-2019 | Lenovo Yoga C940-14IIL 81Q9 i7-1065G7, Iris Plus Graphics G7 (Ice Lake 64 EU) | 1.4 kg | 15.7 mm | 14.00" | 3840x2160 | |
| 86.3 % v7 (old) | 11-2019 | Dell XPS 13 7390 2-in-1 Core i7 i7-1065G7, Iris Plus Graphics G7 (Ice Lake 64 EU) | 1.3 kg | 13 mm | 13.40" | 1920x1200 | |
| 87.6 % v6 (old) | 06-2018 | Huawei Matebook X Pro i5 i5-8250U, GeForce MX150 | 1.3 kg | 14.6 mm | 13.90" | 3000x2000 | |
| 85.2 % v7 (old) | 11-2019 | MSI Prestige 15 A10SC i7-10710U, GeForce GTX 1650 Max-Q | 1.7 kg | 16 mm | 15.60" | 3840x2160 | |
| 86.3 % v7 (old) | 10-2019 | Razer Blade Stealth i7-1065G7 Iris Plus i7-1065G7, Iris Plus Graphics G7 (Ice Lake 64 EU) | 1.4 kg | 15.3 mm | 13.30" | 1920x1080 |
| Networking | |
| iperf3 transmit AX12 | |
| MSI Prestige 15 A10SC | |
| Lenovo Yoga C930-13IKB 81C4 | |
| Asus ZenBook S13 UX392FN | |
| iperf3 receive AX12 | |
| MSI Prestige 15 A10SC | |
| Asus ZenBook S13 UX392FN | |
| Lenovo Yoga C930-13IKB 81C4 | |
| |||||||||||||||||||||||||
Helderheidsverdeling: 82 %
Helderheid in Batterij-modus: 501.7 cd/m²
Contrast: 1568:1 (Zwart: 0.32 cd/m²)
ΔE ColorChecker Calman: 5.48 | ∀{0.5-29.43 Ø4.72}
calibrated: 2.22
ΔE Greyscale Calman: 8.1 | ∀{0.09-98 Ø4.97}
100% sRGB (Argyll 1.6.3 3D)
74.1% AdobeRGB 1998 (Argyll 1.6.3 3D)
83.3% AdobeRGB 1998 (Argyll 3D)
99.9% sRGB (Argyll 3D)
83.8% Display P3 (Argyll 3D)
Gamma: 2.07
CCT: 6730 K
| Lenovo Yoga C940-14IIL 81Q9 BOE HF NV140QUM-N54, IPS, 14", 3840x2160 | Lenovo Yoga C930-13IKB 81C4 AUO B139HAN03_0, IPS, 13.9", 1920x1080 | Lenovo Yoga C940-14IIL LP140WF9-SPE2, IPS LED, 14", 1920x1080 | Dell XPS 13 7390 2-in-1 Core i7 Sharp LQ134N1, IPS, 13.4", 1920x1200 | Razer Blade Stealth i7-1065G7 Iris Plus Sharp LQ133M1JW41, IPS, 13.3", 1920x1080 | Asus ZenBook S13 UX392FN Tianma XM, IPS, 13.9", 1920x1080 | |
|---|---|---|---|---|---|---|
| Display | -18% | -14% | -11% | -14% | -13% | |
| Display P3 Coverage (%) | 83.8 | 62.7 -25% | 66 -21% | 69.9 -17% | 66.2 -21% | 67.5 -19% |
| sRGB Coverage (%) | 99.9 | 92.6 -7% | 97.9 -2% | 99.2 -1% | 97.2 -3% | 95.8 -4% |
| AdobeRGB 1998 Coverage (%) | 83.3 | 64.7 -22% | 67.3 -19% | 71.5 -14% | 67.1 -19% | 69 -17% |
| Response Times | 15% | -11% | -7% | -12% | 2% | |
| Response Time Grey 50% / Grey 80% * (ms) | 44.4 ? | 34.4 ? 23% | 49.6 ? -12% | 47.6 ? -7% | 45.2 ? -2% | 47.2 ? -6% |
| Response Time Black / White * (ms) | 27.2 ? | 25.6 ? 6% | 30 ? -10% | 29.2 ? -7% | 33.2 ? -22% | 24.8 ? 9% |
| PWM Frequency (Hz) | 2500 ? | 22730 ? | ||||
| Screen | -25% | 19% | 19% | 20% | 16% | |
| Brightness middle (cd/m²) | 501.7 | 312 -38% | 384 -23% | 549.8 10% | 422.6 -16% | 466 -7% |
| Brightness (cd/m²) | 501 | 295 -41% | 363 -28% | 520 4% | 404 -19% | 462 -8% |
| Brightness Distribution (%) | 82 | 87 6% | 90 10% | 86 5% | 87 6% | 90 10% |
| Black Level * (cd/m²) | 0.32 | 0.43 -34% | 0.17 47% | 0.39 -22% | 0.35 -9% | 0.33 -3% |
| Contrast (:1) | 1568 | 726 -54% | 2259 44% | 1410 -10% | 1207 -23% | 1412 -10% |
| Colorchecker dE 2000 * | 5.48 | 7.6 -39% | 3.5 36% | 2.12 61% | 1.02 81% | 1.93 65% |
| Colorchecker dE 2000 max. * | 10.03 | 15.06 -50% | 5.5 45% | 3.66 64% | 3.06 69% | 4.26 58% |
| Colorchecker dE 2000 calibrated * | 2.22 | 1.96 12% | 1 55% | 1.37 38% | 0.95 57% | 1.99 10% |
| Greyscale dE 2000 * | 8.1 | 8.8 -9% | 4.6 43% | 2.6 68% | 1 88% | 1.7 79% |
| Gamma | 2.07 106% | 2.01 109% | 2.32 95% | 2.3 96% | 2.21 100% | 2.15 102% |
| CCT | 6730 97% | 6874 95% | 6884 94% | 6884 94% | 6502 100% | 6382 102% |
| Color Space (Percent of AdobeRGB 1998) (%) | 74.1 | 59.1 -20% | 62 -16% | 65.4 -12% | 62.1 -16% | 62.2 -16% |
| Color Space (Percent of sRGB) (%) | 100 | 92.3 -8% | 97.7 -2% | 99.7 0% | 97.1 -3% | 95.7 -4% |
| Totaal Gemiddelde (Programma / Instellingen) | -9% /
-19% | -2% /
9% | 0% /
10% | -2% /
9% | 2% /
9% |
* ... kleiner is beter
Responstijd Scherm
| ↔ Responstijd Zwart naar Wit | ||
|---|---|---|
| 27.2 ms ... stijging ↗ en daling ↘ gecombineerd | ↗ 15.6 ms stijging | 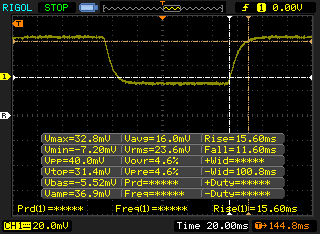 |
| ↘ 11.6 ms daling | ||
| Het scherm vertoonde relatief trage responstijden in onze tests en is misschien te traag voor games. Ter vergelijking: alle testtoestellen variëren van 0.1 (minimum) tot 240 (maximum) ms. » 69 % van alle toestellen zijn beter. Dit betekent dat de gemeten responstijd slechter is dan het gemiddelde (19.9 ms) van alle geteste toestellen. | ||
| ↔ Responstijd 50% Grijs naar 80% Grijs | ||
| 44.4 ms ... stijging ↗ en daling ↘ gecombineerd | ↗ 22.4 ms stijging | 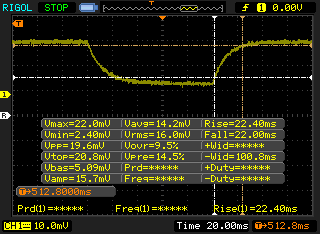 |
| ↘ 22 ms daling | ||
| Het scherm vertoonde trage responstijden in onze tests en is misschien te traag voor games. Ter vergelijking: alle testtoestellen variëren van 0.165 (minimum) tot 636 (maximum) ms. » 76 % van alle toestellen zijn beter. Dit betekent dat de gemeten responstijd slechter is dan het gemiddelde (31.1 ms) van alle geteste toestellen. | ||
Screen Flickering / PWM (Pulse-Width Modulation)
| Screen flickering / PWM niet waargenomen | 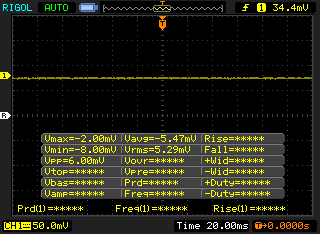 | ||
Ter vergelijking: 52 % van alle geteste toestellen maakten geen gebruik van PWM om de schermhelderheid te verlagen. Als het wel werd gebruikt, werd een gemiddelde van 7784 (minimum: 5 - maximum: 343500) Hz waargenomen. | |||
| Cinebench R20 | |
| CPU (Single Core) | |
| MSI Prestige 15 A10SC | |
| Lenovo Yoga C940-14IIL 81Q9 | |
| Gemiddeld Intel Core i7-1065G7 (358 - 474, n=31) | |
| MSI PS63 Modern 8SC | |
| Lenovo Yoga C940-15IRH | |
| Lenovo Legion Y540-17IRH | |
| Dell G5 15 5590 | |
| Dell XPS 13 7390 2-in-1 Core i3 | |
| Lenovo ThinkPad L590-20Q70019GE | |
| Dynabook Portege A30-E-174 | |
| Dell Latitude 14 5495 | |
| Dell Latitude 13 3390 | |
| Dell Inspiron 15 5000 5585 | |
| CPU (Multi Core) | |
| Dell G5 15 5590 | |
| Lenovo Yoga C940-15IRH | |
| MSI Prestige 15 A10SC | |
| Lenovo Legion Y540-17IRH | |
| Lenovo Yoga C940-14IIL 81Q9 | |
| MSI PS63 Modern 8SC | |
| Gemiddeld Intel Core i7-1065G7 (1081 - 2024, n=31) | |
| Dell Inspiron 15 5000 5585 | |
| Dell Latitude 14 5495 | |
| Lenovo ThinkPad L590-20Q70019GE | |
| Dynabook Portege A30-E-174 | |
| Dell Latitude 13 3390 | |
| Dell XPS 13 7390 2-in-1 Core i3 | |
| Cinebench R15 | |
| CPU Single 64Bit | |
| MSI Prestige 15 A10SC | |
| Lenovo Yoga C940-15IRH | |
| MSI PS63 Modern 8SC | |
| Lenovo Yoga C940-14IIL 81Q9 | |
| Gemiddeld Intel Core i7-1065G7 (141 - 190, n=35) | |
| Lenovo Legion Y540-17IRH | |
| Dell G5 15 5590 | |
| Lenovo ThinkPad L590-20Q70019GE | |
| Dell XPS 13 7390 2-in-1 Core i3 | |
| Dynabook Portege A30-E-174 | |
| Dell Latitude 14 5495 | |
| Dell Latitude 13 3390 | |
| Dell Inspiron 15 5000 5585 | |
| CPU Multi 64Bit | |
| Lenovo Yoga C940-15IRH | |
| Dell G5 15 5590 | |
| MSI Prestige 15 A10SC | |
| Lenovo Legion Y540-17IRH | |
| Lenovo Yoga C940-14IIL 81Q9 | |
| MSI PS63 Modern 8SC | |
| Dell Inspiron 15 5000 5585 | |
| Dell Latitude 14 5495 | |
| Gemiddeld Intel Core i7-1065G7 (288 - 836, n=36) | |
| Dell Latitude 13 3390 | |
| Lenovo ThinkPad L590-20Q70019GE | |
| Dynabook Portege A30-E-174 | |
| Dell XPS 13 7390 2-in-1 Core i3 | |
| Cinebench R10 | |
| Rendering Multiple CPUs 32Bit | |
| Dell G5 15 5590 | |
| Lenovo Legion Y540-17IRH | |
| Gemiddeld Intel Core i7-1065G7 (16551 - 26481, n=4) | |
| Dynabook Portege A30-E-174 | |
| Dell XPS 13 7390 2-in-1 Core i3 | |
| Rendering Single 32Bit | |
| Gemiddeld Intel Core i7-1065G7 (7083 - 7390, n=4) | |
| Dell XPS 13 7390 2-in-1 Core i3 | |
| Lenovo Legion Y540-17IRH | |
| Dell G5 15 5590 | |
| Dynabook Portege A30-E-174 | |
| wPrime 2.10 - 1024m | |
| Dell XPS 13 7390 2-in-1 Core i3 | |
| Gemiddeld Intel Core i7-1065G7 (233 - 354, n=3) | |
* ... kleiner is beter
| PCMark 8 Home Score Accelerated v2 | 3448 punten | |
| PCMark 8 Work Score Accelerated v2 | 4382 punten | |
| PCMark 10 Score | 4633 punten | |
Help | ||
| Lenovo Yoga C940-14IIL 81Q9 Samsung PM981a MZVLB1T0HBLR | Lenovo Yoga C930-13IKB 81C4 SK hynix PC401 HFS256GD9TNG | Lenovo Yoga C940-14IIL Samsung SSD PM981 MZVLB512HAJQ | Dell XPS 13 7390 2-in-1 Core i7 Toshiba BG4 KBG40ZPZ512G | Razer Blade Stealth i7-1065G7 Iris Plus Samsung SSD PM981 MZVLB256HAHQ | Asus ZenBook S13 UX392FN WDC PC SN520 SDAPNUW-512G | |
|---|---|---|---|---|---|---|
| AS SSD | -162% | 3% | -74% | -45% | -15% | |
| Seq Read (MB/s) | 2213 | 1228 -45% | 2525 14% | 1801 -19% | 1989 -10% | 1224 -45% |
| Seq Write (MB/s) | 1401 | 544 -61% | 1253 -11% | 1125 -20% | 827 -41% | 907 -35% |
| 4K Read (MB/s) | 55.2 | 39.16 -29% | 59.1 7% | 39.7 -28% | 40.12 -27% | 41.46 -25% |
| 4K Write (MB/s) | 130.3 | 106.5 -18% | 134.1 3% | 67 -49% | 135.1 4% | 126.2 -3% |
| 4K-64 Read (MB/s) | 878 | 466.4 -47% | 1010 15% | 1253 43% | 531 -40% | 1021 16% |
| 4K-64 Write (MB/s) | 1478 | 305.1 -79% | 1461 -1% | 209 -86% | 309.9 -79% | 1251 -15% |
| Access Time Read * (ms) | 0.036 | 0.46 -1178% | 0.052 -44% | 0.069 -92% | 0.085 -136% | 0.053 -47% |
| Access Time Write * (ms) | 0.086 | 0.51 -493% | 0.029 66% | 0.625 -627% | 0.09 -5% | 0.027 69% |
| Score Read (Points) | 1154 | 628 -46% | 1322 15% | 1472 28% | 770 -33% | 1185 3% |
| Score Write (Points) | 1748 | 466 -73% | 1721 -2% | 388 -78% | 528 -70% | 1468 -16% |
| Score Total (Points) | 3467 | 1394 -60% | 3670 6% | 2583 -25% | 1644 -53% | 3250 -6% |
| Copy ISO MB/s (MB/s) | 2161 | 628 -71% | 2016 -7% | 1293 -40% | 1418 -34% | 1404 -35% |
| Copy Program MB/s (MB/s) | 572 | 540 -6% | 542 -5% | 560 -2% | 382.7 -33% | 402.4 -30% |
| Copy Game MB/s (MB/s) | 1433 | 533 -63% | 1278 -11% | 927 -35% | 334.2 -77% | 902 -37% |
* ... kleiner is beter

| 3DMark 11 Performance | 4950 punten | |
| 3DMark Ice Storm Standard Score | 58009 punten | |
| 3DMark Cloud Gate Standard Score | 12842 punten | |
| 3DMark Fire Strike Score | 2792 punten | |
| 3DMark Time Spy Score | 934 punten | |
Help | ||
| Shadow of the Tomb Raider - 1280x720 Lowest Preset | |
| Acer Nitro 5 AN515-42-R6V0 | |
| Acer Aspire 5 A515-52G-723L | |
| Dell Inspiron 15 5000 5585 | |
| Gemiddeld Intel Iris Plus Graphics G7 (Ice Lake 64 EU) (15.6 - 33, n=13) | |
| Lenovo Yoga C940-14IIL 81Q9 | |
| Dell XPS 13 7390 Core i7-10710U | |
| lage | gem. | hoge | ultra | |
|---|---|---|---|---|
| BioShock Infinite (2013) | 104.2 | 68.3 | 59.9 | 22.1 |
| The Witcher 3 (2015) | 52.7 | 36.3 | 19.6 | 9.9 |
| Rocket League (2017) | 119 | 68.5 | 44.3 | |
| Shadow of the Tomb Raider (2018) | 26 |
| Lenovo Yoga C940-14IIL 81Q9 Iris Plus Graphics G7 (Ice Lake 64 EU), i7-1065G7, Samsung PM981a MZVLB1T0HBLR | MSI Prestige 15 A10SC GeForce GTX 1650 Max-Q, i7-10710U, Samsung SSD PM981 MZVLB1T0HALR | Asus ZenBook S13 UX392FN GeForce MX150, i7-8565U, WDC PC SN520 SDAPNUW-512G | Lenovo Yoga C930-13IKB 81C4 UHD Graphics 620, i5-8550U, SK hynix PC401 HFS256GD9TNG | Razer Blade Stealth i7-1065G7 Iris Plus Iris Plus Graphics G7 (Ice Lake 64 EU), i7-1065G7, Samsung SSD PM981 MZVLB256HAHQ | Dell XPS 13 7390 2-in-1 Core i7 Iris Plus Graphics G7 (Ice Lake 64 EU), i7-1065G7, Toshiba BG4 KBG40ZPZ512G | |
|---|---|---|---|---|---|---|
| Noise | -3% | -4% | 2% | -1% | -1% | |
| uit / omgeving * (dB) | 28.5 | 29.3 -3% | 28.1 1% | 27.9 2% | 28.3 1% | 28.1 1% |
| Idle Minimum * (dB) | 28.5 | 30.1 -6% | 28.1 1% | 27.9 2% | 28.3 1% | 28.1 1% |
| Idle Average * (dB) | 28.5 | 30.2 -6% | 28.1 1% | 27.9 2% | 28.3 1% | 28.1 1% |
| Idle Maximum * (dB) | 29 | 30.2 -4% | 29 -0% | 29.3 -1% | 28.3 2% | 28.1 3% |
| Load Average * (dB) | 33 | 31.5 5% | 41.1 -25% | 32 3% | 33.5 -2% | 31.7 4% |
| Witcher 3 ultra * (dB) | 40.7 | 37 9% | 41.1 -1% | 34.5 15% | 43.4 -7% | |
| Load Maximum * (dB) | 39.5 | 47 -19% | 41.1 -4% | 39.3 1% | 49.4 -25% | 43.4 -10% |
* ... kleiner is beter
Geluidsniveau
| Onbelast |
| 28.5 / 28.5 / 29 dB (A) |
| Belasting |
| 33 / 39.5 dB (A) |
 | ||
30 dB stil 40 dB(A) hoorbaar 50 dB(A) luid |
||
min: | ||
(±) De maximumtemperatuur aan de bovenzijde bedraagt 42.6 °C / 109 F, vergeleken met het gemiddelde van 35.4 °C / 96 F, variërend van 19.6 tot 60 °C voor de klasse Convertible.
(±) De bodem warmt op tot een maximum van 43.8 °C / 111 F, vergeleken met een gemiddelde van 36.9 °C / 98 F
(+) Bij onbelast gebruik bedraagt de gemiddelde temperatuur voor de bovenzijde 23.7 °C / 75 F, vergeleken met het apparaatgemiddelde van 30.3 °C / 87 F.
(±) Bij het spelen van The Witcher 3 is de gemiddelde temperatuur voor de bovenzijde 34.2 °C / 94 F, vergeleken met het apparaatgemiddelde van 30.3 °C / 87 F.
(+) De palmsteunen en het touchpad zijn met een maximum van ###max## °C / 85.3 F koeler dan de huidtemperatuur en voelen daarom koel aan.
(±) De gemiddelde temperatuur van de handpalmsteun van soortgelijke toestellen bedroeg 28 °C / 82.4 F (-1.6 °C / -2.9 F).
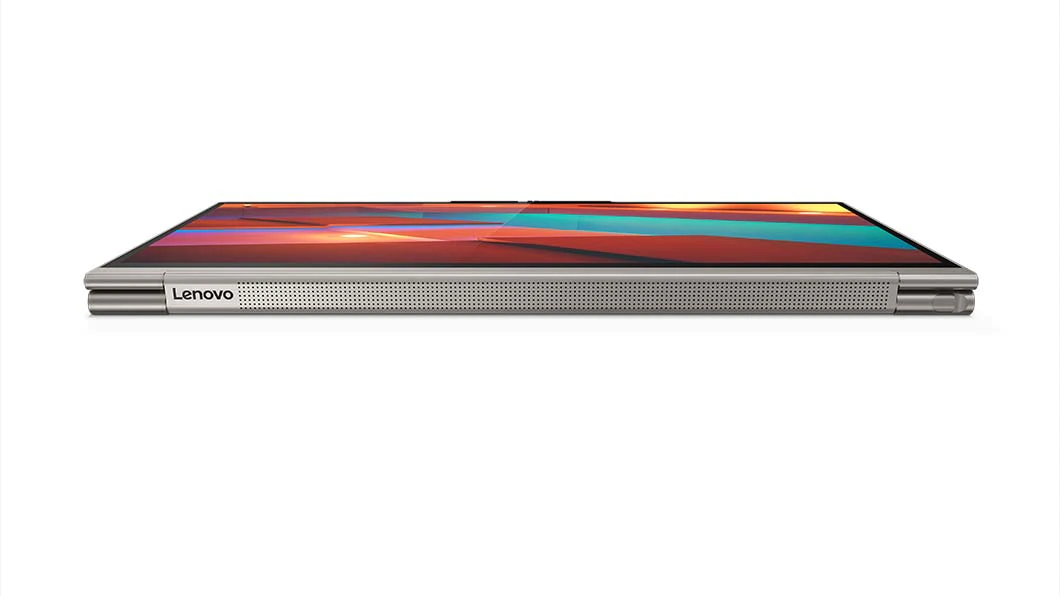
Lenovo Yoga C940-14IIL 81Q9 audioanalyse
(+) | luidsprekers kunnen relatief luid spelen (90.3 dB)
Bas 100 - 315 Hz
(±) | verminderde zeebaars - gemiddeld 11.2% lager dan de mediaan
(±) | lineariteit van de lage tonen is gemiddeld (10.9% delta ten opzichte van de vorige frequentie)
Midden 400 - 2000 Hz
(+) | evenwichtige middens - slechts 2.2% verwijderd van de mediaan
(+) | de middentonen zijn lineair (3.2% delta ten opzichte van de vorige frequentie)
Hoog 2 - 16 kHz
(±) | lagere maxima - gemiddeld 6% lager dan de mediaan
(±) | lineariteit van de hoogtepunten is gemiddeld (8.9% delta ten opzichte van de vorige frequentie)
Algemeen 100 - 16.000 Hz
(+) | het totale geluid is lineair (14.9% verschil met de mediaan)
Vergeleken met dezelfde klasse
» 24% van alle geteste apparaten in deze klasse waren beter, 5% vergelijkbaar, 72% slechter
» De beste had een delta van 6%, het gemiddelde was 20%, de slechtste was 57%
Vergeleken met alle geteste toestellen
» 20% van alle geteste apparaten waren beter, 4% gelijk, 76% slechter
» De beste had een delta van 4%, het gemiddelde was 24%, de slechtste was 134%
Apple MacBook 12 (Early 2016) 1.1 GHz audioanalyse
(+) | luidsprekers kunnen relatief luid spelen (83.6 dB)
Bas 100 - 315 Hz
(±) | verminderde zeebaars - gemiddeld 11.3% lager dan de mediaan
(±) | lineariteit van de lage tonen is gemiddeld (14.2% delta ten opzichte van de vorige frequentie)
Midden 400 - 2000 Hz
(+) | evenwichtige middens - slechts 2.4% verwijderd van de mediaan
(+) | de middentonen zijn lineair (5.5% delta ten opzichte van de vorige frequentie)
Hoog 2 - 16 kHz
(+) | evenwichtige hoogtepunten - slechts 2% verwijderd van de mediaan
(+) | de hoge tonen zijn lineair (4.5% delta naar de vorige frequentie)
Algemeen 100 - 16.000 Hz
(+) | het totale geluid is lineair (10.2% verschil met de mediaan)
Vergeleken met dezelfde klasse
» 7% van alle geteste apparaten in deze klasse waren beter, 2% vergelijkbaar, 91% slechter
» De beste had een delta van 5%, het gemiddelde was 18%, de slechtste was 53%
Vergeleken met alle geteste toestellen
» 5% van alle geteste apparaten waren beter, 1% gelijk, 94% slechter
» De beste had een delta van 4%, het gemiddelde was 24%, de slechtste was 134%
| Uit / Standby | |
| Inactief | |
| Belasting |
|
Key:
min: | |
| Lenovo Yoga C940-14IIL 81Q9 i7-1065G7, Iris Plus Graphics G7 (Ice Lake 64 EU), Samsung PM981a MZVLB1T0HBLR, IPS, 3840x2160, 14" | Asus ZenBook S13 UX392FN i7-8565U, GeForce MX150, WDC PC SN520 SDAPNUW-512G, IPS, 1920x1080, 13.9" | Lenovo Yoga C930-13IKB 81C4 i5-8550U, UHD Graphics 620, SK hynix PC401 HFS256GD9TNG, IPS, 1920x1080, 13.9" | Lenovo Yoga C940-14IIL i7-1065G7, Iris Plus Graphics G7 (Ice Lake 64 EU), Samsung SSD PM981 MZVLB512HAJQ, IPS LED, 1920x1080, 14" | Razer Blade Stealth 13, Core i7-1065G7 i7-1065G7, GeForce GTX 1650 Max-Q, Lite-On CA3-8D512, IPS LED, 3840x2160, 13.3" | Dell XPS 13 7390 2-in-1 Core i7 i7-1065G7, Iris Plus Graphics G7 (Ice Lake 64 EU), Toshiba BG4 KBG40ZPZ512G, IPS, 1920x1200, 13.4" | Huawei MateBook 14 KLV-W29 i7-8565U, GeForce MX250, Samsung SSD PM981 MZVLB512HAJQ, IPS, 2160x1440, 14" | |
|---|---|---|---|---|---|---|---|
| Power Consumption | 19% | 17% | 23% | -35% | 33% | 1% | |
| Idle Minimum * (Watt) | 5.6 | 3.4 39% | 3.4 39% | 3.2 43% | 10.7 -91% | 2.6 54% | 3.7 34% |
| Idle Average * (Watt) | 10.5 | 6.3 40% | 7.5 29% | 7 33% | 13.6 -30% | 5.3 50% | 9.3 11% |
| Idle Maximum * (Watt) | 12 | 10.4 13% | 11.8 2% | 8.9 26% | 15.7 -31% | 7 42% | 12.8 -7% |
| Load Average * (Watt) | 53.3 | 51 4% | 47.7 11% | 47.6 11% | 60 -13% | 43.1 19% | 58.8 -10% |
| Witcher 3 ultra * (Watt) | 46.9 | 39 17% | 64 -36% | 43.1 8% | 55.8 -19% | ||
| Load Maximum * (Watt) | 64.6 | 62.7 3% | 63.2 2% | 63.1 2% | 71 -10% | 49 24% | 65 -1% |
* ... kleiner is beter
| Lenovo Yoga C940-14IIL 81Q9 i7-1065G7, Iris Plus Graphics G7 (Ice Lake 64 EU), 60 Wh | Asus ZenBook S13 UX392FN i7-8565U, GeForce MX150, 50 Wh | Lenovo Yoga C930-13IKB 81C4 i5-8550U, UHD Graphics 620, 60 Wh | Lenovo Yoga C940-14IIL i7-1065G7, Iris Plus Graphics G7 (Ice Lake 64 EU), 60 Wh | Razer Blade Stealth i7-1065G7 Iris Plus i7-1065G7, Iris Plus Graphics G7 (Ice Lake 64 EU), 53.1 Wh | Dell XPS 13 7390 2-in-1 Core i7 i7-1065G7, Iris Plus Graphics G7 (Ice Lake 64 EU), 51 Wh | |
|---|---|---|---|---|---|---|
| Batterijduur | 15% | 52% | 45% | 33% | 23% | |
| WiFi v1.3 (h) | 7.3 | 8.4 15% | 11.1 52% | 10.6 45% | 9.7 33% | 9 23% |
| Reader / Idle (h) | 28.5 | |||||
| Load (h) | 1.7 | 1.1 |
Pro
Contra
Voor het volledige, Engelse testrapport, klik hier.
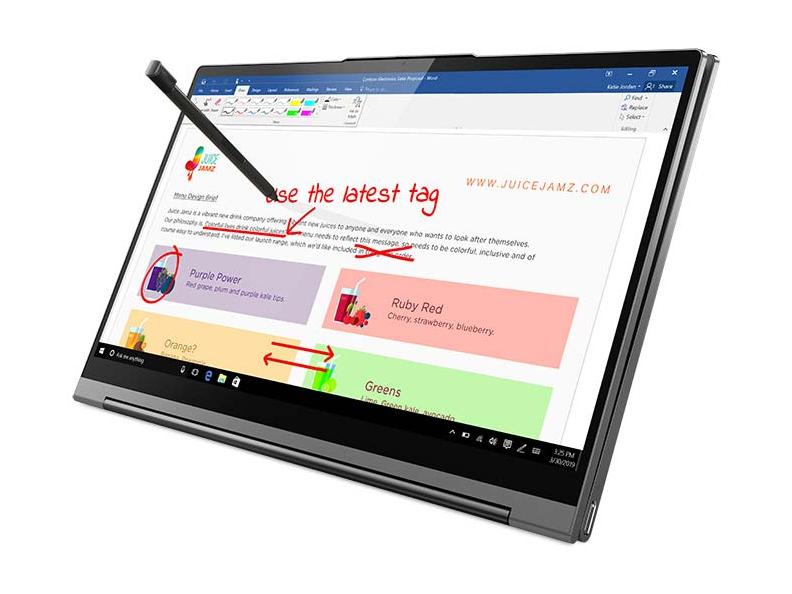
Kiezen voor de 4K UHD Yoga C940 in plaats van de goedkopere FHD-configuratie brengt enkele voor- en nadelen met zich mee. Het goede nieuws is dat de hogere resolutie zorgt voor fijnere peninvoer, iets diepere kleuren en een meetbaar helderdere achtergrondverlichting dan de FHD-versie zonder de reactietijden of het contrast sterk te beïnvloeden. Kleuren en grijstinten zijn merkwaardig genoeg niet zo nauwkeurig, maar een kalibratie door de eindgebruiker lost dit op.
Het belangrijkste nadeel van de 4K-optie is de kortere batterijlevensduur met ongeveer 3 uur volgens onze metingen en een iets hoger stroomverbruik niveau. Toch zou 7 uur WLAN-gebruik voor de meeste gebruikers meer dan genoeg moeten zijn. Alle Yoga C940-14 configuratie hebben dezelfde nadelen als het gaat om de moeilijke onderhoudsmogelijkheden, pulserende ventilatoren tijdens het gamen en zeer variabele gaming-prestaties van Ice Lake.
De zakelijke HP EliteBook x360 1040-serie heeft meer connectiviteitsopties, helderdere schermen en slankere ontwerpen voor een hogere startprijs dan de Lenovo Yoga C940-14. Als je een meer gebalanceerde 14-inch converteerbare consument wilt zonder genoegen te nemen met de kleinere 13,3-inch Spectre x360 of 13,4-inch Dell XPS 2-in-1, dan zou de Yoga C940 bovenaan je lijst moeten staan.
Lenovo Yoga C940-14IIL 81Q9
- 19-12-2019 v7 (old)
Allen Ngo
Price comparison
