Kort testrapport Dell XPS 13 7390 Core i7-10710U Laptop: Sneller dan de XPS 15 met Core i5
Evaluatie | Datum | Model | Gewicht | Hoogte | Formaat | Resolutie | Beste prijs |
|---|---|---|---|---|---|---|---|
| 85.9 % v7 (old) | 11-2019 | Dell XPS 13 7390 Core i7-10710U i7-10710U, UHD Graphics 620 | 1.2 kg | 11.6 mm | 13.30" | 3840x2160 | |
| 86.6 % v6 (old) | 05-2019 | Asus ZenBook S13 UX392FN i7-8565U, GeForce MX150 | 1.1 kg | 12.9 mm | 13.90" | 1920x1080 | |
| 82.7 % v7 (old) | 12-2019 | Acer Swift 3 SF314-41-R8HZ R5 3500U, Vega 8 | 1.5 kg | 18 mm | 14.00" | 1920x1080 | |
| 84.1 % v6 (old) | 09-2023 | Lenovo Yoga 530-14ARR-81H9000VGE R7 2700U, Vega 10 | 1.7 kg | 17.6 mm | 14.00" | 1920x1080 | |
| 87.7 % v6 (old) | 02-2019 | Dell XPS 13 9380 i7 4K i7-8565U, UHD Graphics 620 | 1.2 kg | 11.6 mm | 13.30" | 3840x2160 |
| SD Card Reader | |
| average JPG Copy Test (av. of 3 runs) | |
| Dell XPS 13 9380 i7 4K (Toshiba Exceria Pro M501 64 GB UHS-II) | |
| Dell XPS 13 7390 2-in-1 Core i3 (Toshiba Exceria Pro M501 64 GB UHS-II) | |
| Dell XPS 13 7390 Core i7-10710U (Toshiba Exceria Pro M501 64 GB UHS-II) | |
| Dell XPS 13 7390 2-in-1 Core i7 (Toshiba Exceria Pro M501 64 GB UHS-II) | |
| maximum AS SSD Seq Read Test (1GB) | |
| Dell XPS 13 9380 i7 4K (Toshiba Exceria Pro M501 64 GB UHS-II) | |
| Dell XPS 13 7390 2-in-1 Core i3 (Toshiba Exceria Pro M501 64 GB UHS-II) | |
| Dell XPS 13 7390 Core i7-10710U (Toshiba Exceria Pro M501 64 GB UHS-II) | |
| Dell XPS 13 7390 2-in-1 Core i7 (Toshiba Exceria Pro M501 64 GB UHS-II) | |
| |||||||||||||||||||||||||
Helderheidsverdeling: 89 %
Helderheid in Batterij-modus: 311.7 cd/m²
Contrast: 1047:1 (Zwart: 0.39 cd/m²)
ΔE ColorChecker Calman: 4.6 | ∀{0.5-29.43 Ø4.71}
calibrated: 2.03
ΔE Greyscale Calman: 7.5 | ∀{0.09-98 Ø4.96}
93.5% sRGB (Argyll 1.6.3 3D)
59.5% AdobeRGB 1998 (Argyll 1.6.3 3D)
64.3% AdobeRGB 1998 (Argyll 3D)
93.7% sRGB (Argyll 3D)
63.4% Display P3 (Argyll 3D)
Gamma: 2.12
CCT: 7966 K
| Dell XPS 13 7390 Core i7-10710U AU Optronics B133ZAN, Dell P/N: 90NTH, IPS, 13.3", 3840x2160 | Dell XPS 13 7390 2-in-1 Core i7 Sharp LQ134N1, IPS, 13.4", 1920x1200 | Dell XPS 13 9380 i7 4K ID: AUO 282B B133ZAN Dell: 90NTH, IPS, 13.3", 3840x2160 | Dell XPS 13 9380 2019 ID: AUO 282B B133ZAN Dell: 90NTH, IPS, 13.3", 3840x2160 | Dell XPS 13 9370 i7 UHD ID: Sharp SHP148B, Name: LQ133D1, Dell P/N: 8XDHY, IPS, 13.3", 3840x2160 | Dell XPS 13 i5-8250U ID: Sharp SHP144A, Name: LQ133Z1, IGZO IPS, 13.3", 3200x1800 | |
|---|---|---|---|---|---|---|
| Display | 9% | 1% | 1% | 7% | 0% | |
| Display P3 Coverage (%) | 63.4 | 69.9 10% | 64.8 2% | 64.7 2% | 68.9 9% | 63.9 1% |
| sRGB Coverage (%) | 93.7 | 99.2 6% | 93.6 0% | 93.1 -1% | 98.4 5% | 91.7 -2% |
| AdobeRGB 1998 Coverage (%) | 64.3 | 71.5 11% | 65.8 2% | 65.3 2% | 69.5 8% | 65.7 2% |
| Response Times | 11% | -20% | -10% | -33% | 28% | |
| Response Time Grey 50% / Grey 80% * (ms) | 51.6 ? | 47.6 ? 8% | 64.8 ? -26% | 58 ? -12% | 69.6 ? -35% | 29 ? 44% |
| Response Time Black / White * (ms) | 33.6 ? | 29.2 ? 13% | 38 ? -13% | 36 ? -7% | 44 ? -31% | 30 ? 11% |
| PWM Frequency (Hz) | 2500 ? | 3759 ? | 19500 ? | |||
| Screen | 30% | 21% | 9% | 18% | 1% | |
| Brightness middle (cd/m²) | 408.2 | 549.8 35% | 428.3 5% | 404 -1% | 478.5 17% | 361 -12% |
| Brightness (cd/m²) | 399 | 520 30% | 414 4% | 389 -3% | 466 17% | 303 -24% |
| Brightness Distribution (%) | 89 | 86 -3% | 88 -1% | 85 -4% | 86 -3% | 72 -19% |
| Black Level * (cd/m²) | 0.39 | 0.39 -0% | 0.27 31% | 0.37 5% | 0.43 -10% | 0.33 15% |
| Contrast (:1) | 1047 | 1410 35% | 1586 51% | 1092 4% | 1113 6% | 1094 4% |
| Colorchecker dE 2000 * | 4.6 | 2.12 54% | 2.69 42% | 3.72 19% | 3.09 33% | 5.26 -14% |
| Colorchecker dE 2000 max. * | 11.84 | 3.66 69% | 6.19 48% | 7.38 38% | 5.94 50% | 7.79 34% |
| Colorchecker dE 2000 calibrated * | 2.03 | 1.37 33% | 2.01 1% | 2.06 -1% | 2.06 -1% | |
| Greyscale dE 2000 * | 7.5 | 2.6 65% | 3.7 51% | 4.44 41% | 2.4 68% | 5.69 24% |
| Gamma | 2.12 104% | 2.3 96% | 2.1 105% | 2.34 94% | 2.063 107% | 1.63 135% |
| CCT | 7966 82% | 6884 94% | 6706 97% | 7095 92% | 6883 94% | 6499 100% |
| Color Space (Percent of AdobeRGB 1998) (%) | 59.5 | 65.4 10% | 60.4 2% | 60 1% | 69.47 17% | 59 -1% |
| Color Space (Percent of sRGB) (%) | 93.5 | 99.7 7% | 93.5 0% | 93 -1% | 98.36 5% | 92 -2% |
| Totaal Gemiddelde (Programma / Instellingen) | 17% /
24% | 1% /
12% | 0% /
5% | -3% /
10% | 10% /
4% |
* ... kleiner is beter
Responstijd Scherm
| ↔ Responstijd Zwart naar Wit | ||
|---|---|---|
| 33.6 ms ... stijging ↗ en daling ↘ gecombineerd | ↗ 17.2 ms stijging | 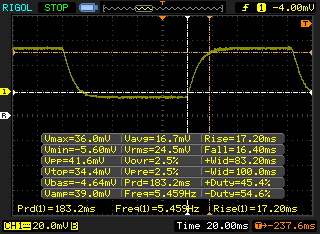 |
| ↘ 16.4 ms daling | ||
| Het scherm vertoonde trage responstijden in onze tests en is misschien te traag voor games. Ter vergelijking: alle testtoestellen variëren van 0.1 (minimum) tot 240 (maximum) ms. » 90 % van alle toestellen zijn beter. Dit betekent dat de gemeten responstijd slechter is dan het gemiddelde (19.8 ms) van alle geteste toestellen. | ||
| ↔ Responstijd 50% Grijs naar 80% Grijs | ||
| 51.6 ms ... stijging ↗ en daling ↘ gecombineerd | ↗ 26.4 ms stijging | 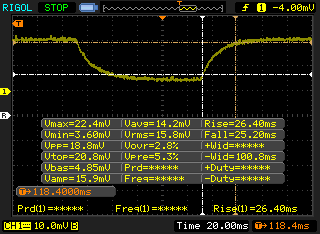 |
| ↘ 25.2 ms daling | ||
| Het scherm vertoonde trage responstijden in onze tests en is misschien te traag voor games. Ter vergelijking: alle testtoestellen variëren van 0.165 (minimum) tot 636 (maximum) ms. » 88 % van alle toestellen zijn beter. Dit betekent dat de gemeten responstijd slechter is dan het gemiddelde (31 ms) van alle geteste toestellen. | ||
Screen Flickering / PWM (Pulse-Width Modulation)
| Screen flickering / PWM niet waargenomen | 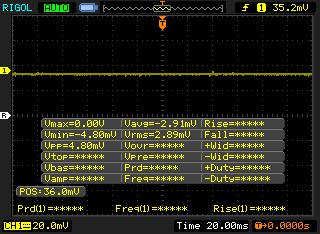 | ||
Ter vergelijking: 52 % van alle geteste toestellen maakten geen gebruik van PWM om de schermhelderheid te verlagen. Als het wel werd gebruikt, werd een gemiddelde van 7757 (minimum: 5 - maximum: 343500) Hz waargenomen. | |||
* ... kleiner is beter
| PCMark 8 Home Score Accelerated v2 | 3442 punten | |
| PCMark 8 Work Score Accelerated v2 | 4578 punten | |
| PCMark 10 Score | 4161 punten | |
Help | ||
| Dell XPS 13 7390 Core i7-10710U SK Hynix PC601 NVMe 512 GB | Dell XPS 13 7390 2-in-1 Core i7 Toshiba BG4 KBG40ZPZ512G | Dell XPS 13 7390 2-in-1 Core i3 Toshiba BG4 KBG40ZPZ256G | Dell XPS 13 9380 i7 4K Samsung SSD PM981 MZVLB512HAJQ | Dell XPS 13 9380 2019 SK hynix PC401 HFS256GD9TNG | Dell XPS 13 9370 i7 UHD Toshiba XG5 KXG50ZNV512G | |
|---|---|---|---|---|---|---|
| AS SSD | -53% | -69% | 44% | -29% | -23% | |
| Seq Read (MB/s) | 1804 | 1801 0% | 1558 -14% | 1981 10% | 2035 13% | 2205 22% |
| Seq Write (MB/s) | 1000 | 1125 13% | 1103 10% | 1473 47% | 658 -34% | 435.8 -56% |
| 4K Read (MB/s) | 45.1 | 39.7 -12% | 37.52 -17% | 53.3 18% | 39.74 -12% | 29.36 -35% |
| 4K Write (MB/s) | 115 | 67 -42% | 59 -49% | 127.4 11% | 105.7 -8% | 107.4 -7% |
| 4K-64 Read (MB/s) | 893 | 1253 40% | 1684 89% | 1179 32% | 461 -48% | 678 -24% |
| 4K-64 Write (MB/s) | 732 | 209 -71% | 198.9 -73% | 2105 188% | 300.1 -59% | 444.8 -39% |
| Access Time Read * (ms) | 0.044 | 0.069 -57% | 0.099 -125% | 0.036 18% | 0.061 -39% | 0.059 -34% |
| Access Time Write * (ms) | 0.095 | 0.625 -558% | 0.722 -660% | 0.029 69% | 0.051 46% | 0.055 42% |
| Score Read (Points) | 1119 | 1472 32% | 1877 68% | 1430 28% | 704 -37% | 926 -17% |
| Score Write (Points) | 947 | 388 -59% | 368 -61% | 2379 151% | 471 -50% | 596 -37% |
| Score Total (Points) | 2608 | 2583 -1% | 3180 22% | 4526 74% | 1479 -43% | 1911 -27% |
| Copy ISO MB/s (MB/s) | 1515 | 1293 -15% | 677 -55% | 1294 -15% | 893 -41% | 585 -61% |
| Copy Program MB/s (MB/s) | 535 | 560 5% | 298.4 -44% | 503 -6% | 287.9 -46% | 570 7% |
| Copy Game MB/s (MB/s) | 1211 | 927 -23% | 496.1 -59% | 1148 -5% | 618 -49% | 503 -58% |
* ... kleiner is beter

| 3DMark 06 Standard Score | 14158 punten | |
| 3DMark 11 Performance | 2228 punten | |
| 3DMark Ice Storm Standard Score | 62104 punten | |
| 3DMark Cloud Gate Standard Score | 9916 punten | |
| 3DMark Fire Strike Score | 1237 punten | |
| 3DMark Time Spy Score | 491 punten | |
Help | ||
| lage | gem. | hoge | ultra | |
|---|---|---|---|---|
| BioShock Infinite (2013) | 85.3 | 42 | 35.8 | 11.2 |
| The Witcher 3 (2015) | 19.7 | |||
| Rocket League (2017) | 76.2 | 36.6 | 23 | |
| Shadow of the Tomb Raider (2018) | 15 |
| Dell XPS 13 7390 Core i7-10710U UHD Graphics 620, i7-10710U, SK Hynix PC601 NVMe 512 GB | Dell XPS 13 7390 2-in-1 Core i7 Iris Plus Graphics G7 (Ice Lake 64 EU), i7-1065G7, Toshiba BG4 KBG40ZPZ512G | Dell XPS 13 7390 2-in-1 Core i3 UHD Graphics G1 (Ice Lake 32 EU), i3-1005G1, Toshiba BG4 KBG40ZPZ256G | Dell XPS 13 9380 i7 4K UHD Graphics 620, i7-8565U, Samsung SSD PM981 MZVLB512HAJQ | Dell XPS 13 9380 2019 UHD Graphics 620, i5-8265U, SK hynix PC401 HFS256GD9TNG | Dell XPS 13 9370 i7 UHD UHD Graphics 620, i5-8550U, Toshiba XG5 KXG50ZNV512G | |
|---|---|---|---|---|---|---|
| Noise | 2% | 2% | -3% | -2% | 2% | |
| uit / omgeving * (dB) | 28 | 28.1 -0% | 28 -0% | 28.4 -1% | 30.4 -9% | 28 -0% |
| Idle Minimum * (dB) | 28 | 28.1 -0% | 28 -0% | 29.4 -5% | 30.4 -9% | 28 -0% |
| Idle Average * (dB) | 28 | 28.1 -0% | 28 -0% | 29.4 -5% | 30.4 -9% | 28 -0% |
| Idle Maximum * (dB) | 28 | 28.1 -0% | 28 -0% | 29.4 -5% | 30.4 -9% | 28 -0% |
| Load Average * (dB) | 33.7 | 31.7 6% | 31.7 6% | 34.6 -3% | 31.7 6% | 32.5 4% |
| Load Maximum * (dB) | 46.5 | 43.4 7% | 43.5 6% | 46.8 -1% | 38.1 18% | 42.2 9% |
| Witcher 3 ultra * (dB) | 43.4 |
* ... kleiner is beter
Geluidsniveau
| Onbelast |
| 28 / 28 / 28 dB (A) |
| Belasting |
| 33.7 / 46.5 dB (A) |
 | ||
30 dB stil 40 dB(A) hoorbaar 50 dB(A) luid |
||
min: | ||
(±) De maximumtemperatuur aan de bovenzijde bedraagt 44.6 °C / 112 F, vergeleken met het gemiddelde van 35.9 °C / 97 F, variërend van 21.4 tot 59 °C voor de klasse Subnotebook.
(-) De bodem warmt op tot een maximum van 49.2 °C / 121 F, vergeleken met een gemiddelde van 39.2 °C / 103 F
(+) Bij onbelast gebruik bedraagt de gemiddelde temperatuur voor de bovenzijde 26.6 °C / 80 F, vergeleken met het apparaatgemiddelde van 30.8 °C / 87 F.
(+) De palmsteunen en het touchpad zijn met een maximum van ###max## °C / 88.5 F koeler dan de huidtemperatuur en voelen daarom koel aan.
(-) De gemiddelde temperatuur van de handpalmsteun van soortgelijke toestellen bedroeg 28.2 °C / 82.8 F (-3.2 °C / -5.7 F).
| Uit / Standby | |
| Inactief | |
| Belasting |
|
Key:
min: | |
| Dell XPS 13 7390 Core i7-10710U i7-10710U, UHD Graphics 620, SK Hynix PC601 NVMe 512 GB, IPS, 3840x2160, 13.3" | Dell XPS 13 7390 2-in-1 Core i7 i7-1065G7, Iris Plus Graphics G7 (Ice Lake 64 EU), Toshiba BG4 KBG40ZPZ512G, IPS, 1920x1200, 13.4" | Dell XPS 13 7390 2-in-1 Core i3 i3-1005G1, UHD Graphics G1 (Ice Lake 32 EU), Toshiba BG4 KBG40ZPZ256G, IPS, 1920x1200, 13.4" | Dell XPS 13 9380 i7 4K i7-8565U, UHD Graphics 620, Samsung SSD PM981 MZVLB512HAJQ, IPS, 3840x2160, 13.3" | Dell XPS 13 9380 2019 i5-8265U, UHD Graphics 620, SK hynix PC401 HFS256GD9TNG, IPS, 3840x2160, 13.3" | Dell XPS 13 9370 i7 UHD i5-8550U, UHD Graphics 620, Toshiba XG5 KXG50ZNV512G, IPS, 3840x2160, 13.3" | |
|---|---|---|---|---|---|---|
| Power Consumption | 20% | 22% | -7% | -2% | -3% | |
| Idle Minimum * (Watt) | 4.7 | 2.6 45% | 3 36% | 5.2 -11% | 4.8 -2% | 5 -6% |
| Idle Average * (Watt) | 8.3 | 5.3 36% | 5.4 35% | 8.6 -4% | 8.6 -4% | 8.3 -0% |
| Idle Maximum * (Watt) | 9 | 7 22% | 7.3 19% | 10.5 -17% | 10.4 -16% | 8.8 2% |
| Load Average * (Watt) | 42 | 43.1 -3% | 33.4 20% | 44.2 -5% | 37.9 10% | 46.4 -10% |
| Load Maximum * (Watt) | 49 | 49 -0% | 48.3 1% | 47.5 3% | 48.5 1% | 48.6 1% |
| Witcher 3 ultra * (Watt) | 43.1 |
* ... kleiner is beter
| Dell XPS 13 7390 Core i7-10710U i7-10710U, UHD Graphics 620, 52 Wh | Dell XPS 13 7390 2-in-1 Core i7 i7-1065G7, Iris Plus Graphics G7 (Ice Lake 64 EU), 51 Wh | Dell XPS 13 7390 2-in-1 Core i3 i3-1005G1, UHD Graphics G1 (Ice Lake 32 EU), 51 Wh | Dell XPS 13 9380 i7 4K i7-8565U, UHD Graphics 620, 52 Wh | Dell XPS 13 9380 2019 i5-8265U, UHD Graphics 620, 52 Wh | Dell XPS 13 9370 i7 UHD i5-8550U, UHD Graphics 620, 52 Wh | |
|---|---|---|---|---|---|---|
| Batterijduur | 7% | 6% | -8% | -1% | -7% | |
| WiFi v1.3 (h) | 8.4 | 9 7% | 8.9 6% | 7.7 -8% | 8.3 -1% | 7.8 -7% |
| Reader / Idle (h) | 35.7 | 17.2 | 13.7 | |||
| Load (h) | 2.2 | 2.4 | 1.8 |
Pro
Contra
Dit is de verkorte versie van het originele artikel. Het volledige, Engelse testrapport vind je hier.
Heb je echt een hexa-core-processor nodig in een subnotebook? Als je de XPS 13 vooral wilt gebruiken om te browsen, video's te streamen, aan tekstverwerking te doen of andere lichte kantoortaken waarvoor de serie oorspronkelijk was bedoeld, zal de oudere quad-core i7-8565U perfect volstaan. De scores voor PCMark verschillen al zo weinig tussen de XPS 13 7390 en XPS 13 9380 dat het moeilijk wordt om de meerprijs voor een hexa-core XPS 13 te rechtvaardigen, zeker aangezien de meeste mensen het verschil niet zullen merken bij alledaagse taken.
Anderzijds zullen veeleisende gebruikers die de twee extra-cores van Comet Lake-U willen exploiteren graag horen dat de multi-thread-prestatiesprong ten opzichte van Whiskey Lake-U aanzienlijk is, zelfs als we rekening houden met de onregelmatige kloksnelheden en de beperkte houdbaarheid van de maximale Turbo Boost. Als je vaak programma's gebruik die baat hebben bij extra threads of een eGPU-docking-station wilt aansluiten op je XPS 13, zal de hexa-core Core i7-10710U SKU de investering waard zijn.
De hexa-core XPS 13 7390 is bedoeld voor veeleisende gebruikers die op zoek de prestaties van een Core i5 XPS 15 in een kleinere 13.3-inch vormfactor. Het systeem slaagt erin om hogere prestaties te bieden zonder merkbare nadelen op het vlak van batterijduur, oppervlaktetemperaturen, energieverbruik of ventilatorgeluid.
Dell XPS 13 7390 Core i7-10710U
- 15-05-2020 v7 (old)
Allen Ngo
Price comparison
