Kort testrapport Dell XPS 13 7390 2-in-1 Core i3 Laptop: Warm ijs
| SD Card Reader | |
| average JPG Copy Test (av. of 3 runs) | |
| Dell XPS 13 9380 2019 (Toshiba Exceria Pro SDXC 64 GB UHS-II) | |
| Dell XPS 13 7390 2-in-1 Core i3 (Toshiba Exceria Pro M501 64 GB UHS-II) | |
| HP Spectre x360 13-ap0312ng (Toshiba Exceria Pro M501 64 GB UHS-II) | |
| Dell XPS 13-9365 2-in-1 (Toshiba THN-M401S0640E2) | |
| maximum AS SSD Seq Read Test (1GB) | |
| Dell XPS 13 7390 2-in-1 Core i3 (Toshiba Exceria Pro M501 64 GB UHS-II) | |
| HP Spectre x360 13-ap0312ng (Toshiba Exceria Pro M501 64 GB UHS-II) | |
| Dell XPS 13 9380 2019 (Toshiba Exceria Pro SDXC 64 GB UHS-II) | |
| Dell XPS 13-9365 2-in-1 (Toshiba THN-M401S0640E2) | |
| Networking | |
| iperf3 transmit AX12 | |
| HP Spectre x360 13-ap0312ng | |
| Dell XPS 13 9380 2019 | |
| Dell XPS 13 7390 2-in-1 Core i3 | |
| Dell XPS 13-9365 2-in-1 | |
| iperf3 receive AX12 | |
| Dell XPS 13 7390 2-in-1 Core i3 | |
| HP Spectre x360 13-ap0312ng | |
| Dell XPS 13 9380 2019 | |
| Dell XPS 13-9365 2-in-1 | |
| |||||||||||||||||||||||||
Helderheidsverdeling: 88 %
Helderheid in Batterij-modus: 576.3 cd/m²
Contrast: 1746:1 (Zwart: 0.33 cd/m²)
ΔE ColorChecker Calman: 1.45 | ∀{0.5-29.43 Ø4.71}
calibrated: 1.19
ΔE Greyscale Calman: 3.1 | ∀{0.09-98 Ø4.96}
98.5% sRGB (Argyll 1.6.3 3D)
64.2% AdobeRGB 1998 (Argyll 1.6.3 3D)
70.4% AdobeRGB 1998 (Argyll 3D)
98.2% sRGB (Argyll 3D)
68.6% Display P3 (Argyll 3D)
Gamma: 2.27
CCT: 6931 K
| Dell XPS 13 7390 2-in-1 Core i3 Sharp LQ134N1, IPS, 13.4", 1920x1200 | Dell XPS 13 9380 2019 ID: AUO 282B B133ZAN Dell: 90NTH, IPS, 13.3", 3840x2160 | Dell XPS 13-9365 2-in-1 IPS, 13.3", 1920x1080 | HP Spectre x360 13-ap0312ng M133NVF3, IPS, 13.3", 1920x1080 | Lenovo Yoga C930-13IKB 81C4 AUO B139HAN03_0, IPS, 13.9", 1920x1080 | Asus ZenBook S13 UX392FN Tianma XM, IPS, 13.9", 1920x1080 | |
|---|---|---|---|---|---|---|
| Display | -6% | -30% | -9% | -8% | -2% | |
| Display P3 Coverage (%) | 68.6 | 64.7 -6% | 47.32 -31% | 63 -8% | 62.7 -9% | 67.5 -2% |
| sRGB Coverage (%) | 98.2 | 93.1 -5% | 71.1 -28% | 89.8 -9% | 92.6 -6% | 95.8 -2% |
| AdobeRGB 1998 Coverage (%) | 70.4 | 65.3 -7% | 48.83 -31% | 64.1 -9% | 64.7 -8% | 69 -2% |
| Response Times | -17% | -1% | 39% | 25% | 12% | |
| Response Time Grey 50% / Grey 80% * (ms) | 46 ? | 58 ? -26% | 48 ? -4% | 29.2 ? 37% | 34.4 ? 25% | 47.2 ? -3% |
| Response Time Black / White * (ms) | 33.6 ? | 36 ? -7% | 32.8 ? 2% | 20 ? 40% | 25.6 ? 24% | 24.8 ? 26% |
| PWM Frequency (Hz) | 2525 ? | 1042 ? | 1000 ? | |||
| Screen | -43% | -86% | -60% | -103% | -11% | |
| Brightness middle (cd/m²) | 576.3 | 404 -30% | 322.6 -44% | 272 -53% | 312 -46% | 466 -19% |
| Brightness (cd/m²) | 555 | 389 -30% | 306 -45% | 298 -46% | 295 -47% | 462 -17% |
| Brightness Distribution (%) | 88 | 85 -3% | 91 3% | 84 -5% | 87 -1% | 90 2% |
| Black Level * (cd/m²) | 0.33 | 0.37 -12% | 0.19 42% | 0.39 -18% | 0.43 -30% | 0.33 -0% |
| Contrast (:1) | 1746 | 1092 -37% | 1698 -3% | 697 -60% | 726 -58% | 1412 -19% |
| Colorchecker dE 2000 * | 1.45 | 3.72 -157% | 7.7 -431% | 4.3 -197% | 7.6 -424% | 1.93 -33% |
| Colorchecker dE 2000 max. * | 4.12 | 7.38 -79% | 11.1 -169% | 9 -118% | 15.06 -266% | 4.26 -3% |
| Colorchecker dE 2000 calibrated * | 1.19 | 2.06 -73% | 2.4 -102% | 1.96 -65% | 1.99 -67% | |
| Greyscale dE 2000 * | 3.1 | 4.44 -43% | 7.9 -155% | 4.4 -42% | 8.8 -184% | 1.7 45% |
| Gamma | 2.27 97% | 2.34 94% | 2.88 76% | 1.97 112% | 2.01 109% | 2.15 102% |
| CCT | 6931 94% | 7095 92% | 7044 92% | 5825 112% | 6874 95% | 6382 102% |
| Color Space (Percent of AdobeRGB 1998) (%) | 64.2 | 60 -7% | 44.1 -31% | 58.9 -8% | 59.1 -8% | 62.2 -3% |
| Color Space (Percent of sRGB) (%) | 98.5 | 93 -6% | 69.9 -29% | 89.8 -9% | 92.3 -6% | 95.7 -3% |
| Totaal Gemiddelde (Programma / Instellingen) | -22% /
-33% | -39% /
-64% | -10% /
-38% | -29% /
-69% | -0% /
-6% |
* ... kleiner is beter
Responstijd Scherm
| ↔ Responstijd Zwart naar Wit | ||
|---|---|---|
| 33.6 ms ... stijging ↗ en daling ↘ gecombineerd | ↗ 19.2 ms stijging | 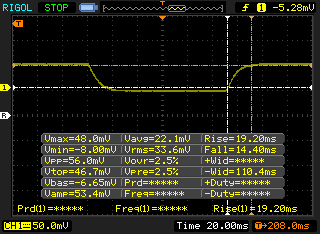 |
| ↘ 14.4 ms daling | ||
| Het scherm vertoonde trage responstijden in onze tests en is misschien te traag voor games. Ter vergelijking: alle testtoestellen variëren van 0.1 (minimum) tot 240 (maximum) ms. » 90 % van alle toestellen zijn beter. Dit betekent dat de gemeten responstijd slechter is dan het gemiddelde (19.8 ms) van alle geteste toestellen. | ||
| ↔ Responstijd 50% Grijs naar 80% Grijs | ||
| 46 ms ... stijging ↗ en daling ↘ gecombineerd | ↗ 23.2 ms stijging | 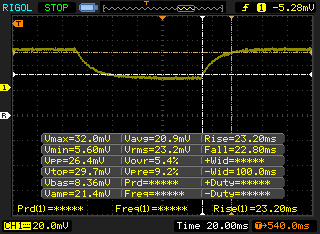 |
| ↘ 22.8 ms daling | ||
| Het scherm vertoonde trage responstijden in onze tests en is misschien te traag voor games. Ter vergelijking: alle testtoestellen variëren van 0.165 (minimum) tot 636 (maximum) ms. » 79 % van alle toestellen zijn beter. Dit betekent dat de gemeten responstijd slechter is dan het gemiddelde (31 ms) van alle geteste toestellen. | ||
Screen Flickering / PWM (Pulse-Width Modulation)
| Screen flickering / PWM waargenomen | 2525 Hz | ≤ 25 % helderheid instelling | 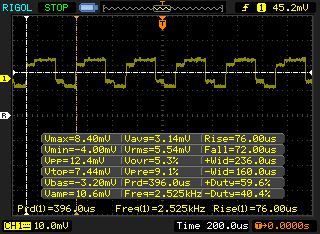 |
De achtergrondverlichting van het scherm flikkert op 2525 Hz (in het slechtste geval, bijvoorbeeld bij gebruik van PWM) aan een helderheid van 25 % en lager. Boven deze helderheid zou er geen flickering / PWM mogen optreden. De frequentie van 2525 Hz is redelijk hoog en de meeste mensen die gevoelig zijn aan flickering zouden dit dus niet mogen waarnemen of geïrriteerde ogen krijgen. Ter vergelijking: 52 % van alle geteste toestellen maakten geen gebruik van PWM om de schermhelderheid te verlagen. Als het wel werd gebruikt, werd een gemiddelde van 7757 (minimum: 5 - maximum: 343500) Hz waargenomen. | |||
| Cinebench R15 | |
| CPU Single 64Bit | |
| Lenovo Yoga C930-13IKB 81C4 | |
| HP Spectre x360 13-ap0312ng | |
| Microsoft Surface Pro 6, Core i7, 512 GB | |
| Dell XPS 13 7390 2-in-1 Core i3 | |
| Acer Swift 3 SF314-55-31N8 | |
| Dell XPS 13 9380 2019 | |
| HP EliteBook 735 G5 3UN62EA | |
| Asus VivoBook Flip 14 TP412UA-EC969T | |
| Dell XPS 13-9365 2-in-1 | |
| Lenovo V330-15IKB | |
| Lenovo Thinkpad 13-20J1001BUS | |
| Dell Inspiron 15 3585 (2300U, Vega 6) | |
| CPU Multi 64Bit | |
| Dell XPS 13 9380 2019 | |
| Lenovo Yoga C930-13IKB 81C4 | |
| HP EliteBook 735 G5 3UN62EA | |
| Microsoft Surface Pro 6, Core i7, 512 GB | |
| HP Spectre x360 13-ap0312ng | |
| Dell Inspiron 15 3585 (2300U, Vega 6) | |
| Dell XPS 13 7390 2-in-1 Core i3 | |
| Acer Swift 3 SF314-55-31N8 | |
| Asus VivoBook Flip 14 TP412UA-EC969T | |
| Lenovo V330-15IKB | |
| Dell XPS 13-9365 2-in-1 | |
| Lenovo Thinkpad 13-20J1001BUS | |
| Cinebench R11.5 | |
| CPU Single 64Bit | |
| Dell XPS 13 7390 2-in-1 Core i3 | |
| Acer Swift 3 SF314-55-31N8 | |
| Dell XPS 13-9365 2-in-1 | |
| Lenovo V330-15IKB | |
| Lenovo Thinkpad 13-20J1001BUS | |
| Dell Inspiron 15 3585 (2300U, Vega 6) | |
| CPU Multi 64Bit | |
| Dell XPS 13 7390 2-in-1 Core i3 | |
| Dell Inspiron 15 3585 (2300U, Vega 6) | |
| Acer Swift 3 SF314-55-31N8 | |
| Lenovo V330-15IKB | |
| Dell XPS 13-9365 2-in-1 | |
| Lenovo Thinkpad 13-20J1001BUS | |
| Cinebench R10 | |
| Rendering Multiple CPUs 32Bit | |
| Dell XPS 13 7390 2-in-1 Core i3 | |
| Acer Swift 3 SF314-55-31N8 | |
| Asus VivoBook Flip 14 TP412UA-EC969T | |
| Lenovo V330-15IKB | |
| Dell XPS 13-9365 2-in-1 | |
| Lenovo Thinkpad 13-20J1001BUS | |
| Rendering Single 32Bit | |
| Dell XPS 13 7390 2-in-1 Core i3 | |
| Acer Swift 3 SF314-55-31N8 | |
| Dell XPS 13-9365 2-in-1 | |
| Asus VivoBook Flip 14 TP412UA-EC969T | |
| Lenovo V330-15IKB | |
| Lenovo Thinkpad 13-20J1001BUS | |
| wPrime 2.10 - 1024m | |
| Lenovo Thinkpad 13-20J1001BUS | |
| Dell XPS 13-9365 2-in-1 | |
| Lenovo V330-15IKB | |
| Acer Swift 3 SF314-55-31N8 | |
| Dell XPS 13 7390 2-in-1 Core i3 | |
* ... kleiner is beter
| PCMark 8 Home Score Accelerated v2 | 3240 punten | |
| PCMark 8 Work Score Accelerated v2 | 4519 punten | |
| PCMark 10 Score | 3562 punten | |
Help | ||
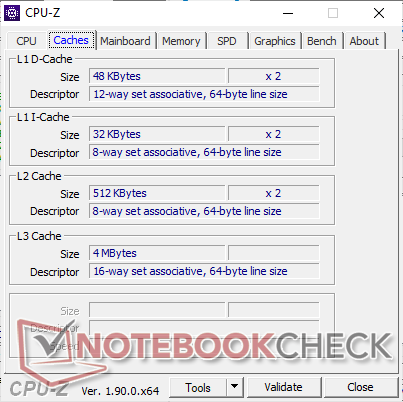
| Dell XPS 13 7390 2-in-1 Core i3 Toshiba BG4 KBG40ZPZ256G | Dell XPS 13 9380 2019 SK hynix PC401 HFS256GD9TNG | Asus ZenBook S13 UX392FN WDC PC SN520 SDAPNUW-512G | Microsoft Surface Pro 6, Core i7, 512 GB Toshiba KBG30ZPZ512G | Dell XPS 13-9365 2-in-1 Toshiba NVMe THNSN5256GPUK | Dell Latitude 7300-P99G Samsung SSD PM981 MZVLB512HAJQ | |
|---|---|---|---|---|---|---|
| AS SSD | 11% | 86% | -25% | 5% | 144% | |
| Seq Read (MB/s) | 1558 | 2035 31% | 1224 -21% | 1154 -26% | 1283 -18% | 2749 76% |
| Seq Write (MB/s) | 1103 | 658 -40% | 907 -18% | 393.6 -64% | 735 -33% | 1367 24% |
| 4K Read (MB/s) | 37.52 | 39.74 6% | 41.46 11% | 34.42 -8% | 37.69 0% | 49.94 33% |
| 4K Write (MB/s) | 59 | 105.7 79% | 126.2 114% | 68.9 17% | 96.9 64% | 137.6 133% |
| 4K-64 Read (MB/s) | 1684 | 461 -73% | 1021 -39% | 494.1 -71% | 586 -65% | 987 -41% |
| 4K-64 Write (MB/s) | 198.9 | 300.1 51% | 1251 529% | 171.3 -14% | 204.7 3% | 1465 637% |
| Access Time Read * (ms) | 0.099 | 0.061 38% | 0.053 46% | 0.213 -115% | 0.045 55% | 0.042 58% |
| Access Time Write * (ms) | 0.722 | 0.051 93% | 0.027 96% | 0.3 58% | 0.037 95% | 0.029 96% |
| Score Read (Points) | 1877 | 704 -62% | 1185 -37% | 644 -66% | 752 -60% | 1312 -30% |
| Score Write (Points) | 368 | 471 28% | 1468 299% | 280 -24% | 375 2% | 1739 373% |
| Score Total (Points) | 3180 | 1479 -53% | 3250 2% | 1225 -61% | 1495 -53% | 3662 15% |
| Copy ISO MB/s (MB/s) | 677 | 893 32% | 1404 107% | 985 45% | 950 40% | 2761 308% |
| Copy Program MB/s (MB/s) | 298.4 | 287.9 -4% | 402.4 35% | 143.1 -52% | 263.8 -12% | 622 108% |
| Copy Game MB/s (MB/s) | 496.1 | 618 25% | 902 82% | 676 36% | 726 46% | 1584 219% |
* ... kleiner is beter

| 3DMark 06 Standard Score | 11753 punten | |
| 3DMark 11 Performance | 2374 punten | |
| 3DMark Ice Storm Standard Score | 56698 punten | |
| 3DMark Cloud Gate Standard Score | 8145 punten | |
| 3DMark Fire Strike Score | 1443 punten | |
Help | ||
| Rocket League | |
| 1920x1080 High Quality AA:High FX | |
| Huawei MateBook 13 i7 | |
| Lenovo IdeaPad 320s-14IKB | |
| Acer Swift 3 SF313-51-59SZ | |
| Lenovo Flex 14IWL | |
| Dell XPS 13 7390 2-in-1 Core i3 | |
| Samsung Notebook 9 NP930QAA | |
| Acer Switch 5 SW512-52-5819 | |
| Dell Inspiron 15 3585 (2300U, Vega 6) | |
| Dell Inspiron 14 5000 5482 2-in-1 | |
| Fujitsu LifeBook U937 | |
| 1920x1080 Quality AA:Medium FX | |
| Huawei MateBook 13 i7 | |
| Lenovo IdeaPad 320s-14IKB | |
| Dell XPS 13 7390 2-in-1 Core i3 | |
| Acer Swift 3 SF313-51-59SZ | |
| Samsung Notebook 9 NP930QAA | |
| Lenovo Flex 14IWL | |
| Acer Switch 5 SW512-52-5819 | |
| Dell Inspiron 15 3585 (2300U, Vega 6) | |
| Fujitsu LifeBook U937 | |
| Dell Inspiron 14 5000 5482 2-in-1 | |
| 1920x1080 Performance | |
| Lenovo IdeaPad 320s-14IKB | |
| Acer Swift 3 SF313-51-59SZ | |
| Dell XPS 13 7390 2-in-1 Core i3 | |
| Acer Switch 5 SW512-52-5819 | |
| Dell Inspiron 15 3585 (2300U, Vega 6) | |
| Samsung Notebook 9 NP930QAA | |
| Lenovo Flex 14IWL | |
| Fujitsu LifeBook U937 | |
| lage | gem. | hoge | ultra | |
|---|---|---|---|---|
| StarCraft II: Heart of the Swarm (2013) | 60.5 | 40.5 | 18.9 | |
| BioShock Infinite (2013) | 82.6 | 40 | 34.8 | 11.7 |
| The Witcher 3 (2015) | 29.7 | 19.1 | 10.4 | 5.4 |
| Overwatch (2016) | 71.4 | 52.3 | 23.5 | |
| Rocket League (2017) | 69.5 | 42.2 | 22.8 |
| Dell XPS 13 7390 2-in-1 Core i3 UHD Graphics G1 (Ice Lake 32 EU), i3-1005G1, Toshiba BG4 KBG40ZPZ256G | Dell XPS 13 9380 2019 UHD Graphics 620, i5-8265U, SK hynix PC401 HFS256GD9TNG | Dell XPS 13-9365 2-in-1 HD Graphics 615, i7-7Y75, Toshiba NVMe THNSN5256GPUK | HP Spectre x360 13-ap0312ng UHD Graphics 620, i7-8565U, Toshiba XG5 KXG50ZNV512G | Lenovo Yoga C930-13IKB 81C4 UHD Graphics 620, i5-8550U, SK hynix PC401 HFS256GD9TNG | Asus ZenBook S13 UX392FN GeForce MX150, i7-8565U, WDC PC SN520 SDAPNUW-512G | |
|---|---|---|---|---|---|---|
| Noise | -4% | 1% | 1% | -5% | ||
| uit / omgeving * (dB) | 28 | 30.4 -9% | 29.2 -4% | 27.9 -0% | 28.1 -0% | |
| Idle Minimum * (dB) | 28 | 30.4 -9% | 29.2 -4% | 27.9 -0% | 28.1 -0% | |
| Idle Average * (dB) | 28 | 30.4 -9% | 29.2 -4% | 27.9 -0% | 28.1 -0% | |
| Idle Maximum * (dB) | 28 | 30.4 -9% | 30.4 -9% | 29.3 -5% | 29 -4% | |
| Load Average * (dB) | 31.7 | 31.7 -0% | 31 2% | 32 -1% | 41.1 -30% | |
| Load Maximum * (dB) | 43.5 | 38.1 12% | 32.1 26% | 39.3 10% | 41.1 6% | |
| Witcher 3 ultra * (dB) | 41.1 |
* ... kleiner is beter
Geluidsniveau
| Onbelast |
| 28 / 28 / 28 dB (A) |
| Belasting |
| 31.7 / 43.5 dB (A) |
 | ||
30 dB stil 40 dB(A) hoorbaar 50 dB(A) luid |
||
min: | ||
(-) De maximumtemperatuur aan de bovenzijde bedraagt 50 °C / 122 F, vergeleken met het gemiddelde van 35.4 °C / 96 F, variërend van 19.6 tot 60 °C voor de klasse Convertible.
(-) De bodem warmt op tot een maximum van 47 °C / 117 F, vergeleken met een gemiddelde van 36.9 °C / 98 F
(+) Bij onbelast gebruik bedraagt de gemiddelde temperatuur voor de bovenzijde 28.8 °C / 84 F, vergeleken met het apparaatgemiddelde van 30.3 °C / 87 F.
(+) De palmsteunen en het touchpad zijn met een maximum van ###max## °C / 87.8 F koeler dan de huidtemperatuur en voelen daarom koel aan.
(-) De gemiddelde temperatuur van de handpalmsteun van soortgelijke toestellen bedroeg 28 °C / 82.4 F (-3 °C / -5.4 F).
| Uit / Standby | |
| Inactief | |
| Belasting |
|
Key:
min: | |
| Dell XPS 13 7390 2-in-1 Core i3 i3-1005G1, UHD Graphics G1 (Ice Lake 32 EU), Toshiba BG4 KBG40ZPZ256G, IPS, 1920x1200, 13.4" | Dell XPS 13 9380 2019 i5-8265U, UHD Graphics 620, SK hynix PC401 HFS256GD9TNG, IPS, 3840x2160, 13.3" | Dell XPS 13-9365 2-in-1 i7-7Y75, HD Graphics 615, Toshiba NVMe THNSN5256GPUK, IPS, 1920x1080, 13.3" | HP Spectre x360 13-ap0312ng i7-8565U, UHD Graphics 620, Toshiba XG5 KXG50ZNV512G, IPS, 1920x1080, 13.3" | Lenovo Yoga C930-13IKB 81C4 i5-8550U, UHD Graphics 620, SK hynix PC401 HFS256GD9TNG, IPS, 1920x1080, 13.9" | Asus ZenBook S13 UX392FN i7-8565U, GeForce MX150, WDC PC SN520 SDAPNUW-512G, IPS, 1920x1080, 13.9" | |
|---|---|---|---|---|---|---|
| Power Consumption | -35% | 26% | -19% | -38% | -31% | |
| Idle Minimum * (Watt) | 3 | 4.8 -60% | 3.1 -3% | 4.32 -44% | 3.4 -13% | 3.4 -13% |
| Idle Average * (Watt) | 5.4 | 8.6 -59% | 4.3 20% | 6.84 -27% | 7.5 -39% | 6.3 -17% |
| Idle Maximum * (Watt) | 7.3 | 10.4 -42% | 4.9 33% | 8.64 -18% | 11.8 -62% | 10.4 -42% |
| Load Average * (Watt) | 33.4 | 37.9 -13% | 24.3 27% | 31.8 5% | 47.7 -43% | 51 -53% |
| Load Maximum * (Watt) | 48.3 | 48.5 -0% | 22.8 53% | 53 -10% | 63.2 -31% | 62.7 -30% |
| Witcher 3 ultra * (Watt) | 39 |
* ... kleiner is beter
| Dell XPS 13 7390 2-in-1 Core i3 i3-1005G1, UHD Graphics G1 (Ice Lake 32 EU), 51 Wh | Dell XPS 13 9380 2019 i5-8265U, UHD Graphics 620, 52 Wh | Dell XPS 13-9365 2-in-1 i7-7Y75, HD Graphics 615, 46 Wh | HP Spectre x360 13-ap0312ng i7-8565U, UHD Graphics 620, 61 Wh | Lenovo Yoga C930-13IKB 81C4 i5-8550U, UHD Graphics 620, 60 Wh | Asus ZenBook S13 UX392FN i7-8565U, GeForce MX150, 50 Wh | |
|---|---|---|---|---|---|---|
| Batterijduur | -17% | 2% | 3% | 25% | -16% | |
| Reader / Idle (h) | 35.7 | 17.2 -52% | 16.2 -55% | 28.5 -20% | ||
| WiFi v1.3 (h) | 8.9 | 8.3 -7% | 11.4 28% | 8.9 0% | 11.1 25% | 8.4 -6% |
| Load (h) | 2.2 | 2.4 9% | 2.9 32% | 2.3 5% | 1.7 -23% |
Pro
Contra
Dit is de verkorte versie van het originele artikel. Het volledige, Engelse testrapport vind je hier.
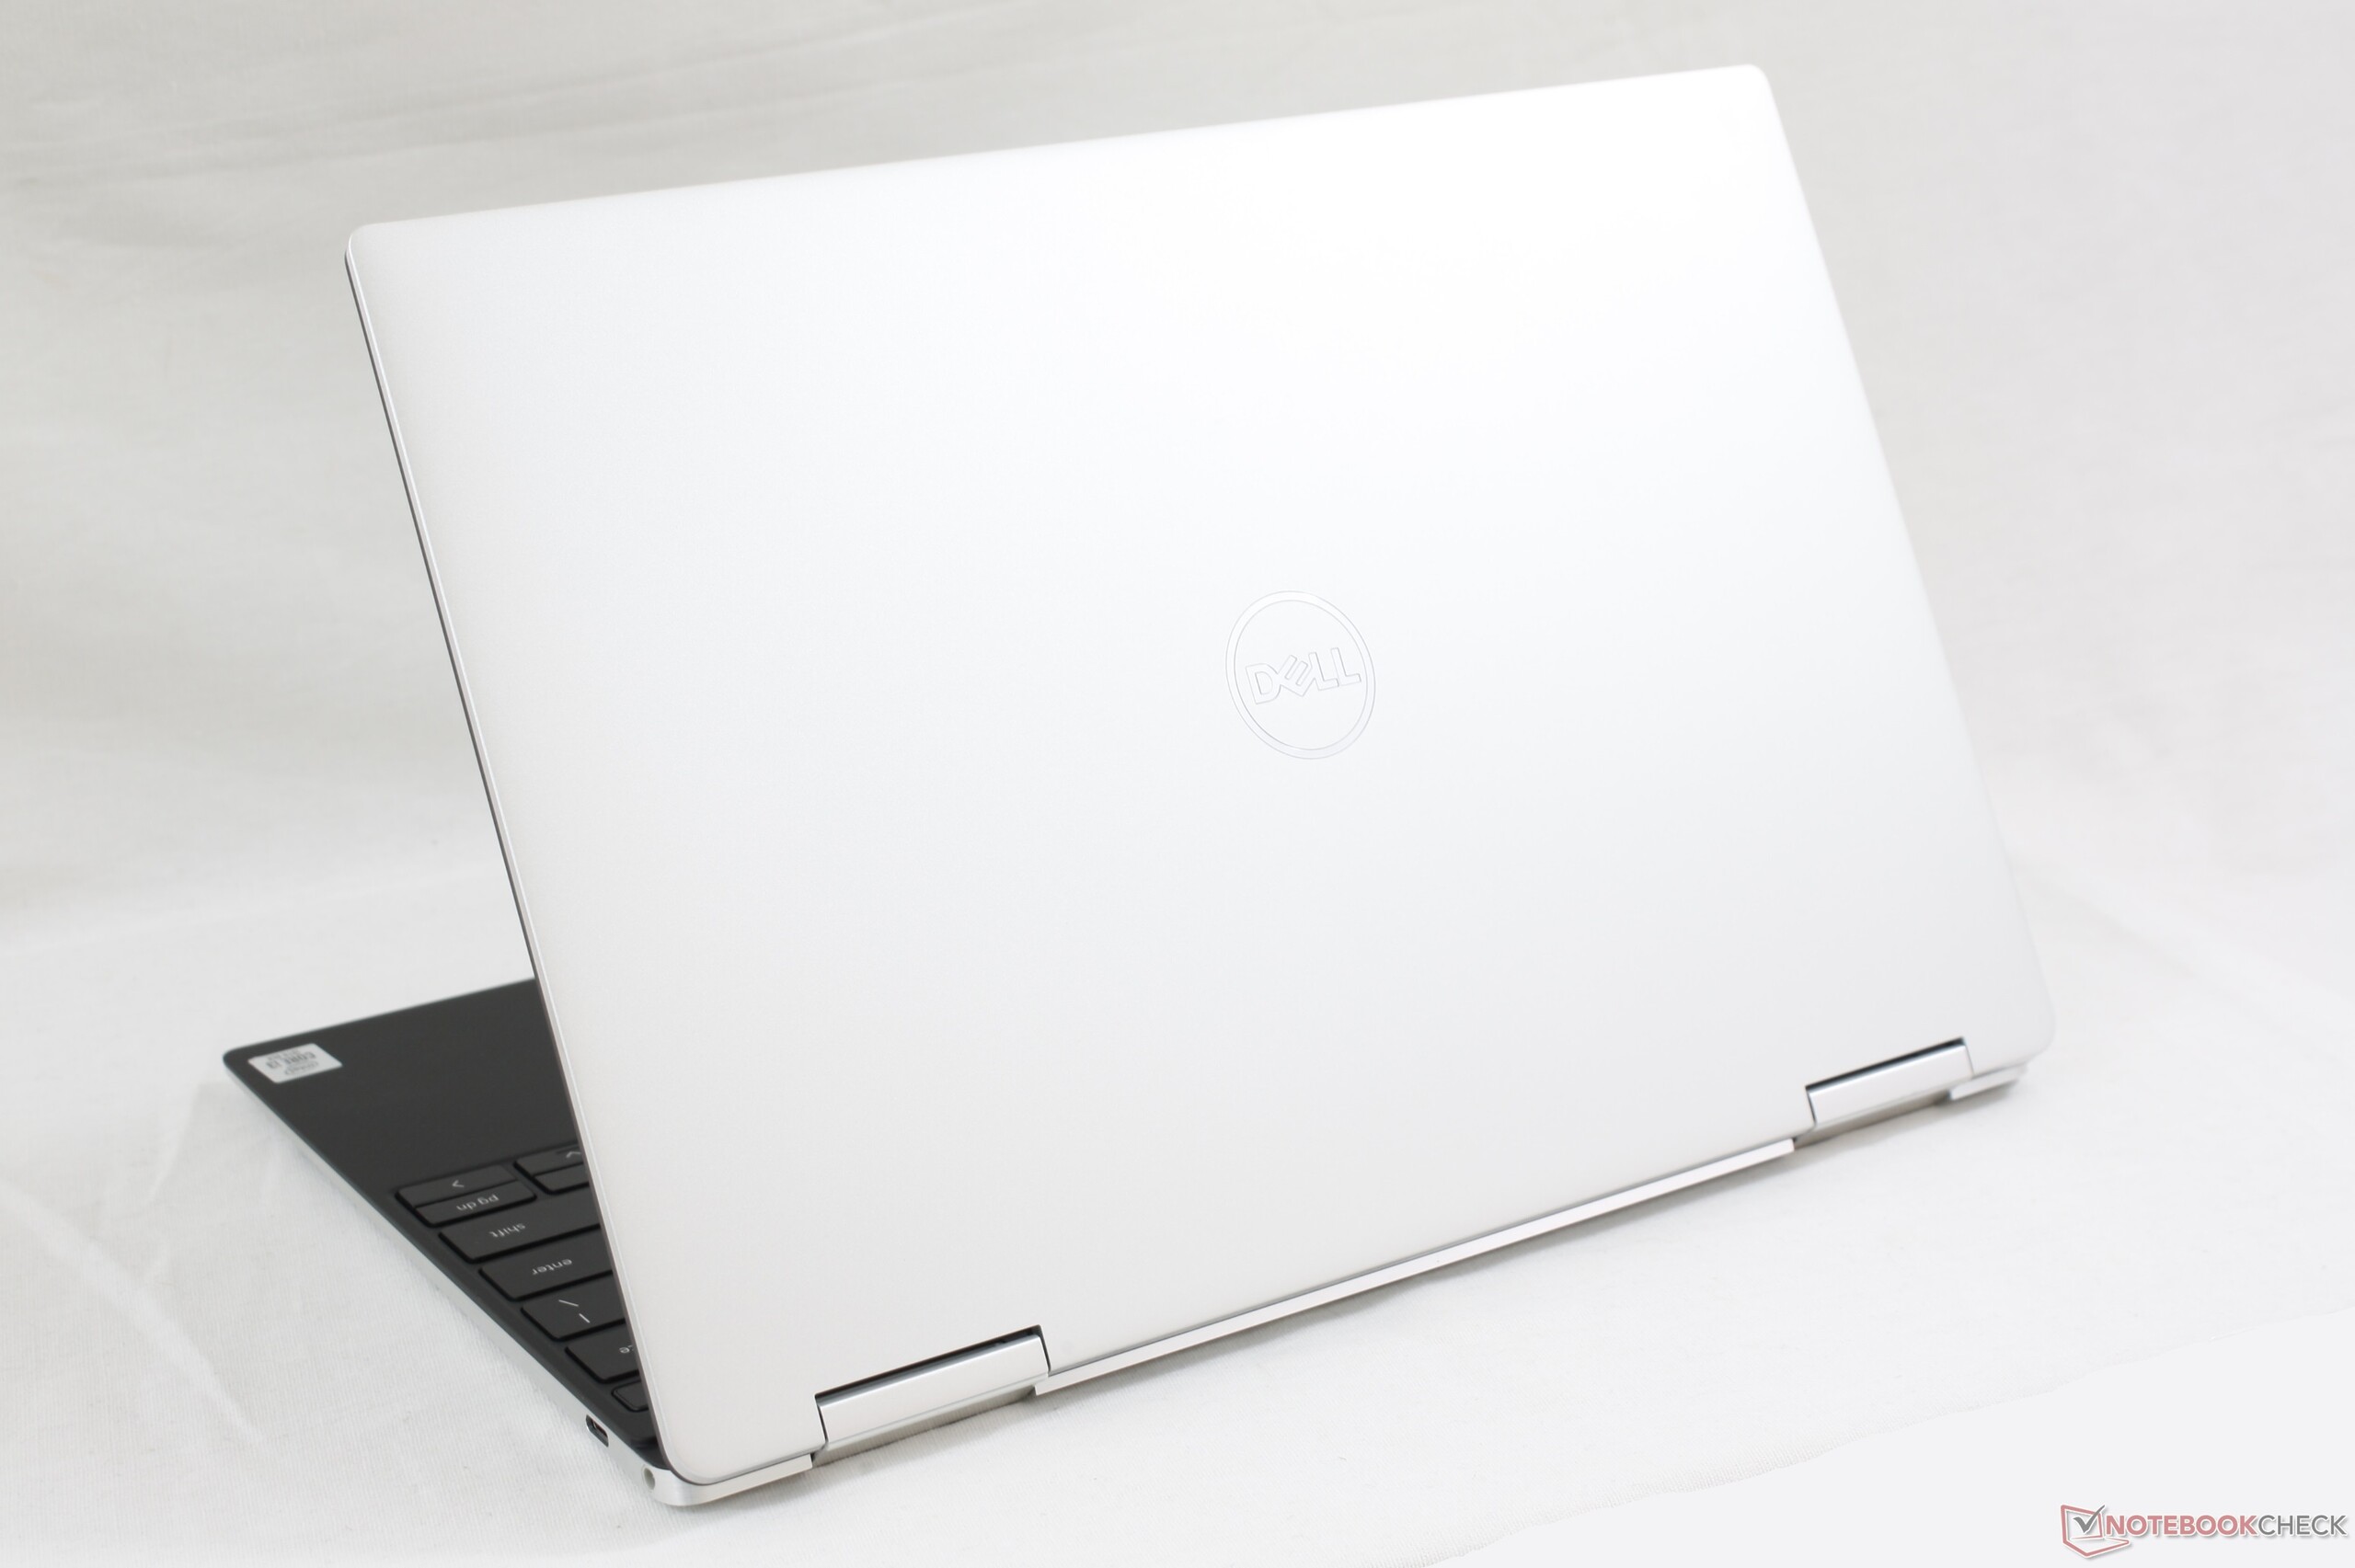
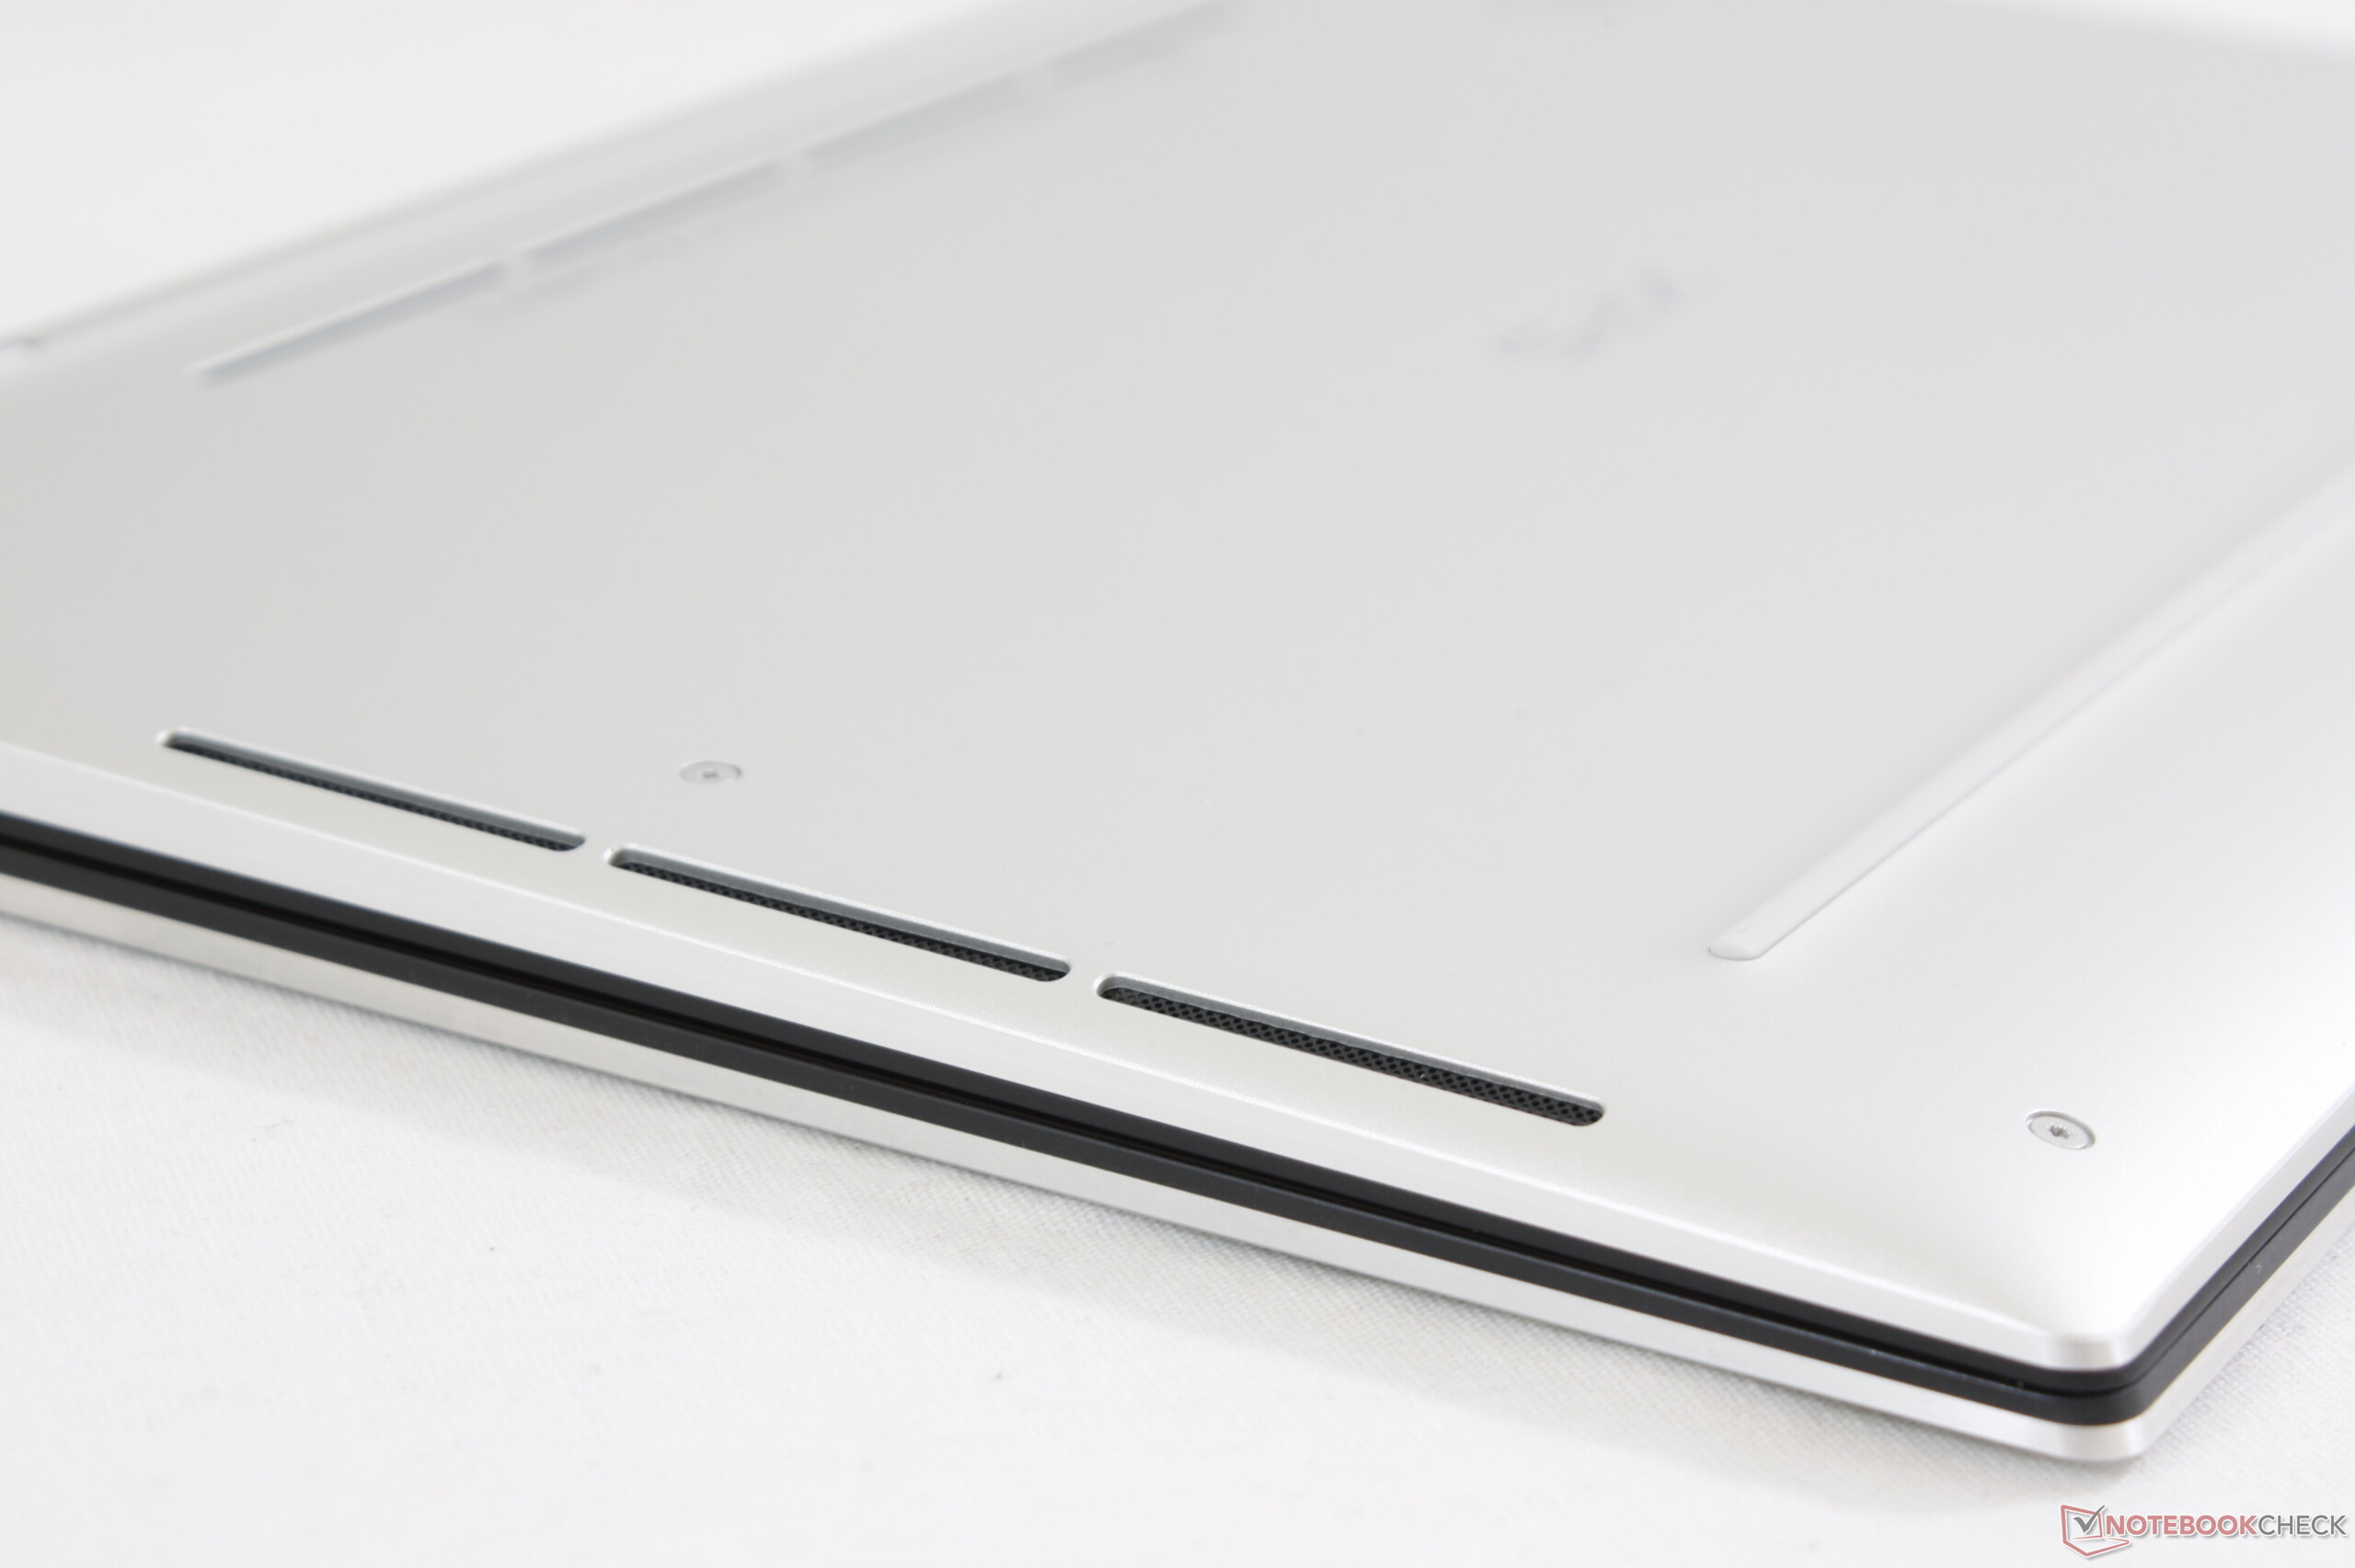
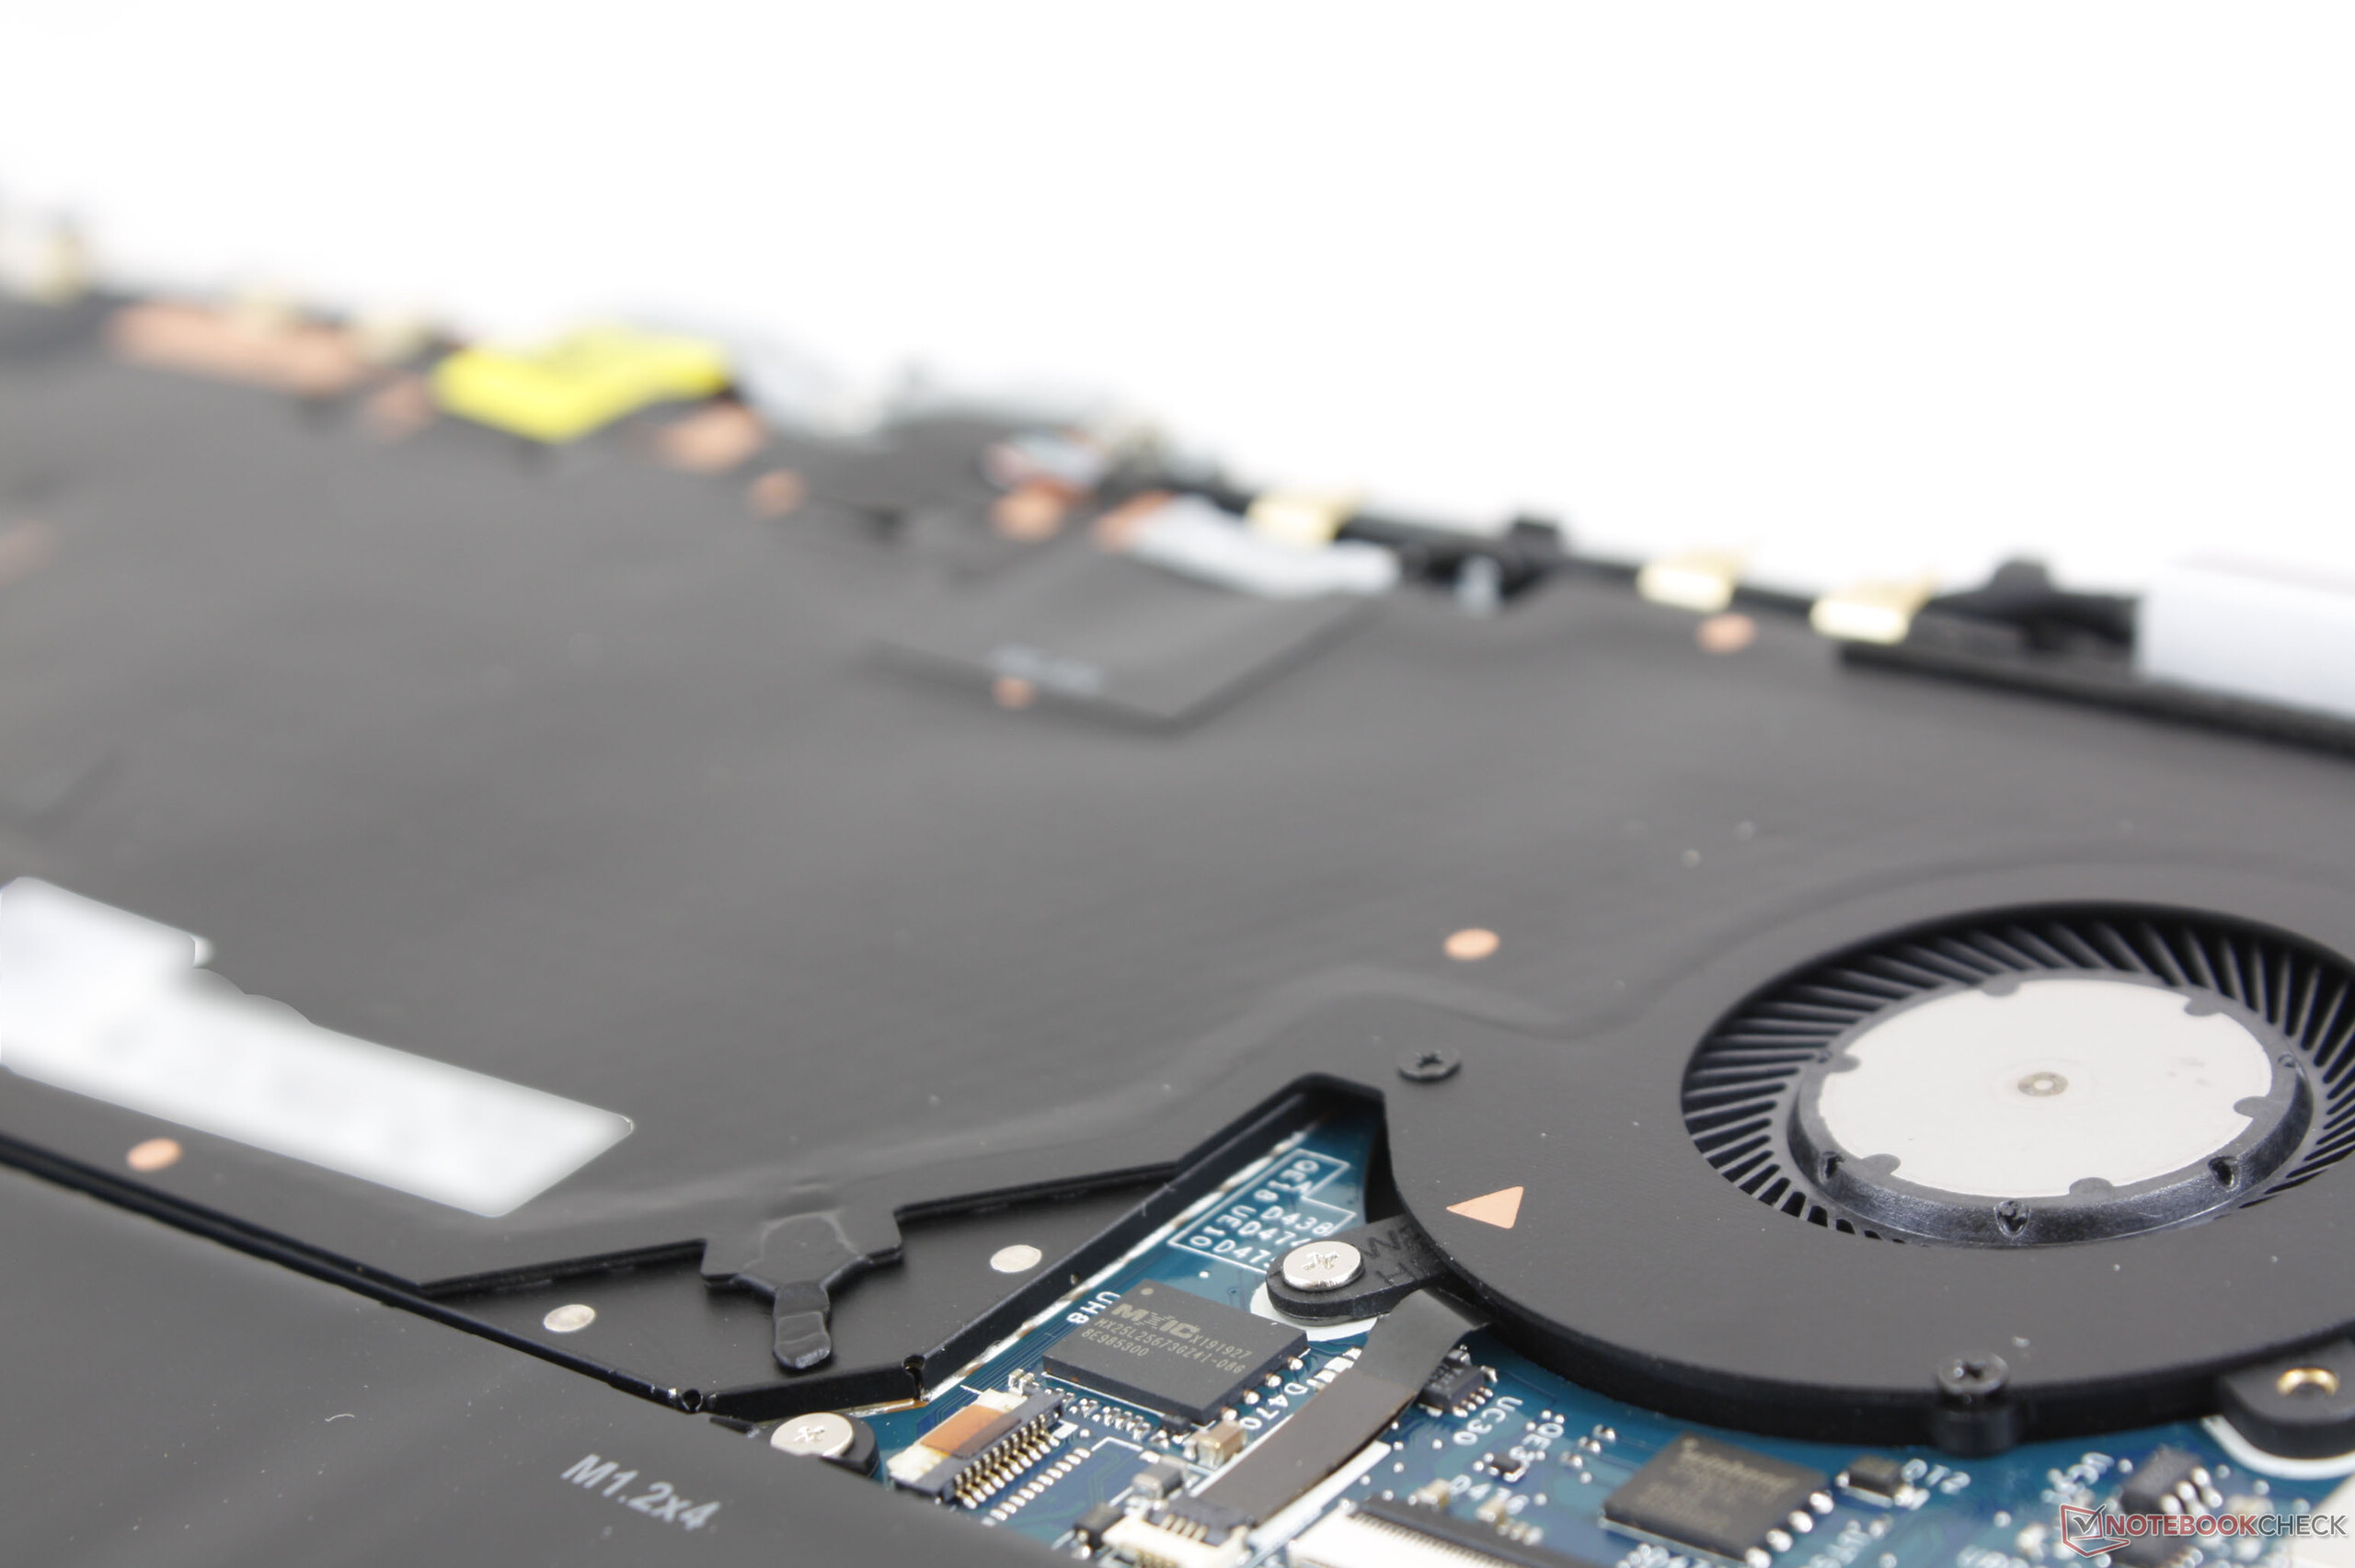
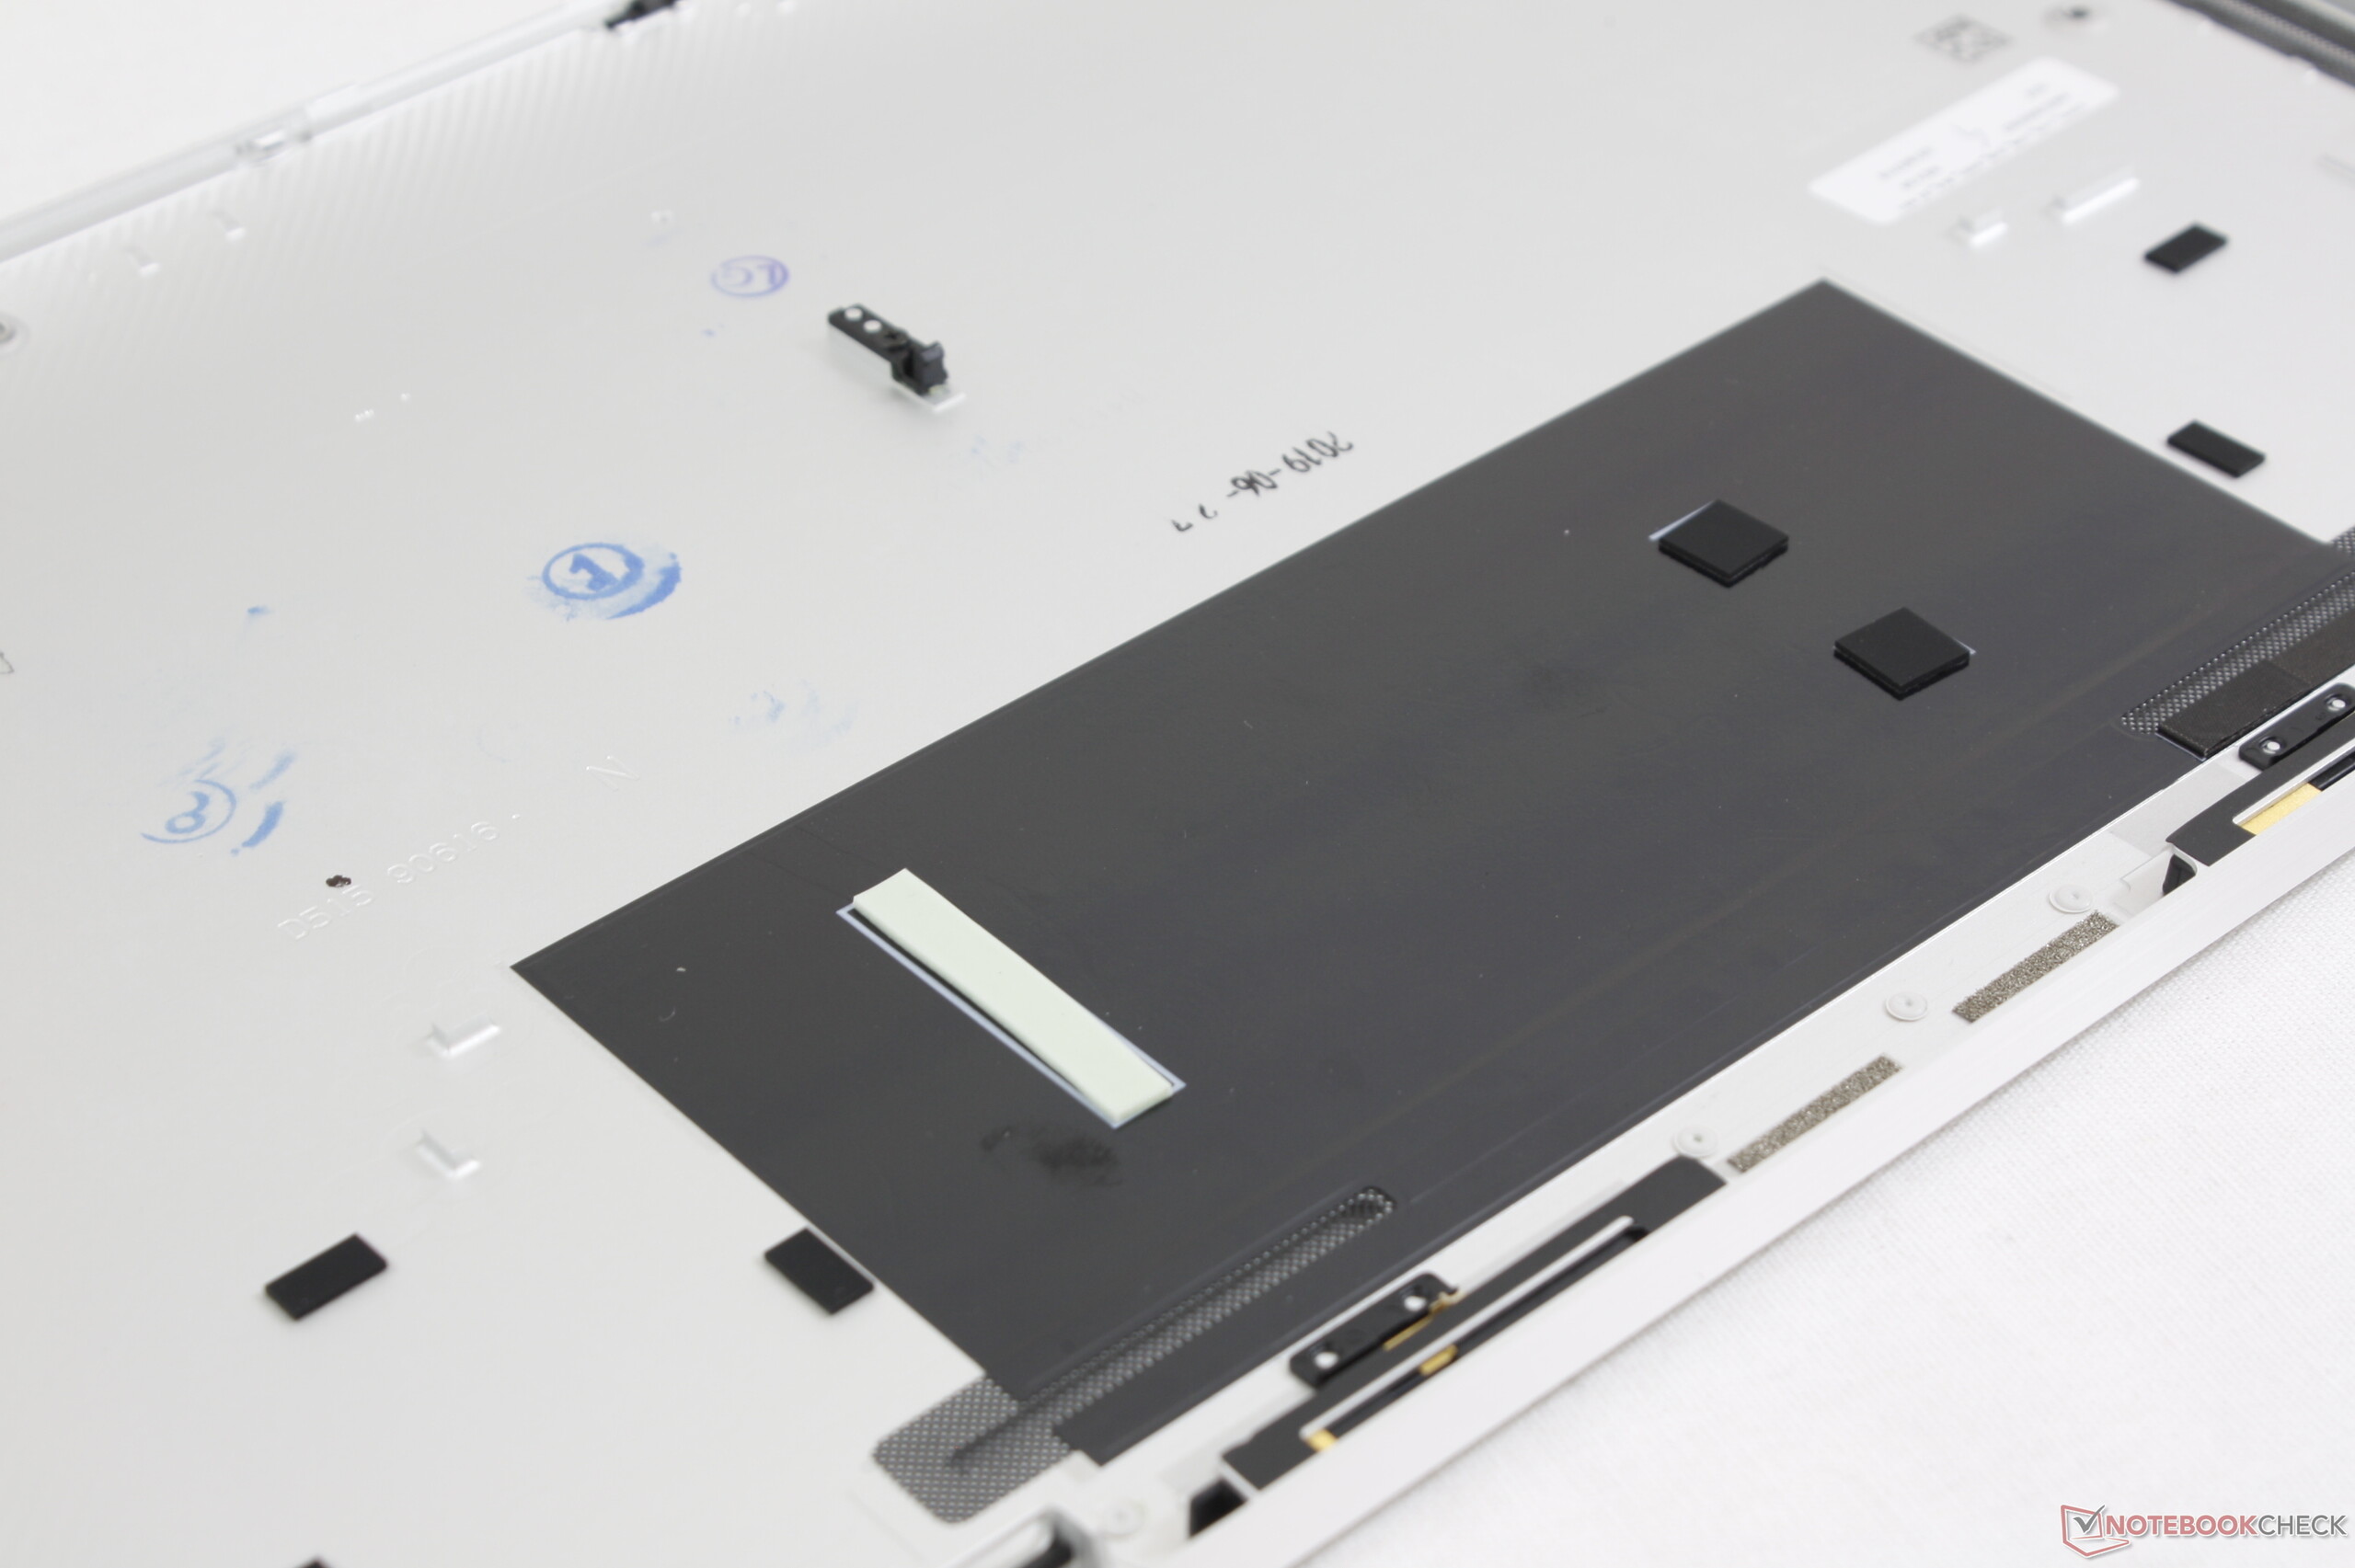
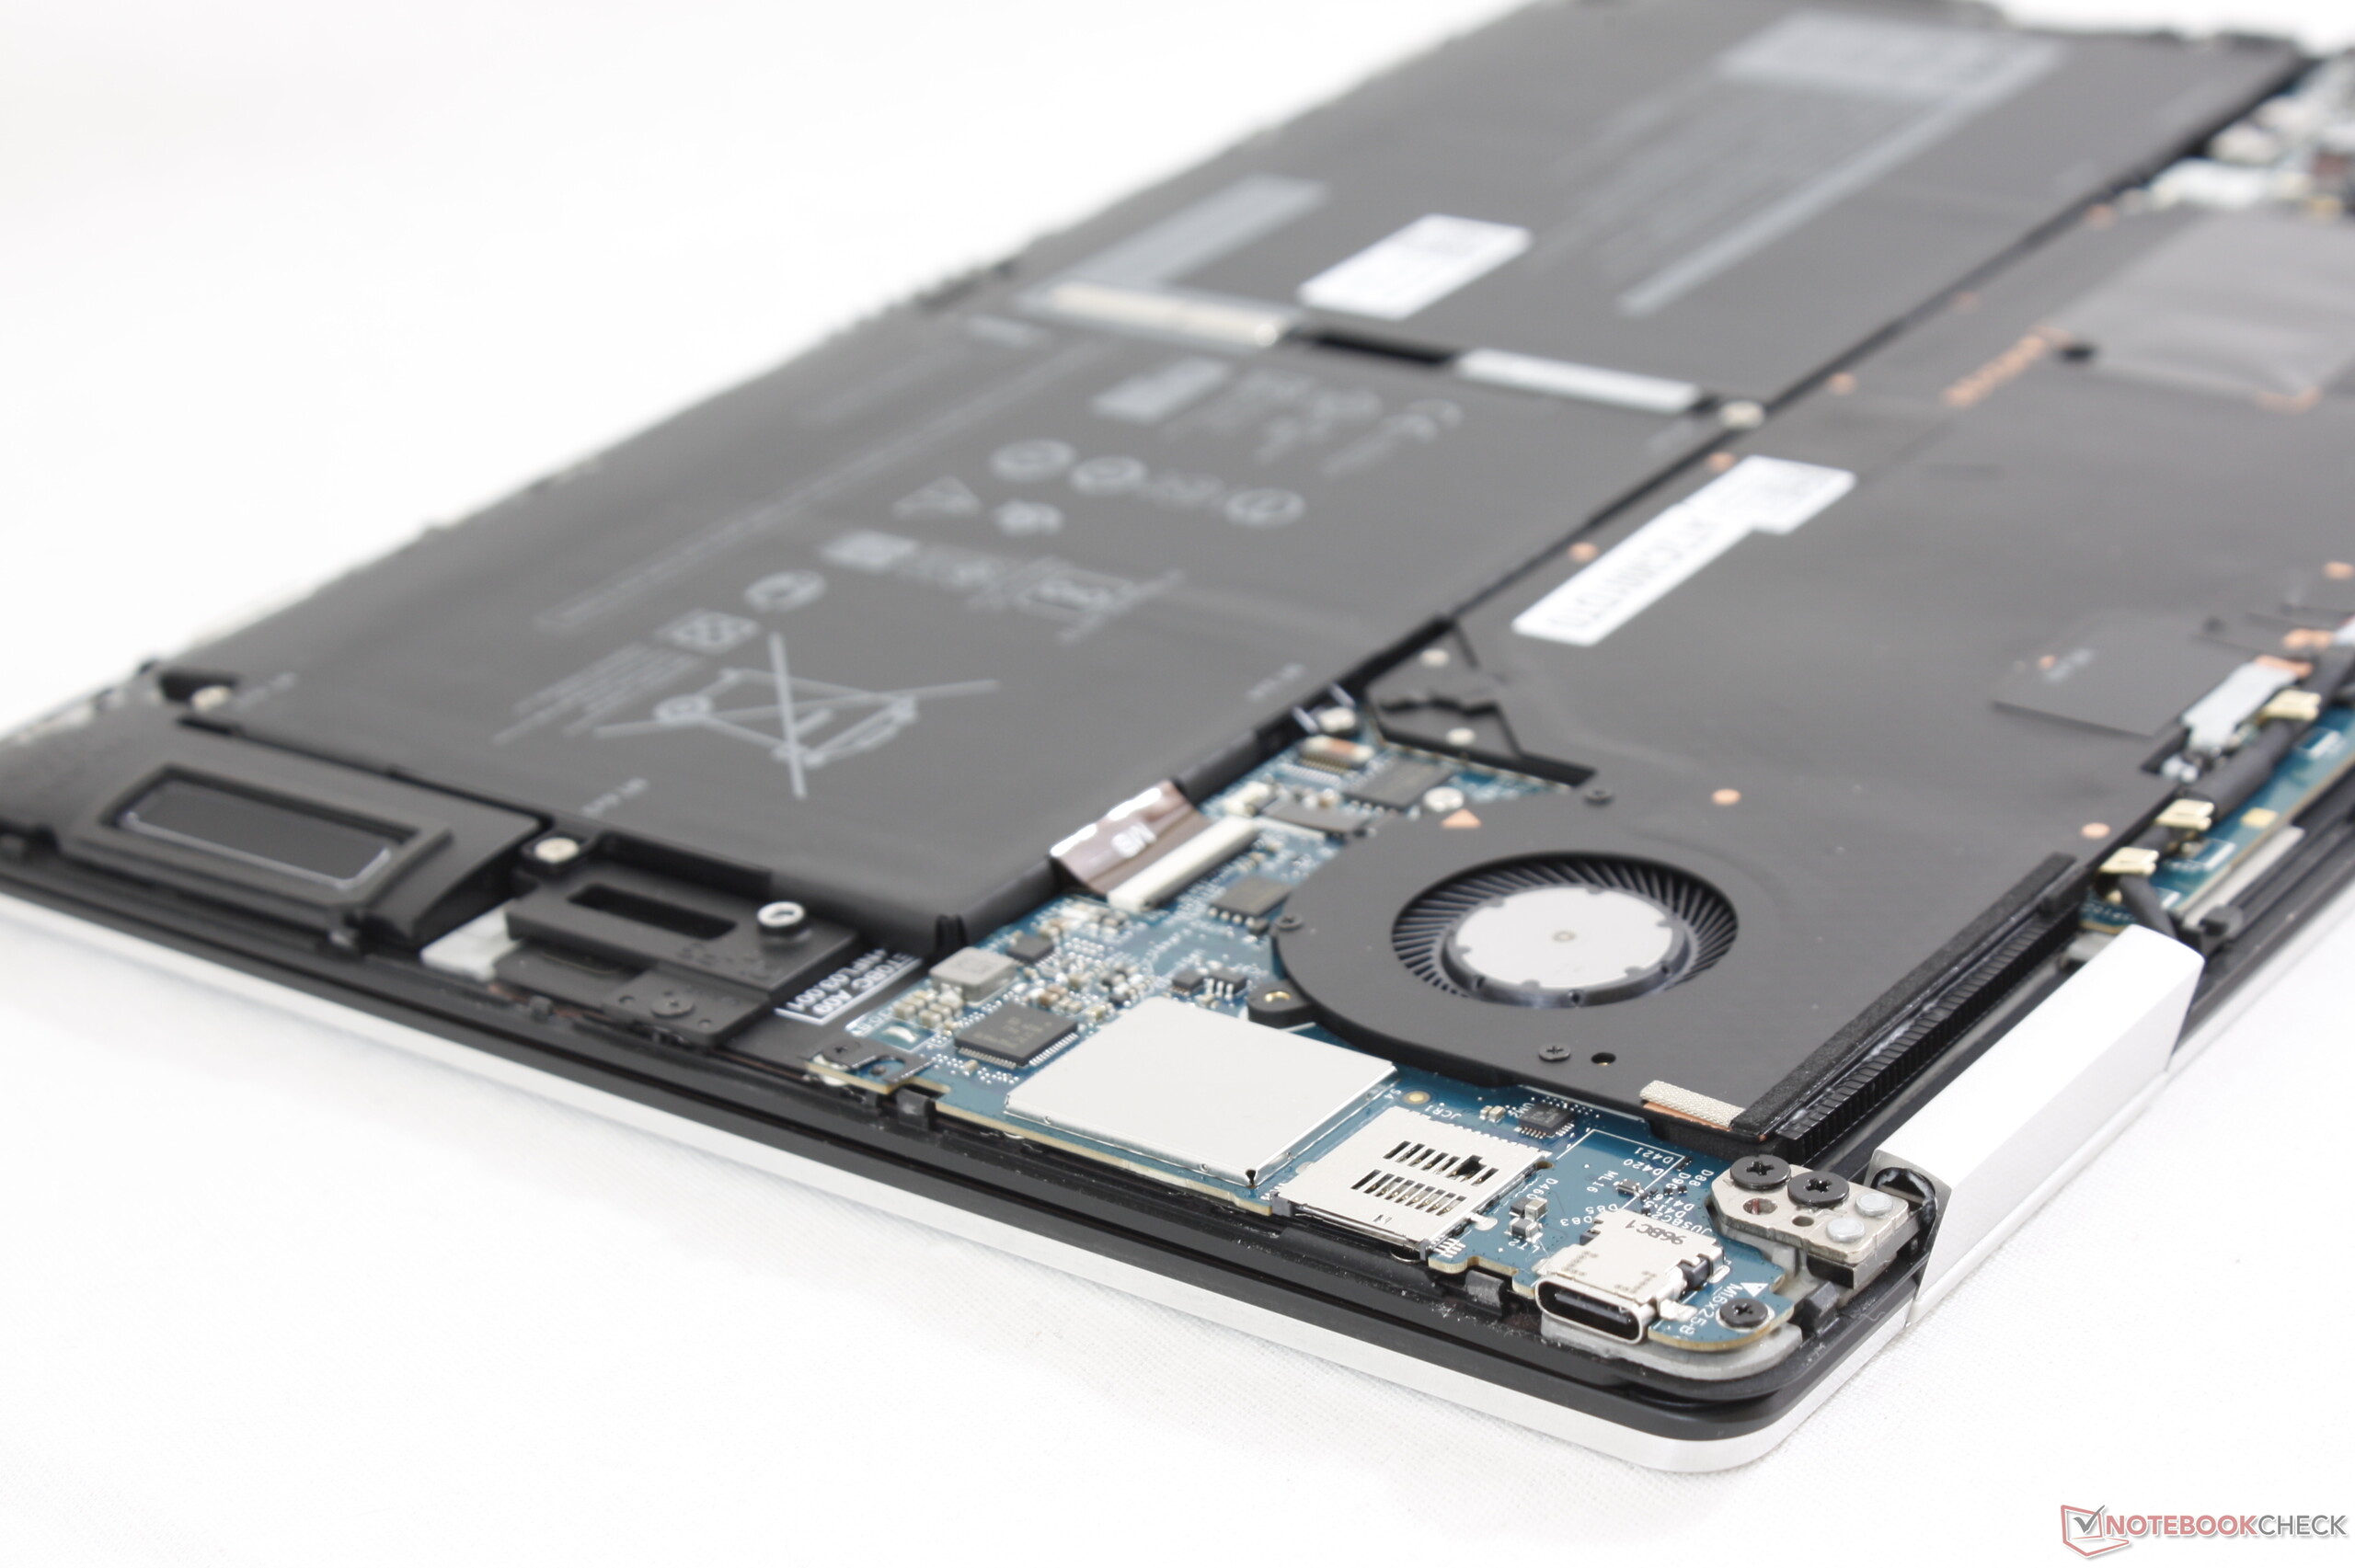
Liefhebbers zullen ongetwijfeld ontevreden zijn met de gesoldeerde componenten van de XPS 13 7390 2-in-1. Hoewel het ongetwijfeld jammer is dat belangrijke onderdelen zoals RAM, WLAN of zelfs opslag niet toegankelijk of upgradebaar zijn, richt Dell zich op een doelpubliek voor wie dergelijke features niet doorslaggevend zijn. De XPS 13 convertible tracht een stevige positie te veroveren in de 2-in-1-markt, waar detachables zoals de Surface Pro evenzeer beperkt zijn op het vlak van upgradebaarheid.
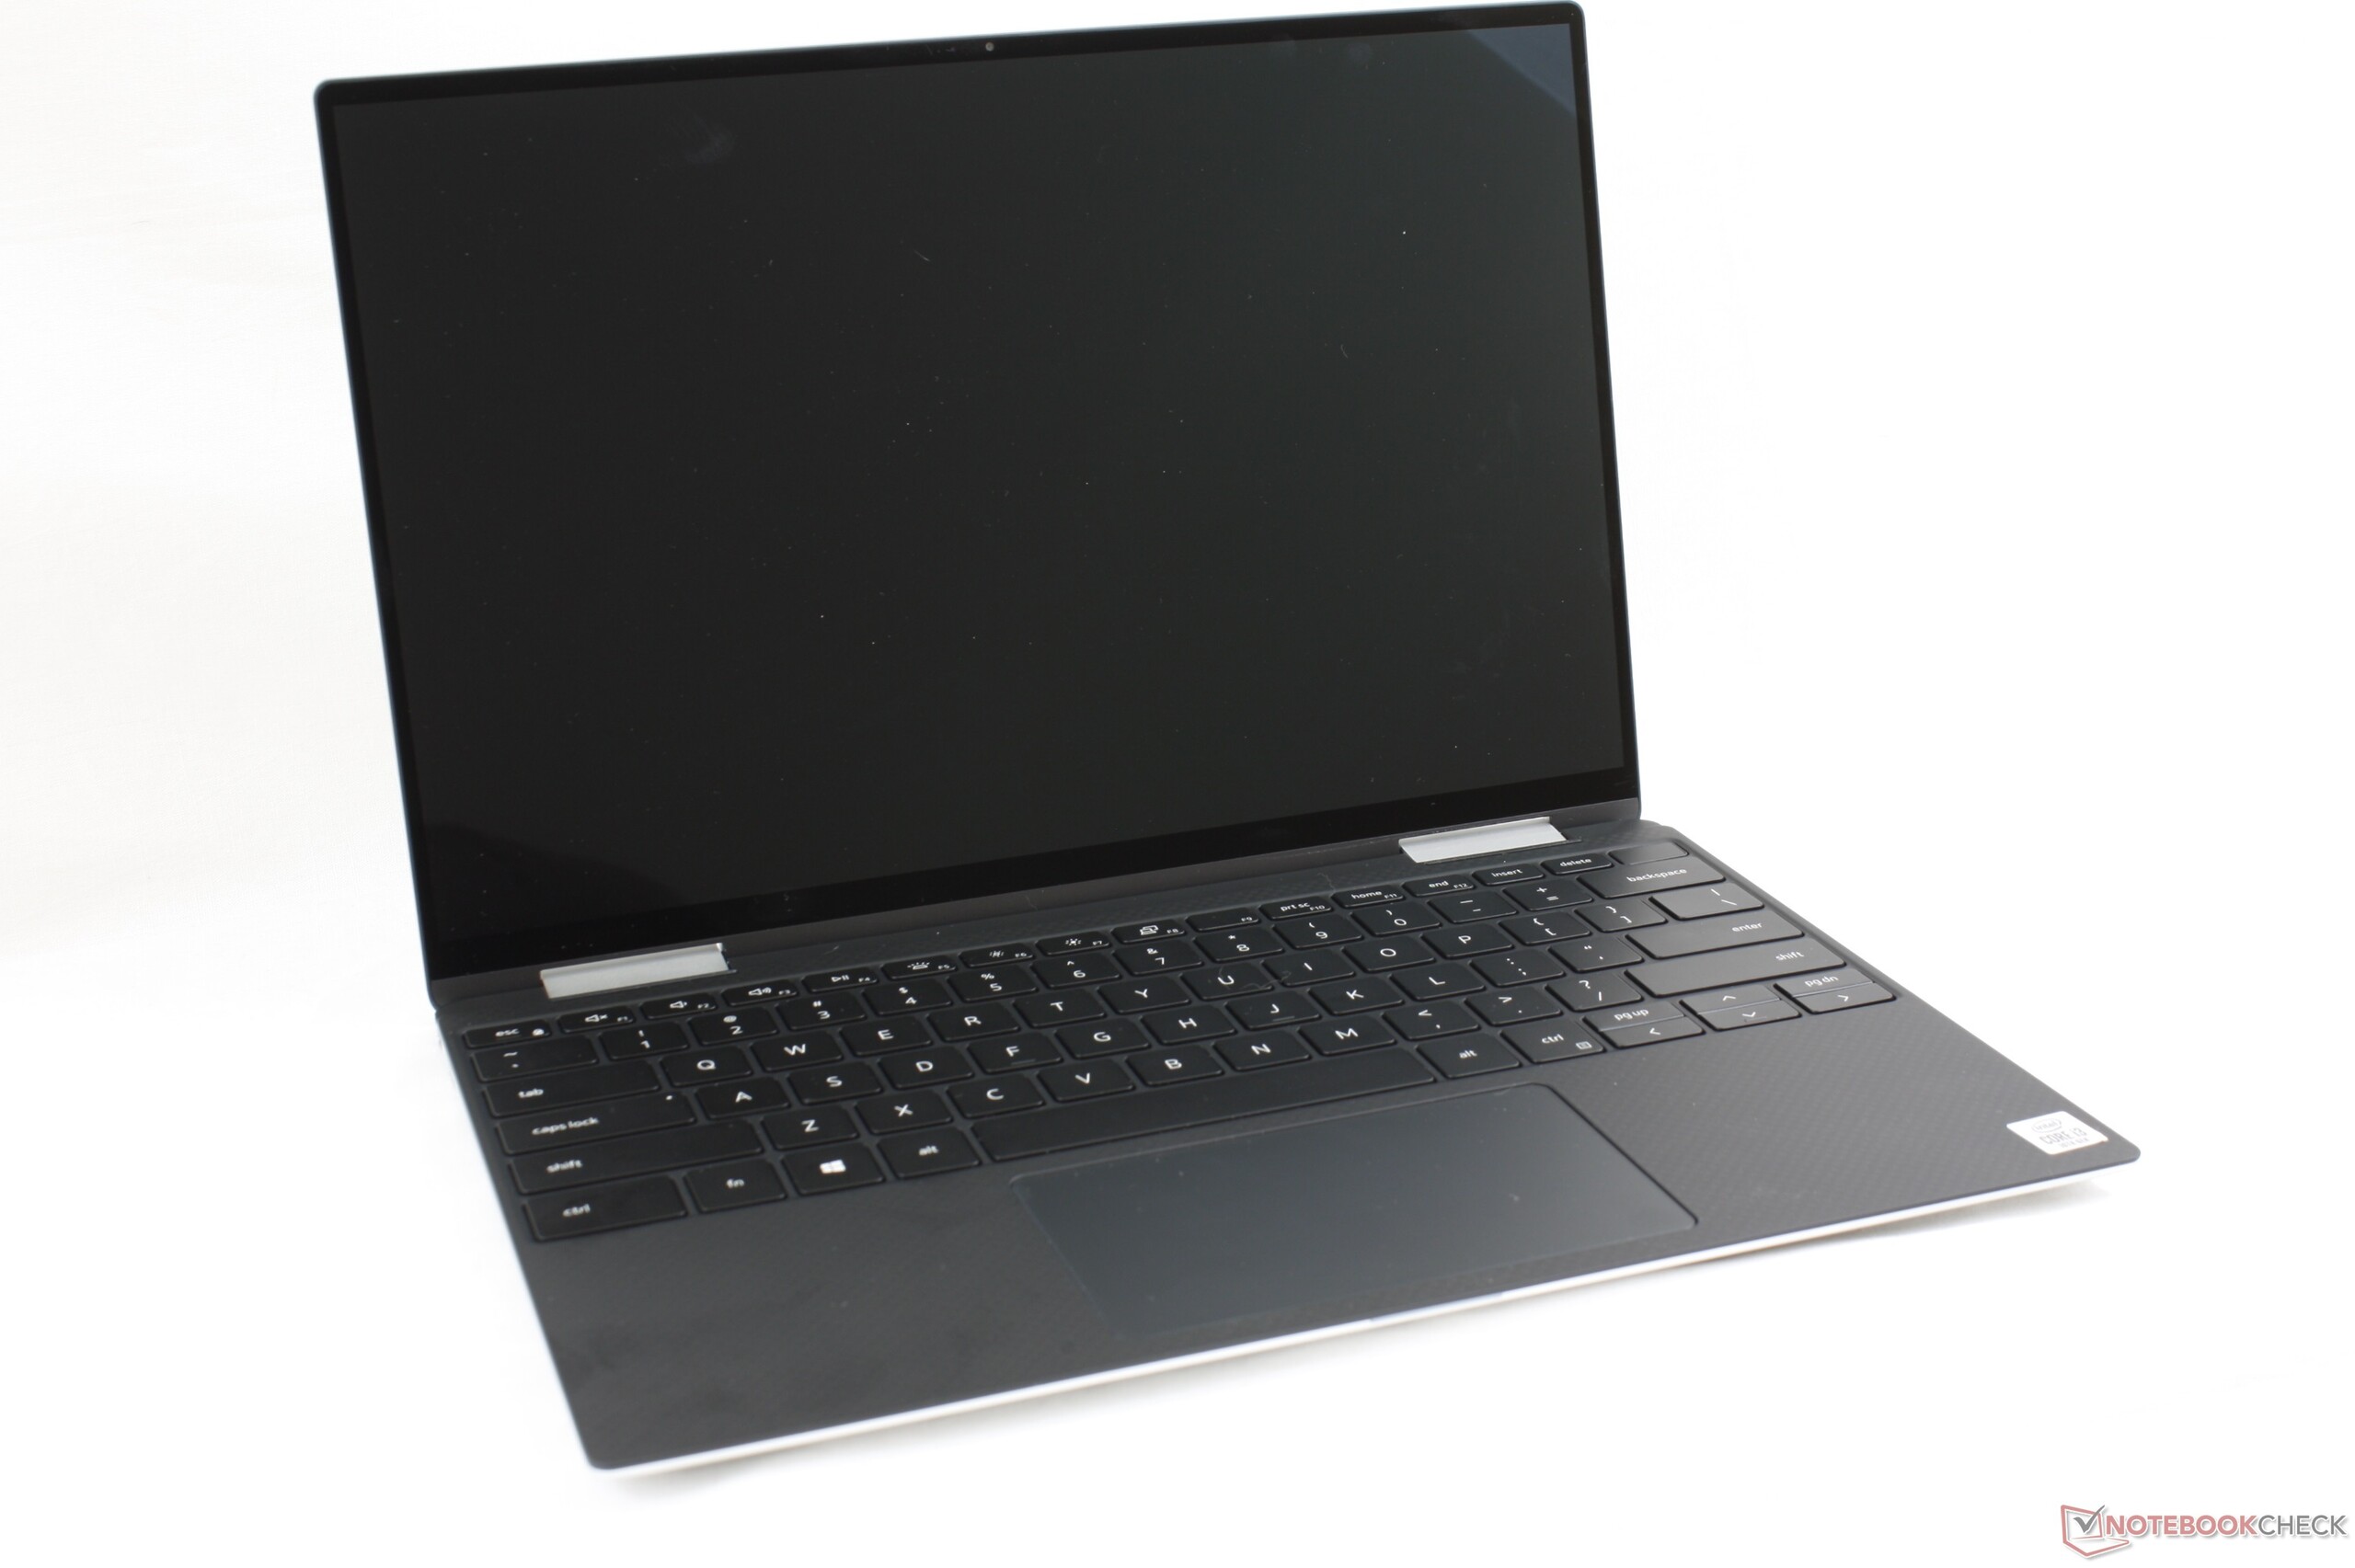
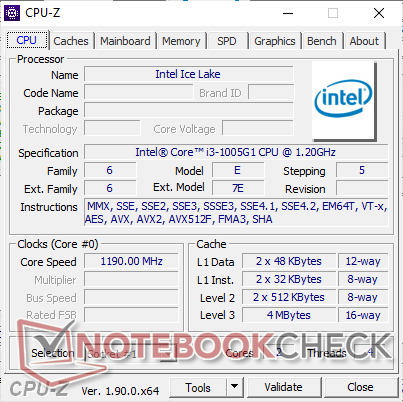
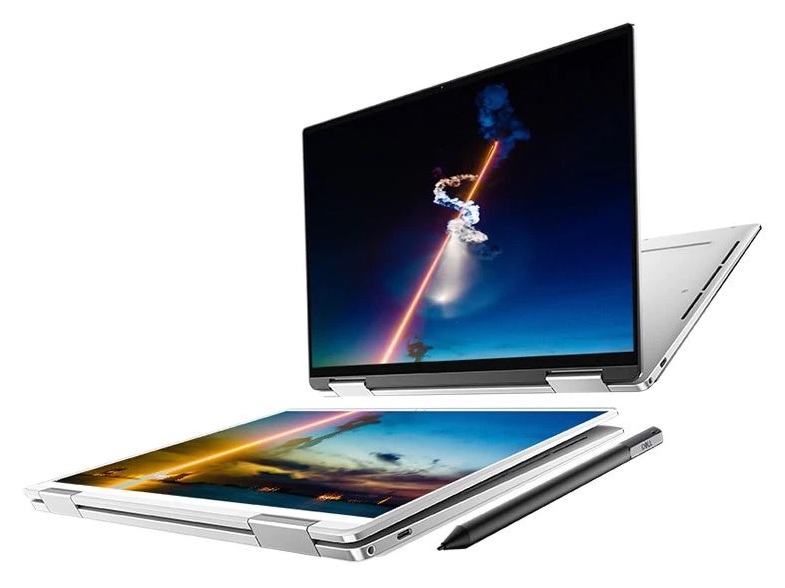
Het beste aspect van Dell's convertible is niet de nieuwe Intel Ice Lake-U-CPU, maar het scherm. Dit is zelfs voor het goedkoopste model met Core i3 objectief gezien beter dan het scherm van veel andere vlaggenschip-Ultrabooks die honderden euro's meer kosten. Het paneel is merkbaar helderder, beter gekalibreerd en dankzij de hogere 16:10-verhouding groter dan wat de meeste gebruikers gewoon zijn. Als je op zoek bent naar een 13-inch-convertible voor op reis of voor gebruik buitenshuis is dit dit een topkandidaat omwille van hoeveel helderder het scherm is in vergelijking met de concurrentie.
Wat de Core i3-1005G1 betreft: zijn zuivere CPU-rekenkracht is slechts iets beter dan de Core i3-8145U, terwijl de geïntegreerde grafische prestaties gelijk zijn aan die van de Core i7-8565U; en dat in een efficiënter 10-nm-proces. De generationele upgrade is in dit opzicht erg beperkt, al blijven de prestaties stukken hoger dan wat de oudere XPS 13 9365-serie ooit kon bieden met de Core 7Y54 of Core 7Y75.
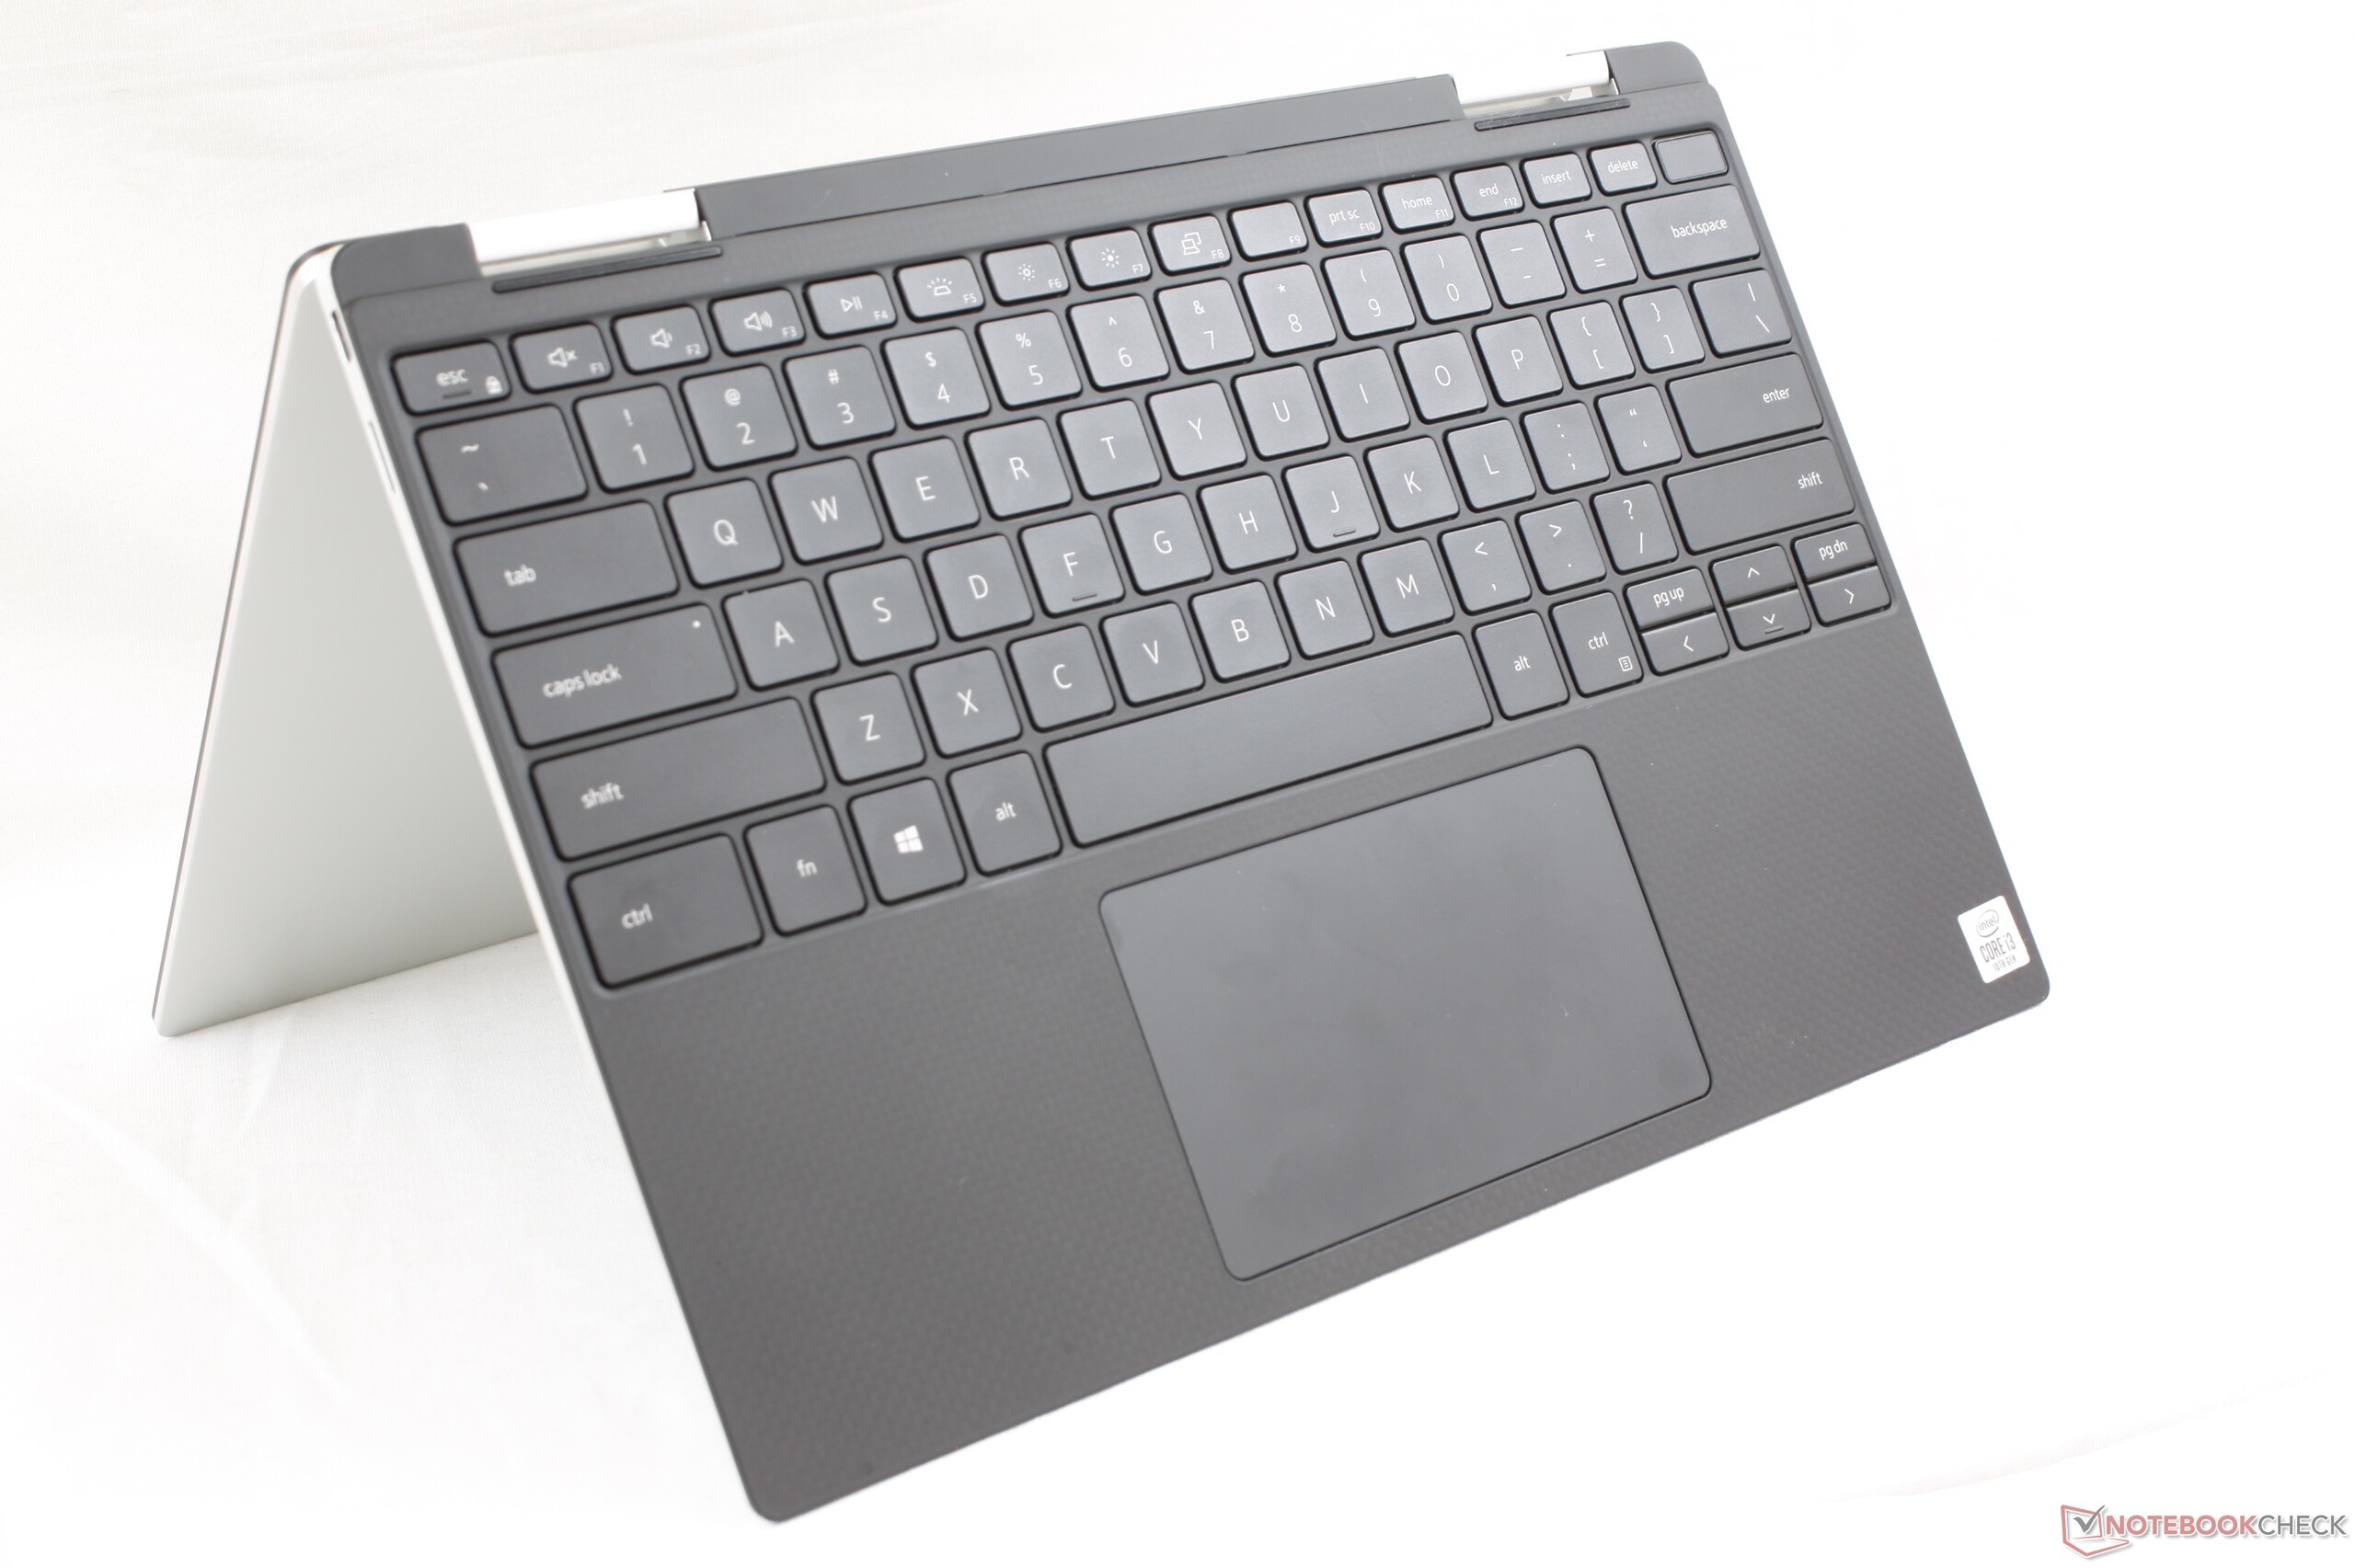
De meeste van onze klachten zijn eerder klein, maar leiden wel tot reële ergernissen. De krappe pijltjestoetsen, gevoeligheid voor vingerafdrukken, trage responstijden van het scherm, problemen met DPC latency en het gebrek aan opties voor hogere refresh rates en WWAN weerhouden ons ervan het statuut van "ultieme" subnotebook toe te kennen. Een aantal nieuwe feature van het 2017-model, waaronder Noble Lock, IR-camera en verwisselbare opslag, werden achterwege gelaten. Daarnaast lopen de core-temperaturen van de CPU bij volle belasting op tot wel 99 °C, wat verontrustend is voor de prestaties van de configuraties met Core i7. Het meest vergelijkbare alternatief dat gebruikers kunnen overwegen is de 14-inch HP EliteBook x360 1040 G5, dat de enige subnotebook is die we kennen met WWAN, een ultrahelder 120-Hz-scherm, upgradebare opslag en heel wat meer opties voor poorten dan de Dell in een bijna even compact toestel.
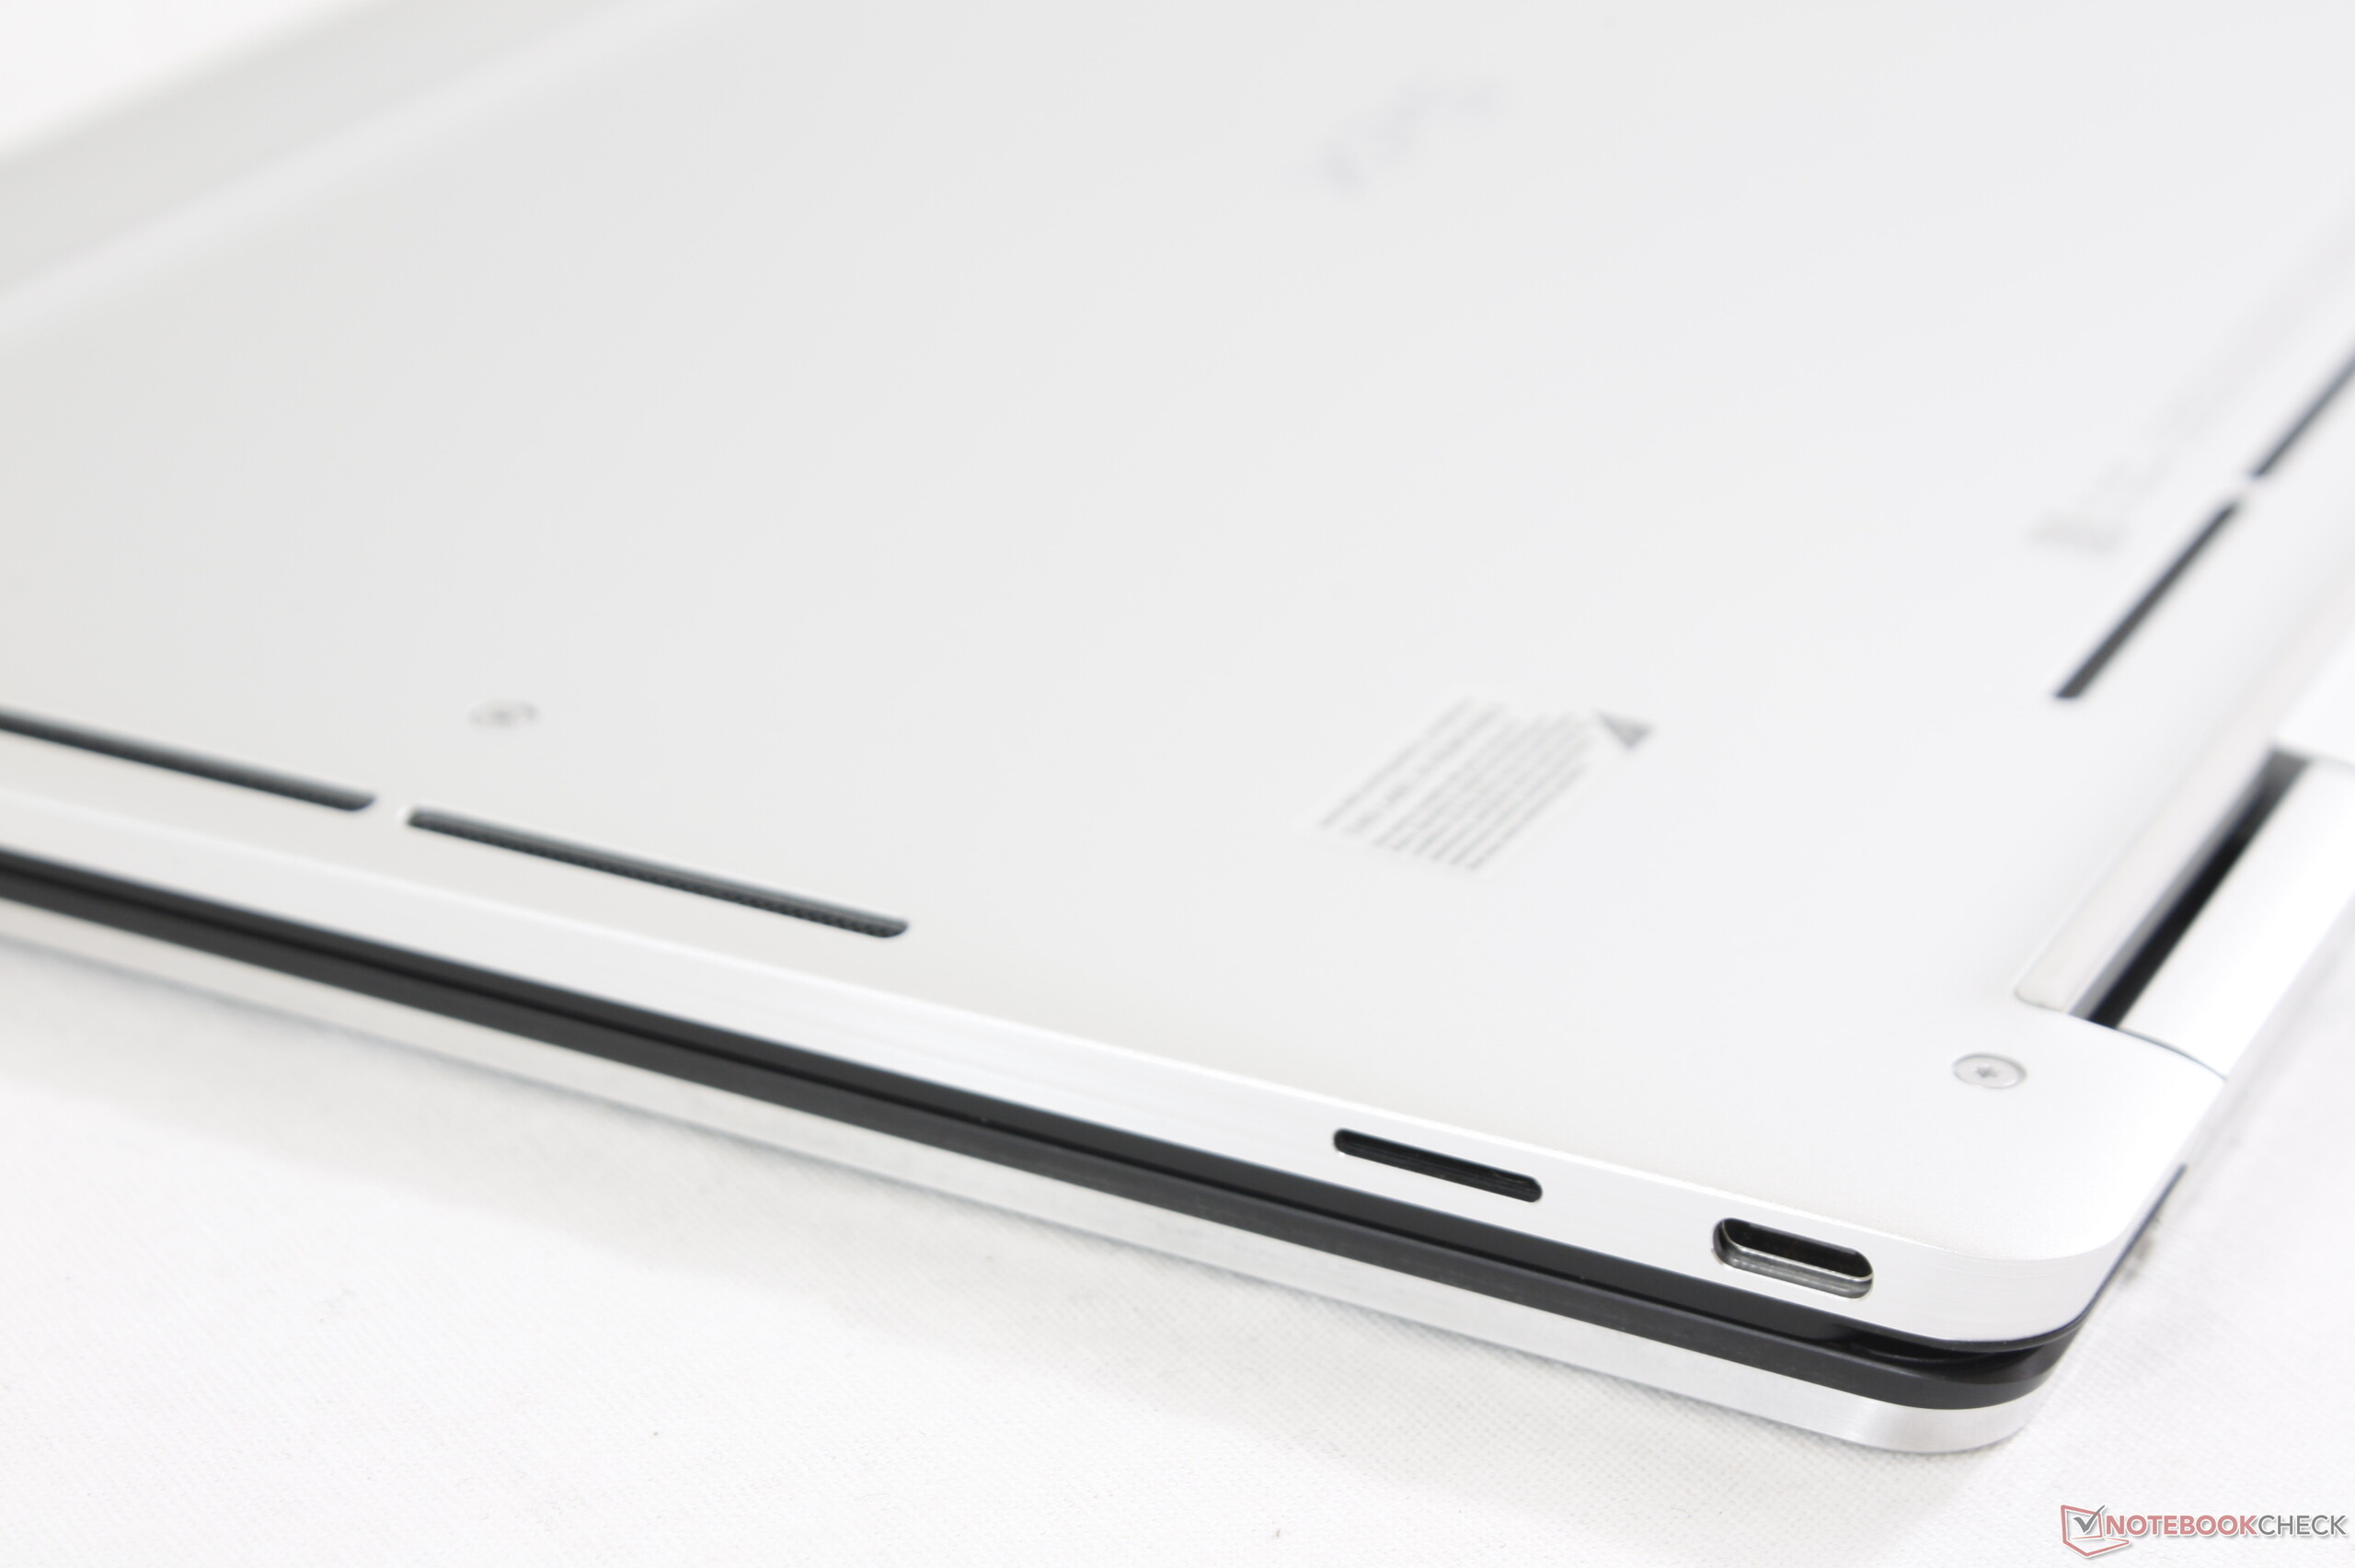
Aangezien we een aantal problemen ondervonden met de hardware van ons testtoestel, raden we aan dat gebruikers na hun aankoop meteen op zoek gaan naar afwijkingen. De vervormde luidsprekers en problemen met USB Type-C zijn ernstig genoeg dat we alleen kunnen hopen dat dit te maken heeft met pech in plaats van structurele tekortkomingen.
De 13.4-inch XPS 13 7390 2-in-1 is in bijna elk opzicht een aanzienlijke upgrade ten opzichte van de 2017 XPS 13 9365. De grootste verrassing is niet de nieuwe processor, maar het uitstekend gekalibreerde scherm dat merkbaar helderder is dan dat van de meeste andere Ultrabooks. Als je echter graag een groter formaat hebt, kan de 14-inch HP EliteBook x360 1040 G5 bijna alles wat de XPS 2-in-1 kan, maar met betere upgradebaarheid en connectiviteit.
Dell XPS 13 7390 2-in-1 Core i3
- 10-09-2019 v7 (old)
Allen Ngo
Price comparison
