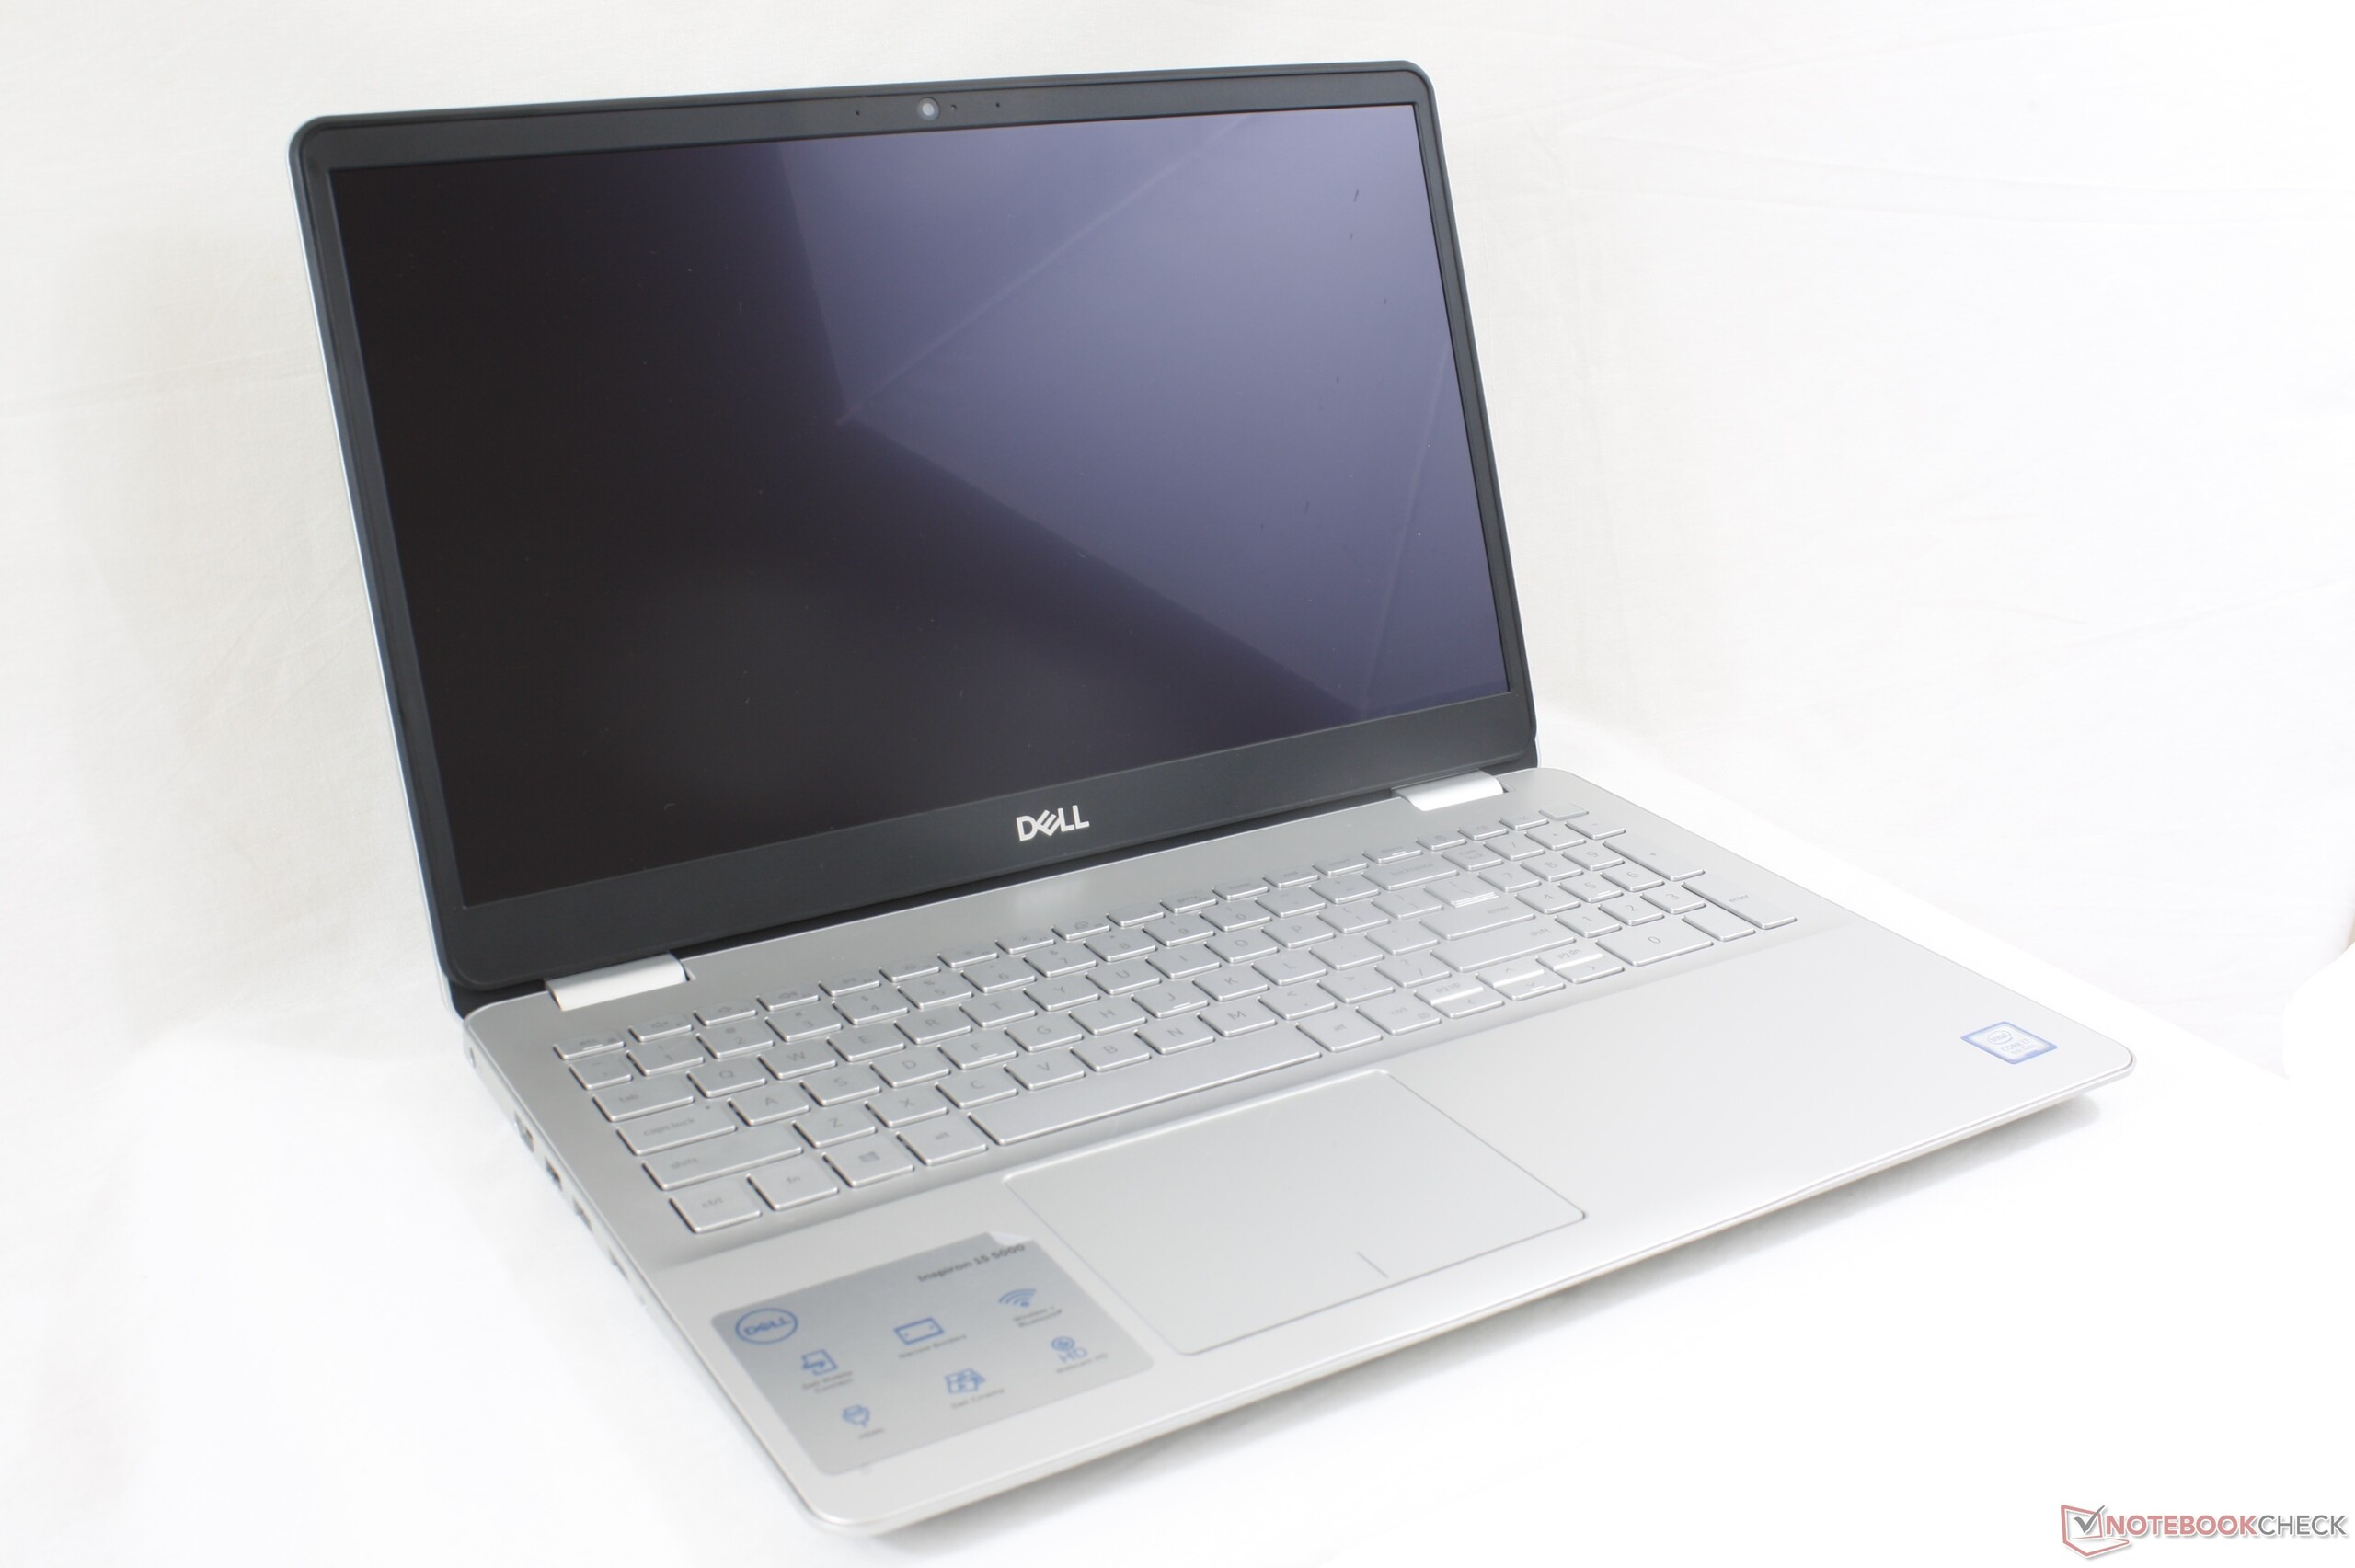
Kort testrapport Dell Inspiron 15 5000 5584 (i7-8565U) Laptop
| SD Card Reader | |
| average JPG Copy Test (av. of 3 runs) | |
| Dell XPS 15 9570 i7 UHD (Toshiba Exceria Pro SDXC 64 GB UHS-II) | |
| Acer Aspire 5 A515-52G-723L (Toshiba Exceria Pro SDXC 64 GB UHS-II) | |
| HP Pavilion 15-cs2019ng (Toshiba Exceria Pro SDXC 64 GB UHS-II) | |
| Dell Inspiron 15 5575-98MH4 (Toshiba Exceria Pro SDXC 64 GB UHS-II) | |
| Dell Inspiron 15 5000 5584 (Toshiba Exceria Pro SDXC 64 GB UHS-II) | |
| maximum AS SSD Seq Read Test (1GB) | |
| Dell XPS 15 9570 i7 UHD (Toshiba Exceria Pro SDXC 64 GB UHS-II) | |
| Acer Aspire 5 A515-52G-723L (Toshiba Exceria Pro SDXC 64 GB UHS-II) | |
| Dell Inspiron 15 5575-98MH4 (Toshiba Exceria Pro SDXC 64 GB UHS-II) | |
| HP Pavilion 15-cs2019ng (Toshiba Exceria Pro SDXC 64 GB UHS-II) | |
| Dell Inspiron 15 5000 5584 (Toshiba Exceria Pro SDXC 64 GB UHS-II) | |
| Networking | |
| iperf3 transmit AX12 | |
| Acer Aspire 5 A515-52G-723L | |
| Dell XPS 15 9570 i7 UHD | |
| HP Pavilion 15-cs2019ng | |
| Dell Inspiron 15 5575-98MH4 | |
| Dell Inspiron 15 5000 5584 | |
| iperf3 receive AX12 | |
| HP Pavilion 15-cs2019ng | |
| Dell XPS 15 9570 i7 UHD | |
| Acer Aspire 5 A515-52G-723L | |
| Dell Inspiron 15 5575-98MH4 | |
| Dell Inspiron 15 5000 5584 | |
| |||||||||||||||||||||||||
Helderheidsverdeling: 92 %
Helderheid in Batterij-modus: 227 cd/m²
Contrast: 1081:1 (Zwart: 0.21 cd/m²)
ΔE ColorChecker Calman: 6.55 | ∀{0.5-29.43 Ø4.73}
calibrated: 4.61
ΔE Greyscale Calman: 5.2 | ∀{0.09-98 Ø4.97}
58.2% sRGB (Argyll 1.6.3 3D)
37% AdobeRGB 1998 (Argyll 1.6.3 3D)
40.48% AdobeRGB 1998 (Argyll 3D)
58.8% sRGB (Argyll 3D)
39.17% Display P3 (Argyll 3D)
Gamma: 2.66
CCT: 6434 K
| Dell Inspiron 15 5000 5584 AU Optronics AUO22ED, B156HAK, IPS, 15.6", 1920x1080 | Dell XPS 15 9570 i7 UHD LQ156D1, IPS, 15.6", 3840x2160 | HP Pavilion 15-cs2019ng BOE080D, IPS, 15.6", 1920x1080 | Acer Aspire 5 A515-52G-723L BOE NV156FHM-N48, IPS, 15.6", 1920x1080 | Lenovo Yoga 730-15IKB BOE HF NV156QUM-N51, IPS, 15.6", 3840x2160 | Dell Inspiron 15 5575-98MH4 Innolux JMC9X 156BGA, TN LED, 15.6", 1366x768 | |
|---|---|---|---|---|---|---|
| Display | 89% | 60% | 1% | 64% | 2% | |
| Display P3 Coverage (%) | 39.17 | 79.1 102% | 67.2 72% | 40.02 2% | 68.7 75% | 40.02 2% |
| sRGB Coverage (%) | 58.8 | 98.8 68% | 88.1 50% | 58.5 -1% | 90 53% | 59.8 2% |
| AdobeRGB 1998 Coverage (%) | 40.48 | 79.2 96% | 64.4 59% | 41.34 2% | 65.8 63% | 41.37 2% |
| Response Times | -3% | 7% | -3% | 22% | 8% | |
| Response Time Grey 50% / Grey 80% * (ms) | 48.8 ? | 46.4 ? 5% | 43 ? 12% | 45 ? 8% | 34 ? 30% | 50 ? -2% |
| Response Time Black / White * (ms) | 29.2 ? | 32 ? -10% | 29 ? 1% | 33 ? -13% | 25 ? 14% | 24 ? 18% |
| PWM Frequency (Hz) | 980 ? | 208 ? | 250 ? | 961 ? | 250 ? | |
| Screen | 44% | 26% | 13% | 20% | -34% | |
| Brightness middle (cd/m²) | 227 | 494 118% | 320 41% | 278 22% | 309 36% | 197 -13% |
| Brightness (cd/m²) | 230 | 457 99% | 293 27% | 271 18% | 299 30% | 195 -15% |
| Brightness Distribution (%) | 92 | 88 -4% | 86 -7% | 89 -3% | 84 -9% | 78 -15% |
| Black Level * (cd/m²) | 0.21 | 0.34 -62% | 0.26 -24% | 0.26 -24% | 0.29 -38% | 0.43 -105% |
| Contrast (:1) | 1081 | 1453 34% | 1231 14% | 1069 -1% | 1066 -1% | 458 -58% |
| Colorchecker dE 2000 * | 6.55 | 5.2 21% | 4.5 31% | 4.73 28% | 3.9 40% | 10.35 -58% |
| Colorchecker dE 2000 max. * | 23.45 | 17.5 25% | 8.81 62% | 8.38 64% | 7.5 68% | 16.02 32% |
| Colorchecker dE 2000 calibrated * | 4.61 | 5.17 -12% | ||||
| Greyscale dE 2000 * | 5.2 | 2.7 48% | 4.71 9% | 2.59 50% | 4.58 12% | 11.25 -116% |
| Gamma | 2.66 83% | 2.1 105% | 2.45 90% | 2.38 92% | 2.43 91% | 2.08 106% |
| CCT | 6434 101% | 7038 92% | 7085 92% | 6160 106% | 7344 89% | 11592 56% |
| Color Space (Percent of AdobeRGB 1998) (%) | 37 | 71.2 92% | 58 57% | 36 -3% | 39 5% | 38 3% |
| Color Space (Percent of sRGB) (%) | 58.2 | 98.8 70% | 88 51% | 58 0% | 90 55% | 60 3% |
| Totaal Gemiddelde (Programma / Instellingen) | 43% /
47% | 31% /
30% | 4% /
9% | 35% /
29% | -8% /
-21% |
* ... kleiner is beter
Responstijd Scherm
| ↔ Responstijd Zwart naar Wit | ||
|---|---|---|
| 29.2 ms ... stijging ↗ en daling ↘ gecombineerd | ↗ 15.6 ms stijging | 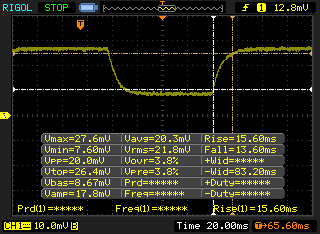 |
| ↘ 13.6 ms daling | ||
| Het scherm vertoonde relatief trage responstijden in onze tests en is misschien te traag voor games. Ter vergelijking: alle testtoestellen variëren van 0.1 (minimum) tot 240 (maximum) ms. » 78 % van alle toestellen zijn beter. Dit betekent dat de gemeten responstijd slechter is dan het gemiddelde (19.9 ms) van alle geteste toestellen. | ||
| ↔ Responstijd 50% Grijs naar 80% Grijs | ||
| 48.8 ms ... stijging ↗ en daling ↘ gecombineerd | ↗ 25.6 ms stijging | 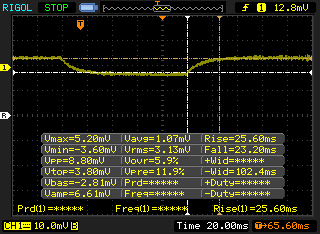 |
| ↘ 23.2 ms daling | ||
| Het scherm vertoonde trage responstijden in onze tests en is misschien te traag voor games. Ter vergelijking: alle testtoestellen variëren van 0.165 (minimum) tot 636 (maximum) ms. » 84 % van alle toestellen zijn beter. Dit betekent dat de gemeten responstijd slechter is dan het gemiddelde (31.1 ms) van alle geteste toestellen. | ||
Screen Flickering / PWM (Pulse-Width Modulation)
| Screen flickering / PWM niet waargenomen | 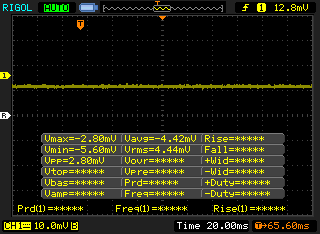 | ||
Ter vergelijking: 52 % van alle geteste toestellen maakten geen gebruik van PWM om de schermhelderheid te verlagen. Als het wel werd gebruikt, werd een gemiddelde van 7798 (minimum: 5 - maximum: 343500) Hz waargenomen. | |||
| Cinebench R11.5 | |
| CPU Single 64Bit | |
| Gemiddeld Intel Core i7-8565U (0.65 - 2.16, n=11) | |
| Acer Swift 3 SF314-55-31N8 | |
| CPU Multi 64Bit | |
| Gemiddeld Intel Core i7-8565U (4.09 - 7.4, n=11) | |
| Acer Swift 3 SF314-55-31N8 | |
| Cinebench R10 | |
| Rendering Multiple CPUs 32Bit | |
| Dell G5 15 5590 | |
| Gemiddeld Intel Core i7-8565U (13806 - 23118, n=16) | |
| Acer Swift 3 SF314-55-31N8 | |
| Rendering Single 32Bit | |
| Gemiddeld Intel Core i7-8565U (2682 - 8906, n=16) | |
| Dell G5 15 5590 | |
| Acer Swift 3 SF314-55-31N8 | |
| wPrime 2.10 - 1024m | |
| Acer Swift 3 SF314-55-31N8 | |
| Gemiddeld Intel Core i7-8565U (263 - 420, n=7) | |
* ... kleiner is beter
| PCMark 8 | |
| Home Score Accelerated v2 | |
| Acer Aspire 5 A515-52G-723L | |
| Dell XPS 15 9570 i7 UHD | |
| HP Pavilion 15-cs2019ng | |
| Gemiddeld Intel Core i7-8565U, Intel UHD Graphics 620 (2577 - 4179, n=20) | |
| Lenovo Yoga 730-15IKB | |
| Dell Inspiron 15 5000 5584 | |
| Dell Inspiron 15 5575-98MH4 | |
| Work Score Accelerated v2 | |
| Acer Aspire 5 A515-52G-723L | |
| HP Pavilion 15-cs2019ng | |
| Gemiddeld Intel Core i7-8565U, Intel UHD Graphics 620 (3596 - 5189, n=19) | |
| Dell Inspiron 15 5000 5584 | |
| Dell XPS 15 9570 i7 UHD | |
| Lenovo Yoga 730-15IKB | |
| PCMark 8 Home Score Accelerated v2 | 3386 punten | |
| PCMark 8 Work Score Accelerated v2 | 4540 punten | |
| PCMark 10 Score | 4060 punten | |
Help | ||
| Dell Inspiron 15 5000 5584 Toshiba BG3 KBG30ZMS512G | HP Pavilion 15-cs2019ng Toshiba KBG30ZMV256G | Acer Aspire 5 A515-52G-723L WDC PC SN520 SDAPNUW-512G | Lenovo Yoga 730-15IKB SK Hynix PC401 512GB M.2 (HFS512GD9TNG) | Dell XPS 15 9570 Core i9 UHD Samsung SSD PM981 MZVLB1T0HALR | |
|---|---|---|---|---|---|
| AS SSD | -69% | 47% | 16% | 92% | |
| Seq Read (MB/s) | 1115 | 1153 3% | 1557 40% | 2158 94% | 1320 18% |
| Seq Write (MB/s) | 841 | 736 -12% | 1237 47% | 680 -19% | 1500 78% |
| 4K Read (MB/s) | 46.39 | 46.51 0% | 42.56 -8% | 44.74 -4% | 30.73 -34% |
| 4K Write (MB/s) | 87.6 | 114.1 30% | 127.2 45% | 123 40% | 94.4 8% |
| 4K-64 Read (MB/s) | 904 | 618 -32% | 1034 14% | 623 -31% | 1453 61% |
| 4K-64 Write (MB/s) | 326.5 | 461.4 41% | 1186 263% | 486 49% | 1815 456% |
| Access Time Read * (ms) | 0.048 | 0.421 -777% | 0.077 -60% | 0.044 8% | 0.061 -27% |
| Access Time Write * (ms) | 0.24 | 0.233 3% | 0.028 88% | 0.051 79% | 0.044 82% |
| Score Read (Points) | 1062 | 780 -27% | 1233 16% | 884 -17% | 1616 52% |
| Score Write (Points) | 498 | 649 30% | 1437 189% | 677 36% | 2059 313% |
| Score Total (Points) | 2100 | 1822 -13% | 3291 57% | 1951 -7% | 4507 115% |
| Copy ISO MB/s (MB/s) | 1090 | 1313 20% | 1641 51% | 2577 136% | |
| Copy Program MB/s (MB/s) | 618 | 334.6 -46% | 390 -37% | 515 -17% | |
| Copy Game MB/s (MB/s) | 750 | 684 -9% | 574 -23% | 1120 49% |
* ... kleiner is beter

| 3DMark 11 Performance | 1993 punten | |
| 3DMark Cloud Gate Standard Score | 8174 punten | |
| 3DMark Fire Strike Score | 1077 punten | |
Help | ||
| Dell Inspiron 15 5000 5584 UHD Graphics 620, i7-8565U, Toshiba BG3 KBG30ZMS512G | HP Pavilion 15-cs2019ng GeForce MX250, i5-8265U, Toshiba KBG30ZMV256G | Acer Aspire 5 A515-52G-723L GeForce MX250, i7-8565U, WDC PC SN520 SDAPNUW-512G | Dell XPS 15 9570 Core i9 UHD GeForce GTX 1050 Ti Max-Q, i9-8950HK, Samsung SSD PM981 MZVLB1T0HALR | Dell Inspiron 15 5575-98MH4 Vega 3, R3 2200U, Seagate Mobile HDD 1TB ST1000LM035 | LG Gram 17Z990-R.AAS7U1 UHD Graphics 620, i7-8565U, Samsung SSD PM871b MZNLN256HAJQ | |
|---|---|---|---|---|---|---|
| Noise | -18% | -13% | -10% | -11% | -4% | |
| uit / omgeving * (dB) | 28.4 | 30.5 -7% | 29.9 -5% | 28.2 1% | 30.4 -7% | 28.1 1% |
| Idle Minimum * (dB) | 28.4 | 31.5 -11% | 29.9 -5% | 28.5 -0% | 31.4 -11% | 28.1 1% |
| Idle Average * (dB) | 28.4 | 31.5 -11% | 29.9 -5% | 28.6 -1% | 31.4 -11% | 28.1 1% |
| Idle Maximum * (dB) | 28.4 | 31.5 -11% | 29.9 -5% | 28.8 -1% | 31.6 -11% | 28.1 1% |
| Load Average * (dB) | 28.9 | 42.5 -47% | 41.7 -44% | 36.2 -25% | 31.9 -10% | 35 -21% |
| Load Maximum * (dB) | 36 | 42.5 -18% | 41.7 -16% | 47.6 -32% | 40.9 -14% | 37.4 -4% |
| Witcher 3 ultra * (dB) | 47.6 |
* ... kleiner is beter
Geluidsniveau
| Onbelast |
| 28.4 / 28.4 / 28.4 dB (A) |
| Belasting |
| 28.9 / 36 dB (A) |
 | ||
30 dB stil 40 dB(A) hoorbaar 50 dB(A) luid |
||
min: | ||
(±) De maximumtemperatuur aan de bovenzijde bedraagt 40.8 °C / 105 F, vergeleken met het gemiddelde van 36.8 °C / 98 F, variërend van 21 tot 71 °C voor de klasse Multimedia.
(-) De bodem warmt op tot een maximum van 47.4 °C / 117 F, vergeleken met een gemiddelde van 39.1 °C / 102 F
(+) Bij onbelast gebruik bedraagt de gemiddelde temperatuur voor de bovenzijde 26.4 °C / 80 F, vergeleken met het apparaatgemiddelde van 31.3 °C / 88 F.
(+) De palmsteunen en het touchpad zijn met een maximum van ###max## °C / 77.7 F koeler dan de huidtemperatuur en voelen daarom koel aan.
(+) De gemiddelde temperatuur van de handpalmsteun van soortgelijke toestellen bedroeg 28.7 °C / 83.7 F (+3.3 °C / 6 F).
Dell Inspiron 15 5000 5584 audioanalyse
(+) | luidsprekers kunnen relatief luid spelen (85.4 dB)
Bas 100 - 315 Hz
(-) | bijna geen lage tonen - gemiddeld 18.1% lager dan de mediaan
(±) | lineariteit van de lage tonen is gemiddeld (14.1% delta ten opzichte van de vorige frequentie)
Midden 400 - 2000 Hz
(+) | evenwichtige middens - slechts 2.6% verwijderd van de mediaan
(±) | lineariteit van de middentonen is gemiddeld (7.6% delta ten opzichte van de vorige frequentie)
Hoog 2 - 16 kHz
(+) | evenwichtige hoogtepunten - slechts 4.3% verwijderd van de mediaan
(+) | de hoge tonen zijn lineair (6.8% delta naar de vorige frequentie)
Algemeen 100 - 16.000 Hz
(±) | lineariteit van het totale geluid is gemiddeld (18.2% verschil met de mediaan)
Vergeleken met dezelfde klasse
» 54% van alle geteste apparaten in deze klasse waren beter, 7% vergelijkbaar, 38% slechter
» De beste had een delta van 5%, het gemiddelde was 17%, de slechtste was 45%
Vergeleken met alle geteste toestellen
» 39% van alle geteste apparaten waren beter, 8% gelijk, 53% slechter
» De beste had een delta van 4%, het gemiddelde was 24%, de slechtste was 134%
Apple MacBook 12 (Early 2016) 1.1 GHz audioanalyse
(+) | luidsprekers kunnen relatief luid spelen (83.6 dB)
Bas 100 - 315 Hz
(±) | verminderde zeebaars - gemiddeld 11.3% lager dan de mediaan
(±) | lineariteit van de lage tonen is gemiddeld (14.2% delta ten opzichte van de vorige frequentie)
Midden 400 - 2000 Hz
(+) | evenwichtige middens - slechts 2.4% verwijderd van de mediaan
(+) | de middentonen zijn lineair (5.5% delta ten opzichte van de vorige frequentie)
Hoog 2 - 16 kHz
(+) | evenwichtige hoogtepunten - slechts 2% verwijderd van de mediaan
(+) | de hoge tonen zijn lineair (4.5% delta naar de vorige frequentie)
Algemeen 100 - 16.000 Hz
(+) | het totale geluid is lineair (10.2% verschil met de mediaan)
Vergeleken met dezelfde klasse
» 7% van alle geteste apparaten in deze klasse waren beter, 2% vergelijkbaar, 91% slechter
» De beste had een delta van 5%, het gemiddelde was 18%, de slechtste was 53%
Vergeleken met alle geteste toestellen
» 5% van alle geteste apparaten waren beter, 1% gelijk, 94% slechter
» De beste had een delta van 4%, het gemiddelde was 24%, de slechtste was 134%
| Uit / Standby | |
| Inactief | |
| Belasting |
|
Key:
min: | |
| Dell Inspiron 15 5000 5584 i7-8565U, UHD Graphics 620, Toshiba BG3 KBG30ZMS512G, IPS, 1920x1080, 15.6" | HP Pavilion 15-cs2019ng i5-8265U, GeForce MX250, Toshiba KBG30ZMV256G, IPS, 1920x1080, 15.6" | Acer Aspire 5 A515-52G-723L i7-8565U, GeForce MX250, WDC PC SN520 SDAPNUW-512G, IPS, 1920x1080, 15.6" | Lenovo Yoga 730-15IKB i5-8550U, GeForce GTX 1050 Mobile, SK Hynix PC401 512GB M.2 (HFS512GD9TNG), IPS, 3840x2160, 15.6" | Dell XPS 15 9570 Core i9 UHD i9-8950HK, GeForce GTX 1050 Ti Max-Q, Samsung SSD PM981 MZVLB1T0HALR, IPS, 3840x2160, 15.6" | Dell XPS 15 9570 i7 UHD i7-8750H, GeForce GTX 1050 Ti Max-Q, Toshiba XG5 KXG50ZNV512G, IPS, 3840x2160, 15.6" | |
|---|---|---|---|---|---|---|
| Power Consumption | -20% | -22% | -42% | -119% | -141% | |
| Idle Minimum * (Watt) | 3.6 | 4.9 -36% | 4.4 -22% | 4.8 -33% | 7.1 -97% | 9.48 -163% |
| Idle Average * (Watt) | 7.4 | 7.9 -7% | 6.9 7% | 10.1 -36% | 13.6 -84% | 16.1 -118% |
| Idle Maximum * (Watt) | 8.3 | 10.1 -22% | 9.9 -19% | 10.7 -29% | 14.1 -70% | 16.9 -104% |
| Load Average * (Watt) | 38 | 60 -58% | 55 -45% | 44 -16% | 103.9 -173% | 90.8 -139% |
| Load Maximum * (Watt) | 47.9 | 38 21% | 63.4 -32% | 94.7 -98% | 130.9 -173% | 134.4 -181% |
| Witcher 3 ultra * (Watt) | 103 |
* ... kleiner is beter
| Dell Inspiron 15 5000 5584 i7-8565U, UHD Graphics 620, 42 Wh | HP Pavilion 15-cs2019ng i5-8265U, GeForce MX250, 41 Wh | Acer Aspire 5 A515-52G-723L i7-8565U, GeForce MX250, 48 Wh | Lenovo Yoga 730-15IKB i5-8550U, GeForce GTX 1050 Mobile, 51.5 Wh | Dell XPS 15 9570 Core i9 UHD i9-8950HK, GeForce GTX 1050 Ti Max-Q, 97 Wh | Acer Swift 5 SF515-51T-76B6 i7-8565U, UHD Graphics 620, 53.9 Wh | |
|---|---|---|---|---|---|---|
| Batterijduur | -2% | 45% | 5% | 40% | 66% | |
| Reader / Idle (h) | 15.3 | 8 -48% | 12.9 -16% | 11.6 -24% | 15 -2% | 16.2 6% |
| WiFi v1.3 (h) | 3.5 | 5 43% | 6.9 97% | 6.2 77% | 8.6 146% | 7.2 106% |
| Load (h) | 1.3 | 1.3 0% | 2 54% | 0.8 -38% | 1 -23% | 2.4 85% |
Pro
Contra
Voor het volledige, Engelse testrapport, klik hier.
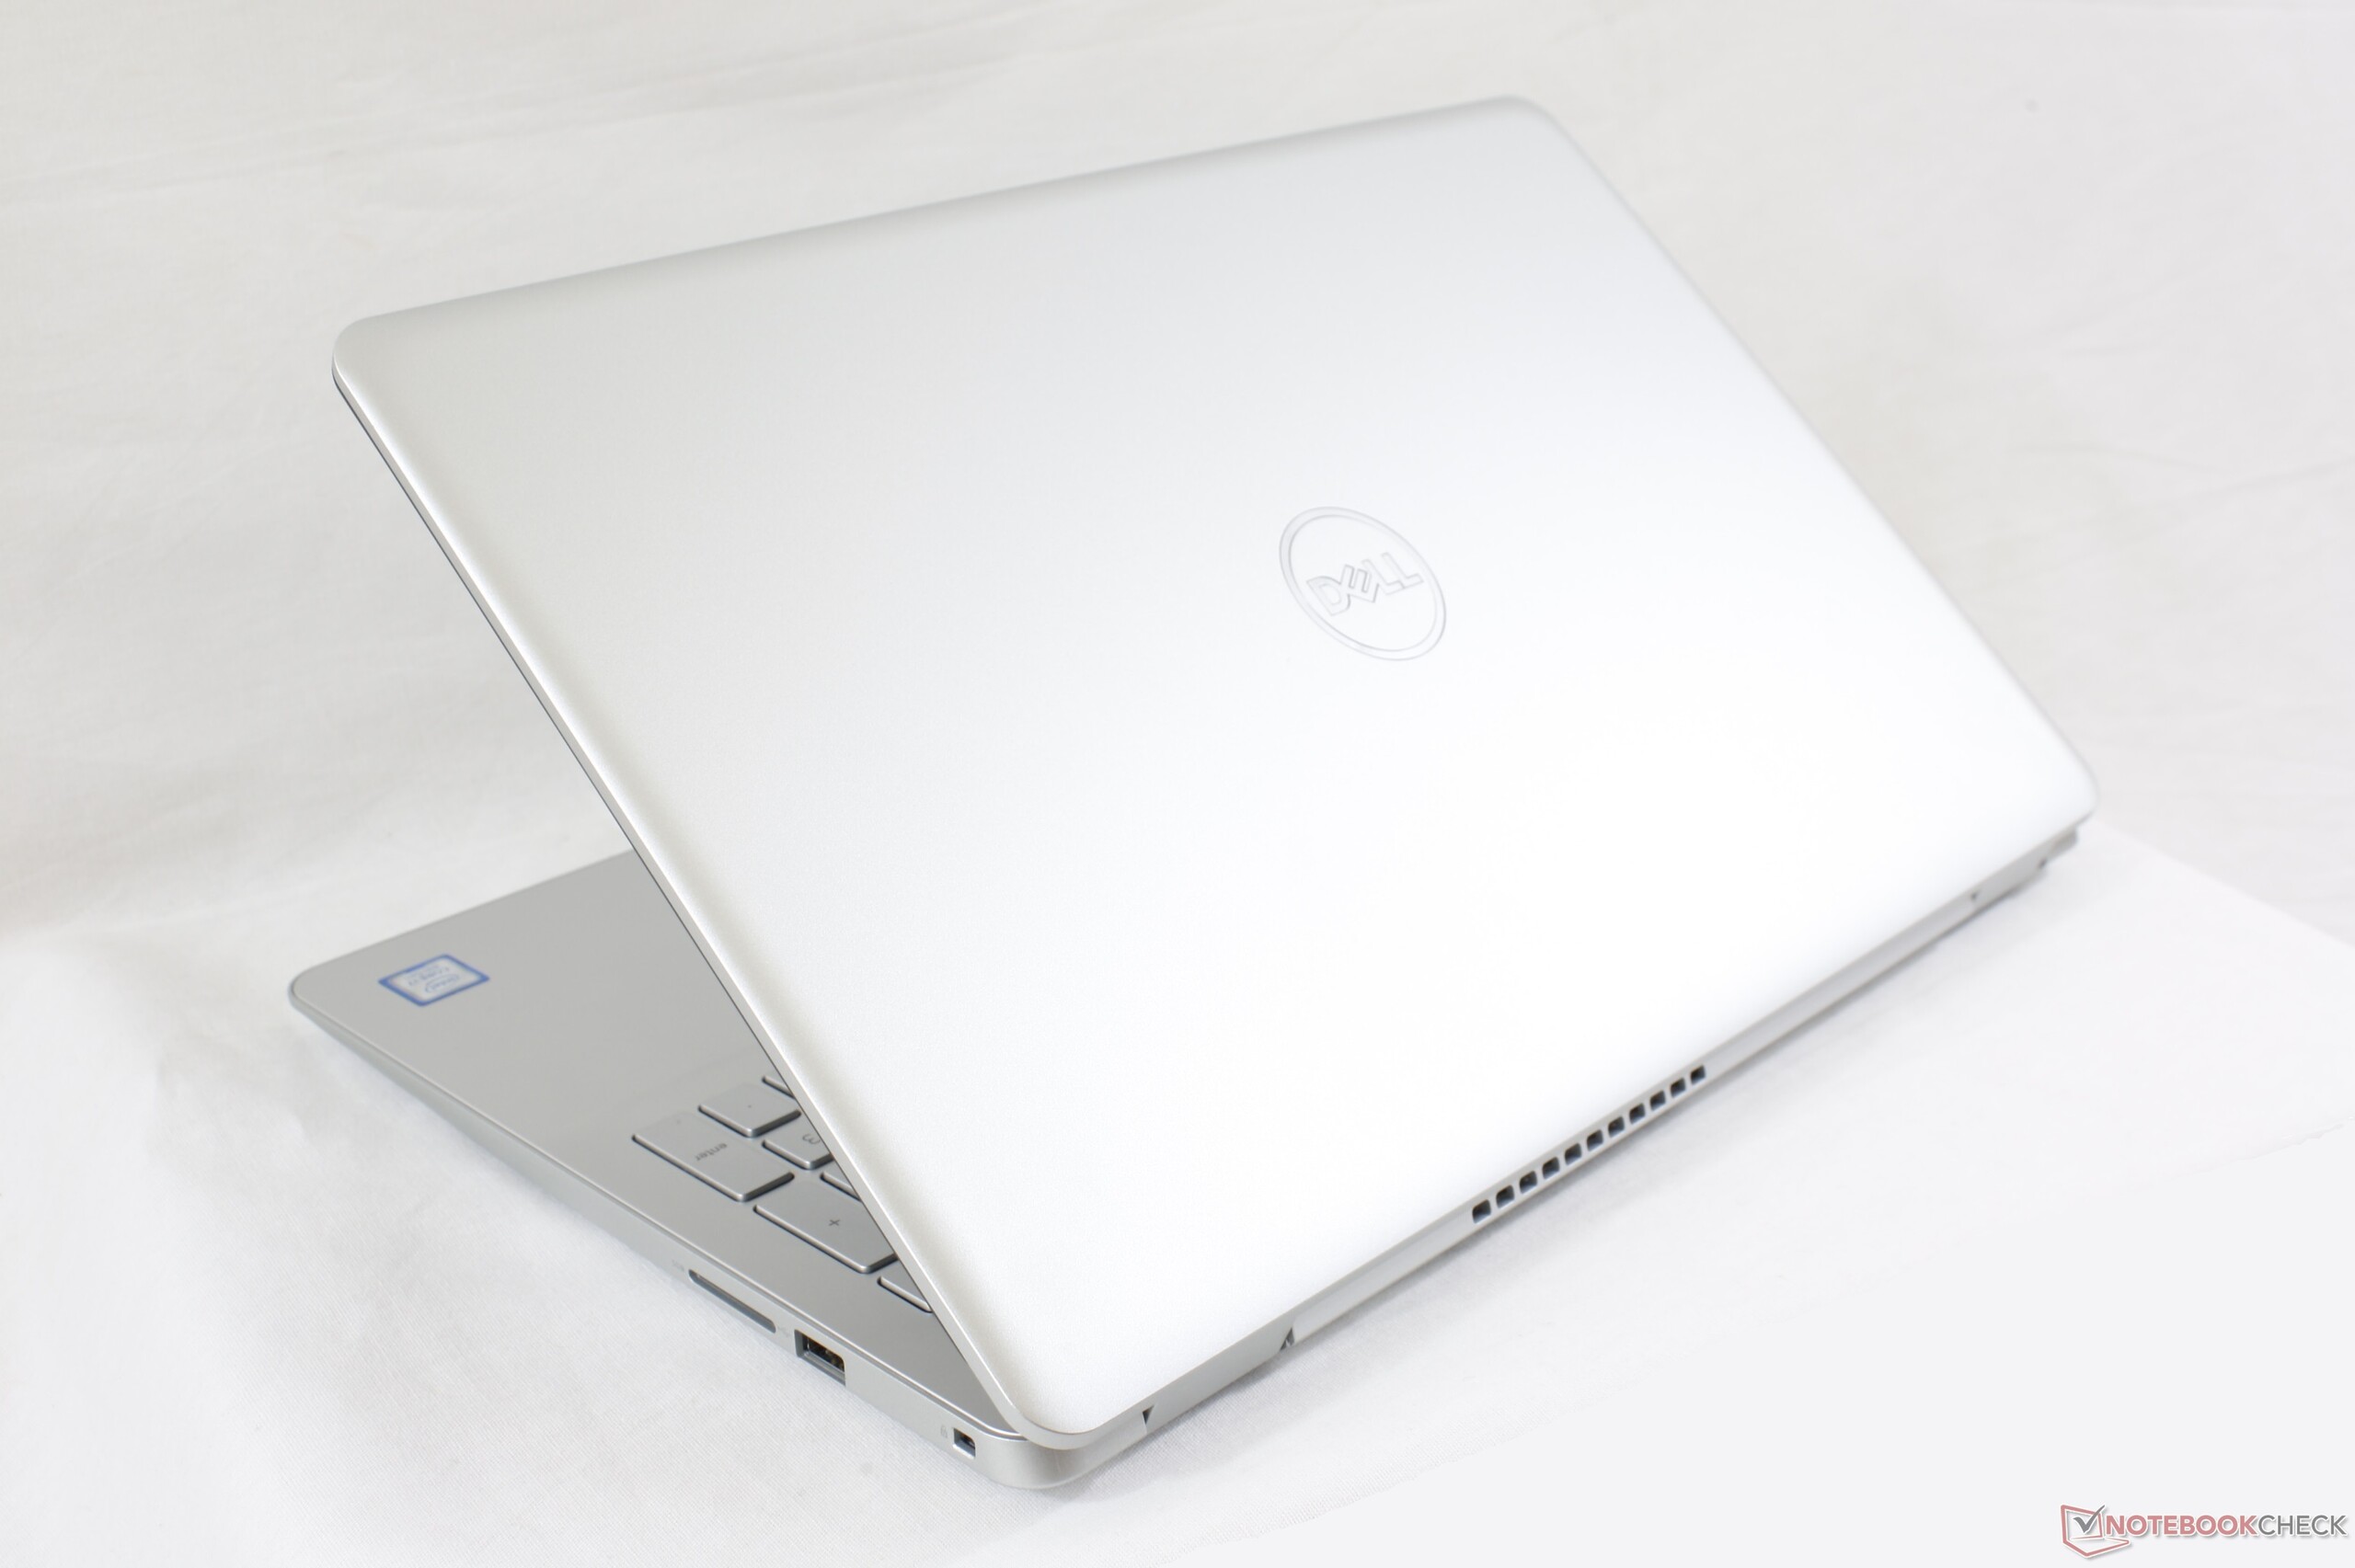
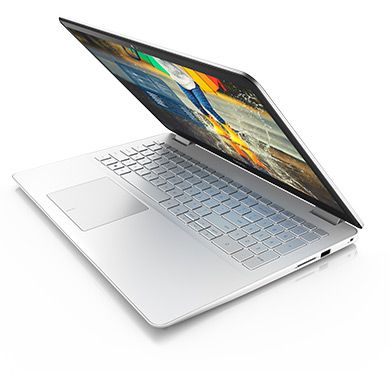
We prijzen de Inspiron 15 5584 voor het verhogen van de norm voor wat alle budgetlaptops moeten hebben. De primaire SSD, het 1080p IPS-scherm en het ontwerp met smalle randen moeten het absolute minimum zijn voor alle multimedia-laptops die in 2019 zijn uitgebracht. Daarom is het geweldig om te zien dat Dell standaard HDD's en 768p-panelen overslaat.
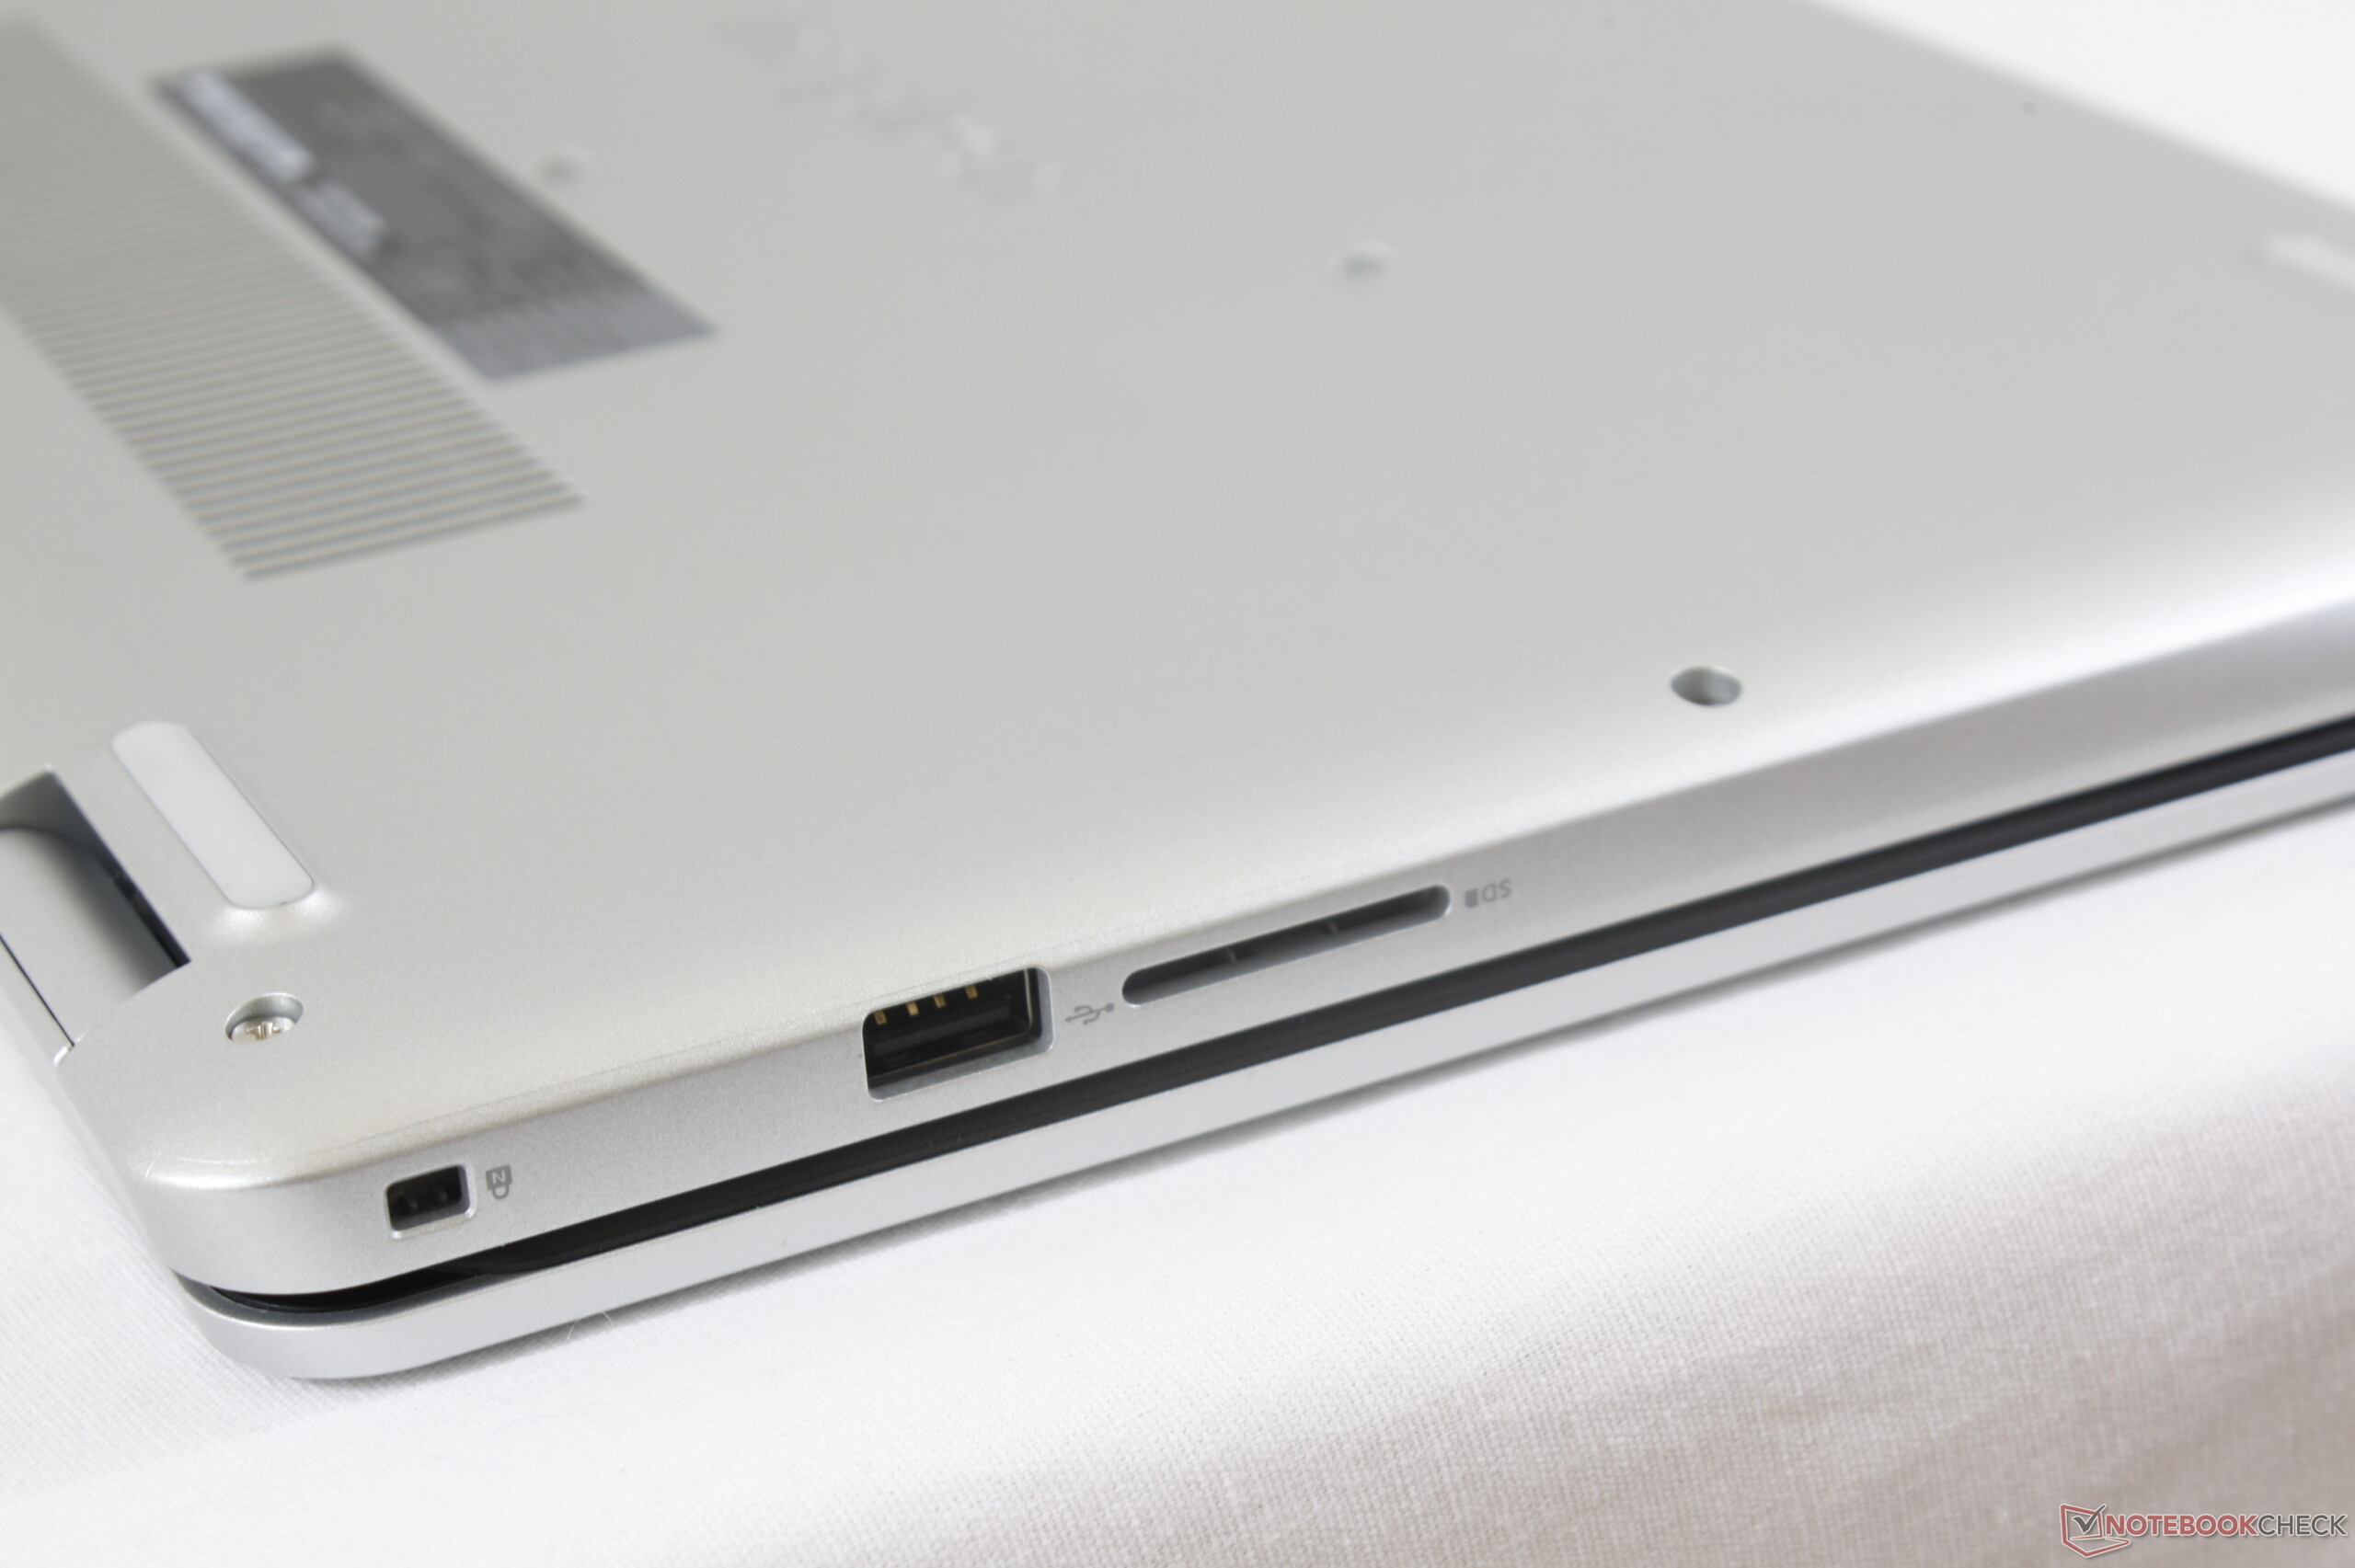
Er zijn een aantal nadelen om in gedachten te houden. Afgezien van de optionele USB Type-C-poort, is het systeem een slechte metgezel voor reizigers vanwege het zwakke beeldscherm, onergonomische clickpad, een korte tot gemiddelde batterijduur en een dikker profiel dan zowel de Pavilion 15 als de Aspire 5. Dit is meer een laptop voor binnenshuis met af en toe een reis tussen bestemmingen. Ondertussen zullen casual gamers elders moeten kijken of de SKU's van AMD Ryzen moeten overwegen, omdat het systeem geen discrete GPU-opties biedt, in tegenstelling tot de eerder genoemde HP- of Acer-alternatieven. We hopen dat toekomstige herzieningen de USB Type-C-standaard zullen maken voor zowel gegevens als opladen, de feedback van het clickpad verbeteren en de grootte van de NumPad- en pijltoetsen vergroten zonder de aantrekkelijke prijs van de serie te beïnvloeden.
Een betaalbare oplossing voor het afspelen van multimedia thuis of voor tekstverwerking. We raden aan om voor de Core i5-8265U SKU te gaan in plaats van de i7-8565U SKU omdat het prestatievoordeel van de Core i7 op zijn best minimaal is voor deze behuizing. Het bespaarde geld kan in plaats daarvan worden besteed aan extra RAM of opslag.
Dell Inspiron 15 5000 5584
- 25-05-2019 v6 (old)
Allen Ngo
Price comparison
