Dell Inspiron 15 5518 laptop in review: De CPU wordt vertraagd

Dell heeft met de Inspiron 15 5518 een 15,6-inch allrounder in zijn line-up, die wordt aangedreven door een Core i5-11300H-CPU en een GeForce-MX450-GPU. Tot de concurrenten behoren apparaten als de Xiaomi RedmiBook Pro 15, de HP Pavilion 15, de Lenovo IdeaPad 5 Pro 16IHU6en de Asus VivoBook S15 D533UA
Possible competitors in comparison
Evaluatie | Datum | Model | Gewicht | Hoogte | Formaat | Resolutie | Beste prijs |
|---|---|---|---|---|---|---|---|
| 82.3 % v7 (old) | 09-2021 | Dell Inspiron 15 5518-2X3JR i5-11300H, GeForce MX450 | 1.8 kg | 18 mm | 15.60" | 1920x1080 | |
| 81.2 % v7 (old) | 06-2021 | HP Pavilion 15-eg i7-1165G7, GeForce MX450 | 1.7 kg | 17.9 mm | 15.60" | 1920x1080 | |
| 83.2 % v7 (old) | 06-2021 | Xiaomi RedmiBook Pro 15 i7-11370H, GeForce MX450 | 1.7 kg | 16 mm | 15.60" | 3200x2000 | |
| 86 % v7 (old) | 08-2021 | Lenovo IdeaPad 5 Pro 16IHU6 i5-11300H, GeForce MX450 | 1.9 kg | 18.4 mm | 16.00" | 2560x1600 | |
| 82.1 % v7 (old) | 07-2021 | Asus VivoBook S15 D533UA R7 5700U, Vega 8 | 1.8 kg | 16.1 mm | 15.60" | 1920x1080 | |
| 83.5 % v7 (old) | 08-2021 | Lenovo IdeaPad 5 15ALC05 R5 5500U, Vega 7 | 1.7 kg | 19.1 mm | 15.60" | 1920x1080 |
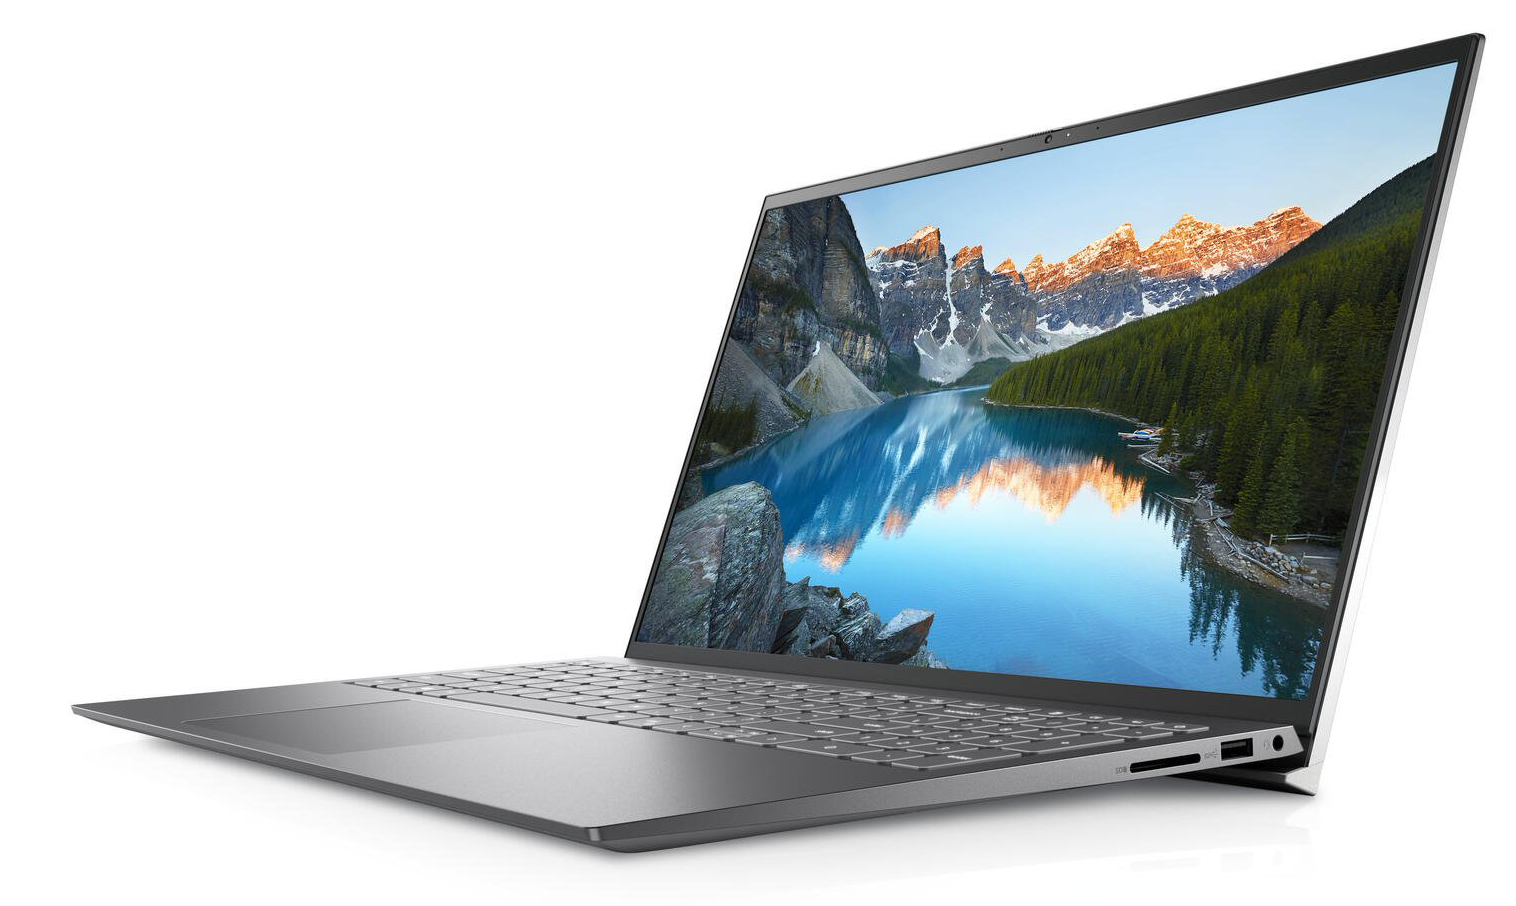
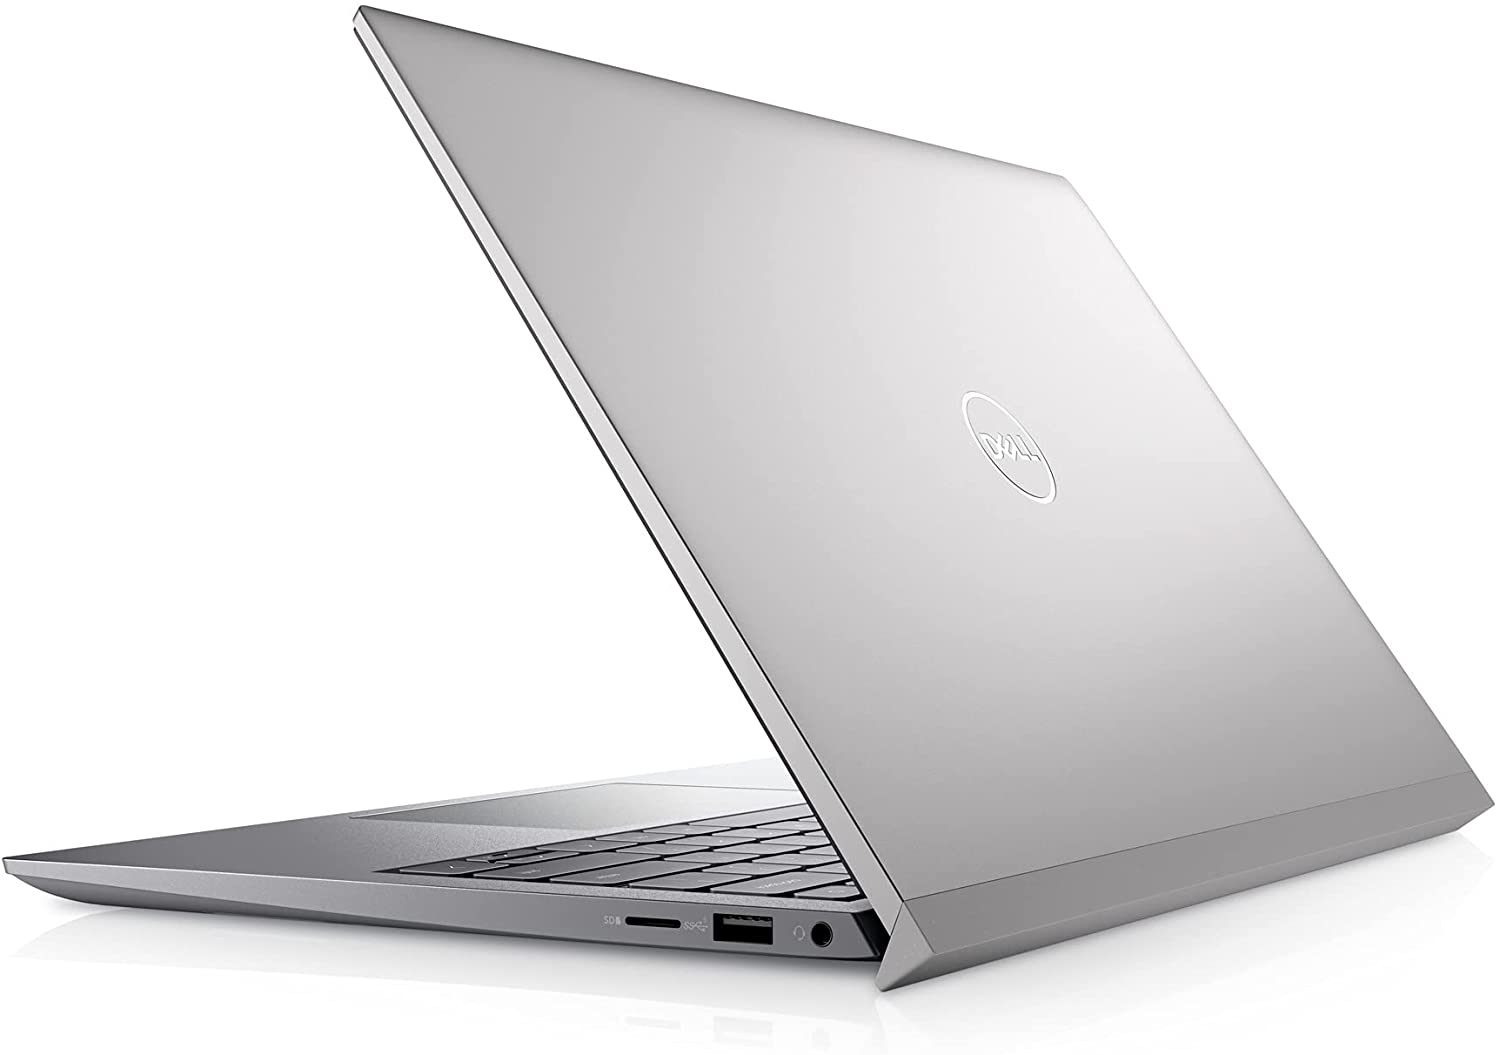
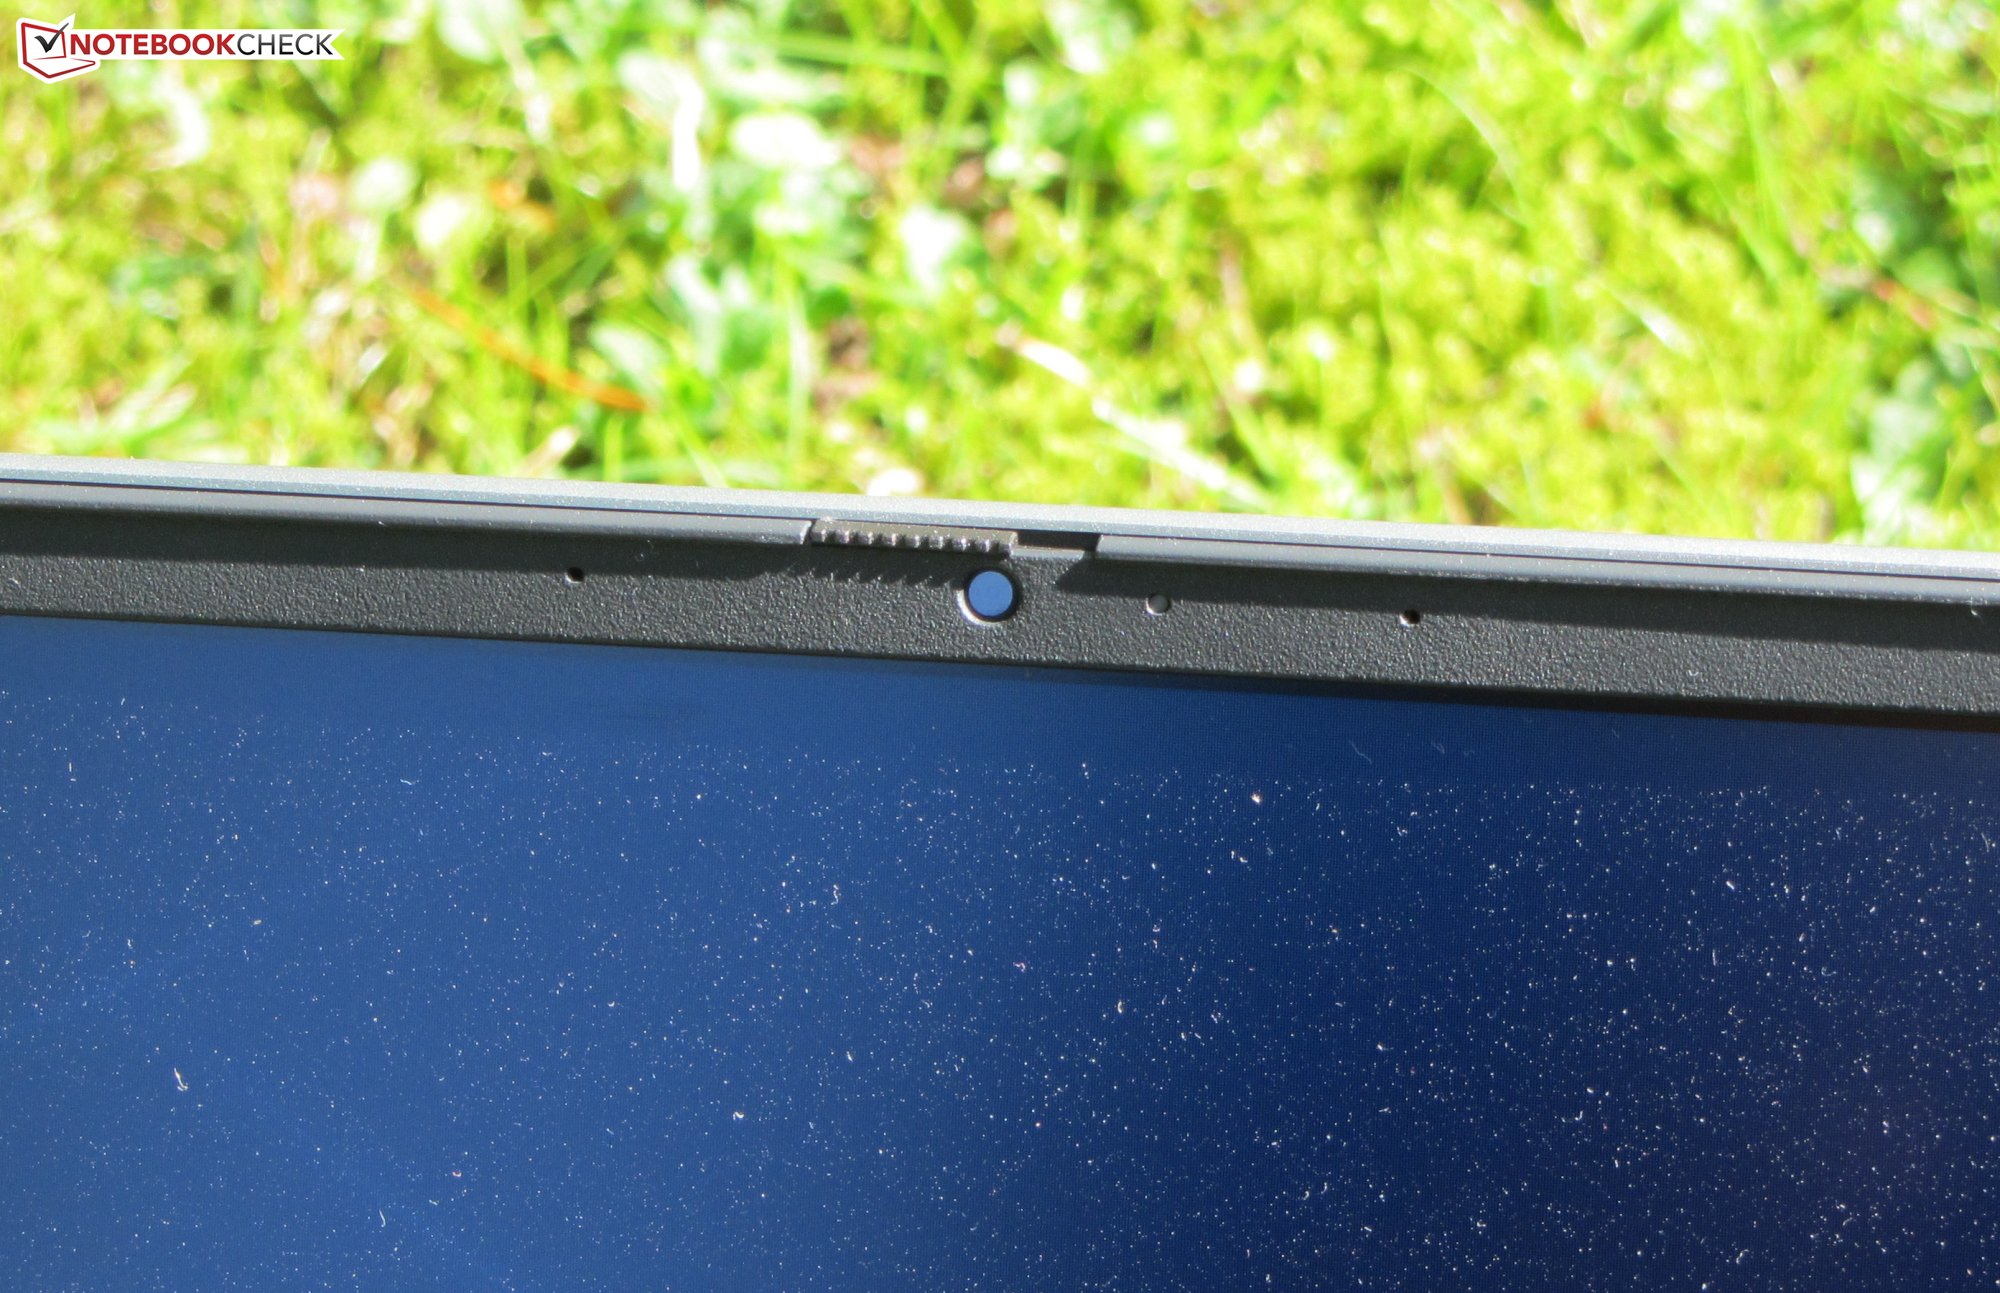
Behuizing & kenmerken - De Inspiron wordt geleverd met een chique metalen behuizing
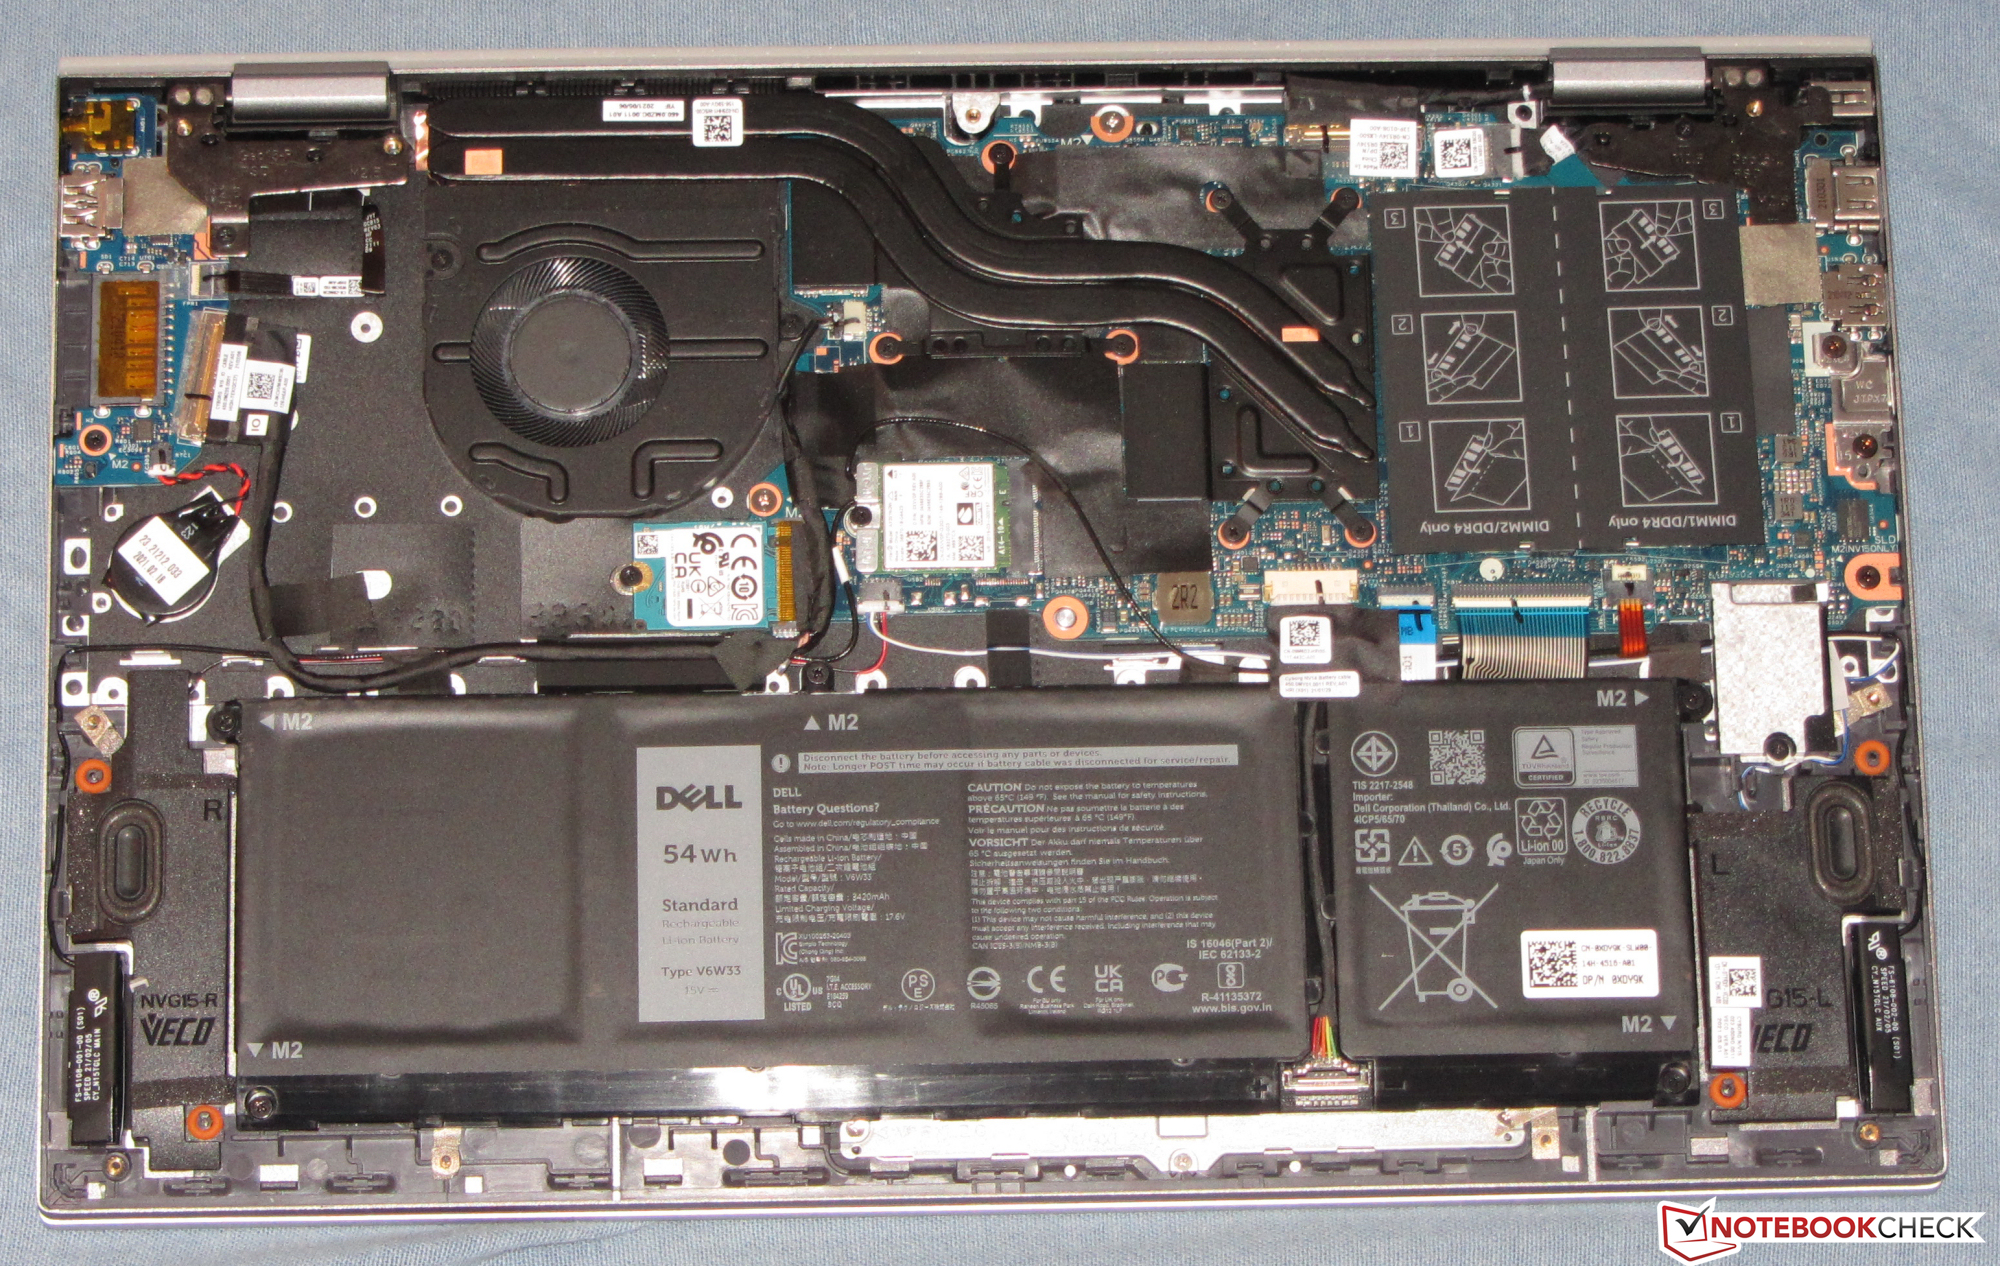
Dell vertrouwt op een slank,chique ontwerp met gladde oppervlakkenvoor de slanke, mat-zilvergrijze metalen behuizing van de Inspiron.De laptop vertoont geen fabricagefouten, maar zou over het geheel genomen stijver moeten zijn.De basiseenheid en het deksel kunnen te veel worden verdraaid. De batterij is stevig geïnstalleerd. De ingewanden zijn toegankelijk na het verwijderen van de bodemshell.
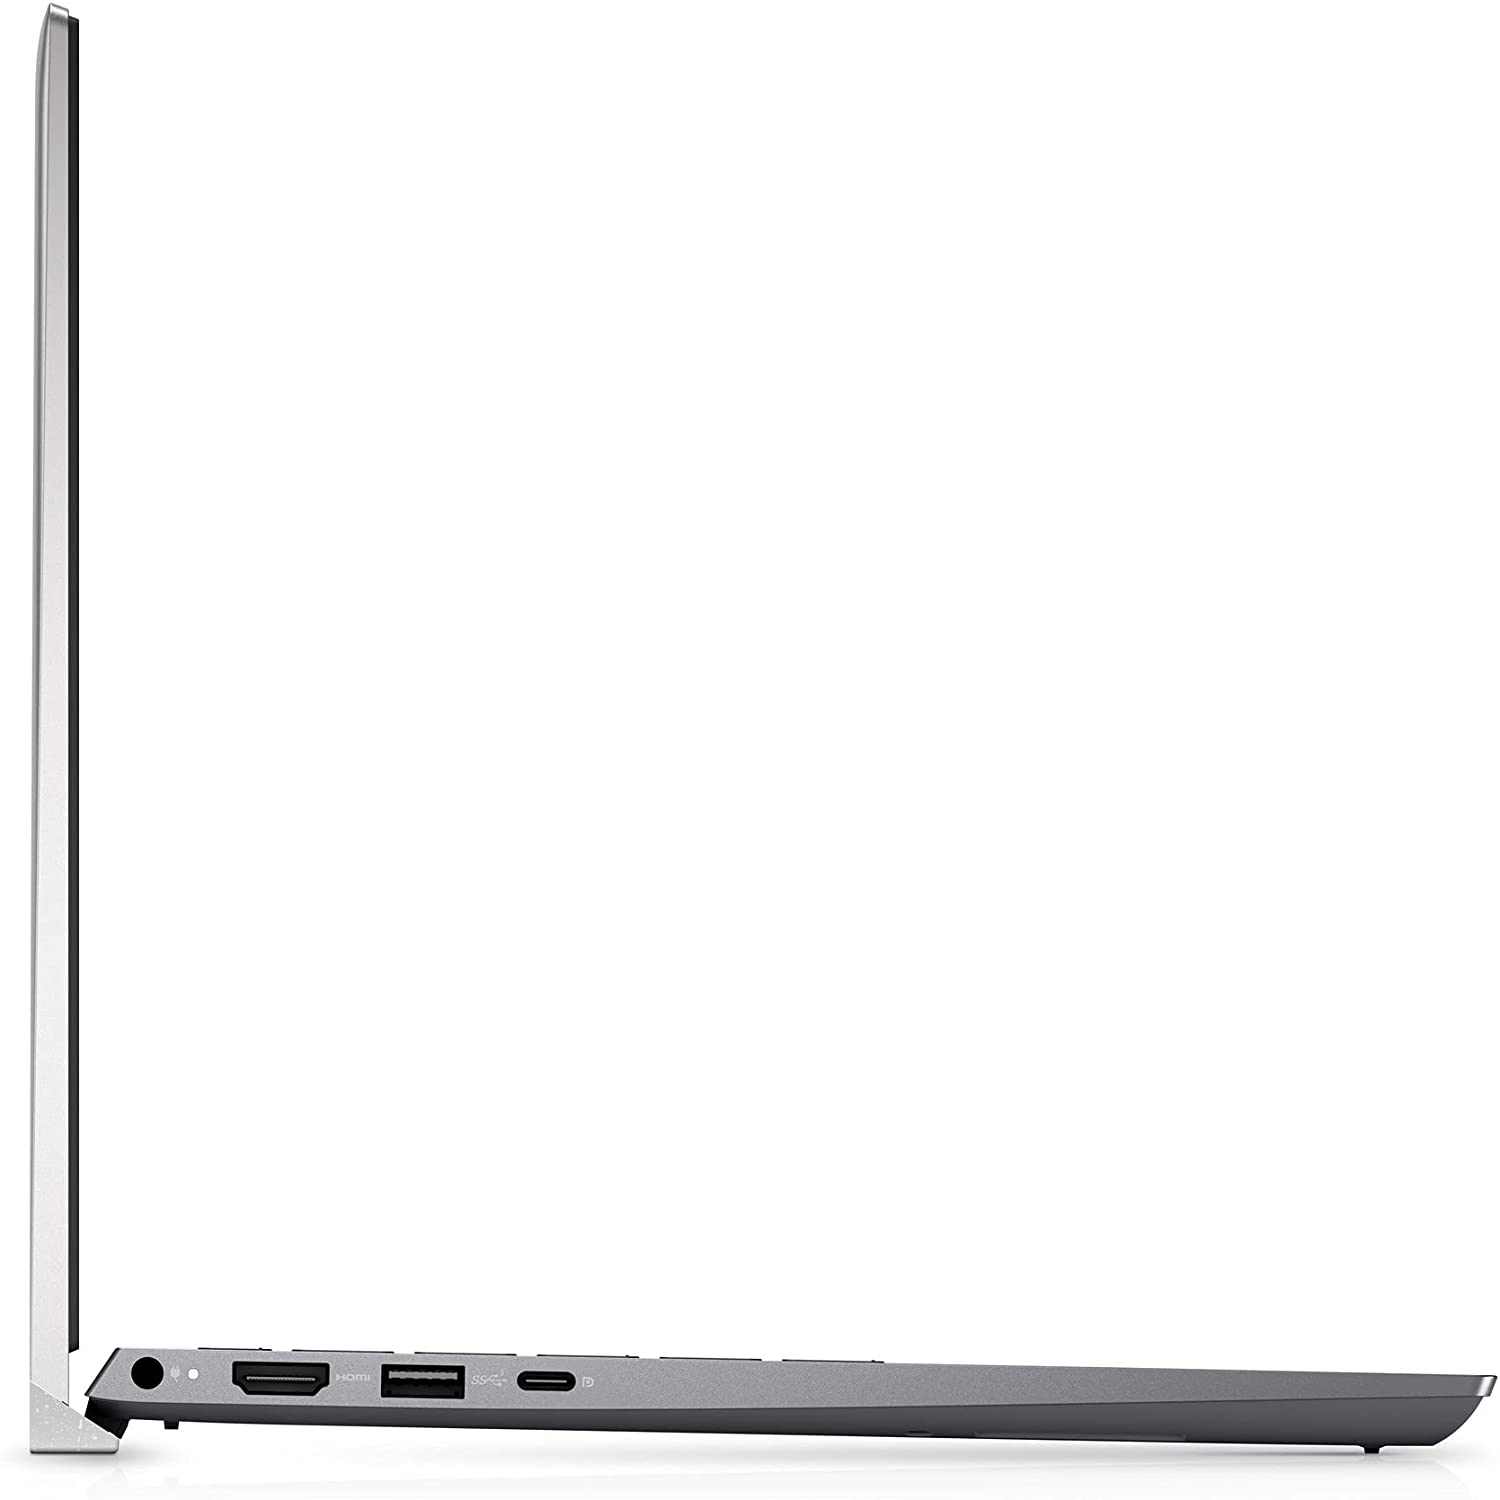
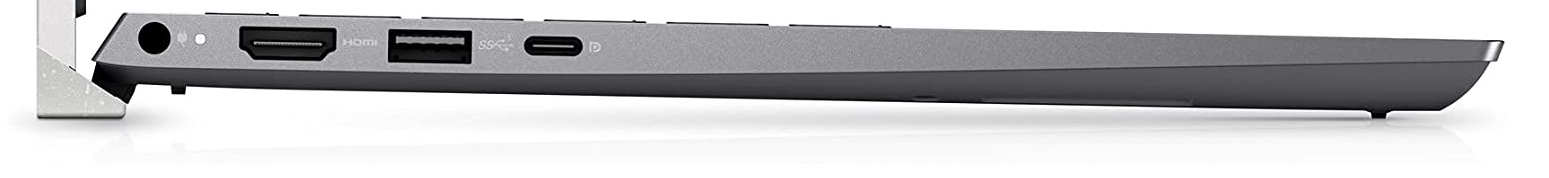
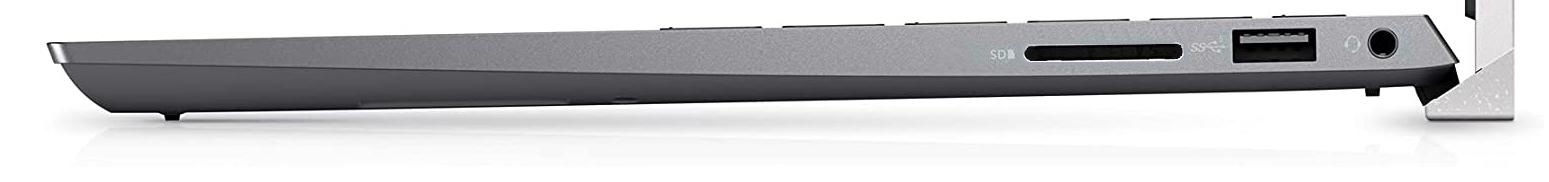
De Inspiron heeft twee USB-A-poorten (USB 3.2 Gen 1) en een USB-C-poort (USB 3.2 Gen 2x2; Core i7-modellen: Thunderbolt 4). Deze laatste ondersteunt Power Delivery en Displayport-per-USB-C. De 5518 heeft dus twee video-uitgangen samen met de HDMI-sleuf. De SD-geheugenkaartlezer (referentiekaart: AV PRO SD 128 GB V60) behoort tot de trage modellen.
De WLAN datasnelheden bepaald onder optimale omstandigheden (geen andere WLAN apparaten in de nabijheid, korte afstand tussen notebook en server PC; router: Netgear Nighthawk AX12) blijken goed te werken, maar blijven iets onder de mogelijkheden van de geïnstalleerde Intel AX201 chip.

Aansluitapparatuur
| SD Card Reader | |
| average JPG Copy Test (av. of 3 runs) | |
| HP Pavilion 15-eg (AV PRO microSD 128 GB V60) | |
| Gemiddelde van klas Office (19.8 - 198.5, n=22, laatste 2 jaar) | |
| Asus VivoBook S15 D533UA (AV PRO microSD 128 GB V60) | |
| Lenovo IdeaPad 5 15ALC05 (Toshiba Exceria Pro SDXC 64 GB UHS-II) | |
| Dell Inspiron 15 5518-2X3JR (AV Pro SD 128 GB V60) | |
| maximum AS SSD Seq Read Test (1GB) | |
| Lenovo IdeaPad 5 Pro 16IHU6 (AV PRO microSD 128 GB V60) | |
| Gemiddelde van klas Office (27.4 - 249, n=21, laatste 2 jaar) | |
| HP Pavilion 15-eg (AV PRO microSD 128 GB V60) | |
| Asus VivoBook S15 D533UA (AV PRO microSD 128 GB V60) | |
| Lenovo IdeaPad 5 15ALC05 (Toshiba Exceria Pro SDXC 64 GB UHS-II) | |
| Dell Inspiron 15 5518-2X3JR (AV Pro SD 128 GB V60) | |


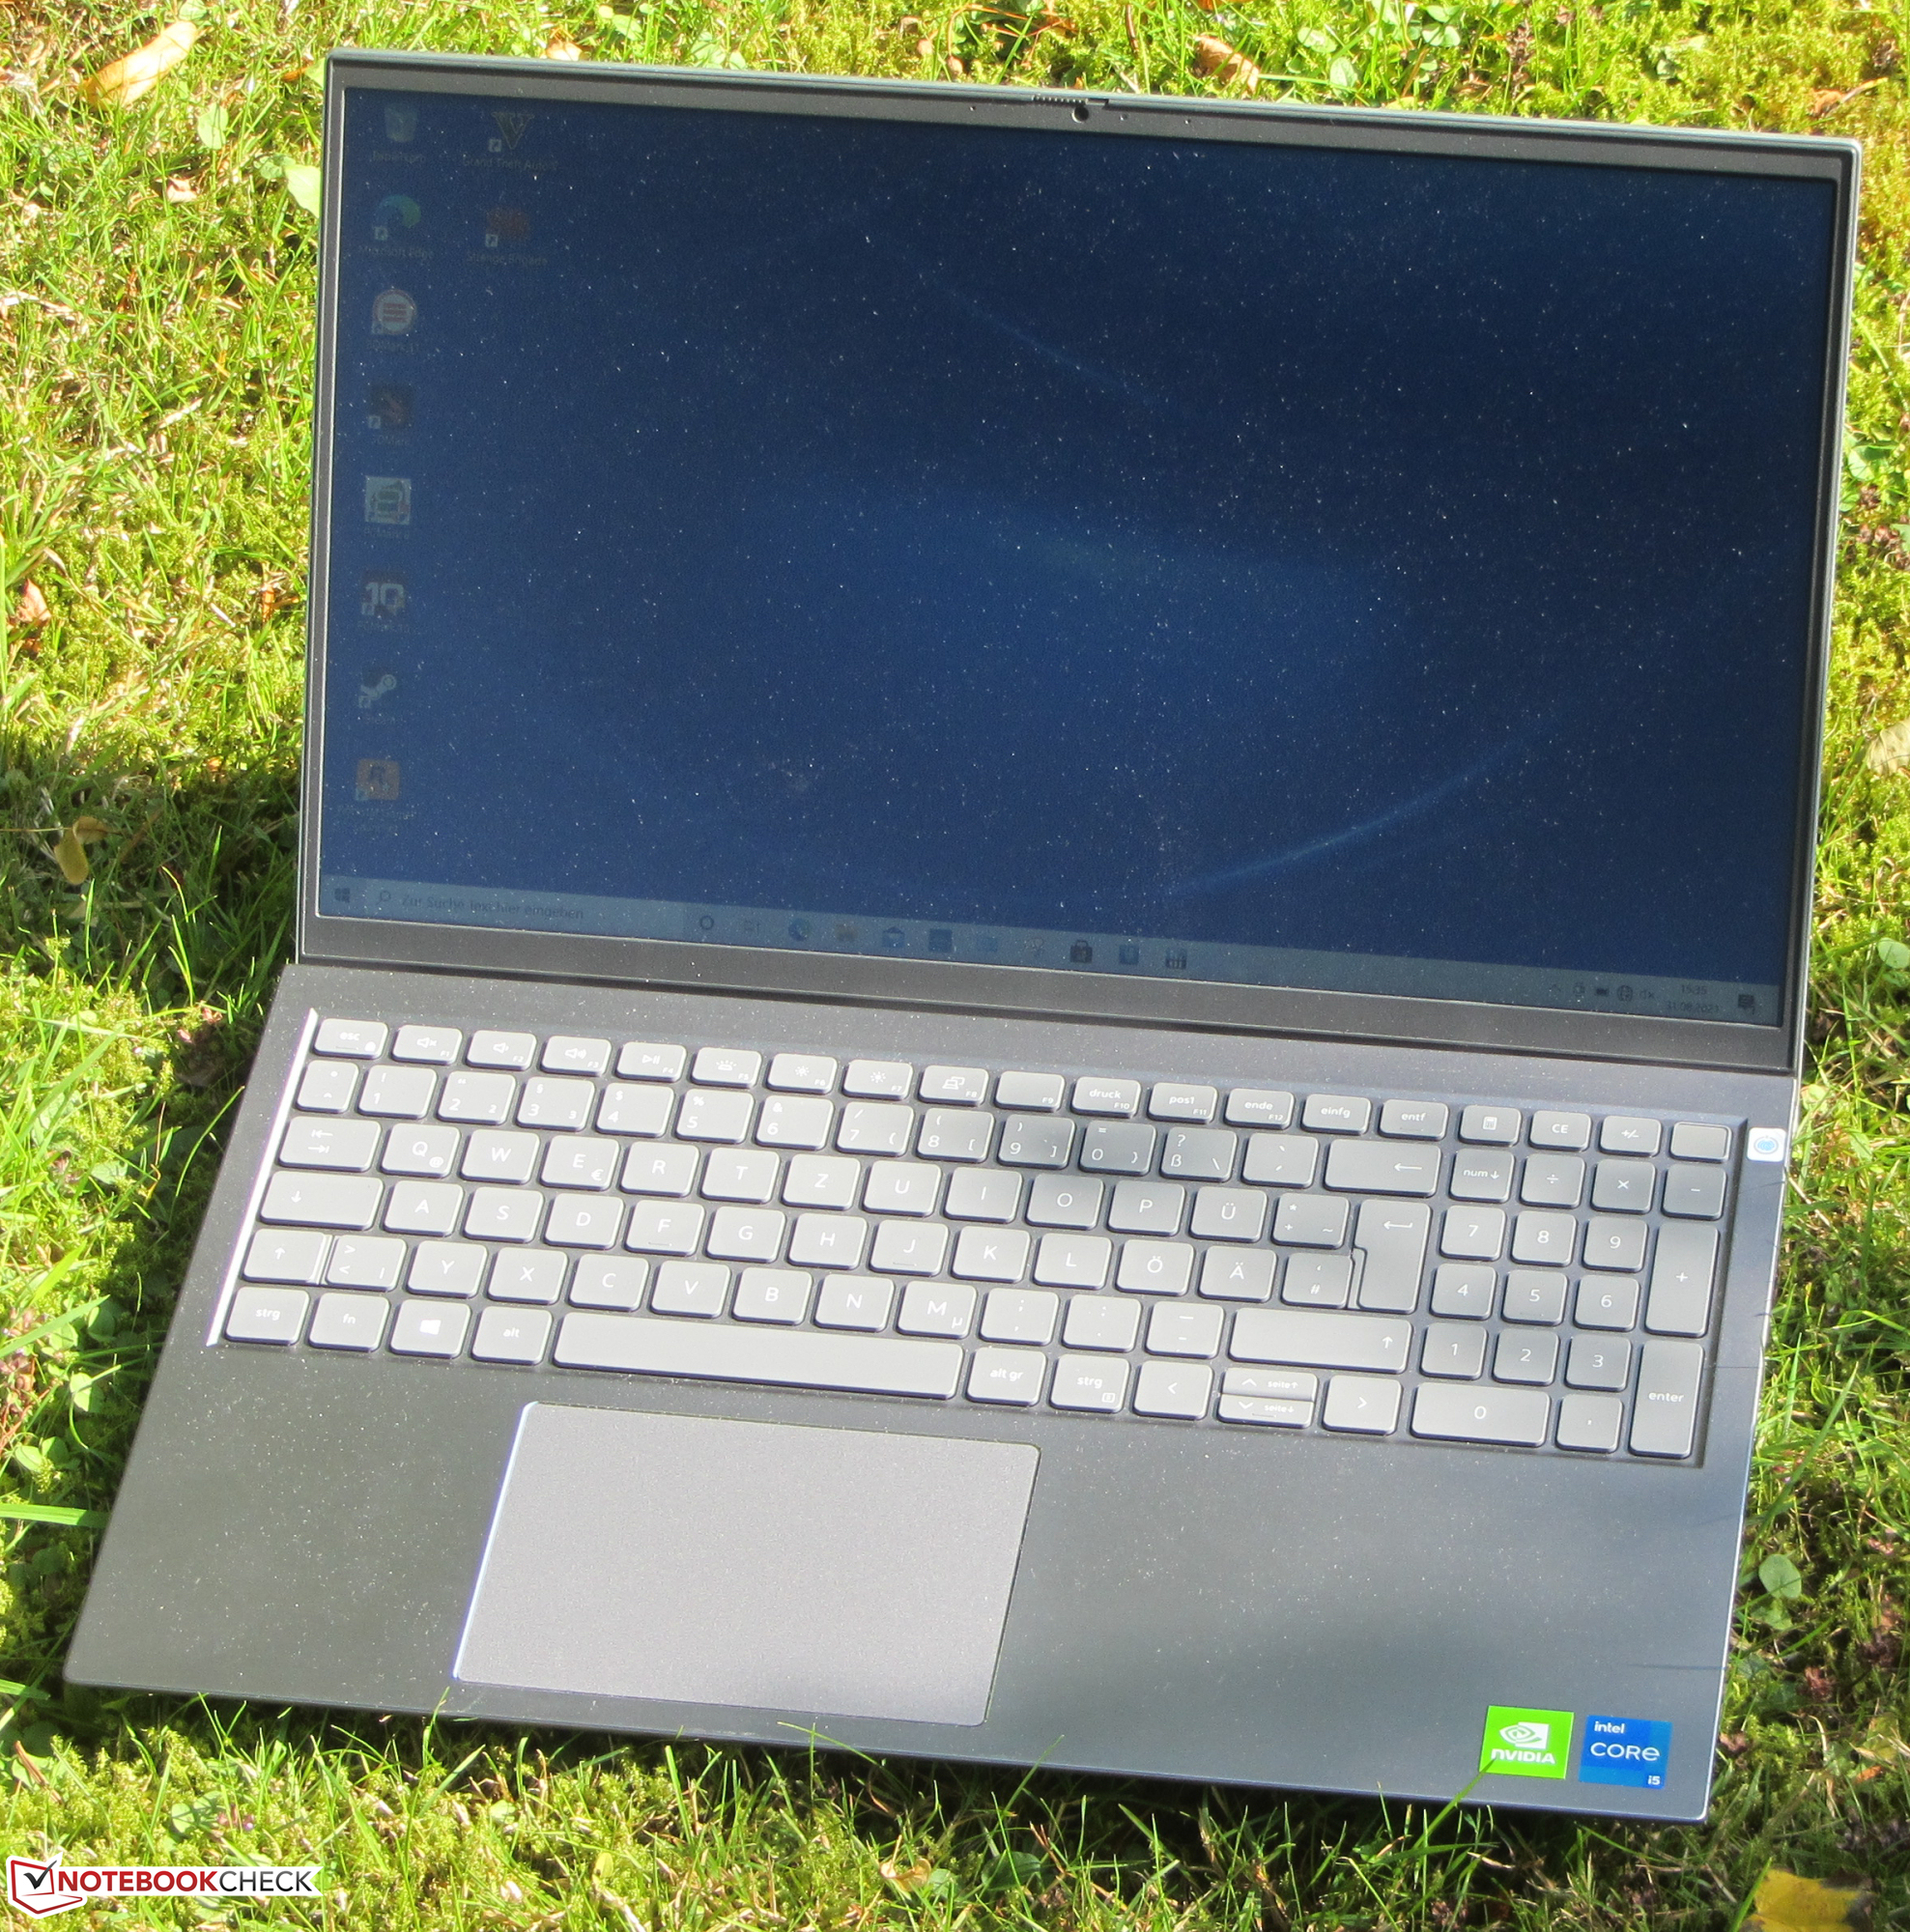
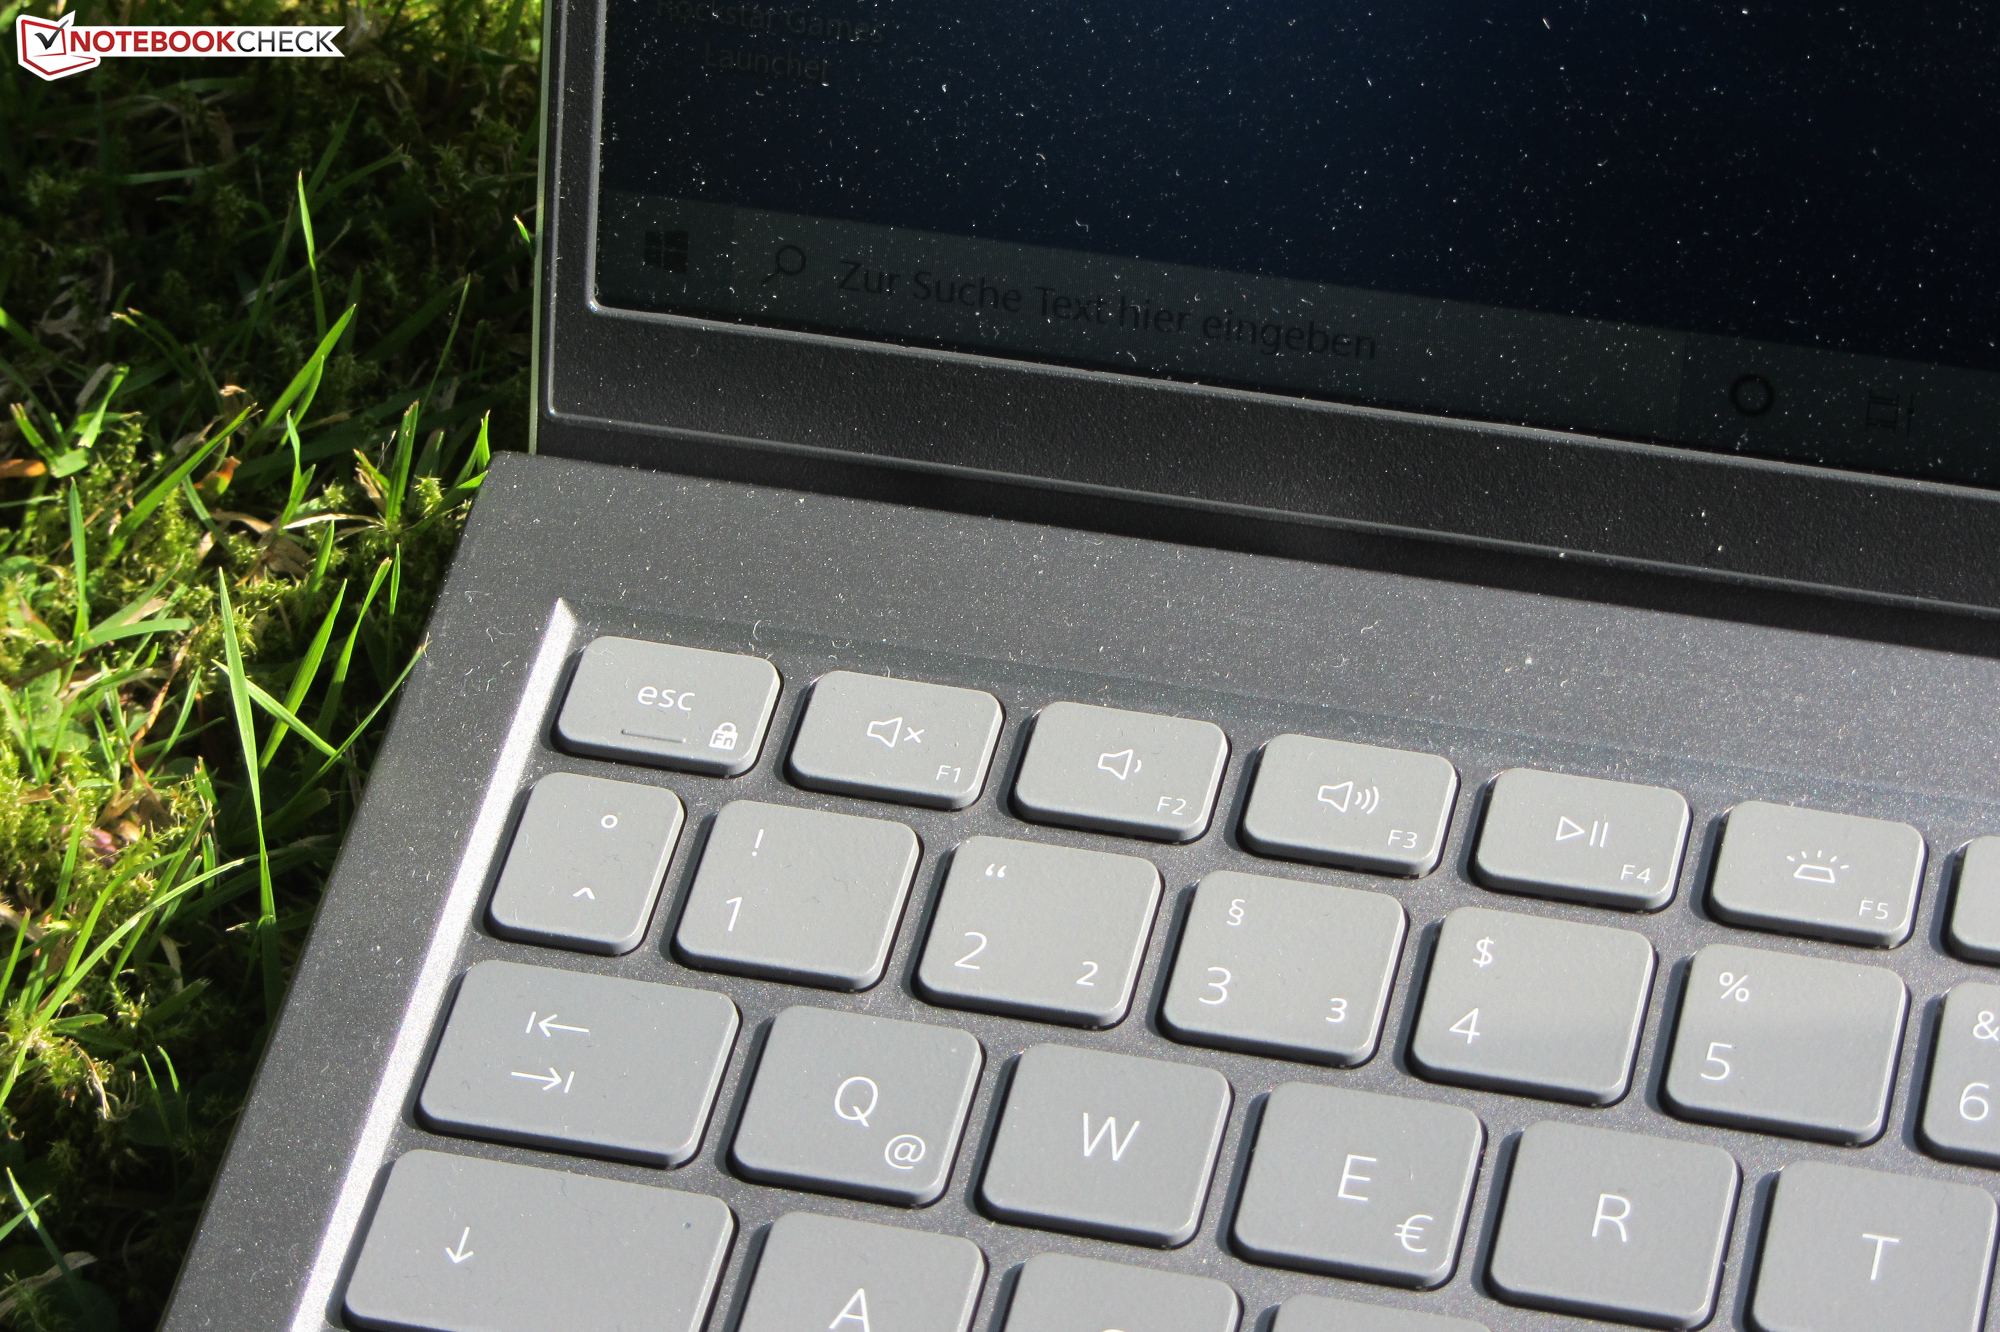
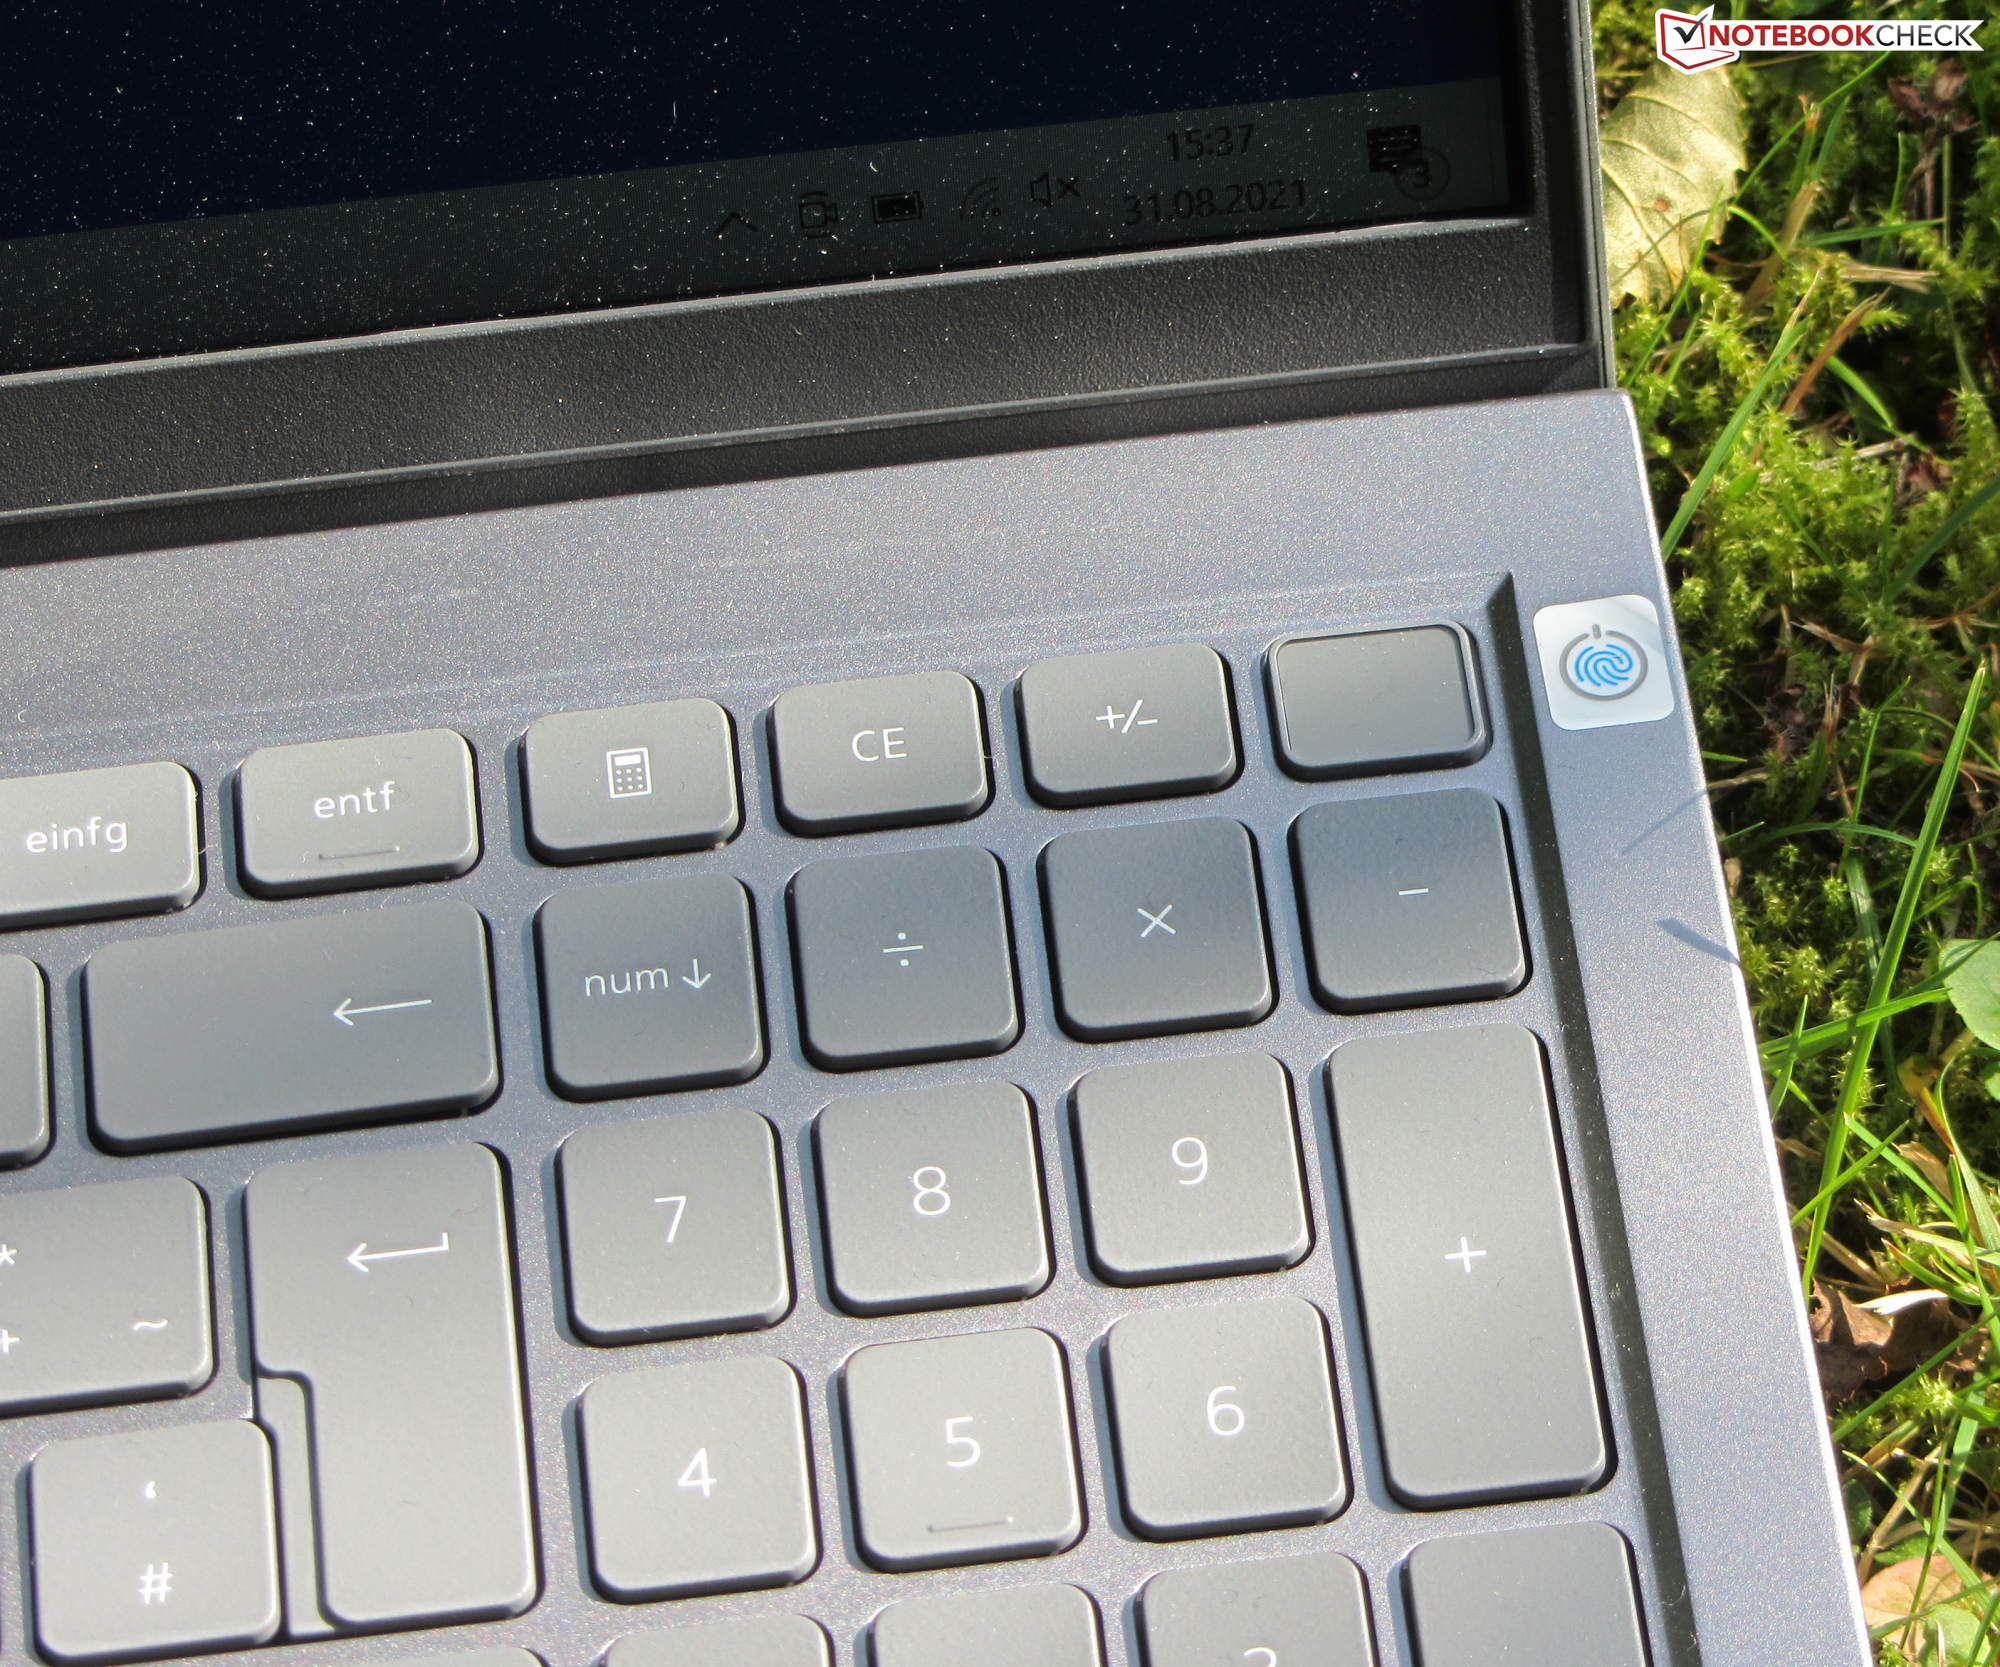
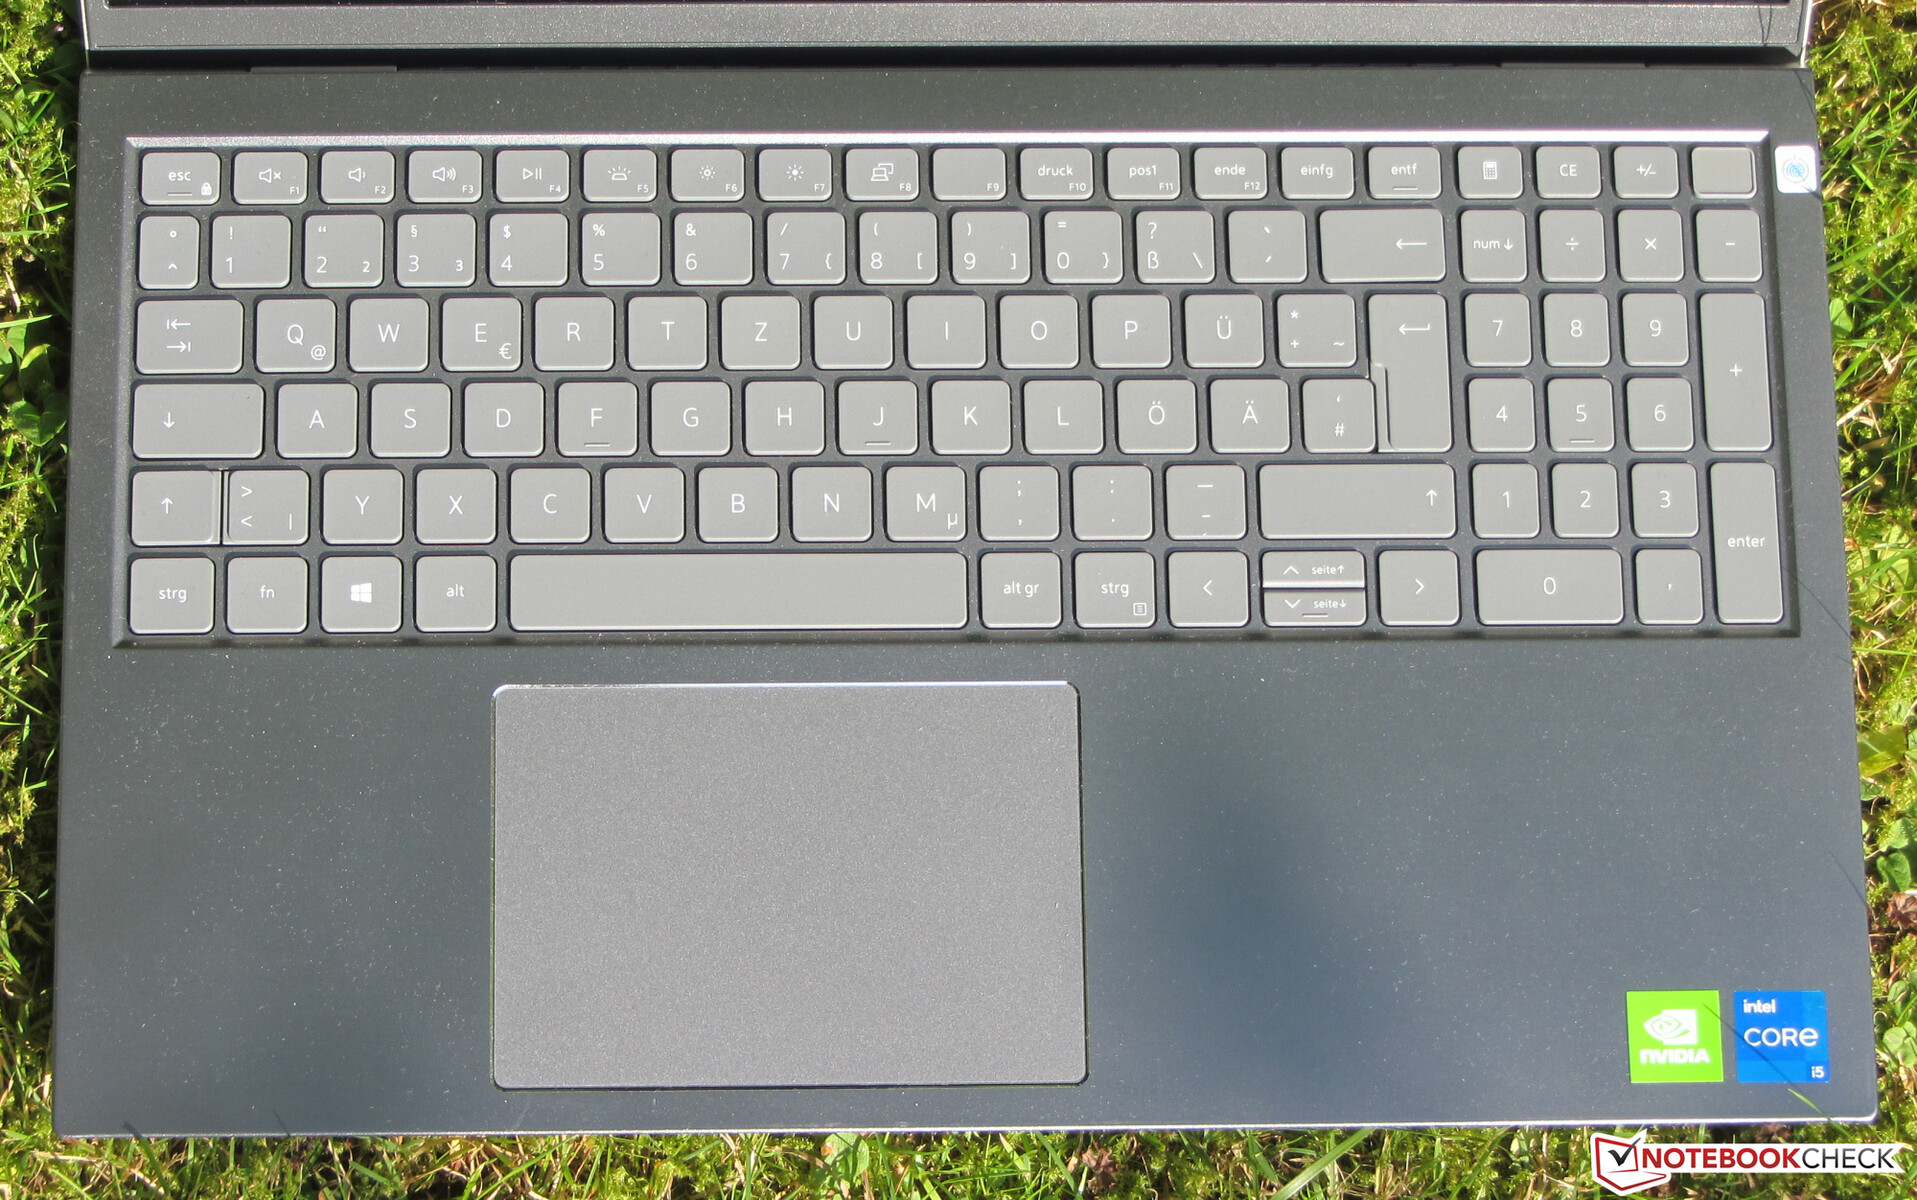
Invoerapparaten - Dell 5518 biedt toetsverlichting
De licht geruwde toetsen van het verlichte chiclet-toetsenbord hebben een korte aanslag en een duidelijk drukpunt. De toetsweerstand is aangenaam. Het toetsenbord geeft een beetje mee tijdens het typen - meer in het midden dan aan de randen. De verlichting (twee helderheidsniveaus) wordt geregeld via een functietoets. Al met al levert Dell hier een toetsenbord af dat geschikt is voor dagelijks gebruik.
Het multi-touch ClickPad (ca. 11,5 x 8 cm) reageert zelfs in de hoeken op invoer. Het gladde oppervlak maakt het gemakkelijk voor de vingers om te glijden. Het pad heeft een korte slag en een duidelijk drukpunt.
Beeldscherm - IPS aan boord
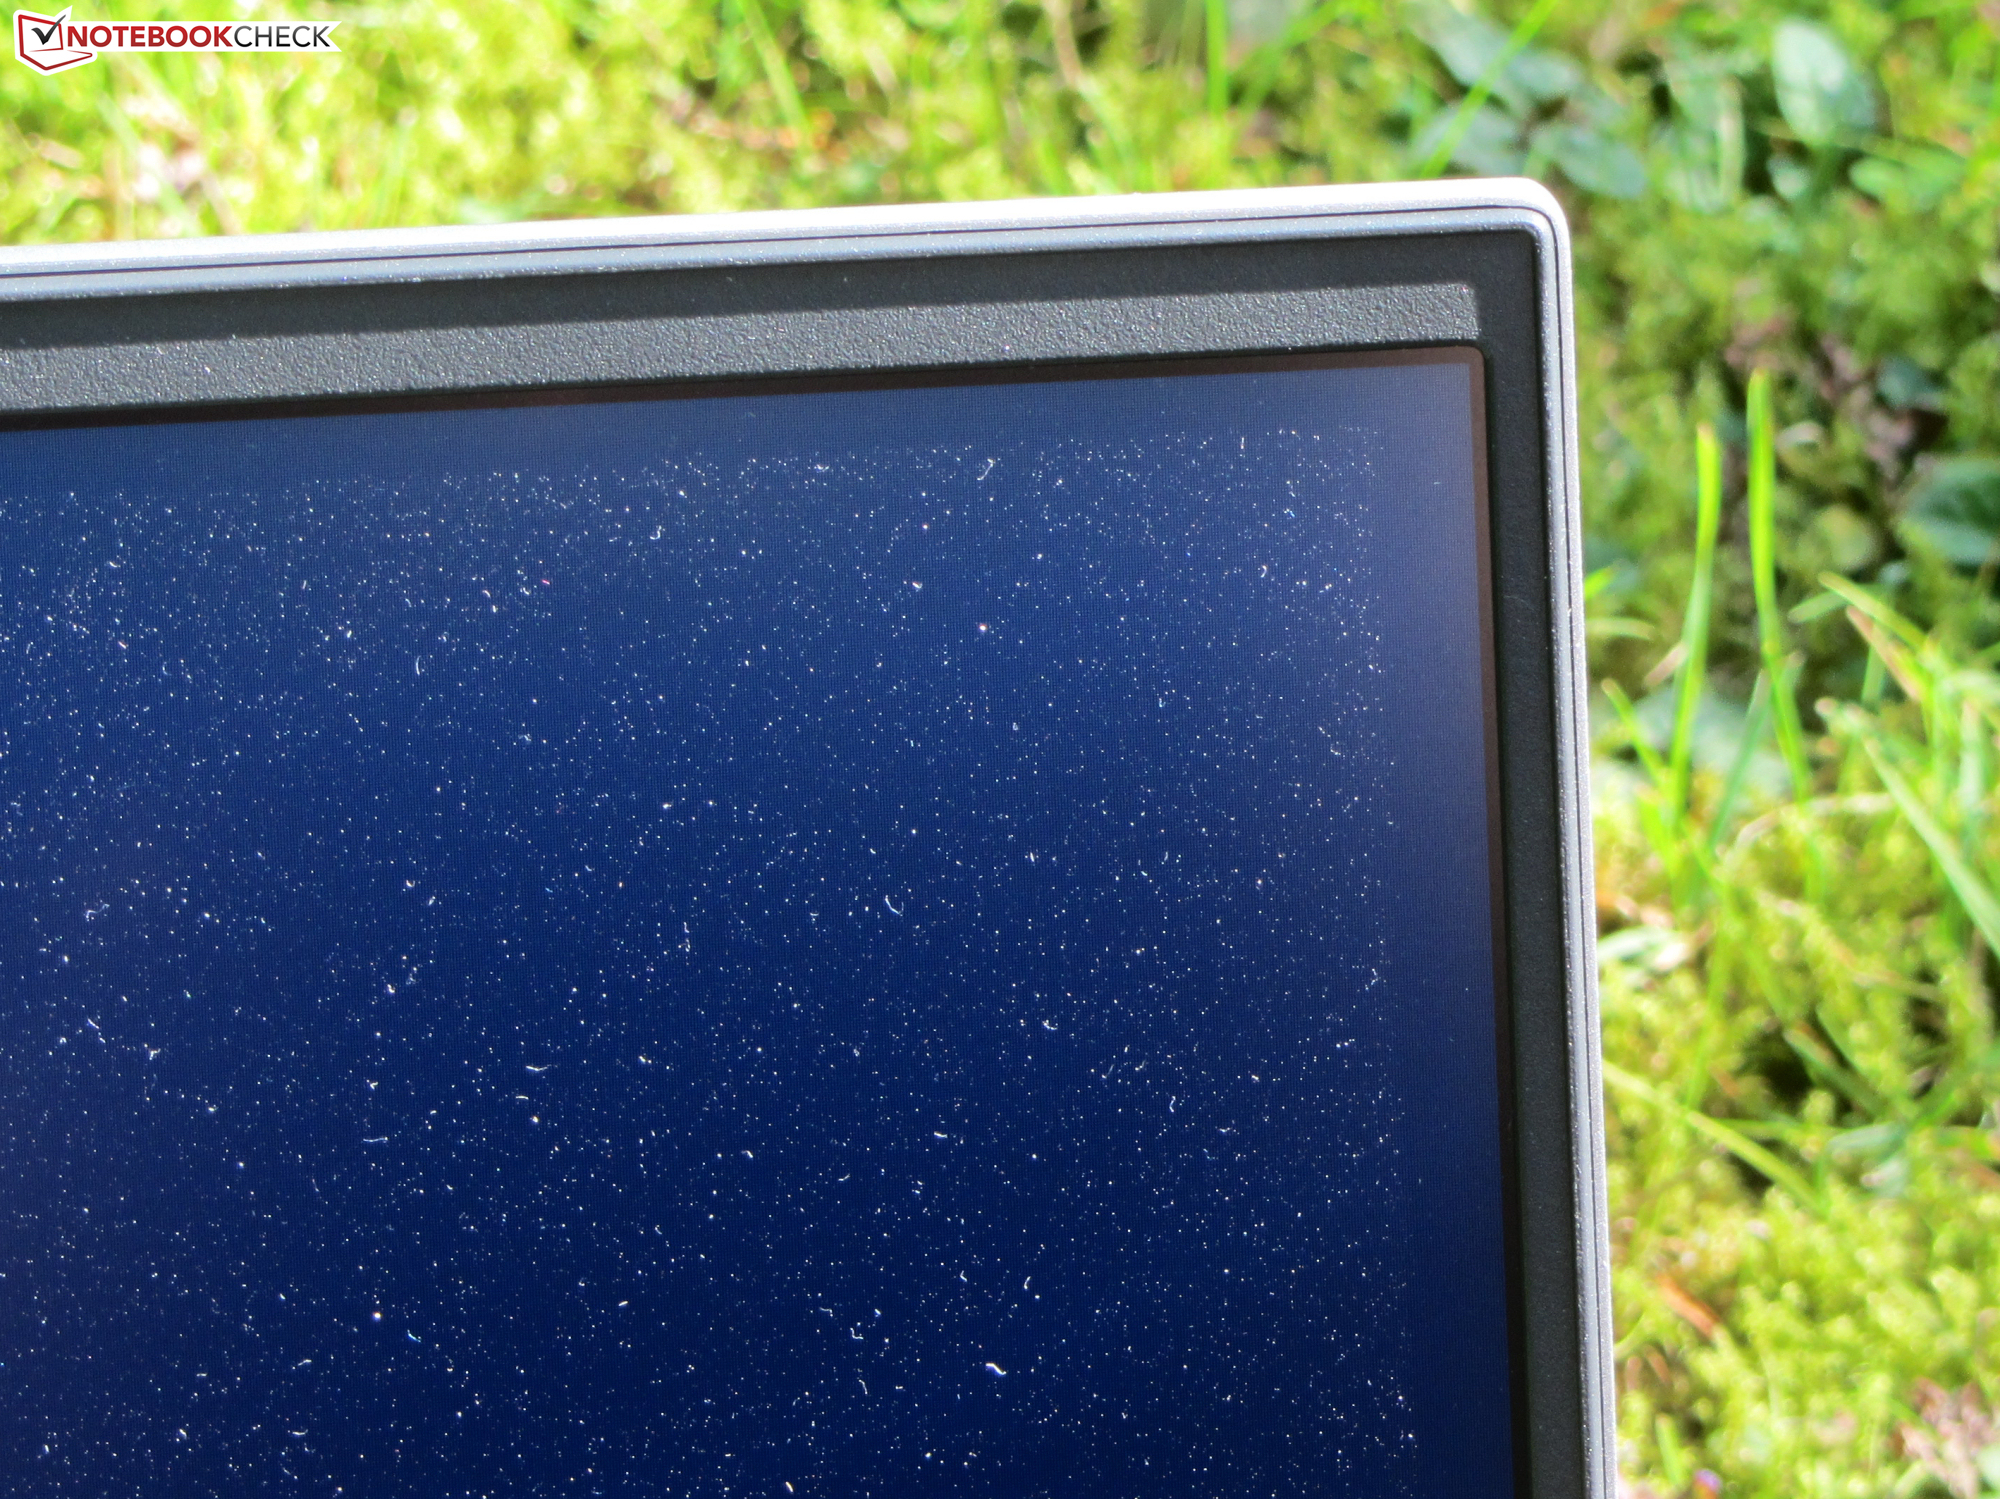
Hoewel het matte 15,6-inch beeldscherm (1.920 x 1.080 pixels) een goed contrast (1.040:1) levert, is de helderheid (267,8 cd/m²) te laag. De waarde daalt nog wat verder in batterijmodus. We beschouwen waarden boven 300 cd/m² als goed.
Het scherm vertoont flikkeringen met een frequentie van 1.000 Hz bij helderheidsniveaus van 90 procent en lager. Door de vrij hoge frequentie zouden gevoelige mensen gevrijwaard moeten blijven van hoofdpijn en/of oogproblemen.
| |||||||||||||||||||||||||
Helderheidsverdeling: 87 %
Helderheid in Batterij-modus: 257 cd/m²
Contrast: 1040:1 (Zwart: 0.275 cd/m²)
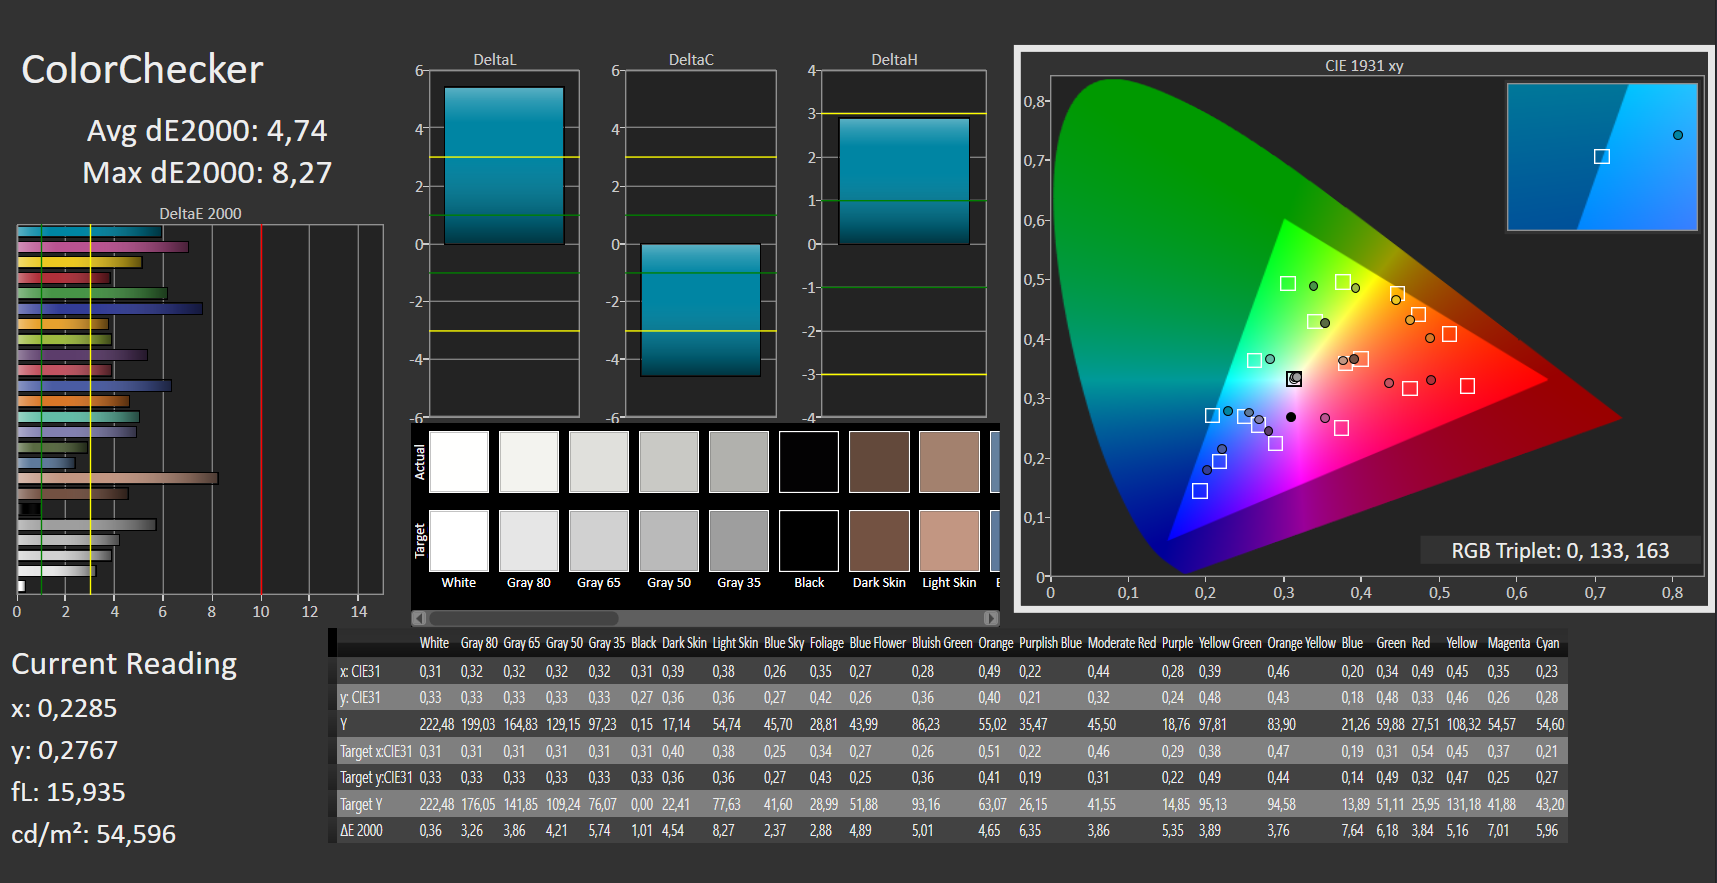
ΔE ColorChecker Calman: 4.74 | ∀{0.5-29.43 Ø4.73}
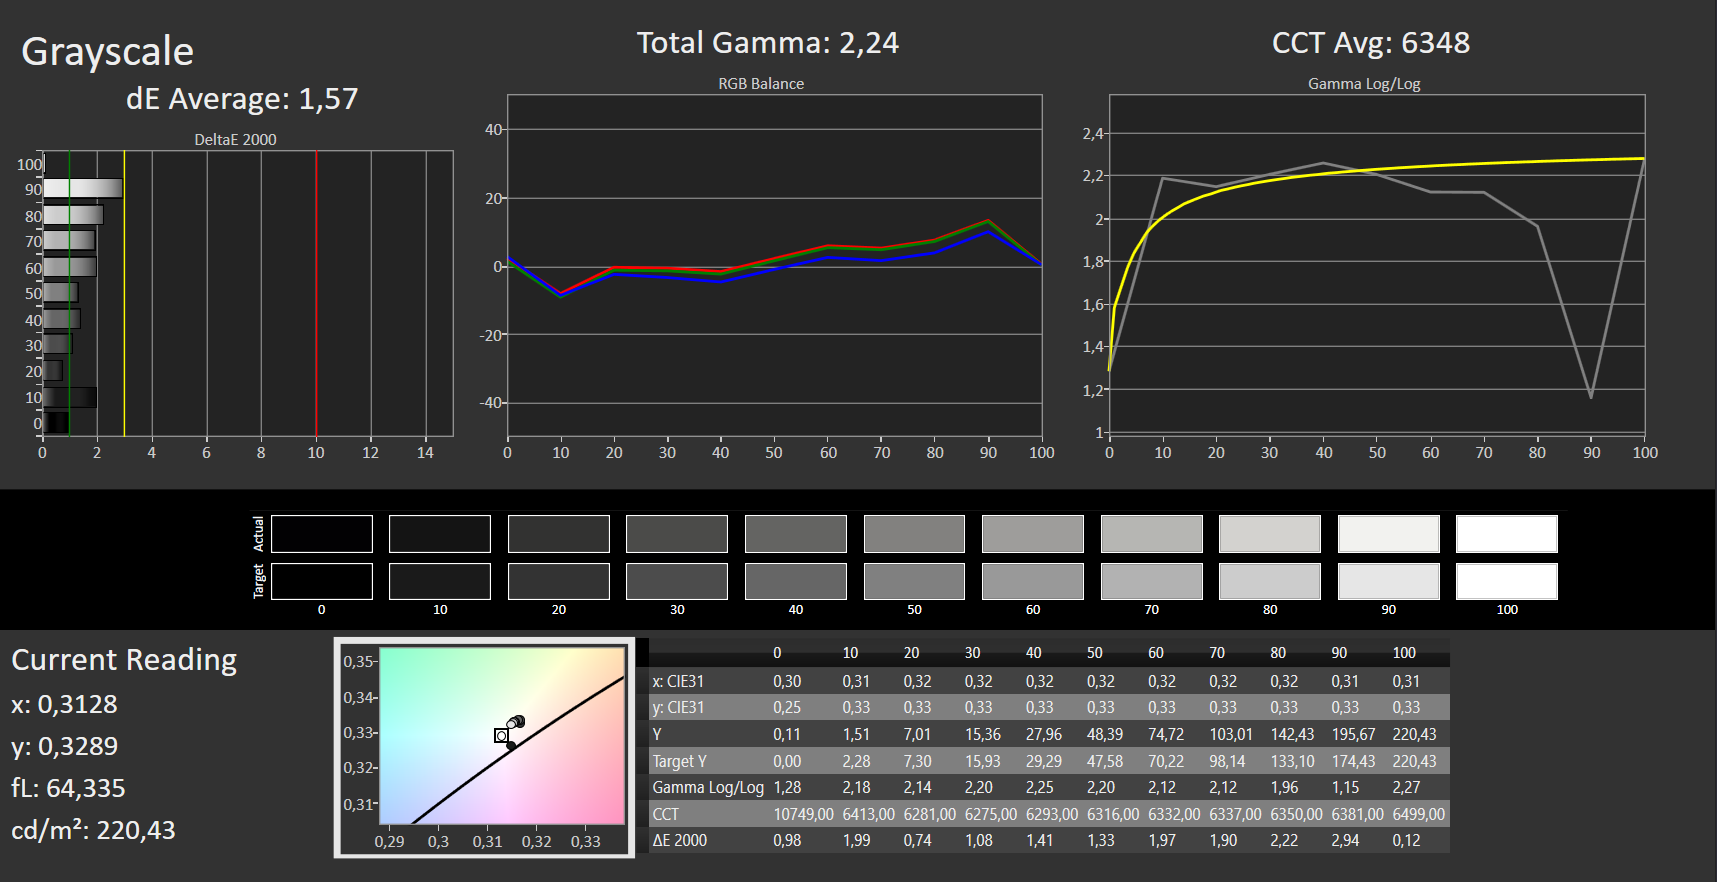
ΔE Greyscale Calman: 1.57 | ∀{0.09-98 Ø4.97}
41.24% AdobeRGB 1998 (Argyll 3D)
58.8% sRGB (Argyll 3D)
39.92% Display P3 (Argyll 3D)
Gamma: 2.24
CCT: 6348 K
| Dell Inspiron 15 5518-2X3JR BOE NV15N4V, IPS, 1920x1080, 15.6" | HP Pavilion 15-eg Chi Mei CMN1523, IPS, 1920x1080, 15.6" | Xiaomi RedmiBook Pro 15 IPS, 3200x2000, 15.6" | Lenovo IdeaPad 5 Pro 16IHU6 Lenovo LEN160WQXGA, IPS, 2560x1600, 16" | Asus VivoBook S15 D533UA Chi Mei N156HCA-EAB, IPS, 1920x1080, 15.6" | Lenovo IdeaPad 5 15ALC05 Lenovo LEN156FHD, IPS, 1920x1080, 15.6" | |
|---|---|---|---|---|---|---|
| Display | 8% | 66% | 78% | 10% | -4% | |
| Display P3 Coverage (%) | 39.92 | 42.9 7% | 66.7 67% | 74 85% | 43.6 9% | |
| sRGB Coverage (%) | 58.8 | 64 9% | 96.3 64% | 98.7 68% | 65.2 11% | 59 0% |
| AdobeRGB 1998 Coverage (%) | 41.24 | 44.4 8% | 68.5 66% | 74.5 81% | 45 9% | 38 -8% |
| Response Times | 34% | 19% | 71% | 48% | 36% | |
| Response Time Grey 50% / Grey 80% * (ms) | 41 ? | 22.8 ? 44% | 34.8 ? 15% | 13 ? 68% | 18 ? 56% | 29 ? 29% |
| Response Time Black / White * (ms) | 31 ? | 23.6 ? 24% | 24 ? 23% | 8 ? 74% | 19 ? 39% | 18 ? 42% |
| PWM Frequency (Hz) | 1000 ? | 26320 ? | ||||
| Screen | -27% | -27% | 10% | -30% | -64% | |
| Brightness middle (cd/m²) | 286 | 294.3 3% | 312 9% | 356 24% | 289 1% | 376 31% |
| Brightness (cd/m²) | 268 | 251 -6% | 298 11% | 322 20% | 267 0% | 341 27% |
| Brightness Distribution (%) | 87 | 76 -13% | 87 0% | 80 -8% | 85 -2% | 78 -10% |
| Black Level * (cd/m²) | 0.275 | 0.26 5% | 0.18 35% | 0.27 2% | 0.56 -104% | 0.66 -140% |
| Contrast (:1) | 1040 | 1132 9% | 1733 67% | 1319 27% | 516 -50% | 570 -45% |
| Colorchecker dE 2000 * | 4.74 | 4.08 14% | 5.39 -14% | 2.4 49% | 3.96 16% | 6.4 -35% |
| Colorchecker dE 2000 max. * | 8.27 | 19.49 -136% | 9.95 -20% | 4.42 47% | 6.76 18% | 20.45 -147% |
| Greyscale dE 2000 * | 1.57 | 3 -91% | 6.3 -301% | 2.81 -79% | 3.43 -118% | 4.59 -192% |
| Gamma | 2.24 98% | 2.21 100% | 2.192 100% | 2.4 92% | 2.28 96% | 2.26 97% |
| CCT | 6348 102% | 6616 98% | 7473 87% | 6294 103% | 7191 90% | 6819 95% |
| Colorchecker dE 2000 calibrated * | 3.7 | 3.15 | ||||
| Color Space (Percent of AdobeRGB 1998) (%) | 69 | 42 | 38 | |||
| Color Space (Percent of sRGB) (%) | 96 | 65 | 59 | |||
| Totaal Gemiddelde (Programma / Instellingen) | 5% /
-9% | 19% /
2% | 53% /
35% | 9% /
-9% | -11% /
-37% |
* ... kleiner is beter
Responstijd Scherm
| ↔ Responstijd Zwart naar Wit | ||
|---|---|---|
| 31 ms ... stijging ↗ en daling ↘ gecombineerd | ↗ 17 ms stijging |  |
| ↘ 14 ms daling | ||
| Het scherm vertoonde trage responstijden in onze tests en is misschien te traag voor games. Ter vergelijking: alle testtoestellen variëren van 0.1 (minimum) tot 240 (maximum) ms. » 84 % van alle toestellen zijn beter. Dit betekent dat de gemeten responstijd slechter is dan het gemiddelde (19.9 ms) van alle geteste toestellen. | ||
| ↔ Responstijd 50% Grijs naar 80% Grijs | ||
| 41 ms ... stijging ↗ en daling ↘ gecombineerd | ↗ 21 ms stijging |  |
| ↘ 20 ms daling | ||
| Het scherm vertoonde trage responstijden in onze tests en is misschien te traag voor games. Ter vergelijking: alle testtoestellen variëren van 0.165 (minimum) tot 636 (maximum) ms. » 65 % van alle toestellen zijn beter. Dit betekent dat de gemeten responstijd slechter is dan het gemiddelde (31.1 ms) van alle geteste toestellen. | ||
Screen Flickering / PWM (Pulse-Width Modulation)
| Screen flickering / PWM waargenomen | 1000 Hz | ≤ 90 % helderheid instelling |  |
De achtergrondverlichting van het scherm flikkert op 1000 Hz (in het slechtste geval, bijvoorbeeld bij gebruik van PWM) aan een helderheid van 90 % en lager. Boven deze helderheid zou er geen flickering / PWM mogen optreden. De frequentie van 1000 Hz is redelijk hoog en de meeste mensen die gevoelig zijn aan flickering zouden dit dus niet mogen waarnemen of geïrriteerde ogen krijgen. Ter vergelijking: 52 % van alle geteste toestellen maakten geen gebruik van PWM om de schermhelderheid te verlagen. Als het wel werd gebruikt, werd een gemiddelde van 7791 (minimum: 5 - maximum: 343500) Hz waargenomen. | |||
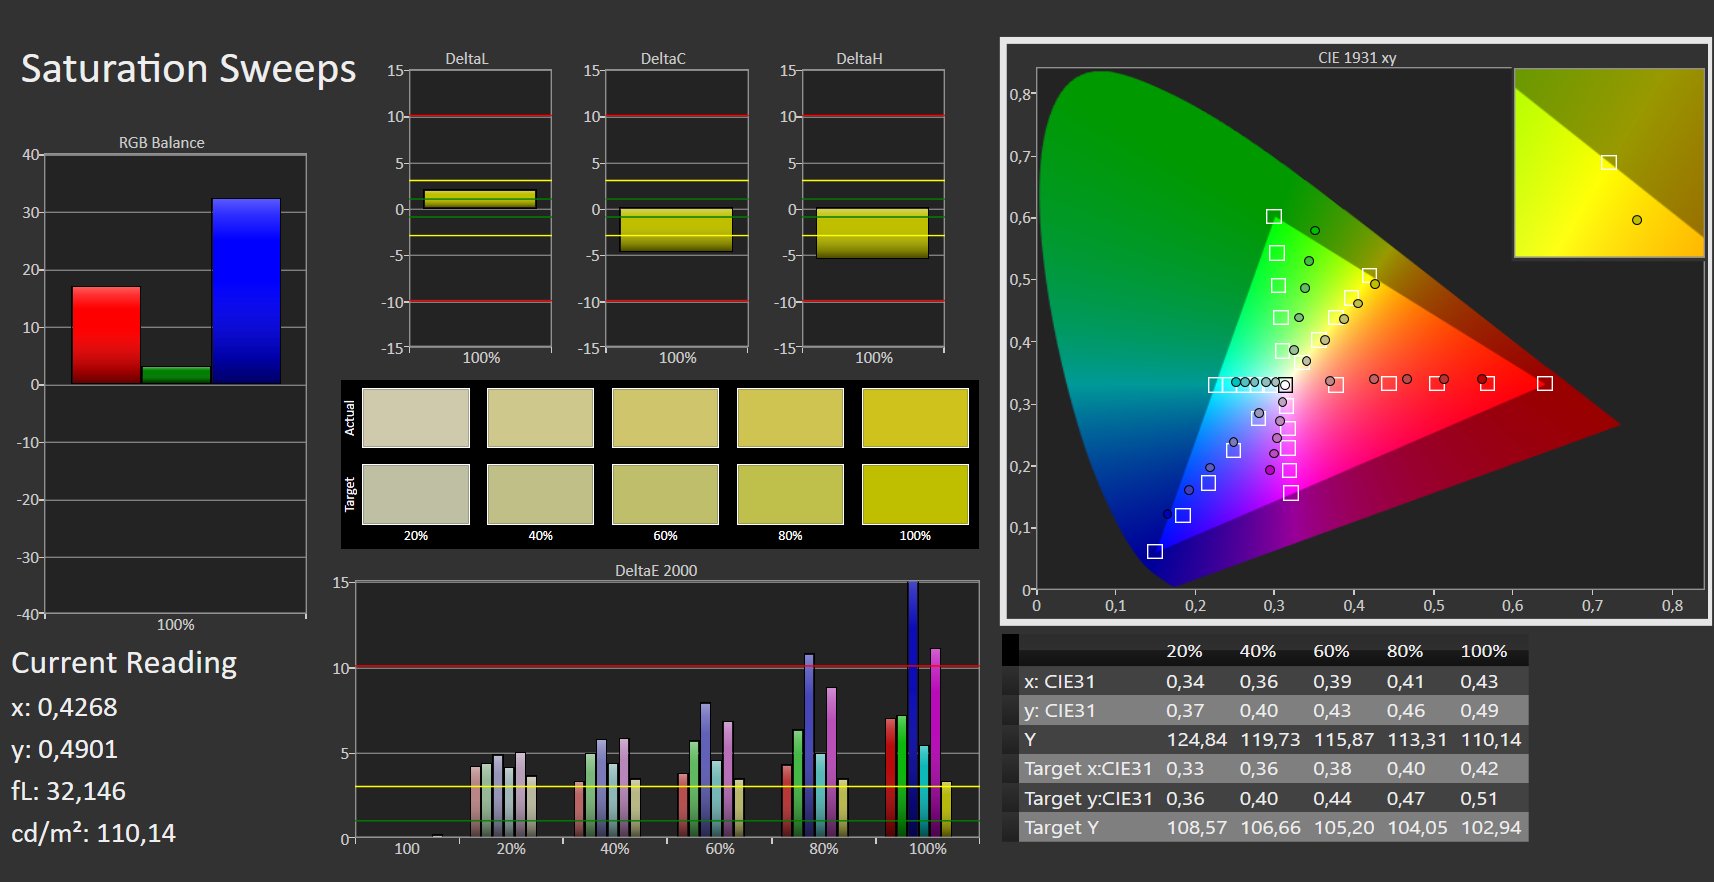
Het scherm heeft een behoorlijke kleurweergave in de staat waarin het is afgeleverd, maar de kleuren wijken een beetje af van het doel - het geheel ligt nog binnen een aanvaardbaar bereik. Het heeft geen last van een blauwzweem. Het scherm kan de AdobeRGB (41%), sRGB (59%) en DCI-P3 (40%) kleurruimtes niet reproduceren.
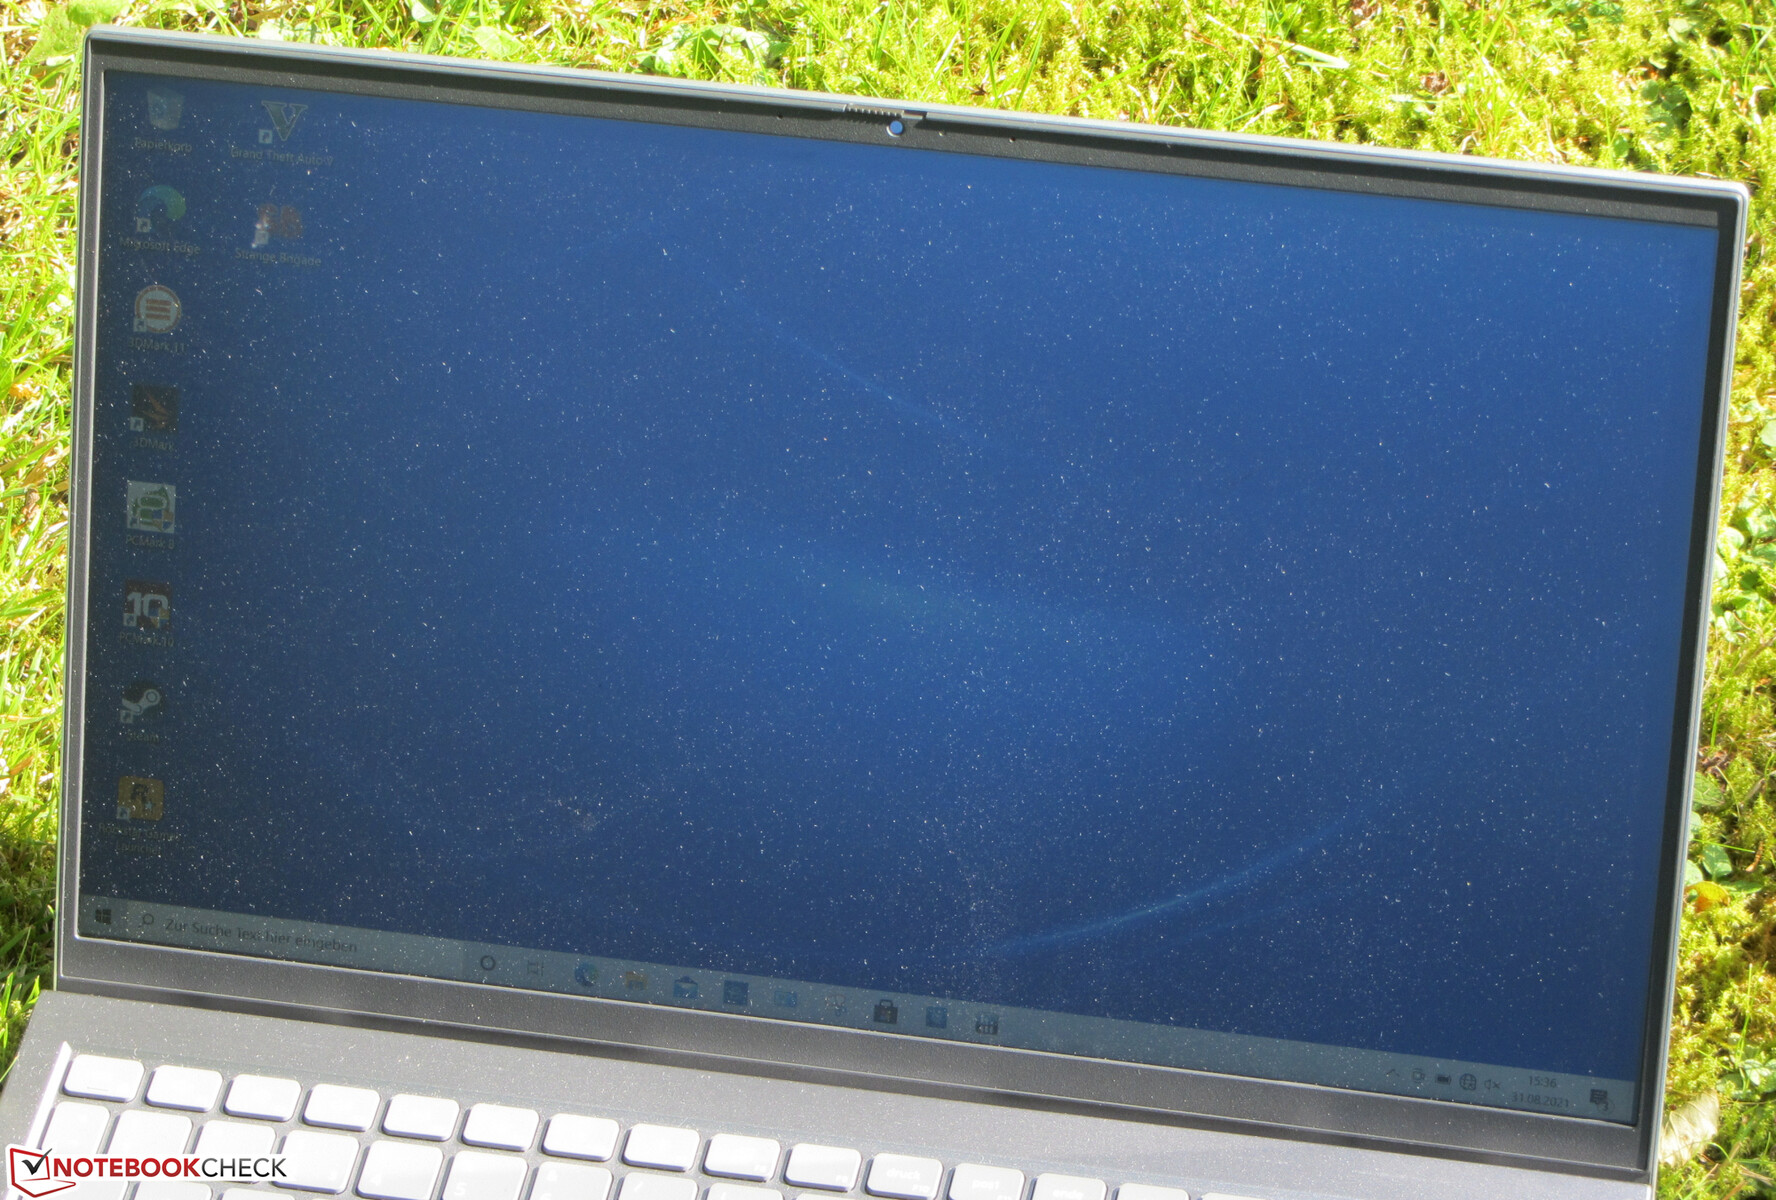
Het kijkhoekstabiele IPS-paneel kan vanuit elke positie worden gelezen. Het scherm kan buiten worden gelezen als de zon niet te fel schijnt.
Prestaties - De CPU van de Dell computer blijft onder zijn mogelijkheden
De 15,6-inch allrounder van Dell biedt voldoende prestaties voor kantoor- en internettoepassingen en maakt het gebruik van computerspellen mogelijk.
Testomstandigheden
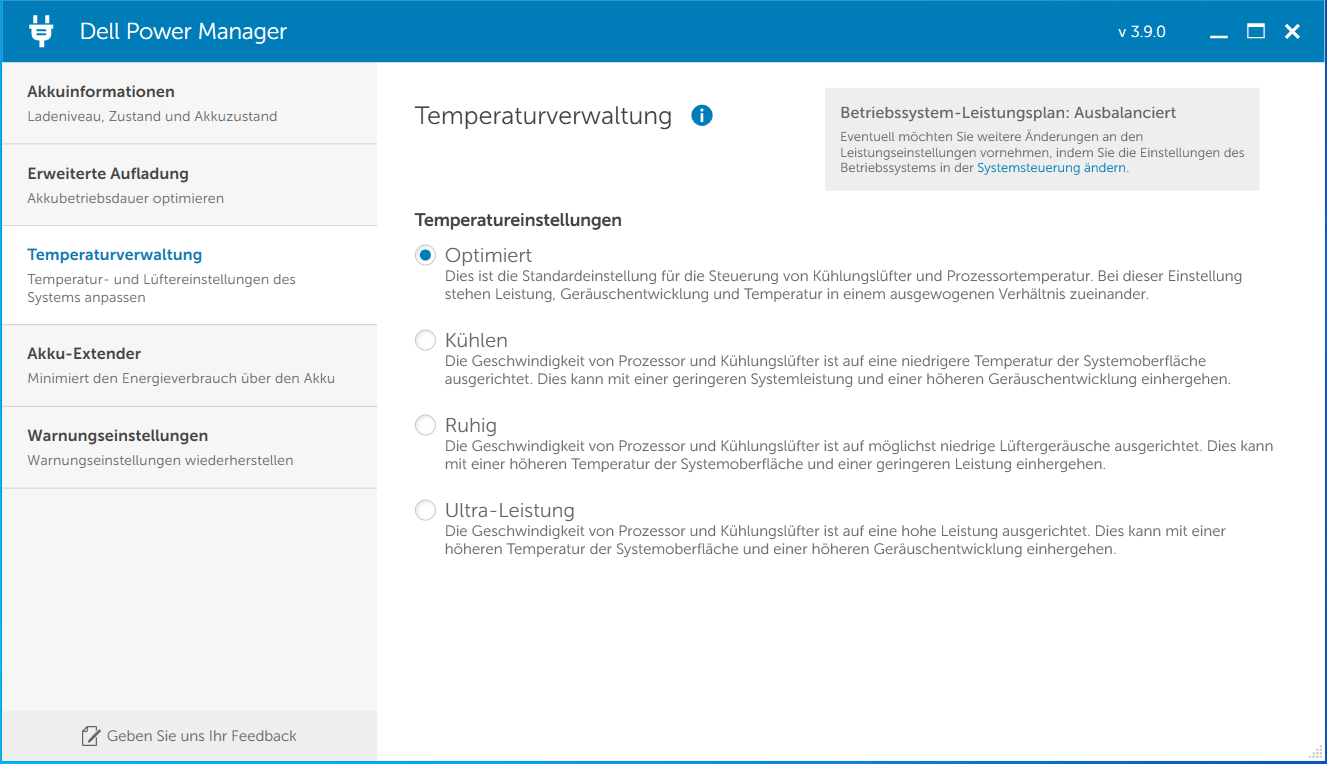
Dell Power Manager biedt profielen die de temperatuur en de energieontwikkeling van de notebook beïnvloeden. Wij hebben het profiel "Optimized" gebruikt. Sommige benchmarks werden bovendien uitgevoerd met het "Ultra Performance" profiel actief.
| Optimized Cool Quiet Ultra Performance |
|---|
| PL1 25 watt 15 watt 30 watt |
| PL2 |
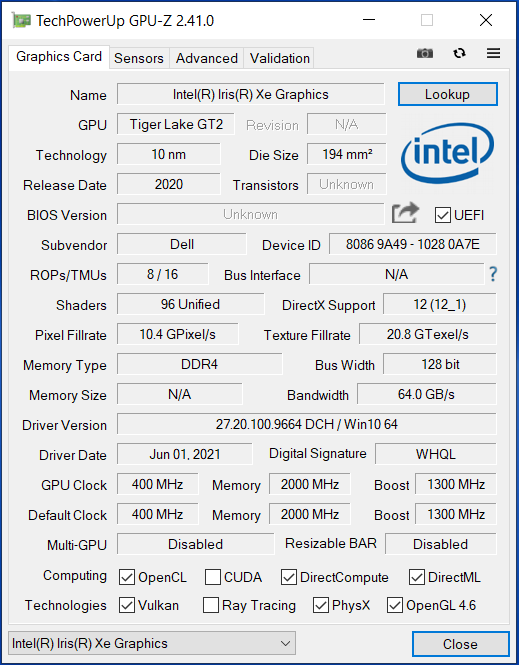
Processor
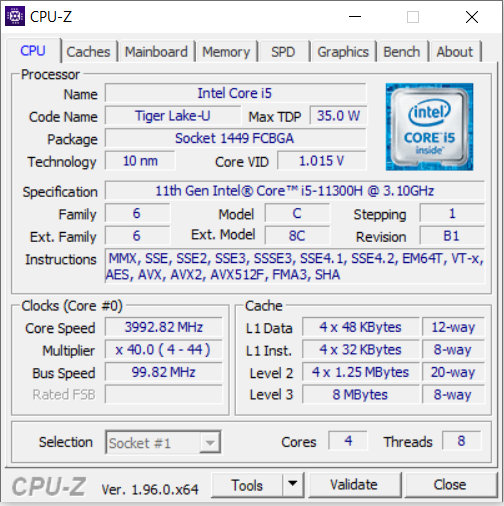
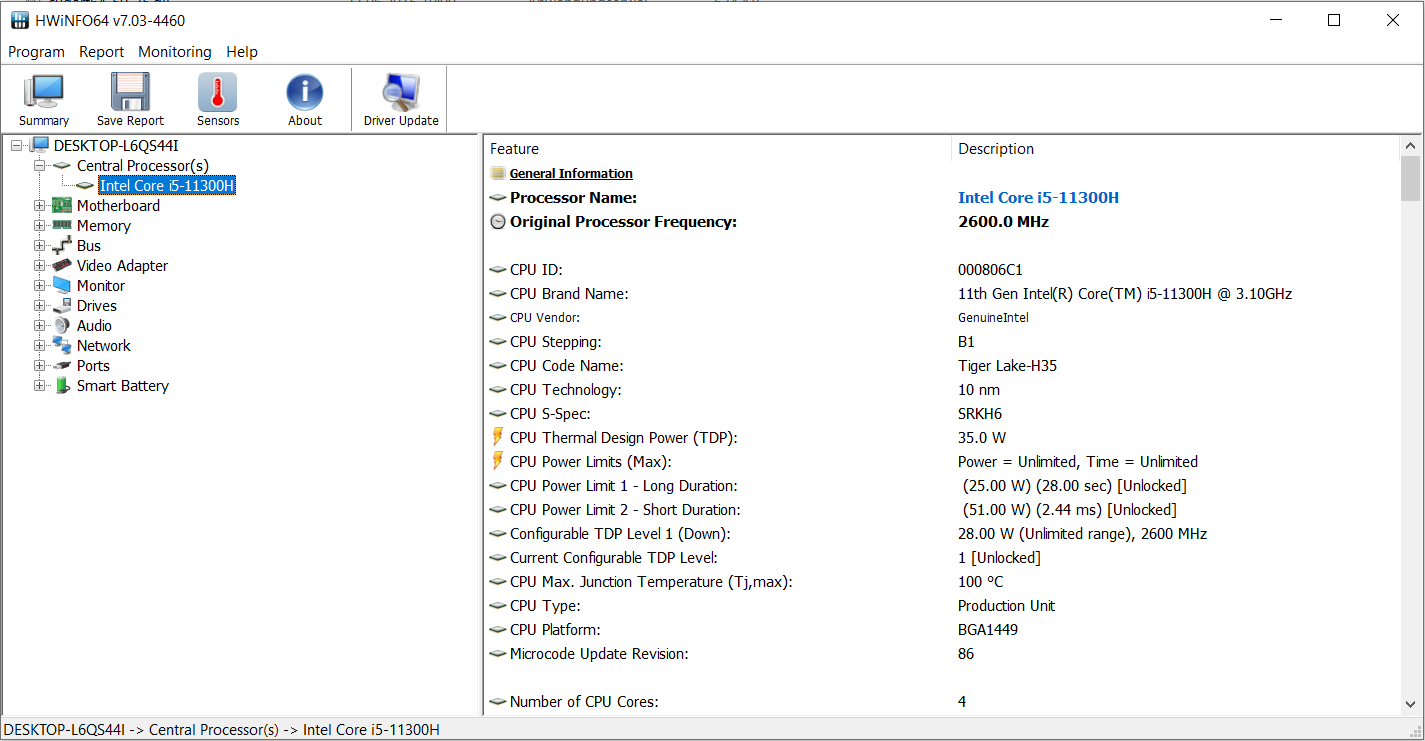
De Core i7-11300H-Quad-core processor (Tiger Lake) werkt met een basisklok van 3,1 GHz. Een verhoging naar 4 GHz (vier cores) tot 4,4 GHz (één core) is mogelijk via Turbo. Hyperthreading (twee threads per core) wordt ondersteund.
De multi-thread test van de Cinebench R15 benchmark wordt korte tijd op 3,3 tot 4 GHz uitgevoerd, daarna schommelt de klok tussen 600 MHz en 3 GHz. De single-thread test wordt uitgevoerd met 1,6 tot 4,4 GHz. De kloksnelheden zijn lager in de batterijmodus.
Dell heeft gekozen voor relatief lage vermogenslimieten voor de CPU. Hierdoor blijft de 11300H onder zijn kunnen, getuige een vergelijking met de benchmark resultaten van de Ideapad 5 Pro 16IHU6 laat zien. De kloof is aanzienlijk groter in de multi-thread tests dan in de single-thread tests
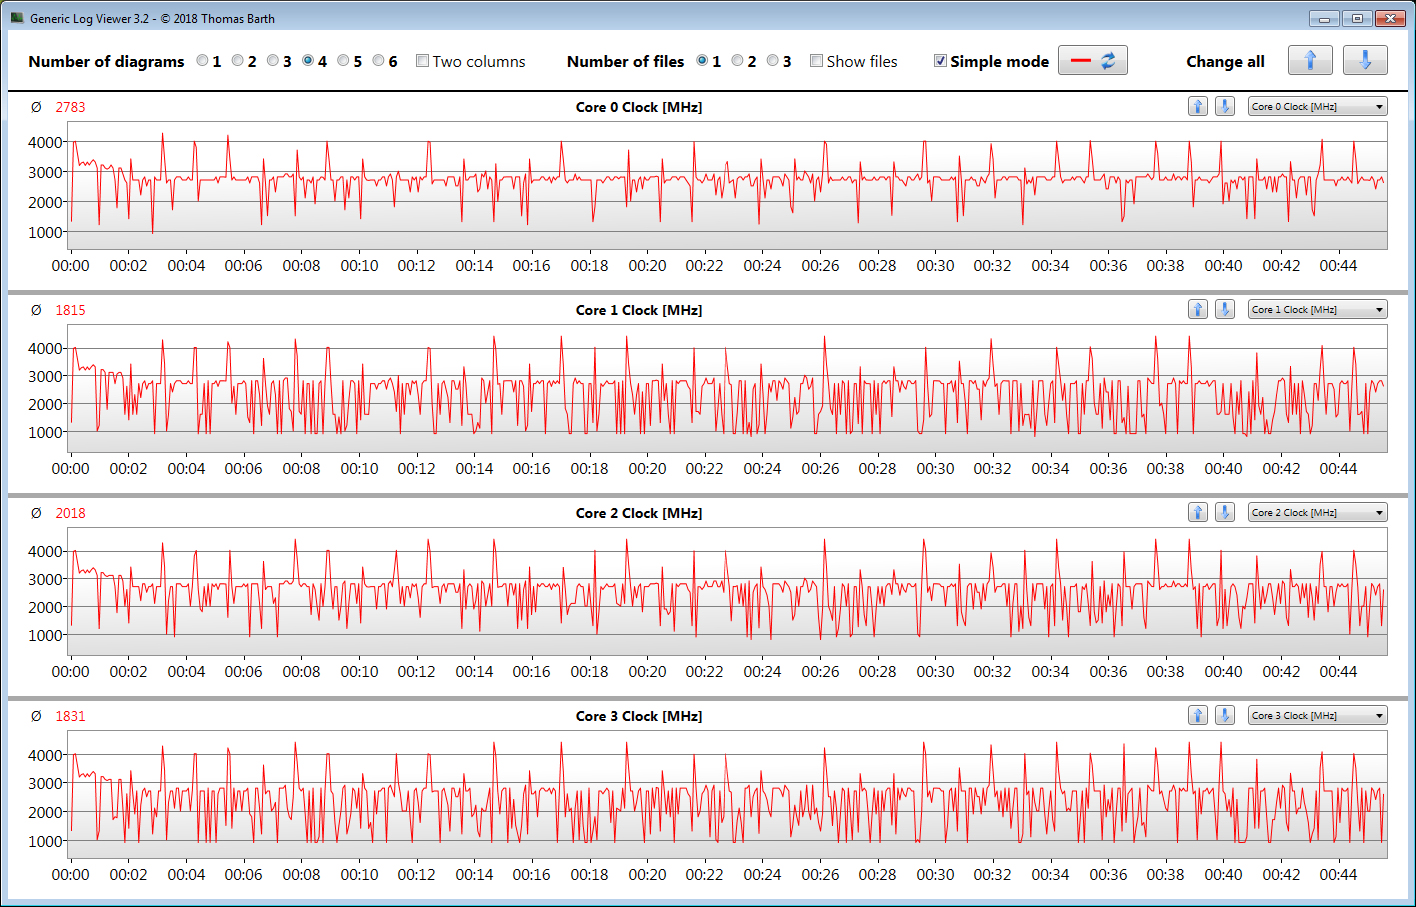
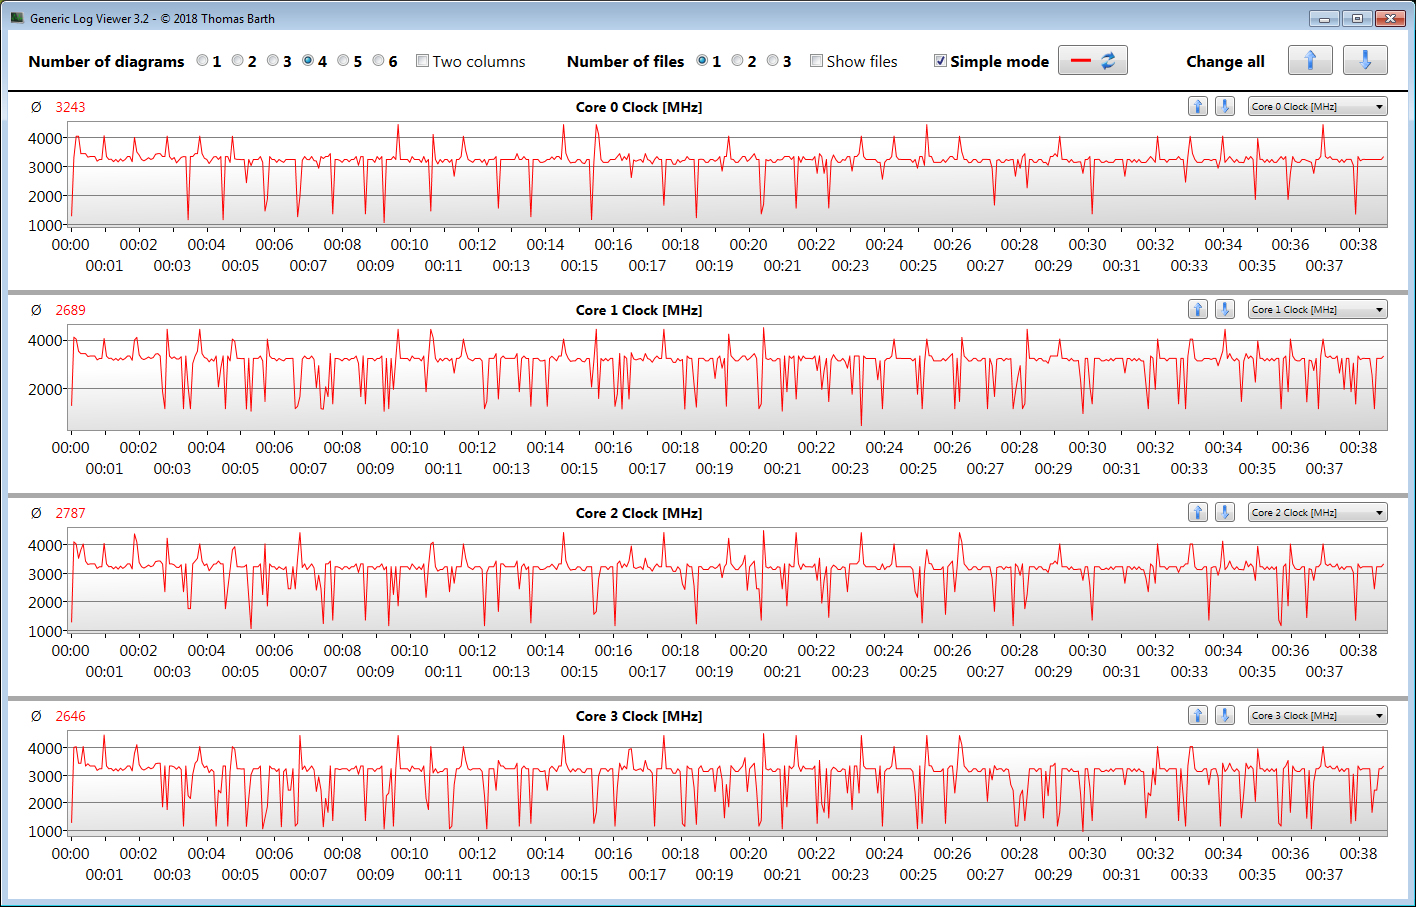
We controleren of de CPU Turbo ook permanent wordt gebruikt in netstroombedrijf door de multi-thread test van de Cinebench R15 benchmark gedurende ten minste 30 minuten in een lus te laten lopen. De Turbo wordt alleen in het begin gebruikt, meestal wordt de basisklok onderschreden. Het "Ultra Performance" profiel laat de CPU op hogere snelheden draaien.
Cinebench R15 Multi Endurance test
| Cinebench R23 | |
| Single Core | |
| Gemiddelde van klas Office (708 - 2130, n=74, laatste 2 jaar) | |
| Xiaomi RedmiBook Pro 15 | |
| HP Pavilion 15-eg | |
| Lenovo IdeaPad 5 Pro 16IHU6 | |
| Dell Inspiron 15 5518-2X3JR (Ultra-Leistung) | |
| Gemiddeld Intel Core i5-11300H (1218 - 1431, n=11) | |
| Dell Inspiron 15 5518-2X3JR | |
| Asus VivoBook S15 D533UA | |
| Lenovo IdeaPad 5 15ALC05 | |
| Multi Core | |
| Gemiddelde van klas Office (1673 - 22808, n=74, laatste 2 jaar) | |
| Asus VivoBook S15 D533UA | |
| Lenovo IdeaPad 5 15ALC05 | |
| Lenovo IdeaPad 5 Pro 16IHU6 | |
| Xiaomi RedmiBook Pro 15 | |
| Xiaomi RedmiBook Pro 15 | |
| Gemiddeld Intel Core i5-11300H (3313 - 6581, n=10) | |
| HP Pavilion 15-eg | |
| Dell Inspiron 15 5518-2X3JR (Ultra-Leistung) | |
| Dell Inspiron 15 5518-2X3JR | |
| Cinebench R20 | |
| CPU (Single Core) | |
| Gemiddelde van klas Office (345 - 816, n=73, laatste 2 jaar) | |
| Xiaomi RedmiBook Pro 15 | |
| HP Pavilion 15-eg | |
| Lenovo IdeaPad 5 Pro 16IHU6 | |
| Dell Inspiron 15 5518-2X3JR (Ultra-Leistung) | |
| Dell Inspiron 15 5518-2X3JR | |
| Gemiddeld Intel Core i5-11300H (431 - 548, n=11) | |
| Asus VivoBook S15 D533UA | |
| Lenovo IdeaPad 5 15ALC05 | |
| CPU (Multi Core) | |
| Gemiddelde van klas Office (648 - 8840, n=73, laatste 2 jaar) | |
| Asus VivoBook S15 D533UA | |
| Lenovo IdeaPad 5 15ALC05 | |
| Lenovo IdeaPad 5 Pro 16IHU6 | |
| Xiaomi RedmiBook Pro 15 | |
| Gemiddeld Intel Core i5-11300H (1300 - 2533, n=10) | |
| Dell Inspiron 15 5518-2X3JR | |
| HP Pavilion 15-eg | |
| Dell Inspiron 15 5518-2X3JR (Ultra-Leistung) | |
| Cinebench R15 | |
| CPU Single 64Bit | |
| Gemiddelde van klas Office (99.5 - 312, n=75, laatste 2 jaar) | |
| Xiaomi RedmiBook Pro 15 | |
| Xiaomi RedmiBook Pro 15 | |
| HP Pavilion 15-eg | |
| Asus VivoBook S15 D533UA | |
| Lenovo IdeaPad 5 15ALC05 | |
| Lenovo IdeaPad 5 Pro 16IHU6 | |
| Gemiddeld Intel Core i5-11300H (123 - 211, n=8) | |
| Dell Inspiron 15 5518-2X3JR | |
| CPU Multi 64Bit | |
| Gemiddelde van klas Office (250 - 3380, n=75, laatste 2 jaar) | |
| Asus VivoBook S15 D533UA | |
| Lenovo IdeaPad 5 15ALC05 | |
| Xiaomi RedmiBook Pro 15 (Variable PL1 ) | |
| Xiaomi RedmiBook Pro 15 (Pl1 @ 25W) | |
| Xiaomi RedmiBook Pro 15 (PL1 fixed @ 28W) | |
| Lenovo IdeaPad 5 Pro 16IHU6 | |
| Gemiddeld Intel Core i5-11300H (632 - 990, n=11) | |
| Dell Inspiron 15 5518-2X3JR (Ultra-Leistung) | |
| Dell Inspiron 15 5518-2X3JR | |
| HP Pavilion 15-eg | |
| Blender - v2.79 BMW27 CPU | |
| Dell Inspiron 15 5518-2X3JR | |
| Dell Inspiron 15 5518-2X3JR (Ultra-Leistung) | |
| HP Pavilion 15-eg | |
| Gemiddeld Intel Core i5-11300H (466 - 862, n=10) | |
| Lenovo IdeaPad 5 Pro 16IHU6 | |
| Xiaomi RedmiBook Pro 15 | |
| Lenovo IdeaPad 5 15ALC05 | |
| Gemiddelde van klas Office (158 - 1940, n=74, laatste 2 jaar) | |
| Asus VivoBook S15 D533UA | |
| 7-Zip 18.03 | |
| 7z b 4 -mmt1 | |
| HP Pavilion 15-eg | |
| Xiaomi RedmiBook Pro 15 | |
| Gemiddelde van klas Office (3387 - 6469, n=75, laatste 2 jaar) | |
| Lenovo IdeaPad 5 Pro 16IHU6 | |
| Dell Inspiron 15 5518-2X3JR | |
| Dell Inspiron 15 5518-2X3JR (Ultra-Leistung) | |
| Gemiddeld Intel Core i5-11300H (4603 - 4969, n=10) | |
| Asus VivoBook S15 D533UA | |
| Lenovo IdeaPad 5 15ALC05 | |
| 7z b 4 | |
| Gemiddelde van klas Office (7098 - 76886, n=75, laatste 2 jaar) | |
| Asus VivoBook S15 D533UA | |
| Lenovo IdeaPad 5 15ALC05 | |
| Xiaomi RedmiBook Pro 15 | |
| Lenovo IdeaPad 5 Pro 16IHU6 | |
| Gemiddeld Intel Core i5-11300H (17573 - 26001, n=10) | |
| HP Pavilion 15-eg | |
| Dell Inspiron 15 5518-2X3JR (Ultra-Leistung) | |
| Dell Inspiron 15 5518-2X3JR | |
| Geekbench 5.5 | |
| Single-Core | |
| Gemiddelde van klas Office (811 - 2128, n=71, laatste 2 jaar) | |
| Xiaomi RedmiBook Pro 15 | |
| Lenovo IdeaPad 5 Pro 16IHU6 | |
| Gemiddeld Intel Core i5-11300H (1342 - 1462, n=10) | |
| Dell Inspiron 15 5518-2X3JR (Ultra-Leistung) | |
| Dell Inspiron 15 5518-2X3JR | |
| Asus VivoBook S15 D533UA | |
| Lenovo IdeaPad 5 15ALC05 | |
| Multi-Core | |
| Gemiddelde van klas Office (1483 - 16999, n=71, laatste 2 jaar) | |
| Asus VivoBook S15 D533UA | |
| Lenovo IdeaPad 5 15ALC05 | |
| Xiaomi RedmiBook Pro 15 | |
| Lenovo IdeaPad 5 Pro 16IHU6 | |
| Gemiddeld Intel Core i5-11300H (3631 - 5499, n=10) | |
| Dell Inspiron 15 5518-2X3JR (Ultra-Leistung) | |
| Dell Inspiron 15 5518-2X3JR | |
| HWBOT x265 Benchmark v2.2 - 4k Preset | |
| Gemiddelde van klas Office (2.21 - 26, n=74, laatste 2 jaar) | |
| Asus VivoBook S15 D533UA | |
| Lenovo IdeaPad 5 15ALC05 | |
| Lenovo IdeaPad 5 Pro 16IHU6 | |
| Gemiddeld Intel Core i5-11300H (4.32 - 8.38, n=10) | |
| Xiaomi RedmiBook Pro 15 | |
| HP Pavilion 15-eg | |
| Dell Inspiron 15 5518-2X3JR (Ultra-Leistung) | |
| Dell Inspiron 15 5518-2X3JR | |
| LibreOffice - 20 Documents To PDF | |
| Lenovo IdeaPad 5 15ALC05 | |
| Gemiddelde van klas Office (39.9 - 102.3, n=74, laatste 2 jaar) | |
| Asus VivoBook S15 D533UA | |
| Lenovo IdeaPad 5 Pro 16IHU6 | |
| Gemiddeld Intel Core i5-11300H (43.6 - 59.4, n=10) | |
| Xiaomi RedmiBook Pro 15 | |
| Dell Inspiron 15 5518-2X3JR | |
| HP Pavilion 15-eg | |
| Dell Inspiron 15 5518-2X3JR (Ultra-Leistung) | |
| R Benchmark 2.5 - Overall mean | |
| Lenovo IdeaPad 5 15ALC05 | |
| Dell Inspiron 15 5518-2X3JR (Ultra-Leistung) | |
| Dell Inspiron 15 5518-2X3JR | |
| Gemiddeld Intel Core i5-11300H (0.6 - 0.644, n=10) | |
| Lenovo IdeaPad 5 Pro 16IHU6 | |
| Asus VivoBook S15 D533UA | |
| HP Pavilion 15-eg | |
| Xiaomi RedmiBook Pro 15 | |
| Gemiddelde van klas Office (0.4098 - 0.888, n=74, laatste 2 jaar) | |
* ... kleiner is beter
Prestaties van het systeem
Het lichtvoetige en soepel werkende systeemlevert voldoende prestaties voor alle gangbare toepassingsgebieden. De in principe goede PCMark resultaten blijven een beetje achter bij de concurrentie.
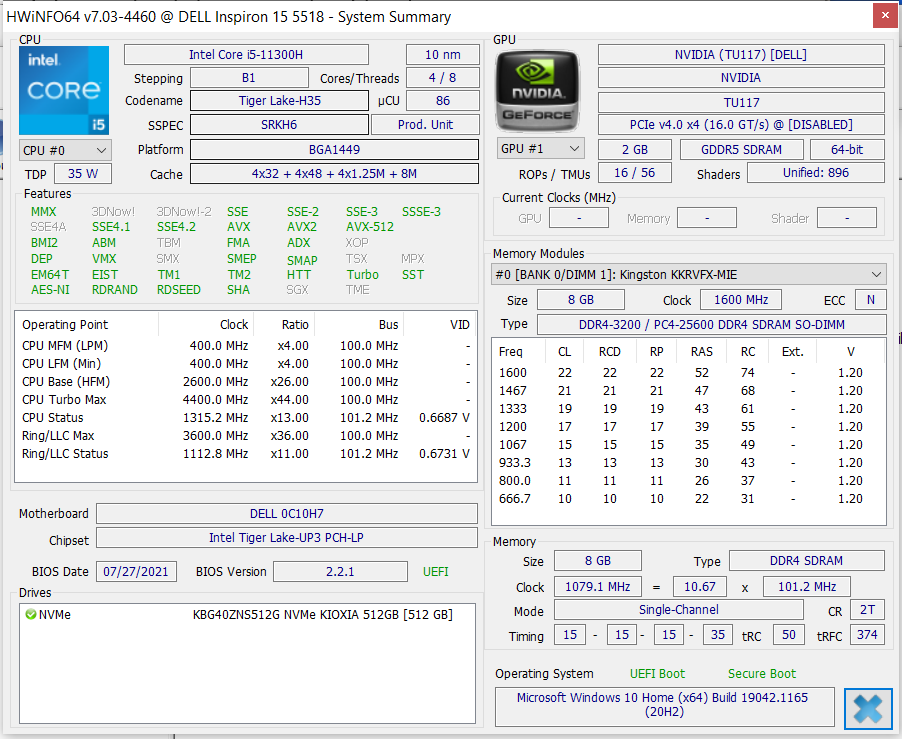
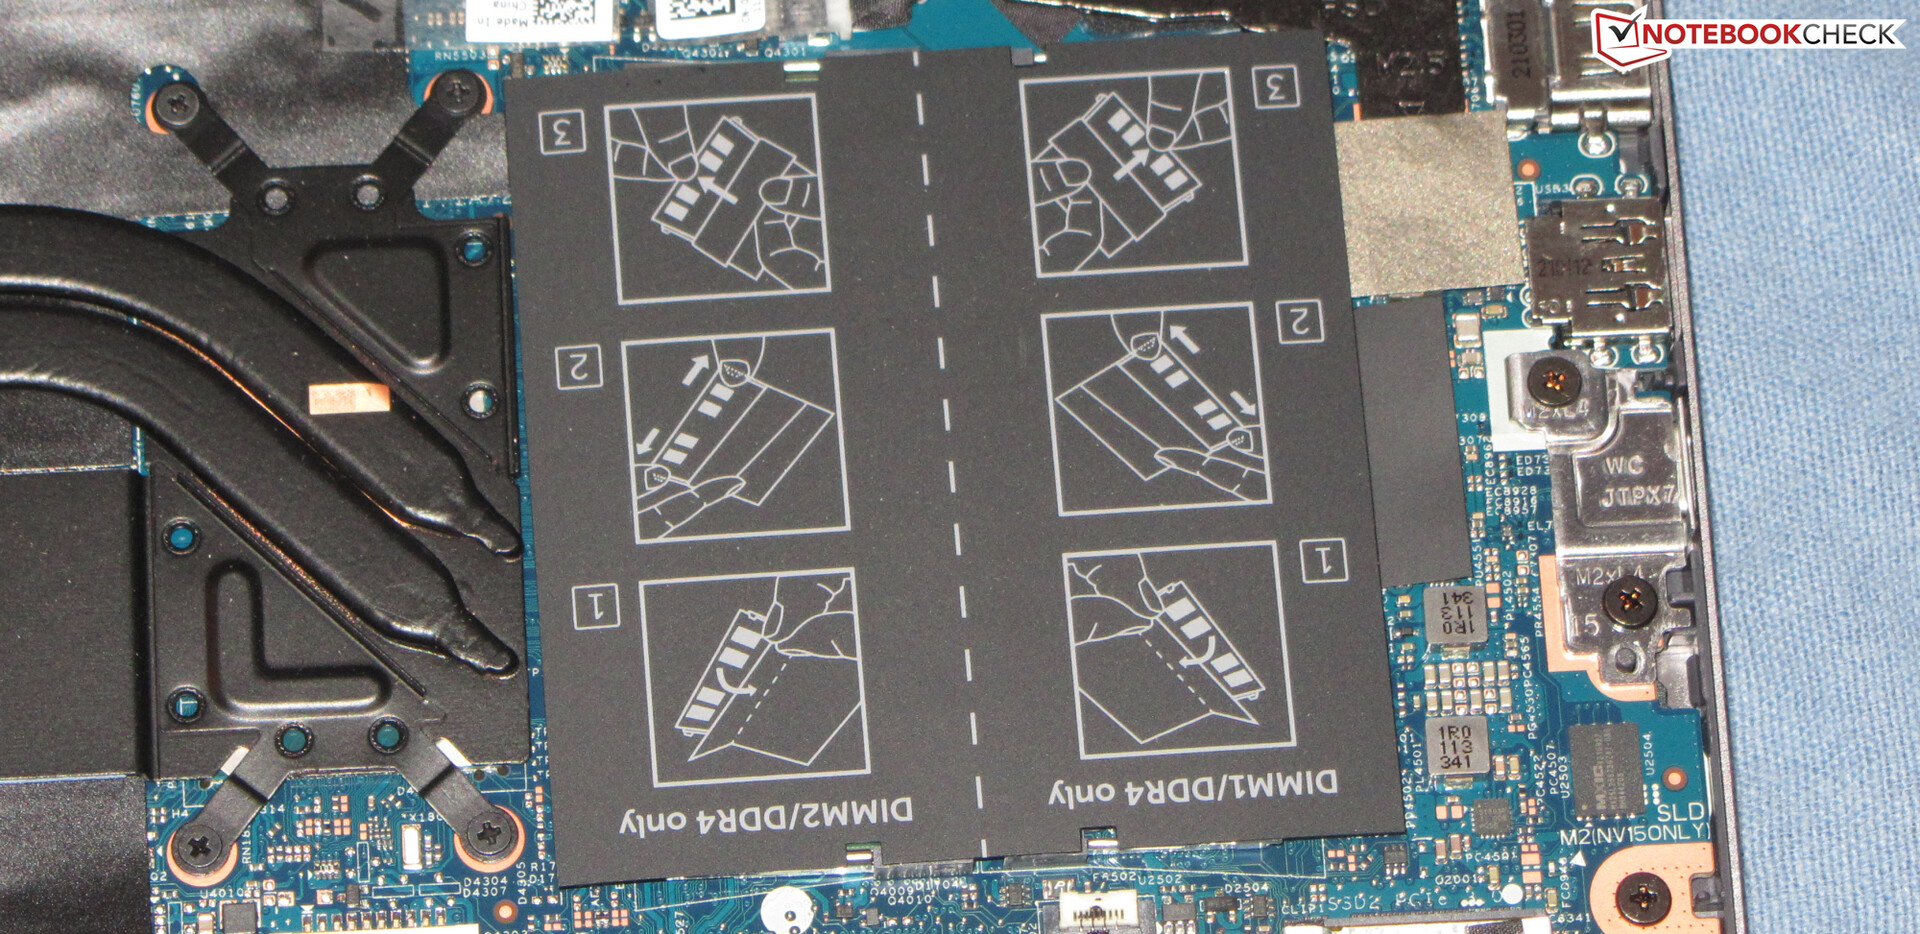
Een deel van de prestatiesblijft onbenutdoordat hetwerkgeheugen in single-channel mode draait.Dual-channel mode kan worden geactiveerd door een tweede geheugenmodule te installeren.
| PCMark 10 Score | 4899 punten | |
Help | ||
| PCMark 10 / Score | |
| Gemiddelde van klas Office (2601 - 9298, n=64, laatste 2 jaar) | |
| HP Pavilion 15-eg | |
| Xiaomi RedmiBook Pro 15 | |
| Asus VivoBook S15 D533UA | |
| Lenovo IdeaPad 5 Pro 16IHU6 | |
| Lenovo IdeaPad 5 15ALC05 | |
| Gemiddeld Intel Core i5-11300H, NVIDIA GeForce MX450 (4899 - 5391, n=3) | |
| Dell Inspiron 15 5518-2X3JR | |
| PCMark 10 / Essentials | |
| Gemiddelde van klas Office (3245 - 11594, n=64, laatste 2 jaar) | |
| HP Pavilion 15-eg | |
| Asus VivoBook S15 D533UA | |
| Lenovo IdeaPad 5 15ALC05 | |
| Lenovo IdeaPad 5 Pro 16IHU6 | |
| Gemiddeld Intel Core i5-11300H, NVIDIA GeForce MX450 (8366 - 8931, n=3) | |
| Xiaomi RedmiBook Pro 15 | |
| Dell Inspiron 15 5518-2X3JR | |
| PCMark 10 / Productivity | |
| Xiaomi RedmiBook Pro 15 | |
| Gemiddelde van klas Office (5336 - 17243, n=64, laatste 2 jaar) | |
| HP Pavilion 15-eg | |
| Gemiddeld Intel Core i5-11300H, NVIDIA GeForce MX450 (8292 - 9188, n=3) | |
| Lenovo IdeaPad 5 Pro 16IHU6 | |
| Dell Inspiron 15 5518-2X3JR | |
| Asus VivoBook S15 D533UA | |
| Lenovo IdeaPad 5 15ALC05 | |
| PCMark 10 / Digital Content Creation | |
| Gemiddelde van klas Office (2049 - 13541, n=64, laatste 2 jaar) | |
| Xiaomi RedmiBook Pro 15 | |
| HP Pavilion 15-eg | |
| Asus VivoBook S15 D533UA | |
| Lenovo IdeaPad 5 Pro 16IHU6 | |
| Lenovo IdeaPad 5 15ALC05 | |
| Gemiddeld Intel Core i5-11300H, NVIDIA GeForce MX450 (4600 - 5388, n=3) | |
| Dell Inspiron 15 5518-2X3JR | |
DPC latenties
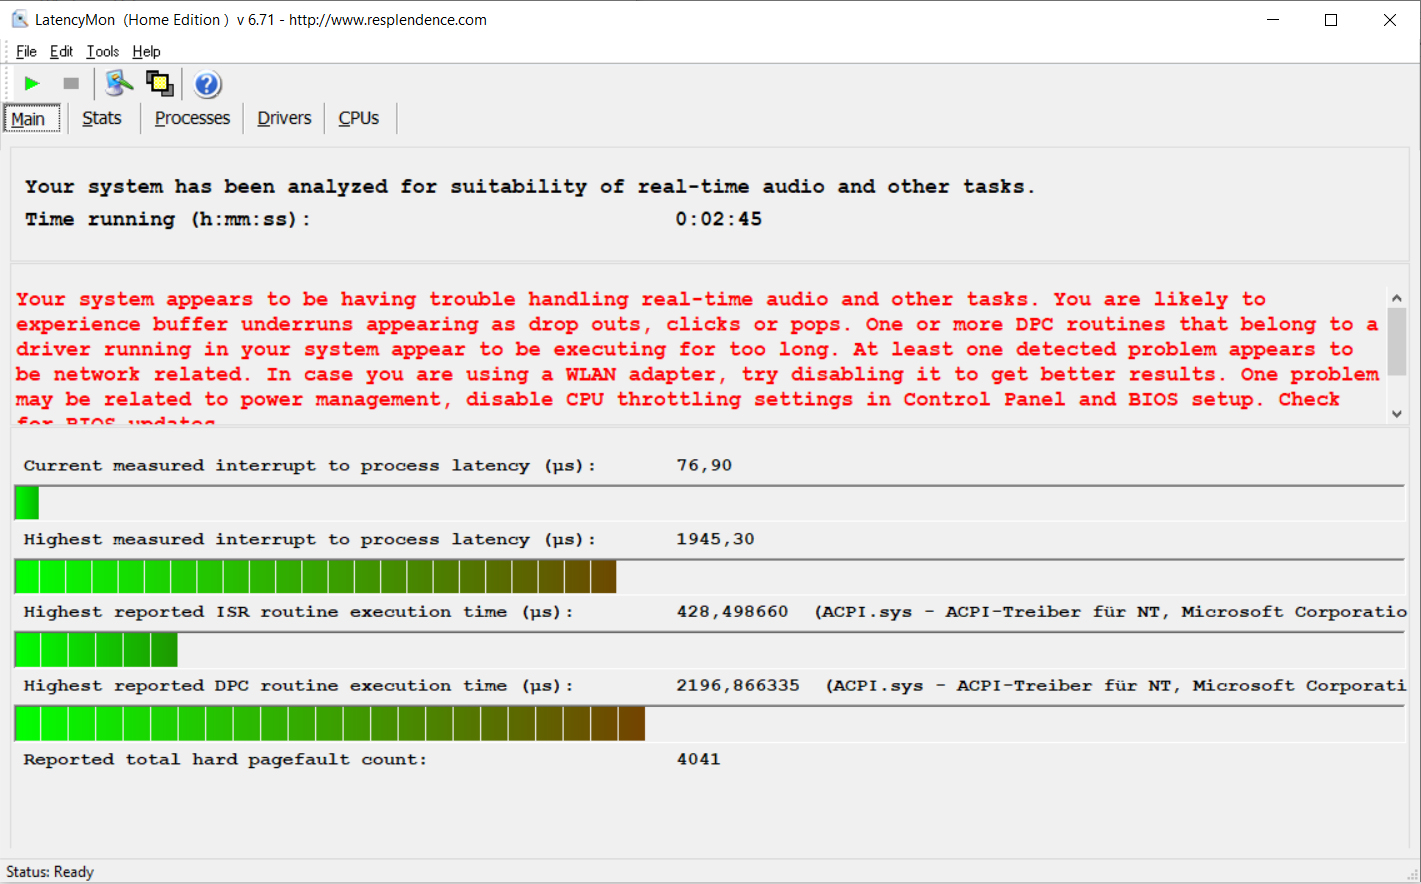
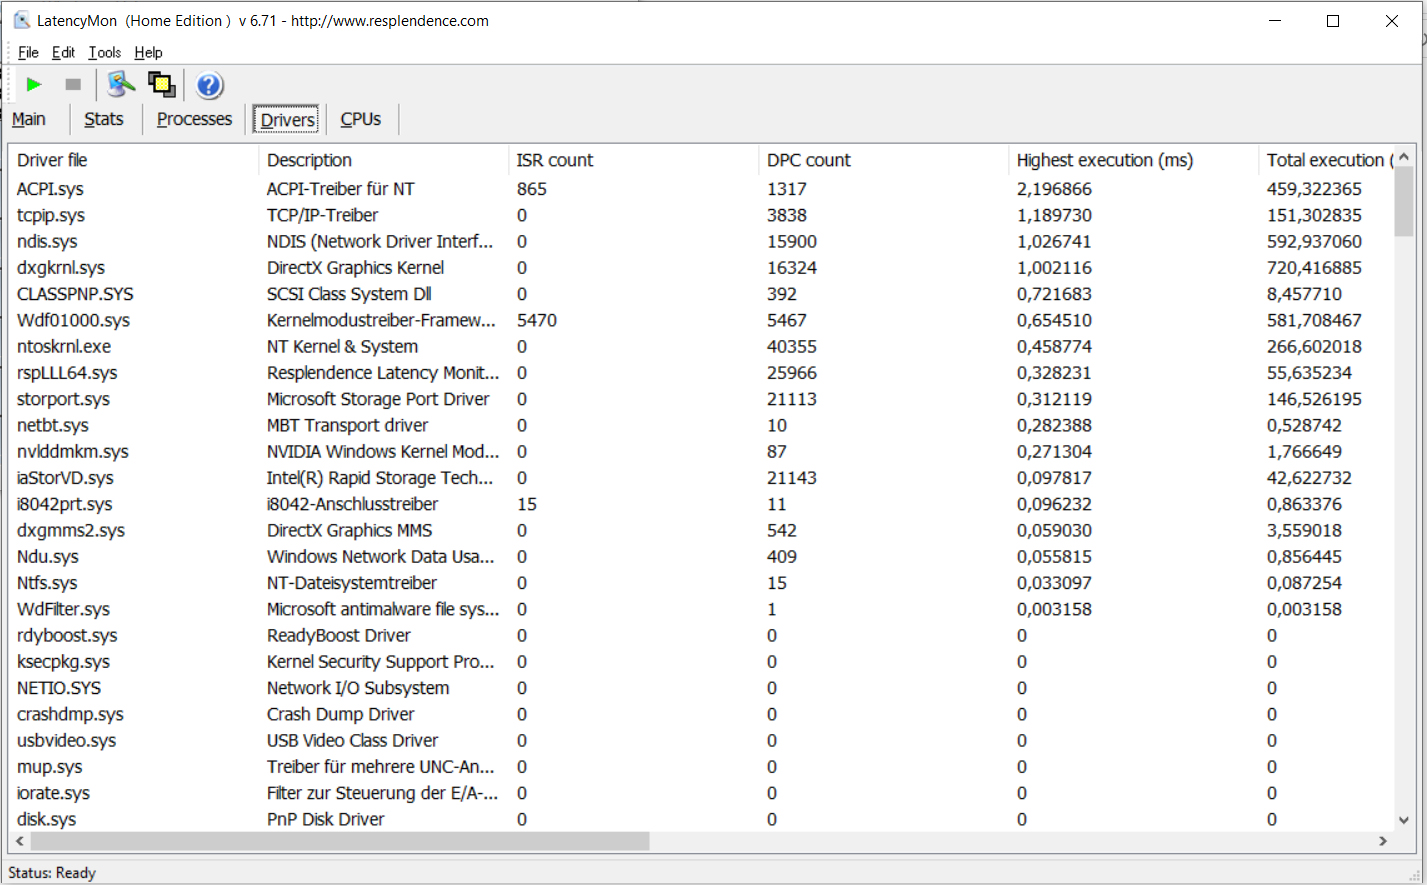
| DPC Latencies / LatencyMon - interrupt to process latency (max), Web, Youtube, Prime95 | |
| Xiaomi RedmiBook Pro 15 | |
| HP Pavilion 15-eg | |
| Dell Inspiron 15 5518-2X3JR | |
| Lenovo IdeaPad 5 15ALC05 | |
| Lenovo IdeaPad 5 Pro 16IHU6 | |
| Asus VivoBook S15 D533UA | |
* ... kleiner is beter
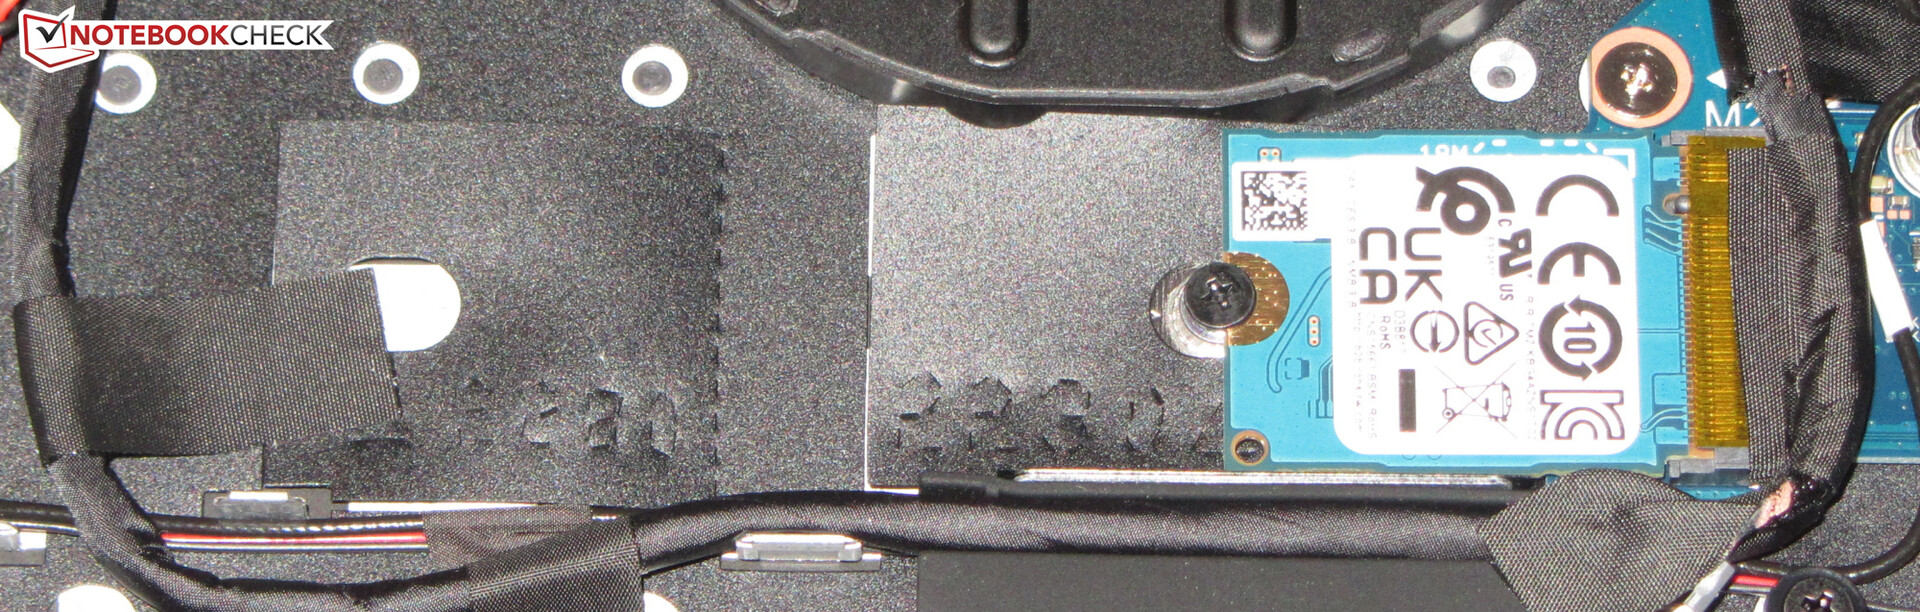
Massa-opslag
De overdrachtssnelheden van de512GB NVMe SSD (M.2-2230) zijn goed, maar het is niet een van de top SSD's. Het gebruik van een SSD in 2280-formaat vereist dat de montagebeugel wordt verplaatst. De se tweede M.2 slot is alleen geschikt voor modellen in het 2230 formaat.

| Dell Inspiron 15 5518-2X3JR Toshiba KBG40ZNS512G NVMe | HP Pavilion 15-eg Samsung PM991 MZVLQ1T0HALB | Xiaomi RedmiBook Pro 15 Toshiba KBG40ZNV512G | Lenovo IdeaPad 5 Pro 16IHU6 Samsung SSD PM981a MZVLB512HBJQ | Asus VivoBook S15 D533UA WDC PC SN530 SDBPNPZ-1T00 | Lenovo IdeaPad 5 15ALC05 | Gemiddeld Toshiba KBG40ZNS512G NVMe | Gemiddelde van klas Office | |
|---|---|---|---|---|---|---|---|---|
| CrystalDiskMark 5.2 / 6 | -16% | -12% | 27% | -5% | -21% | -23% | 53% | |
| Write 4K (MB/s) | 207.3 | 141.6 -32% | 136 -34% | 203 -2% | 116.8 -44% | 82.7 -60% | 126.4 ? -39% | 151.4 ? -27% |
| Read 4K (MB/s) | 61.3 | 42.61 -30% | 60.4 -1% | 52.3 -15% | 43.92 -28% | 39.96 -35% | 50 ? -18% | 72.8 ? 19% |
| Write Seq (MB/s) | 1499 | 1337 -11% | 1447 -3% | 2138 43% | 1990 33% | 1273 -15% | 1207 ? -19% | 2558 ? 71% |
| Read Seq (MB/s) | 1858 | 1575 -15% | 1507 -19% | 1974 6% | 1959 5% | 1601 -14% | 1567 ? -16% | 3237 ? 74% |
| Write 4K Q32T1 (MB/s) | 510 | 397.8 -22% | 235.6 -54% | 640 25% | 373.3 -27% | 360.4 -29% | 347 ? -32% | 424 ? -17% |
| Read 4K Q32T1 (MB/s) | 640 | 454.2 -29% | 737 15% | 707 10% | 524 -18% | 410.4 -36% | 425 ? -34% | 509 ? -20% |
| Write Seq Q32T1 (MB/s) | 1521 | 1648 8% | 1529 1% | 2973 95% | 1985 31% | 1589 4% | 1224 ? -20% | 3999 ? 163% |
| Read Seq Q32T1 (MB/s) | 2316 | 2388 3% | 2357 2% | 3559 54% | 2456 6% | 2652 15% | 2278 ? -2% | 5962 ? 157% |
| AS SSD | 35% | -7% | 86% | 43% | 30% | -10% | 83% | |
| Seq Read (MB/s) | 2086 | 2030 -3% | 1972 -5% | 2541 22% | 2082 0% | 2549 22% | 1871 ? -10% | 4254 ? 104% |
| Seq Write (MB/s) | 1124 | 1003 -11% | 981 -13% | 2555 127% | 1844 64% | 1571 40% | 810 ? -28% | 2704 ? 141% |
| 4K Read (MB/s) | 54.1 | 46.74 -14% | 55.8 3% | 56 4% | 44.33 -18% | 41.92 -23% | 45.8 ? -15% | 57.1 ? 6% |
| 4K Write (MB/s) | 138.1 | 164.2 19% | 133.5 -3% | 129.6 -6% | 157.5 14% | 110.3 -20% | 110.9 ? -20% | 162.4 ? 18% |
| 4K-64 Read (MB/s) | 1295 | 1098 -15% | 1277 -1% | 1633 26% | 1039 -20% | 1086 -16% | 997 ? -23% | 919 ? -29% |
| 4K-64 Write (MB/s) | 750 | 891 19% | 313.9 -58% | 1863 148% | 1556 107% | 1083 44% | 452 ? -40% | 1624 ? 117% |
| Access Time Read * (ms) | 0.141 | 0.053 62% | 0.15 -6% | 0.077 45% | 0.05 65% | 0.119 16% | 0.1024 ? 27% | 0.08503 ? 40% |
| Access Time Write * (ms) | 0.169 | 0.062 63% | 0.513 -204% | 0.029 83% | 0.065 62% | 0.034 80% | 0.4026 ? -138% | 0.05781 ? 66% |
| Score Read (Points) | 1558 | 1348 -13% | 1530 -2% | 1944 25% | 1292 -17% | 1383 -11% | 1232 ? -21% | 1402 ? -10% |
| Score Write (Points) | 1001 | 1155 15% | 546 -45% | 2248 125% | 1898 90% | 1351 35% | 644 ? -36% | 2056 ? 105% |
| Score Total (Points) | 3316 | 3149 -5% | 2819 -15% | 5192 57% | 3845 16% | 3398 2% | 2461 ? -26% | 4110 ? 24% |
| Copy ISO MB/s (MB/s) | 678 | 1583 133% | 1105 63% | 2246 231% | 1441 113% | 1286 90% | 1785 ? 163% | 2515 ? 271% |
| Copy Program MB/s (MB/s) | 364.8 | 682 87% | 799 119% | 861 136% | 484.9 33% | 574 57% | 388 ? 6% | 788 ? 116% |
| Copy Game MB/s (MB/s) | 557 | 1428 156% | 957 72% | 1552 179% | 1098 97% | 1133 103% | 715 ? 28% | 1603 ? 188% |
| Totaal Gemiddelde (Programma / Instellingen) | 10% /
17% | -10% /
-9% | 57% /
64% | 19% /
26% | 5% /
11% | -17% /
-14% | 68% /
72% |
* ... kleiner is beter
Continuous load read: DiskSpd Read Loop, Queue Depth 8
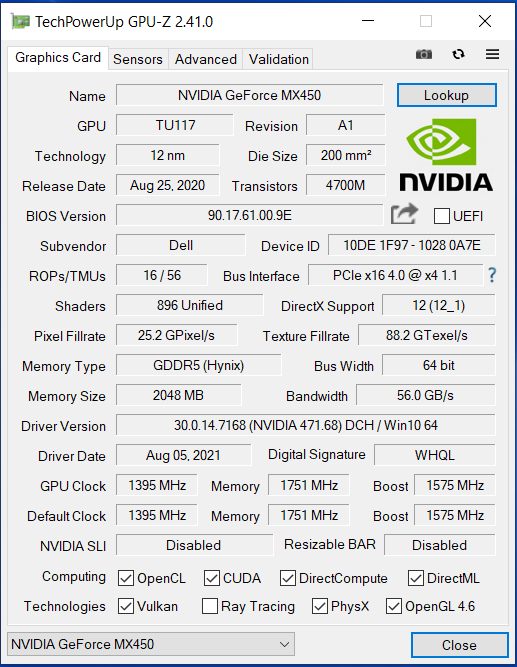
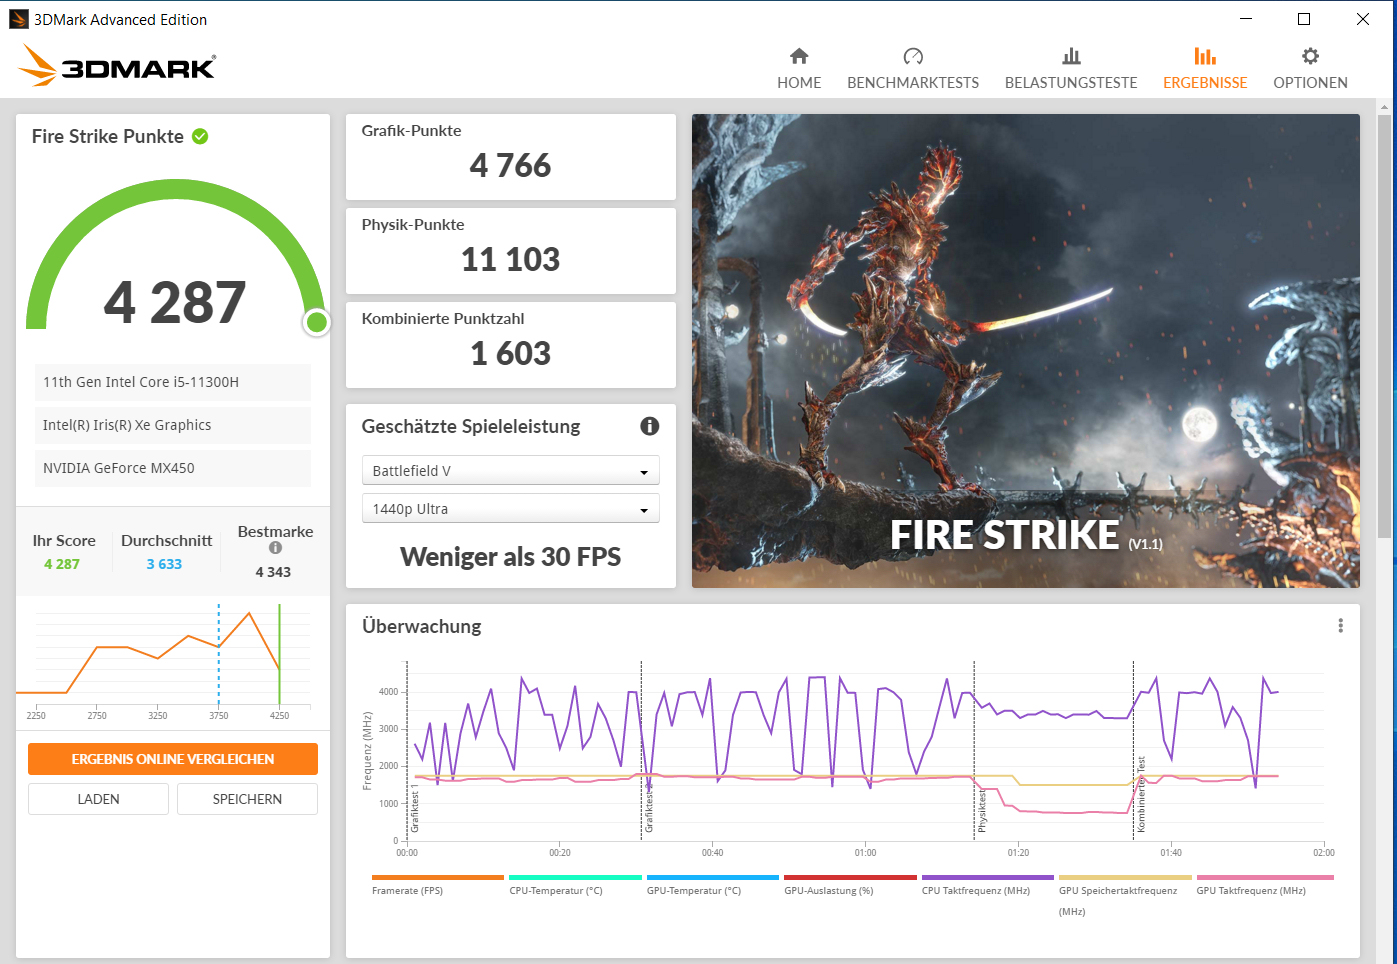
Grafische kaart
DeGeForce-MX450GPU (Turing) is het huidige middenklasse model van Nvidia. Hij wordt ondersteund door snel GDDR5 geheugen (2.048 MB) dat is aangesloten via een 64-bit lijn. De 3DMark resultaten liggen op gelijke hoogte met het MX450 gemiddelde dat we tot nu toe hebben vastgesteld. Het"Ultra Performance" profiel heeft geen invloed op de grafische prestaties

| 3DMark 11 Performance | 7524 punten | |
| 3DMark Ice Storm Standard Score | 55566 punten | |
| 3DMark Cloud Gate Standard Score | 14683 punten | |
| 3DMark Fire Strike Score | 4287 punten | |
| 3DMark Time Spy Score | 2030 punten | |
Help | ||
| 3DMark 11 - 1280x720 Performance GPU | |
| Lenovo IdeaPad 5 Pro 16IHU6 | |
| Dell Inspiron 15 5518-2X3JR (Ultra-Leistung) | |
| Dell Inspiron 15 5518-2X3JR | |
| Gemiddelde van klas Office (2551 - 18313, n=68, laatste 2 jaar) | |
| HP Pavilion 15-eg | |
| Gemiddeld NVIDIA GeForce MX450 (6341 - 9580, n=16) | |
| Xiaomi RedmiBook Pro 15 | |
| Asus VivoBook S15 D533UA | |
| Lenovo IdeaPad 5 15ALC05 | |
| 3DMark | |
| 1920x1080 Fire Strike Graphics | |
| Gemiddelde van klas Office (736 - 21871, n=73, laatste 2 jaar) | |
| Lenovo IdeaPad 5 Pro 16IHU6 | |
| Gemiddeld NVIDIA GeForce MX450 (4336 - 5753, n=17) | |
| Dell Inspiron 15 5518-2X3JR | |
| HP Pavilion 15-eg | |
| Dell Inspiron 15 5518-2X3JR (Ultra-Leistung) | |
| Xiaomi RedmiBook Pro 15 | |
| Asus VivoBook S15 D533UA | |
| Lenovo IdeaPad 5 15ALC05 | |
| 1280x720 Cloud Gate Standard Graphics | |
| Gemiddelde van klas Office (11640 - 118515, n=37, laatste 2 jaar) | |
| Lenovo IdeaPad 5 Pro 16IHU6 | |
| Gemiddeld NVIDIA GeForce MX450 (25467 - 33806, n=13) | |
| Dell Inspiron 15 5518-2X3JR (Ultra-Leistung) | |
| HP Pavilion 15-eg | |
| Dell Inspiron 15 5518-2X3JR | |
| Xiaomi RedmiBook Pro 15 | |
| Lenovo IdeaPad 5 15ALC05 | |
| 2560x1440 Time Spy Graphics | |
| Lenovo IdeaPad 5 Pro 16IHU6 | |
| Gemiddelde van klas Office (493 - 6679, n=68, laatste 2 jaar) | |
| Dell Inspiron 15 5518-2X3JR (Ultra-Leistung) | |
| HP Pavilion 15-eg | |
| Dell Inspiron 15 5518-2X3JR | |
| Gemiddeld NVIDIA GeForce MX450 (1086 - 2300, n=16) | |
| Lenovo IdeaPad 5 15ALC05 | |
| Asus VivoBook S15 D533UA | |
Gaming prestaties
De meeste games in onze database halen speelbare framerates bij lage resoluties en lage tot gemiddelde kwaliteitsniveaus. Titels met matige hardwarevereisten laten meer toe. Debeeldsnelheden liggen iets onder het MX450-gemiddelde. De Inspiron kande uitstekende snelheden van deLenovo Ideapad 5 Pro 16IHU6niet bijbenen.
| Dota 2 Reborn - 1920x1080 ultra (3/3) best looking | |
| Lenovo IdeaPad 5 Pro 16IHU6 | |
| HP Pavilion 15-eg | |
| MSI Modern 14 B11SB-085 | |
| Gemiddeld NVIDIA GeForce MX450 (34.9 - 104.6, n=20) | |
| Xiaomi RedmiBook Pro 15 | |
| Dell Inspiron 15 5518-2X3JR (Ultra-Leistung) | |
| Dell Inspiron 15 5518-2X3JR | |
| Gemiddelde van klas Office (14.6 - 135, n=75, laatste 2 jaar) | |
| Asus VivoBook S15 D533UA | |
| Lenovo IdeaPad 5 15ALC05 | |
| X-Plane 11.11 - 1920x1080 high (fps_test=3) | |
| HP Pavilion 15-eg | |
| Lenovo IdeaPad 5 Pro 16IHU6 | |
| Xiaomi RedmiBook Pro 15 | |
| MSI Modern 14 B11SB-085 | |
| Gemiddeld NVIDIA GeForce MX450 (35.4 - 71.4, n=20) | |
| Dell Inspiron 15 5518-2X3JR | |
| Dell Inspiron 15 5518-2X3JR (Ultra-Leistung) | |
| Gemiddelde van klas Office (12 - 82.4, n=66, laatste 2 jaar) | |
| Lenovo IdeaPad 5 15ALC05 | |
| Asus VivoBook S15 D533UA | |
| Final Fantasy XV Benchmark - 1280x720 Lite Quality | |
| Lenovo IdeaPad 5 Pro 16IHU6 (1.3) | |
| Gemiddeld NVIDIA GeForce MX450 (27.6 - 72.2, n=16) | |
| Gemiddelde van klas Office (16.5 - 171.2, n=71, laatste 2 jaar) | |
| MSI Modern 14 B11SB-085 (1.3) | |
| Dell Inspiron 15 5518-2X3JR (1.3, Ultra-Leistung) | |
| Xiaomi RedmiBook Pro 15 (1.3) | |
| Dell Inspiron 15 5518-2X3JR (1.3) | |
| HP Pavilion 15-eg (1.3) | |
| Asus VivoBook S15 D533UA (1.3) | |
| GTA V - 1920x1080 High/On (Advanced Graphics Off) AA:2xMSAA + FX AF:8x | |
| Lenovo IdeaPad 5 Pro 16IHU6 | |
| Gemiddeld NVIDIA GeForce MX450 (30.6 - 68.3, n=11) | |
| Dell Inspiron 15 5518-2X3JR (Ultra-Leistung) | |
| Dell Inspiron 15 5518-2X3JR | |
| MSI Modern 14 B11SB-085 | |
| HP Pavilion 15-eg | |
| Gemiddelde van klas Office (11.4 - 163.1, n=67, laatste 2 jaar) | |
| Asus VivoBook S15 D533UA | |
| Strange Brigade - 1280x720 lowest AF:1 | |
| Lenovo IdeaPad 5 Pro 16IHU6 (1.47.22.14 D3D12) | |
| Gemiddelde van klas Office (19.4 - 388, n=51, laatste 2 jaar) | |
| Gemiddeld NVIDIA GeForce MX450 (61.4 - 137.7, n=12) | |
| MSI Modern 14 B11SB-085 (1.47.22.14 D3D12) | |
| Dell Inspiron 15 5518-2X3JR (1.47.22.14 D3D12) | |
| Dell Inspiron 15 5518-2X3JR (1.47.22.14 D3D12, Ultra-Leistung) | |
| Xiaomi RedmiBook Pro 15 (1.47.22.14 D3D12) | |
| Asus VivoBook S15 D533UA (1.47.22.14 D3D12) | |
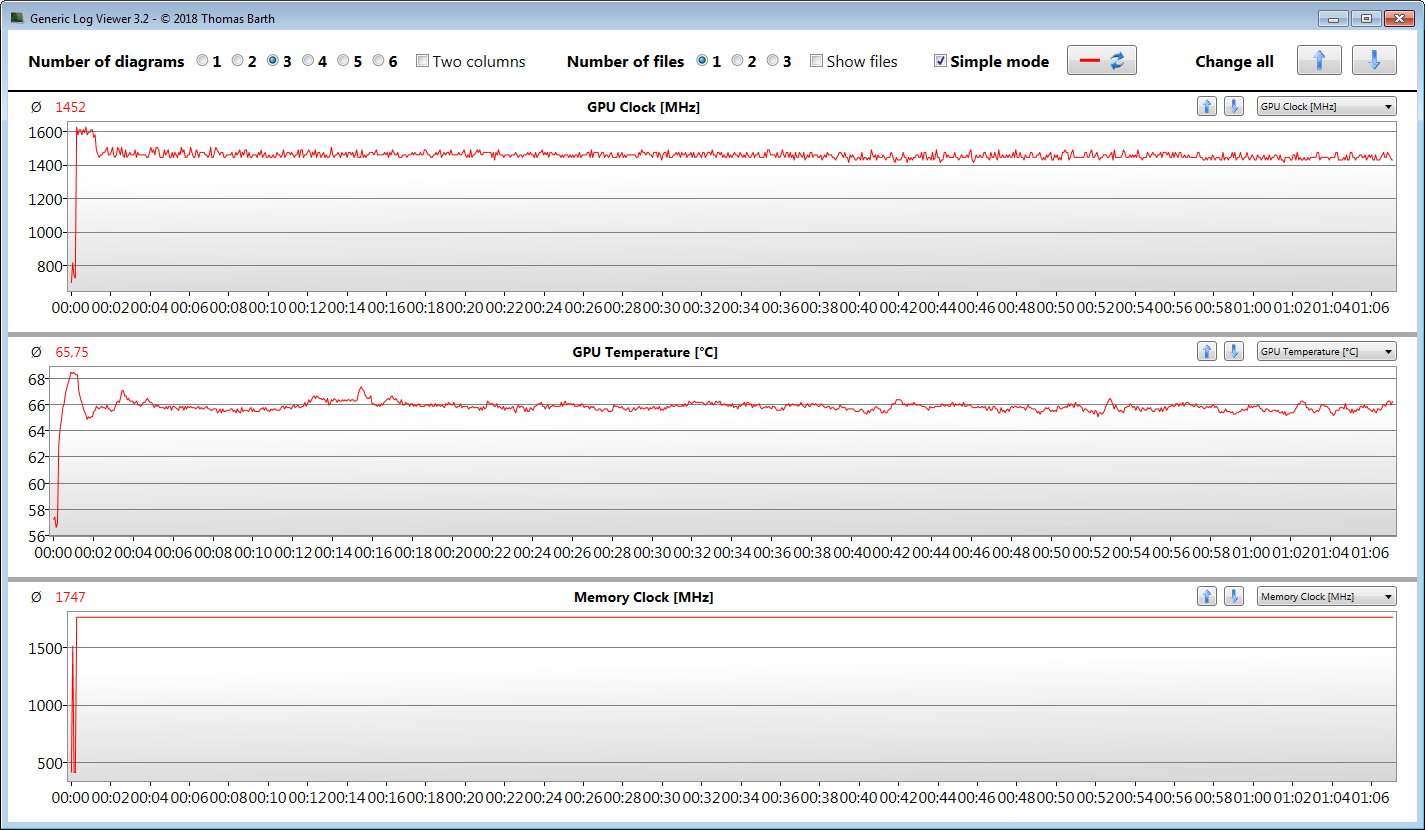
Om te controleren of de framerates over een langere periode grotendeels constant blijven, laten we het spel"The Witcher 3" ongeveer 60 minuten draaien met Full HD resolutie en maximale kwaliteitsinstellingen. Het spelpersonage wordt niet bewogen. De GPU klok wordt iets verlaagd na iets minder dan twee minuten, maar dit heeft geen invloed op de framerates
Witcher 3 FPS-Diagram
| lage | gem. | hoge | ultra | |
|---|---|---|---|---|
| GTA V (2015) | 115 | 95.8 | 51.8 | 23.8 |
| The Witcher 3 (2015) | 99.3 | 57.8 | 30.7 | 17.7 |
| Dota 2 Reborn (2015) | 104 | 90.5 | 80.7 | 75.3 |
| Final Fantasy XV Benchmark (2018) | 54.1 | 25.3 | 13.8 | |
| X-Plane 11.11 (2018) | 68.8 | 53.7 | 47 | |
| Strange Brigade (2018) | 106 | 40.6 | 35.4 | 25 |
| Control (2019) | 74.8 | 24.7 | 15.7 | |
| Flight Simulator 2020 (2020) | 61 | 22.7 | 14.8 | 7.86 |
| Deathloop (2021) | 27.7 | 13.5 | 11 | |
| Alan Wake Remastered (2021) | 25.5 | 16.2 | 13.4 | |
| Back 4 Blood (2021) | 128.3 | 46.9 | 29.4 | 26.7 |
| Riders Republic (2021) | 62 | 28 | 23 | 20 |
| Forza Horizon 5 (2021) | 72 | 28 | 23 | 13 |
| Halo Infinite (2021) | 8.6 | |||
| God of War (2022) | 25.8 | 18.4 | 8.66 | 3.09 |
| Rainbow Six Extraction (2022) | 54 | 28 | 26 | 16 |
| Dying Light 2 (2022) | 22 | 16.7 | 11.8 | |
| GRID Legends (2022) | 67.7 | 45.8 | 39.7 | 24.9 |
| Elden Ring (2022) | 31 | 19 | 17.2 | 15.1 |
| Elex 2 (2022) | 23.1 | 10.7 | 6.62 | |
| Ghostwire Tokyo (2022) | 38.2 | 25.8 | 25.8 | 24.9 |
| Tiny Tina's Wonderlands (2022) | 37.2 | 22.7 | 14 | 10.5 |
| Vampire Bloodhunt (2022) | 96.5 | 59.3 | 50.7 | 33.4 |
| F1 22 (2022) | 54.7 | 49.2 | 36 | 22.2 |
| The Quarry (2022) | 30 | 21.1 | 14.9 | 9.31 |
| FIFA 23 (2022) | 57.4 | 42.1 | 37.8 | 33.9 |
| A Plague Tale Requiem (2022) | 22.6 | 18.3 | 12.4 | 8.51 |
| Uncharted Legacy of Thieves Collection (2022) | 9.73 | 8.41 | 5.83 | 5.51 |
| Call of Duty Modern Warfare 2 2022 (2022) | 37 | 33 | 15 | 17 |
| Spider-Man Miles Morales (2022) | 22.9 | 21 | 17.6 | 11.2 |
| The Callisto Protocol (2022) | 34.2 | 15 | 8 | 7.4 |
| Need for Speed Unbound (2022) | 28.7 | 21.4 | 13.5 | |
| High On Life (2023) | 29.4 | 15.8 | 14 | 12.4 |
| The Witcher 3 v4 (2023) | 45.8 | 32.4 | 24.9 | 14.1 |
| Dead Space Remake (2023) | 17.1 | 15.7 | 6.37 | |
| Baldur's Gate 3 (2023) | 11.3 | 5.94 | ||
| Cyberpunk 2077 (2023) | 22.6 | 14 | 8.12 | 7.09 |
| Counter-Strike 2 (2023) | 87.5 | 67 | 34.8 | 21.7 |
| EA Sports FC 24 (2023) | 58 | 57.3 | 56.4 | 55.9 |
| Assassin's Creed Mirage (2023) | 18 | 15 | ||
| Skull & Bones (2024) | 21 | 21 | 13 | |
| Horizon Forbidden West (2024) | 11.6 | |||
| F1 24 (2024) | 31.9 | 25.7 | 20.4 | 13.4 |
Emissions & energy - Dell laptop with good battery runtimes
Geluidsemissies
Bij dagelijks gebruik (kantoor, internet) produceert de notebook weinig tot geen geluid - de ventilator staat vaak stil. Bij zwaardere belasting wordenhogere geluidsdrukniveaus bereikt dan bij notebooks met een vergelijkbare uitrusting, zoals deRedmiBook Pro 15 en deIdeapad 5 Pro 16IHU6. Een lager geluidsniveau kan worden bereikt door het "Quiet"-profiel te gebruiken - ten koste van de computerprestaties
Geluidsniveau
| Onbelast |
| 26 / 26 / 26 dB (A) |
| Belasting |
| 47.4 / 48.4 dB (A) |
 | ||
30 dB stil 40 dB(A) hoorbaar 50 dB(A) luid |
||
min: | ||
| Dell Inspiron 15 5518-2X3JR Intel Core i5-11300H, NVIDIA GeForce MX450 | HP Pavilion 15-eg Intel Core i7-1165G7, NVIDIA GeForce MX450 | Xiaomi RedmiBook Pro 15 Intel Core i7-11370H, NVIDIA GeForce MX450 | Lenovo IdeaPad 5 Pro 16IHU6 Intel Core i5-11300H, NVIDIA GeForce MX450 | Asus VivoBook S15 D533UA AMD Ryzen 7 5700U, AMD Radeon RX Vega 8 (Ryzen 4000/5000) | Lenovo IdeaPad 5 15ALC05 AMD Ryzen 5 5500U, AMD Radeon RX Vega 7 | |
|---|---|---|---|---|---|---|
| Noise | 7% | 4% | 8% | 0% | 6% | |
| uit / omgeving * (dB) | 26 | 25.4 2% | 25 4% | 25 4% | 26 -0% | 26 -0% |
| Idle Minimum * (dB) | 26 | 25.6 2% | 25 4% | 25 4% | 26 -0% | 26 -0% |
| Idle Average * (dB) | 26 | 25.6 2% | 26 -0% | 25 4% | 26 -0% | 26 -0% |
| Idle Maximum * (dB) | 26 | 25.6 2% | 27 -4% | 25 4% | 28.8 -11% | 26 -0% |
| Load Average * (dB) | 47.4 | 39.2 17% | 43 9% | 44.5 6% | 45 5% | 42.6 10% |
| Load Maximum * (dB) | 48.4 | 41.5 14% | 44 9% | 36.5 25% | 45 7% | 37.4 23% |
| Witcher 3 ultra * (dB) | 39.1 | 42 |
* ... kleiner is beter
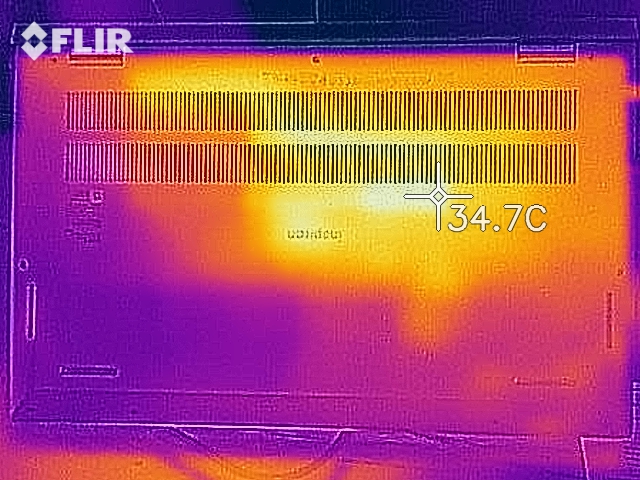
Temperatuur
De kasttemperaturen liggen bij dagelijks gebruik (kantoor, internet) binnen de groene zone.Waarden boven 50 of 60 °C (122 of 140°F) worden bereikt in het gebied van het koellichaam bij volledige hardwarebelasting. De concurrentie warmt meestal minder selectief op,maar in totaal warmen ze meer op.
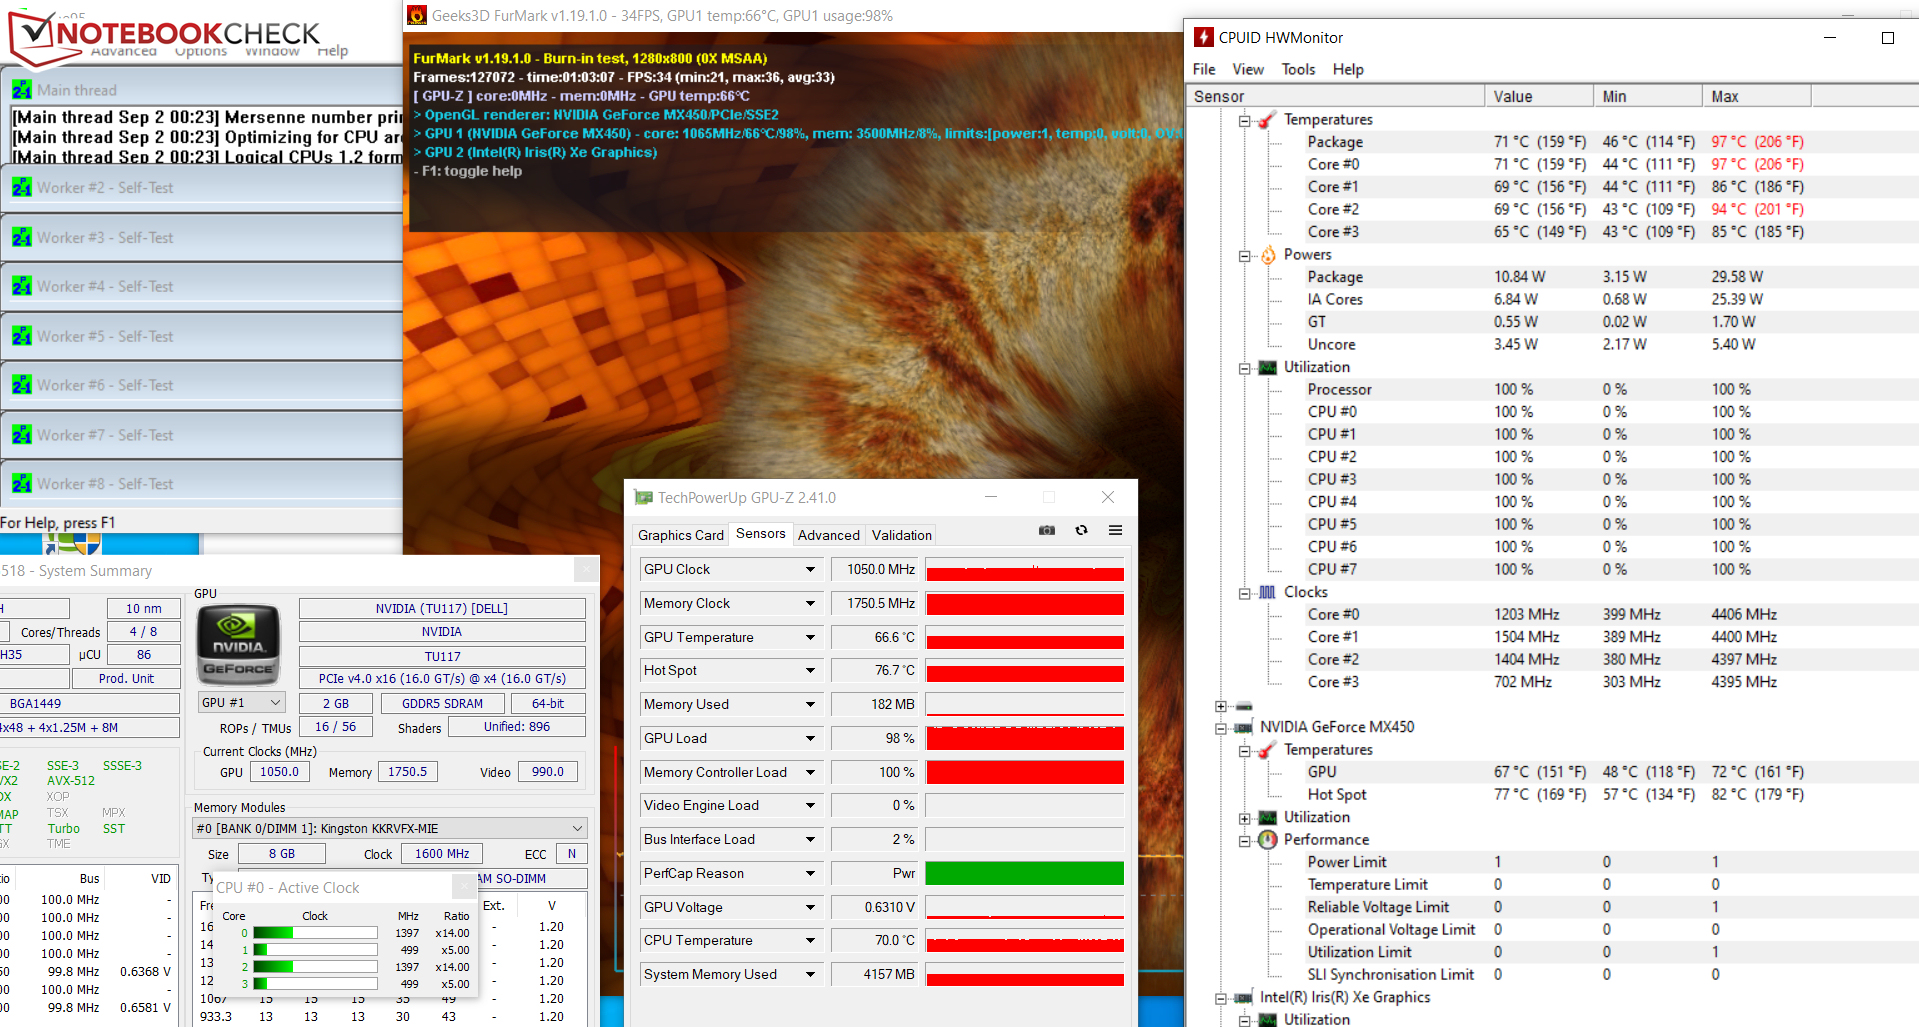
De CPU en GPU beginnen de stresstest (Prime95 en FurMark lopen minstens een uur) met relatief hoge snelheden. Na deze periode dalen de snelheden naar 400 MHz tot 1,4 GHz of ongeveer 1.050 MHz. De stresstest vertegenwoordigt een extreem scenario. We gebruiken deze test om na te gaan of het systeem stabiel draait onder volledige belasting.
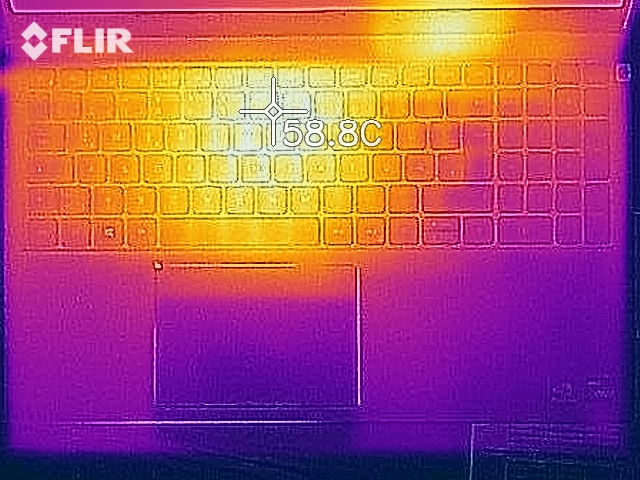
(-) De maximumtemperatuur aan de bovenzijde bedraagt 55.1 °C / 131 F, vergeleken met het gemiddelde van 34.3 °C / 94 F, variërend van 21.2 tot 62.5 °C voor de klasse Office.
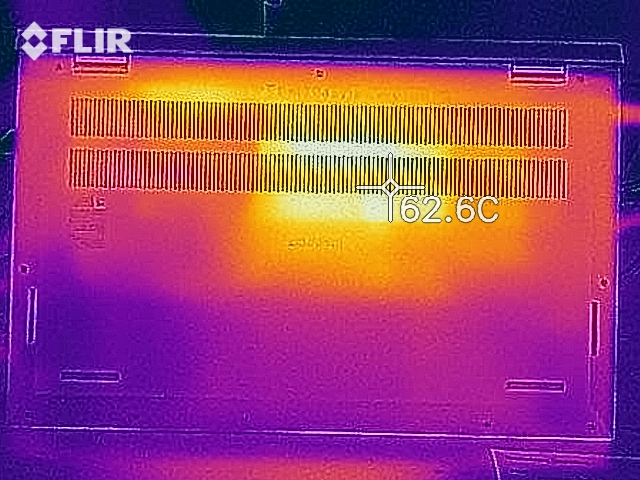
(-) De bodem warmt op tot een maximum van 62.4 °C / 144 F, vergeleken met een gemiddelde van 36.8 °C / 98 F
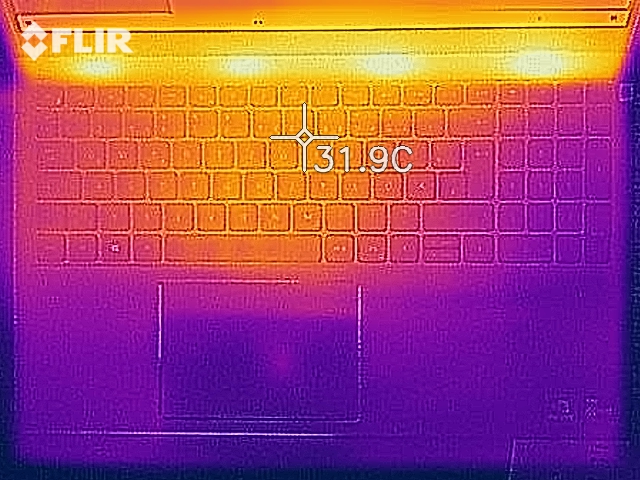
(+) Bij onbelast gebruik bedraagt de gemiddelde temperatuur voor de bovenzijde 26.3 °C / 79 F, vergeleken met het apparaatgemiddelde van 29.5 °C / 85 F.
(+) De palmsteunen en het touchpad zijn met een maximum van ###max## °C / 82.9 F koeler dan de huidtemperatuur en voelen daarom koel aan.
(±) De gemiddelde temperatuur van de handpalmsteun van soortgelijke toestellen bedroeg 27.5 °C / 81.5 F (-0.8 °C / -1.4 F).
| Dell Inspiron 15 5518-2X3JR Intel Core i5-11300H, NVIDIA GeForce MX450 | HP Pavilion 15-eg Intel Core i7-1165G7, NVIDIA GeForce MX450 | Xiaomi RedmiBook Pro 15 Intel Core i7-11370H, NVIDIA GeForce MX450 | Lenovo IdeaPad 5 Pro 16IHU6 Intel Core i5-11300H, NVIDIA GeForce MX450 | Asus VivoBook S15 D533UA AMD Ryzen 7 5700U, AMD Radeon RX Vega 8 (Ryzen 4000/5000) | Lenovo IdeaPad 5 15ALC05 AMD Ryzen 5 5500U, AMD Radeon RX Vega 7 | |
|---|---|---|---|---|---|---|
| Heat | 13% | 6% | 6% | 16% | 20% | |
| Maximum Upper Side * (°C) | 55.1 | 44 20% | 54 2% | 65.3 -19% | 46.1 16% | 40.5 26% |
| Maximum Bottom * (°C) | 62.4 | 53.4 14% | 52 17% | 55.4 11% | 46.6 25% | 42 33% |
| Idle Upper Side * (°C) | 29.8 | 27.4 8% | 33 -11% | 25.4 15% | 27.4 8% | 26.5 11% |
| Idle Bottom * (°C) | 32.5 | 28.8 11% | 28 14% | 26.8 18% | 28.2 13% | 29 11% |
* ... kleiner is beter
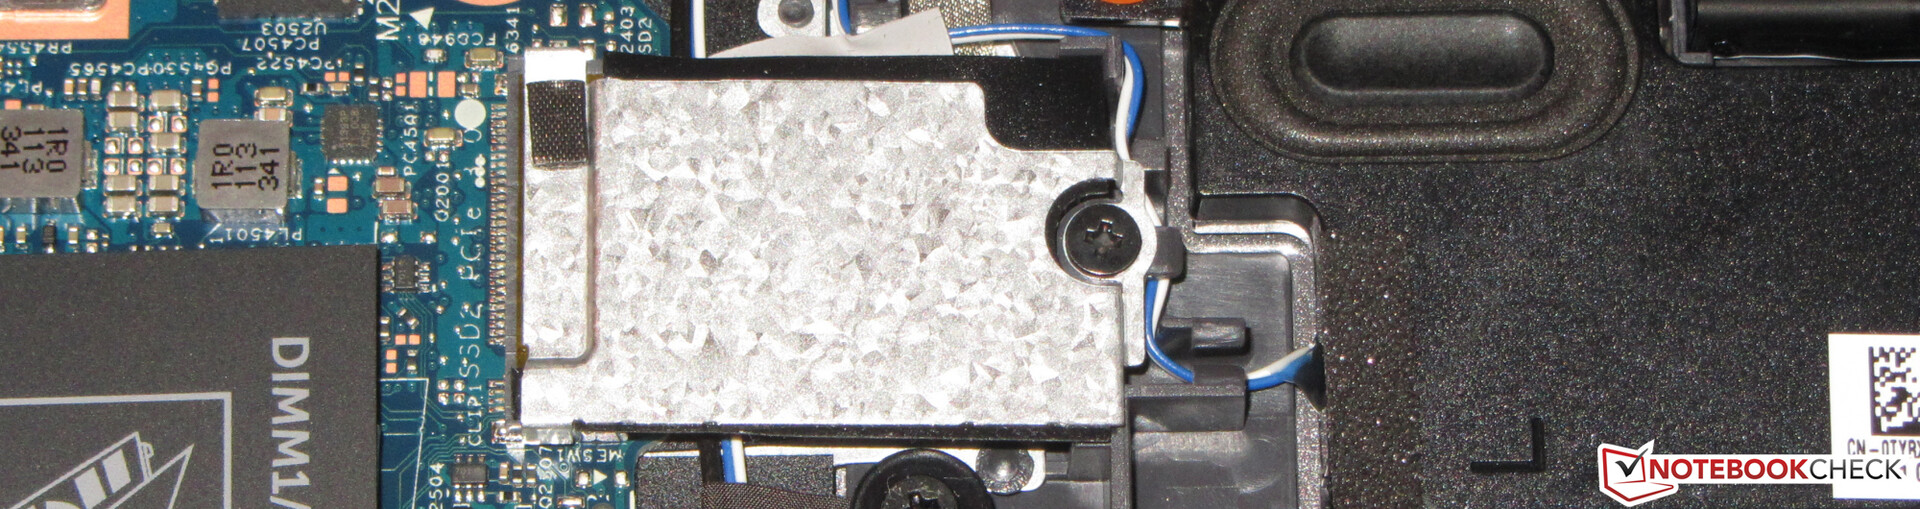
Spreker
De stereoluidsprekers produceren een behoorlijk geluid, dat echter nauwelijks lage tonen heeft.
Dell Inspiron 15 5518-2X3JR audioanalyse
(+) | luidsprekers kunnen relatief luid spelen (88.4 dB)
Bas 100 - 315 Hz
(-) | bijna geen lage tonen - gemiddeld 21.3% lager dan de mediaan
(+) | de lage tonen zijn lineair (5.8% delta naar de vorige frequentie)
Midden 400 - 2000 Hz
(+) | evenwichtige middens - slechts 3.1% verwijderd van de mediaan
(+) | de middentonen zijn lineair (4.2% delta ten opzichte van de vorige frequentie)
Hoog 2 - 16 kHz
(±) | higher highs - on average 5.5% higher than median
(+) | de hoge tonen zijn lineair (6.4% delta naar de vorige frequentie)
Algemeen 100 - 16.000 Hz
(±) | lineariteit van het totale geluid is gemiddeld (17% verschil met de mediaan)
Vergeleken met dezelfde klasse
» 24% van alle geteste apparaten in deze klasse waren beter, 8% vergelijkbaar, 69% slechter
» De beste had een delta van 7%, het gemiddelde was 21%, de slechtste was 53%
Vergeleken met alle geteste toestellen
» 30% van alle geteste apparaten waren beter, 8% gelijk, 62% slechter
» De beste had een delta van 4%, het gemiddelde was 24%, de slechtste was 134%
HP Pavilion 15-eg audioanalyse
(±) | luidspreker luidheid is gemiddeld maar goed (81.3 dB)
Bas 100 - 315 Hz
(-) | bijna geen lage tonen - gemiddeld 18% lager dan de mediaan
(±) | lineariteit van de lage tonen is gemiddeld (12.8% delta ten opzichte van de vorige frequentie)
Midden 400 - 2000 Hz
(+) | evenwichtige middens - slechts 2.8% verwijderd van de mediaan
(+) | de middentonen zijn lineair (4% delta ten opzichte van de vorige frequentie)
Hoog 2 - 16 kHz
(+) | evenwichtige hoogtepunten - slechts 1% verwijderd van de mediaan
(+) | de hoge tonen zijn lineair (3% delta naar de vorige frequentie)
Algemeen 100 - 16.000 Hz
(+) | het totale geluid is lineair (13.2% verschil met de mediaan)
Vergeleken met dezelfde klasse
» 27% van alle geteste apparaten in deze klasse waren beter, 5% vergelijkbaar, 68% slechter
» De beste had een delta van 5%, het gemiddelde was 17%, de slechtste was 45%
Vergeleken met alle geteste toestellen
» 13% van alle geteste apparaten waren beter, 3% gelijk, 84% slechter
» De beste had een delta van 4%, het gemiddelde was 24%, de slechtste was 134%
Stroomverbruik
In rusttoestand en onder lage belasting is het energieverbruik van de Dell computer ongeveer gelijk aan de waarden van deIdeapad 5 Proen deRedmiBook Pro 15. Bij hoge belasting verbruikt hij aanzienlijk minder energie. Aan de ene kant zijn hier de lage vermogenslimieten van de CPU merkbaar, en aan de andere kant levert Dell slechts een 65 watt voeding (Lenovo: 95 watt, Xiaomi: 100 watt). Bijgevolg kan de Inspiron de concurrentie niet bijbenen op het gebied van rekenkracht.
De grafiek van het CPU en GPU stroomverbruik tijdens de stresstest en de Witcher 3 test geeft hun gedrag goed weer: De kloksnelheden dalen in de loop van de tests.
| Uit / Standby | |
| Inactief | |
| Belasting |
|
Key:
min: | |
Power consumption Witcher 3 / Stress test
| Dell Inspiron 15 5518-2X3JR Intel Core i5-11300H, NVIDIA GeForce MX450 | HP Pavilion 15-eg Intel Core i7-1165G7, NVIDIA GeForce MX450 | Xiaomi RedmiBook Pro 15 Intel Core i7-11370H, NVIDIA GeForce MX450 | Lenovo IdeaPad 5 Pro 16IHU6 Intel Core i5-11300H, NVIDIA GeForce MX450 | Asus VivoBook S15 D533UA AMD Ryzen 7 5700U, AMD Radeon RX Vega 8 (Ryzen 4000/5000) | Lenovo IdeaPad 5 15ALC05 AMD Ryzen 5 5500U, AMD Radeon RX Vega 7 | |
|---|---|---|---|---|---|---|
| Power Consumption | -19% | -37% | -30% | -3% | 11% | |
| Idle Minimum * (Watt) | 4 | 4.9 -23% | 6 -50% | 5 -25% | 5 -25% | 3.7 7% |
| Idle Average * (Watt) | 7.6 | 7.9 -4% | 9 -18% | 9 -18% | 7.7 -1% | 7.9 -4% |
| Idle Maximum * (Watt) | 10.2 | 14.2 -39% | 12 -18% | 9.4 8% | 12.2 -20% | 9.3 9% |
| Load Average * (Watt) | 49.4 | 64.3 -30% | 74 -50% | 71 -44% | 41 17% | 41 17% |
| Witcher 3 ultra * (Watt) | 49.4 | 55.6 -13% | 70.7 -43% | 72.4 -47% | 43 13% | 41 17% |
| Load Maximum * (Watt) | 63.4 | 65.4 -3% | 91 -44% | 99 -56% | 65 -3% | 52.2 18% |
* ... kleiner is beter
Levensduur batterij
De Inspiron 5518 haalt een runtime van 9:24 uur in onze praktische WLAN-test. De belasting tijdens het laden van webpagina's wordt in kaart gebracht via een script
Pro
Contra
Verdict - De Inspiron 15 5518 biedt potentieel voor verbetering
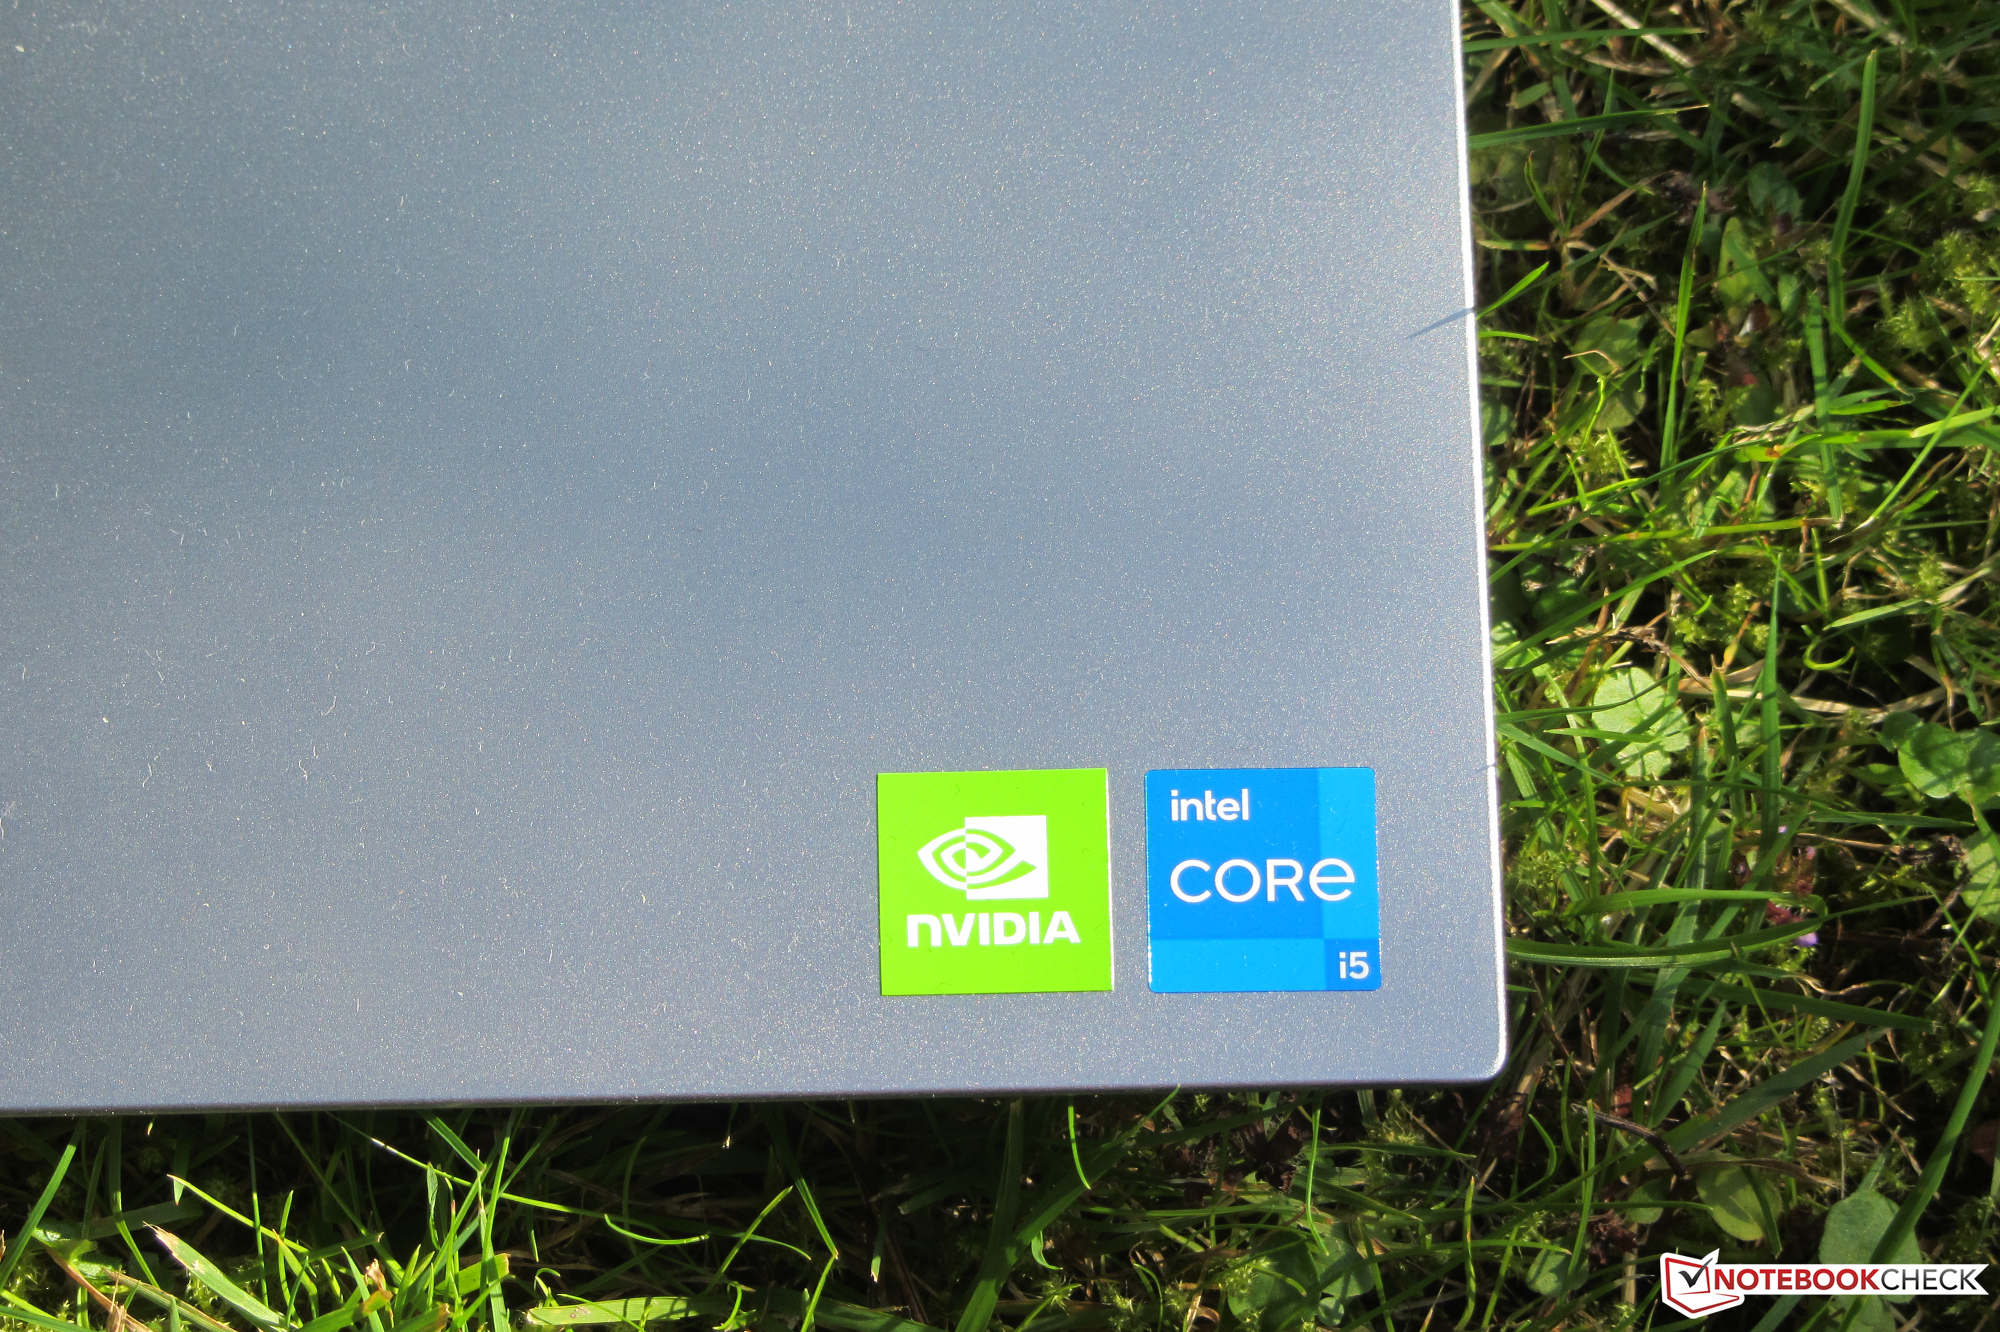
De geïnstalleerde Core i5-11300HCPU levert voldoende prestaties voor kantoor- en internettoepassingen, de GeForce-MX450grafische kern maakt het gebruik van computerspellen of GPU-intensieve toepassingen mogelijk. De hardware is ondergebracht in een chique aluminium behuizing.
Thunderbolt 4 is voorbehouden aan het Core i7-model van de Inspiron.
Met een WLAN-runtime van bijna 9,5 uur moet je de dag doorkomen zonder stroomadapter. De stroom kan worden opgeladen via de meegeleverde eigen Dell stroomadapter of via een USB-C stroomadapter - de USB-C poort van de 5518 werkt volgens de USB 3.2 Gen 2x2 standaard.
De laptop produceert niet veel geluid bij dagelijks gebruik (kantoor, internet), en de warmteontwikkeling is op een acceptabel niveau. Het matte scherm (FHD, IPS) biedt stabiele kijkhoeken, een goed contrast en een fatsoenlijke kleurweergave. De helderheid en kleurruimte dekking zijn te laag.
De processor schiet tekort door de lage vermogenslimieten. Het werkgeheugen (1x 8 GB, DDR4-3200) dat in single-channel modus draait, kost verdere prestaties. Dit zou kunnen worden verbeterd door een tweede geheugenmodule te installeren. De aluminium behuizing mist stijfheid.
Een alternatief voor de Inspiron in het 800 Euro (~$939) segment zou de Lenovo IdeaPad 5 15ALC05 zijn. Hij scoort met veel multi-thread CPU prestaties, een helder scherm, lage emissies en een uitstekende batterijruntime. De zwakke punten: Het werkgeheugen is gesoldeerd en het scherm levert een laag contrast.
Prijs en beschikbaarheid
Dell's Inspiron 15 5518 (Core i5-11300H, GeForce MX450, 8 GB RAM, 512 GB SSD) is momenteel verkrijgbaar bij Cyberport.de voor een prijs van net geen 800 Euro (~$939)
Dell Inspiron 15 5518-2X3JR
- 14-09-2021 v7 (old)
Sascha Mölck
Price comparison
