Kort testrapport Dell Inspiron 17-7786 (i7-8565U, 16 GB, 17-inch touchscherm, MX 150) Convertible
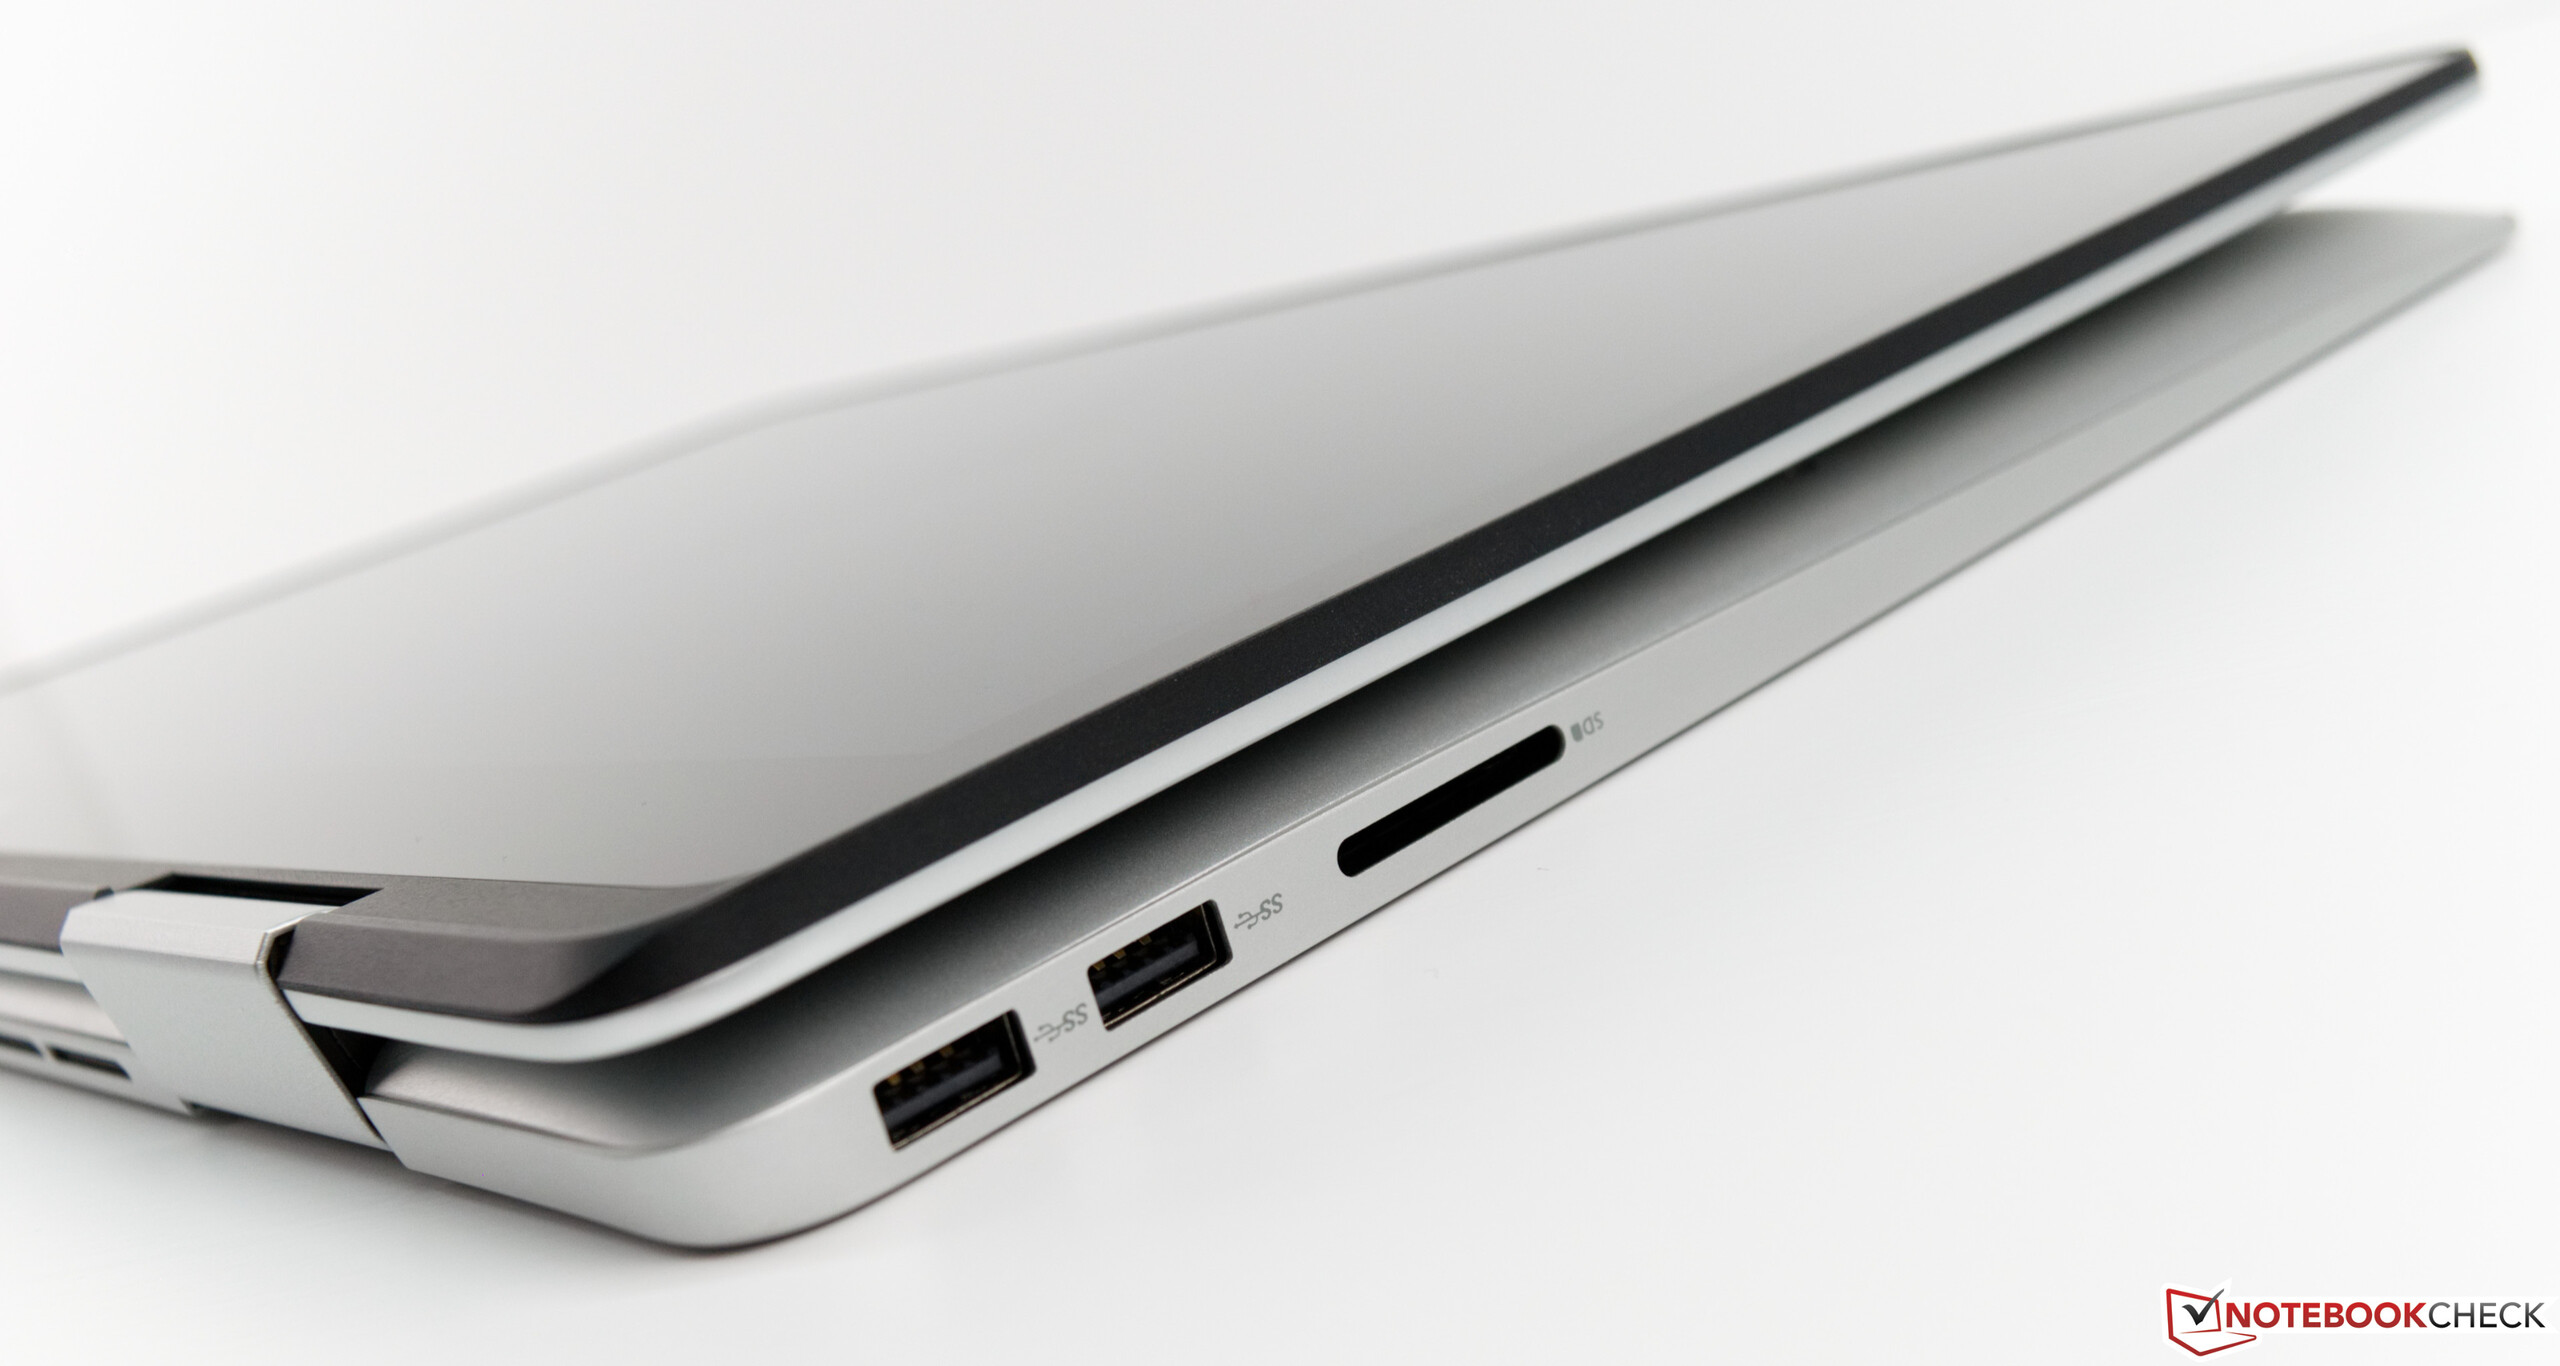
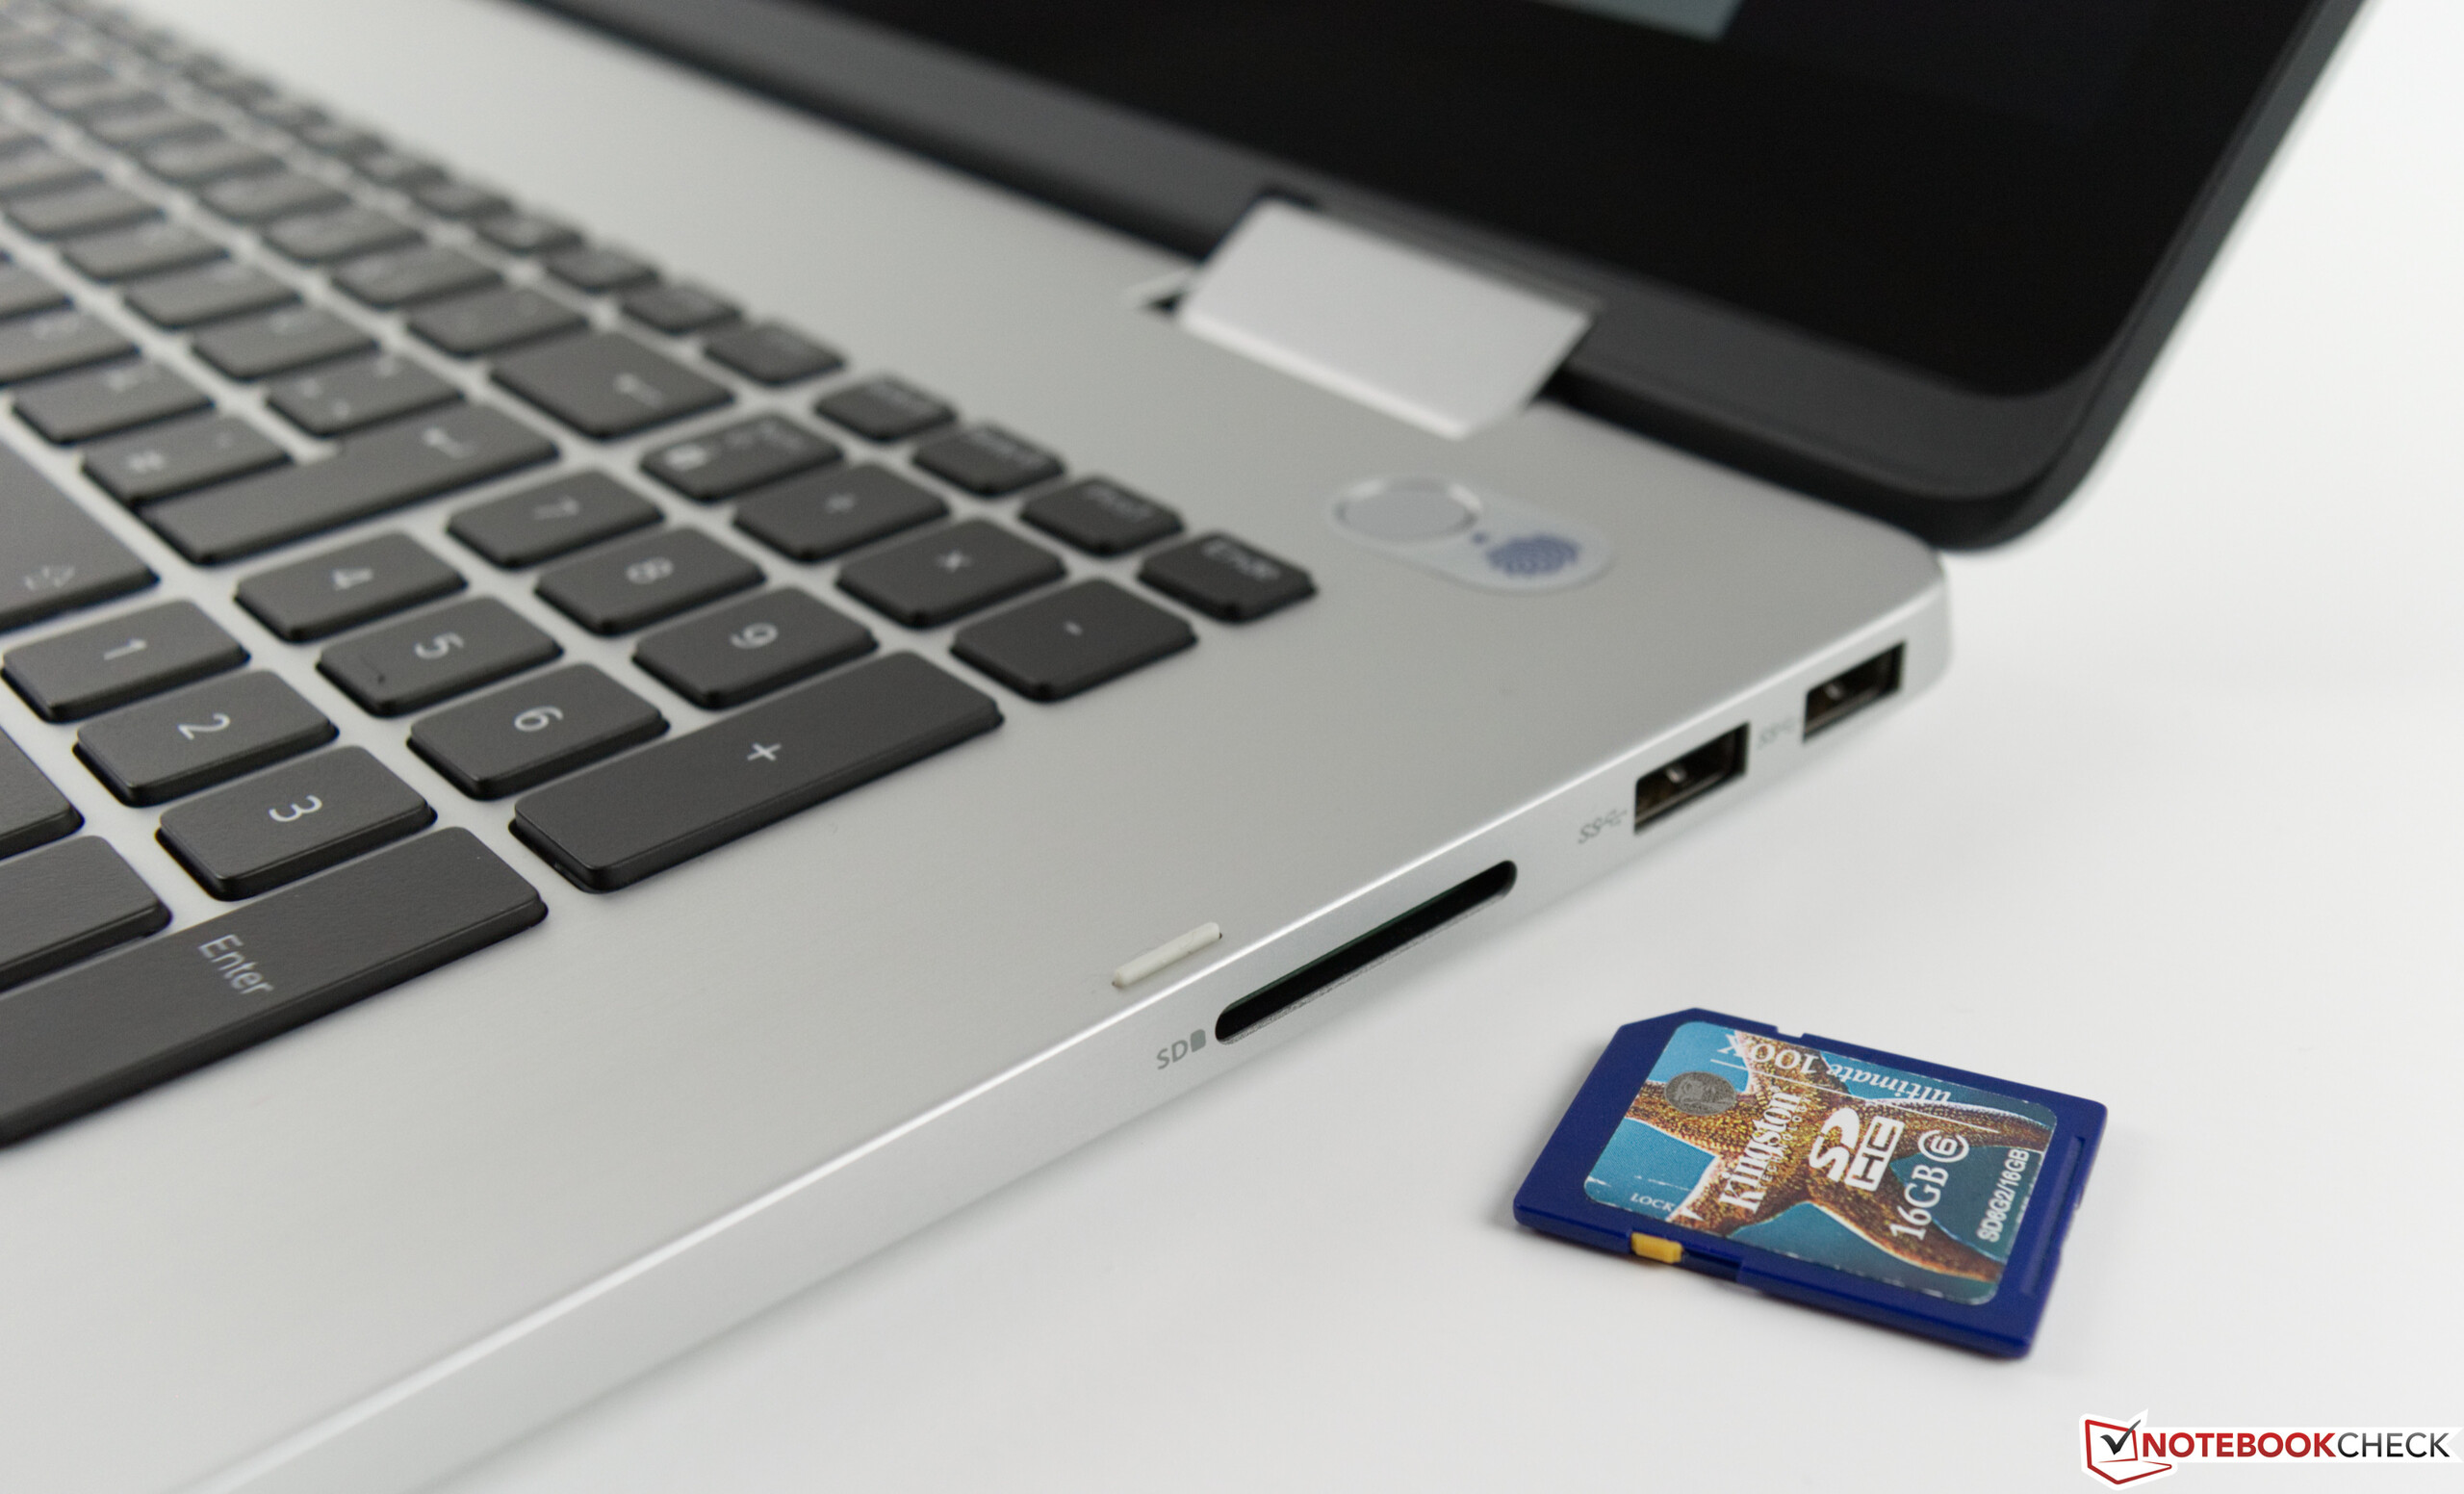
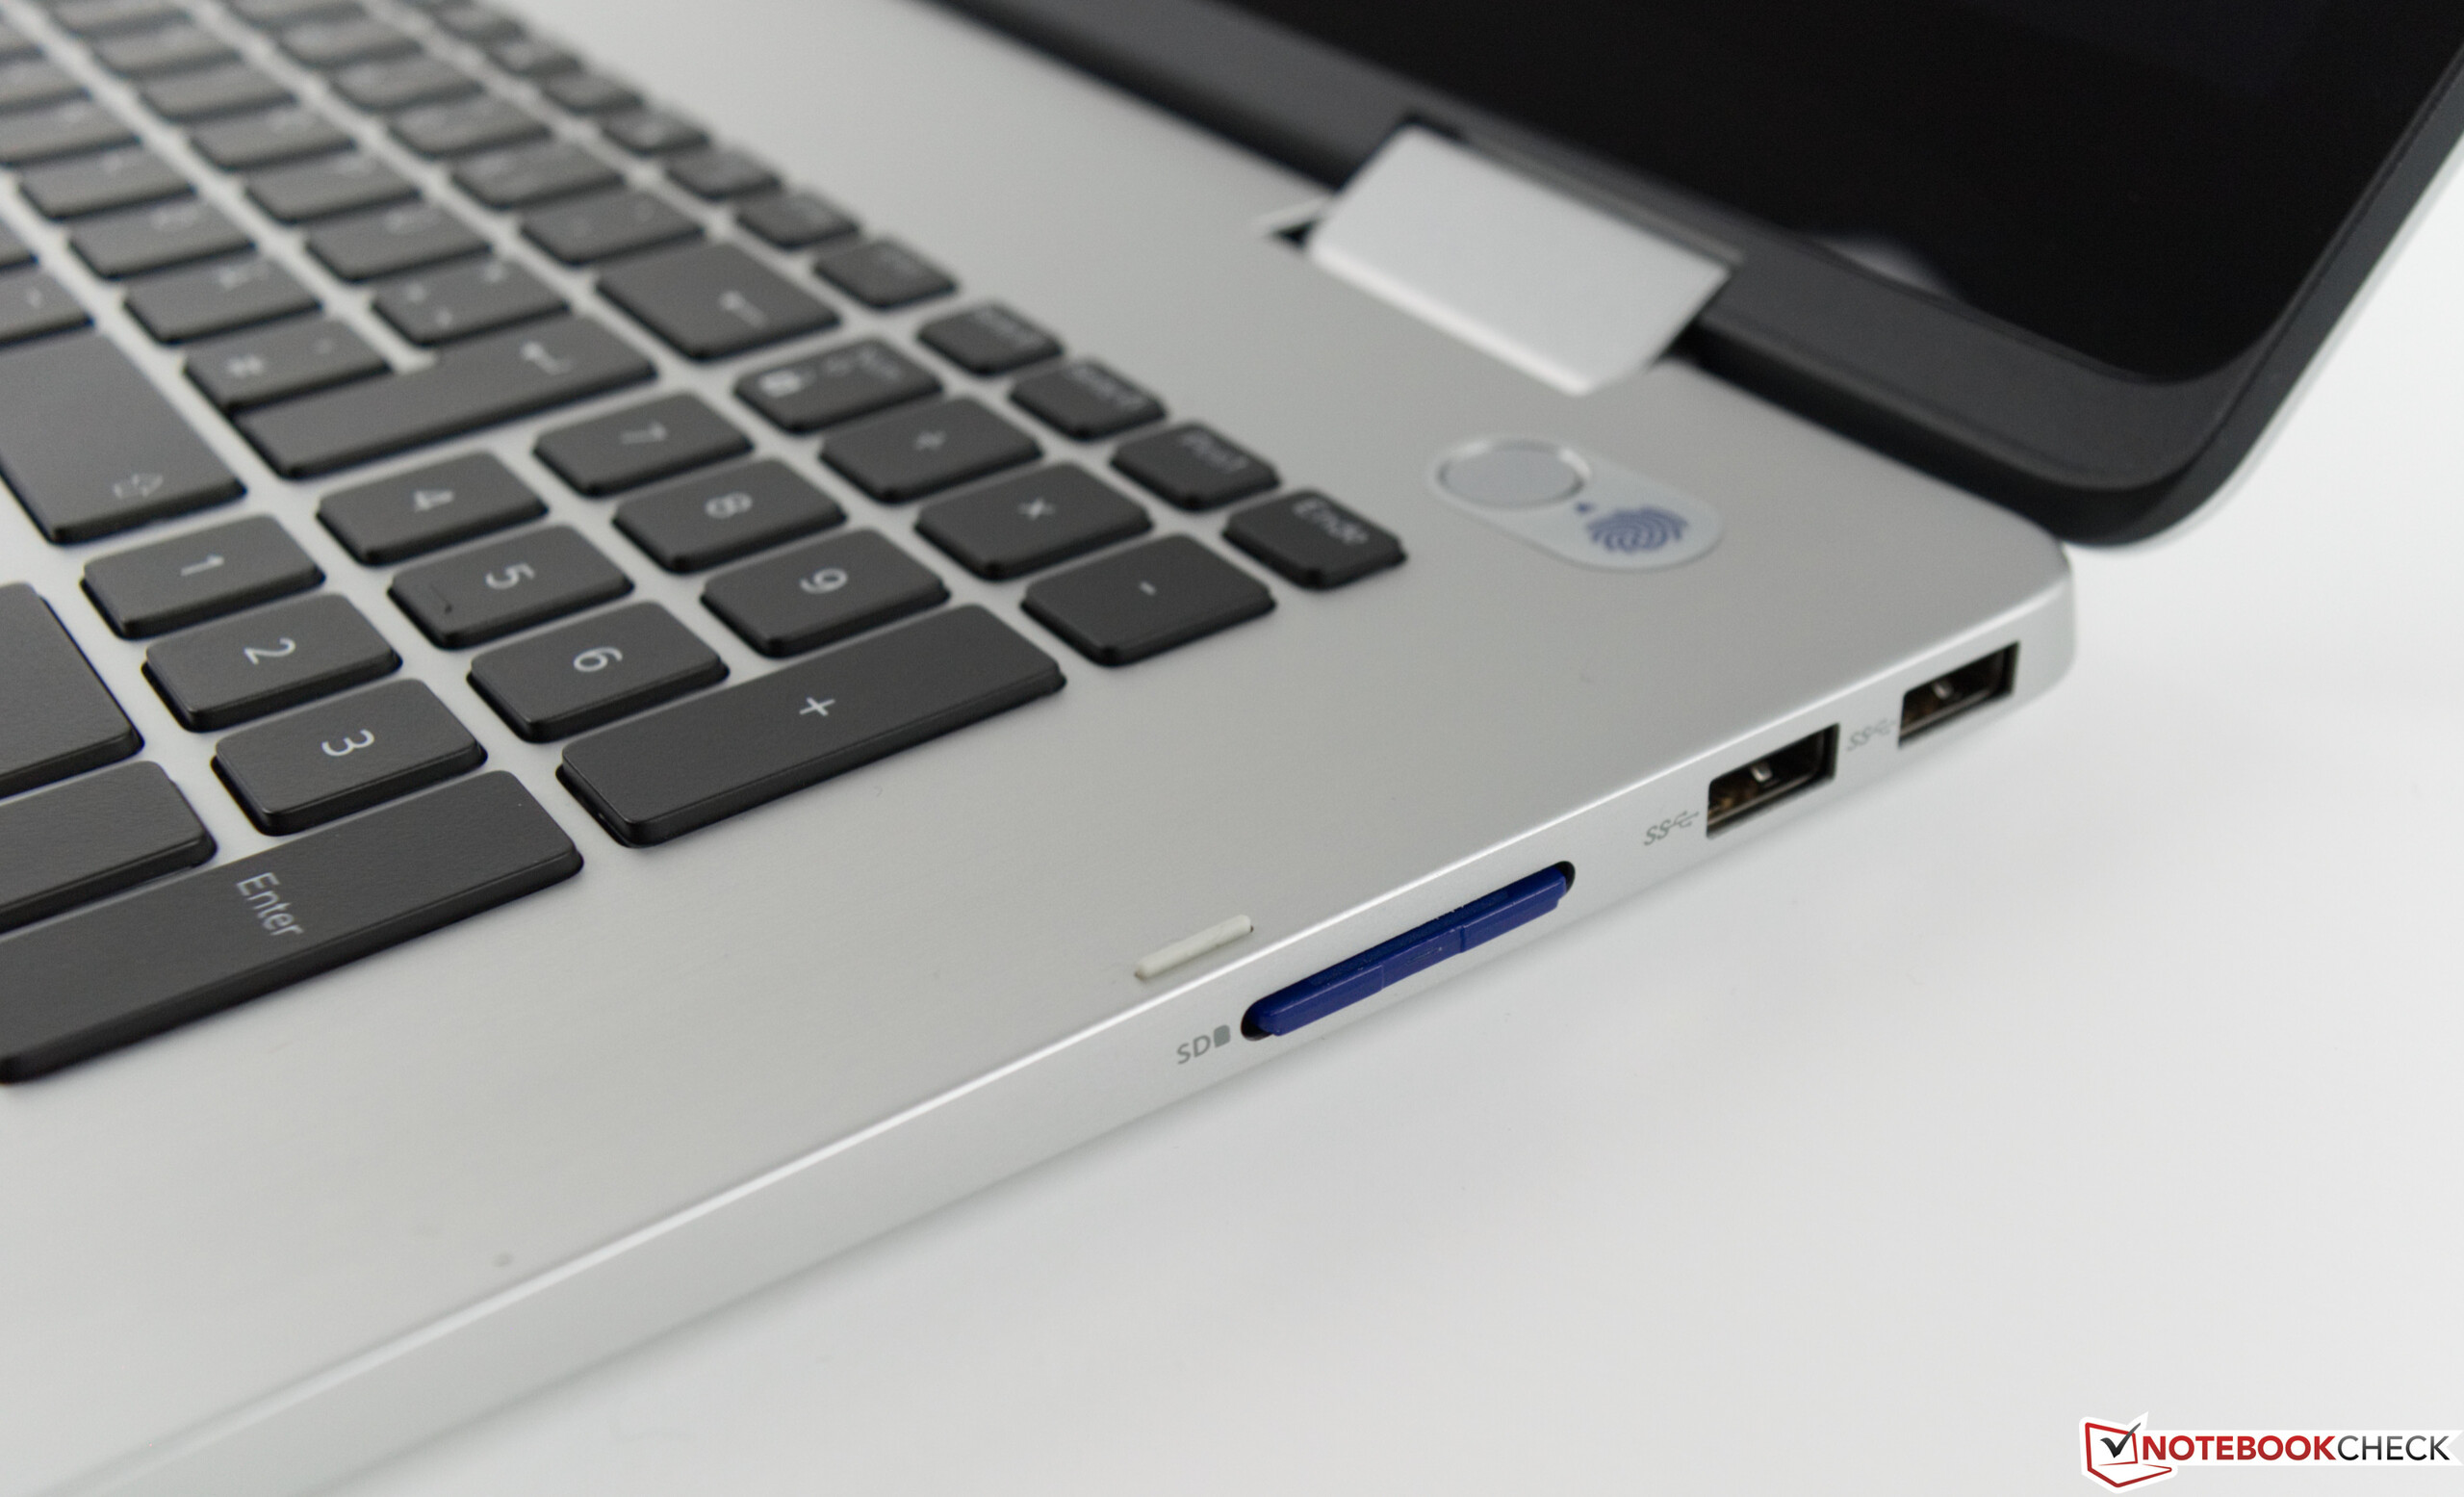
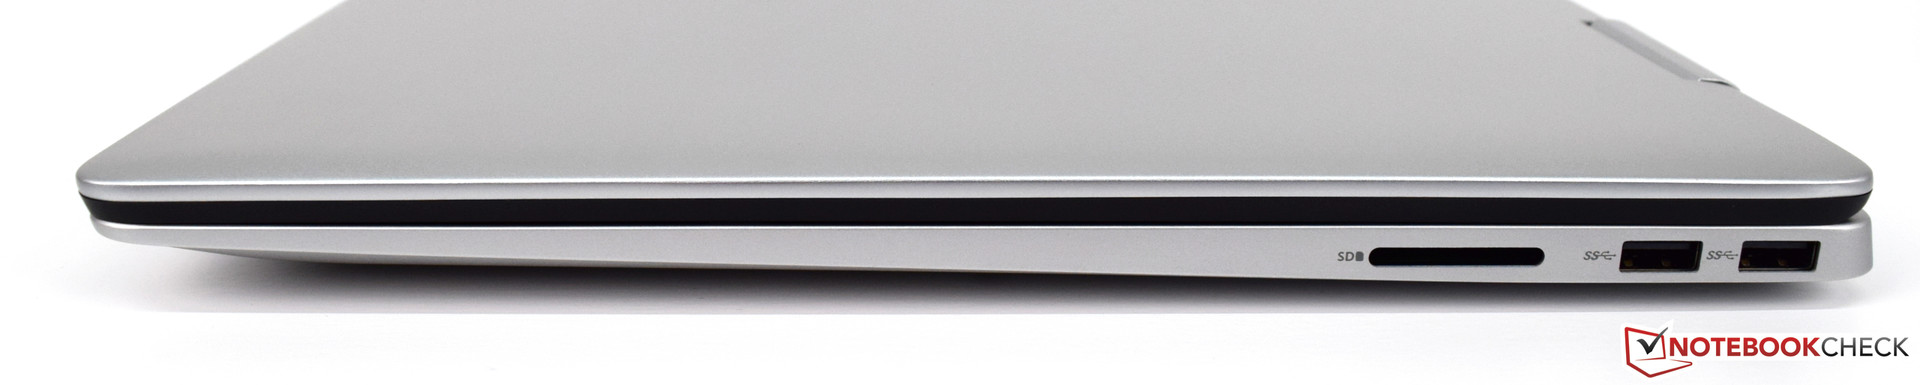
| SD Card Reader | |
| average JPG Copy Test (av. of 3 runs) | |
| Gemiddelde van klas Multimedia (23 - 531, n=43, laatste 2 jaar) | |
| Acer Aspire 5 A517-51G-80L (Toshiba Exceria Pro SDXC 64 GB UHS-II) | |
| HP Envy 17-ae143ng (Toshiba Exceria Pro SDXC 64 GB UHS-II) | |
| Asus VivoBook Pro 17 N705UD-EH76 (Toshiba Exceria Pro SDXC 64 GB UHS-II) | |
| Dell Inspiron 17-7773-0043 (Toshiba Exceria Pro SDXC 64 GB UHS-II) | |
| Dell Inspiron 17-7786 (Toshiba Exceria Pro SDXC 64 GB UHS-II) | |
| Dell Inspiron 17 7778 | |
| maximum AS SSD Seq Read Test (1GB) | |
| Gemiddelde van klas Multimedia (27.9 - 1455, n=42, laatste 2 jaar) | |
| Acer Aspire 5 A517-51G-80L (Toshiba Exceria Pro SDXC 64 GB UHS-II) | |
| HP Envy 17-ae143ng (Toshiba Exceria Pro SDXC 64 GB UHS-II) | |
| Asus VivoBook Pro 17 N705UD-EH76 (Toshiba Exceria Pro SDXC 64 GB UHS-II) | |
| Dell Inspiron 17-7786 (Toshiba Exceria Pro SDXC 64 GB UHS-II) | |
| Dell Inspiron 17-7773-0043 (Toshiba Exceria Pro SDXC 64 GB UHS-II) | |
| Dell Inspiron 17 7778 | |
| Networking | |
| iperf3 transmit AX12 | |
| HP Envy 17-ae143ng | |
| Dell Inspiron 17-7786 | |
| Asus VivoBook Pro 17 N705UD-EH76 | |
| Dell Inspiron 17-7773-0043 | |
| Acer Aspire 5 A517-51G-80L | |
| iperf3 receive AX12 | |
| Asus VivoBook Pro 17 N705UD-EH76 | |
| Dell Inspiron 17-7786 | |
| HP Envy 17-ae143ng | |
| Acer Aspire 5 A517-51G-80L | |
| Dell Inspiron 17-7773-0043 | |
| |||||||||||||||||||||||||
Helderheidsverdeling: 82 %
Helderheid in Batterij-modus: 320 cd/m²
Contrast: 927:1 (Zwart: 0.37 cd/m²)
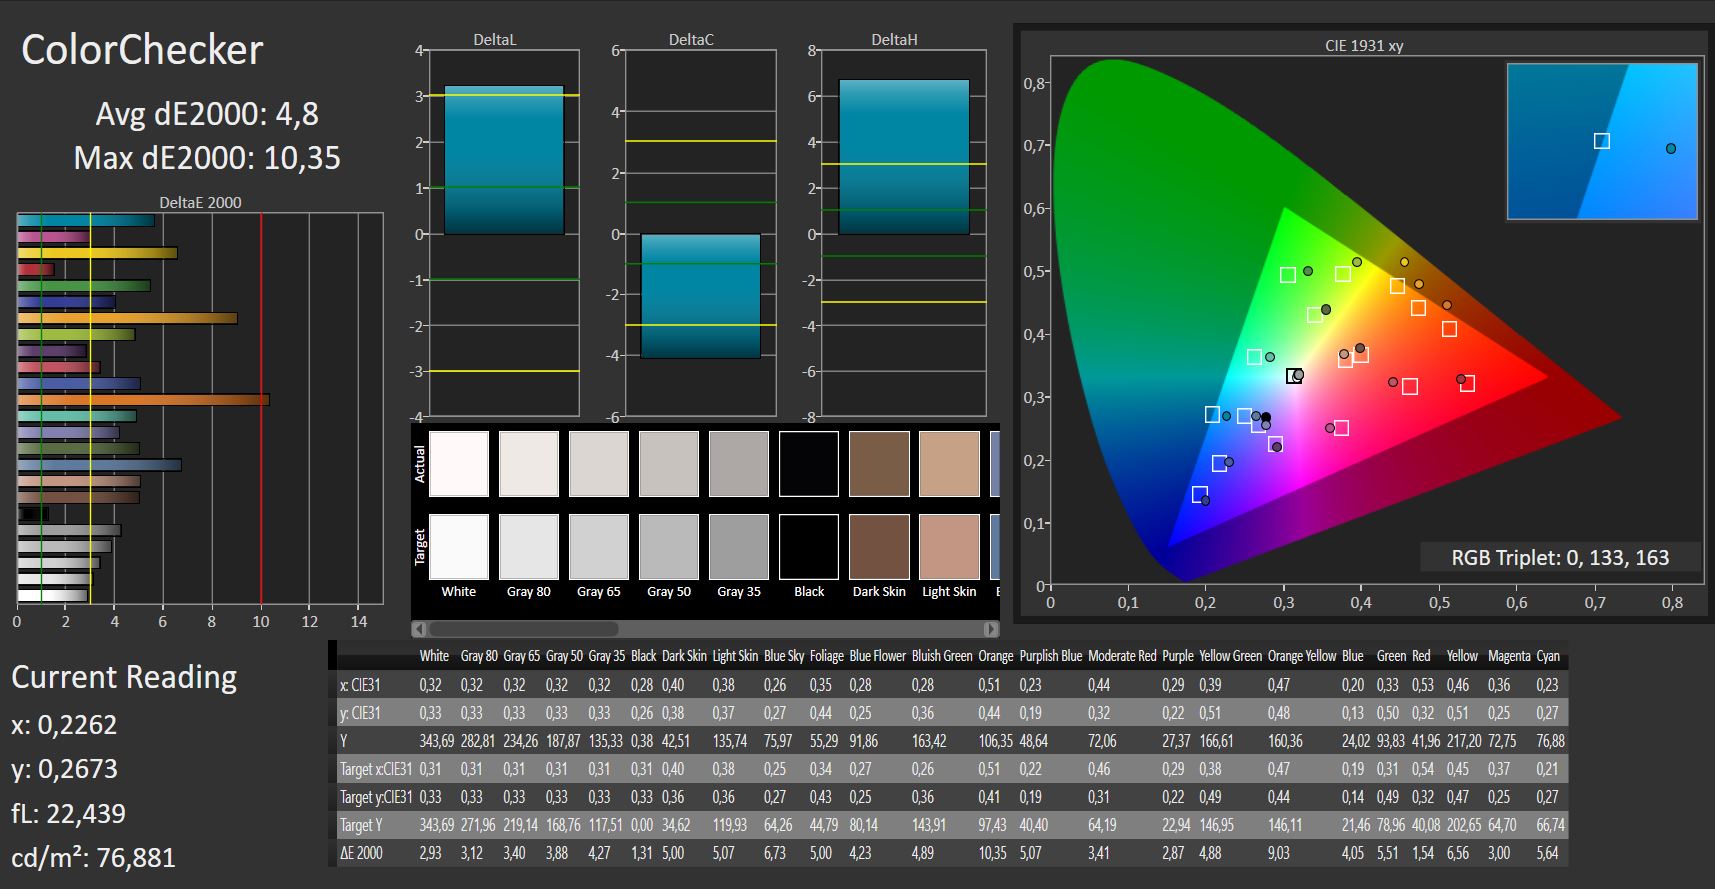
ΔE ColorChecker Calman: 4.8 | ∀{0.5-29.43 Ø4.72}
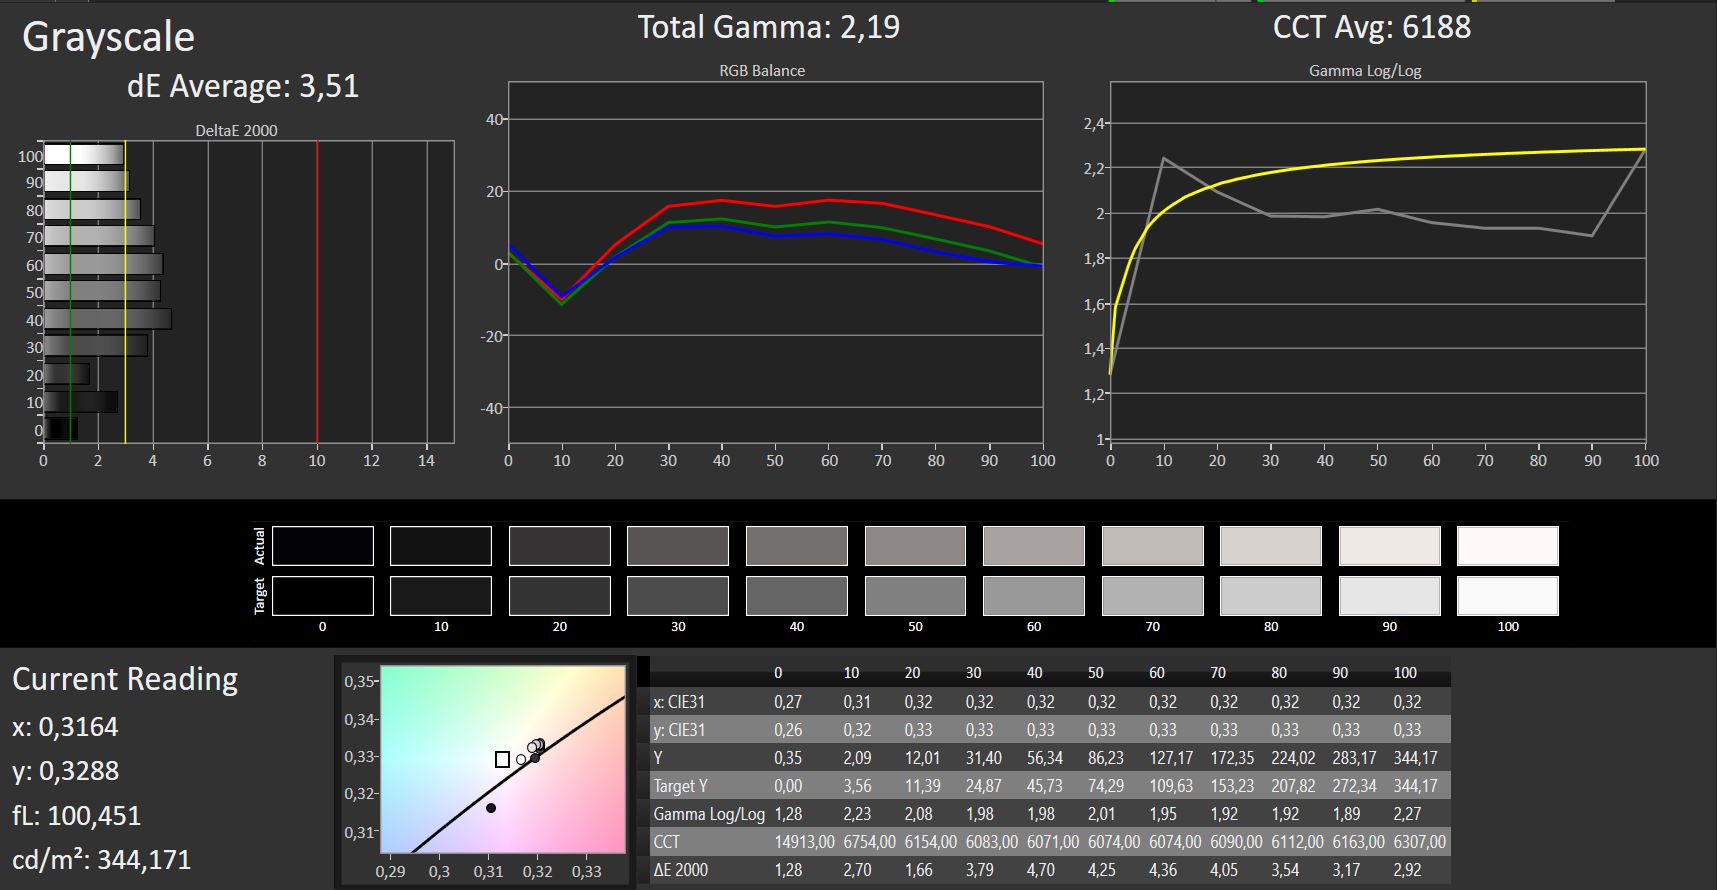
ΔE Greyscale Calman: 3.51 | ∀{0.09-98 Ø4.97}
81% sRGB (Argyll 1.6.3 3D)
54% AdobeRGB 1998 (Argyll 1.6.3 3D)
59.7% AdobeRGB 1998 (Argyll 3D)
81.6% sRGB (Argyll 3D)
64.8% Display P3 (Argyll 3D)
Gamma: 2.19
CCT: 6188 K
| Dell Inspiron 17-7786 LG Philips, 173W4F, IPS, 1920x1080, 17.3" | Dell Inspiron 17-7773-0043 Chi Mei CMN1738, IPS, 1920x1080, 17.3" | Dell Inspiron 17 7778 LG Philips LGD 0513 / 173WF4, IPS, 1920x1080, 17.3" | HP Envy 17-ae143ng AU Optronics B173HW01 V0, IPS, 1920x1080, 17.3" | Acer Aspire 5 A517-51G-80L LG Display, LP173WF4-SPF5, aSi TFT, IPS, 1920x1080, 17.3" | Asus VivoBook Pro 17 N705UD-EH76 LP173WF4-SPF5, IPS, 1920x1080, 17.3" | |
|---|---|---|---|---|---|---|
| Display | 10% | 5% | 5% | 3% | 6% | |
| Display P3 Coverage (%) | 64.8 | 67.4 4% | 67.4 4% | 63.9 -1% | 66.3 2% | 67.9 5% |
| sRGB Coverage (%) | 81.6 | 91.9 13% | 86.3 6% | 88 8% | 84.2 3% | 86.8 6% |
| AdobeRGB 1998 Coverage (%) | 59.7 | 67.2 13% | 63.1 6% | 64.3 8% | 61.6 3% | 63.5 6% |
| Response Times | -5% | 12% | 18% | -12% | 17% | |
| Response Time Grey 50% / Grey 80% * (ms) | 38 ? | 40 ? -5% | 36 ? 5% | 33 ? 13% | 41 ? -8% | 30.8 ? 19% |
| Response Time Black / White * (ms) | 27 ? | 28 ? -4% | 22 ? 19% | 21 ? 22% | 31 ? -15% | 23.2 ? 14% |
| PWM Frequency (Hz) | 1000 ? | 122000 ? | 119000 ? | |||
| Screen | 5% | -13% | 3% | 16% | 0% | |
| Brightness middle (cd/m²) | 343 | 323 -6% | 327 -5% | 352 3% | 397 16% | 376.2 10% |
| Brightness (cd/m²) | 313 | 290 -7% | 314 0% | 330 5% | 364 16% | 355 13% |
| Brightness Distribution (%) | 82 | 77 -6% | 87 6% | 88 7% | 84 2% | 89 9% |
| Black Level * (cd/m²) | 0.37 | 0.21 43% | 0.3 19% | 0.31 16% | 0.29 22% | 0.42 -14% |
| Contrast (:1) | 927 | 1538 66% | 1090 18% | 1135 22% | 1369 48% | 896 -3% |
| Colorchecker dE 2000 * | 4.8 | 4.88 -2% | 6.75 -41% | 4.34 10% | 3.88 19% | 4.21 12% |
| Colorchecker dE 2000 max. * | 10.35 | 8.86 14% | 11.82 -14% | 8.69 16% | 8.22 21% | 8.31 20% |
| Greyscale dE 2000 * | 3.51 | 6.21 -77% | 7.91 -125% | 5.66 -61% | 3.1 12% | 5.5 -57% |
| Gamma | 2.19 100% | 2.36 93% | 2.31 95% | 2.29 96% | 2.59 85% | 2.335 94% |
| CCT | 6188 105% | 6620 98% | 7642 85% | 6326 103% | 6570 99% | 7056 92% |
| Color Space (Percent of AdobeRGB 1998) (%) | 54 | 60 11% | 57 6% | 57 6% | 55 2% | 57 6% |
| Color Space (Percent of sRGB) (%) | 81 | 92 14% | 86 6% | 88 9% | 84 4% | 87 7% |
| Colorchecker dE 2000 calibrated * | 3.95 | |||||
| Totaal Gemiddelde (Programma / Instellingen) | 3% /
5% | 1% /
-6% | 9% /
6% | 2% /
10% | 8% /
4% |
* ... kleiner is beter
Responstijd Scherm
| ↔ Responstijd Zwart naar Wit | ||
|---|---|---|
| 27 ms ... stijging ↗ en daling ↘ gecombineerd | ↗ 16 ms stijging | 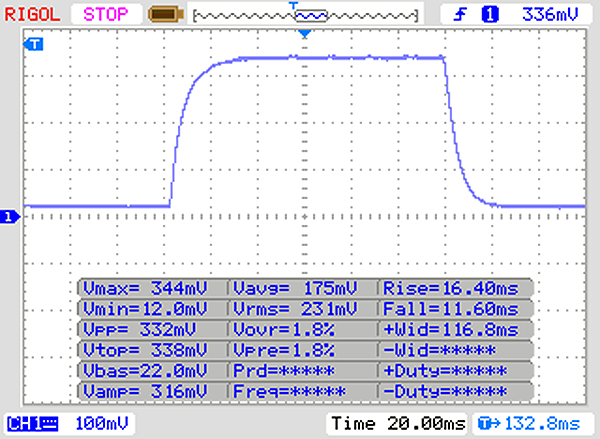 |
| ↘ 11 ms daling | ||
| Het scherm vertoonde relatief trage responstijden in onze tests en is misschien te traag voor games. Ter vergelijking: alle testtoestellen variëren van 0.1 (minimum) tot 240 (maximum) ms. » 67 % van alle toestellen zijn beter. Dit betekent dat de gemeten responstijd slechter is dan het gemiddelde (19.8 ms) van alle geteste toestellen. | ||
| ↔ Responstijd 50% Grijs naar 80% Grijs | ||
| 38 ms ... stijging ↗ en daling ↘ gecombineerd | ↗ 19 ms stijging | 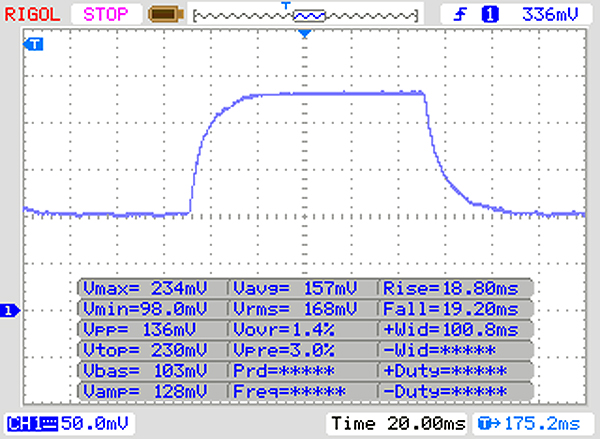 |
| ↘ 19 ms daling | ||
| Het scherm vertoonde trage responstijden in onze tests en is misschien te traag voor games. Ter vergelijking: alle testtoestellen variëren van 0.165 (minimum) tot 636 (maximum) ms. » 55 % van alle toestellen zijn beter. Dit betekent dat de gemeten responstijd slechter is dan het gemiddelde (31 ms) van alle geteste toestellen. | ||
Screen Flickering / PWM (Pulse-Width Modulation)
| Screen flickering / PWM niet waargenomen |  | ||
Ter vergelijking: 52 % van alle geteste toestellen maakten geen gebruik van PWM om de schermhelderheid te verlagen. Als het wel werd gebruikt, werd een gemiddelde van 7763 (minimum: 5 - maximum: 343500) Hz waargenomen. | |||
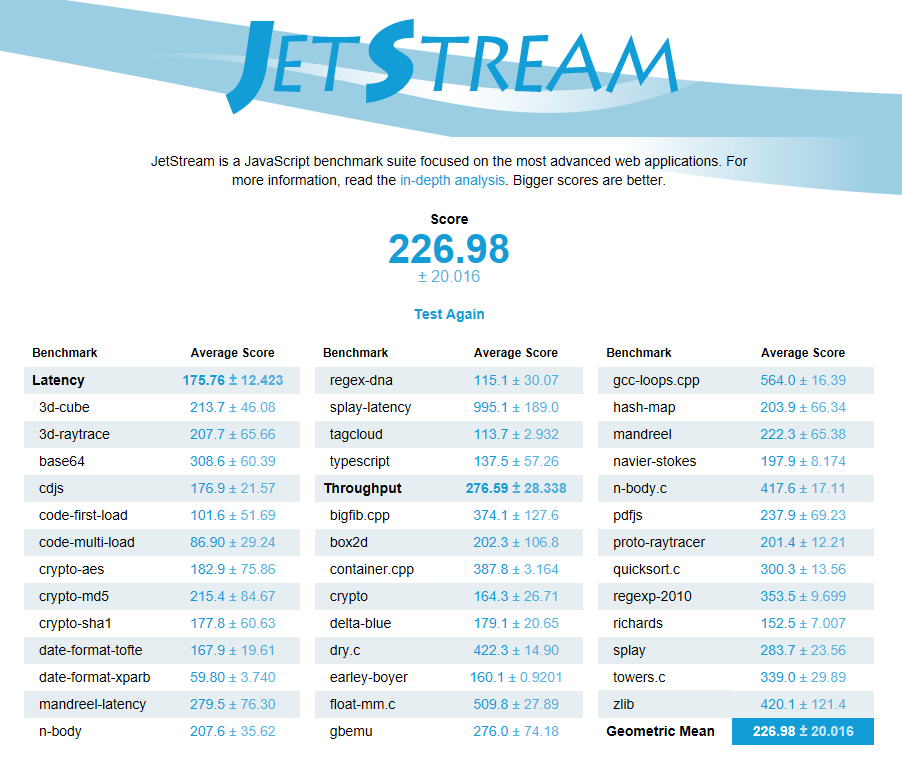
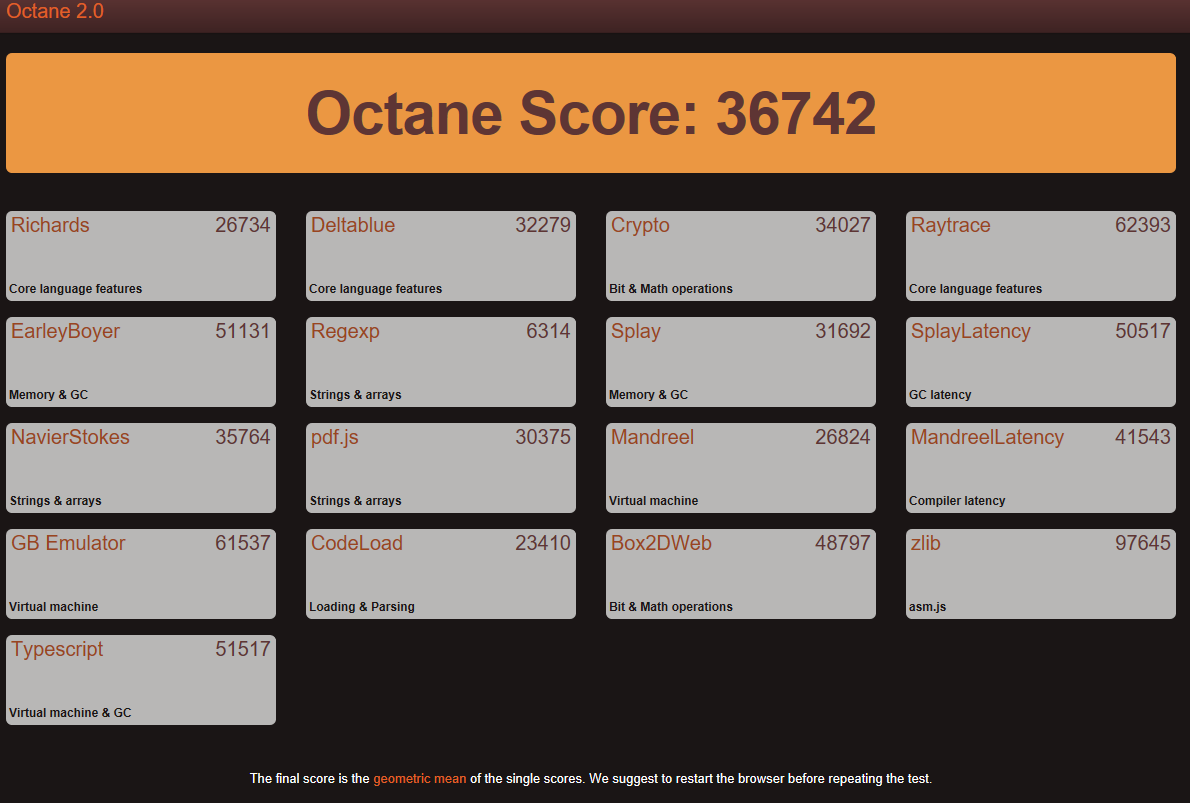
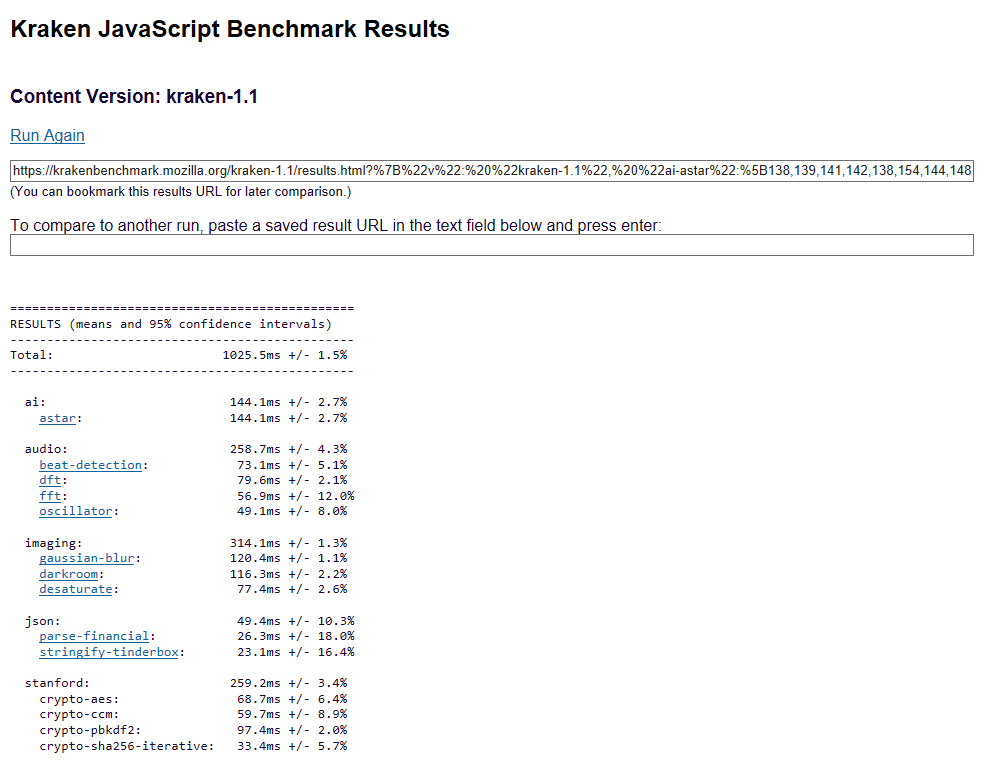
| JetStream 1.1 - 1.1 Total | |
| Gemiddelde van klas Multimedia (n=1laatste 2 jaar) | |
| Acer Aspire 5 A517-51G-80L | |
| Asus VivoBook Pro 17 N705UD-EH76 | |
| Dell Inspiron 17-7773-0043 | |
| Gemiddeld Intel Core i7-8565U (107.6 - 277, n=37) | |
| Dell Inspiron 17-7786 | |
| HP Envy 17-ae143ng | |
| Blender - v2.79 BMW27 CPU | |
| Dell Inspiron 17-7786 | |
| Gemiddeld Intel Core i7-8565U (687 - 1175, n=22) | |
| Gemiddelde van klas Multimedia (100 - 557, n=64, laatste 2 jaar) | |
| HWBOT x265 Benchmark v2.2 - 4k Preset | |
| Gemiddelde van klas Multimedia (5.26 - 36.1, n=62, laatste 2 jaar) | |
| Dell Inspiron 17-7786 | |
| Gemiddeld Intel Core i7-8565U (3.24 - 5.5, n=22) | |
* ... kleiner is beter
| PCMark 8 Home Score Accelerated v2 | 4092 punten | |
| PCMark 8 Creative Score Accelerated v2 | 5840 punten | |
| PCMark 8 Work Score Accelerated v2 | 5254 punten | |
| PCMark 10 Score | 4175 punten | |
Help | ||
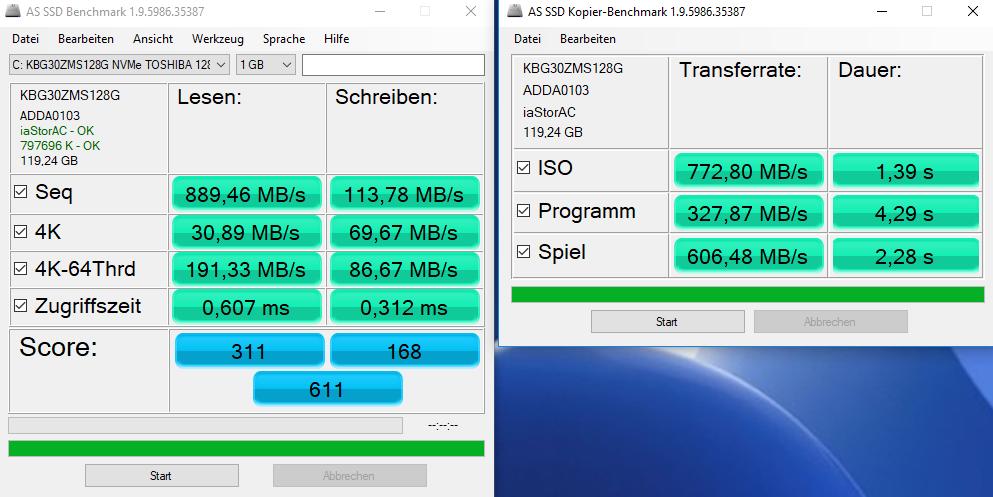
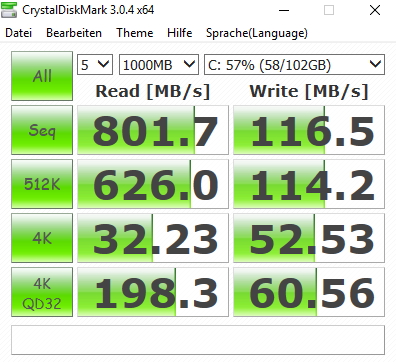
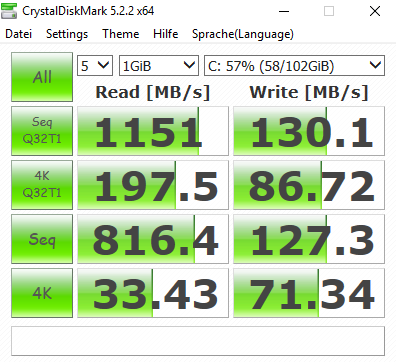
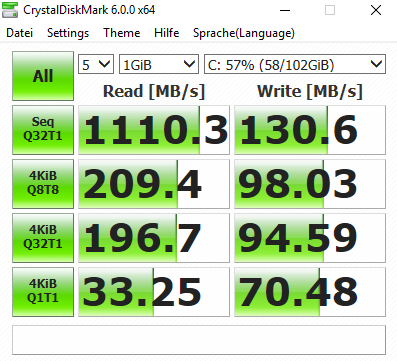
Benchmarks of the SSD
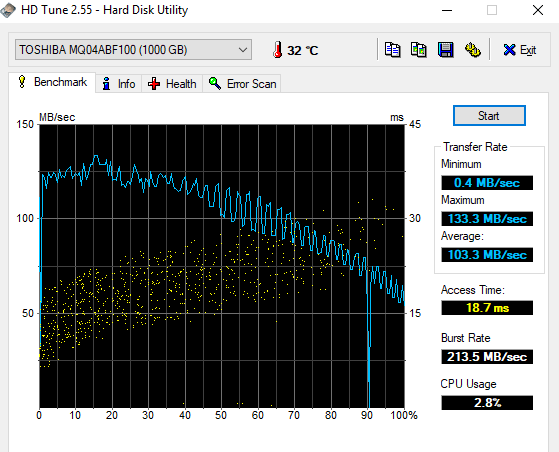
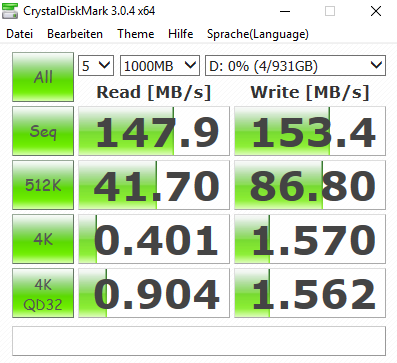
Benchmarks of the HDD
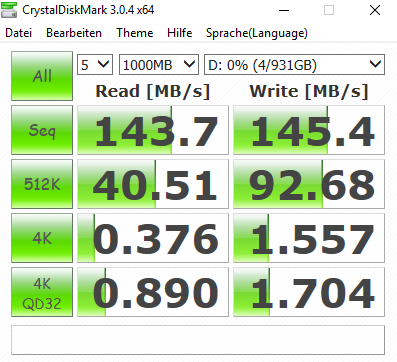
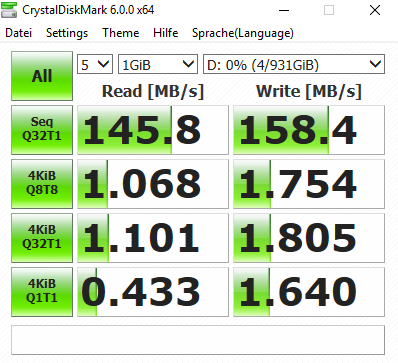
| Dell Inspiron 17-7786 KBG30ZMS128G | Dell Inspiron 17-7773-0043 SanDisk X400 M.2 2280 128GB | Dell Inspiron 17 7778 Liteonit CV3-CE512 | HP Envy 17-ae143ng Liteonit CV3-8D128 | Acer Aspire 5 A517-51G-80L Micron 1100 MTFDDAV256TBN | Asus VivoBook Pro 17 N705UD-EH76 Samsung PM961 NVMe MZVLW512HMJP | |
|---|---|---|---|---|---|---|
| CrystalDiskMark 5.2 / 6 | 52% | 78% | 61% | 344% | ||
| Write 4K (MB/s) | 71.3 | 56.4 -21% | 66.2 -7% | 84.2 18% | 151.3 112% | |
| Read 4K (MB/s) | 33.43 | 28.72 -14% | 33.83 1% | 28.39 -15% | 46.62 39% | |
| Write Seq (MB/s) | 127.3 | 356.3 180% | 449.4 253% | 398.2 213% | 1020 701% | |
| Read Seq (MB/s) | 816 | 490.3 -40% | 468.6 -43% | 472.1 -42% | 935 15% | |
| Write 4K Q32T1 (MB/s) | 94.6 | 276.7 192% | 209.6 122% | 181.6 92% | 452.3 378% | |
| Read 4K Q32T1 (MB/s) | 196.7 | 279.7 42% | 290.8 48% | 247.7 26% | 559 184% | |
| Write Seq Q32T1 (MB/s) | 130.6 | 298.5 129% | 525 302% | 454.3 248% | 1614 1136% | |
| Read Seq Q32T1 (MB/s) | 1110 | 522 -53% | 508 -54% | 533 -52% | 3220 190% | |
| Write 4K Q8T8 (MB/s) | 98 | |||||
| Read 4K Q8T8 (MB/s) | 209.4 | |||||
| AS SSD | 18% | 69% | 23% | 41% | 328% | |
| Seq Read (MB/s) | 889 | 482.2 -46% | 489.8 -45% | 488.5 -45% | 494.2 -44% | 2339 163% |
| Seq Write (MB/s) | 113.8 | 330 190% | 445.8 292% | 476.7 319% | 404.2 255% | 1409 1138% |
| 4K Read (MB/s) | 30.89 | 27.84 -10% | 24.93 -19% | 29.7 -4% | 25.78 -17% | 49.78 61% |
| 4K Write (MB/s) | 69.7 | 54.4 -22% | 55.6 -20% | 54.1 -22% | 71.4 2% | 122.1 75% |
| 4K-64 Read (MB/s) | 191.3 | 355 86% | 282 47% | 258.7 35% | 234.6 23% | 1329 595% |
| 4K-64 Write (MB/s) | 86.7 | 98 13% | 247.1 185% | 116.9 35% | 259.1 199% | 828 855% |
| Access Time Read * (ms) | 0.607 | 0.218 64% | 0.106 83% | 0.161 73% | 0.081 87% | 0.056 91% |
| Access Time Write * (ms) | 0.312 | 0.081 74% | 0.081 74% | 0.069 78% | 0.057 82% | 0.03 90% |
| Score Read (Points) | 311 | 431 39% | 356 14% | 337 8% | 310 0% | 1612 418% |
| Score Write (Points) | 168 | 185 10% | 347 107% | 219 30% | 371 121% | 1091 549% |
| Score Total (Points) | 611 | 838 37% | 891 46% | 739 21% | 844 38% | 3488 471% |
| Copy ISO MB/s (MB/s) | 773 | 410.1 -47% | 255.9 -67% | 300.4 -61% | 1733 124% | |
| Copy Program MB/s (MB/s) | 327.9 | 127.6 -61% | 109.2 -67% | 157.4 -52% | 305.8 -7% | |
| Copy Game MB/s (MB/s) | 606 | 165.5 -73% | 129 -79% | 221.7 -63% | 405.5 -33% | |
| Totaal Gemiddelde (Programma / Instellingen) | 35% /
30% | 69% /
69% | 51% /
43% | 51% /
48% | 336% /
334% |
* ... kleiner is beter

| 3DMark 11 - 1280x720 Performance GPU | |
| Gemiddelde van klas Multimedia (3749 - 60002, n=61, laatste 2 jaar) | |
| Asus VivoBook Pro 17 N705UD-EH76 | |
| Dell Inspiron 17-7786 | |
| HP Envy 17-ae143ng | |
| Acer Aspire 5 A517-51G-80L | |
| Dell Inspiron 17-7773-0043 | |
| Gemiddeld NVIDIA GeForce MX150 (2796 - 4905, n=47) | |
| Dell Inspiron 17 7778 | |
| 3DMark | |
| 1280x720 Cloud Gate Standard Graphics | |
| Gemiddelde van klas Multimedia (16765 - 143501, n=35, laatste 2 jaar) | |
| Asus VivoBook Pro 17 N705UD-EH76 | |
| Dell Inspiron 17-7786 | |
| HP Envy 17-ae143ng | |
| Dell Inspiron 17-7773-0043 | |
| Gemiddeld NVIDIA GeForce MX150 (16227 - 22183, n=43) | |
| Acer Aspire 5 A517-51G-80L | |
| Dell Inspiron 17 7778 | |
| 1920x1080 Fire Strike Graphics | |
| Gemiddelde van klas Multimedia (2328 - 48907, n=65, laatste 2 jaar) | |
| Asus VivoBook Pro 17 N705UD-EH76 | |
| HP Envy 17-ae143ng | |
| Dell Inspiron 17-7786 | |
| Acer Aspire 5 A517-51G-80L | |
| Dell Inspiron 17-7773-0043 | |
| Gemiddeld NVIDIA GeForce MX150 (2323 - 3739, n=44) | |
| Dell Inspiron 17 7778 | |
| 2560x1440 Time Spy Graphics | |
| Gemiddelde van klas Multimedia (696 - 19403, n=66, laatste 2 jaar) | |
| HP Envy 17-ae143ng | |
| Dell Inspiron 17-7786 | |
| Gemiddeld NVIDIA GeForce MX150 (830 - 1147, n=16) | |
| 3DMark 06 Standard Score | 22583 punten | |
| 3DMark 11 Performance | 4866 punten | |
| 3DMark Ice Storm Standard Score | 65934 punten | |
| 3DMark Cloud Gate Standard Score | 15737 punten | |
| 3DMark Fire Strike Score | 3253 punten | |
| 3DMark Fire Strike Extreme Score | 1646 punten | |
| 3DMark Time Spy Score | 1141 punten | |
Help | ||
| lage | gem. | hoge | ultra | |
|---|---|---|---|---|
| BioShock Infinite (2013) | 179.4 | 109.6 | 92.9 | 34.6 |
| Dota 2 Reborn (2015) | 98.4 | 82.9 | 67.1 | 61.3 |
| Rise of the Tomb Raider (2016) | 58.9 | 41.9 | 23 | 19 |
| X-Plane 11.11 (2018) | 47.97 | 40.93 | 36.74 |
Geluidsniveau
| Onbelast |
| 30.7 / 30.7 / 30.7 dB (A) |
| HDD |
| 31.1 dB (A) |
| Belasting |
| 33.4 / 38.7 dB (A) |
 | ||
30 dB stil 40 dB(A) hoorbaar 50 dB(A) luid |
||
min: | ||
| Dell Inspiron 17-7786 GeForce MX150, i7-8565U, KBG30ZMS128G | Dell Inspiron 17-7773-0043 GeForce MX150, i5-8550U, SanDisk X400 M.2 2280 128GB | Dell Inspiron 17 7778 GeForce 940MX, 6500U, Liteonit CV3-CE512 | HP Envy 17-ae143ng GeForce MX150, i5-8250U, Liteonit CV3-8D128 | Acer Aspire 5 A517-51G-80L GeForce MX150, i5-8550U, Micron 1100 MTFDDAV256TBN | Asus VivoBook Pro 17 N705UD-EH76 GeForce GTX 1050 Mobile, i5-8550U, Samsung PM961 NVMe MZVLW512HMJP | |
|---|---|---|---|---|---|---|
| Noise | -5% | -10% | -156% | 3% | 1% | |
| uit / omgeving * (dB) | 30.3 | 30.3 -0% | 32.1 -6% | 304 -903% | 29.4 3% | 28.3 7% |
| Idle Minimum * (dB) | 30.7 | 30.6 -0% | 32.1 -5% | 31.9 -4% | 30.1 2% | 28.3 8% |
| Idle Average * (dB) | 30.7 | 30.6 -0% | 32.1 -5% | 31.9 -4% | 30.1 2% | 29 6% |
| Idle Maximum * (dB) | 30.7 | 32.2 -5% | 34 -11% | 31.9 -4% | 29.7 3% | 29 6% |
| Load Average * (dB) | 33.4 | 40.5 -21% | 40.3 -21% | 39.4 -18% | 34.4 -3% | 36.7 -10% |
| Load Maximum * (dB) | 38.7 | 39.5 -2% | 42.6 -10% | 39.7 -3% | 34.4 11% | 42.8 -11% |
| Witcher 3 ultra * (dB) | 44.7 |
* ... kleiner is beter
(±) De maximumtemperatuur aan de bovenzijde bedraagt 42.1 °C / 108 F, vergeleken met het gemiddelde van 36.8 °C / 98 F, variërend van 21 tot 71 °C voor de klasse Multimedia.
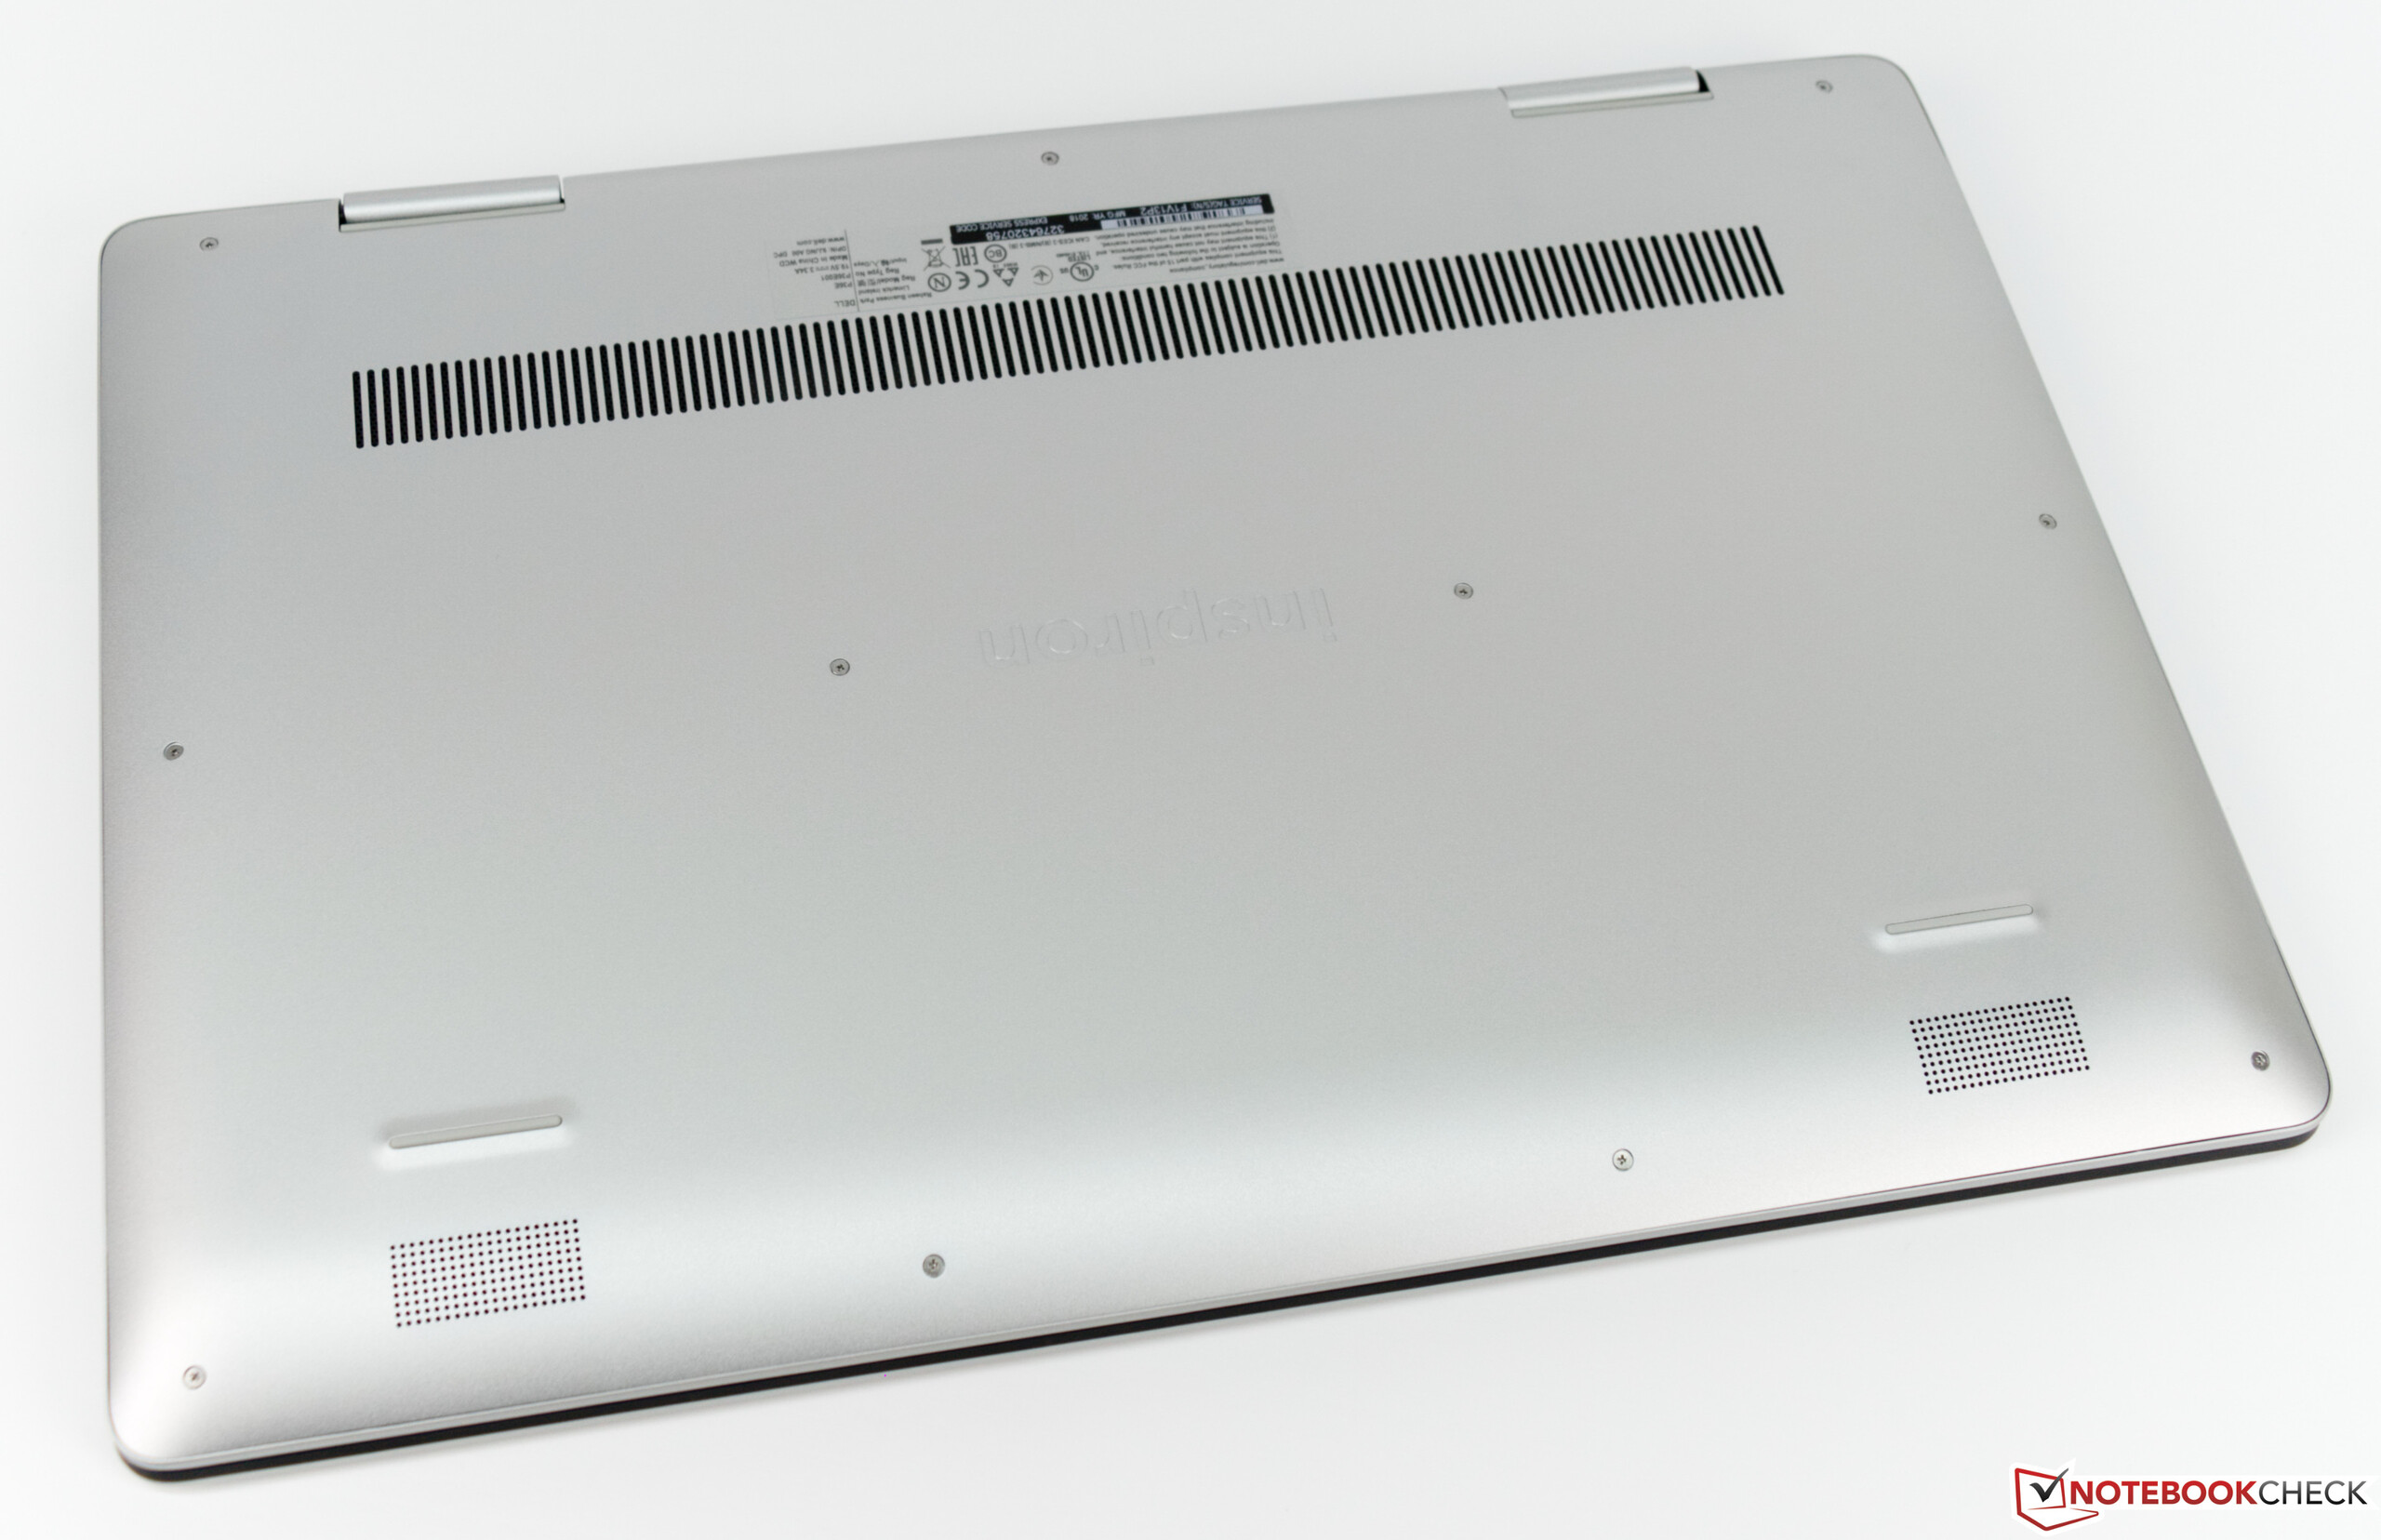
(±) De bodem warmt op tot een maximum van 43 °C / 109 F, vergeleken met een gemiddelde van 39.1 °C / 102 F
(+) Bij onbelast gebruik bedraagt de gemiddelde temperatuur voor de bovenzijde 23.1 °C / 74 F, vergeleken met het apparaatgemiddelde van 31.3 °C / 88 F.
(+) De palmsteunen en het touchpad zijn met een maximum van ###max## °C / 84.9 F koeler dan de huidtemperatuur en voelen daarom koel aan.
(±) De gemiddelde temperatuur van de handpalmsteun van soortgelijke toestellen bedroeg 28.7 °C / 83.7 F (-0.7 °C / -1.2 F).
| Dell Inspiron 17-7786 GeForce MX150, i7-8565U, KBG30ZMS128G | Dell Inspiron 17-7773-0043 GeForce MX150, i5-8550U, SanDisk X400 M.2 2280 128GB | Dell Inspiron 17 7778 GeForce 940MX, 6500U, Liteonit CV3-CE512 | HP Envy 17-ae143ng GeForce MX150, i5-8250U, Liteonit CV3-8D128 | Acer Aspire 5 A517-51G-80L GeForce MX150, i5-8550U, Micron 1100 MTFDDAV256TBN | Asus VivoBook Pro 17 N705UD-EH76 GeForce GTX 1050 Mobile, i5-8550U, Samsung PM961 NVMe MZVLW512HMJP | |
|---|---|---|---|---|---|---|
| Heat | -13% | -18% | 1% | 3% | -29% | |
| Maximum Upper Side * (°C) | 42.1 | 42.7 -1% | 44.7 -6% | 36 14% | 40.4 4% | 46 -9% |
| Maximum Bottom * (°C) | 43 | 47.2 -10% | 45.5 -6% | 37.6 13% | 37 14% | 56.2 -31% |
| Idle Upper Side * (°C) | 24 | 28.4 -18% | 31 -29% | 26.2 -9% | 25.3 -5% | 28.6 -19% |
| Idle Bottom * (°C) | 24.2 | 29.7 -23% | 31.4 -30% | 27.8 -15% | 24.7 -2% | 37.6 -55% |
* ... kleiner is beter
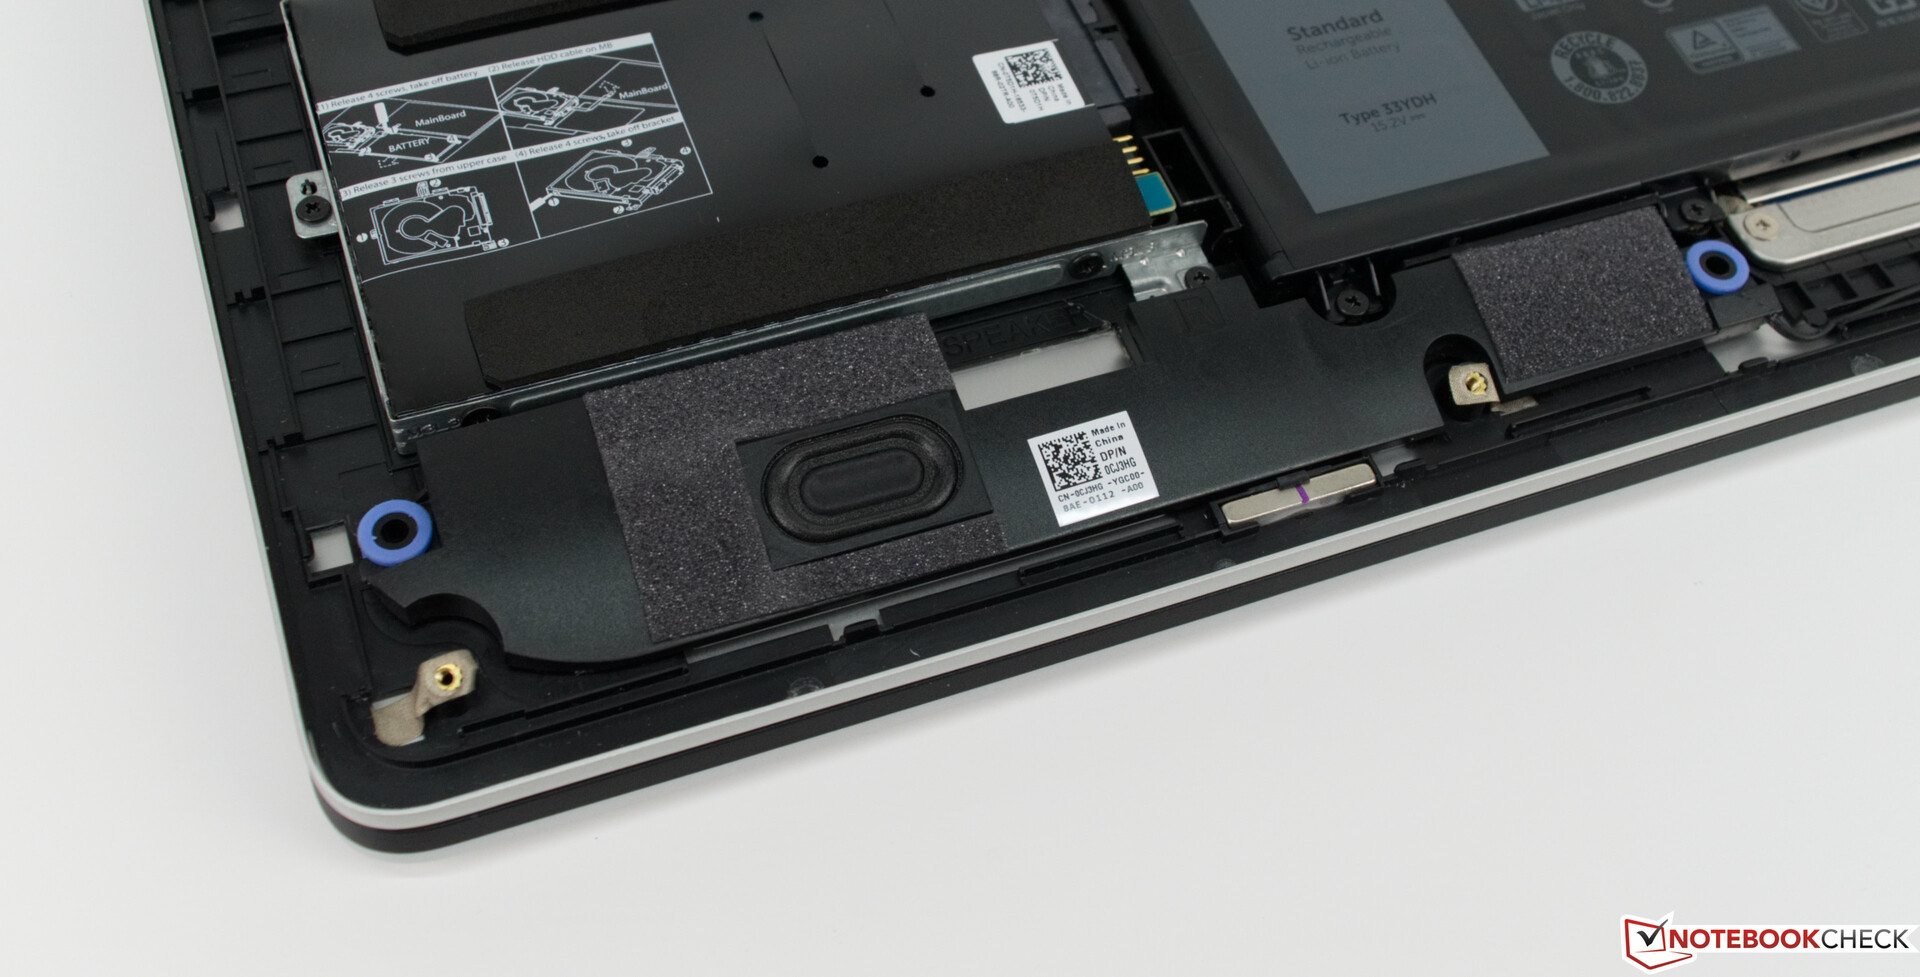
Dell Inspiron 17-7786 audioanalyse
(-) | niet erg luide luidsprekers (68.8 dB)
Bas 100 - 315 Hz
(-) | bijna geen lage tonen - gemiddeld 15.5% lager dan de mediaan
(+) | de lage tonen zijn lineair (6.4% delta naar de vorige frequentie)
Midden 400 - 2000 Hz
(+) | evenwichtige middens - slechts 2.9% verwijderd van de mediaan
(+) | de middentonen zijn lineair (3.7% delta ten opzichte van de vorige frequentie)
Hoog 2 - 16 kHz
(+) | evenwichtige hoogtepunten - slechts 3.4% verwijderd van de mediaan
(+) | de hoge tonen zijn lineair (4.1% delta naar de vorige frequentie)
Algemeen 100 - 16.000 Hz
(±) | lineariteit van het totale geluid is gemiddeld (16.6% verschil met de mediaan)
Vergeleken met dezelfde klasse
» 44% van alle geteste apparaten in deze klasse waren beter, 7% vergelijkbaar, 50% slechter
» De beste had een delta van 5%, het gemiddelde was 17%, de slechtste was 45%
Vergeleken met alle geteste toestellen
» 29% van alle geteste apparaten waren beter, 6% gelijk, 65% slechter
» De beste had een delta van 4%, het gemiddelde was 23%, de slechtste was 134%
Asus VivoBook Pro 17 N705UD-EH76 audioanalyse
(±) | luidspreker luidheid is gemiddeld maar goed (79.2 dB)
Bas 100 - 315 Hz
(±) | verminderde zeebaars - gemiddeld 8.8% lager dan de mediaan
(±) | lineariteit van de lage tonen is gemiddeld (14.1% delta ten opzichte van de vorige frequentie)
Midden 400 - 2000 Hz
(+) | evenwichtige middens - slechts 1.8% verwijderd van de mediaan
(+) | de middentonen zijn lineair (4.1% delta ten opzichte van de vorige frequentie)
Hoog 2 - 16 kHz
(+) | evenwichtige hoogtepunten - slechts 1.6% verwijderd van de mediaan
(+) | de hoge tonen zijn lineair (3% delta naar de vorige frequentie)
Algemeen 100 - 16.000 Hz
(+) | het totale geluid is lineair (11.7% verschil met de mediaan)
Vergeleken met dezelfde klasse
» 19% van alle geteste apparaten in deze klasse waren beter, 3% vergelijkbaar, 78% slechter
» De beste had een delta van 5%, het gemiddelde was 17%, de slechtste was 45%
Vergeleken met alle geteste toestellen
» 8% van alle geteste apparaten waren beter, 3% gelijk, 89% slechter
» De beste had een delta van 4%, het gemiddelde was 23%, de slechtste was 134%
| Uit / Standby | |
| Inactief | |
| Belasting |
|
Key:
min: | |
| Dell Inspiron 17-7786 i7-8565U, GeForce MX150, KBG30ZMS128G, IPS, 1920x1080, 17.3" | Dell Inspiron 17-7773-0043 i5-8550U, GeForce MX150, SanDisk X400 M.2 2280 128GB, IPS, 1920x1080, 17.3" | Dell Inspiron 17 7778 6500U, GeForce 940MX, Liteonit CV3-CE512, IPS, 1920x1080, 17.3" | HP Envy 17-ae143ng i5-8250U, GeForce MX150, Liteonit CV3-8D128, IPS, 1920x1080, 17.3" | Acer Aspire 5 A517-51G-80L i5-8550U, GeForce MX150, Micron 1100 MTFDDAV256TBN, aSi TFT, IPS, 1920x1080, 17.3" | Asus VivoBook Pro 17 N705UD-EH76 i5-8550U, GeForce GTX 1050 Mobile, Samsung PM961 NVMe MZVLW512HMJP, IPS, 1920x1080, 17.3" | Gemiddeld NVIDIA GeForce MX150 | Gemiddelde van klas Multimedia | |
|---|---|---|---|---|---|---|---|---|
| Power Consumption | -11% | -2% | -5% | 2% | -24% | 7% | -26% | |
| Idle Minimum * (Watt) | 4.2 | 5.5 -31% | 5.6 -33% | 4.8 -14% | 4.1 2% | 5.06 -20% | 4.48 ? -7% | 5.65 ? -35% |
| Idle Average * (Watt) | 9.4 | 11.6 -23% | 11.2 -19% | 8.3 12% | 9.3 1% | 10.3 -10% | 7.88 ? 16% | 10 ? -6% |
| Idle Maximum * (Watt) | 12.9 | 12.4 4% | 11.9 8% | 10.3 20% | 9.8 24% | 10.7 17% | 9.76 ? 24% | 12.3 ? 5% |
| Load Average * (Watt) | 56 | 65 -16% | 46 18% | 61 -9% | 64 -14% | 83 -48% | 54.7 ? 2% | 65.1 ? -16% |
| Load Maximum * (Watt) | 63.4 | 56 12% | 53 16% | 86 -36% | 66.4 -5% | 99.9 -58% | 63.5 ? -0% | 112.5 ? -77% |
| Witcher 3 ultra * (Watt) | 92.4 |
* ... kleiner is beter
| Dell Inspiron 17-7786 i7-8565U, GeForce MX150, 56 Wh | Dell Inspiron 17-7773-0043 i5-8550U, GeForce MX150, 56 Wh | Dell Inspiron 17 7778 6500U, GeForce 940MX, 56 Wh | HP Envy 17-ae143ng i5-8250U, GeForce MX150, 55.8 Wh | Acer Aspire 5 A517-51G-80L i5-8550U, GeForce MX150, 48 Wh | Asus VivoBook Pro 17 N705UD-EH76 i5-8550U, GeForce GTX 1050 Mobile, 42 Wh | Gemiddelde van klas Multimedia | |
|---|---|---|---|---|---|---|---|
| Batterijduur | -19% | -18% | -10% | -36% | -58% | 41% | |
| Reader / Idle (h) | 16.6 | 14.7 -11% | 13.5 -19% | 9.3 -44% | 25.2 ? 52% | ||
| H.264 (h) | 7.7 | 6.2 -19% | 5.4 -30% | 16.2 ? 110% | |||
| WiFi v1.3 (h) | 9 | 6.8 -24% | 8.3 -8% | 8.1 -10% | 6.3 -30% | 4.4 -51% | 12 ? 33% |
| Load (h) | 2.5 | 2 -20% | 1.8 -28% | 1.5 -40% | 0.9 -64% | 1.669 ? -33% |
Pro
Contra
Dit is de verkorte versie van het originele artikel. Het volledige, Engelse testrapport vind je hier.
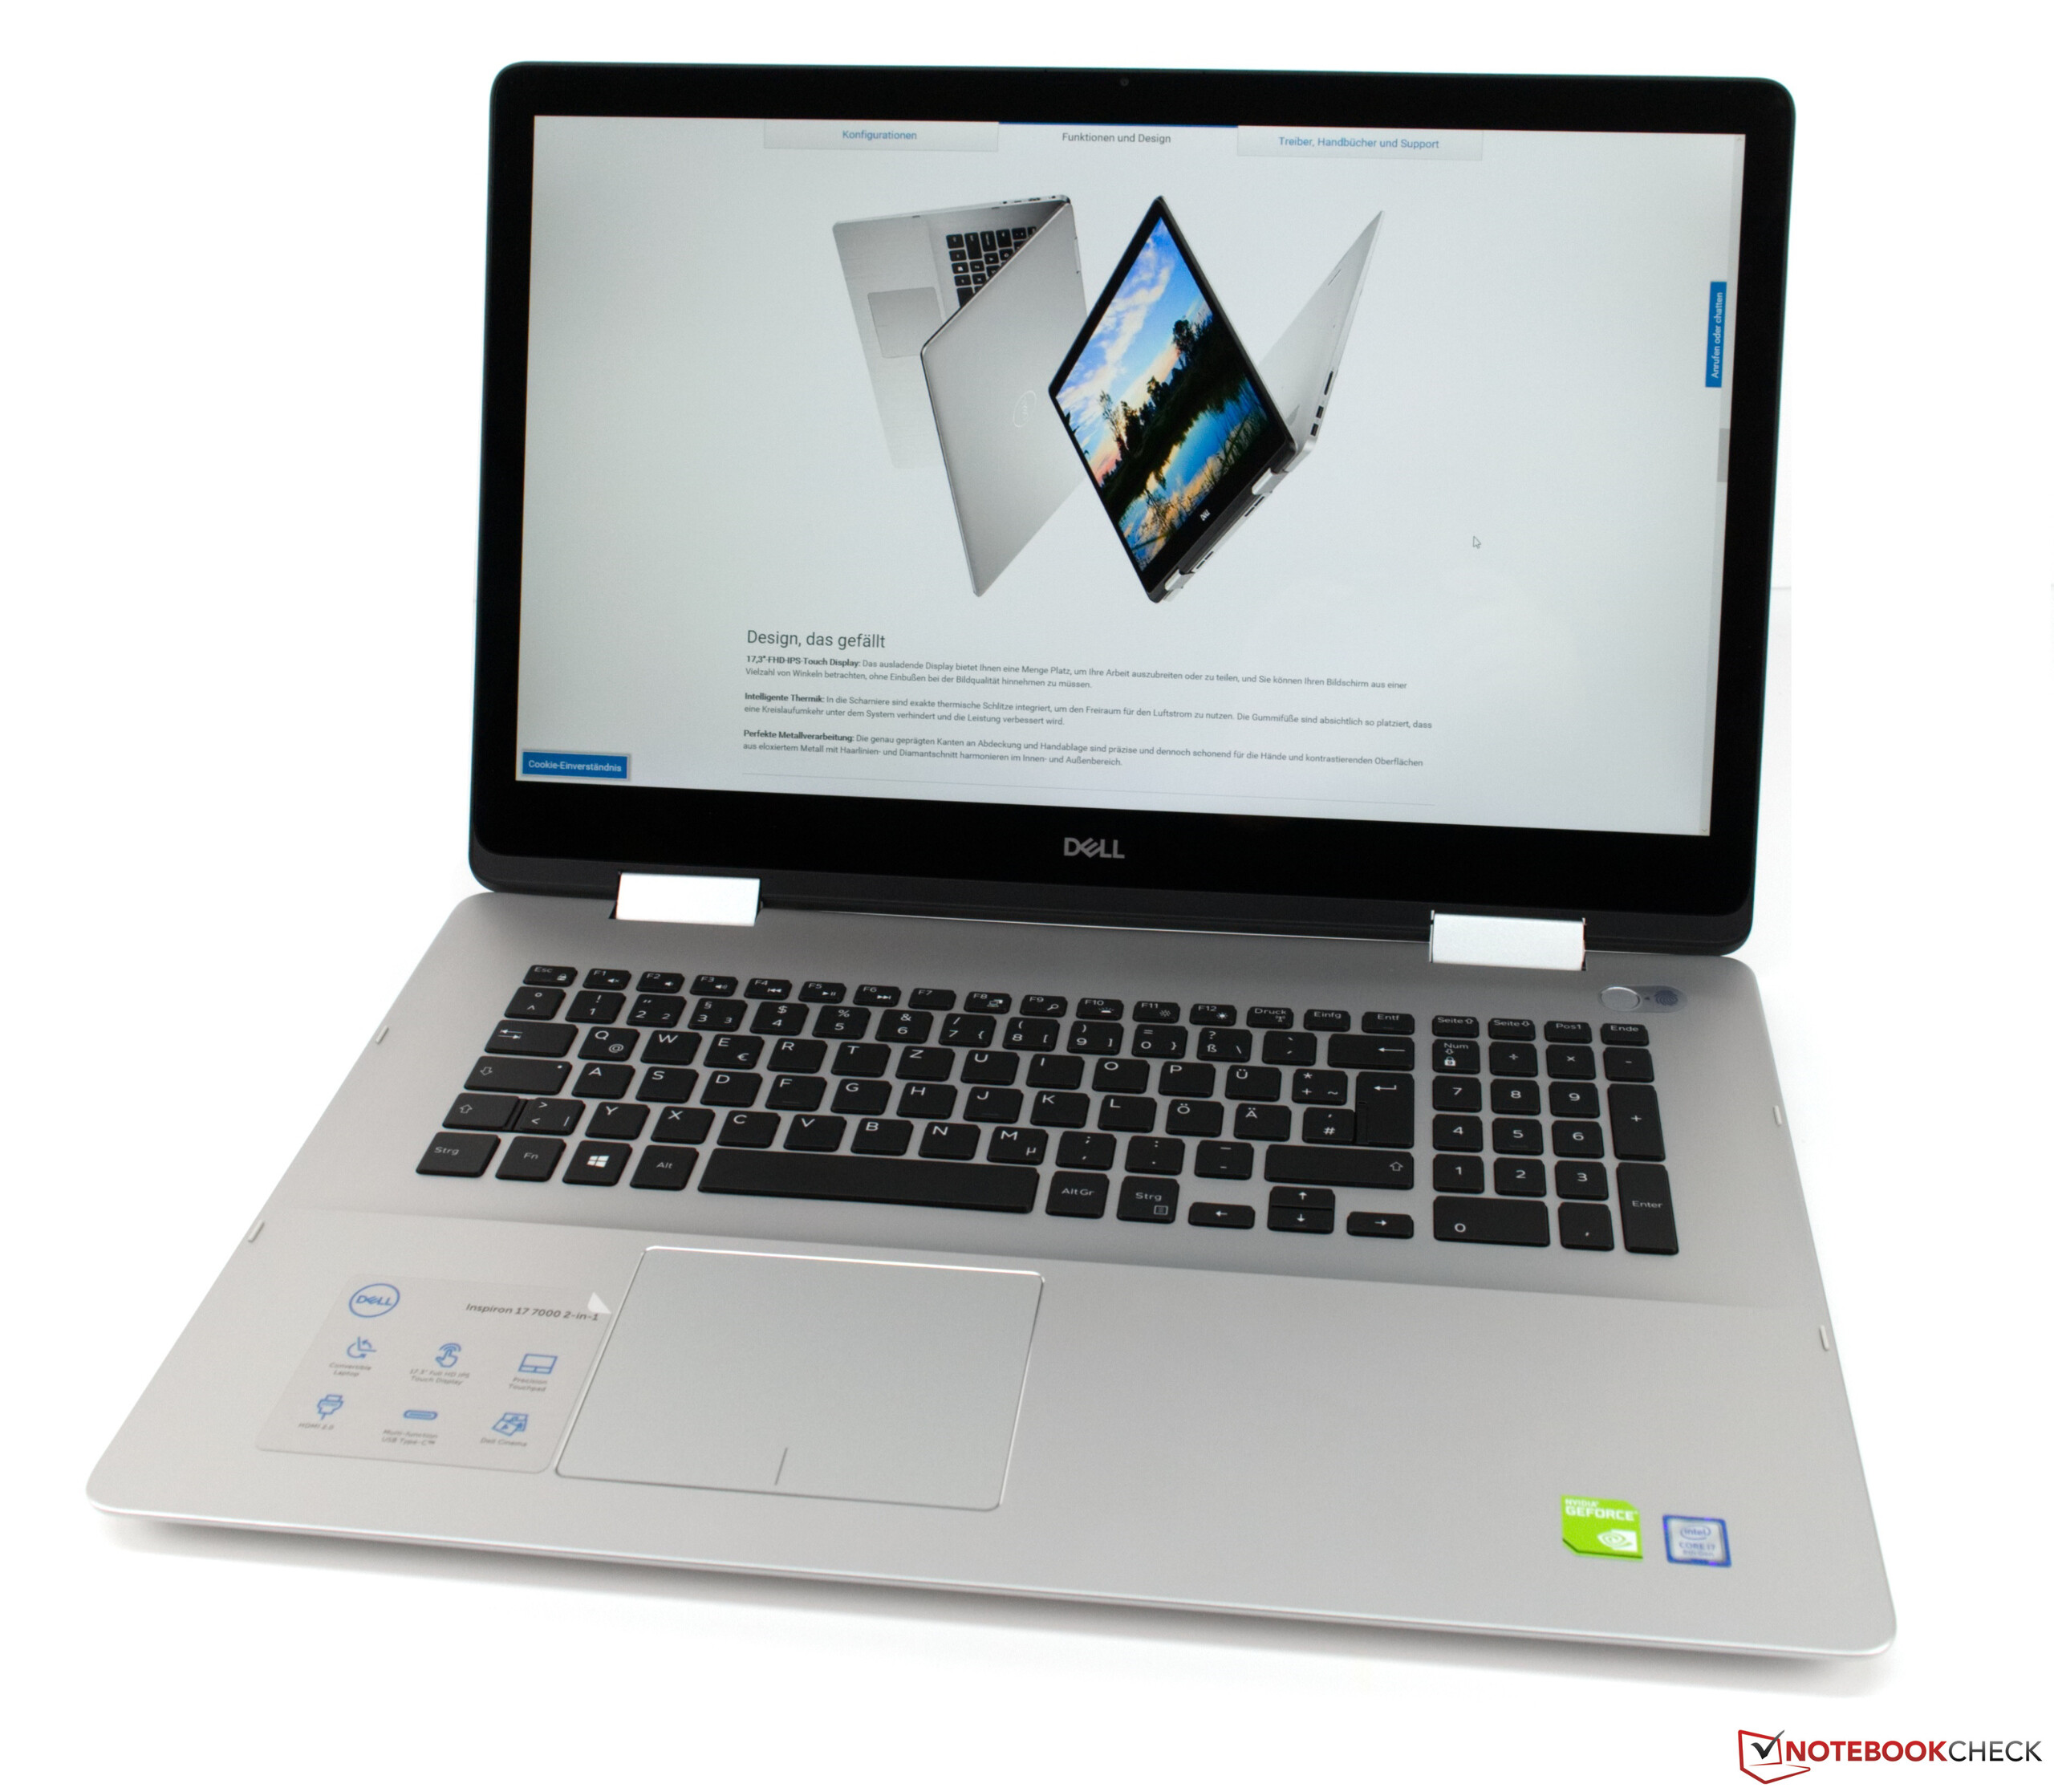
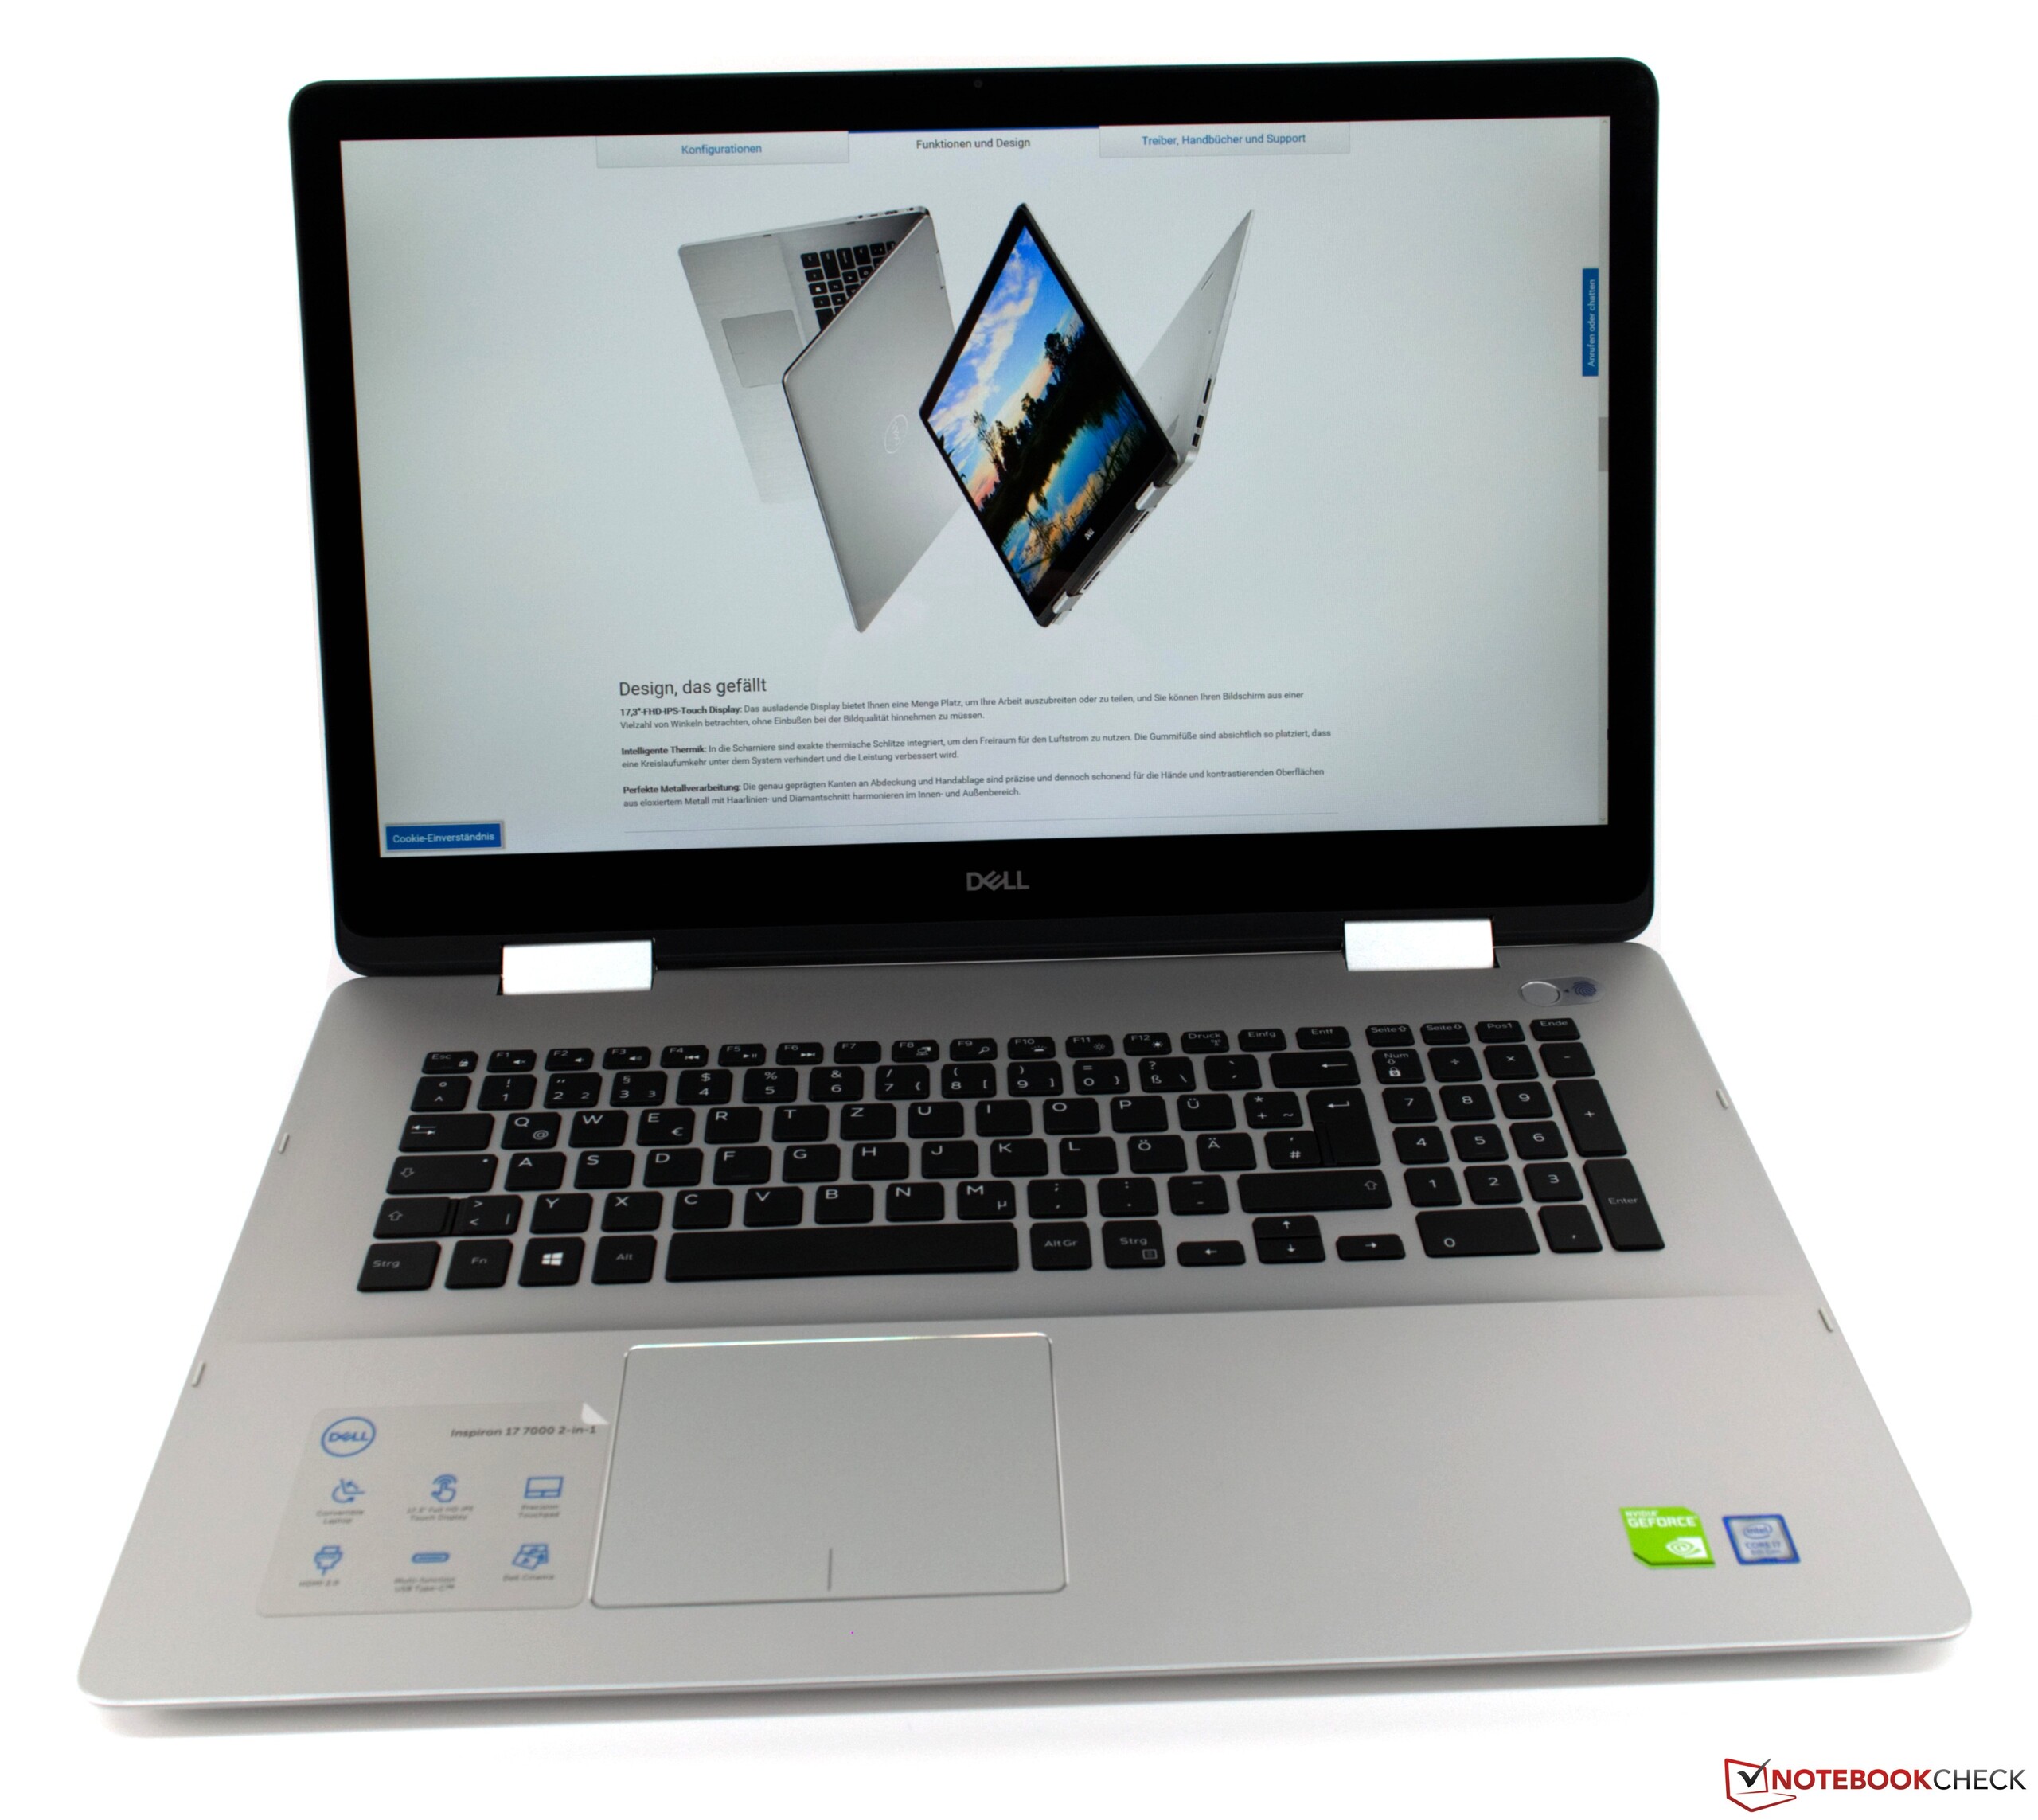
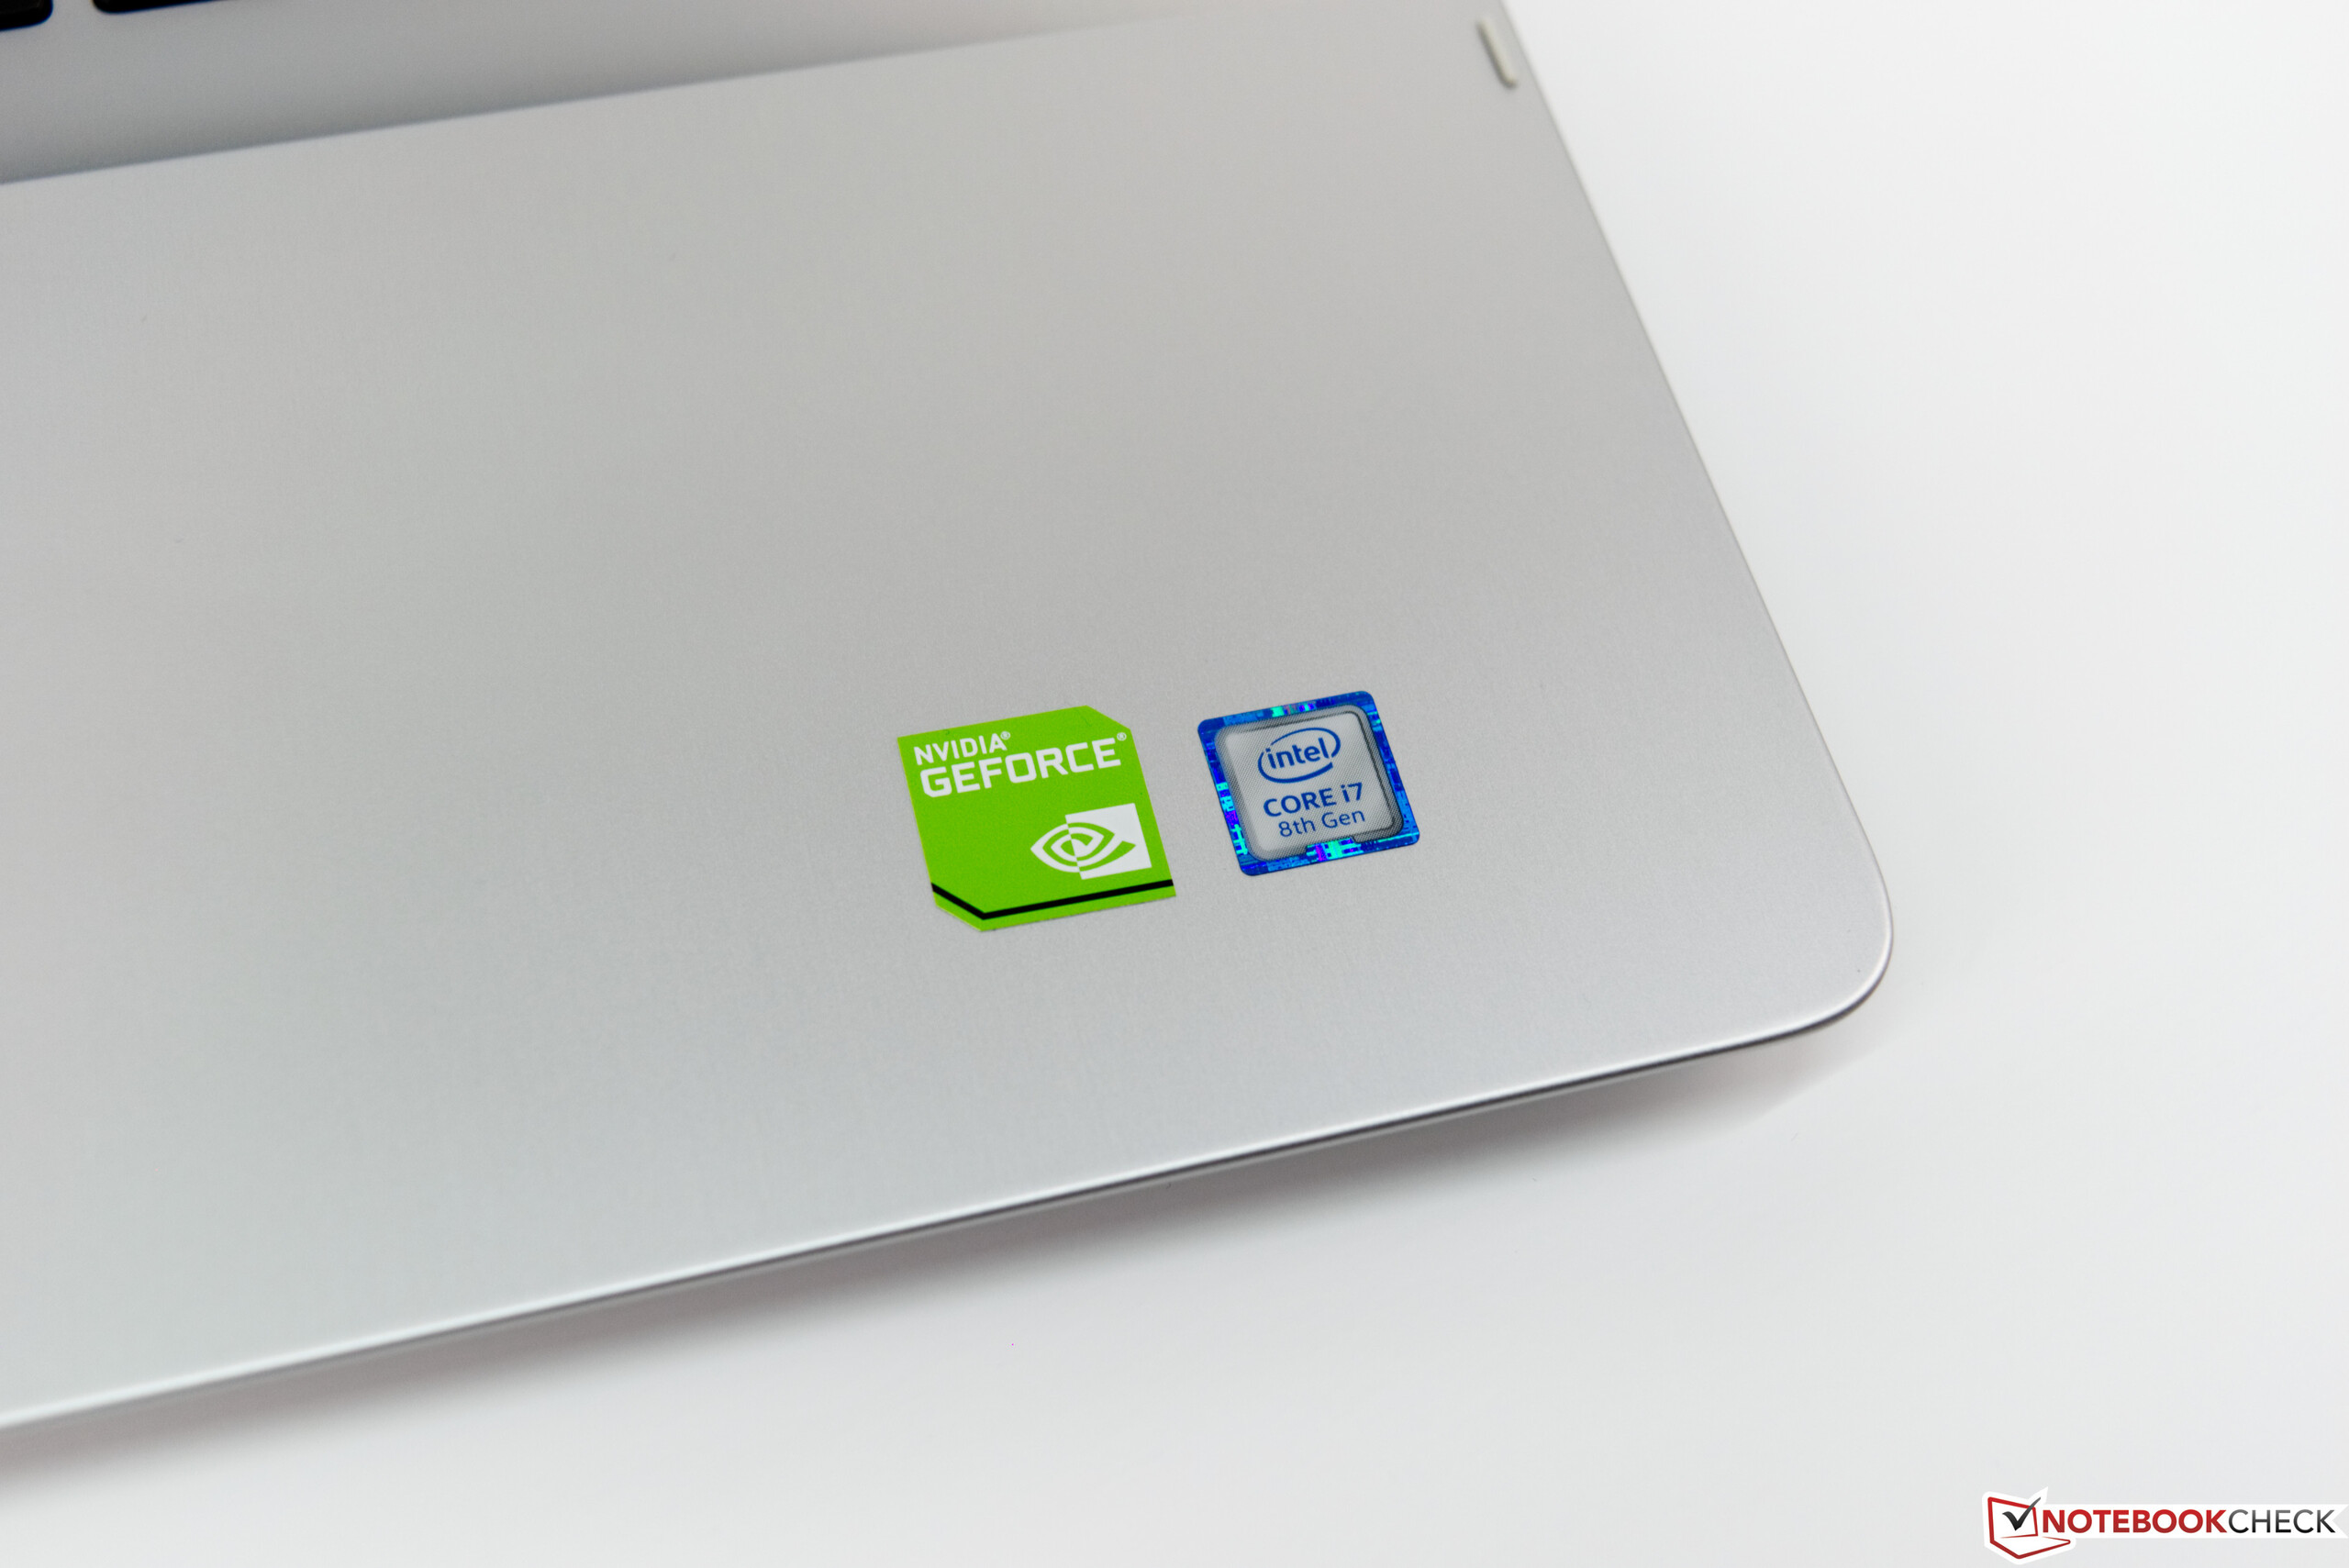
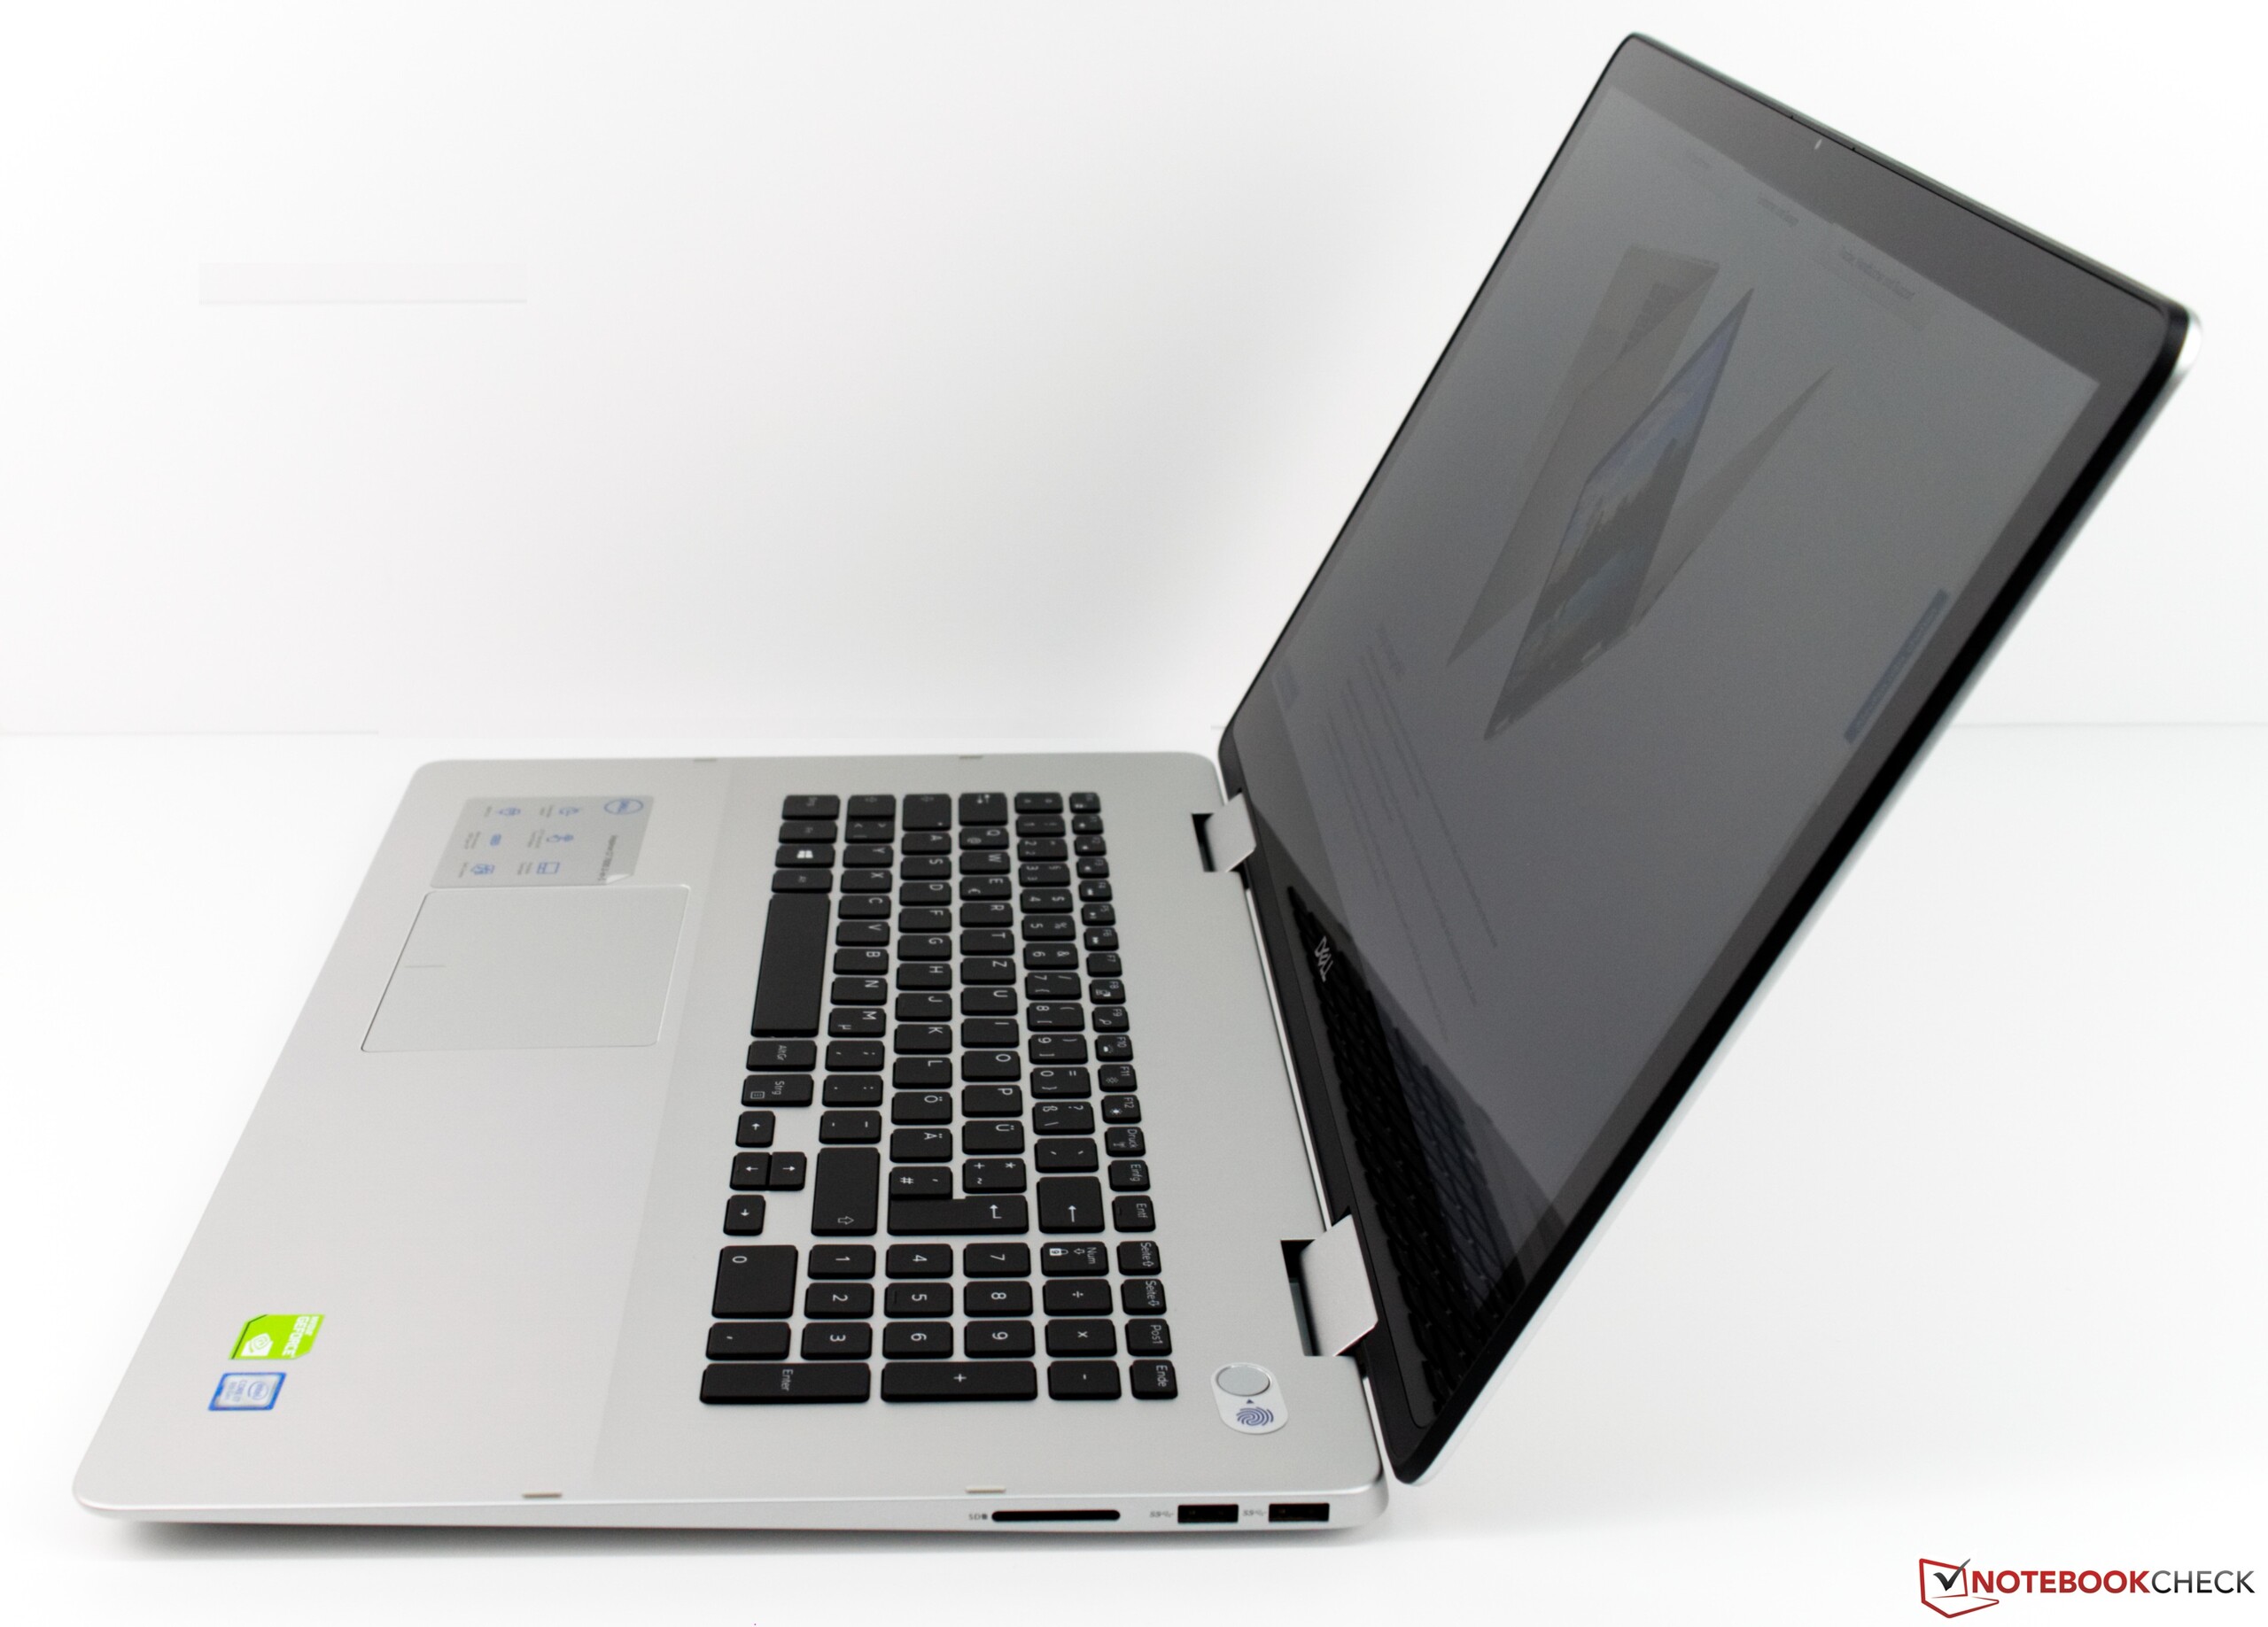
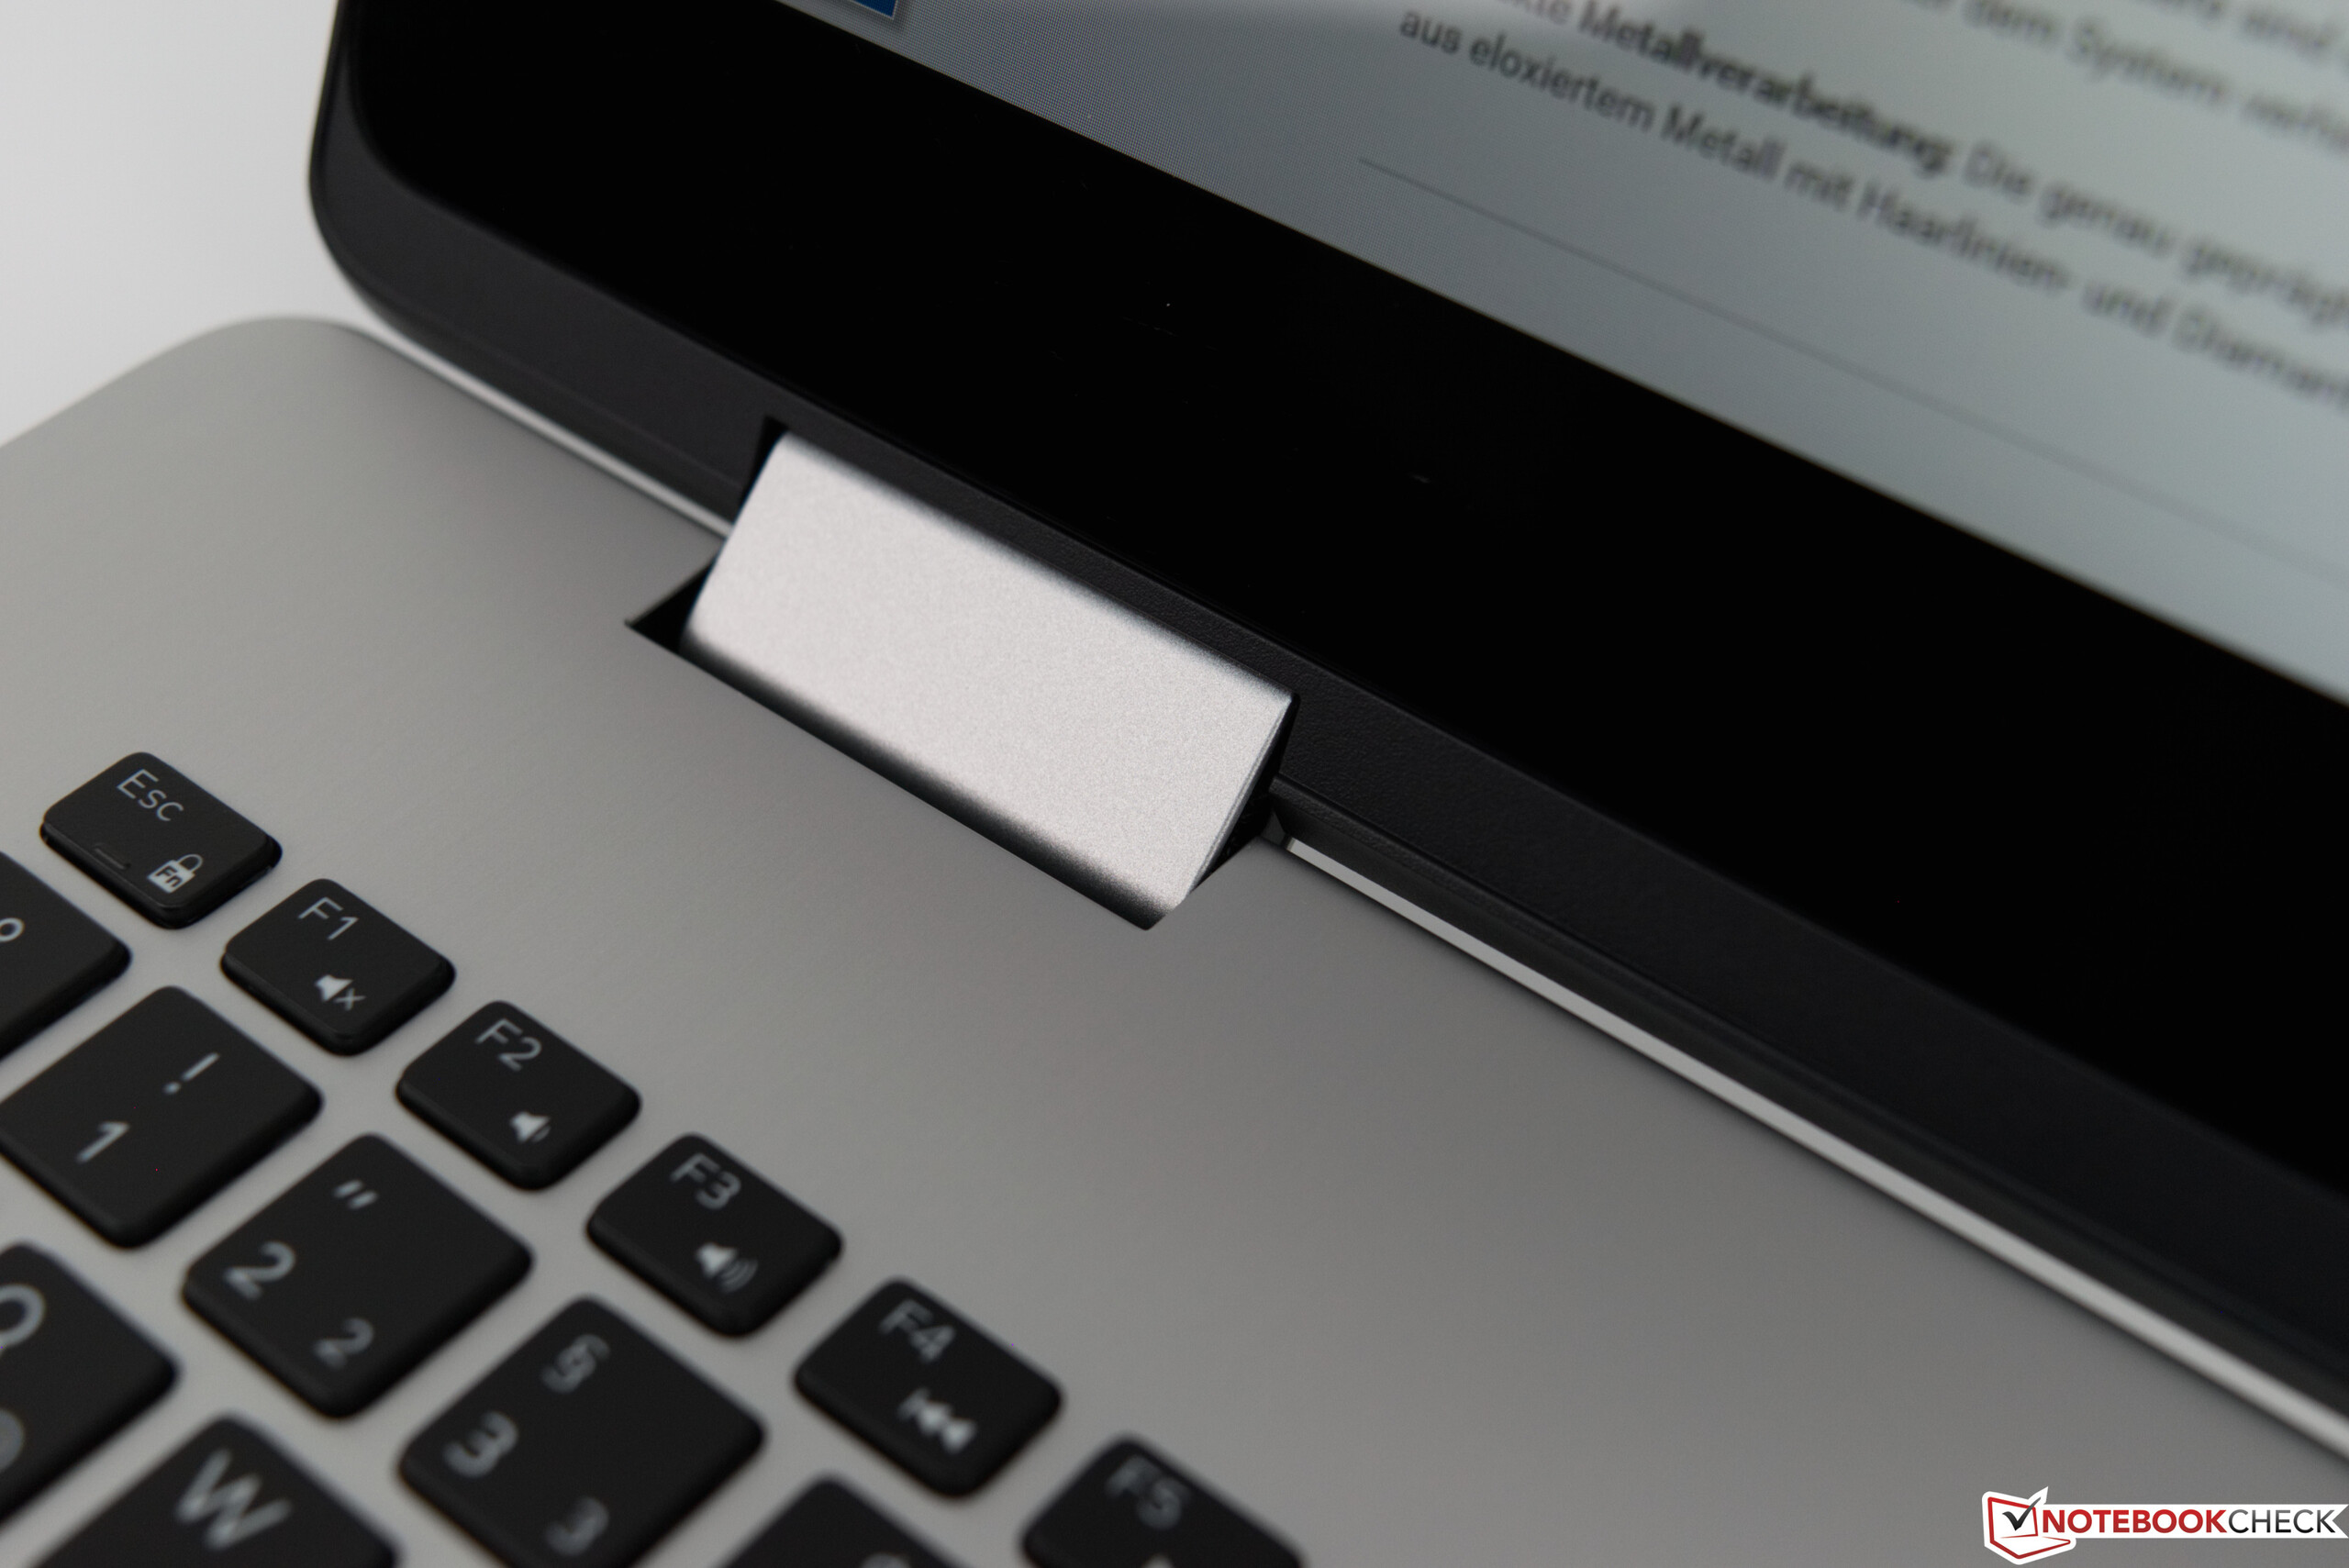
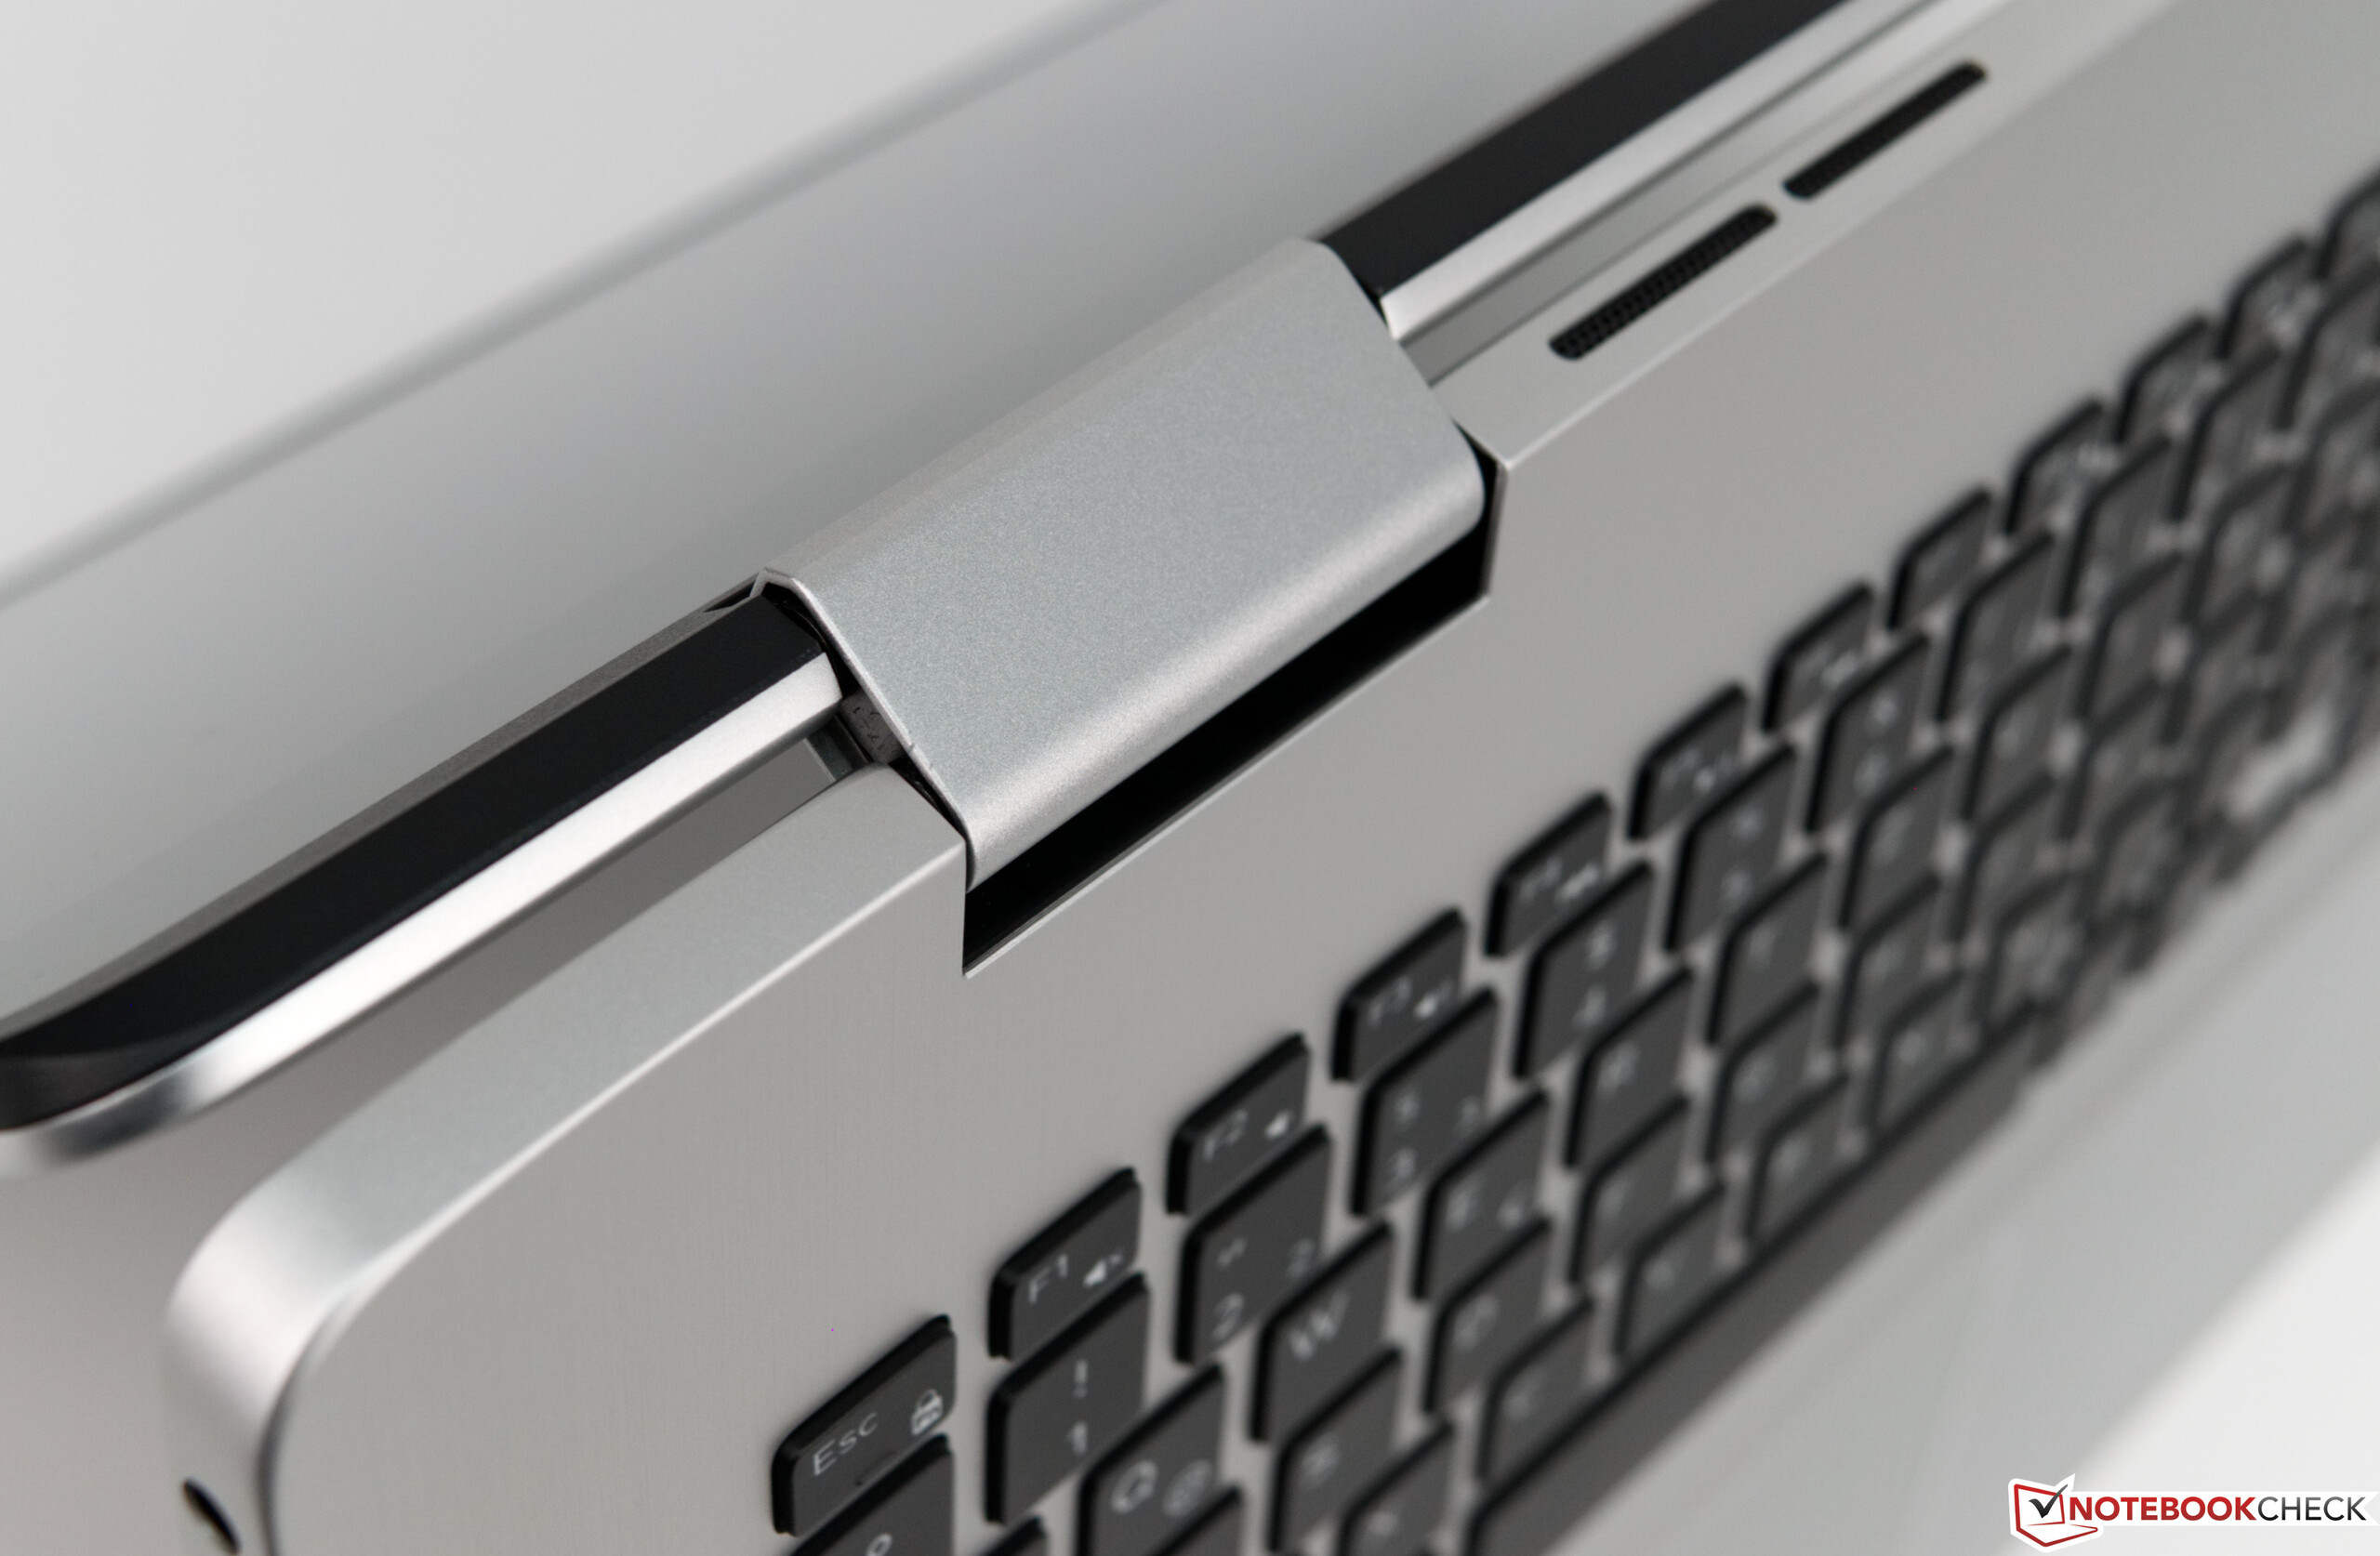
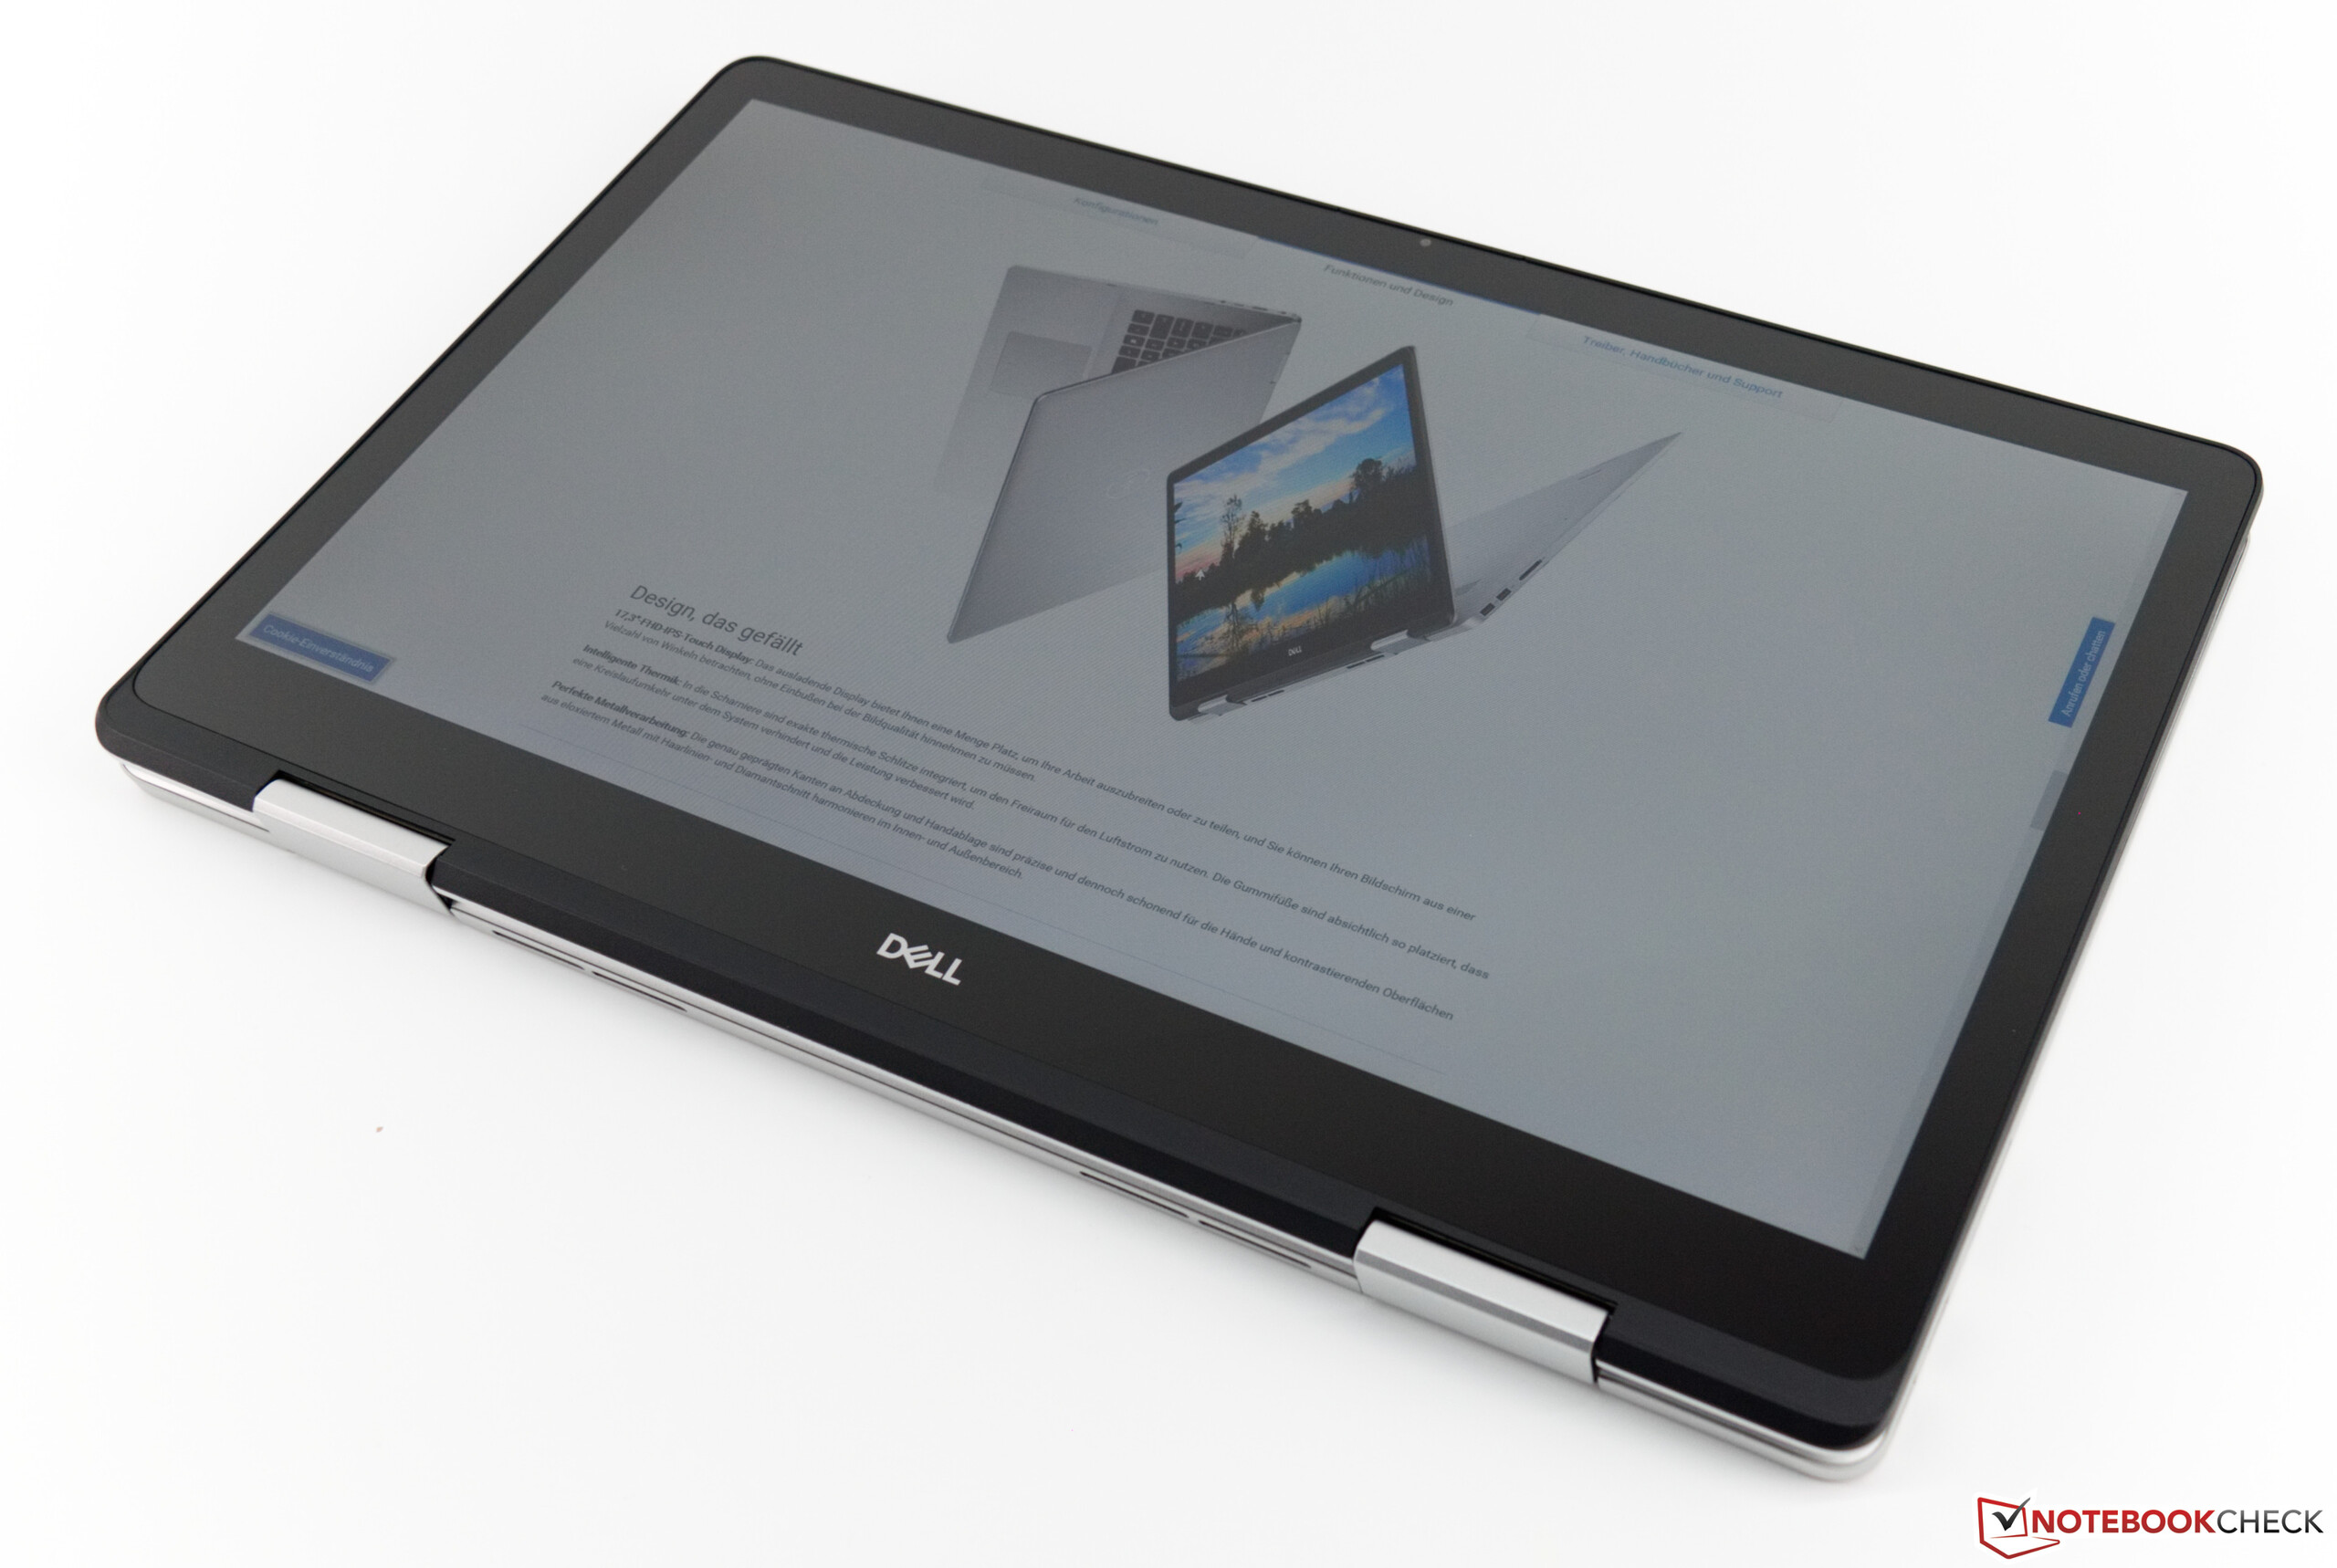
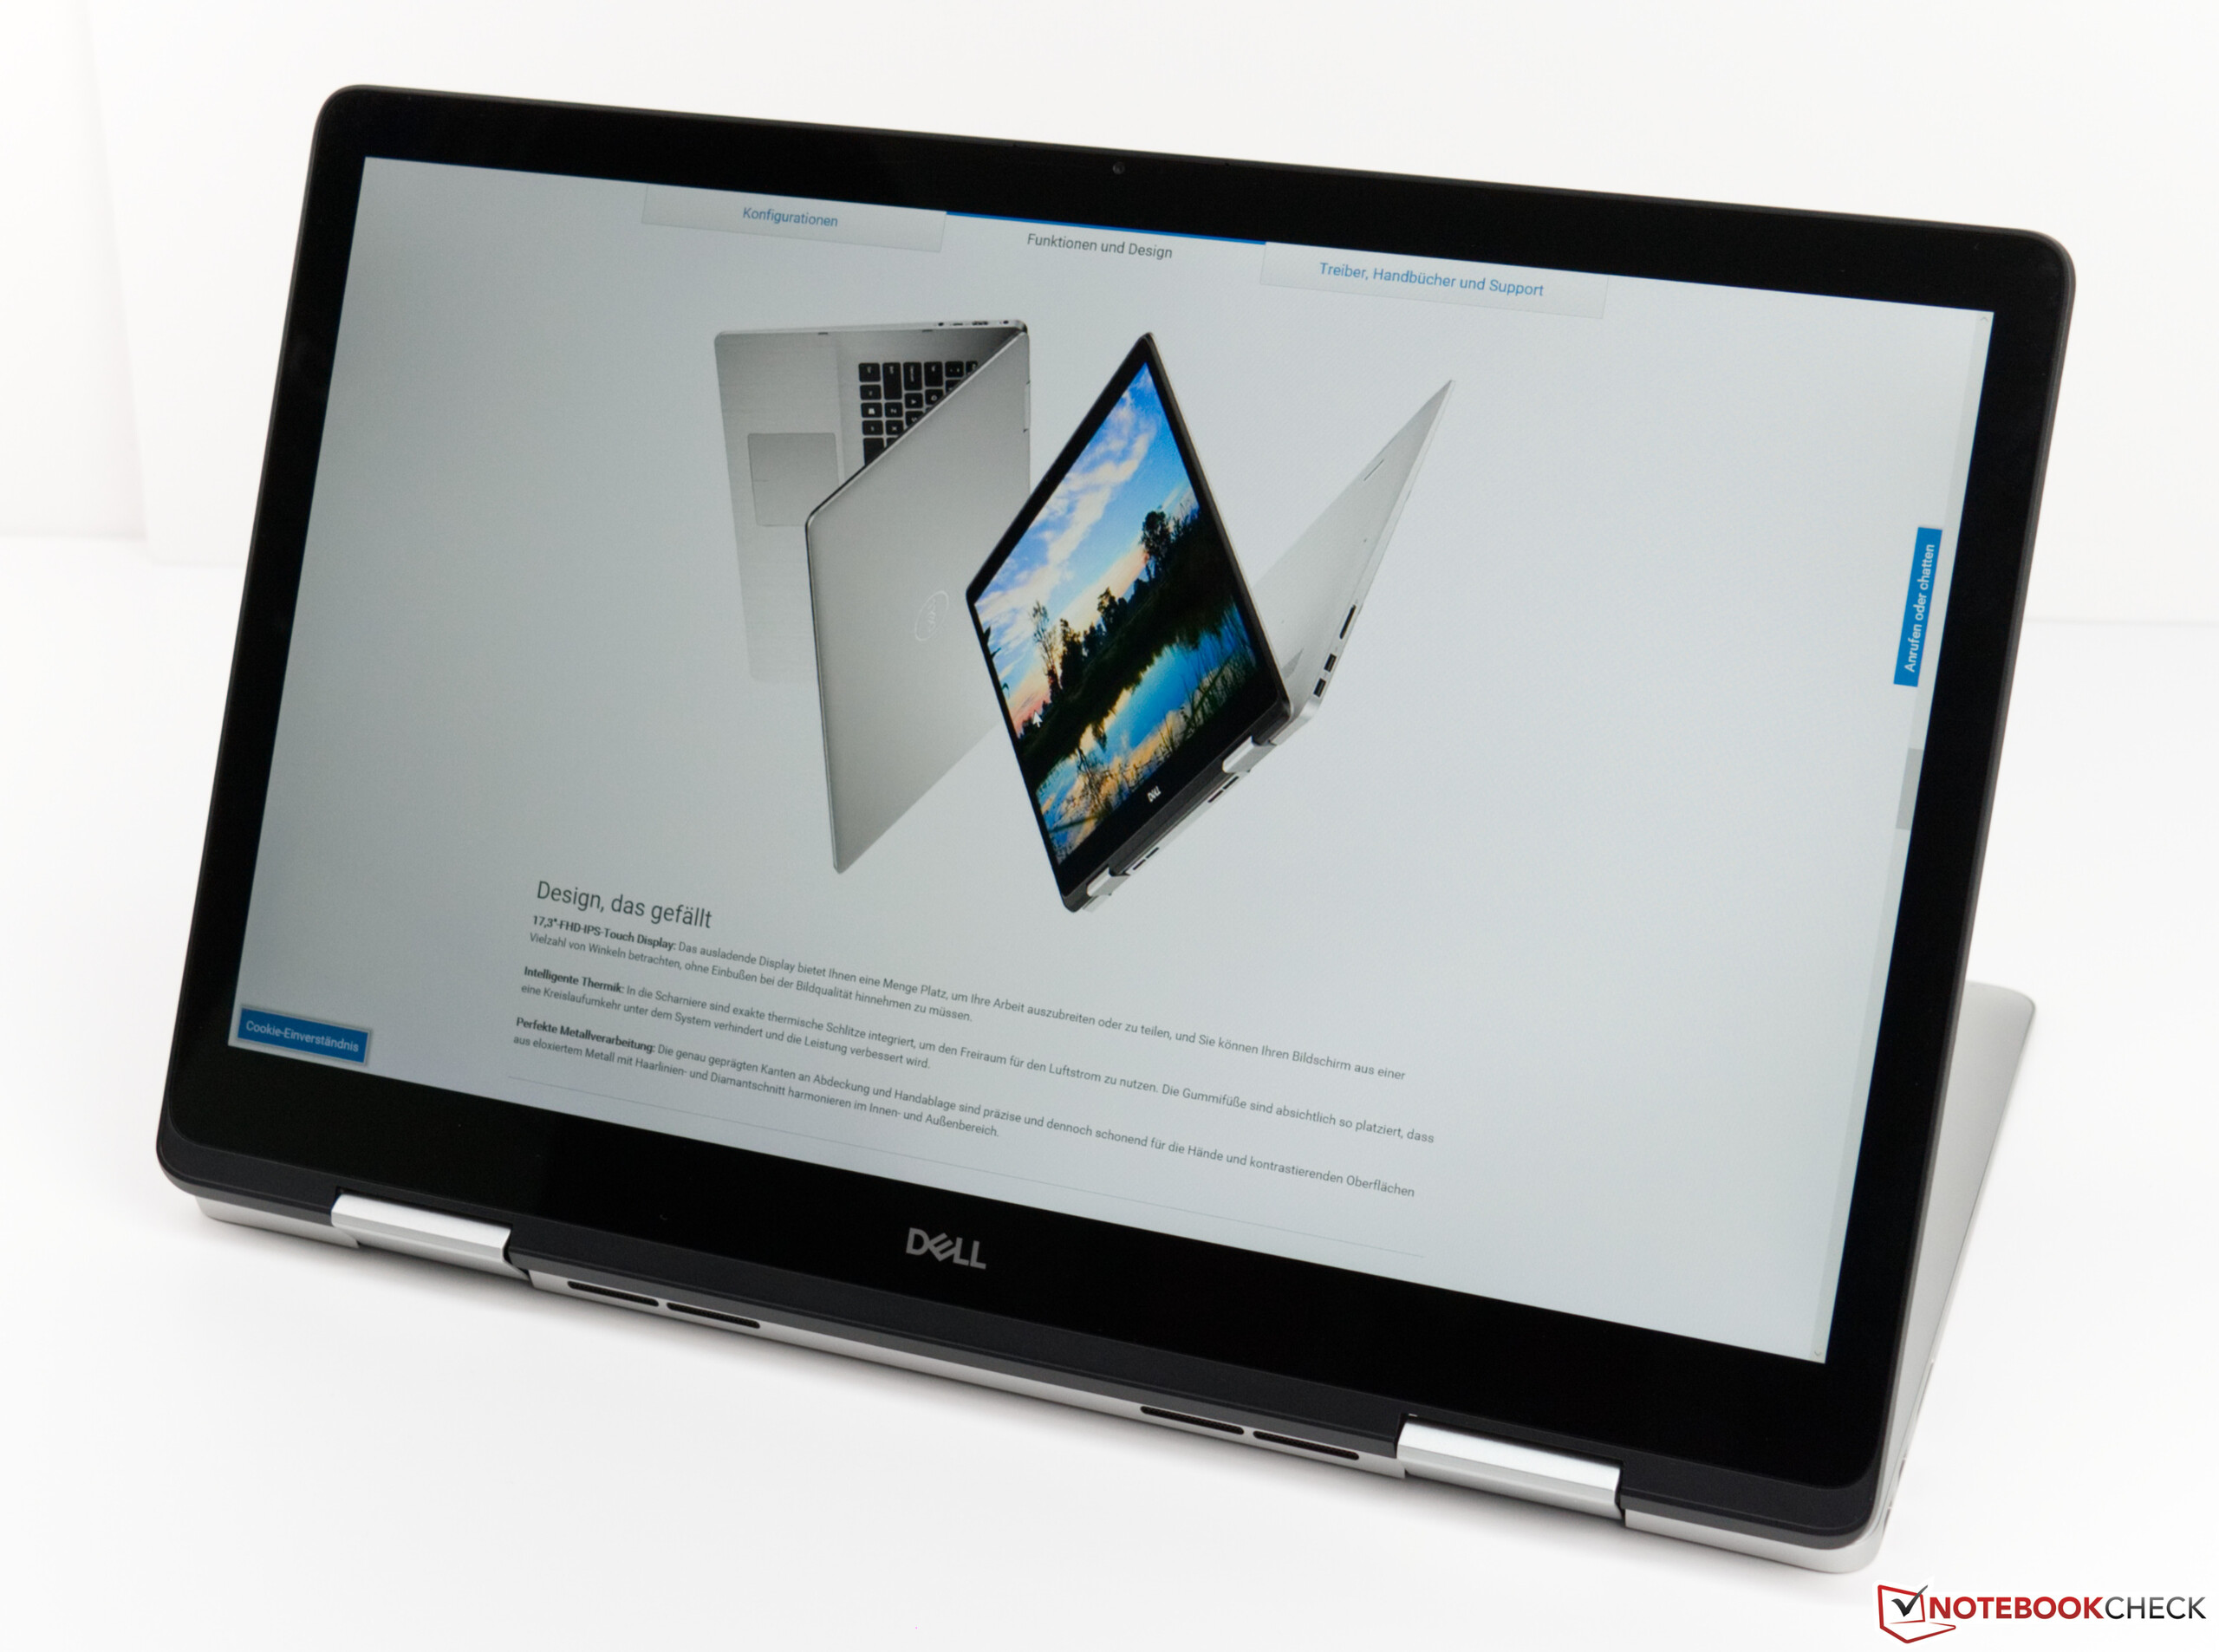
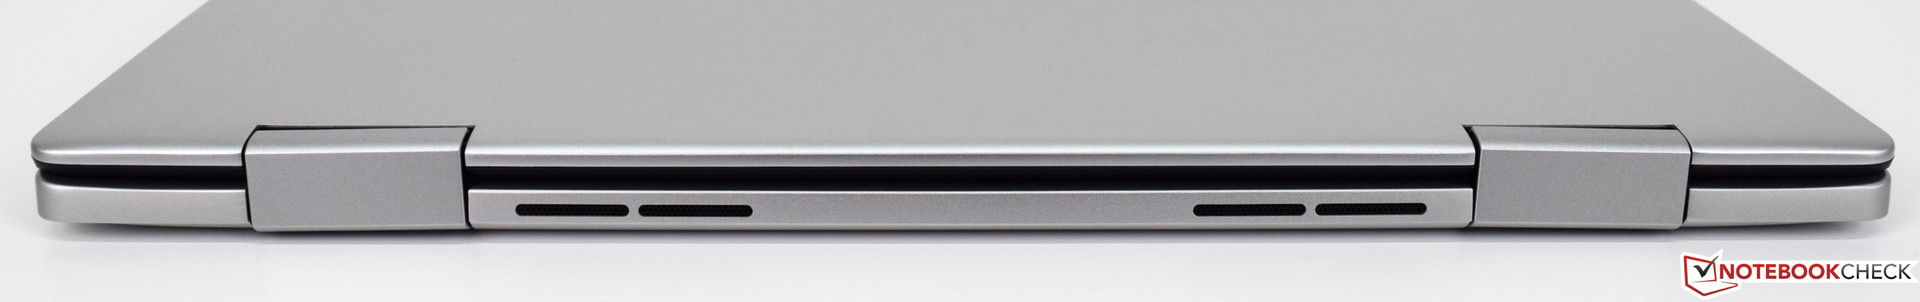
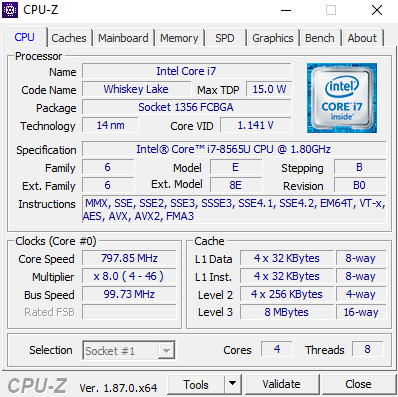
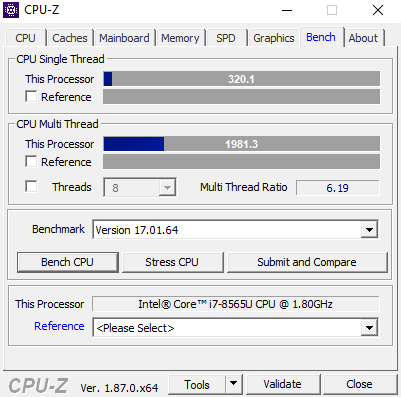
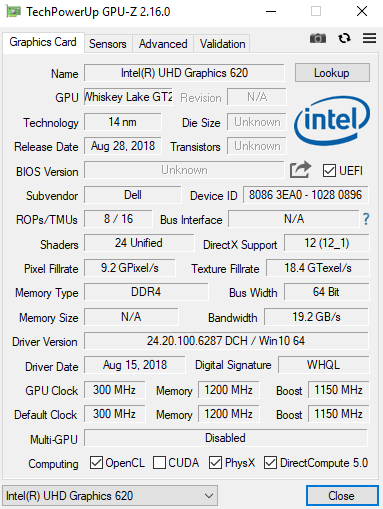
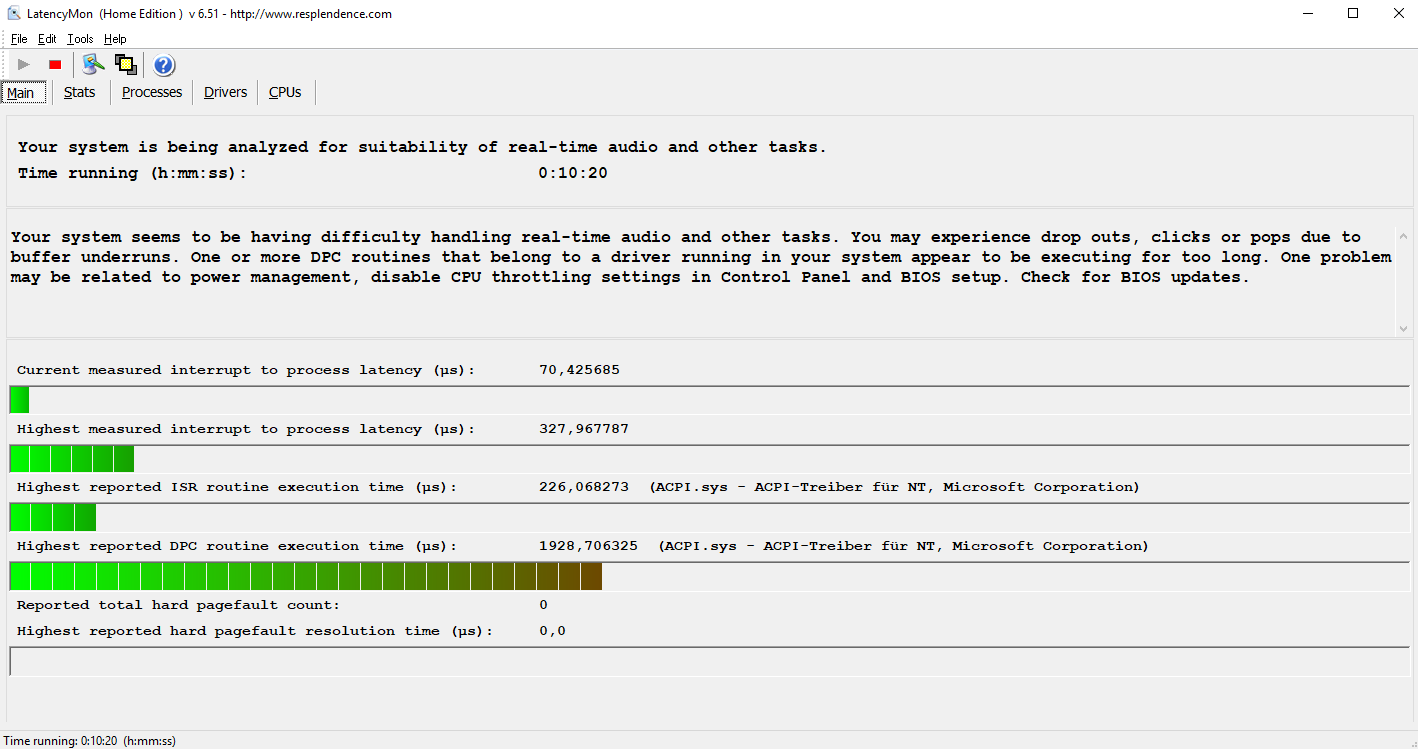
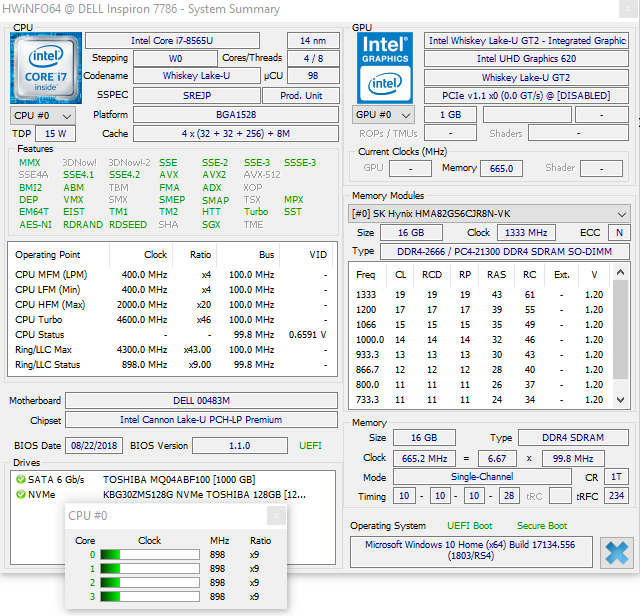
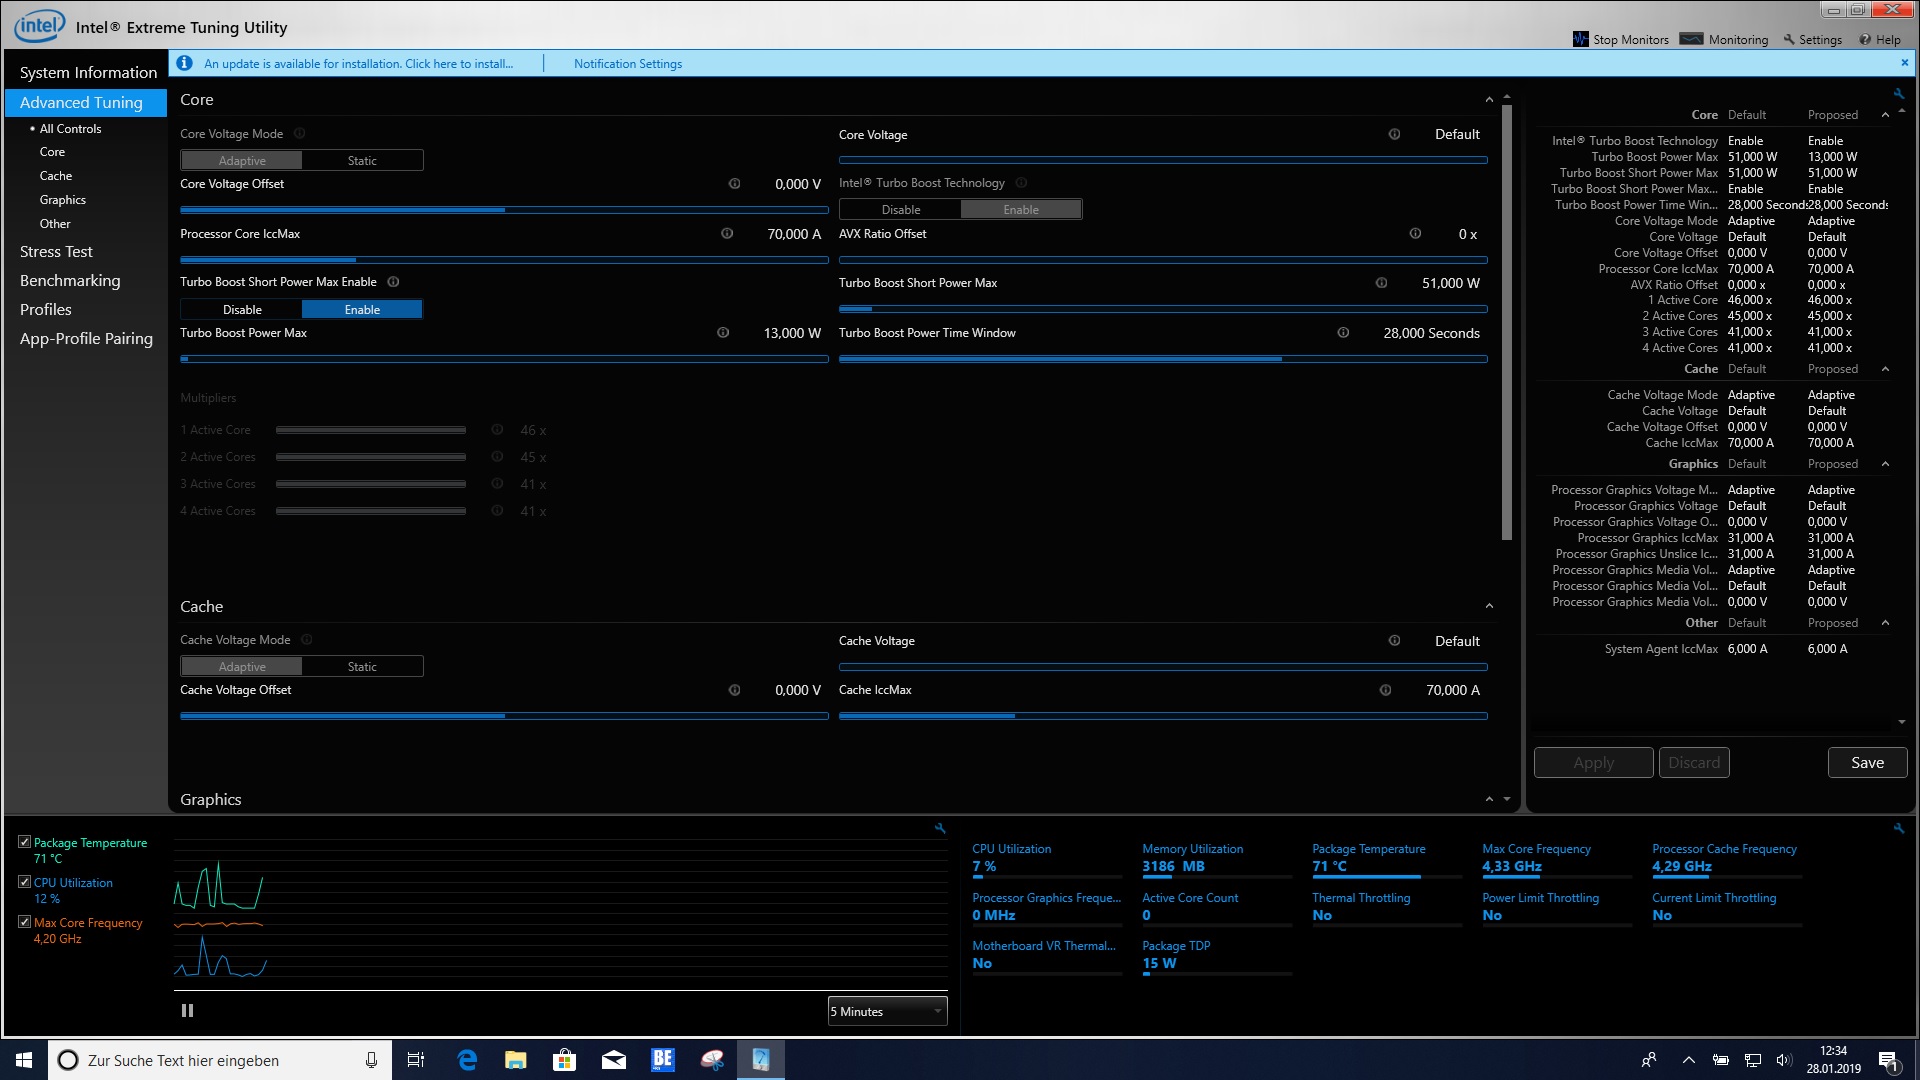
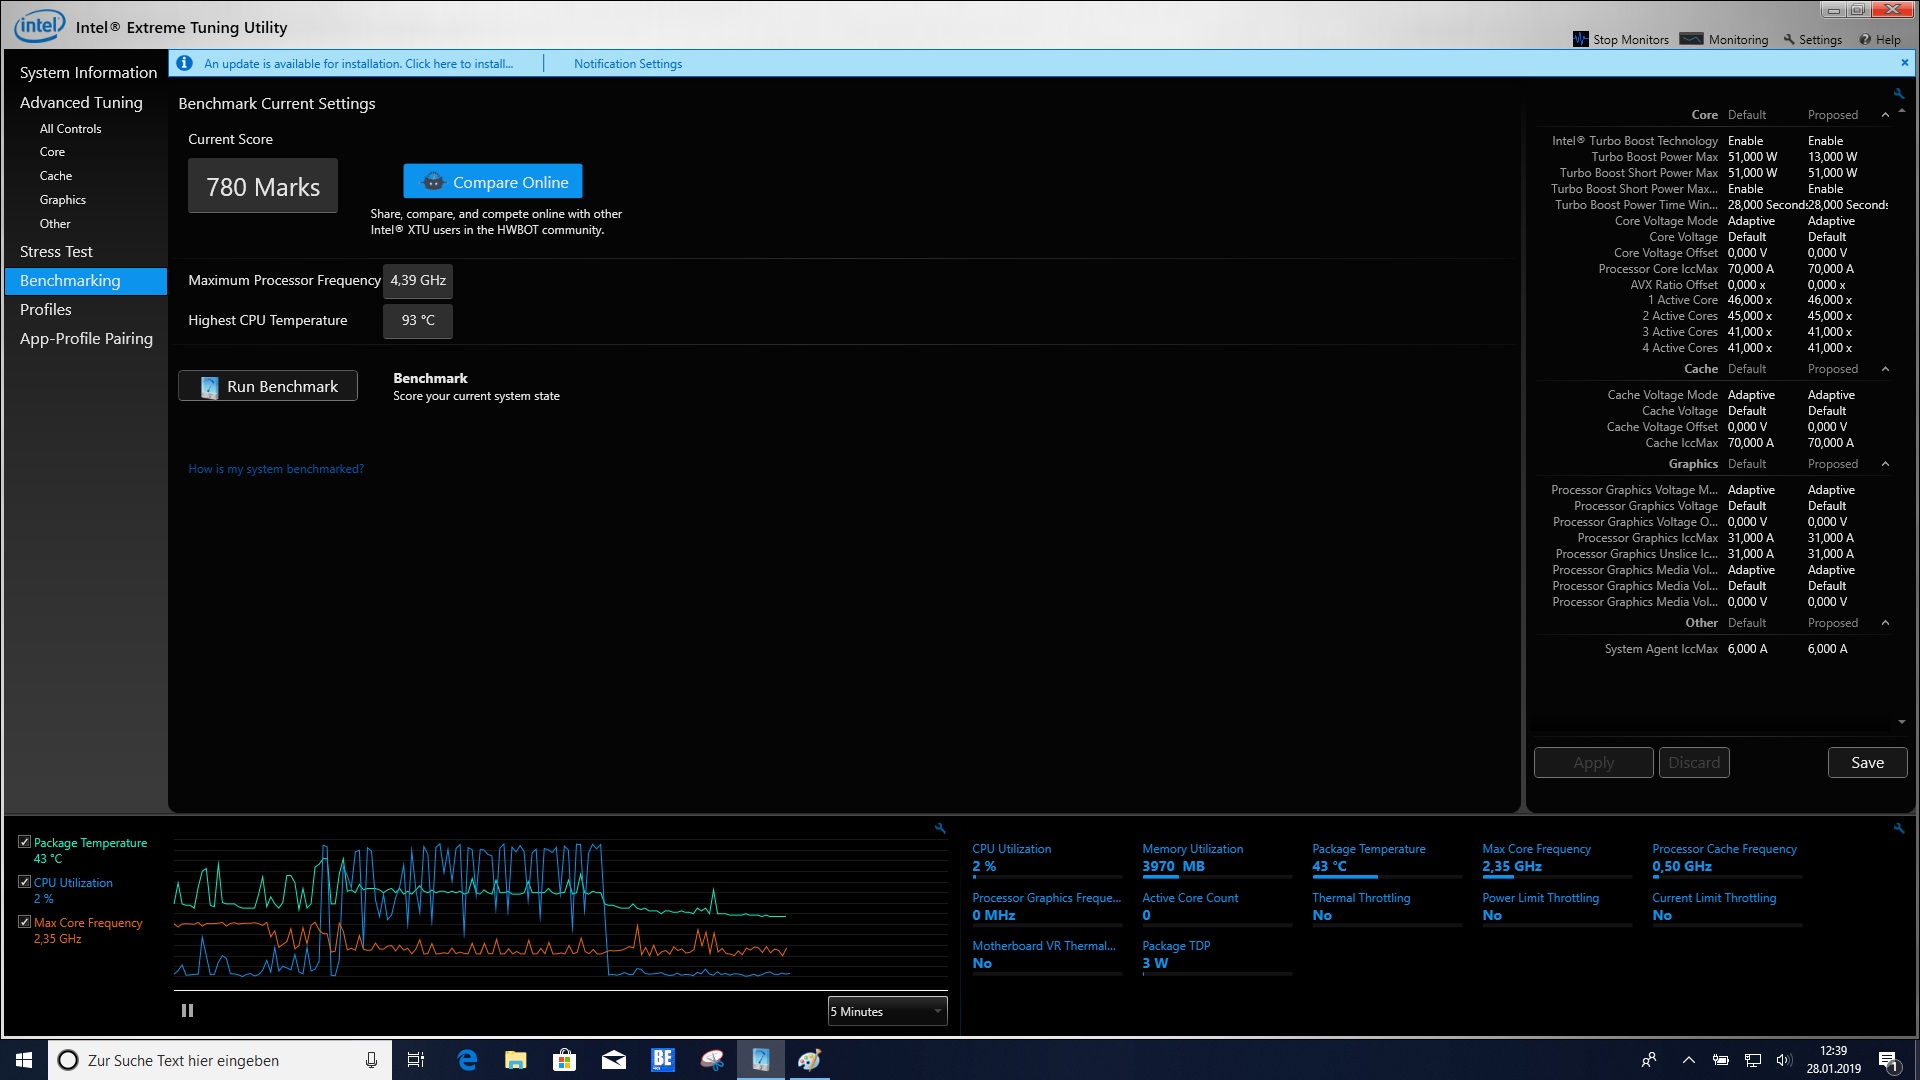
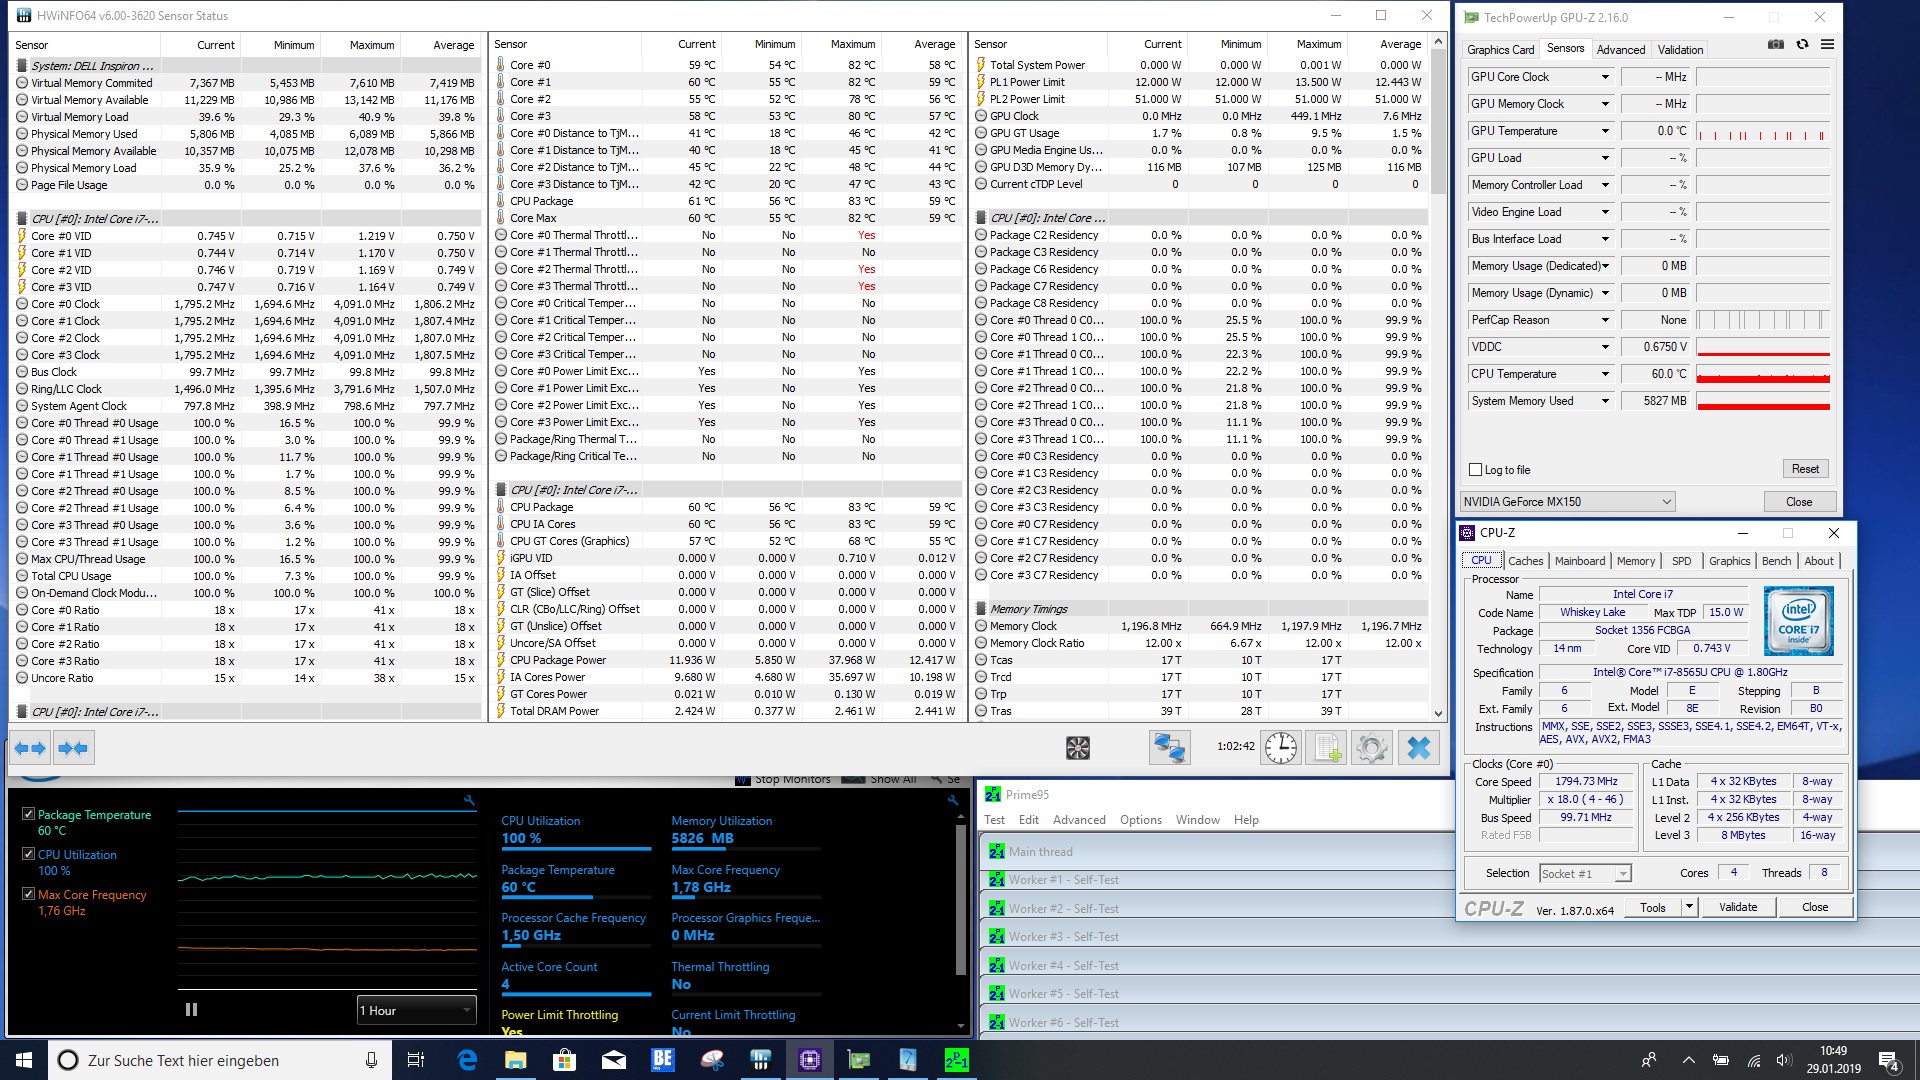
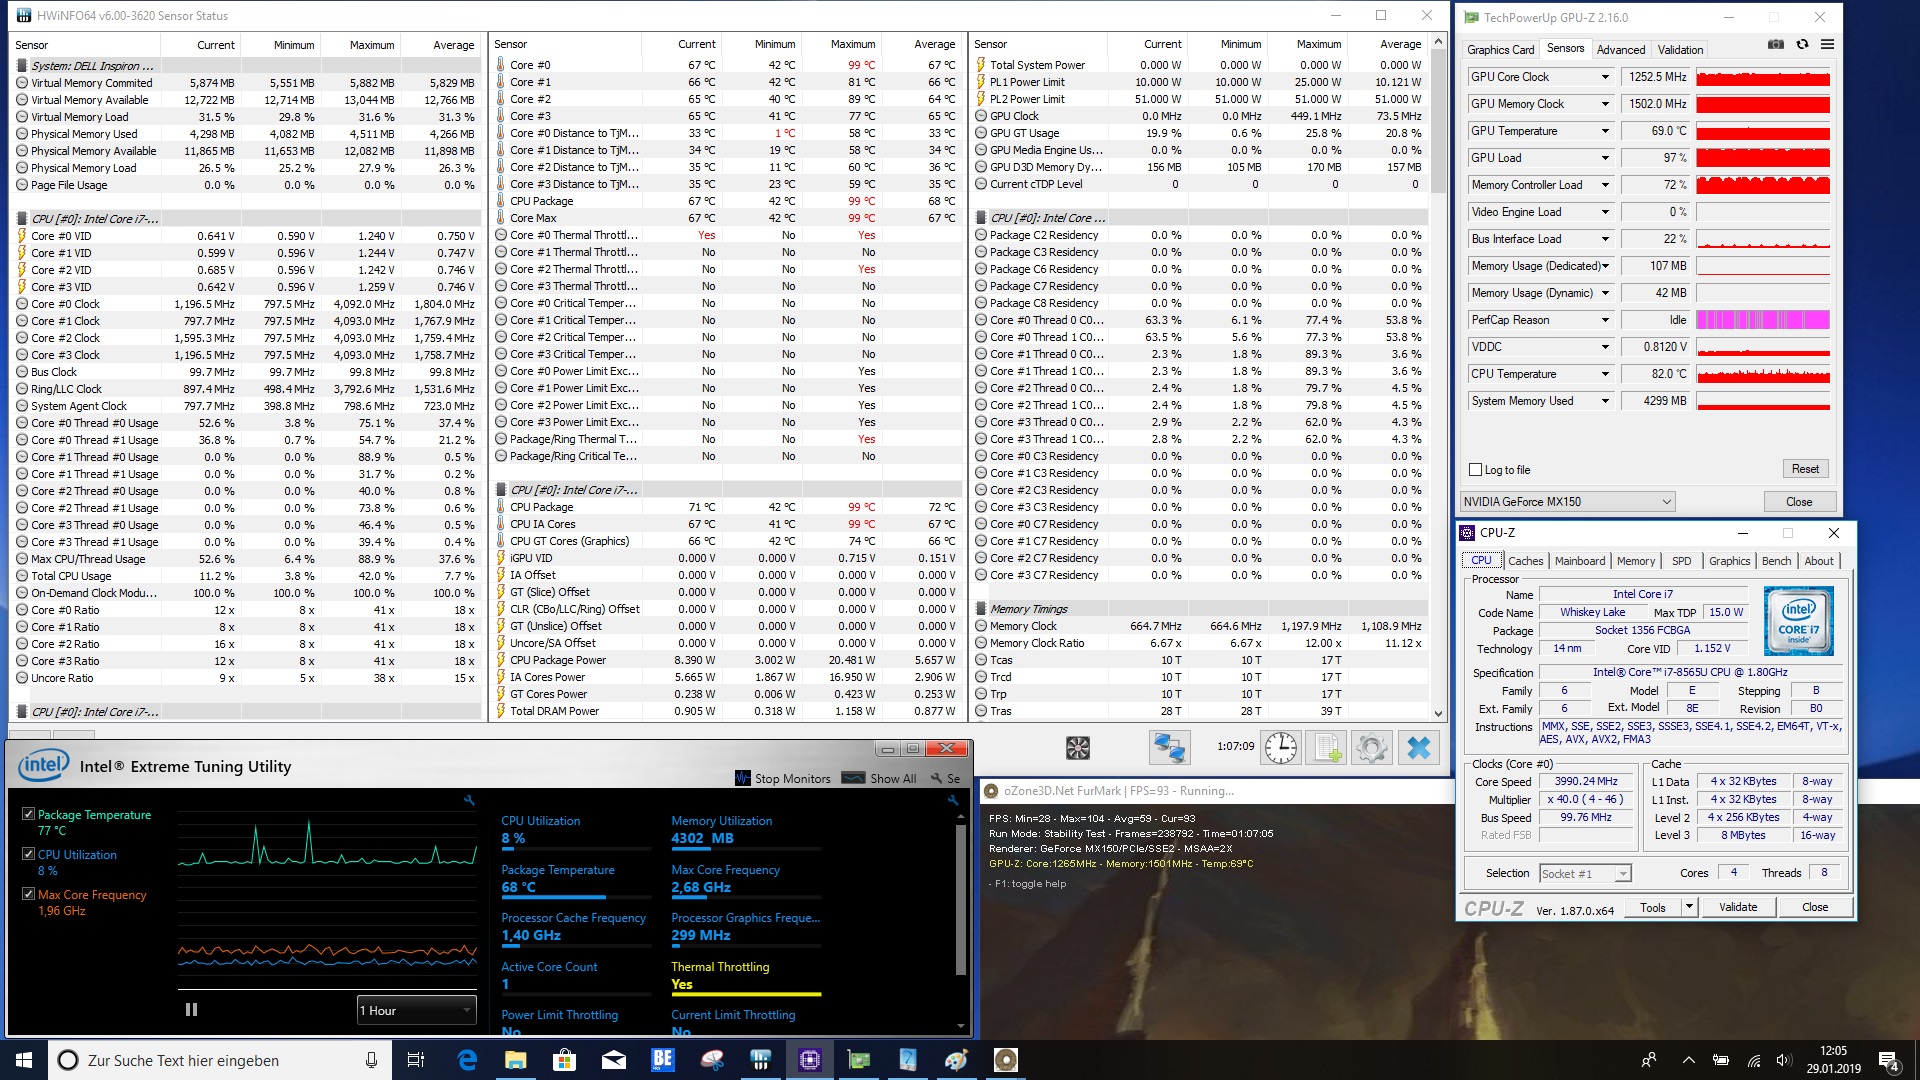
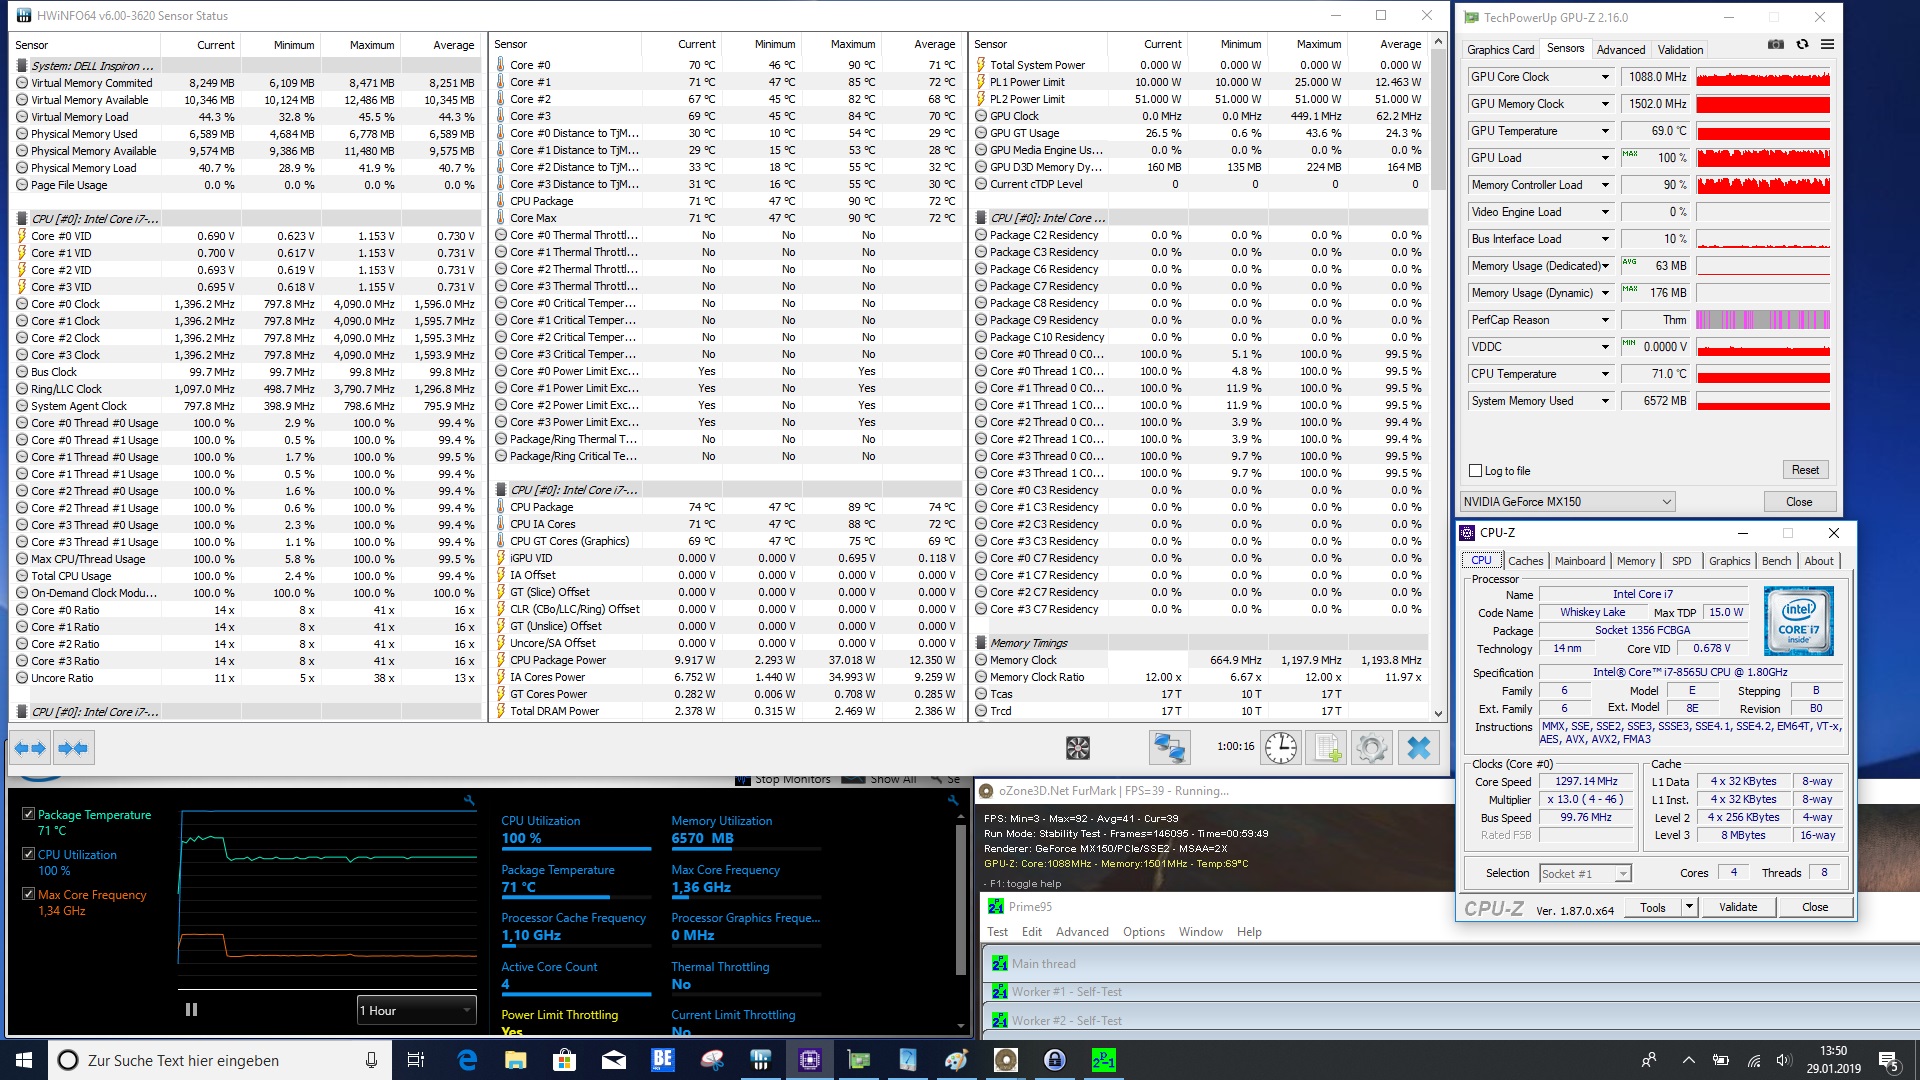
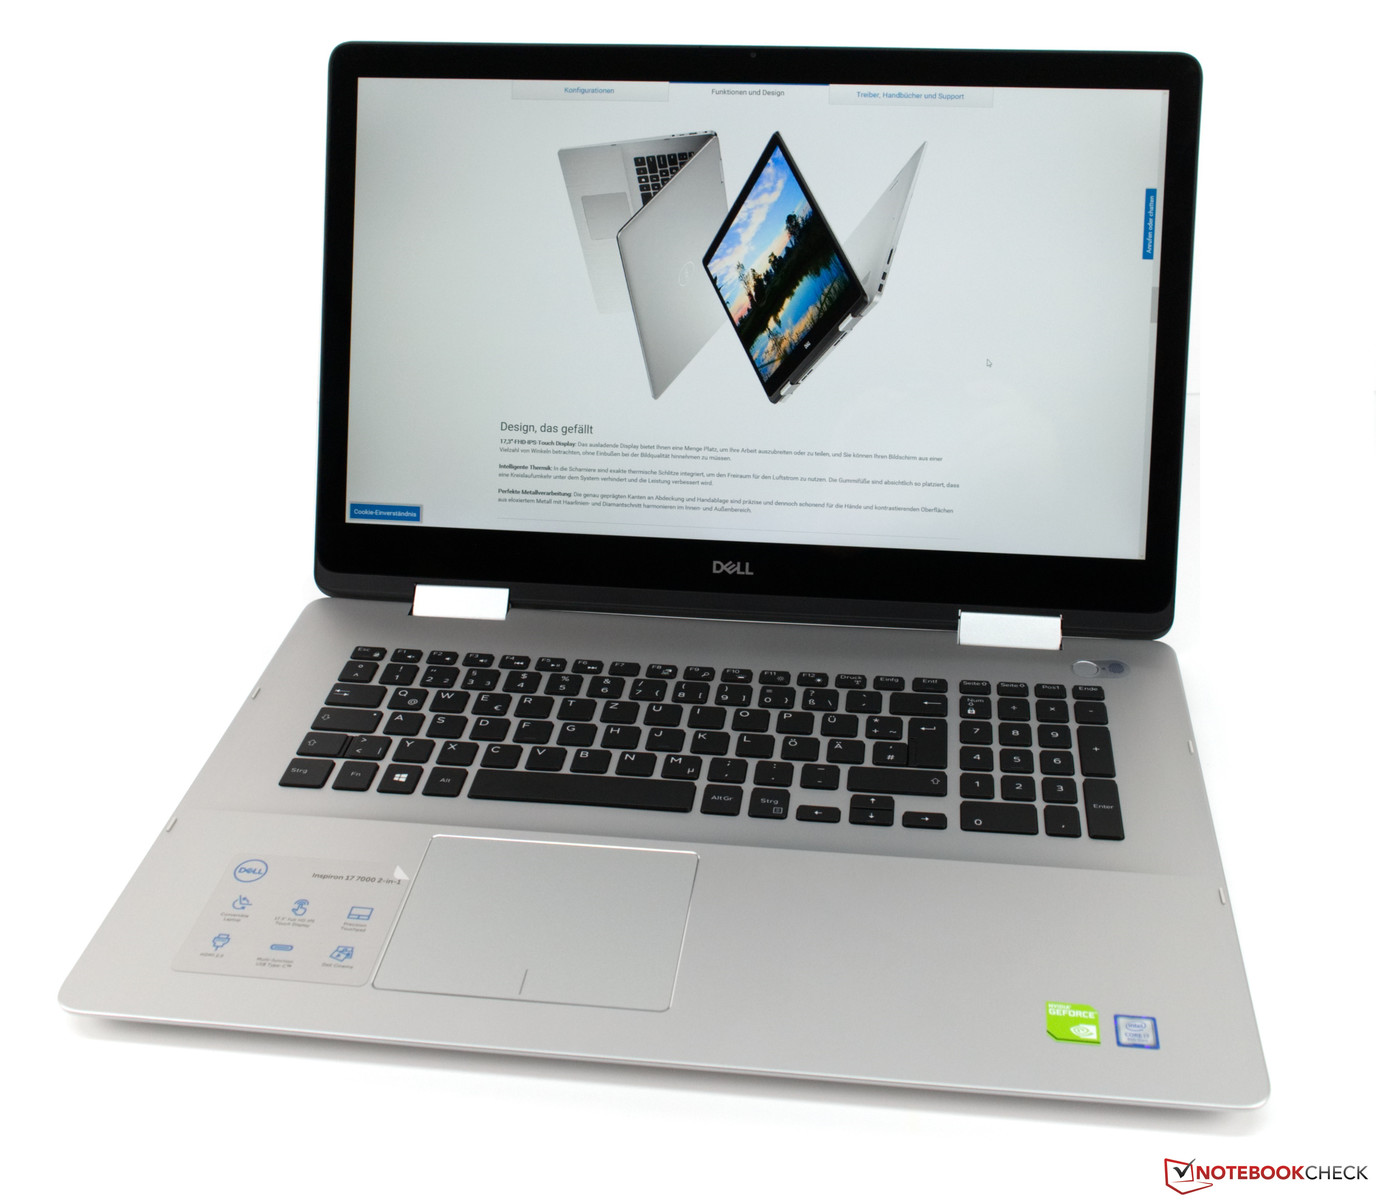
De Dell Inspiron 17-7786 blijft als 17-inch convertible ongeëvenaard, als je de directe voorganger buiten beschouwing laat. Met de nieuwe gigantische convertible brengt Dell een opvolger uit voor de Dell Inspiron 17-7773. Op het eerste gezicht ziet het nieuwe 2-in-1 notebook er niet heel anders uit, omdat de visuele verschillen pas opvallen als je beter kijkt. En je kunt discussiëren of dit logische wijzigingen zijn of niet. De belangrijkere wijzigingen bevinden zich onder de motorkap, waar de Kaby Lake processor vervangen is door de nieuwe Intel Core i7-8565U (Whiskey Lake). Deze biedt een aanzienlijk hogere Turbo Boost kloksnelheid en zou dan ook beter moeten presteren. In onze tests kon de maximale snelheid echter niet volgehouden worden en werd ons testmodel zelfs verslagen door zijn voorganger in de Cinebench-R15 multi-loop test. Over het algemeen zijn we echter tevreden met de CPU van deze notebook.
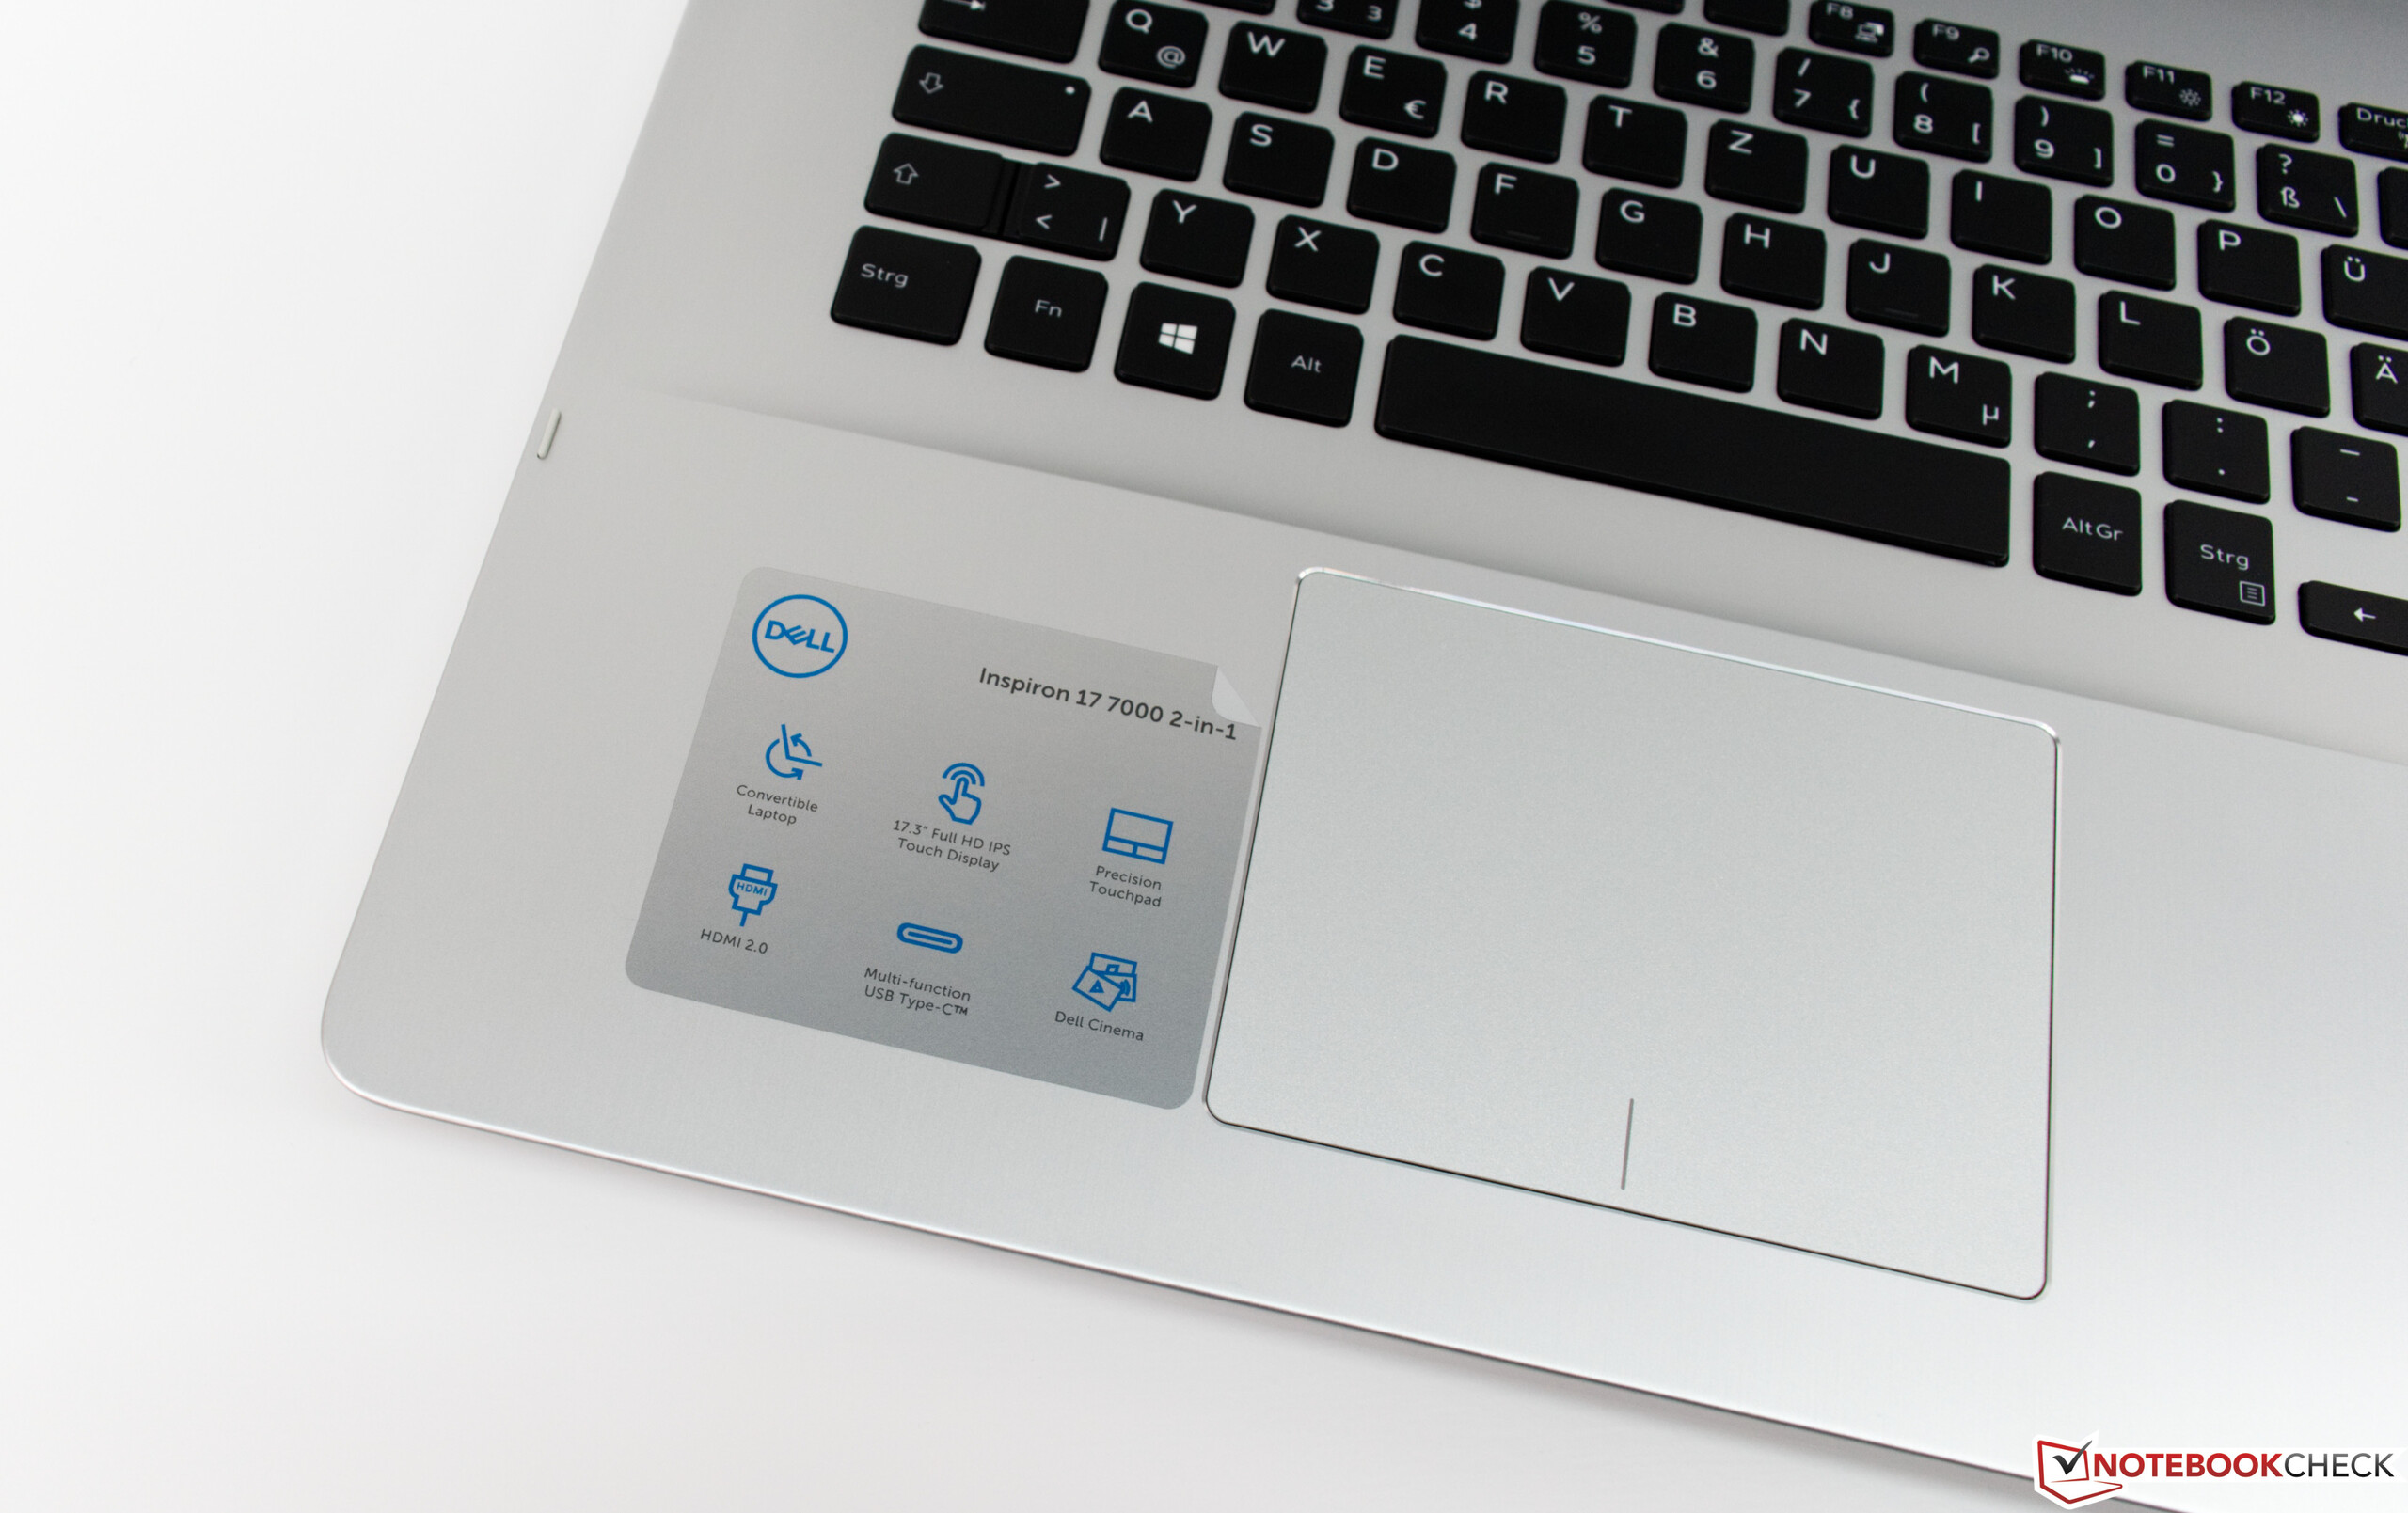
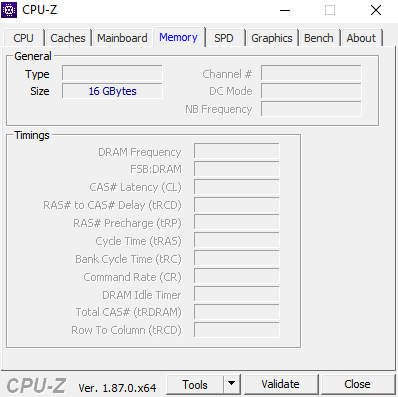
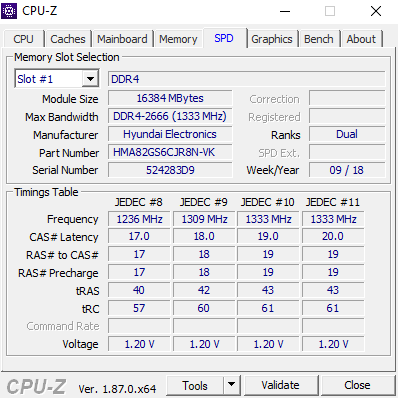
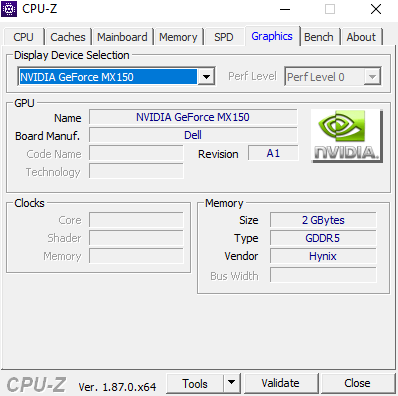
Helaas biedt Dell het notebook enkel aan met deze CPU/GPU configuratie. Het is niet duidelijk waarom er geen optie is voor een i5-processor gebaseerd op Whiskey Lake. Kopers hebben enkel een keuze wat betreft de opslag. We raden een combinatie aan van een SSD en HDD, zoals ook ons testmodel geconfigureerd was. Samen met het 16 GB RAM en 17-inch touchscherm zal dit kopers € 1328 kosten.
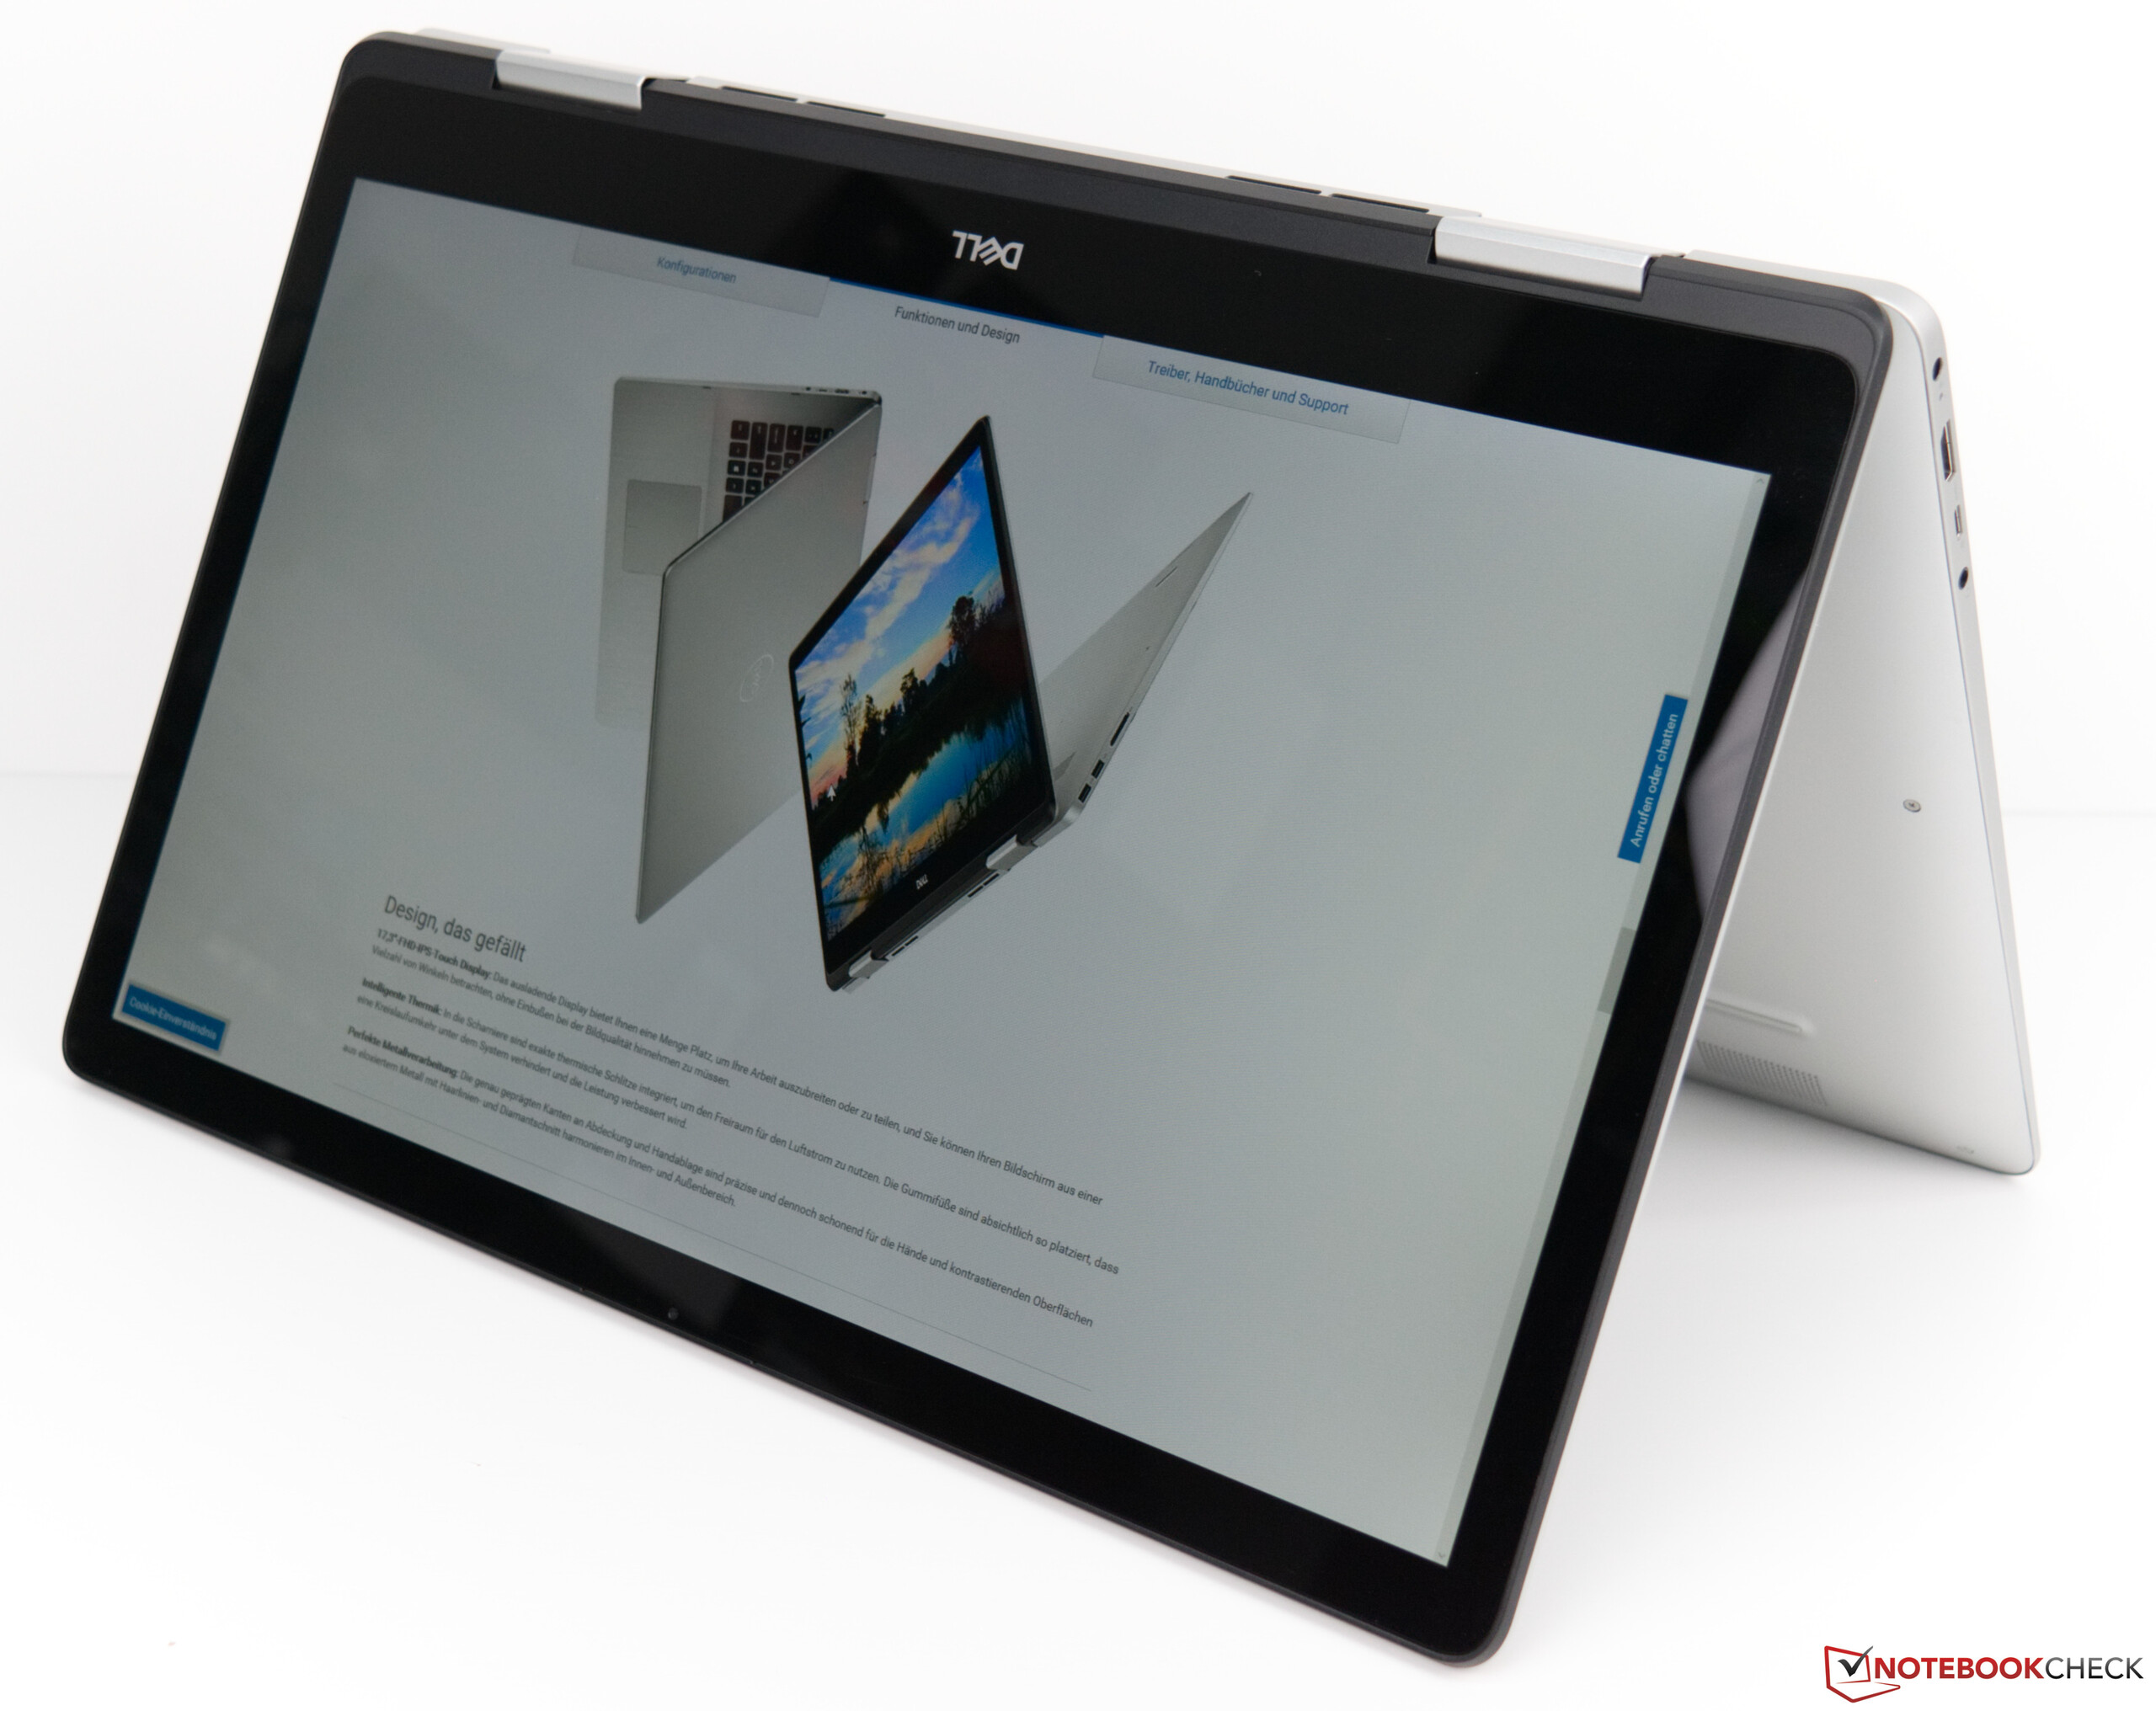
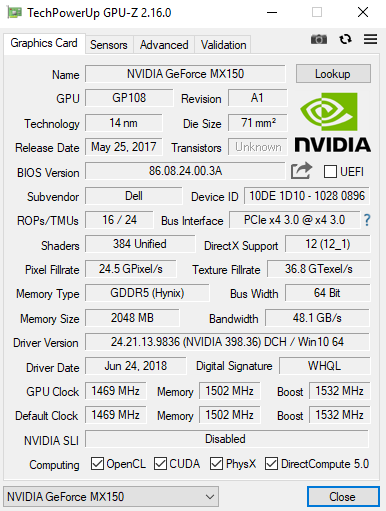
Een ieder die niet kan kiezen tussen een convertible en een multimedia notebook moet gewoon de Dell Inspiron 17-7786 aanschaffen. Deze 17-inch notebook combineert beide soorten klassen en de aparte GPU maakt het ook mogelijk om games te spelen.
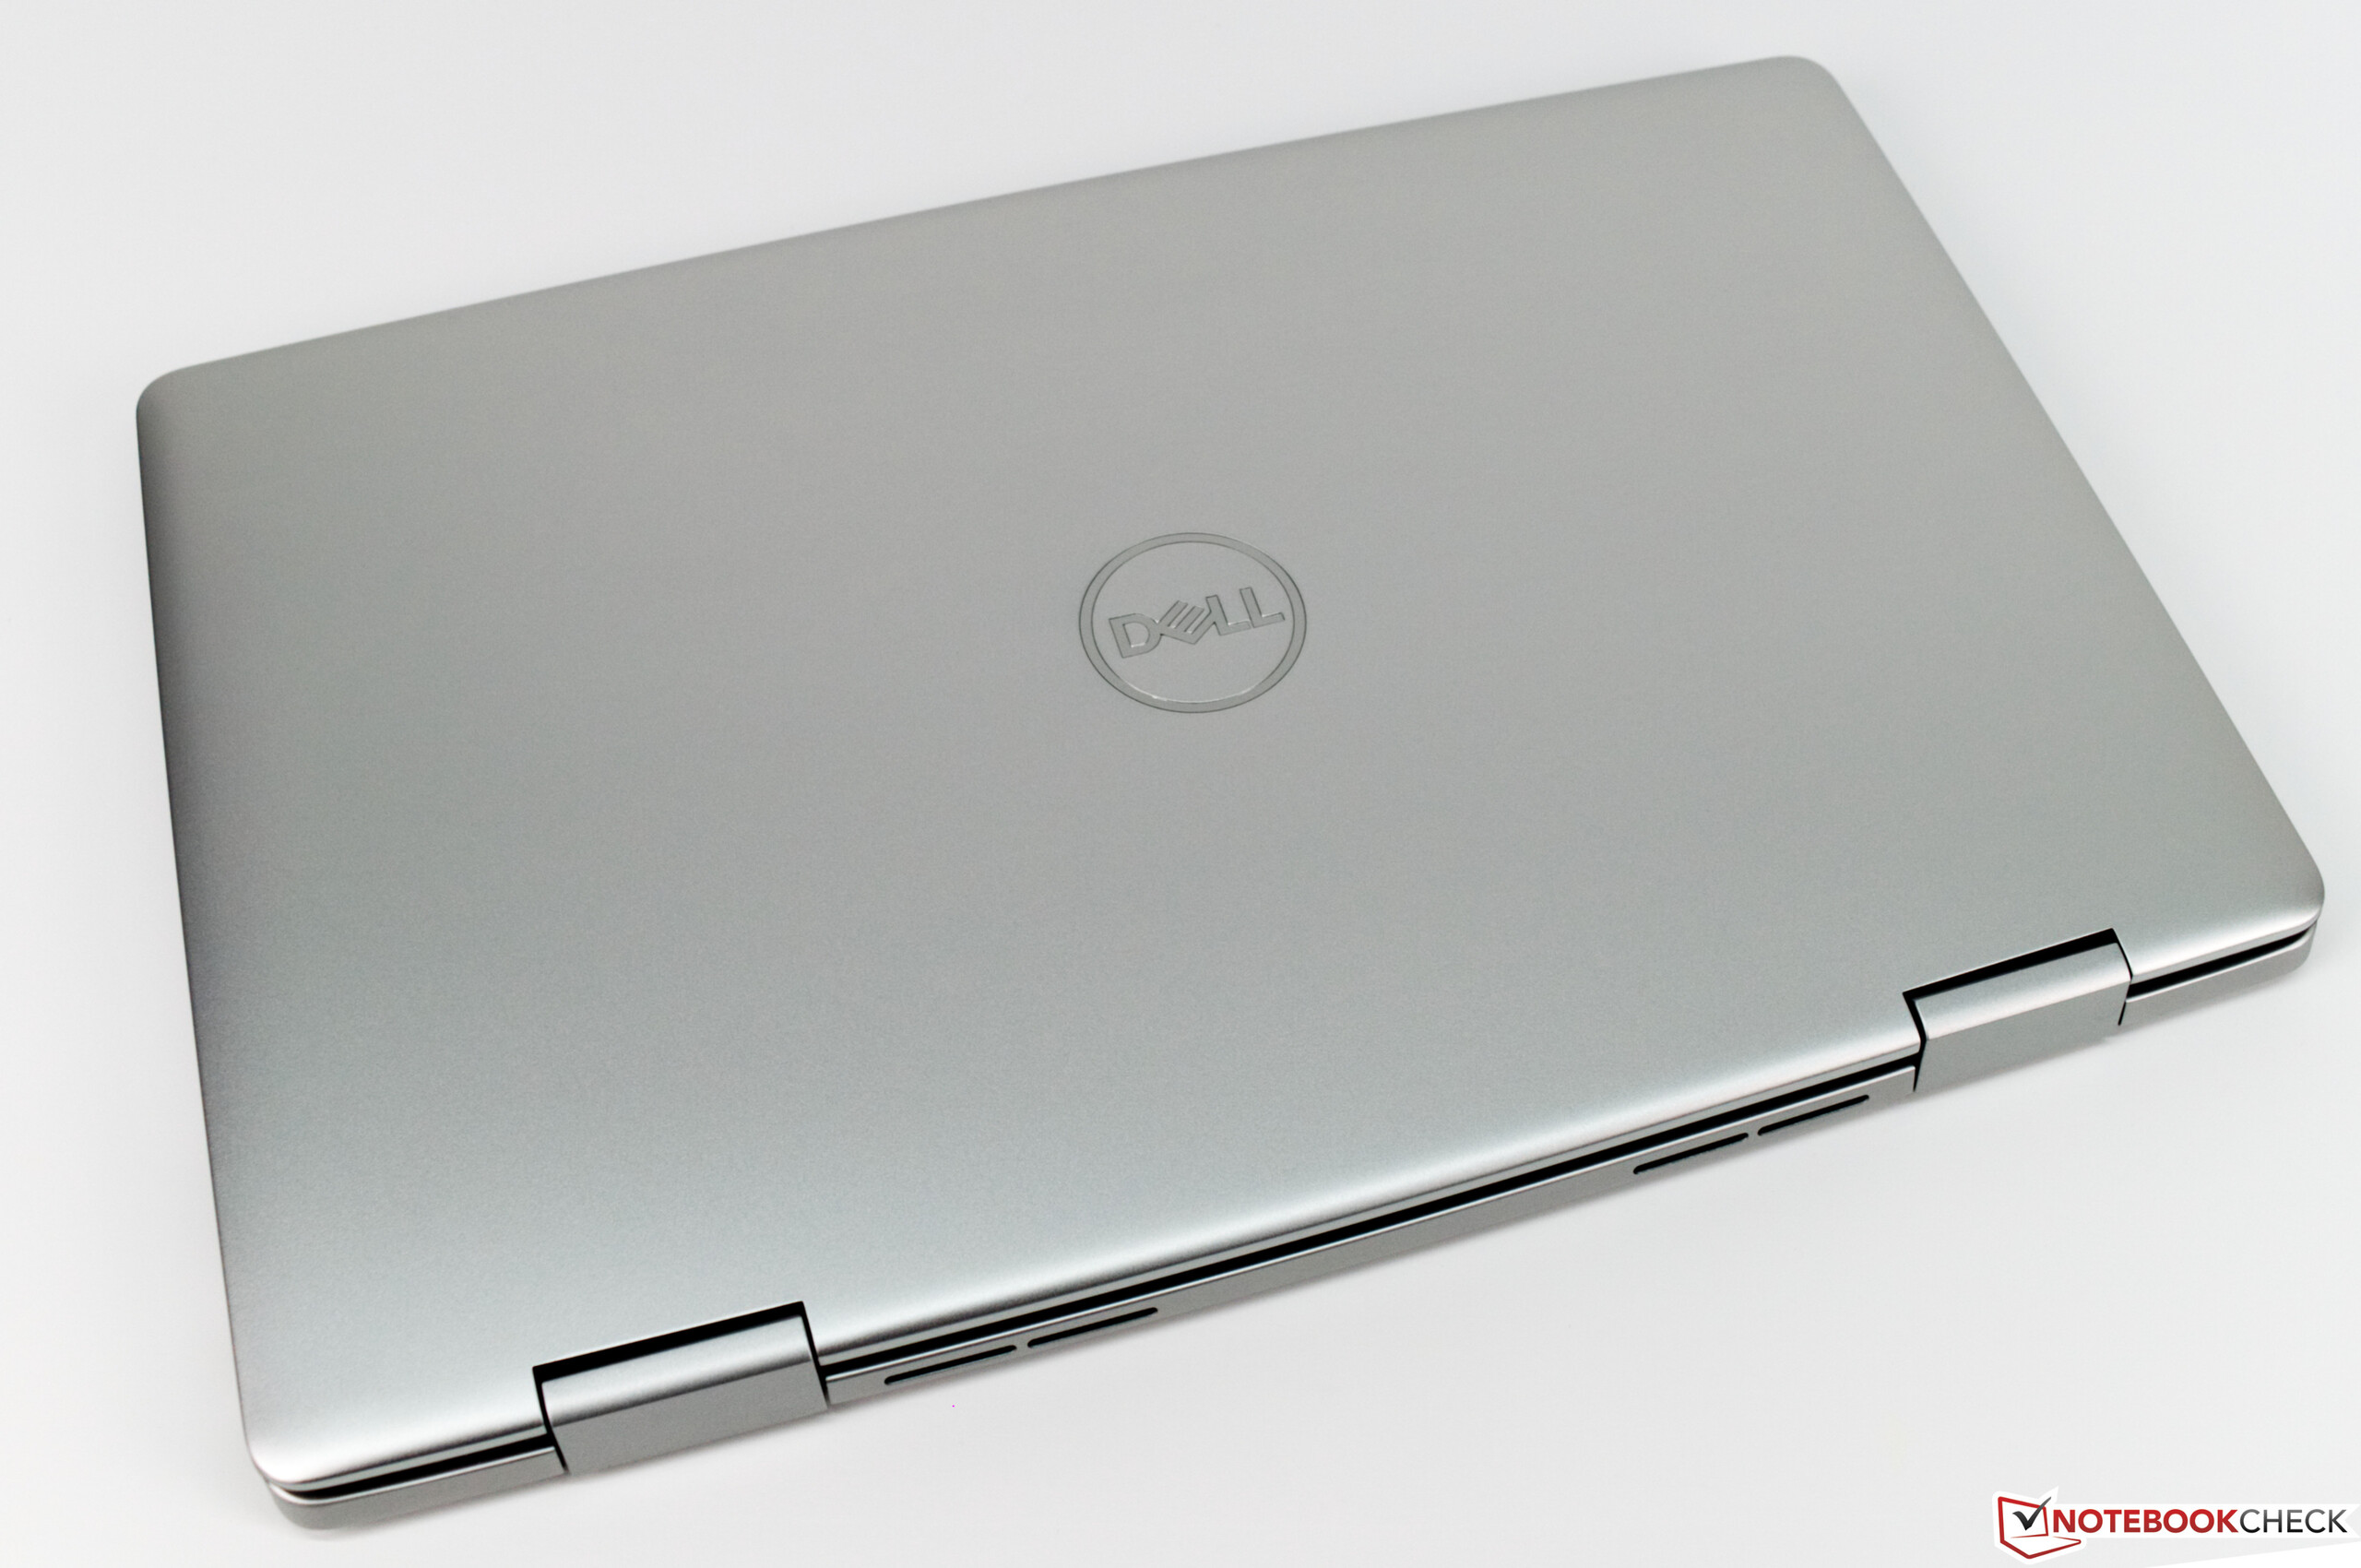
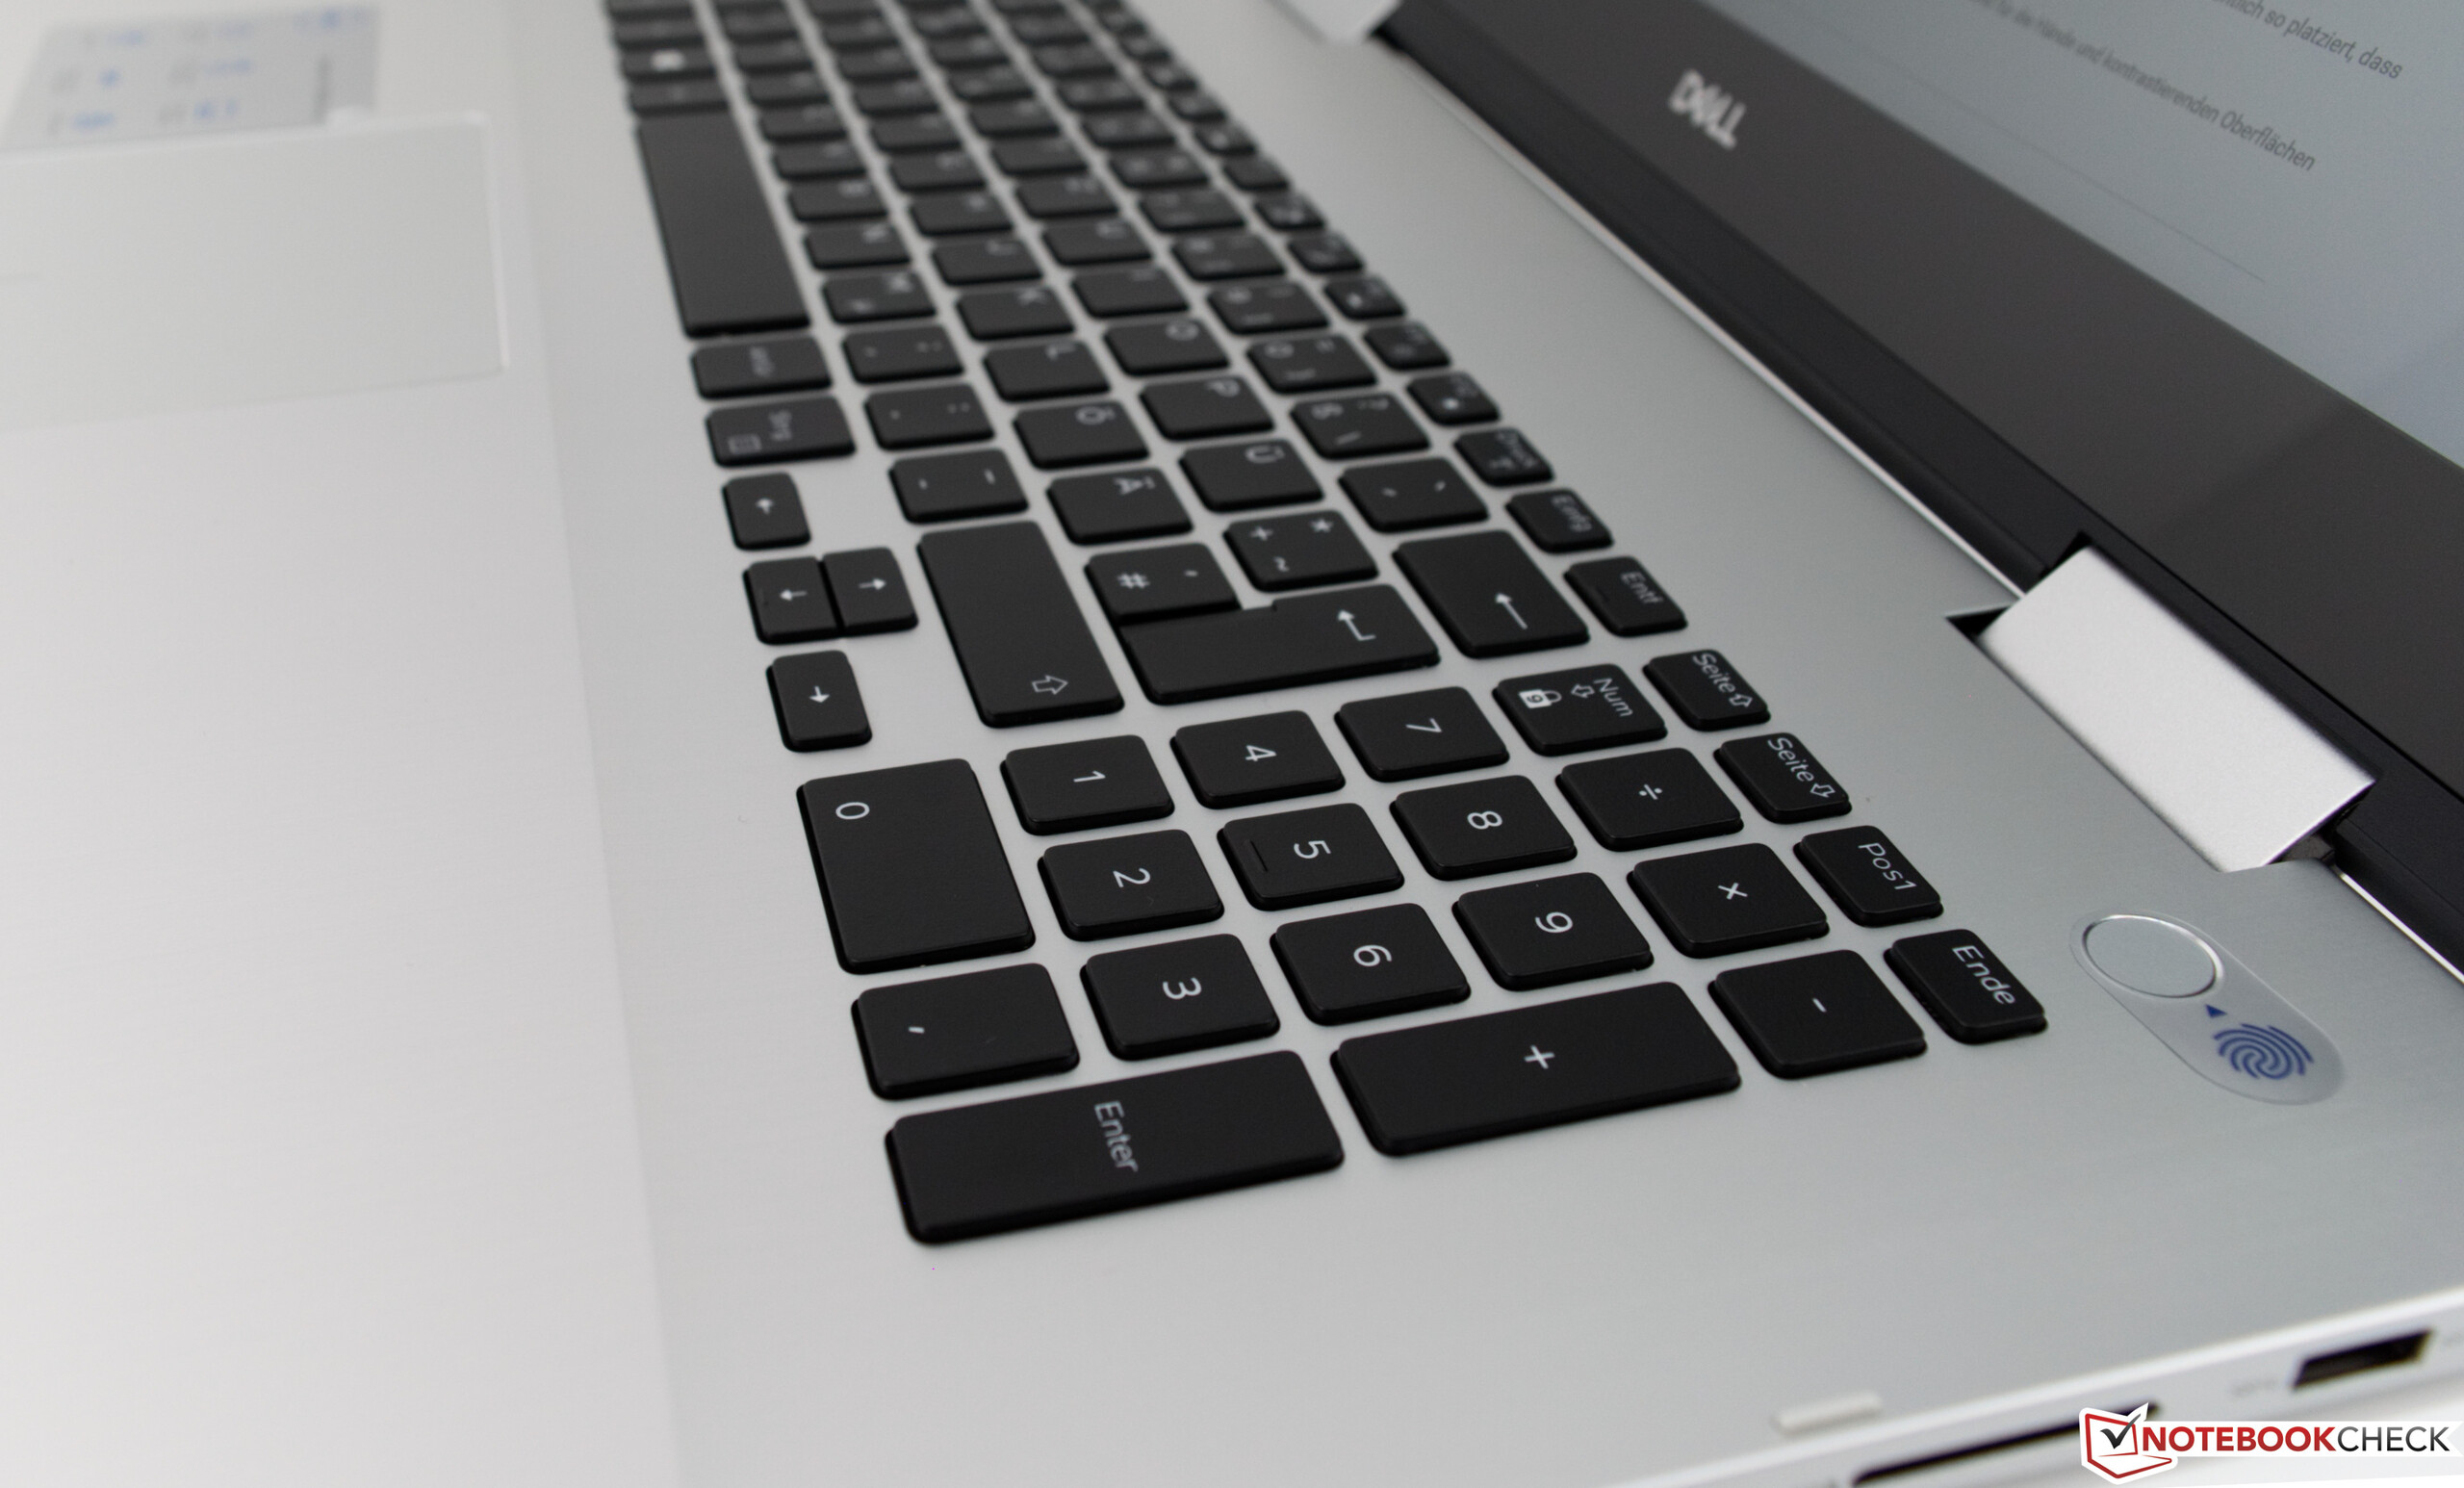
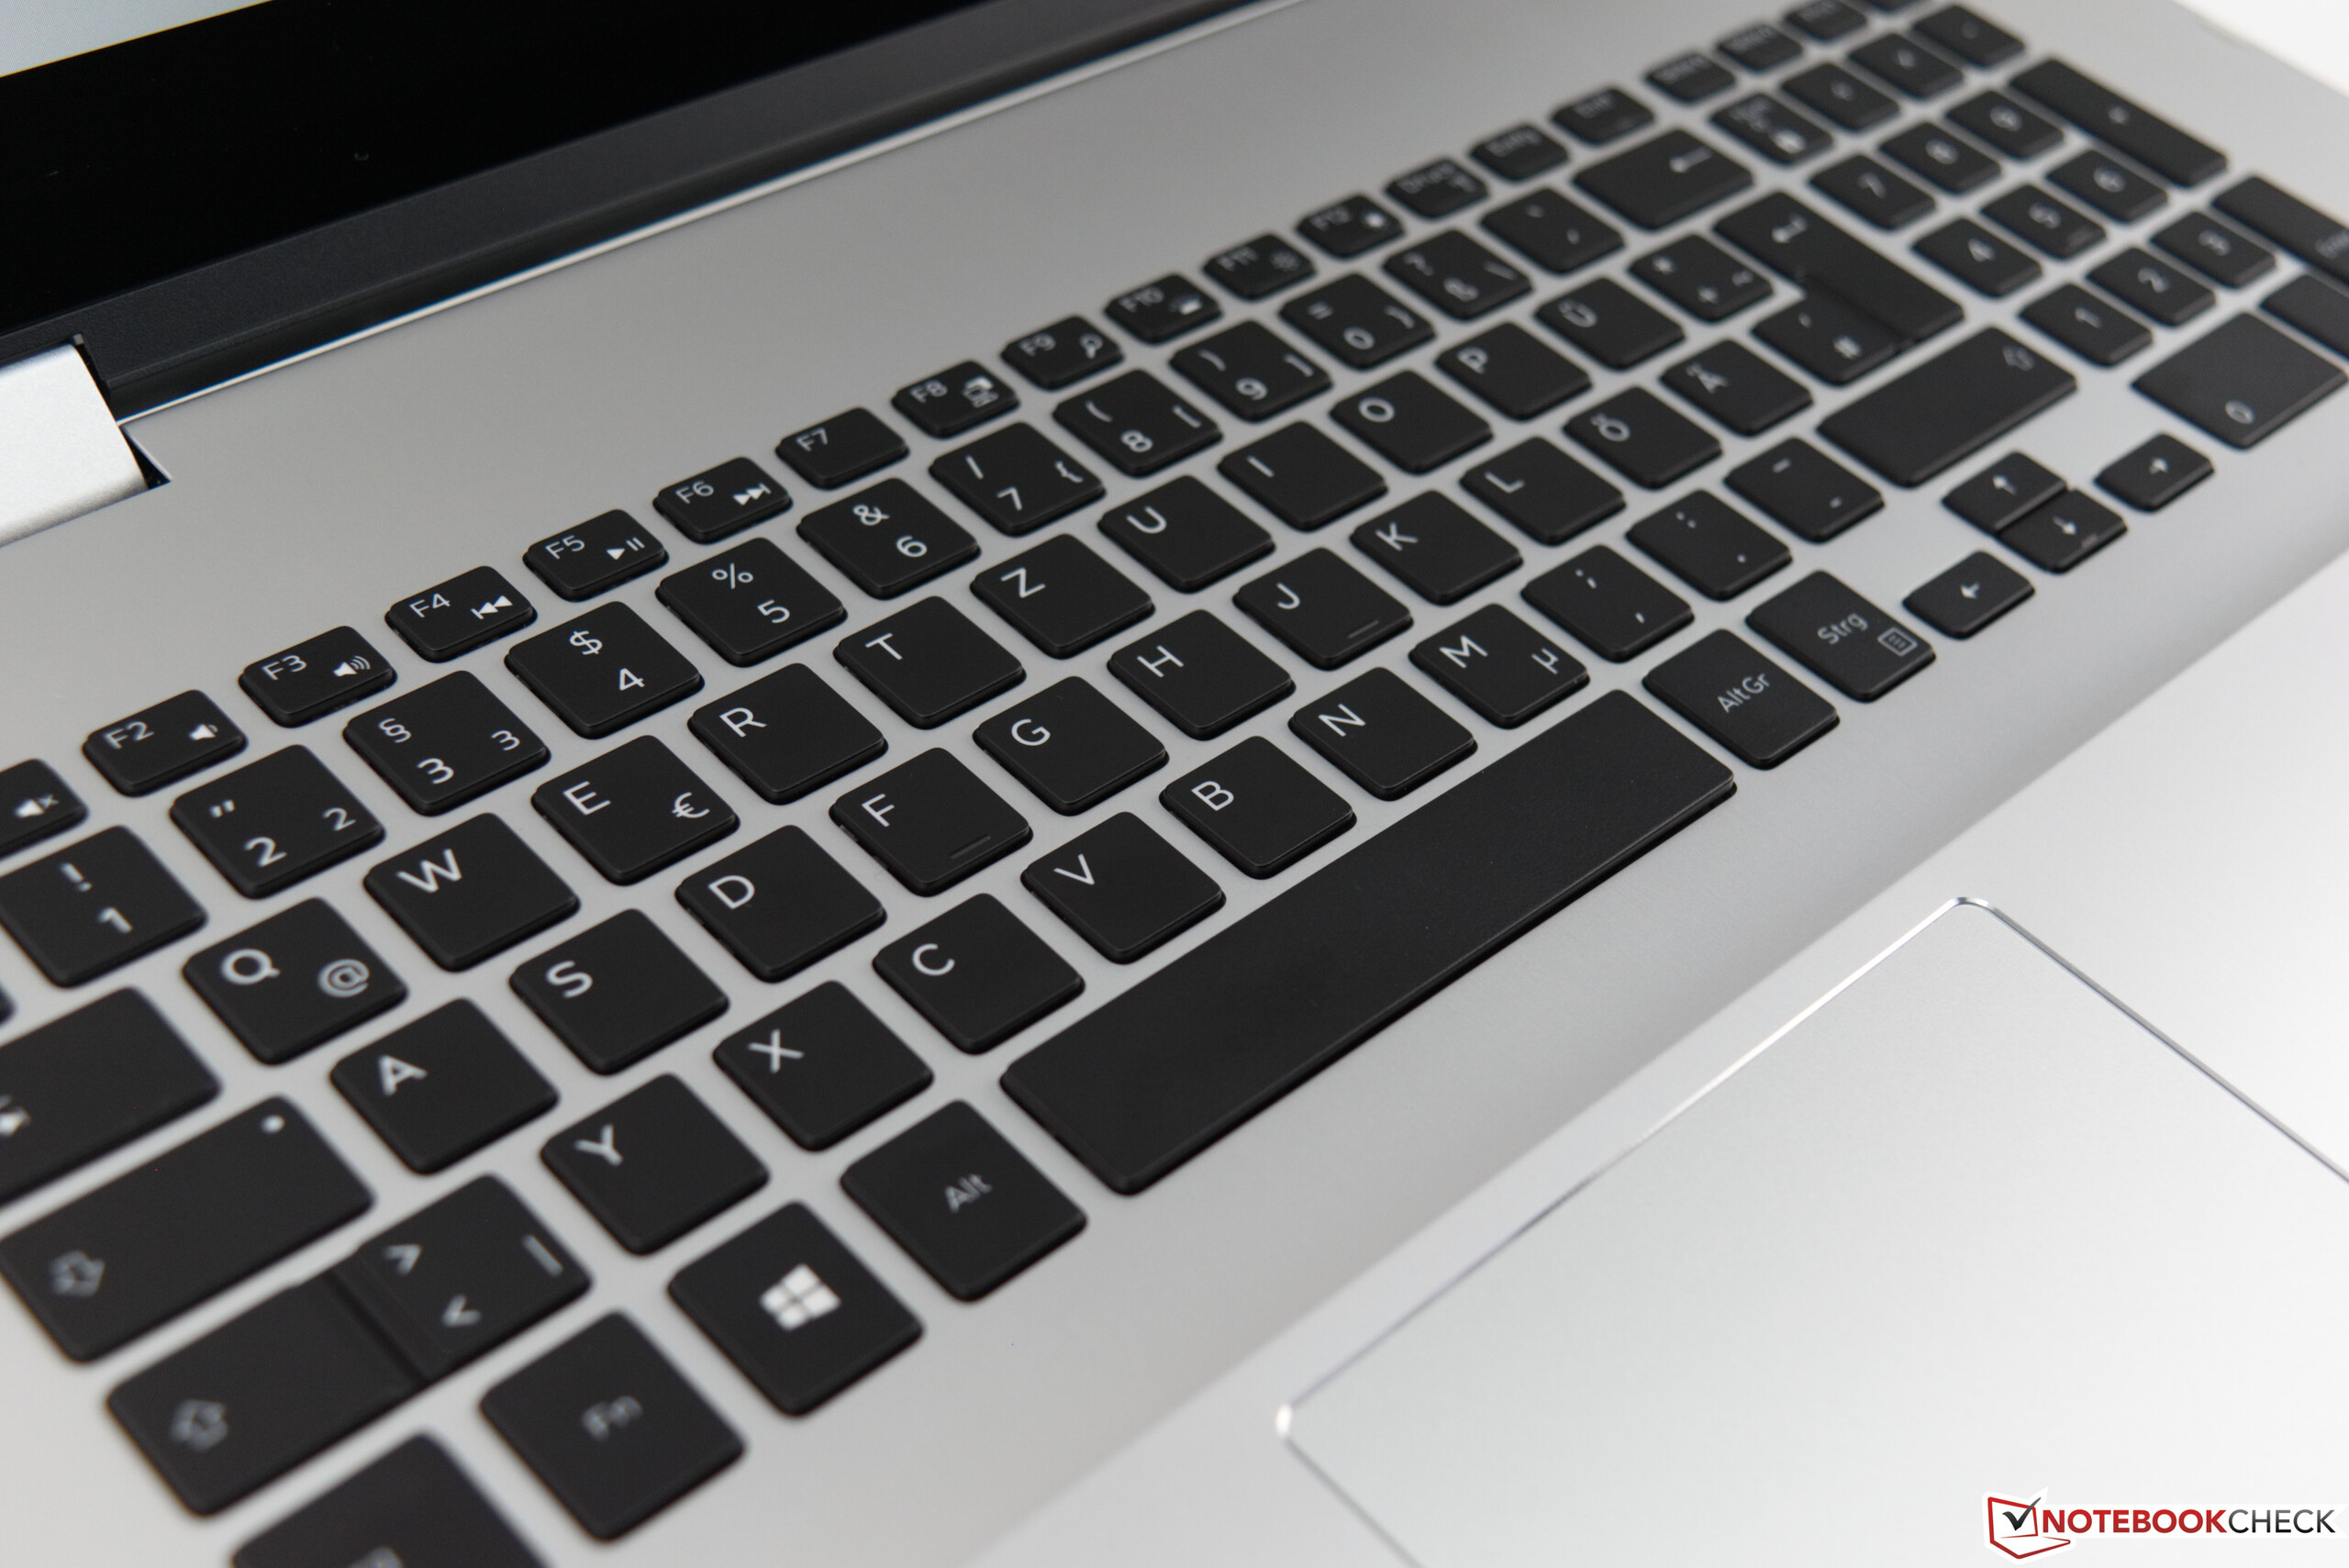
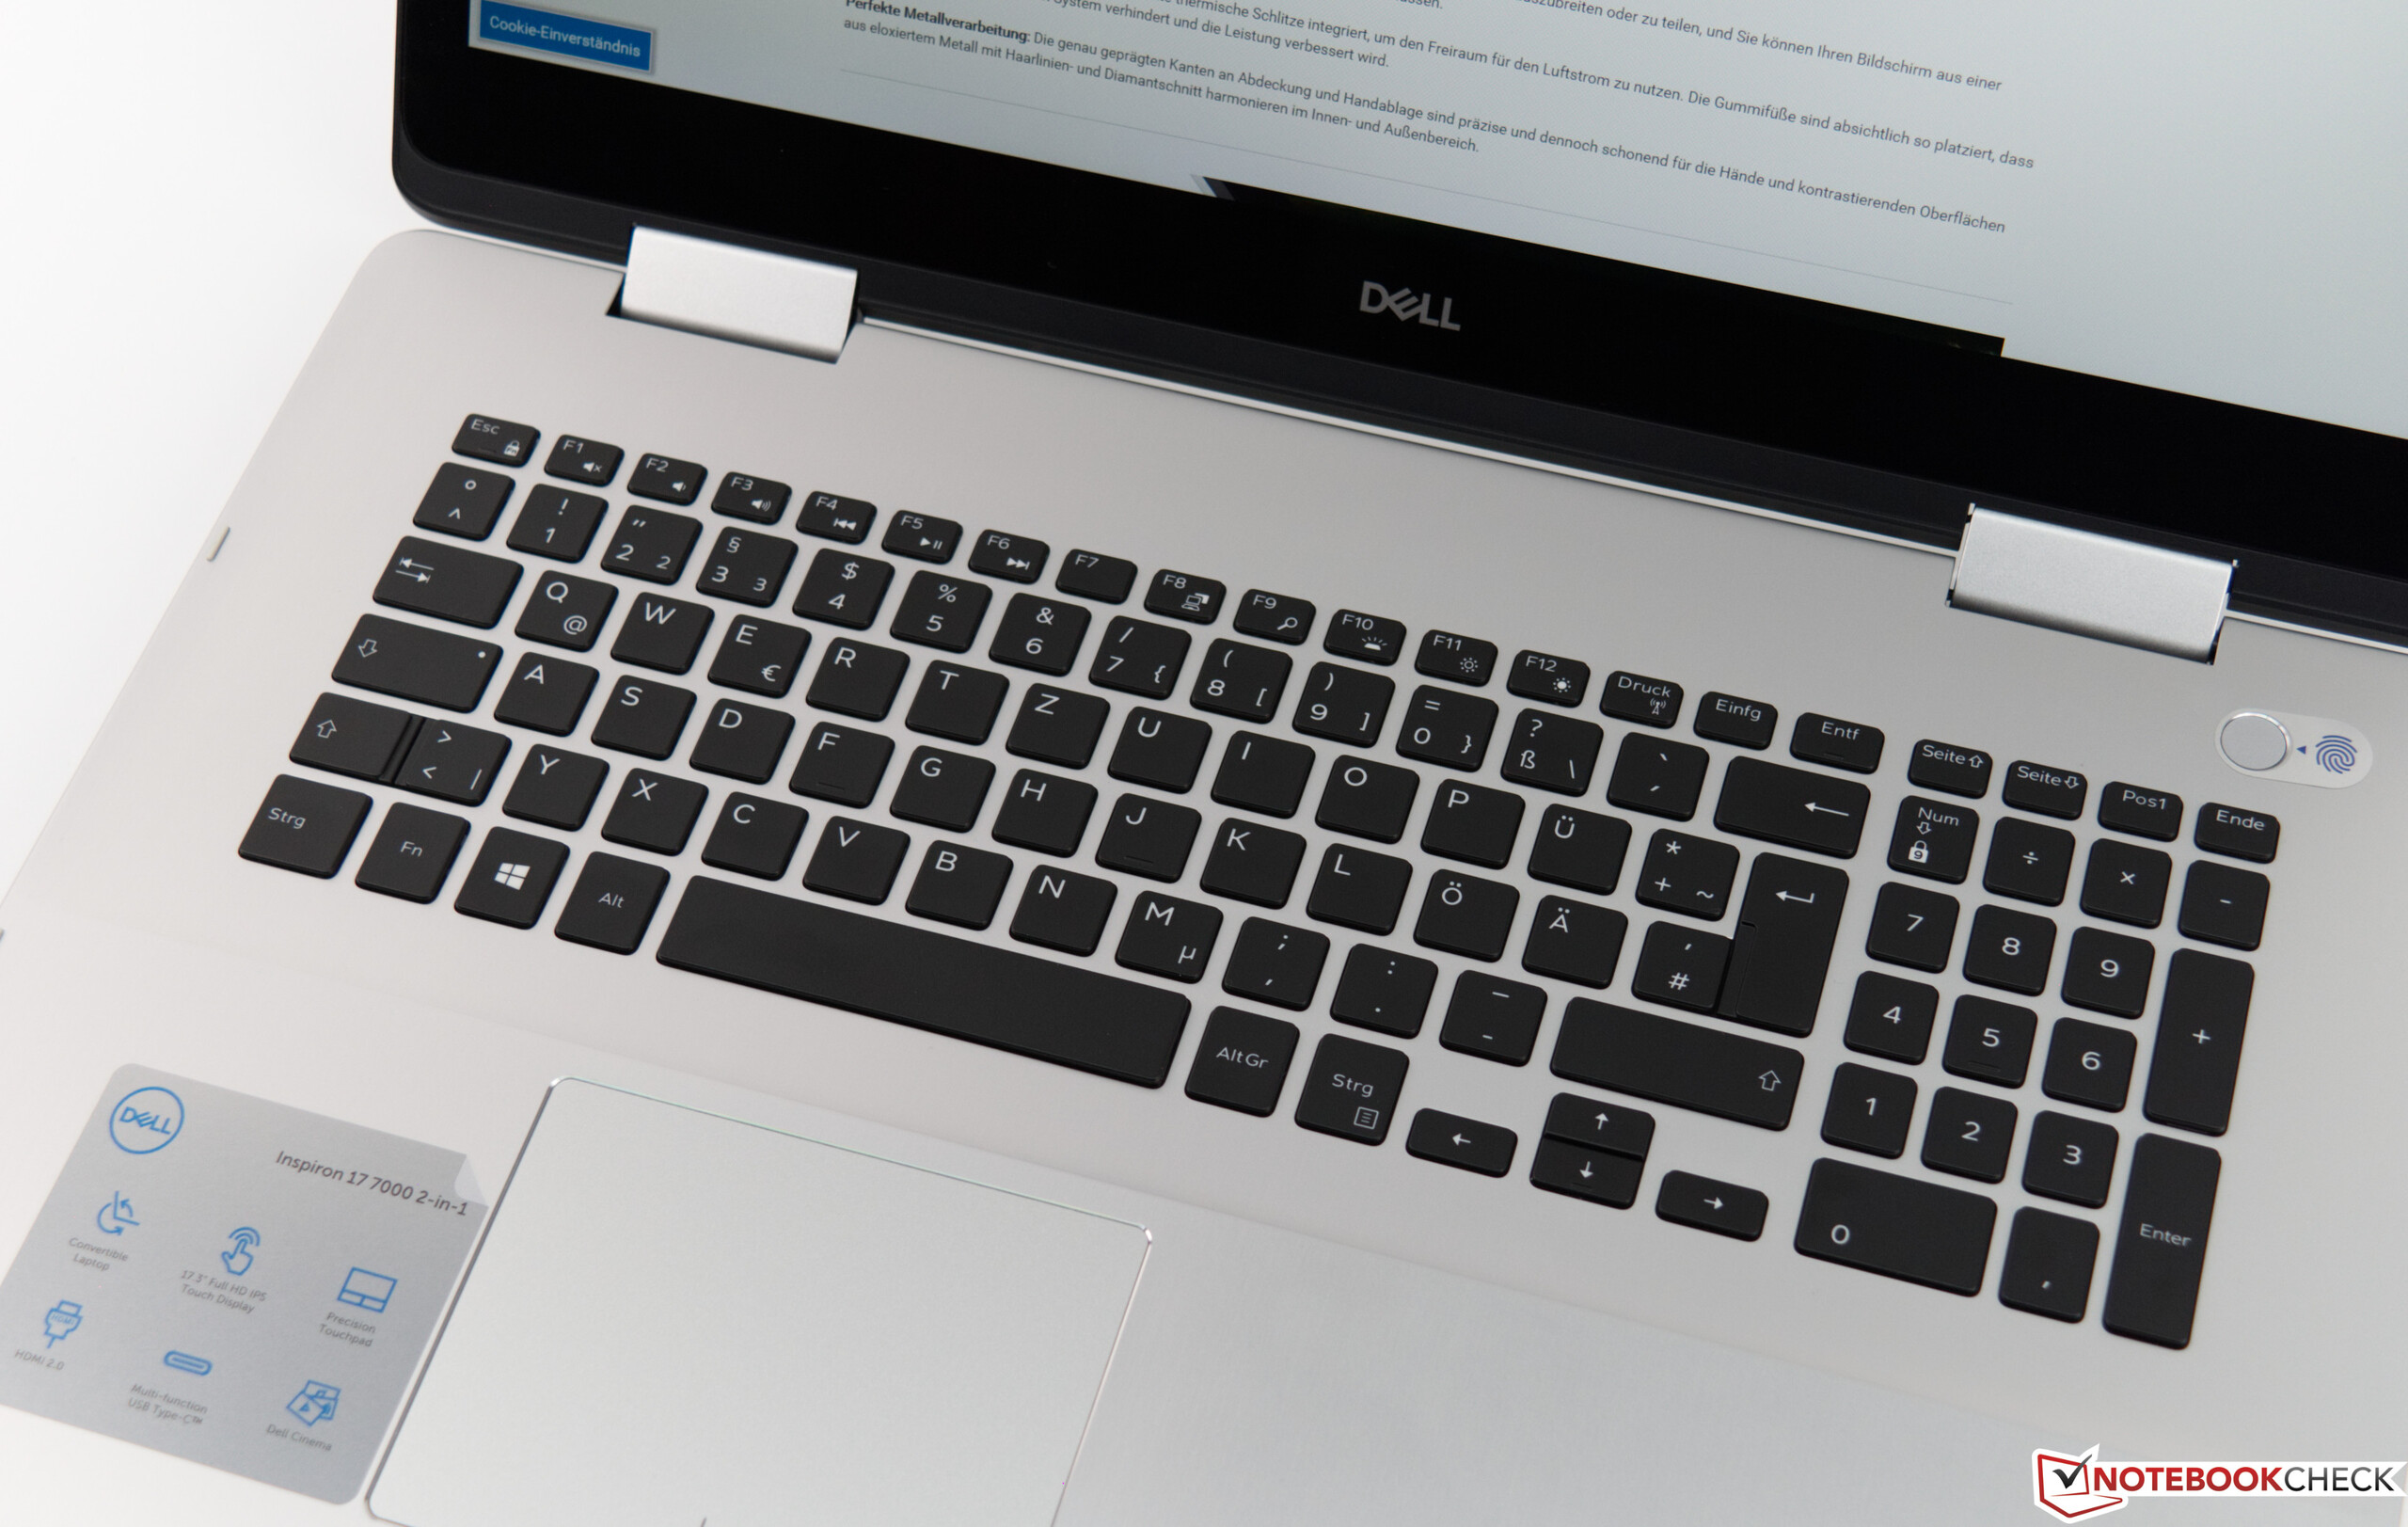
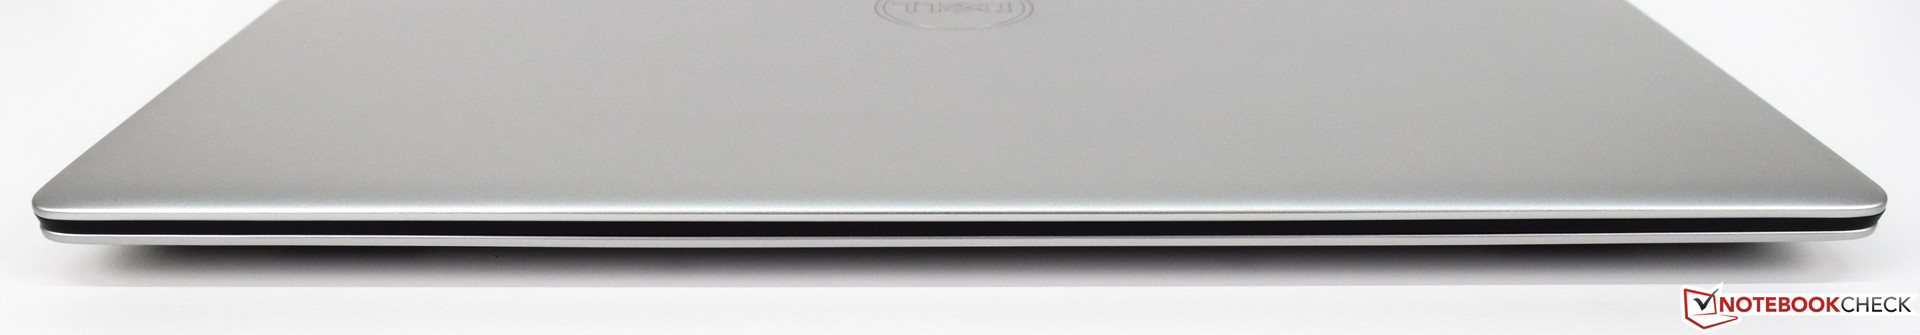
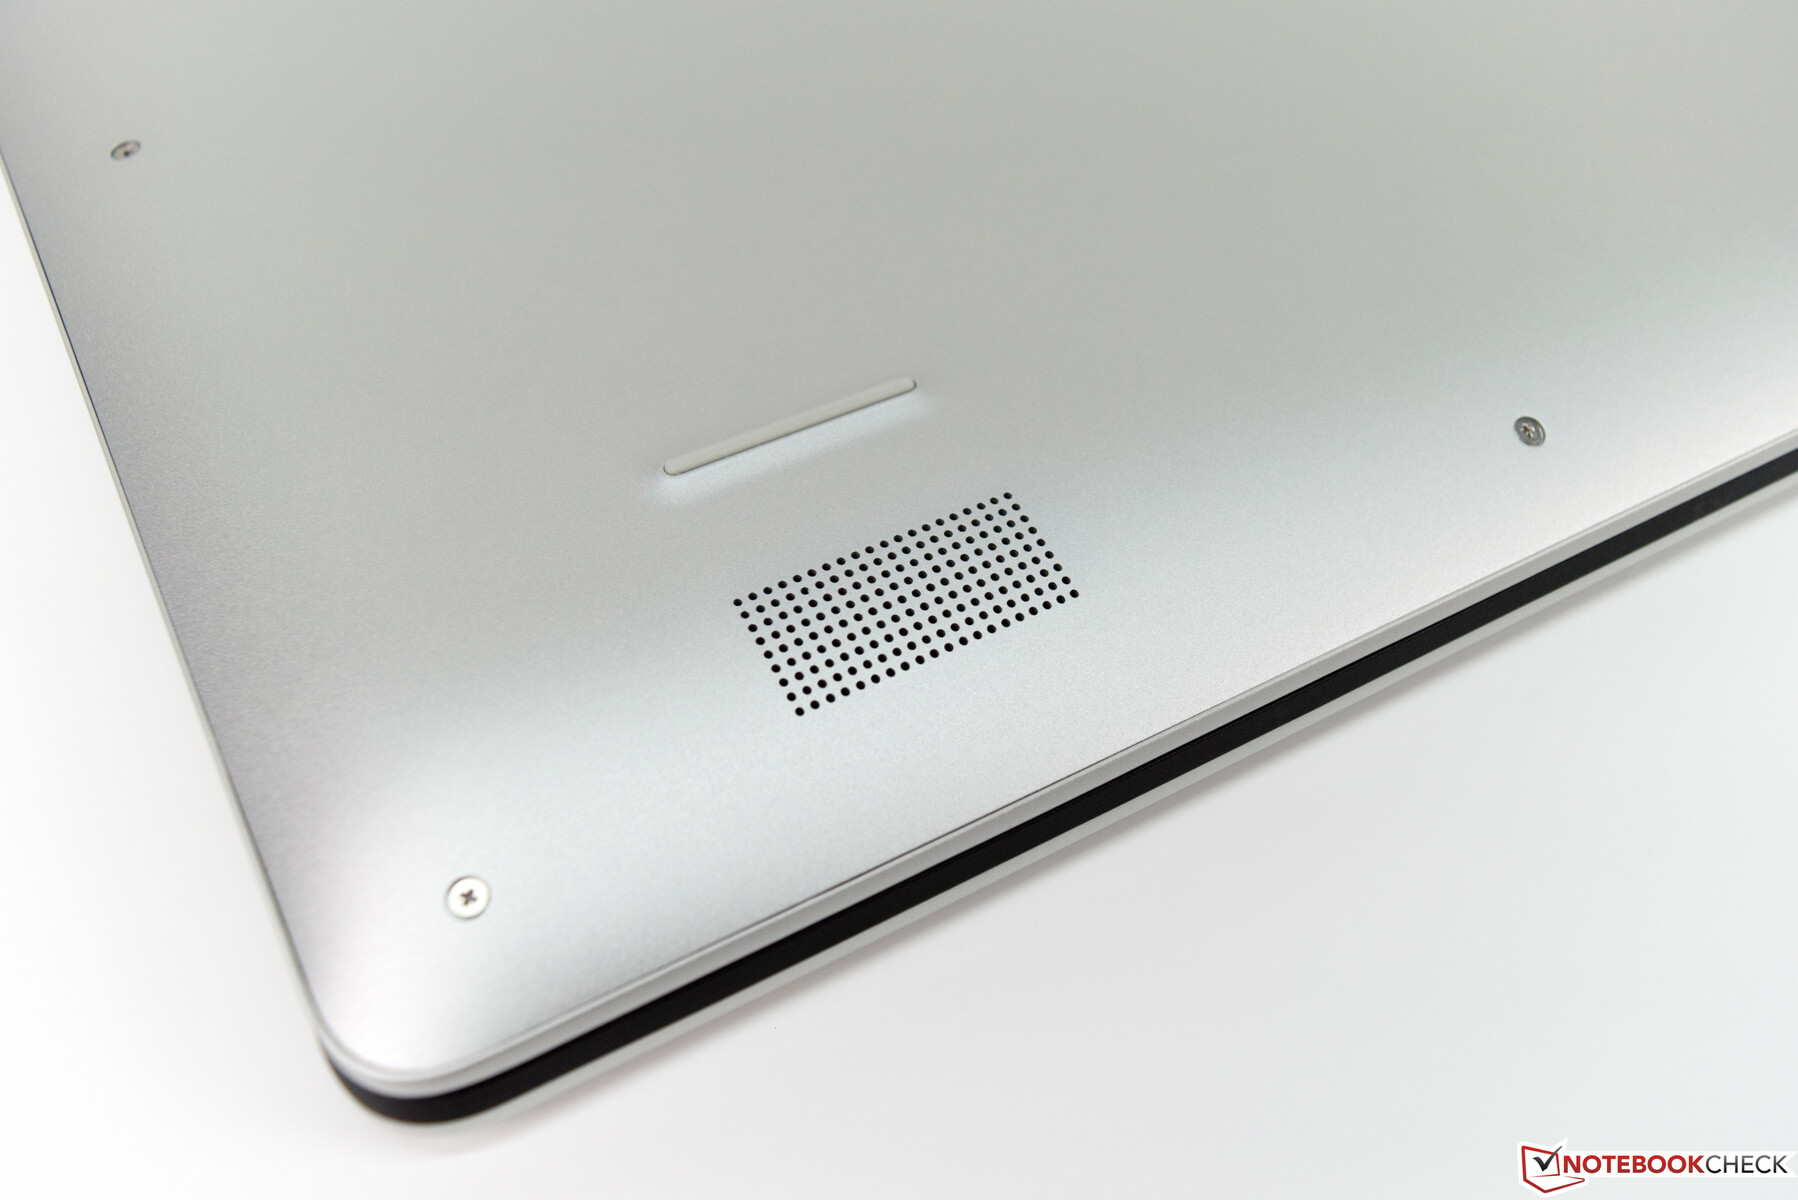
De Dell Inspiron 17-7786 kan ons overtuigen met een erg goede selectie van materialen en de robuuste basiseenheid. De invoerapparaten zijn goed en bruikbaar, al voorkomen enkele kleine punten een nog betere beoordeling. De type-ervaring is beter dan de voorganger en de hoogte van de toetsen is ook aangepast.
Vergeleken met zijn voorganger is het beeldscherm iets helderder en heeft deze een betere response, maar qua kleurdekking doet het notebook het slechter dan zijn voorganger. Door het sterk reflecterende oppervlak wordt positieve invloed van het verbeterde helderheid voor het gebruik buiten teniet gedaan.
Al met al is de Dell Inspiron 17-7786 een succesvolle upgrade met aanzienlijk verbeterd stroomverbruik en ook een aanzienlijk betere batterijduur.
Dell Inspiron 17-7786
- 31-01-2019 v6 (old)
Sebastian Bade
Price comparison
