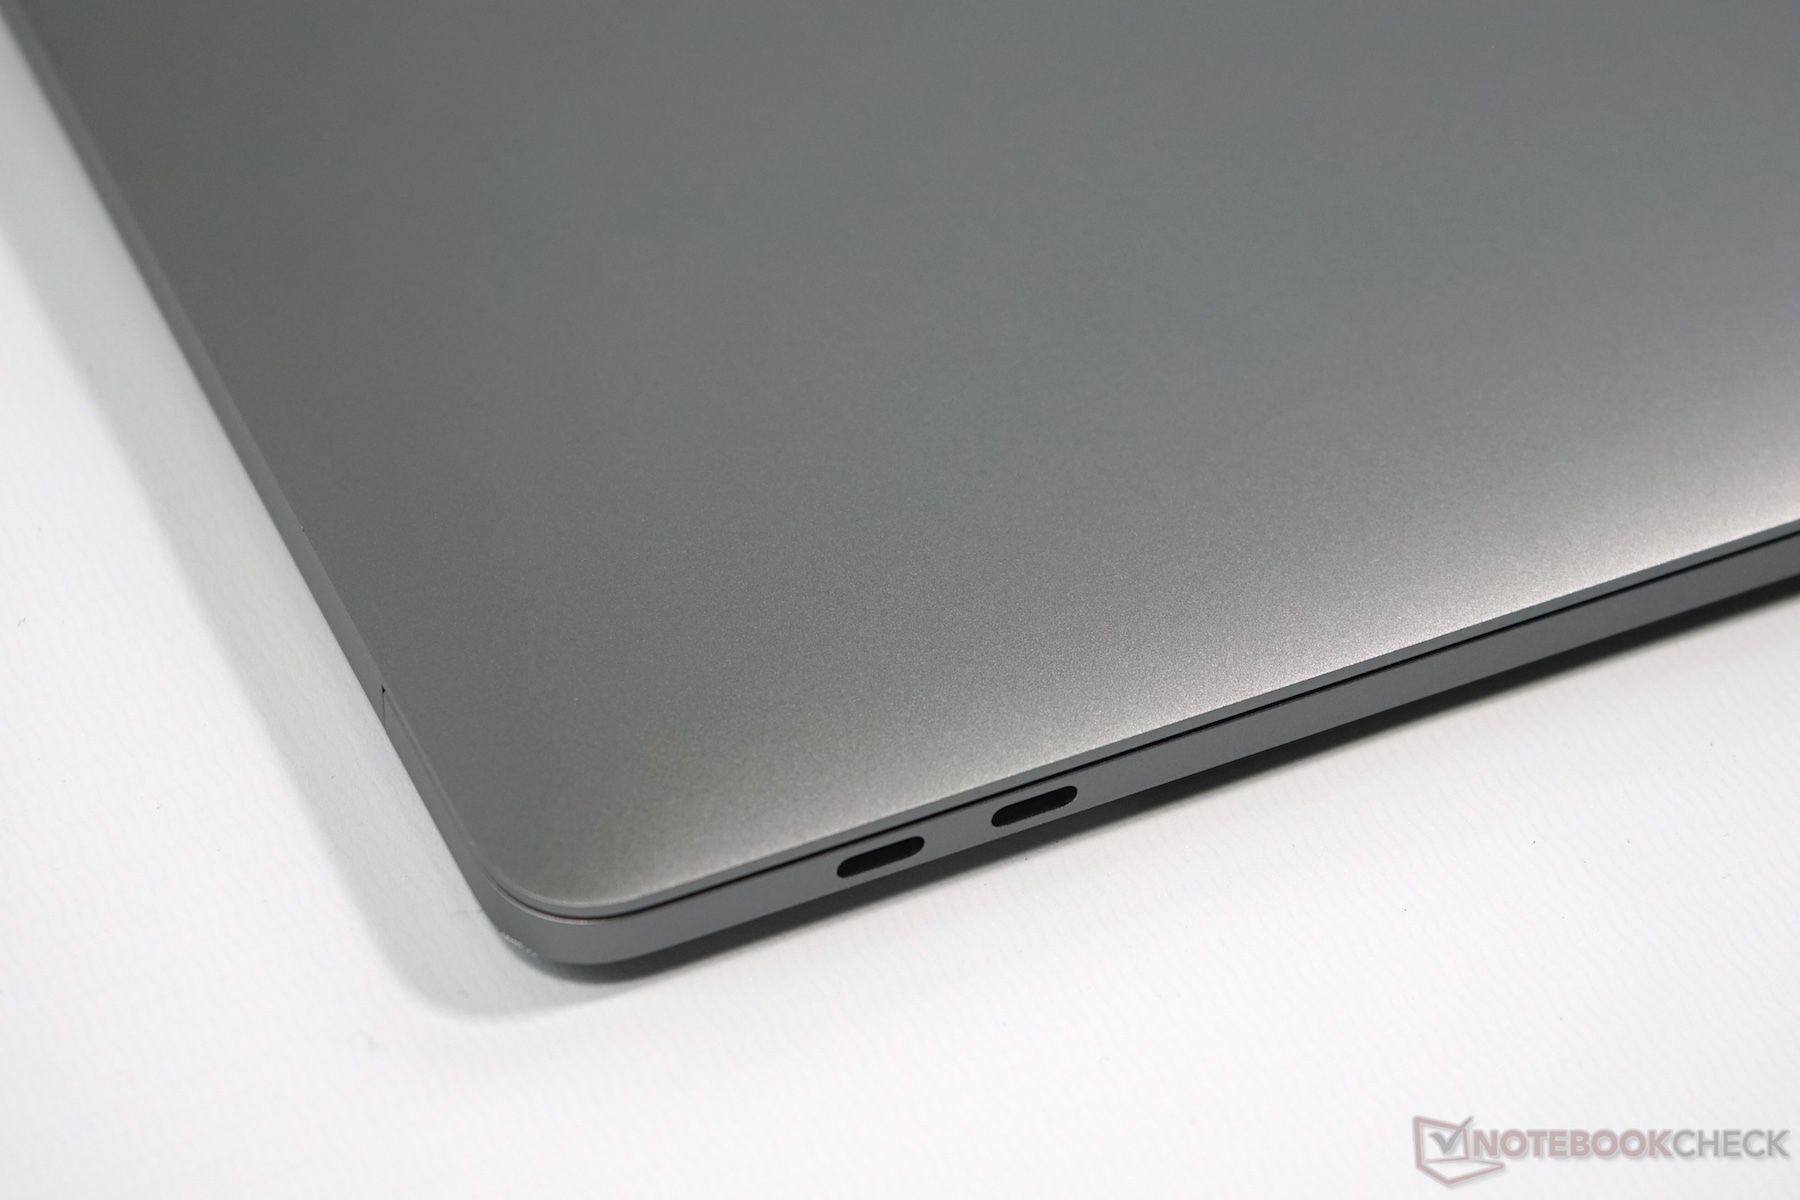
Kort testrapport Apple MacBook Pro 13 2019 laptop: Goede prestaties, maar geen echte innovatie
Evaluatie | Datum | Model | Gewicht | Hoogte | Formaat | Resolutie | Beste prijs |
|---|---|---|---|---|---|---|---|
| 90.7 % v7 (old) | 10-2019 | Apple MacBook Pro 13 2019 i5 4TB3 i5-8279U, Iris Plus Graphics 655 | 1.4 kg | 14.9 mm | 13.30" | 2560x1600 | |
| 90.1 % v7 (old) | 07-2019 | Lenovo ThinkPad X1 Carbon 2019-20QE000VGE i7-8665U, UHD Graphics 620 | 1.1 kg | 14.9 mm | 14.00" | 2560x1440 | |
| 87.7 % v6 (old) | 02-2019 | Dell XPS 13 9380 i7 4K i7-8565U, UHD Graphics 620 | 1.2 kg | 11.6 mm | 13.30" | 3840x2160 | |
| 85.6 % v7 (old) | 12-2018 | Razer Blade Stealth i7-8565U i7-8565U, GeForce MX150 | 1.3 kg | 14.8 mm | 13.30" | 1920x1080 | |
| 84.5 % v7 (old) | 08-2019 | HP Envy 13-aq0003ng i7-8565U, GeForce MX250 | 1.2 kg | 14.7 mm | 13.30" | 1920x1080 |
| |||||||||||||||||||||||||
Helderheidsverdeling: 87 %
Helderheid in Batterij-modus: 513 cd/m²
Contrast: 1524:1 (Zwart: 0.34 cd/m²)
ΔE ColorChecker Calman: 1.5 | ∀{0.5-29.43 Ø4.73}
calibrated: 2.6
ΔE Greyscale Calman: 2 | ∀{0.09-98 Ø4.97}
99.9% sRGB (Argyll 1.6.3 3D)
78.4% AdobeRGB 1998 (Argyll 1.6.3 3D)
87.7% AdobeRGB 1998 (Argyll 3D)
100% sRGB (Argyll 3D)
98.7% Display P3 (Argyll 3D)
Gamma: 2.22
CCT: 6898 K
| Apple MacBook Pro 13 2019 i5 4TB3 APPA03E, , 2560x1600, 13.3" | Apple MacBook Pro 13 2018 Touchbar i5 APPA03E, , 2560x1600, 13.3" | Lenovo ThinkPad X1 Carbon 2019-20QE000VGE LP140QH2-SPD1, , 2560x1440, 14" | Dell XPS 13 9380 i7 4K ID: AUO 282B B133ZAN Dell: 90NTH, , 3840x2160, 13.3" | Razer Blade Stealth i7-8565U Sharp LQ133M1JW41, , 1920x1080, 13.3" | HP Envy 13-aq0003ng InfoVision M133NVF3 R2, , 1920x1080, 13.3" | |
|---|---|---|---|---|---|---|
| Display | 0% | -15% | -22% | -21% | -23% | |
| Display P3 Coverage (%) | 98.7 | 98.5 0% | 72.5 -27% | 64.8 -34% | 65.5 -34% | 64.4 -35% |
| sRGB Coverage (%) | 100 | 99.9 0% | 97.8 -2% | 93.6 -6% | 96.3 -4% | 91.7 -8% |
| AdobeRGB 1998 Coverage (%) | 87.7 | 87.3 0% | 73.8 -16% | 65.8 -25% | 66.3 -24% | 65.2 -26% |
| Response Times | -7% | 21% | -39% | -24% | 24% | |
| Response Time Grey 50% / Grey 80% * (ms) | 43.2 ? | 46 ? -6% | 33.6 ? 22% | 64.8 ? -50% | 57.6 ? -33% | 31 ? 28% |
| Response Time Black / White * (ms) | 29.6 ? | 32 ? -8% | 24 ? 19% | 38 ? -28% | 34 ? -15% | 24 ? 19% |
| PWM Frequency (Hz) | 118000 ? | 22730 ? | 4000 ? | |||
| Screen | 2% | -62% | -27% | 1% | -31% | |
| Brightness middle (cd/m²) | 518 | 519 0% | 338 -35% | 428.3 -17% | 429.8 -17% | 768 48% |
| Brightness (cd/m²) | 480 | 504 5% | 315 -34% | 414 -14% | 403 -16% | 778 62% |
| Brightness Distribution (%) | 87 | 95 9% | 88 1% | 88 1% | 89 2% | 82 -6% |
| Black Level * (cd/m²) | 0.34 | 0.33 3% | 0.43 -26% | 0.27 21% | 0.32 6% | 0.48 -41% |
| Contrast (:1) | 1524 | 1573 3% | 786 -48% | 1586 4% | 1343 -12% | 1600 5% |
| Colorchecker dE 2000 * | 1.5 | 1.4 7% | 4 -167% | 2.69 -79% | 1.08 28% | 3.49 -133% |
| Colorchecker dE 2000 max. * | 2.8 | 2.8 -0% | 7.9 -182% | 6.19 -121% | 3.96 -41% | 7.41 -165% |
| Colorchecker dE 2000 calibrated * | 2.6 | 1.7 35% | 2.01 23% | 1.21 53% | 2.07 20% | |
| Greyscale dE 2000 * | 2 | 2.2 -10% | 6.2 -210% | 3.7 -85% | 1.3 35% | 4.09 -105% |
| Gamma | 2.22 99% | 2.22 99% | 2.13 103% | 2.1 105% | 2.23 99% | 2.54 87% |
| CCT | 6898 94% | 6908 94% | 6787 96% | 6706 97% | 6452 101% | 6452 101% |
| Color Space (Percent of AdobeRGB 1998) (%) | 78.4 | 77.3 -1% | 68.1 -13% | 60.4 -23% | 61.4 -22% | 60 -23% |
| Color Space (Percent of sRGB) (%) | 99.9 | 99.99 0% | 97.8 -2% | 93.5 -6% | 96.3 -4% | 92 -8% |
| Totaal Gemiddelde (Programma / Instellingen) | -2% /
0% | -19% /
-43% | -29% /
-27% | -15% /
-6% | -10% /
-23% |
* ... kleiner is beter
Responstijd Scherm
| ↔ Responstijd Zwart naar Wit | ||
|---|---|---|
| 29.6 ms ... stijging ↗ en daling ↘ gecombineerd | ↗ 15.6 ms stijging | 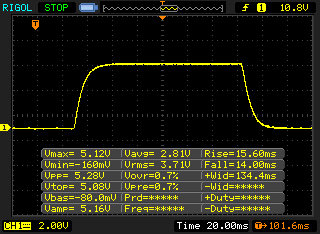 |
| ↘ 14 ms daling | ||
| Het scherm vertoonde relatief trage responstijden in onze tests en is misschien te traag voor games. Ter vergelijking: alle testtoestellen variëren van 0.1 (minimum) tot 240 (maximum) ms. » 79 % van alle toestellen zijn beter. Dit betekent dat de gemeten responstijd slechter is dan het gemiddelde (19.9 ms) van alle geteste toestellen. | ||
| ↔ Responstijd 50% Grijs naar 80% Grijs | ||
| 43.2 ms ... stijging ↗ en daling ↘ gecombineerd | ↗ 22 ms stijging | 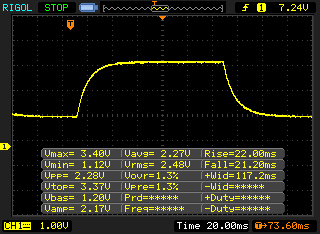 |
| ↘ 21.2 ms daling | ||
| Het scherm vertoonde trage responstijden in onze tests en is misschien te traag voor games. Ter vergelijking: alle testtoestellen variëren van 0.165 (minimum) tot 636 (maximum) ms. » 72 % van alle toestellen zijn beter. Dit betekent dat de gemeten responstijd slechter is dan het gemiddelde (31.1 ms) van alle geteste toestellen. | ||
Screen Flickering / PWM (Pulse-Width Modulation)
| Screen flickering / PWM niet waargenomen | 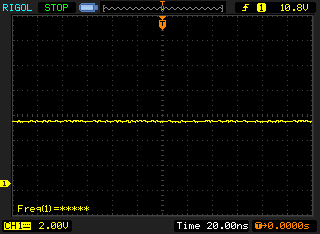 | ||
Ter vergelijking: 52 % van alle geteste toestellen maakten geen gebruik van PWM om de schermhelderheid te verlagen. Als het wel werd gebruikt, werd een gemiddelde van 7794 (minimum: 5 - maximum: 343500) Hz waargenomen. | |||

| PCMark 8 Home Score Accelerated v2 | 4056 punten | |
| PCMark 8 Creative Score Accelerated v2 | 5689 punten | |
| PCMark 8 Work Score Accelerated v2 | 4537 punten | |
| PCMark 10 Score | 3779 punten | |
Help | ||

| 3DMark 06 Standard Score | 17176 punten | |
| 3DMark Ice Storm Standard Score | 57033 punten | |
| 3DMark Cloud Gate Standard Score | 11806 punten | |
| 3DMark Fire Strike Score | 1903 punten | |
| 3DMark Time Spy Score | 705 punten | |
Help | ||
| lage | gem. | hoge | ultra | |
|---|---|---|---|---|
| BioShock Infinite (2013) | 78.4 | 54.3 | 49.4 | 15.5 |
| Dota 2 Reborn (2015) | 84 | 63 | 33.3 | 29.9 |
| X-Plane 11.11 (2018) | 42.8 | 29.5 | 25.1 |
Geluidsniveau
| Onbelast |
| 29 / 29 / 29 dB (A) |
| Belasting |
| 33.9 / 41.8 dB (A) |
 | ||
30 dB stil 40 dB(A) hoorbaar 50 dB(A) luid |
||
min: | ||
| Apple MacBook Pro 13 2019 i5 4TB3 Iris Plus Graphics 655, i5-8279U, Apple SSD AP0512 | Apple MacBook Pro 13 2018 Touchbar i5 Iris Plus Graphics 655, i5-8259U | Lenovo ThinkPad X1 Carbon 2019-20QE000VGE UHD Graphics 620, i7-8665U, WDC PC SN720 SDAQNTW-512G | Dell XPS 13 9380 i7 4K UHD Graphics 620, i7-8565U, Samsung SSD PM981 MZVLB512HAJQ | Razer Blade Stealth i7-8565U GeForce MX150, i7-8565U, Lite-On CA3-8D256-Q11 | HP Envy 13-aq0003ng GeForce MX250, i7-8565U, Toshiba KBG30ZMV512G | |
|---|---|---|---|---|---|---|
| Noise | -5% | 6% | -3% | -4% | -1% | |
| uit / omgeving * (dB) | 29 | 29.6 -2% | 28.4 2% | 28.4 2% | 28.4 2% | 30 -3% |
| Idle Minimum * (dB) | 29 | 29.6 -2% | 28.4 2% | 29.4 -1% | 28.5 2% | 30 -3% |
| Idle Average * (dB) | 29 | 29.6 -2% | 28.4 2% | 29.4 -1% | 29 -0% | 30 -3% |
| Idle Maximum * (dB) | 29 | 29.6 -2% | 28.6 1% | 29.4 -1% | 29.1 -0% | 30 -3% |
| Load Average * (dB) | 33.9 | 36.7 -8% | 31.5 7% | 34.6 -2% | 42.8 -26% | |
| Load Maximum * (dB) | 41.8 | 46.7 -12% | 33.1 21% | 46.8 -12% | 41.6 -0% | 39.5 6% |
| Witcher 3 ultra * (dB) | 32.5 | 41.4 |
* ... kleiner is beter
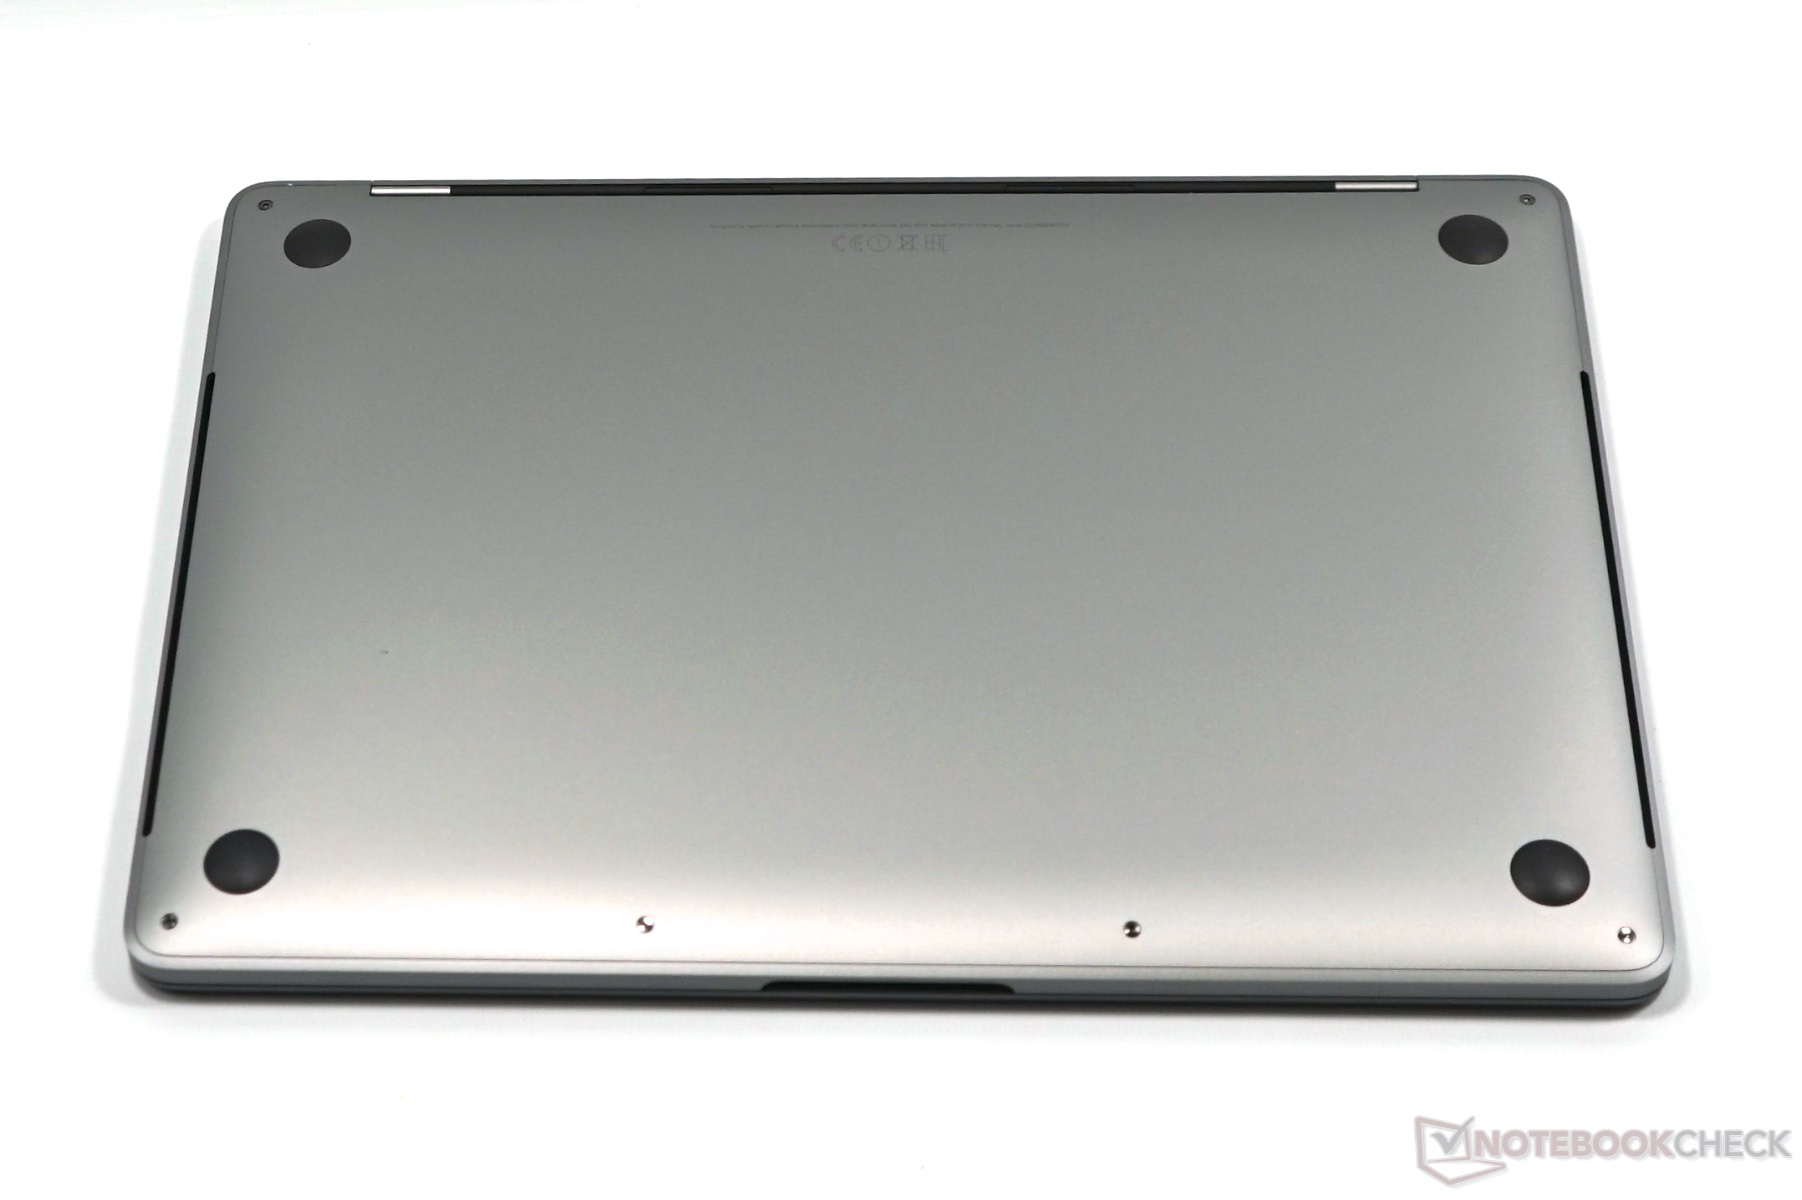
(-) De maximumtemperatuur aan de bovenzijde bedraagt 45.7 °C / 114 F, vergeleken met het gemiddelde van 35.9 °C / 97 F, variërend van 21.4 tot 59 °C voor de klasse Subnotebook.
(±) De bodem warmt op tot een maximum van 44.2 °C / 112 F, vergeleken met een gemiddelde van 39.2 °C / 103 F
(+) Bij onbelast gebruik bedraagt de gemiddelde temperatuur voor de bovenzijde 28.3 °C / 83 F, vergeleken met het apparaatgemiddelde van 30.8 °C / 87 F.
(+) De handpalmsteunen en het touchpad bereiken maximaal de huidtemperatuur (32.5 °C / 90.5 F) en zijn dus niet heet.
(-) De gemiddelde temperatuur van de handpalmsteun van soortgelijke toestellen bedroeg 28.2 °C / 82.8 F (-4.3 °C / -7.7 F).
Apple MacBook Pro 13 2019 i5 4TB3 audioanalyse
(±) | luidspreker luidheid is gemiddeld maar goed (79.7 dB)
Bas 100 - 315 Hz
(±) | verminderde zeebaars - gemiddeld 12.8% lager dan de mediaan
(±) | lineariteit van de lage tonen is gemiddeld (11.2% delta ten opzichte van de vorige frequentie)
Midden 400 - 2000 Hz
(+) | evenwichtige middens - slechts 3.2% verwijderd van de mediaan
(+) | de middentonen zijn lineair (4.6% delta ten opzichte van de vorige frequentie)
Hoog 2 - 16 kHz
(+) | evenwichtige hoogtepunten - slechts 3.4% verwijderd van de mediaan
(+) | de hoge tonen zijn lineair (5.3% delta naar de vorige frequentie)
Algemeen 100 - 16.000 Hz
(+) | het totale geluid is lineair (13.7% verschil met de mediaan)
Vergeleken met dezelfde klasse
» 24% van alle geteste apparaten in deze klasse waren beter, 5% vergelijkbaar, 71% slechter
» De beste had een delta van 5%, het gemiddelde was 18%, de slechtste was 53%
Vergeleken met alle geteste toestellen
» 15% van alle geteste apparaten waren beter, 4% gelijk, 81% slechter
» De beste had een delta van 4%, het gemiddelde was 24%, de slechtste was 134%
Lenovo ThinkPad X1 Carbon 2019-20QE000VGE audioanalyse
(±) | luidspreker luidheid is gemiddeld maar goed (76.8 dB)
Bas 100 - 315 Hz
(±) | verminderde zeebaars - gemiddeld 11.2% lager dan de mediaan
(±) | lineariteit van de lage tonen is gemiddeld (7.1% delta ten opzichte van de vorige frequentie)
Midden 400 - 2000 Hz
(±) | hogere middens - gemiddeld 5.1% hoger dan de mediaan
(+) | de middentonen zijn lineair (5.4% delta ten opzichte van de vorige frequentie)
Hoog 2 - 16 kHz
(+) | evenwichtige hoogtepunten - slechts 2.9% verwijderd van de mediaan
(±) | lineariteit van de hoogtepunten is gemiddeld (9.1% delta ten opzichte van de vorige frequentie)
Algemeen 100 - 16.000 Hz
(±) | lineariteit van het totale geluid is gemiddeld (16.7% verschil met de mediaan)
Vergeleken met dezelfde klasse
» 21% van alle geteste apparaten in deze klasse waren beter, 8% vergelijkbaar, 71% slechter
» De beste had een delta van 7%, het gemiddelde was 21%, de slechtste was 53%
Vergeleken met alle geteste toestellen
» 29% van alle geteste apparaten waren beter, 7% gelijk, 64% slechter
» De beste had een delta van 4%, het gemiddelde was 24%, de slechtste was 134%
| Uit / Standby | |
| Inactief | |
| Belasting |
|
Key:
min: | |
| Apple MacBook Pro 13 2019 i5 4TB3 i5-8279U, Iris Plus Graphics 655, Apple SSD AP0512, IPS, 2560x1600, 13.3" | Apple MacBook Pro 13 2018 Touchbar i5 i5-8259U, Iris Plus Graphics 655, , IPS, 2560x1600, 13.3" | Lenovo ThinkPad X1 Carbon 2019-20QE000VGE i7-8665U, UHD Graphics 620, WDC PC SN720 SDAQNTW-512G, IPS, 2560x1440, 14" | Dell XPS 13 9380 i7 4K i7-8565U, UHD Graphics 620, Samsung SSD PM981 MZVLB512HAJQ, IPS, 3840x2160, 13.3" | Razer Blade Stealth i7-8565U i7-8565U, GeForce MX150, Lite-On CA3-8D256-Q11, IPS, 1920x1080, 13.3" | HP Envy 13-aq0003ng i7-8565U, GeForce MX250, Toshiba KBG30ZMV512G, IPS, 1920x1080, 13.3" | Gemiddeld Intel Iris Plus Graphics 655 | Gemiddelde van klas Subnotebook | |
|---|---|---|---|---|---|---|---|---|
| Power Consumption | -15% | -3% | -28% | -52% | -23% | -38% | -8% | |
| Idle Minimum * (Watt) | 2.2 | 2.3 -5% | 3 -36% | 5.2 -136% | 6.7 -205% | 3.9 -77% | 5.96 ? -171% | 3.82 ? -74% |
| Idle Average * (Watt) | 7.2 | 8.7 -21% | 6.3 12% | 8.6 -19% | 8.6 -19% | 7.8 -8% | 8.44 ? -17% | 6.61 ? 8% |
| Idle Maximum * (Watt) | 8.2 | 12.2 -49% | 8.9 -9% | 10.5 -28% | 9.4 -15% | 10.8 -32% | 10.6 ? -29% | 7.99 ? 3% |
| Load Average * (Watt) | 54 | 53.3 1% | 40.8 24% | 44.2 18% | 64.1 -19% | 53 2% | 46.5 ? 14% | 41.9 ? 22% |
| Load Maximum * (Watt) | 63.9 | 64 -0% | 67.5 -6% | 47.5 26% | 64.1 -0% | 62.7 2% | 56.2 ? 12% | 64.1 ? -0% |
| Witcher 3 ultra * (Watt) | 63.7 |
* ... kleiner is beter
| Apple MacBook Pro 13 2019 i5 4TB3 i5-8279U, Iris Plus Graphics 655, 58 Wh | Apple MacBook Pro 13 2018 Touchbar i5 i5-8259U, Iris Plus Graphics 655, 58 Wh | Lenovo ThinkPad X1 Carbon 2019-20QE000VGE i7-8665U, UHD Graphics 620, 51 Wh | Dell XPS 13 9380 i7 4K i7-8565U, UHD Graphics 620, 52 Wh | Razer Blade Stealth i7-8565U i7-8565U, GeForce MX150, 53.1 Wh | HP Envy 13-aq0003ng i7-8565U, GeForce MX250, 53.2 Wh | Gemiddelde van klas Subnotebook | |
|---|---|---|---|---|---|---|---|
| Batterijduur | -13% | -24% | -33% | -17% | -26% | 26% | |
| H.264 (h) | 12 | 10.9 -9% | 9.8 -18% | 15.6 ? 30% | |||
| WiFi v1.3 (h) | 11.5 | 9.7 -16% | 8.2 -29% | 7.7 -33% | 9.5 -17% | 8.5 -26% | 14 ? 22% |
| Witcher 3 ultra (h) | 1.6 |
Pro
Contra
Voor het volledige, Engelse testrapport, klik hier.
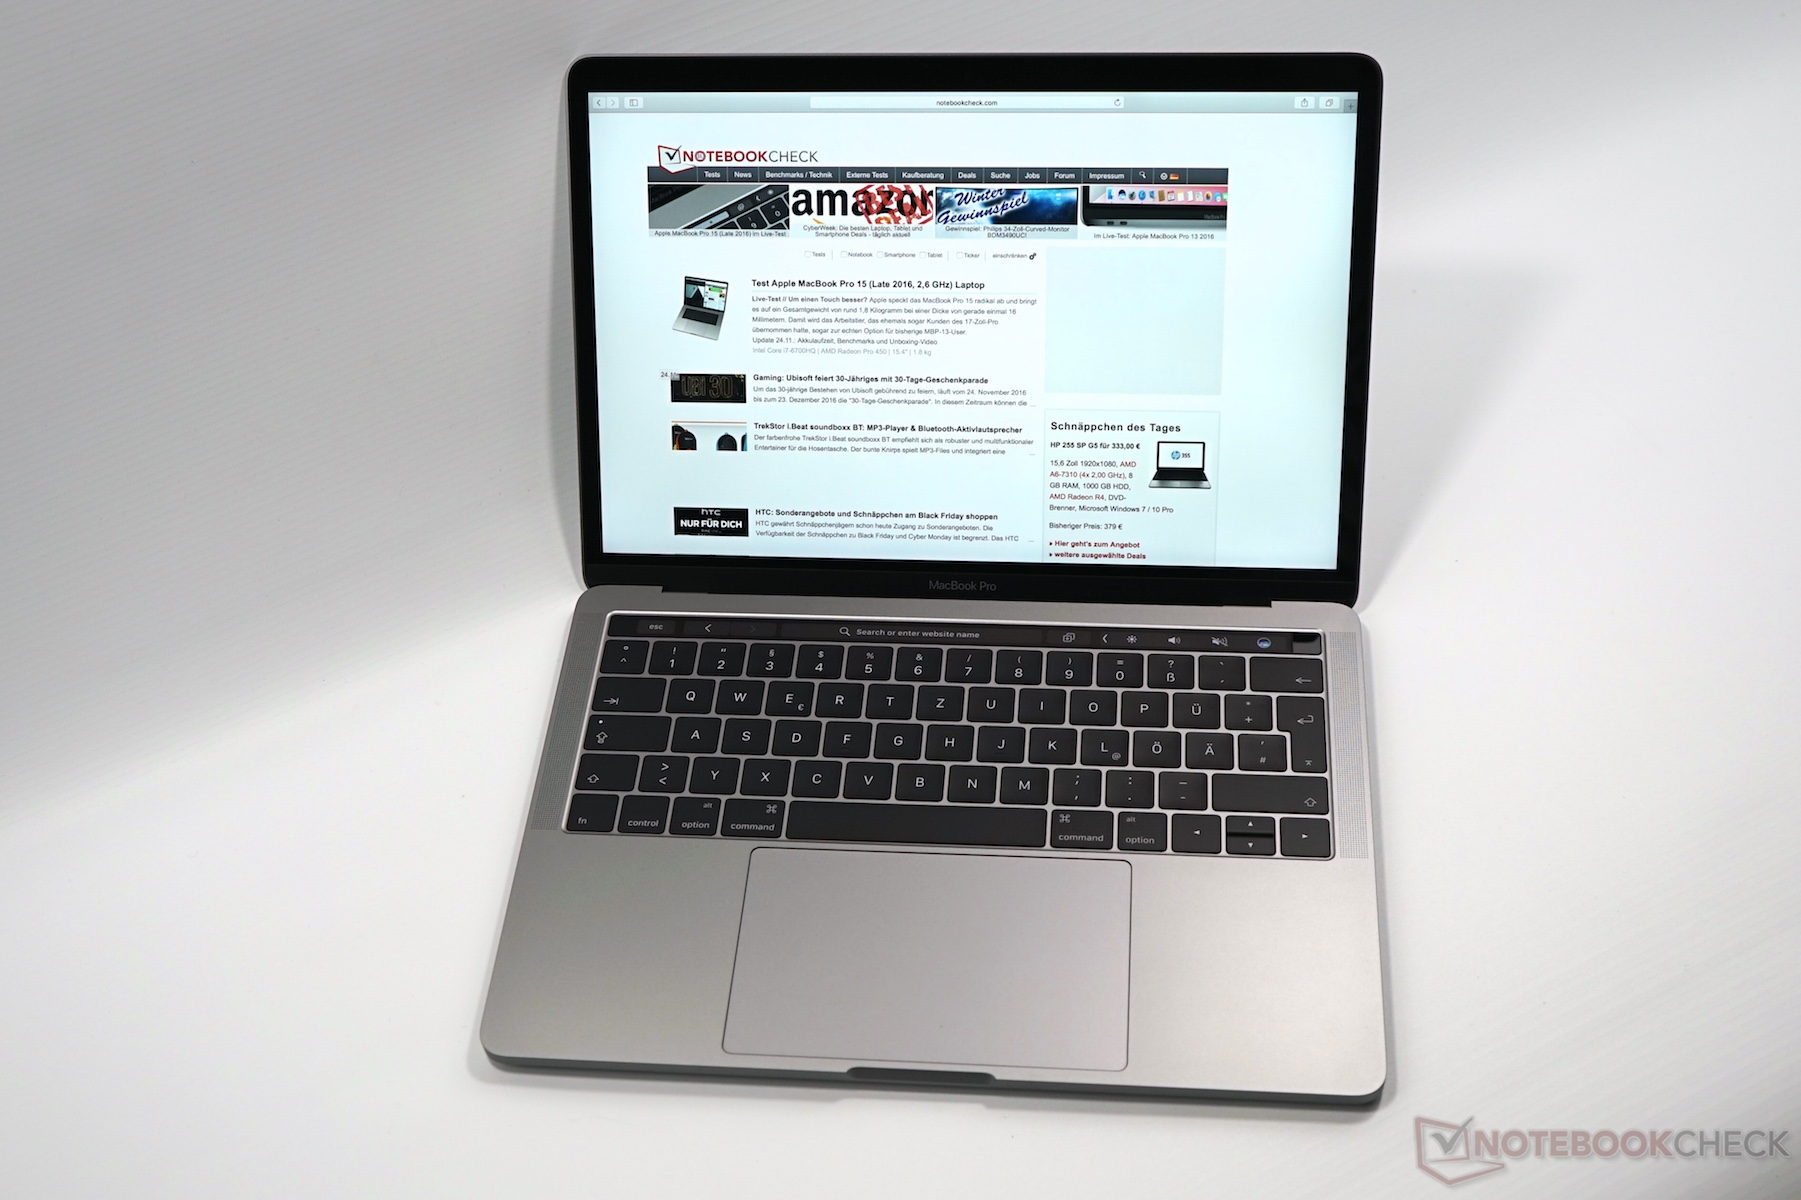
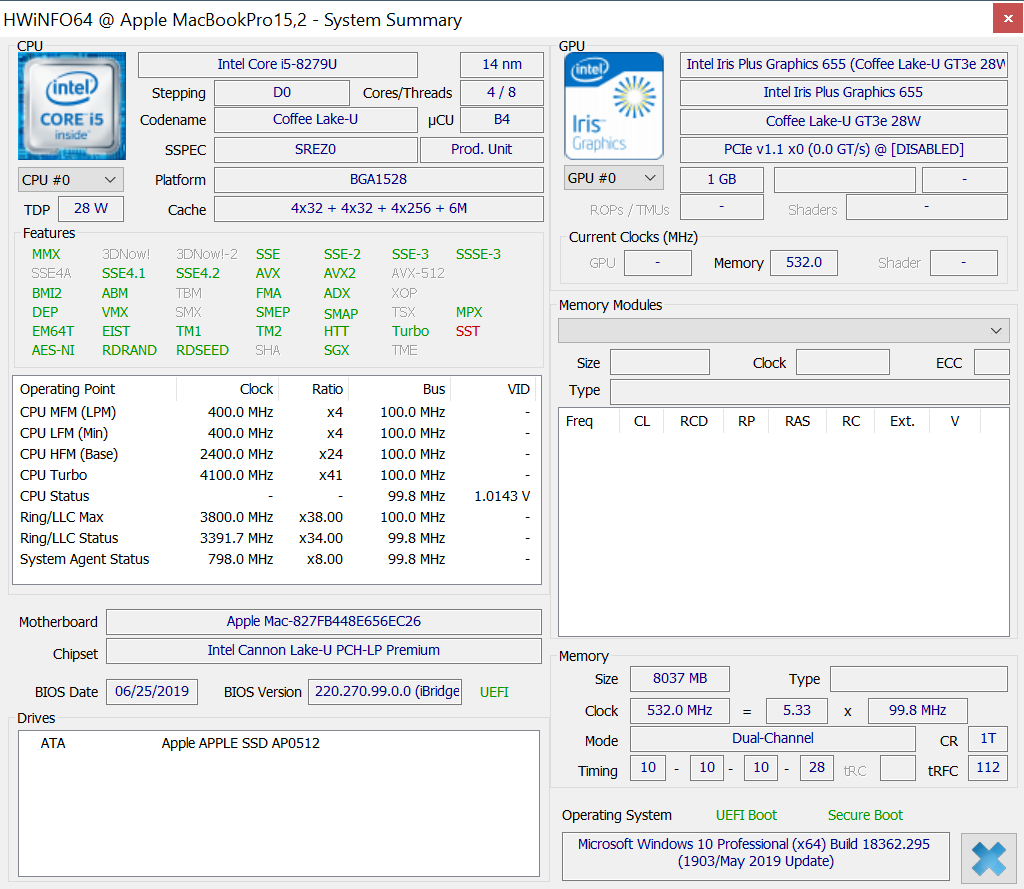
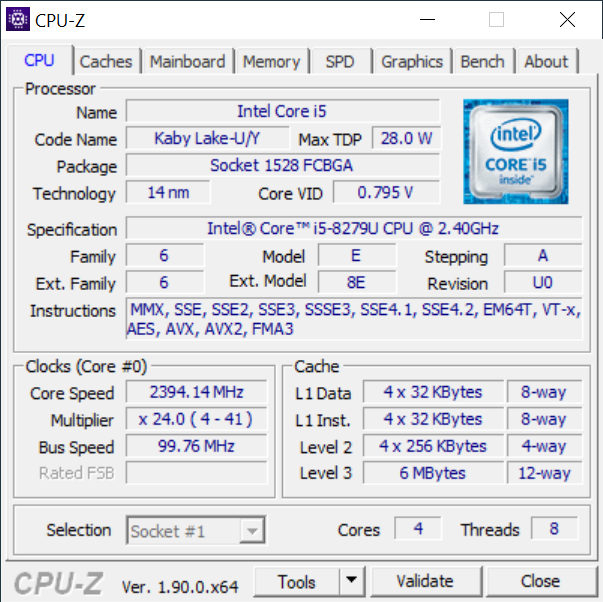
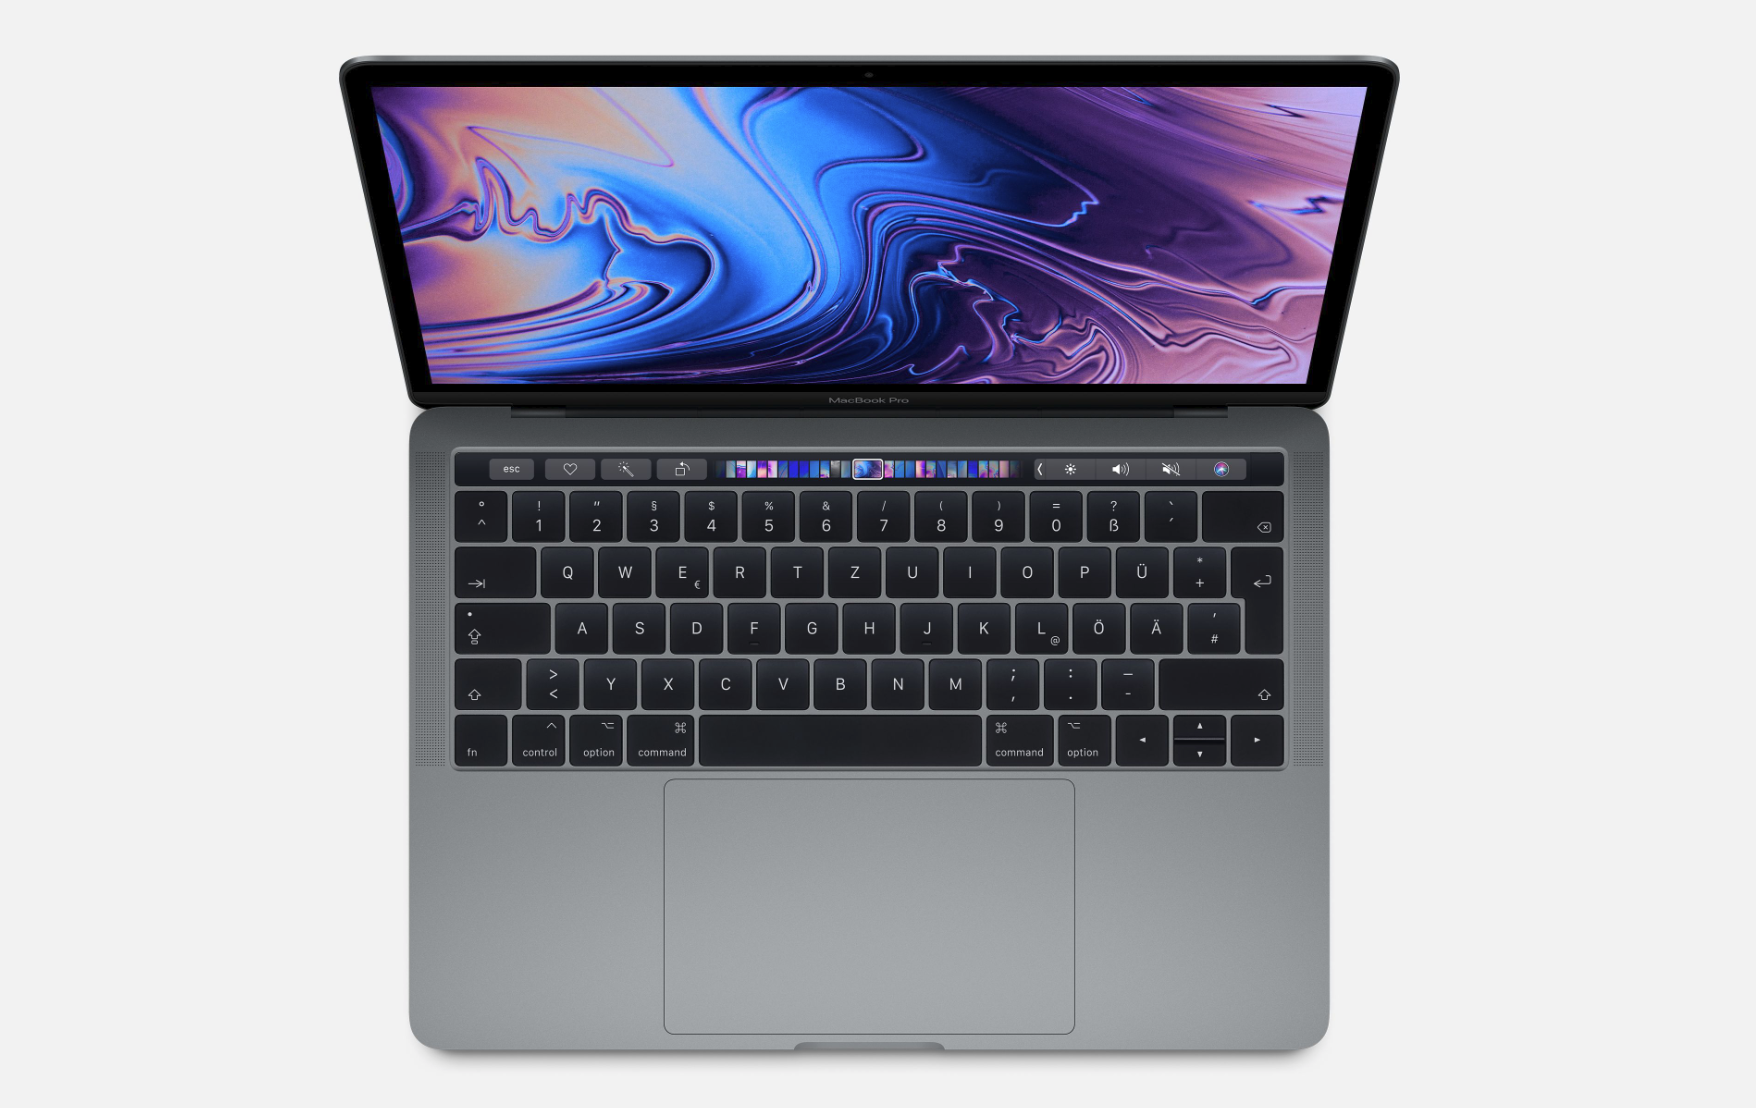
Het 2019-model van de Apple MacBook Pro 13 met 4 Thunderbolt 3-poorten is slechts een lichte modelupdate. De belangrijkste focus van de fabrikant dit jaar was zeker de update van de goedkopere MacBook Pro 13 (2x TB3), die nu ook is uitgerust met de Touch Bar.
Enigszins verrassend voor ons, de CPU-prestaties zijn aanzienlijk verbeterd, ondanks de vrij vergelijkbare processor, en de prestaties dalen ook niet bij langdurige belasting. Dit is zeldzaam in de subnotebookcategorie. Ook aan het beeldscherm is niets veranderd, maar het paneel is nog steeds een van de beste op de markt en hoeft de vergelijking met de concurrentie niet te vrezen. Bovendien is het ook een van de weinige panelen in het 16:10-formaat.
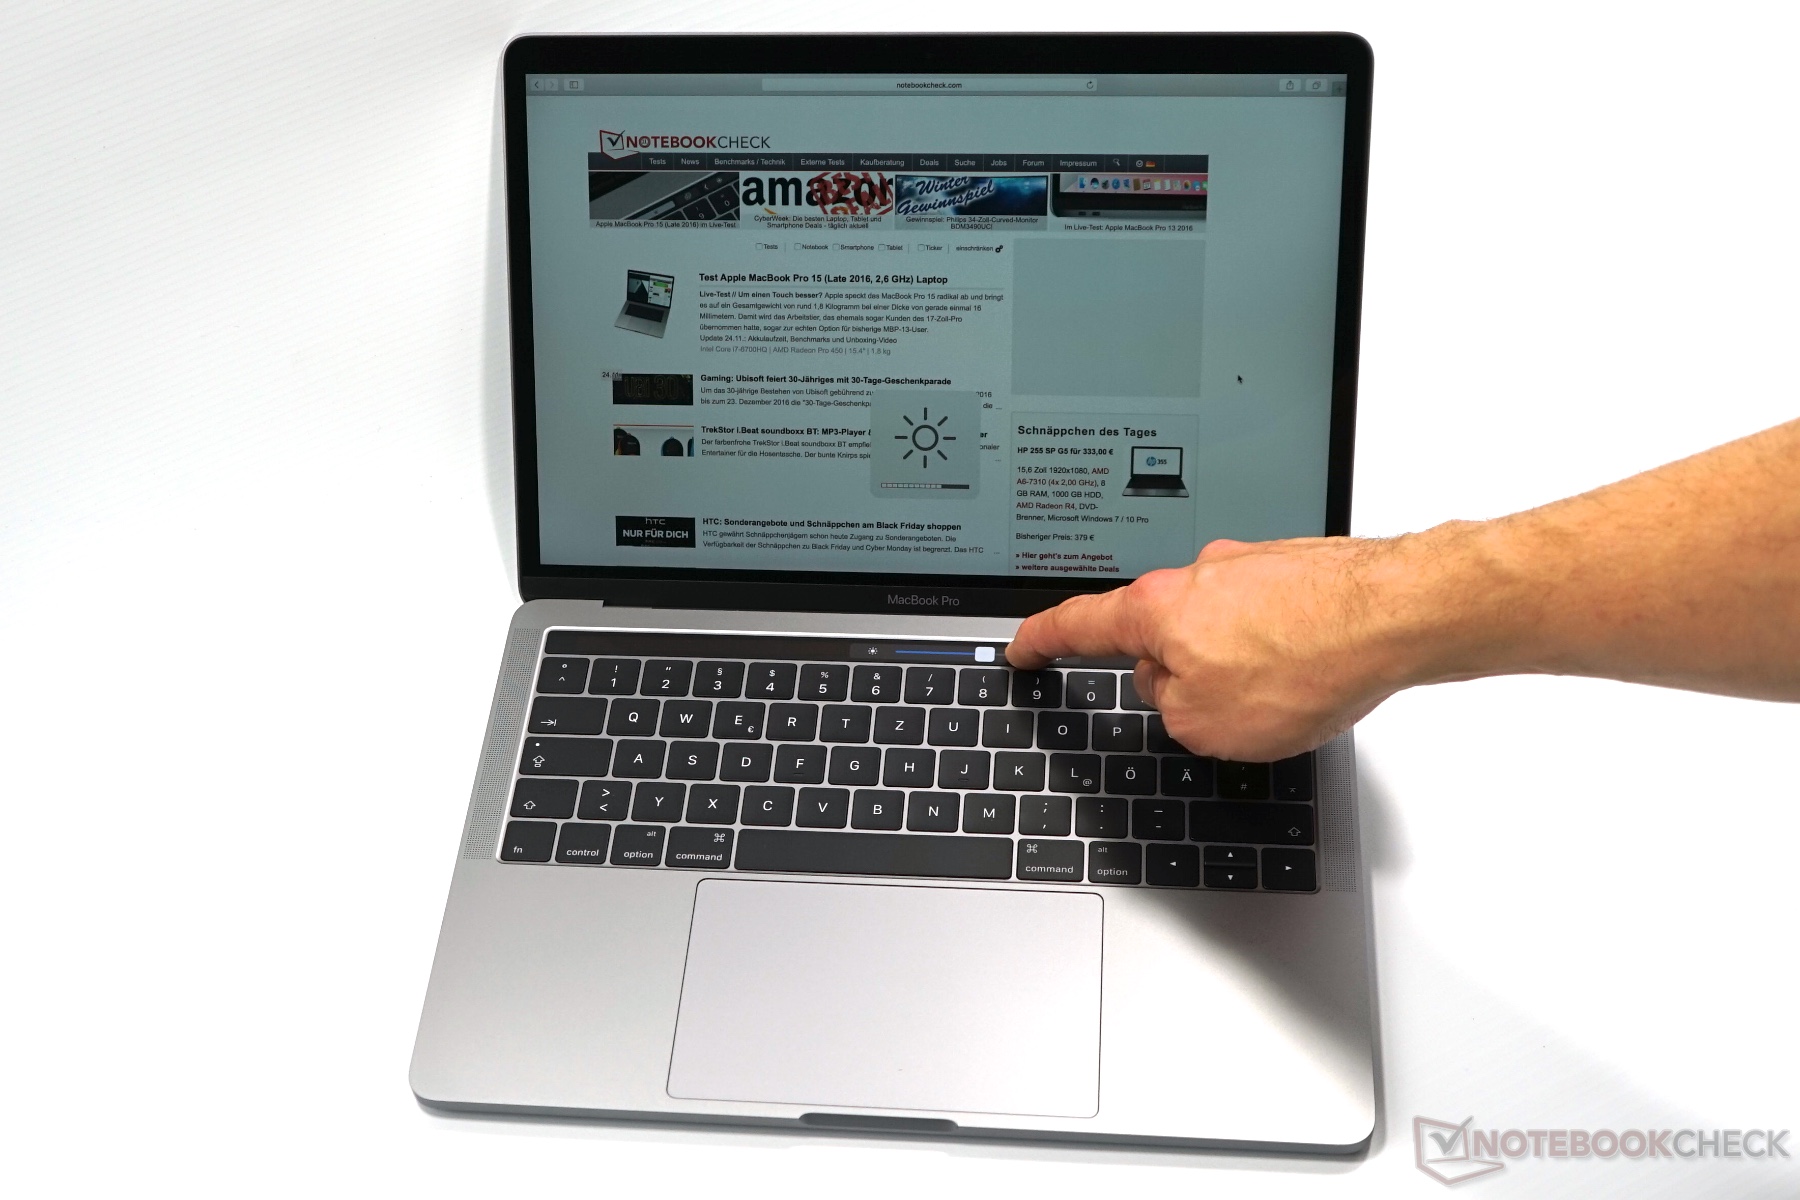
Verbeterde CPU-prestaties en een enigszins herzien toetsenbord: de wijzigingen in de 2019 MacBook Pro 13 met 4x Thunderbolt-poorten zijn gering en rechtvaardigen in geen geval een upgrade van het model van vorig jaar. Desalniettemin is de MBP 13 nog steeds een geweldige subnotebook.
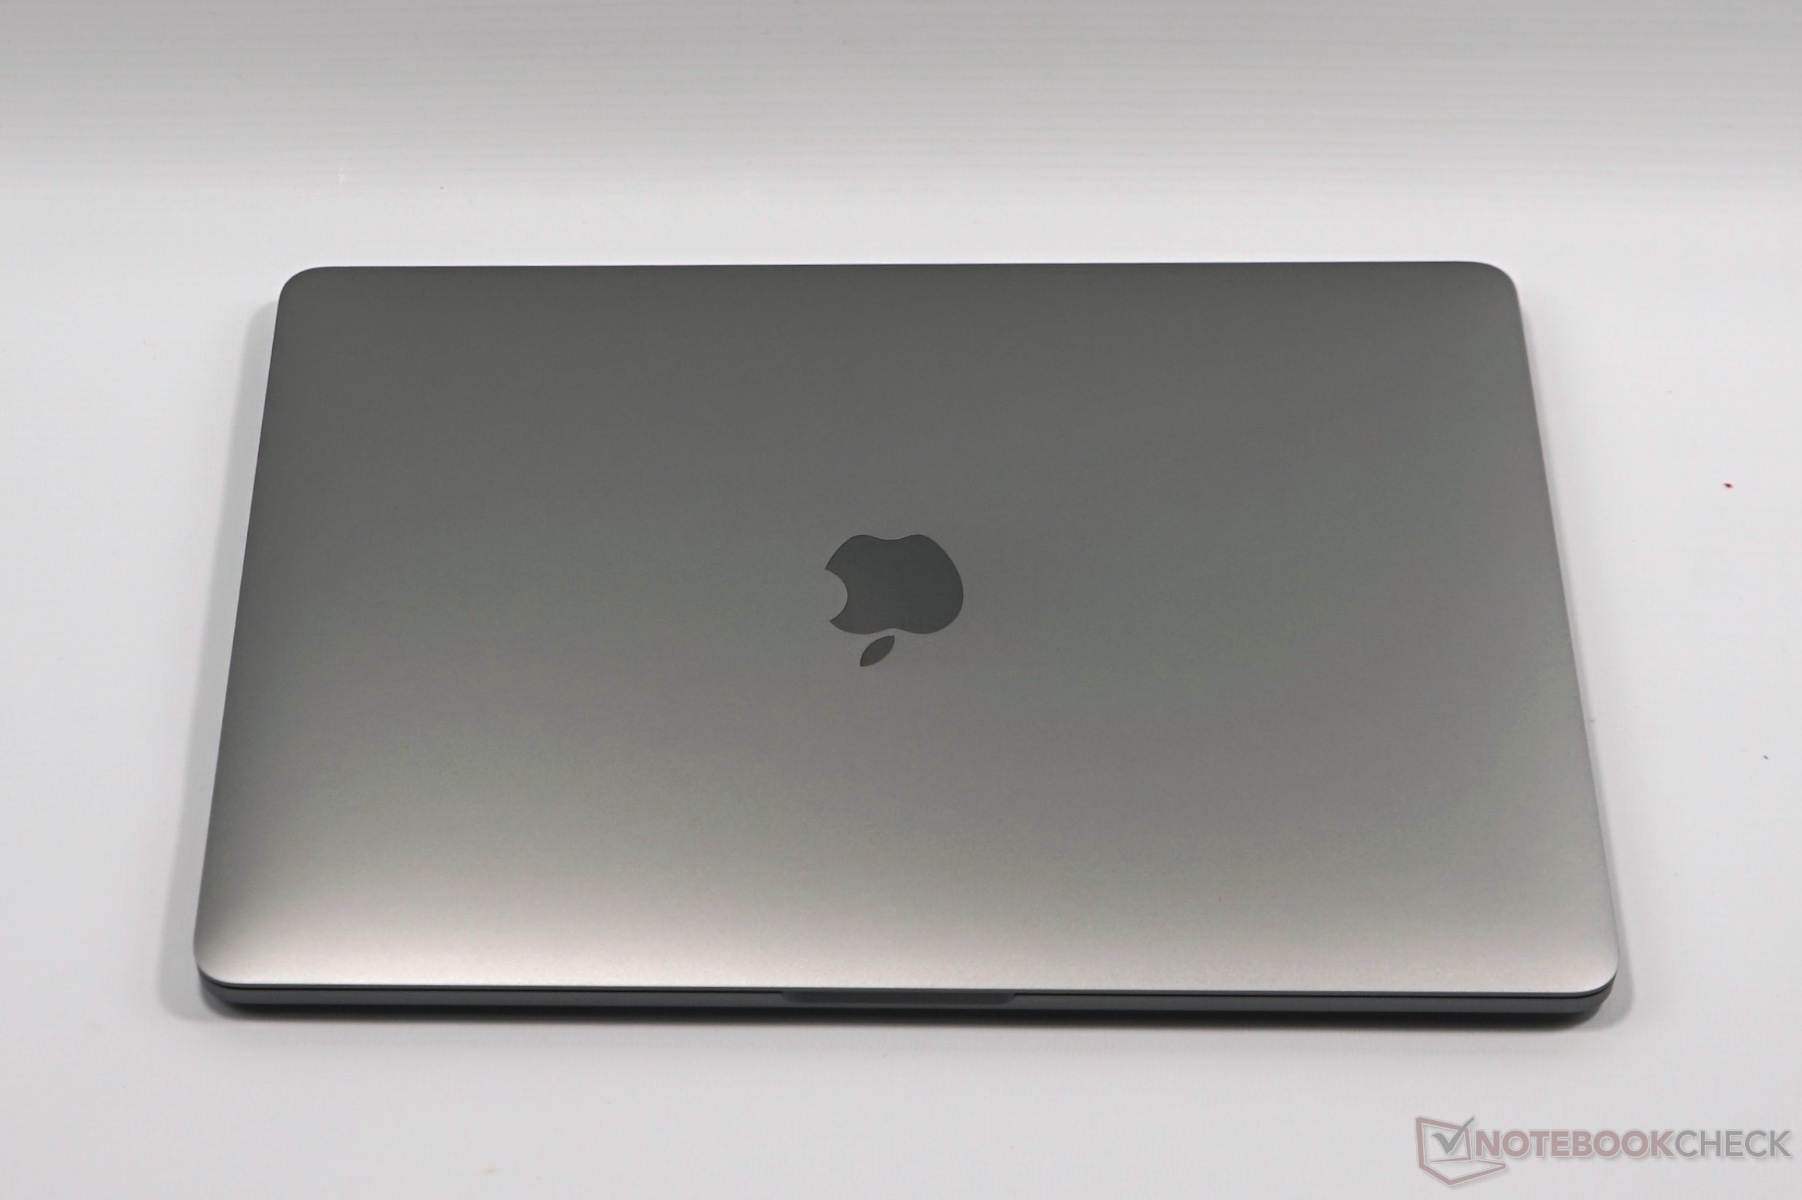
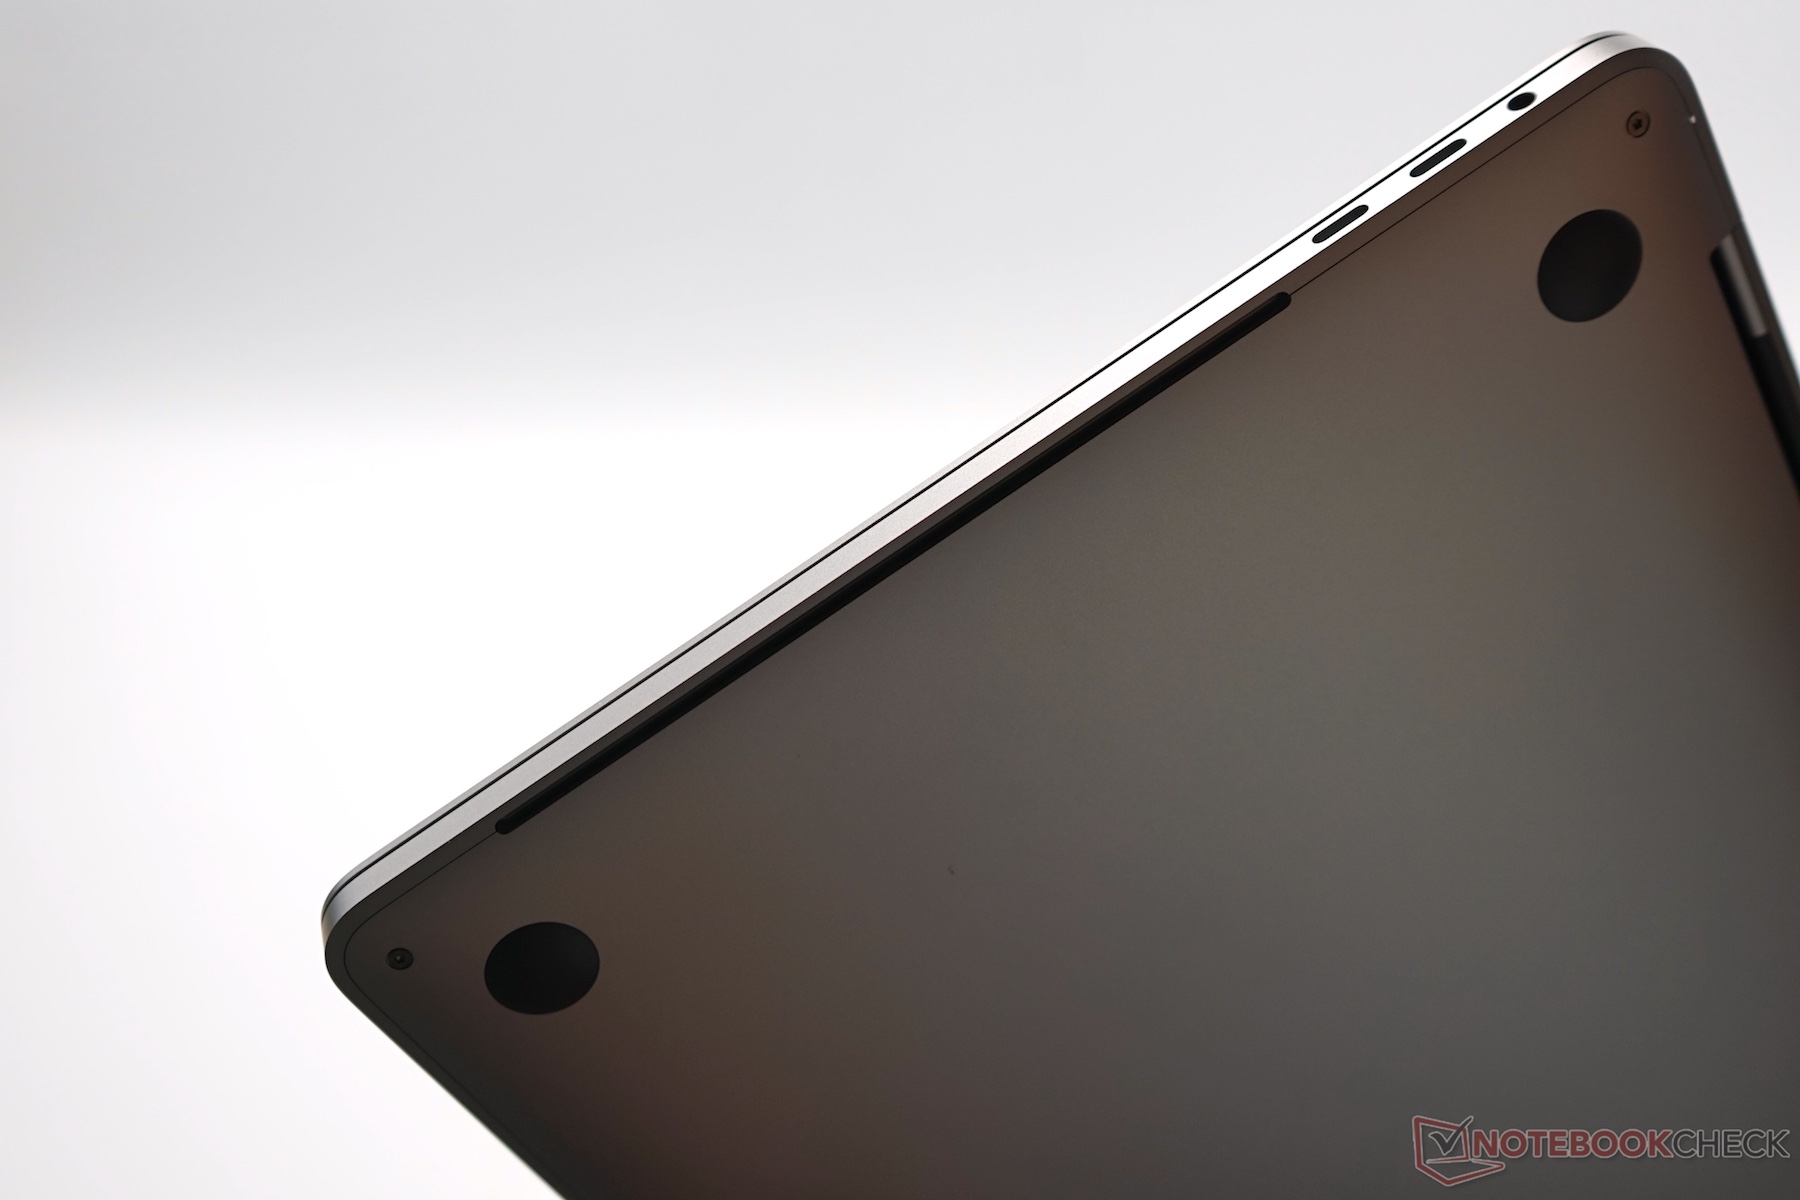
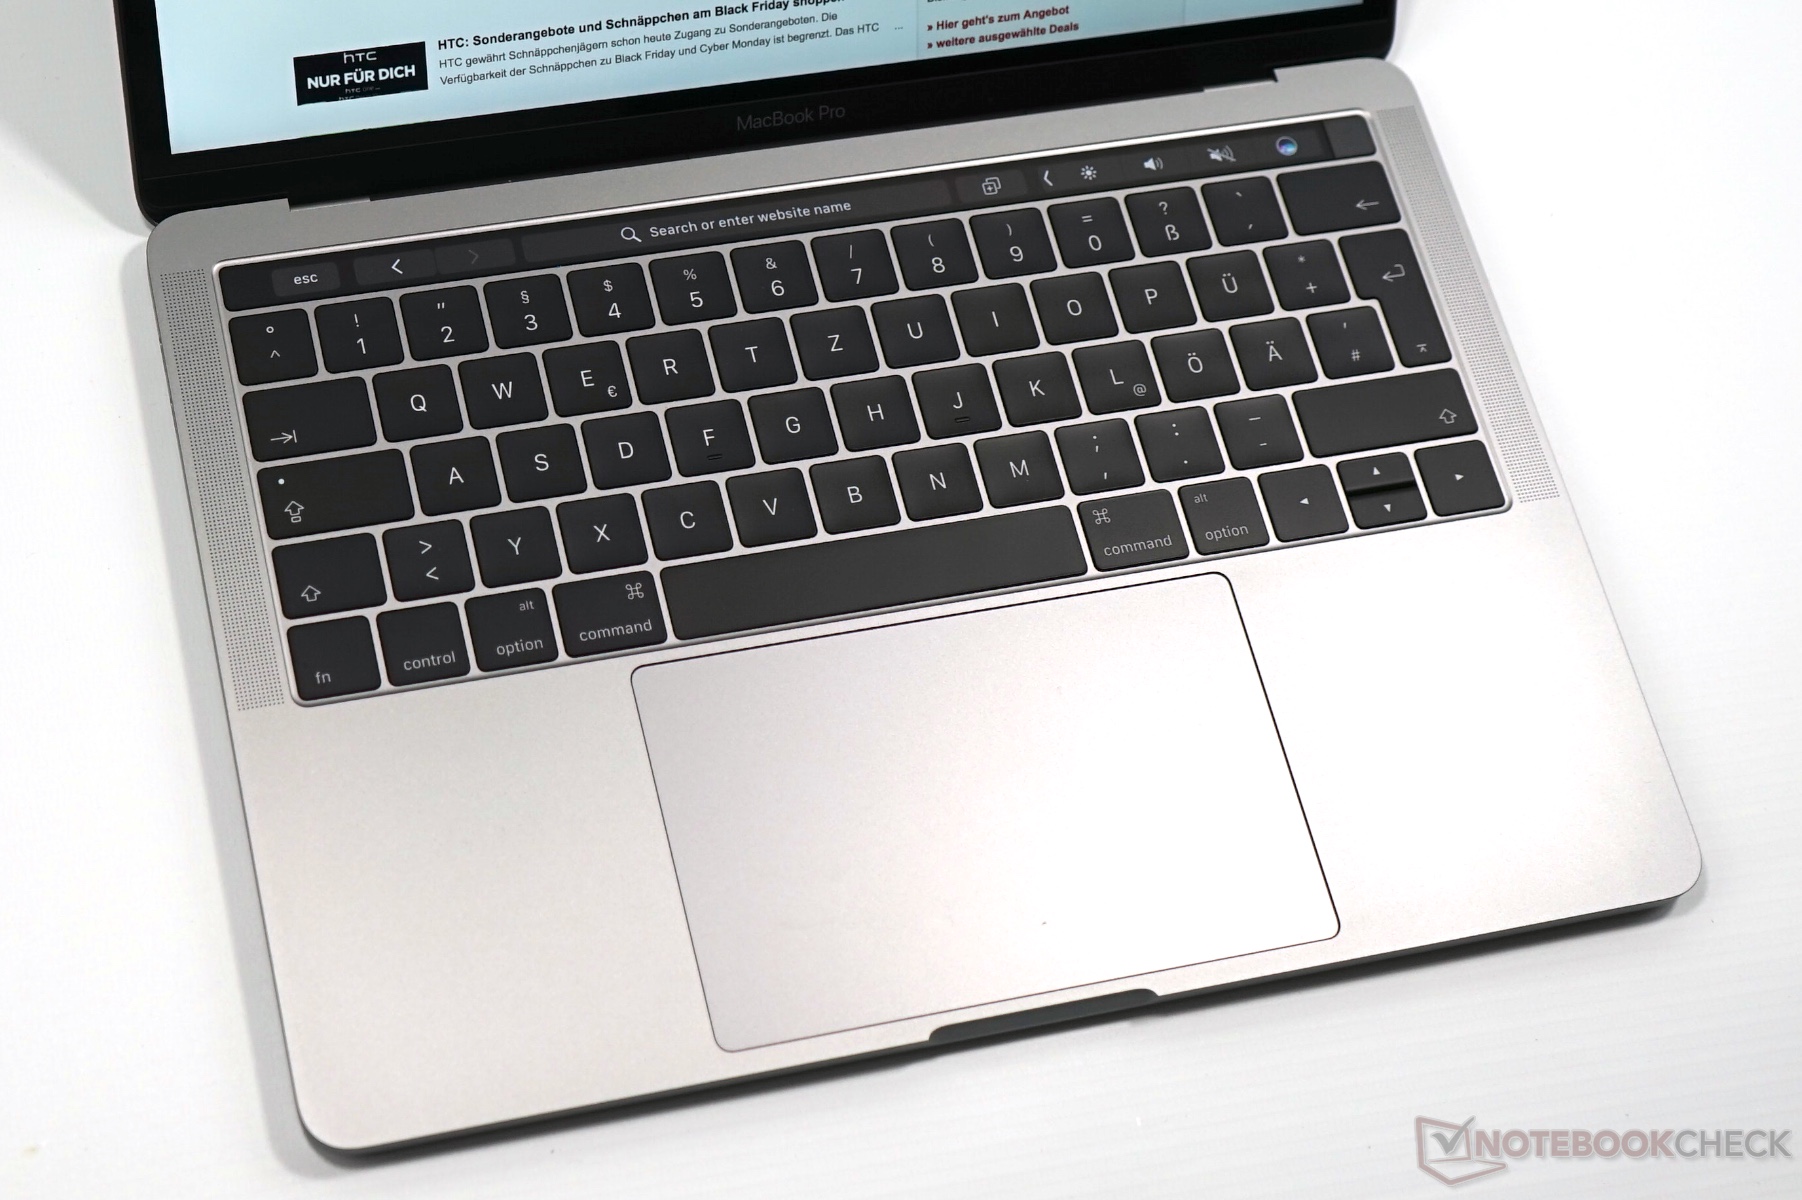
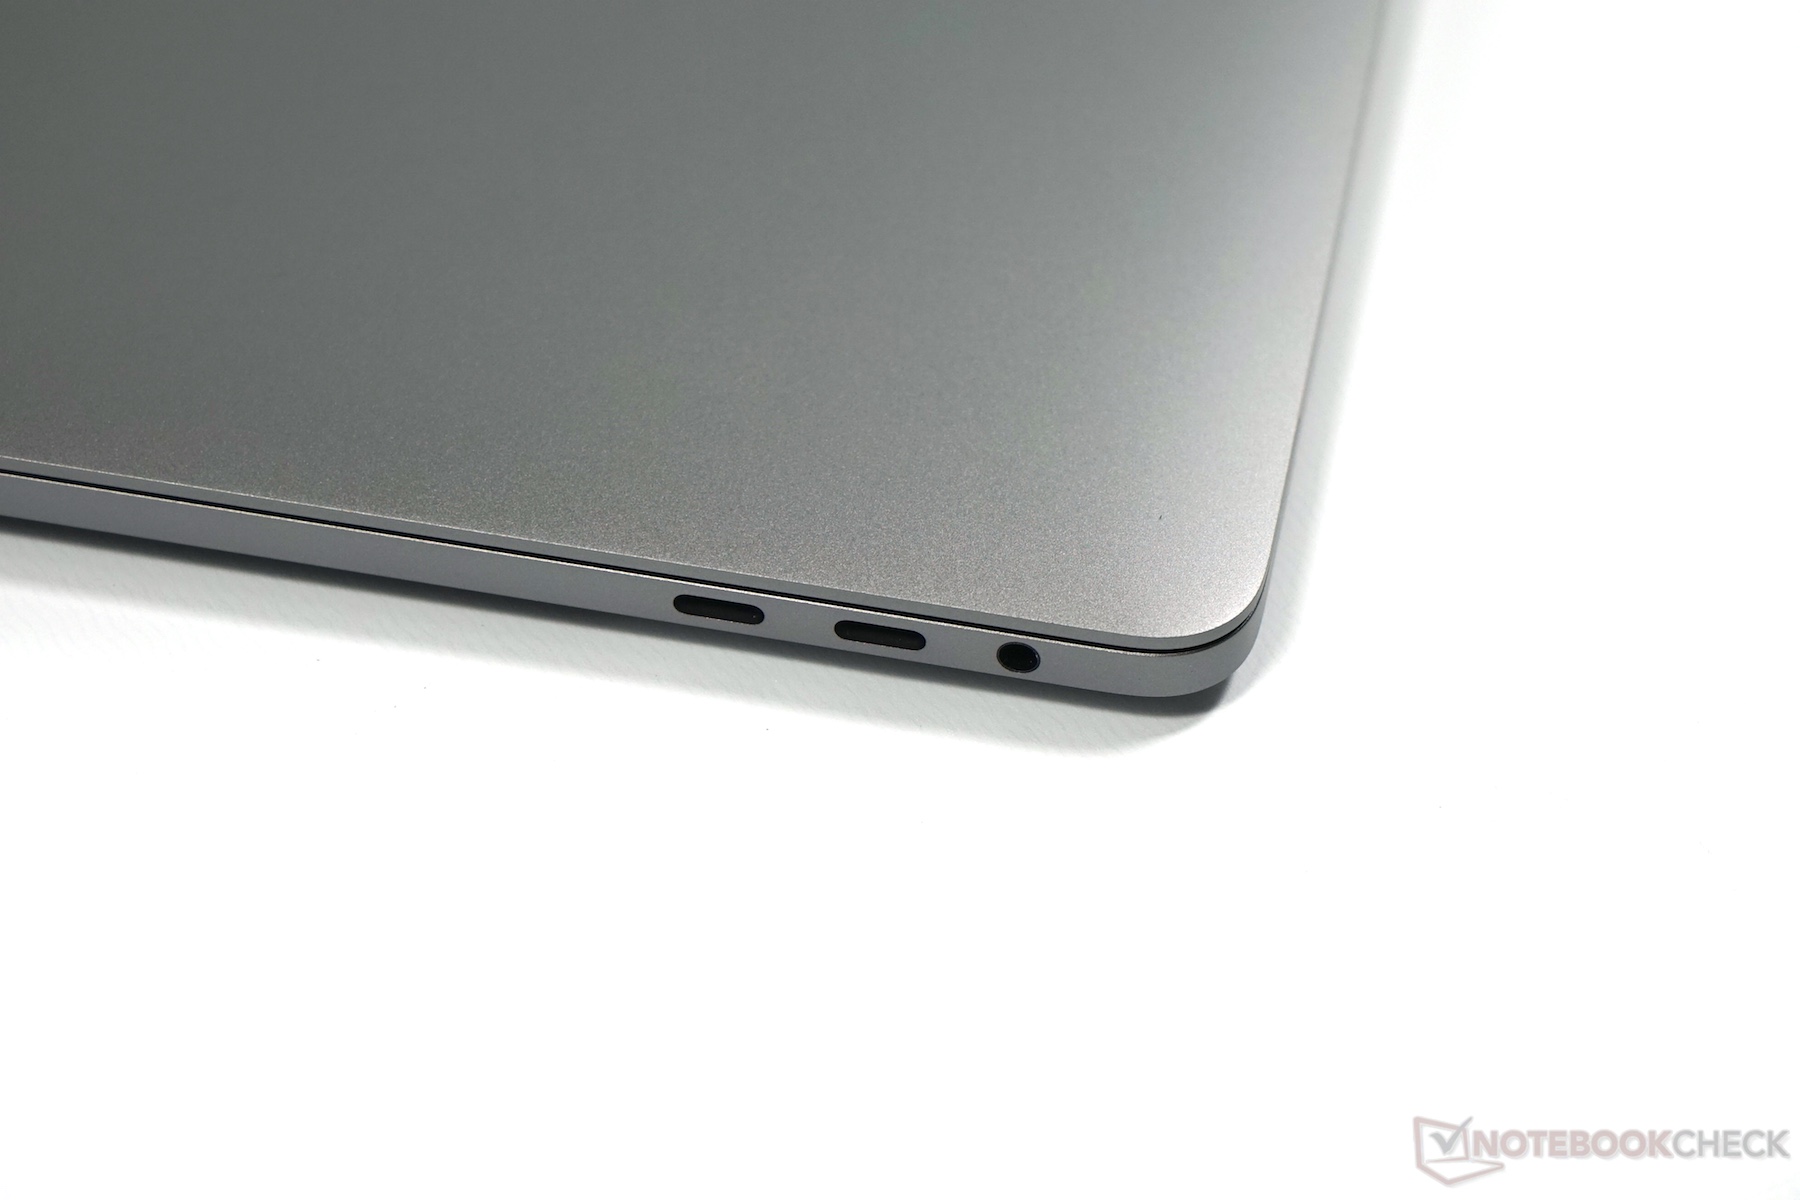
Naast de bekende voordelen (geweldige behuizing, perfect touchpad, 4x Thunderbolt 3, lange batterijduur), blijven de nadelen van de voorganger. De Thunderbolt-poorten zijn extreem veelzijdig, maar in het dagelijks gebruik heb je vaak adapters nodig. Er is geen SD-kaartlezer en het toetsenbord is nog steeds een subjectieve zaak, maar de betrouwbaarheidsproblemen van de afgelopen jaren hebben al een onaangename nasmaak achtergelaten. Ten slotte is er nog steeds de hoge prijs en de meestal hoge meerprijs voor hardware-upgrades. Maar dit verandert niets aan het feit dat de 2019-versie van de MacBook Pro 13 een geweldig subnotebook is.
Apple MacBook Pro 13 2019 i5 4TB3
- 02-10-2019 v7 (old)
Andreas Osthoff