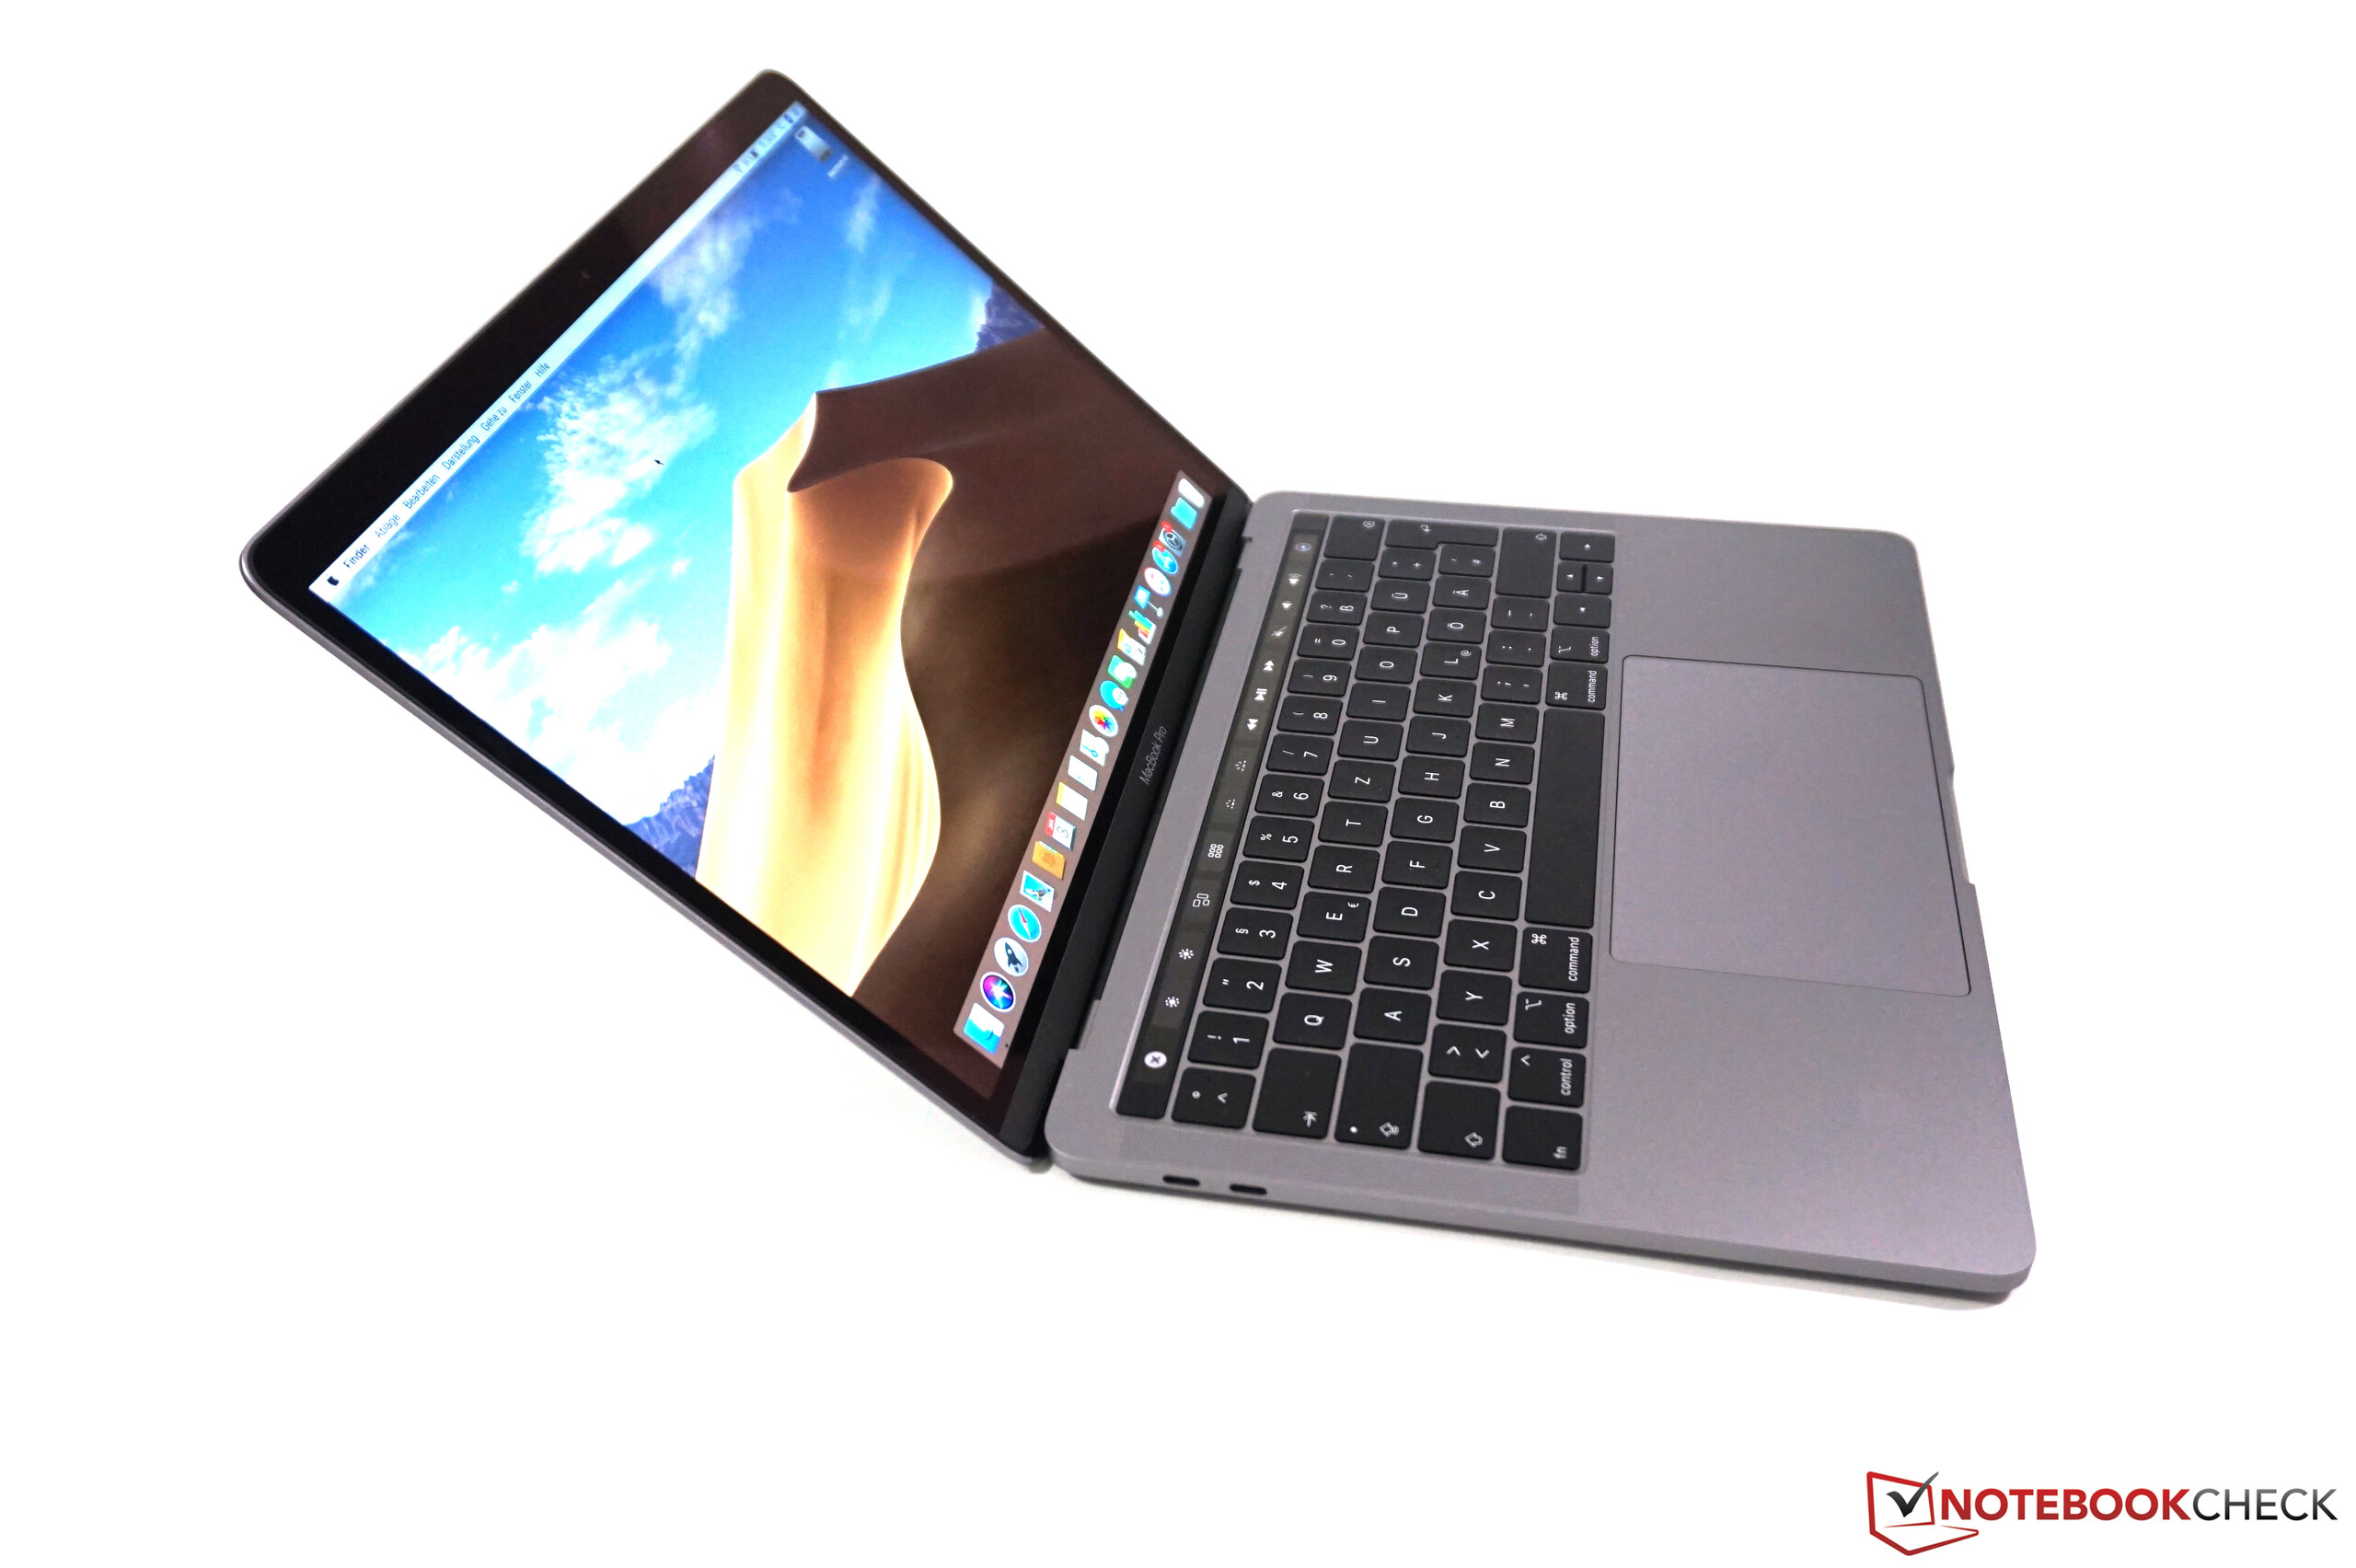
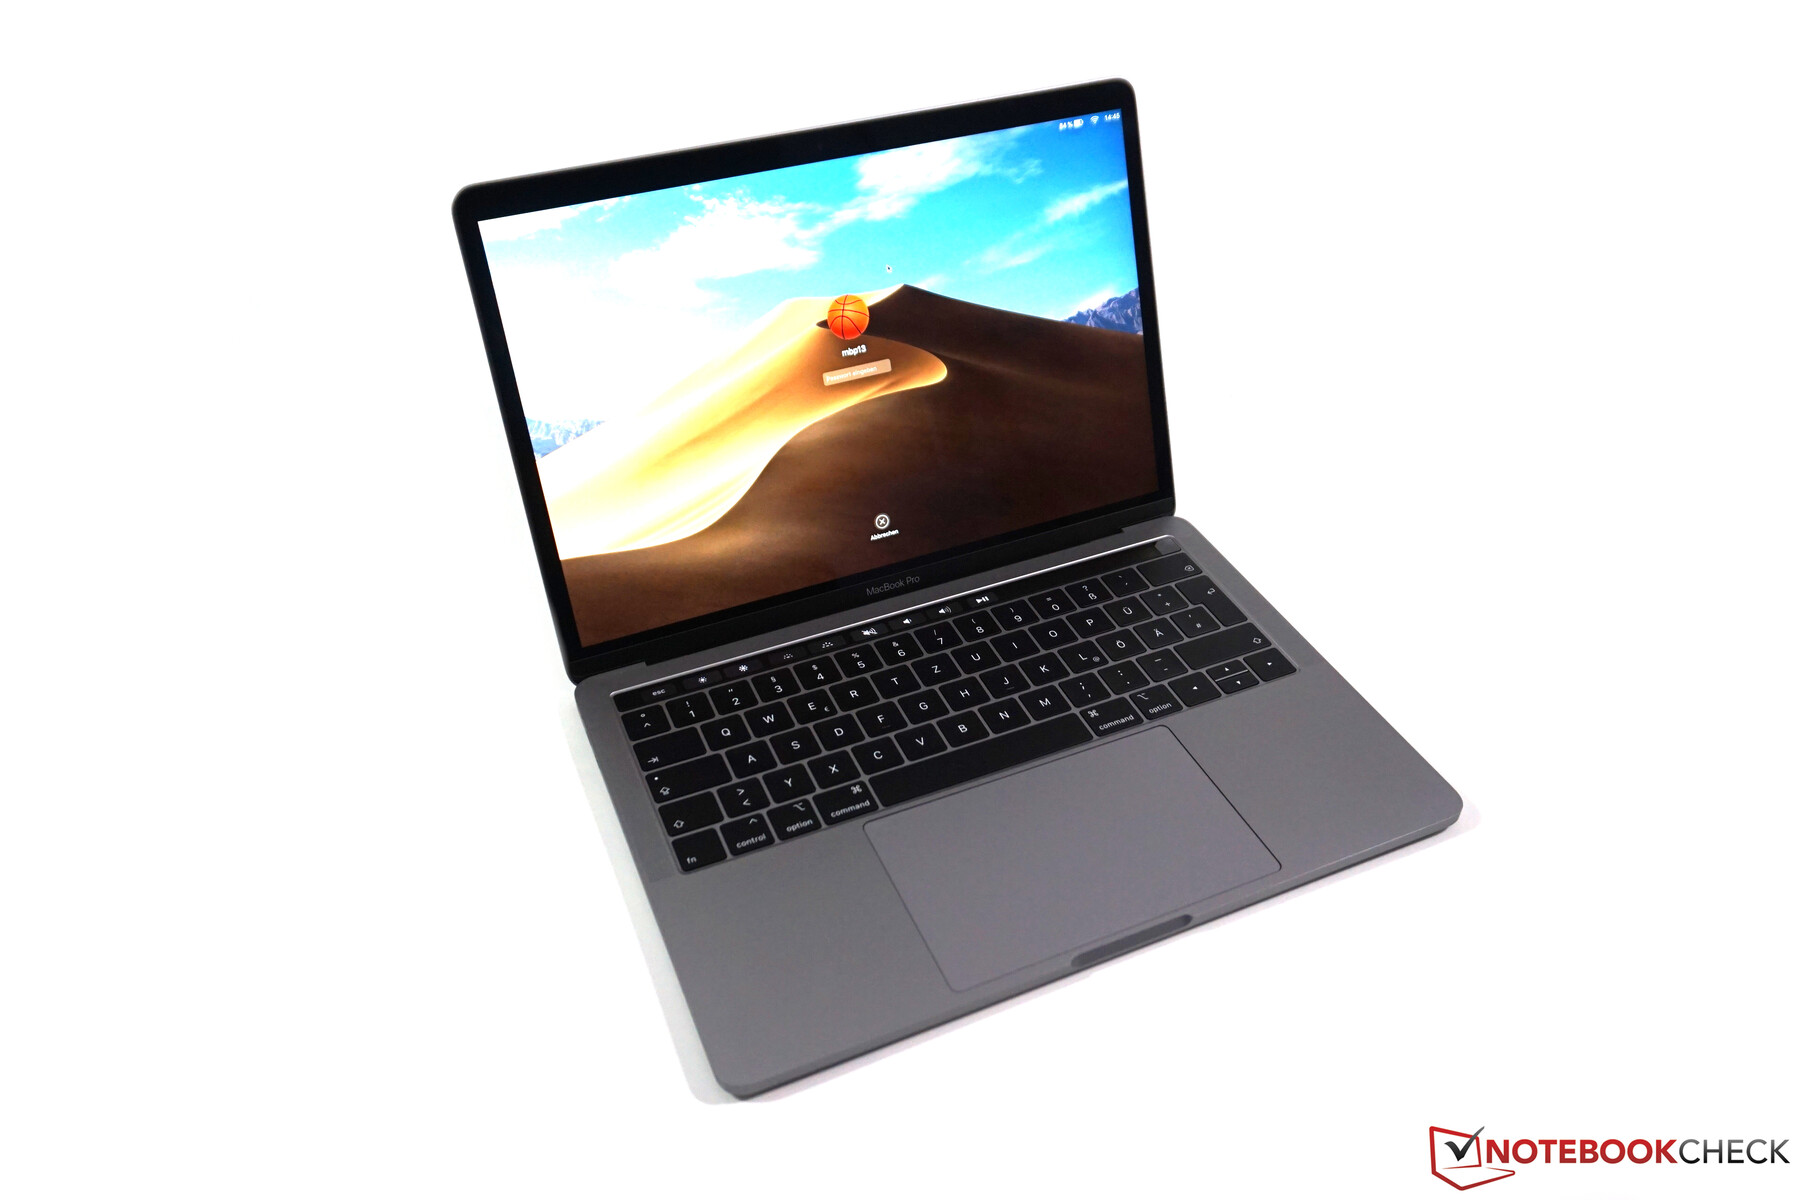
Kort testrapport Apple MacBook Pro 13 2019: Entry-Level Pro met Touch Bar
Evaluatie | Datum | Model | Gewicht | Hoogte | Formaat | Resolutie | Beste prijs |
|---|---|---|---|---|---|---|---|
| 90.6 % v7 (old) | 02-2020 | Apple MacBook Pro 13 2019 2TB3 i5-8257U, Iris Plus Graphics 645 | 1.4 kg | 14.9 mm | 13.30" | 2560x1600 | |
| 90.7 % v7 (old) | 10-2019 | Apple MacBook Pro 13 2019 i5 4TB3 i5-8279U, Iris Plus Graphics 655 | 1.4 kg | 14.9 mm | 13.30" | 2560x1600 | |
| 88.1 % v6 (old) | 07-2017 | Apple MacBook Pro 13 2017 i5-7360U, Iris Plus Graphics 640 | 1.4 kg | 14.9 mm | 13.30" | 2560x1600 | |
| 85.6 % v7 (old) | 08-2019 | Apple Macbook Air 2019 i5-8210Y, UHD Graphics 617 | 1.3 kg | 15.6 mm | 13.30" | 2560x1600 | |
| 87.7 % v6 (old) | 02-2019 | Dell XPS 13 9380 i7 4K i7-8565U, UHD Graphics 620 | 1.2 kg | 11.6 mm | 13.30" | 3840x2160 | |
| 86.3 % v7 (old) | 10-2019 | Razer Blade Stealth i7-1065G7 Iris Plus i7-1065G7, Iris Plus Graphics G7 (Ice Lake 64 EU) | 1.4 kg | 15.3 mm | 13.30" | 1920x1080 | |
| 84.5 % v7 (old) | 08-2019 | HP Envy 13-aq0003ng i7-8565U, GeForce MX250 | 1.2 kg | 14.7 mm | 13.30" | 1920x1080 |


| |||||||||||||||||||||||||
Helderheidsverdeling: 92 %
Helderheid in Batterij-modus: 602 cd/m²
Contrast: 1723:1 (Zwart: 0.35 cd/m²)
ΔE ColorChecker Calman: 1.7 | ∀{0.5-29.43 Ø4.73}
calibrated: 0.7
ΔE Greyscale Calman: 2.1 | ∀{0.09-98 Ø4.97}
99.4% sRGB (Argyll 1.6.3 3D)
76.7% AdobeRGB 1998 (Argyll 1.6.3 3D)
85.6% AdobeRGB 1998 (Argyll 3D)
99.4% sRGB (Argyll 3D)
96.1% Display P3 (Argyll 3D)
Gamma: 2.18
CCT: 6843 K
| Apple MacBook Pro 13 2019 2TB3 APPA03D, IPS, 2560x1600, 13.3" | Apple MacBook Pro 13 2019 i5 4TB3 APPA03E, IPS, 2560x1600, 13.3" | Apple MacBook Pro 13 2017 APPA033, IPS, 2560x1600, 13.3" | Apple Macbook Air 2019 APPA041, IPS, 2560x1600, 13.3" | Dell XPS 13 9380 i7 4K ID: AUO 282B B133ZAN Dell: 90NTH, IPS, 3840x2160, 13.3" | Razer Blade Stealth i7-1065G7 Iris Plus Sharp LQ133M1JW41, IPS, 1920x1080, 13.3" | HP Envy 13-aq0003ng InfoVision M133NVF3 R2, IPS, 1920x1080, 13.3" | |
|---|---|---|---|---|---|---|---|
| Display | 2% | 2% | -18% | -21% | -18% | -22% | |
| Display P3 Coverage (%) | 96.1 | 98.7 3% | 99.2 3% | 67.4 -30% | 64.8 -33% | 66.2 -31% | 64.4 -33% |
| sRGB Coverage (%) | 99.4 | 100 1% | 99.9 1% | 94.7 -5% | 93.6 -6% | 97.2 -2% | 91.7 -8% |
| AdobeRGB 1998 Coverage (%) | 85.6 | 87.7 2% | 87.1 2% | 69.1 -19% | 65.8 -23% | 67.1 -22% | 65.2 -24% |
| Response Times | 15% | 17% | 16% | -19% | 8% | 35% | |
| Response Time Grey 50% / Grey 80% * (ms) | 50.4 ? | 43.2 ? 14% | 42.8 ? 15% | 42.4 ? 16% | 64.8 ? -29% | 45.2 ? 10% | 31 ? 38% |
| Response Time Black / White * (ms) | 35.2 ? | 29.6 ? 16% | 28.8 ? 18% | 29.6 ? 16% | 38 ? -8% | 33.2 ? 6% | 24 ? 32% |
| PWM Frequency (Hz) | 116300 ? | 111100 ? | 22730 ? | 4000 ? | |||
| Screen | -26% | -6% | -8% | -45% | -5% | -51% | |
| Brightness middle (cd/m²) | 603 | 518 -14% | 588 -2% | 421 -30% | 428.3 -29% | 422.6 -30% | 768 27% |
| Brightness (cd/m²) | 577 | 480 -17% | 561 -3% | 393 -32% | 414 -28% | 404 -30% | 778 35% |
| Brightness Distribution (%) | 92 | 87 -5% | 92 0% | 88 -4% | 88 -4% | 87 -5% | 82 -11% |
| Black Level * (cd/m²) | 0.35 | 0.34 3% | 0.45 -29% | 0.34 3% | 0.27 23% | 0.35 -0% | 0.48 -37% |
| Contrast (:1) | 1723 | 1524 -12% | 1307 -24% | 1238 -28% | 1586 -8% | 1207 -30% | 1600 -7% |
| Colorchecker dE 2000 * | 1.7 | 1.5 12% | 1.7 -0% | 1.5 12% | 2.69 -58% | 1.02 40% | 3.49 -105% |
| Colorchecker dE 2000 max. * | 3.1 | 2.8 10% | 3.5 -13% | 3.8 -23% | 6.19 -100% | 3.06 1% | 7.41 -139% |
| Colorchecker dE 2000 calibrated * | 0.7 | 2.6 -271% | 2.01 -187% | 0.95 -36% | 2.07 -196% | ||
| Greyscale dE 2000 * | 2.1 | 2 5% | 1.9 10% | 1.2 43% | 3.7 -76% | 1 52% | 4.09 -95% |
| Gamma | 2.18 101% | 2.22 99% | 2.33 94% | 2.21 100% | 2.1 105% | 2.21 100% | 2.54 87% |
| CCT | 6843 95% | 6898 94% | 6738 96% | 6694 97% | 6706 97% | 6502 100% | 6452 101% |
| Color Space (Percent of AdobeRGB 1998) (%) | 76.7 | 78.4 2% | 77.92 2% | 61.3 -20% | 60.4 -21% | 62.1 -19% | 60 -22% |
| Color Space (Percent of sRGB) (%) | 99.4 | 99.9 1% | 99.94 1% | 94.6 -5% | 93.5 -6% | 97.1 -2% | 92 -7% |
| Totaal Gemiddelde (Programma / Instellingen) | -3% /
-16% | 4% /
-1% | -3% /
-7% | -28% /
-37% | -5% /
-6% | -13% /
-35% |
* ... kleiner is beter
Responstijd Scherm
| ↔ Responstijd Zwart naar Wit | ||
|---|---|---|
| 35.2 ms ... stijging ↗ en daling ↘ gecombineerd | ↗ 19.6 ms stijging | 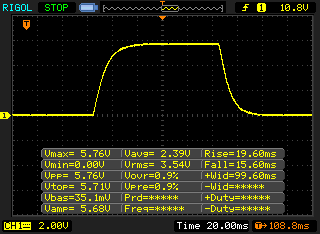 |
| ↘ 15.6 ms daling | ||
| Het scherm vertoonde trage responstijden in onze tests en is misschien te traag voor games. Ter vergelijking: alle testtoestellen variëren van 0.1 (minimum) tot 240 (maximum) ms. » 93 % van alle toestellen zijn beter. Dit betekent dat de gemeten responstijd slechter is dan het gemiddelde (19.9 ms) van alle geteste toestellen. | ||
| ↔ Responstijd 50% Grijs naar 80% Grijs | ||
| 50.4 ms ... stijging ↗ en daling ↘ gecombineerd | ↗ 24.4 ms stijging | 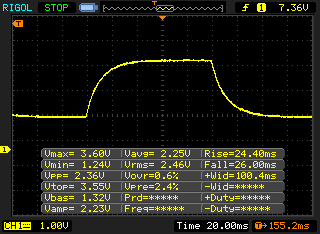 |
| ↘ 26 ms daling | ||
| Het scherm vertoonde trage responstijden in onze tests en is misschien te traag voor games. Ter vergelijking: alle testtoestellen variëren van 0.165 (minimum) tot 636 (maximum) ms. » 87 % van alle toestellen zijn beter. Dit betekent dat de gemeten responstijd slechter is dan het gemiddelde (31.1 ms) van alle geteste toestellen. | ||
Screen Flickering / PWM (Pulse-Width Modulation)
| Screen flickering / PWM waargenomen | 116300 Hz | ≤ 66 % helderheid instelling | 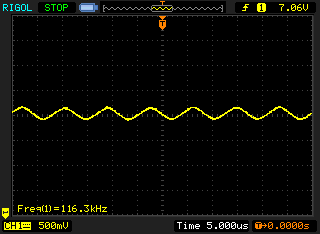 |
De achtergrondverlichting van het scherm flikkert op 116300 Hz (in het slechtste geval, bijvoorbeeld bij gebruik van PWM) aan een helderheid van 66 % en lager. Boven deze helderheid zou er geen flickering / PWM mogen optreden. De frequentie van 116300 Hz is redelijk hoog en de meeste mensen die gevoelig zijn aan flickering zouden dit dus niet mogen waarnemen of geïrriteerde ogen krijgen. Ter vergelijking: 52 % van alle geteste toestellen maakten geen gebruik van PWM om de schermhelderheid te verlagen. Als het wel werd gebruikt, werd een gemiddelde van 7801 (minimum: 5 - maximum: 343500) Hz waargenomen. | |||
| PCMark 8 Home Score Accelerated v2 | 3986 punten | |
| PCMark 8 Creative Score Accelerated v2 | 5589 punten | |
| PCMark 8 Work Score Accelerated v2 | 4238 punten | |
| PCMark 10 Score | 3751 punten | |
Help | ||

| 3DMark 11 Performance | 3238 punten | |
| 3DMark Fire Strike Score | 1736 punten | |
| 3DMark Time Spy Score | 624 punten | |
Help | ||
| lage | gem. | hoge | ultra | |
|---|---|---|---|---|
| BioShock Infinite (2013) | 104.6 | 60 | 51.6 | 22.1 |
| Dota 2 Reborn (2015) | 76.5 | 57.3 | 29 | 26.9 |
| X-Plane 11.11 (2018) | 37.4 | 26.1 | 22.5 |
Geluidsniveau
| Onbelast |
| 29.5 / 29.5 / 29.5 dB (A) |
| Belasting |
| 31.1 / 39.3 dB (A) |
 | ||
30 dB stil 40 dB(A) hoorbaar 50 dB(A) luid |
||
min: | ||
| Apple MacBook Pro 13 2019 2TB3 Iris Plus Graphics 645, i5-8257U, Apple SSD AP0256 | Apple MacBook Pro 13 2019 i5 4TB3 Iris Plus Graphics 655, i5-8279U, Apple SSD AP0512 | Apple MacBook Pro 13 2017 Iris Plus Graphics 640, i5-7360U, Apple SSD AP0128 | Apple Macbook Air 2019 UHD Graphics 617, i5-8210Y, Apple SSD AP0256 | Dell XPS 13 9380 i7 4K UHD Graphics 620, i7-8565U, Samsung SSD PM981 MZVLB512HAJQ | Razer Blade Stealth i7-1065G7 Iris Plus Iris Plus Graphics G7 (Ice Lake 64 EU), i7-1065G7, Samsung SSD PM981 MZVLB256HAHQ | HP Envy 13-aq0003ng GeForce MX250, i7-8565U, Toshiba KBG30ZMV512G | |
|---|---|---|---|---|---|---|---|
| Noise | -1% | -2% | -2% | -4% | -3% | -2% | |
| uit / omgeving * (dB) | 29.5 | 29 2% | 30.2 -2% | 29.5 -0% | 28.4 4% | 28.3 4% | 30 -2% |
| Idle Minimum * (dB) | 29.5 | 29 2% | 30.2 -2% | 29.5 -0% | 29.4 -0% | 28.3 4% | 30 -2% |
| Idle Average * (dB) | 29.5 | 29 2% | 30.2 -2% | 29.5 -0% | 29.4 -0% | 28.3 4% | 30 -2% |
| Idle Maximum * (dB) | 29.5 | 29 2% | 30.2 -2% | 29.5 -0% | 29.4 -0% | 28.3 4% | 30 -2% |
| Load Average * (dB) | 31.1 | 33.9 -9% | 32.9 -6% | 34 -9% | 34.6 -11% | 33.5 -8% | |
| Load Maximum * (dB) | 39.3 | 41.8 -6% | 39.3 -0% | 41 -4% | 46.8 -19% | 49.4 -26% | 39.5 -1% |
| Witcher 3 ultra * (dB) | 34.5 |
* ... kleiner is beter
(±) De maximumtemperatuur aan de bovenzijde bedraagt 44.9 °C / 113 F, vergeleken met het gemiddelde van 35.9 °C / 97 F, variërend van 21.4 tot 59 °C voor de klasse Subnotebook.
(-) De bodem warmt op tot een maximum van 45.1 °C / 113 F, vergeleken met een gemiddelde van 39.2 °C / 103 F
(+) Bij onbelast gebruik bedraagt de gemiddelde temperatuur voor de bovenzijde 24.8 °C / 77 F, vergeleken met het apparaatgemiddelde van 30.8 °C / 87 F.
(+) De handpalmsteunen en het touchpad bereiken maximaal de huidtemperatuur (32.1 °C / 89.8 F) en zijn dus niet heet.
(-) De gemiddelde temperatuur van de handpalmsteun van soortgelijke toestellen bedroeg 28.2 °C / 82.8 F (-3.9 °C / -7 F).
Apple MacBook Pro 13 2019 2TB3 audioanalyse
(±) | luidspreker luidheid is gemiddeld maar goed (79.1 dB)
Bas 100 - 315 Hz
(±) | verminderde zeebaars - gemiddeld 10.7% lager dan de mediaan
(±) | lineariteit van de lage tonen is gemiddeld (8.7% delta ten opzichte van de vorige frequentie)
Midden 400 - 2000 Hz
(+) | evenwichtige middens - slechts 4.6% verwijderd van de mediaan
(+) | de middentonen zijn lineair (3.8% delta ten opzichte van de vorige frequentie)
Hoog 2 - 16 kHz
(+) | evenwichtige hoogtepunten - slechts 2.3% verwijderd van de mediaan
(+) | de hoge tonen zijn lineair (4.7% delta naar de vorige frequentie)
Algemeen 100 - 16.000 Hz
(±) | lineariteit van het totale geluid is gemiddeld (15.6% verschil met de mediaan)
Vergeleken met dezelfde klasse
» 36% van alle geteste apparaten in deze klasse waren beter, 5% vergelijkbaar, 59% slechter
» De beste had een delta van 5%, het gemiddelde was 18%, de slechtste was 53%
Vergeleken met alle geteste toestellen
» 23% van alle geteste apparaten waren beter, 5% gelijk, 72% slechter
» De beste had een delta van 4%, het gemiddelde was 24%, de slechtste was 134%
Apple MacBook Pro 13 2019 i5 4TB3 audioanalyse
(±) | luidspreker luidheid is gemiddeld maar goed (79.7 dB)
Bas 100 - 315 Hz
(±) | verminderde zeebaars - gemiddeld 12.8% lager dan de mediaan
(±) | lineariteit van de lage tonen is gemiddeld (11.2% delta ten opzichte van de vorige frequentie)
Midden 400 - 2000 Hz
(+) | evenwichtige middens - slechts 3.2% verwijderd van de mediaan
(+) | de middentonen zijn lineair (4.6% delta ten opzichte van de vorige frequentie)
Hoog 2 - 16 kHz
(+) | evenwichtige hoogtepunten - slechts 3.4% verwijderd van de mediaan
(+) | de hoge tonen zijn lineair (5.3% delta naar de vorige frequentie)
Algemeen 100 - 16.000 Hz
(+) | het totale geluid is lineair (13.7% verschil met de mediaan)
Vergeleken met dezelfde klasse
» 24% van alle geteste apparaten in deze klasse waren beter, 5% vergelijkbaar, 71% slechter
» De beste had een delta van 5%, het gemiddelde was 18%, de slechtste was 53%
Vergeleken met alle geteste toestellen
» 15% van alle geteste apparaten waren beter, 4% gelijk, 81% slechter
» De beste had een delta van 4%, het gemiddelde was 24%, de slechtste was 134%
| Uit / Standby | |
| Inactief | |
| Belasting |
|
Key:
min: | |
| Apple MacBook Pro 13 2019 2TB3 i5-8257U, Iris Plus Graphics 645, Apple SSD AP0256, IPS, 2560x1600, 13.3" | Apple MacBook Pro 13 2019 i5 4TB3 i5-8279U, Iris Plus Graphics 655, Apple SSD AP0512, IPS, 2560x1600, 13.3" | Apple MacBook Pro 13 2017 i5-7360U, Iris Plus Graphics 640, Apple SSD AP0128, IPS, 2560x1600, 13.3" | Dell XPS 13 9380 i7 4K i7-8565U, UHD Graphics 620, Samsung SSD PM981 MZVLB512HAJQ, IPS, 3840x2160, 13.3" | Razer Blade Stealth i7-1065G7 Iris Plus i7-1065G7, Iris Plus Graphics G7 (Ice Lake 64 EU), Samsung SSD PM981 MZVLB256HAHQ, IPS, 1920x1080, 13.3" | HP Envy 13-aq0003ng i7-8565U, GeForce MX250, Toshiba KBG30ZMV512G, IPS, 1920x1080, 13.3" | Gemiddeld Intel Iris Plus Graphics 645 | Gemiddelde van klas Subnotebook | |
|---|---|---|---|---|---|---|---|---|
| Power Consumption | -8% | -5% | -37% | -45% | -32% | -4% | -16% | |
| Idle Minimum * (Watt) | 2.1 | 2.2 -5% | 3.7 -76% | 5.2 -148% | 5.9 -181% | 3.9 -86% | 2.2 ? -5% | 3.78 ? -80% |
| Idle Average * (Watt) | 6.9 | 7.2 -4% | 5.2 25% | 8.6 -25% | 8.1 -17% | 7.8 -13% | 7.4 ? -7% | 6.6 ? 4% |
| Idle Maximum * (Watt) | 7.8 | 8.2 -5% | 7.6 3% | 10.5 -35% | 11.2 -44% | 10.8 -38% | 8.2 ? -5% | 7.93 ? -2% |
| Load Average * (Watt) | 42 | 54 -29% | 41.6 1% | 44.2 -5% | 44.3 -5% | 53 -26% | 44 ? -5% | 41.8 ? -0% |
| Load Maximum * (Watt) | 64.5 | 63.9 1% | 50.5 22% | 47.5 26% | 50.2 22% | 62.7 3% | 64.3 ? -0% | 64.7 ? -0% |
| Witcher 3 ultra * (Watt) | 41.9 |
* ... kleiner is beter
| Apple MacBook Pro 13 2019 2TB3 i5-8257U, Iris Plus Graphics 645, 58.2 Wh | Apple MacBook Pro 13 2019 i5 4TB3 i5-8279U, Iris Plus Graphics 655, 58 Wh | Apple MacBook Pro 13 2017 i5-7360U, Iris Plus Graphics 640, 54.5 Wh | Apple Macbook Air 2019 i5-8210Y, UHD Graphics 617, 49.9 Wh | Dell XPS 13 9380 i7 4K i7-8565U, UHD Graphics 620, 52 Wh | Razer Blade Stealth i7-1065G7 Iris Plus i7-1065G7, Iris Plus Graphics G7 (Ice Lake 64 EU), 53.1 Wh | HP Envy 13-aq0003ng i7-8565U, GeForce MX250, 53.2 Wh | Gemiddelde van klas Subnotebook | |
|---|---|---|---|---|---|---|---|---|
| Battery Runtime | -12% | -12% | -9% | -41% | -25% | -35% | 12% | |
| WiFi Websurfing (h) | 13 | 11.5 -12% | 11.4 -12% | 11.5 -12% | 7.7 -41% | 9.7 -25% | 8.5 -35% | 14 ? 8% |
| WiFi Websurfing max. Brightness (h) | 7.4 | 7 -5% | 8.62 ? 16% |
Pro
Contra
Samenvatting – Goedkoper is beter
Voor het volledige, Engelse testrapport, klik hier.
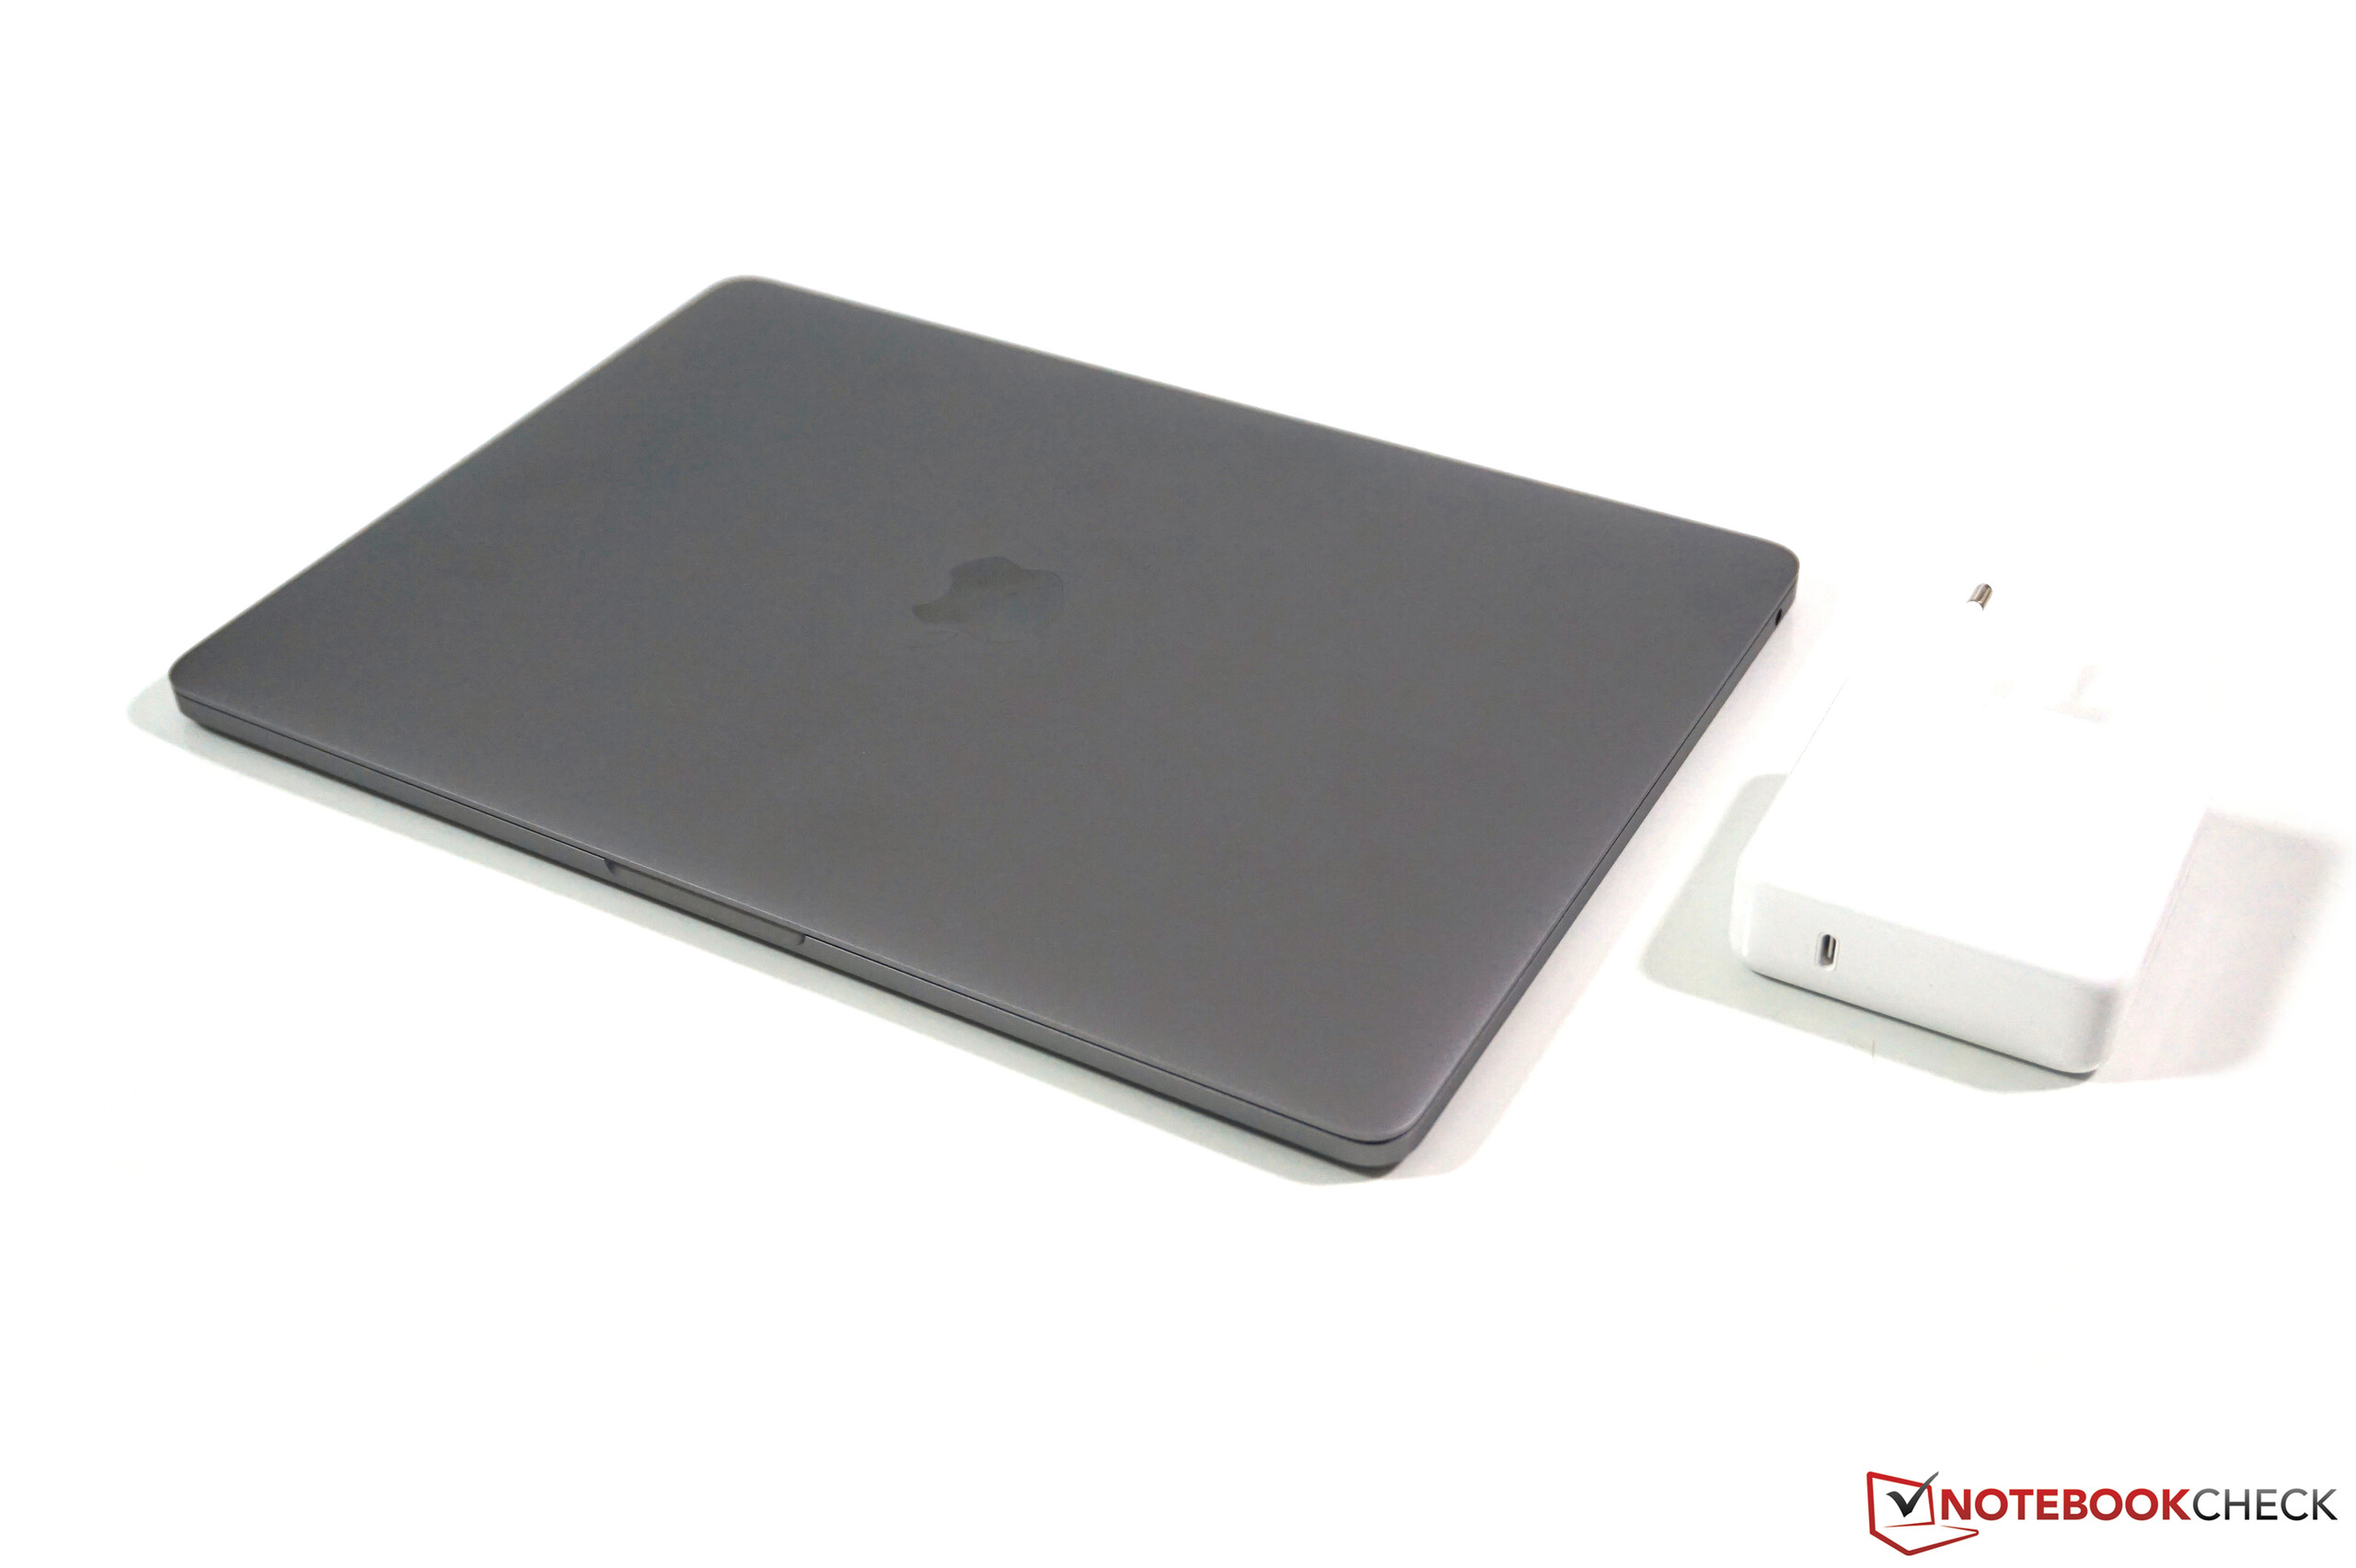
Na onze tests van de twee MacBook Pro 13-modellen is ons oordeel vrij duidelijk: het goedkopere model is de betere keuze voor de meeste gebruikers. Het enige echte nadeel is het lagere aantal Thunderbolt 3-poorten. De prestaties zijn ook iets lager, maar we zijn positief verrast door de kleinere MBP 13 om eerlijk te zijn. De officiële specificaties van Apple suggereren een grotere kloof, maar het werkelijke verschil is erg klein en niet merkbaar in dagelijkse situaties.
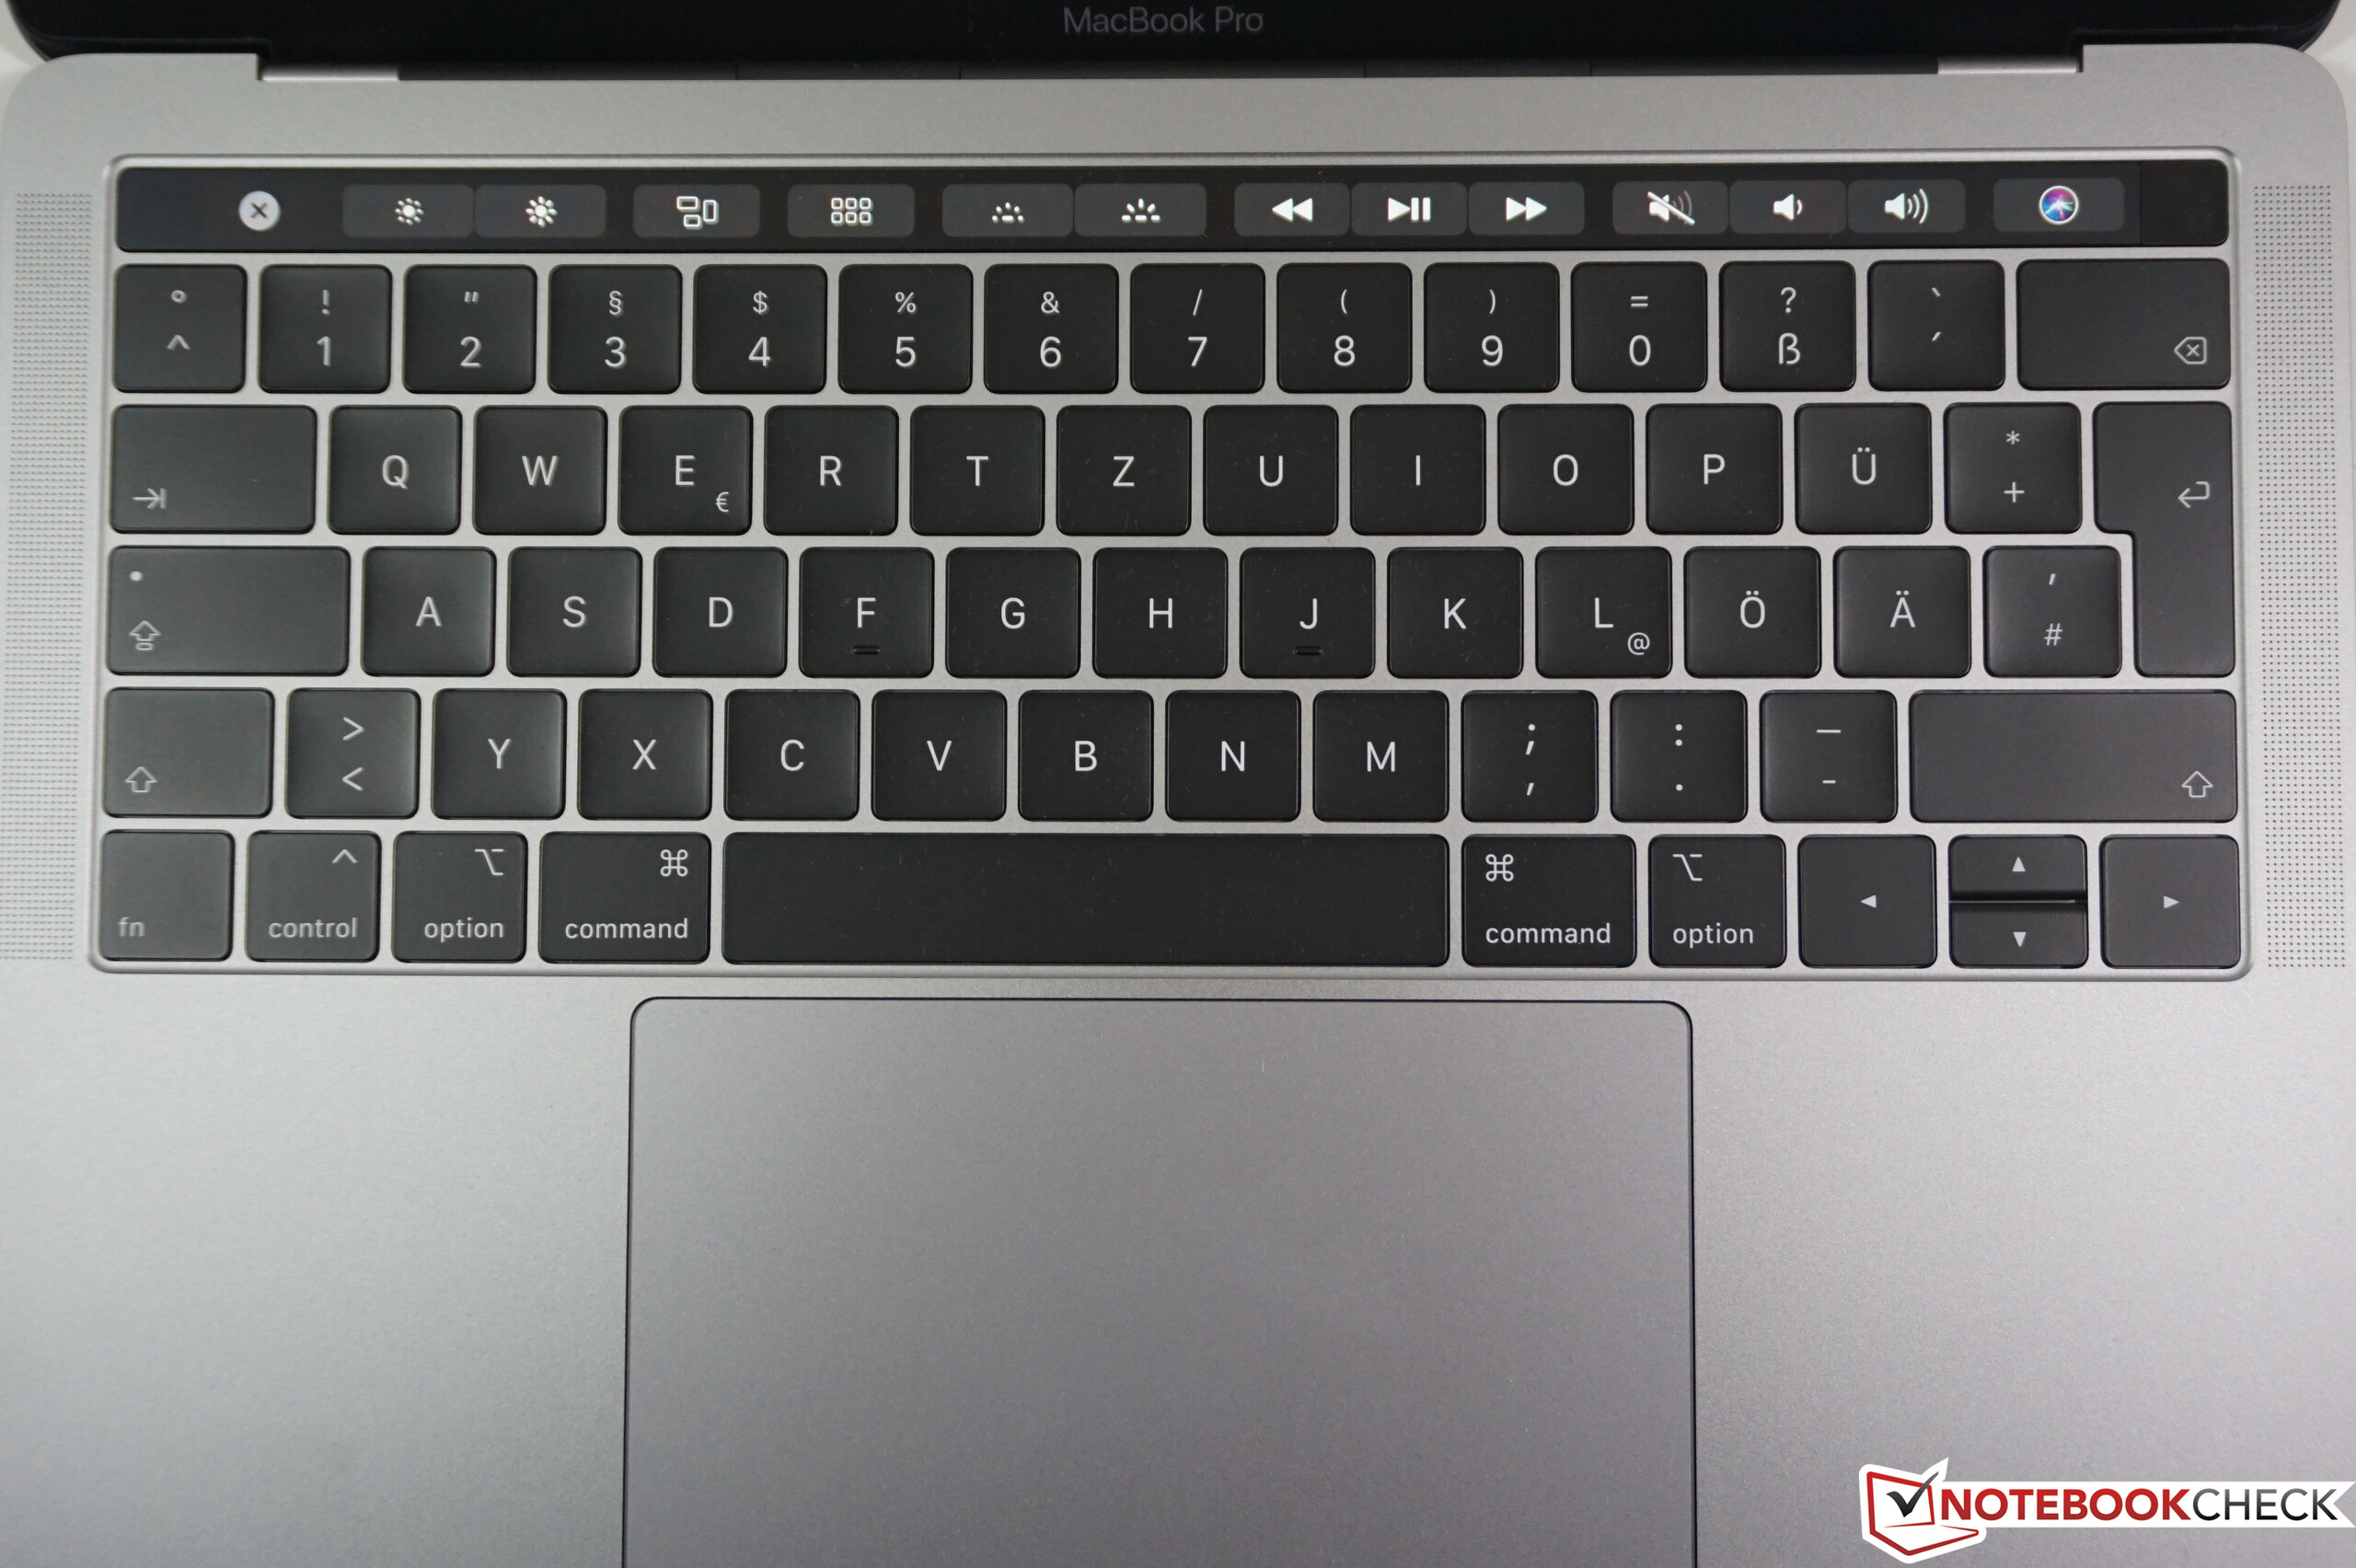
Het scherm is buitengewoon goed en al met al is de MacBook Pro 13 een geweldig totaalpakket. Het enige probleem is nog steeds het toetsenbord (of potentiële betrouwbaarheidsproblemen). Volgens Apple zijn er verbeteringen doorgevoerd, maar de slechte ervaringen van de voorgaande jaren schetsen geen geweldig beeld voor de input van Butterfly. Als je nu een nieuw subnotebook nodig hebt, is dit model zeker een aanrader. Echter, geruchten suggereren dat de volgende MBP 13 (of MBP 14) het nieuwe toetsenbord zal krijgen, dus over een paar maanden krijg je misschien een nog beter apparaat.
De goedkopere MacBook Pro 13 is de betere keuze in de line-up van Apple. Bijna net zo snel als het duurdere model en veel krachtiger dan de MacBook Air.
Dit laat ons achter met de vergelijking van de iets compactere MacBook Air. De Air is een beetje goedkoper, maar nog steeds geen koopje voor meer dan €1300. De MacBook Pro 13 is daarentegen veel krachtiger en heeft een nog beter beeldscherm, dus we raden de MacBook Pro 13 duidelijk aan. Dit model zou de komende jaren ook veel beter moeten presteren.
Apple MacBook Pro 13 2019 2TB3
- 04-02-2020 v7 (old)
Andreas Osthoff
Price comparison
