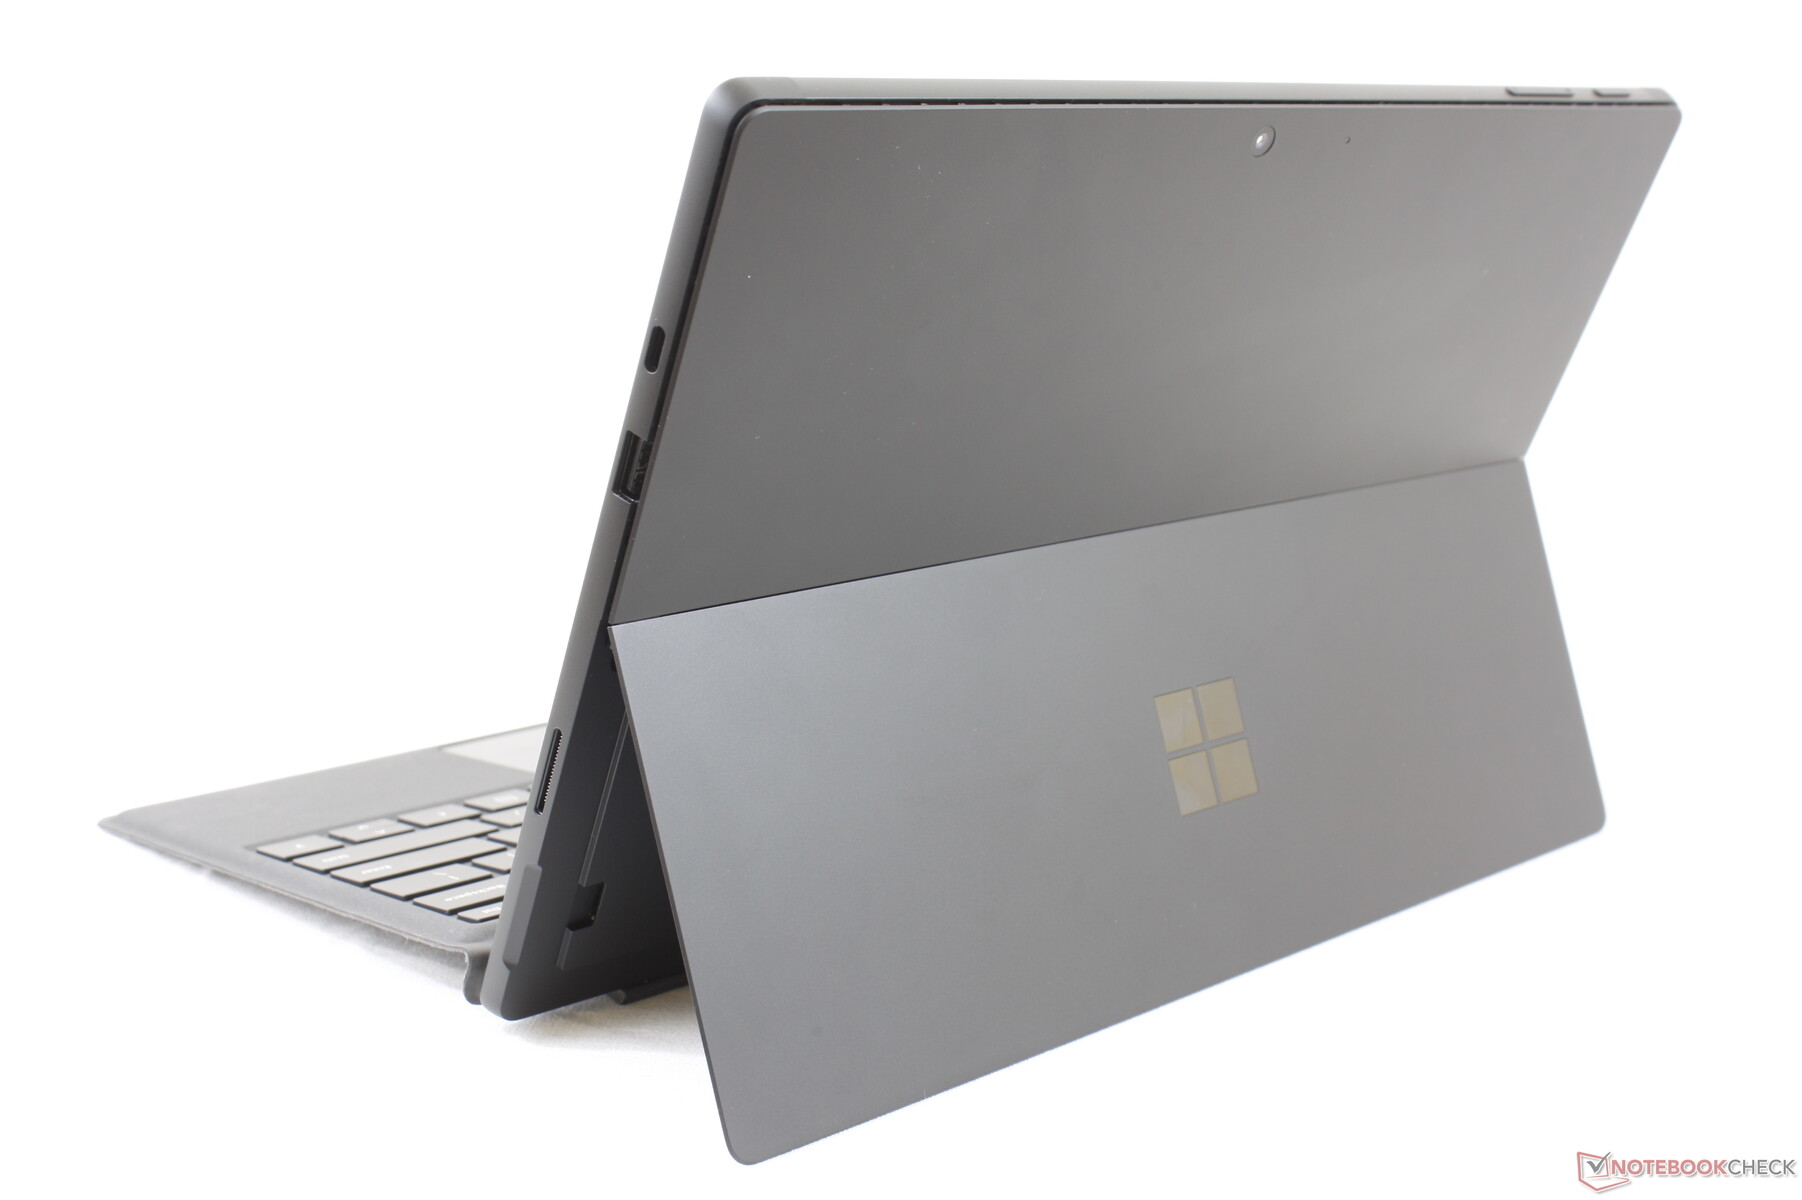
Kort testrapport Microsoft Surface Pro 7 Core i5: Eerder een Surface Pro 6.5
Evaluatie | Datum | Model | Gewicht | Hoogte | Formaat | Resolutie | Beste prijs |
|---|---|---|---|---|---|---|---|
| 88.4 % v7 (old) | 12-2019 | Microsoft Surface Pro 7 Core i5-1035G4 i5-1035G4, Iris Plus Graphics G4 (Ice Lake 48 EU) | 1.1 kg | 8.5 mm | 12.30" | 2736x1824 | |
| 89.1 % v7 (old) | 11-2018 | Microsoft Surface Pro 6, Core i7, 512 GB i7-8650U, UHD Graphics 620 | 1.1 kg | 8.5 mm | 12.30" | 2736x1824 | |
| 86.3 % v7 (old) | 11-2019 | Dell XPS 13 7390 2-in-1 Core i7 i7-1065G7, Iris Plus Graphics G7 (Ice Lake 64 EU) | 1.3 kg | 13 mm | 13.40" | 1920x1200 | |
| 87 % v7 (old) | 10-2018 | HP Elite x2 1013 G3-2TT14EA i5-8350U, UHD Graphics 620 | 1.2 kg | 7.9 mm | 13.00" | 3000x2000 | |
| 83.3 % v6 (old) | 03-2018 | Lenovo Miix 520-12IKB 20M3000LGE i5-8550U, UHD Graphics 620 | 1.3 kg | 9.9 mm | 12.20" | 1920x1200 |

| SD Card Reader | |
| average JPG Copy Test (av. of 3 runs) | |
| Microsoft Surface Book 2 (Toshiba Exceria Pro SDXC 64 GB UHS-II) | |
| Dell XPS 13 7390 2-in-1 Core i7 (Toshiba Exceria Pro M501 64 GB UHS-II) | |
| Microsoft Surface Pro 6, Core i7, 512 GB (Toshiba Exceria Pro M501 microSDXC 64GB) | |
| Microsoft Surface Pro 7 Core i5-1035G4 (Toshiba Exceria Pro M501 64 GB UHS-II) | |
| Chuwi UBook Pro (Toshiba Exceria Pro M501 64 GB UHS-II) | |
| Microsoft Surface Go MHN-00003 (Toshiba Exceria Pro M501) | |
| Microsoft Surface Pro (2017) i7 (Toshiba Exceria Pro M401 64 GB) | |
| maximum AS SSD Seq Read Test (1GB) | |
| Microsoft Surface Book 2 (Toshiba Exceria Pro SDXC 64 GB UHS-II) | |
| Dell XPS 13 7390 2-in-1 Core i7 (Toshiba Exceria Pro M501 64 GB UHS-II) | |
| Microsoft Surface Pro (2017) i7 (Toshiba Exceria Pro M401 64 GB) | |
| Microsoft Surface Pro 6, Core i7, 512 GB (Toshiba Exceria Pro M501 microSDXC 64GB) | |
| Microsoft Surface Pro 7 Core i5-1035G4 (Toshiba Exceria Pro M501 64 GB UHS-II) | |
| Microsoft Surface Go MHN-00003 (Toshiba Exceria Pro M501) | |
| Chuwi UBook Pro (Toshiba Exceria Pro M501 64 GB UHS-II) | |
| |||||||||||||||||||||||||
Helderheidsverdeling: 91 %
Helderheid in Batterij-modus: 480.4 cd/m²
Contrast: 1001:1 (Zwart: 0.48 cd/m²)
ΔE ColorChecker Calman: 5 | ∀{0.5-29.43 Ø4.71}
calibrated: 2.44
ΔE Greyscale Calman: 5.9 | ∀{0.09-98 Ø4.96}
93.2% sRGB (Argyll 1.6.3 3D)
60.3% AdobeRGB 1998 (Argyll 1.6.3 3D)
66.9% AdobeRGB 1998 (Argyll 3D)
93.8% sRGB (Argyll 3D)
66% Display P3 (Argyll 3D)
Gamma: 2.38
CCT: 7805 K
| Microsoft Surface Pro 7 Core i5-1035G4 LG Philips LP123WQ112604, IPS, 12.3", 2736x1824 | Microsoft Surface Pro 6, Core i7, 512 GB LGPhilips LP123WQ112604, IPS, 12.3", 2736x1824 | Microsoft Surface Go MHN-00003 Sharp SHP14A6, IPS, 10", 1800x1200 | Microsoft Surface Pro (2017) i7 LG Display LP123WQ112604, IPS, 12.3", 2736x1824 | Microsoft Surface Pro 4 Core i7 Samsung 123YL01-001 ID: SDC3853, IPS, 12.3", 2736x1824 | Microsoft Surface Pro 3 SEC3542, IPS, 12", 2160x1440 | |
|---|---|---|---|---|---|---|
| Display | 2% | 2% | 2% | 3% | -4% | |
| Display P3 Coverage (%) | 66 | 67.1 2% | 66.5 1% | 66.6 1% | 66.9 1% | 63.6 -4% |
| sRGB Coverage (%) | 93.8 | 95.5 2% | 97.5 4% | 96.5 3% | 97.5 4% | 88.8 -5% |
| AdobeRGB 1998 Coverage (%) | 66.9 | 67.9 1% | 67.5 1% | 67.8 1% | 68.6 3% | 65.6 -2% |
| Response Times | -10% | -12% | -1% | -37% | ||
| Response Time Grey 50% / Grey 80% * (ms) | 34.8 ? | 43 ? -24% | 44 ? -26% | 37 ? -6% | 48.4 ? -39% | |
| Response Time Black / White * (ms) | 26.4 ? | 25 ? 5% | 25.6 ? 3% | 25 ? 5% | 35.6 ? -35% | |
| PWM Frequency (Hz) | 21550 ? | 22000 ? | 1020 ? | 22130 ? | 10420 | |
| Screen | 17% | 30% | 7% | 21% | -3% | |
| Brightness middle (cd/m²) | 480.4 | 484 1% | 456 -5% | 482 0% | 436.7 -9% | 355.3 -26% |
| Brightness (cd/m²) | 485 | 473 -2% | 426 -12% | 466 -4% | 433 -11% | 338 -30% |
| Brightness Distribution (%) | 91 | 91 0% | 88 -3% | 92 1% | 87 -4% | 91 0% |
| Black Level * (cd/m²) | 0.48 | 0.33 31% | 0.31 35% | 0.395 18% | 0.326 32% | 0.33 31% |
| Contrast (:1) | 1001 | 1467 47% | 1471 47% | 1220 22% | 1340 34% | 1077 8% |
| Colorchecker dE 2000 * | 5 | 4.29 14% | 1.3 74% | 4 20% | 1.82 64% | 4.72 6% |
| Colorchecker dE 2000 max. * | 7.72 | 6.46 16% | 3 61% | 7.2 7% | ||
| Colorchecker dE 2000 calibrated * | 2.44 | 1.34 45% | 1.1 55% | |||
| Greyscale dE 2000 * | 5.9 | 4.3 27% | 1.4 76% | 5.7 3% | 1.44 76% | 6.53 -11% |
| Gamma | 2.38 92% | 2.51 88% | 2.24 98% | 2.28 96% | 2.1 105% | 2.17 101% |
| CCT | 7805 83% | 7315 89% | 6687 97% | 7950 82% | 6560 99% | 6707 97% |
| Color Space (Percent of AdobeRGB 1998) (%) | 60.3 | 62 3% | 62.3 3% | 62 3% | 62.3 3% | 59.37 -2% |
| Color Space (Percent of sRGB) (%) | 93.2 | 95 2% | 96.8 4% | 96 3% | 97.5 5% | |
| Totaal Gemiddelde (Programma / Instellingen) | 3% /
11% | 7% /
20% | 3% /
5% | -4% /
9% | -4% /
-3% |
* ... kleiner is beter
Responstijd Scherm
| ↔ Responstijd Zwart naar Wit | ||
|---|---|---|
| 26.4 ms ... stijging ↗ en daling ↘ gecombineerd | ↗ 13.2 ms stijging | 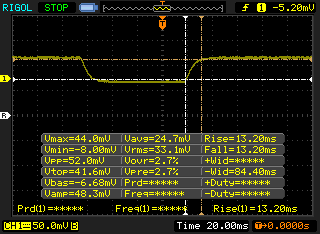 |
| ↘ 13.2 ms daling | ||
| Het scherm vertoonde relatief trage responstijden in onze tests en is misschien te traag voor games. Ter vergelijking: alle testtoestellen variëren van 0.1 (minimum) tot 240 (maximum) ms. » 66 % van alle toestellen zijn beter. Dit betekent dat de gemeten responstijd slechter is dan het gemiddelde (19.8 ms) van alle geteste toestellen. | ||
| ↔ Responstijd 50% Grijs naar 80% Grijs | ||
| 34.8 ms ... stijging ↗ en daling ↘ gecombineerd | ↗ 16.8 ms stijging | 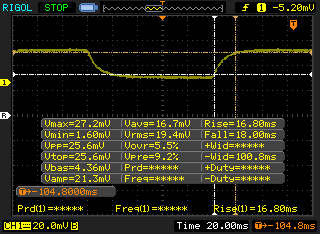 |
| ↘ 18 ms daling | ||
| Het scherm vertoonde trage responstijden in onze tests en is misschien te traag voor games. Ter vergelijking: alle testtoestellen variëren van 0.165 (minimum) tot 636 (maximum) ms. » 49 % van alle toestellen zijn beter. Dit betekent dat de gemeten responstijd slechter is dan het gemiddelde (31 ms) van alle geteste toestellen. | ||
Screen Flickering / PWM (Pulse-Width Modulation)
| Screen flickering / PWM waargenomen | 21550 Hz | ≤ 24 % helderheid instelling | 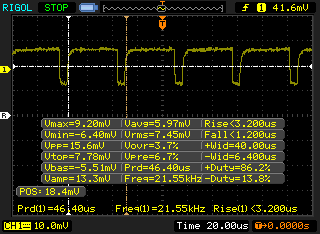 |
De achtergrondverlichting van het scherm flikkert op 21550 Hz (in het slechtste geval, bijvoorbeeld bij gebruik van PWM) aan een helderheid van 24 % en lager. Boven deze helderheid zou er geen flickering / PWM mogen optreden. De frequentie van 21550 Hz is redelijk hoog en de meeste mensen die gevoelig zijn aan flickering zouden dit dus niet mogen waarnemen of geïrriteerde ogen krijgen. Ter vergelijking: 52 % van alle geteste toestellen maakten geen gebruik van PWM om de schermhelderheid te verlagen. Als het wel werd gebruikt, werd een gemiddelde van 7757 (minimum: 5 - maximum: 343500) Hz waargenomen. | |||
* ... kleiner is beter
| PCMark 8 Home Score Accelerated v2 | 3537 punten | |
| PCMark 8 Work Score Accelerated v2 | 4639 punten | |
| PCMark 10 Score | 4163 punten | |
Help | ||
| Microsoft Surface Pro 7 Core i5-1035G4 Toshiba BG4 KBG40ZPZ256G | Microsoft Surface Pro 6, Core i7, 512 GB Toshiba KBG30ZPZ512G | Microsoft Surface Go MHN-00003 64 GB eMMC Flash | Microsoft Surface Pro (2017) i7 Samsung PM971 KUS040202M | Microsoft Surface Pro 4 Core i7 Samsung MZFLV256 NVMe | Microsoft Surface Laptop 3 15 Ryzen 5 3580U SK hynix BC501 HFM256GDGTNG | |
|---|---|---|---|---|---|---|
| AS SSD | -45% | -77% | -101% | -10% | -18% | |
| Seq Read (MB/s) | 1590 | 1154 -27% | 289.8 -82% | 1070 -33% | 1312 -17% | 1122 -29% |
| Seq Write (MB/s) | 714 | 393.6 -45% | 126.7 -82% | 171 -76% | 274.8 -62% | 514 -28% |
| 4K Read (MB/s) | 50.7 | 34.42 -32% | 18.29 -64% | 41 -19% | 33.47 -34% | 34.98 -31% |
| 4K Write (MB/s) | 109.4 | 68.9 -37% | 35.07 -68% | 0.2 -100% | 89.2 -18% | 96.8 -12% |
| 4K-64 Read (MB/s) | 924 | 494.1 -47% | 40.27 -96% | 1015 10% | 1280 39% | 492 -47% |
| 4K-64 Write (MB/s) | 294.6 | 171.3 -42% | 44.48 -85% | 34 -88% | 268.7 -9% | 339.9 15% |
| Access Time Read * (ms) | 0.066 | 0.213 -223% | 0.151 -129% | 0.04 39% | 0.047 29% | 0.056 15% |
| Access Time Write * (ms) | 0.697 | 0.3 57% | 0.233 67% | 7.6 -990% | 0.036 95% | 0.11 84% |
| Score Read (Points) | 1133 | 644 -43% | 88 -92% | 1164 3% | 1445 28% | 639 -44% |
| Score Write (Points) | 475 | 280 -41% | 92 -81% | 52 -89% | 385 -19% | 488 3% |
| Score Total (Points) | 2157 | 1225 -43% | 225 -90% | 1774 -18% | 2518 17% | 1434 -34% |
| Copy ISO MB/s (MB/s) | 1177 | 985 -16% | 99.1 -92% | 1036 -12% | 409.9 -65% | 828 -30% |
| Copy Program MB/s (MB/s) | 406 | 143.1 -65% | 44.34 -89% | 386 -5% | 209.8 -48% | 200.5 -51% |
| Copy Game MB/s (MB/s) | 923 | 676 -27% | 76.5 -92% | 582 -37% | 273.9 -70% | 387.4 -58% |
* ... kleiner is beter

| 3DMark 06 Standard Score | 13031 punten | |
| 3DMark 11 Performance | 3485 punten | |
| 3DMark Time Spy Score | 699 punten | |
Help | ||
| Fortnite | |
| 1280x720 Low Preset | |
| Microsoft Surface Laptop 3 15 Ryzen 5 3580U | |
| Microsoft Surface Pro 7 Core i5-1035G4 | |
| 1920x1080 Medium Preset | |
| Microsoft Surface Laptop 3 15 Ryzen 5 3580U | |
| Microsoft Surface Pro 7 Core i5-1035G4 | |
| lage | gem. | hoge | ultra | |
|---|---|---|---|---|
| StarCraft II: Heart of the Swarm (2013) | 247.2 | 29.9 | 29.8 | 16.5 |
| BioShock Infinite (2013) | 87.3 | 50.8 | 42.9 | 15.2 |
| The Witcher 3 (2015) | 39.4 | 24.5 | 12.6 | 6.7 |
| Overwatch (2016) | 54.6 | 33.8 | 17.7 | 12.7 |
| Rocket League (2017) | 45.9 | 29.8 | 20.3 | |
| Fortnite (2018) | 39.5 | 12.3 | 11.6 | 7 |
| Shadow of the Tomb Raider (2018) | 18 | |||
| Borderlands 3 (2019) | 25.3 | 8.3 | 5.1 | 3.5 |
(±) De maximumtemperatuur aan de bovenzijde bedraagt 43.6 °C / 110 F, vergeleken met het gemiddelde van 35.4 °C / 96 F, variërend van 19.6 tot 60 °C voor de klasse Convertible.
(-) De bodem warmt op tot een maximum van 47.8 °C / 118 F, vergeleken met een gemiddelde van 36.9 °C / 98 F
(+) Bij onbelast gebruik bedraagt de gemiddelde temperatuur voor de bovenzijde 29.8 °C / 86 F, vergeleken met het apparaatgemiddelde van 30.3 °C / 87 F.
(±) De palmsteunen en het touchpad kunnen zeer heet aanvoelen met een maximum van ###max## °C / 102.9 F.
(-) De gemiddelde temperatuur van de handpalmsteun van soortgelijke toestellen bedroeg 28 °C / 82.4 F (-11.4 °C / -20.5 F).
Microsoft Surface Pro 7 Core i5-1035G4 audioanalyse
(±) | luidspreker luidheid is gemiddeld maar goed (78.4 dB)
Bas 100 - 315 Hz
(±) | verminderde zeebaars - gemiddeld 10.6% lager dan de mediaan
(±) | lineariteit van de lage tonen is gemiddeld (11.3% delta ten opzichte van de vorige frequentie)
Midden 400 - 2000 Hz
(+) | evenwichtige middens - slechts 4.8% verwijderd van de mediaan
(+) | de middentonen zijn lineair (4.1% delta ten opzichte van de vorige frequentie)
Hoog 2 - 16 kHz
(±) | higher highs - on average 5.4% higher than median
(±) | lineariteit van de hoogtepunten is gemiddeld (7.9% delta ten opzichte van de vorige frequentie)
Algemeen 100 - 16.000 Hz
(±) | lineariteit van het totale geluid is gemiddeld (24.9% verschil met de mediaan)
Vergeleken met dezelfde klasse
» 75% van alle geteste apparaten in deze klasse waren beter, 7% vergelijkbaar, 18% slechter
» De beste had een delta van 6%, het gemiddelde was 20%, de slechtste was 57%
Vergeleken met alle geteste toestellen
» 76% van alle geteste apparaten waren beter, 5% gelijk, 19% slechter
» De beste had een delta van 4%, het gemiddelde was 23%, de slechtste was 134%
Apple MacBook 12 (Early 2016) 1.1 GHz audioanalyse
(+) | luidsprekers kunnen relatief luid spelen (83.6 dB)
Bas 100 - 315 Hz
(±) | verminderde zeebaars - gemiddeld 11.3% lager dan de mediaan
(±) | lineariteit van de lage tonen is gemiddeld (14.2% delta ten opzichte van de vorige frequentie)
Midden 400 - 2000 Hz
(+) | evenwichtige middens - slechts 2.4% verwijderd van de mediaan
(+) | de middentonen zijn lineair (5.5% delta ten opzichte van de vorige frequentie)
Hoog 2 - 16 kHz
(+) | evenwichtige hoogtepunten - slechts 2% verwijderd van de mediaan
(+) | de hoge tonen zijn lineair (4.5% delta naar de vorige frequentie)
Algemeen 100 - 16.000 Hz
(+) | het totale geluid is lineair (10.2% verschil met de mediaan)
Vergeleken met dezelfde klasse
» 7% van alle geteste apparaten in deze klasse waren beter, 2% vergelijkbaar, 90% slechter
» De beste had een delta van 5%, het gemiddelde was 18%, de slechtste was 53%
Vergeleken met alle geteste toestellen
» 5% van alle geteste apparaten waren beter, 1% gelijk, 94% slechter
» De beste had een delta van 4%, het gemiddelde was 23%, de slechtste was 134%
| Uit / Standby | |
| Inactief | |
| Belasting |
|
Key:
min: | |
| Microsoft Surface Pro 7 Core i5-1035G4 i5-1035G4, Iris Plus Graphics G4 (Ice Lake 48 EU), Toshiba BG4 KBG40ZPZ256G, IPS, 2736x1824, 12.3" | Microsoft Surface Pro 6, Core i7, 512 GB i7-8650U, UHD Graphics 620, Toshiba KBG30ZPZ512G, IPS, 2736x1824, 12.3" | Microsoft Surface Go MHN-00003 Pentium 4415Y, UHD Graphics 615, 64 GB eMMC Flash, IPS, 1800x1200, 10" | Microsoft Surface Pro (2017) i7 i7-7660U, Iris Plus Graphics 640, Samsung PM971 KUS040202M, IPS, 2736x1824, 12.3" | Microsoft Surface Pro (2017) i5 i5-7300U, HD Graphics 620, Samsung PM971 KUS030202M, IPS, 2736x1824, 12.3" | HP Elite x2 1013 G3-2TT14EA i5-8350U, UHD Graphics 620, Samsung PM961 MZVLW256HEHP, IPS, 3000x2000, 13" | |
|---|---|---|---|---|---|---|
| Power Consumption | 18% | 46% | 2% | 29% | 9% | |
| Idle Minimum * (Watt) | 4.5 | 3.2 29% | 2.88 36% | 4.2 7% | 3.6 20% | 4.9 -9% |
| Idle Average * (Watt) | 9.2 | 8.7 5% | 4.8 48% | 10.1 -10% | 8.1 12% | 8.9 3% |
| Idle Maximum * (Watt) | 9.6 | 10.4 -8% | 7.5 22% | 14 -46% | 8.7 9% | 11 -15% |
| Load Average * (Watt) | 42 | 29.2 30% | 16.9 60% | 37.4 11% | 25.5 39% | 32 24% |
| Load Maximum * (Watt) | 63.5 | 40.8 36% | 23.8 63% | 34 46% | 23.5 63% | 36 43% |
| Witcher 3 ultra * (Watt) | 38.1 |
* ... kleiner is beter
| Microsoft Surface Pro 7 Core i5-1035G4 i5-1035G4, Iris Plus Graphics G4 (Ice Lake 48 EU), 45 Wh | Microsoft Surface Pro 6, Core i7, 512 GB i7-8650U, UHD Graphics 620, 45 Wh | Microsoft Surface Go MHN-00003 Pentium 4415Y, UHD Graphics 615, 28 Wh | Microsoft Surface Pro 4 Core i7 6650U, Iris Graphics 540, 38 Wh | Microsoft Surface Pro 3 4300U, HD Graphics 4400, 42 Wh | HP Elite x2 1013 G3-2TT14EA i5-8350U, UHD Graphics 620, 50 Wh | Microsoft Surface Pro (2017) i5 i5-7300U, HD Graphics 620, 45 Wh | |
|---|---|---|---|---|---|---|---|
| Batterijduur | -6% | -3% | -45% | -4% | -15% | 17% | |
| Reader / Idle (h) | 22.3 | 18.1 -19% | 12.9 -42% | 10.9 -51% | 18.3 -18% | 13 -42% | 17.6 -21% |
| WiFi v1.3 (h) | 10 | 8.5 -15% | 7.5 -25% | 4.9 -51% | 7.7 -23% | 12.4 24% | |
| Load (h) | 1.9 | 2.2 16% | 3 58% | 1.3 -32% | 2.1 11% | 2.3 21% | 2.8 47% |
| WiFi (h) | 8.4 |
Pro
Contra
Voor het volledige, Engelse testrapport, klik hier.
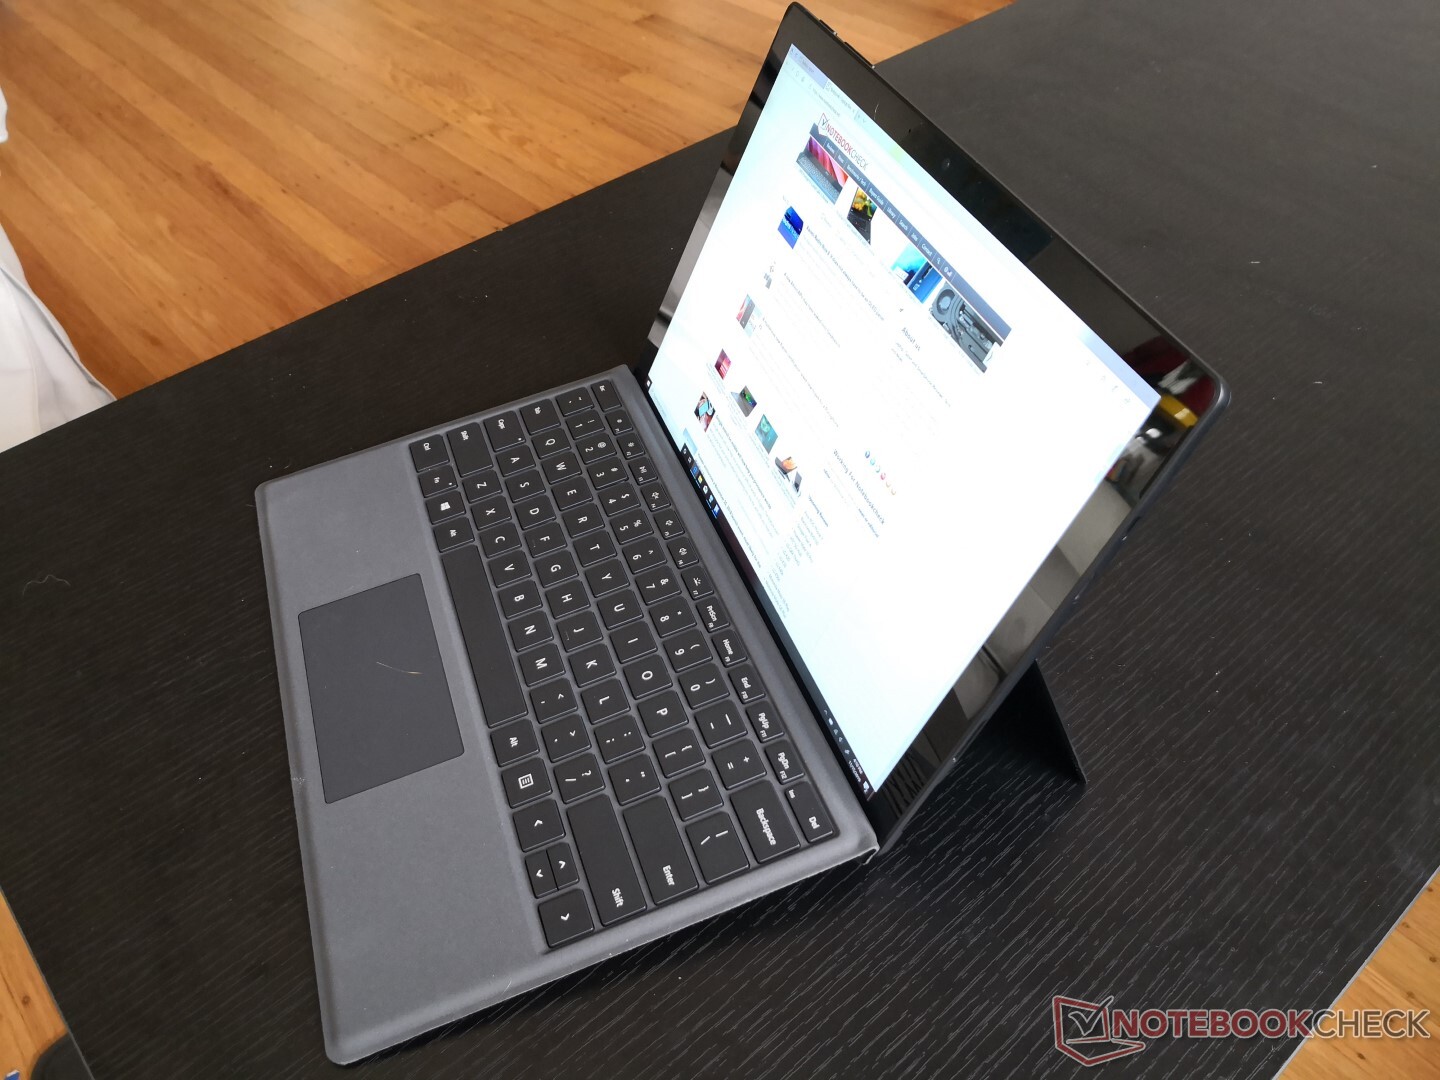
Als je een tevreden eigenaar bent van een Surface Pro 5 of Surface Pro 6, dan is er weinig reden om te upgraden naar de Surface Pro 7. Het is moeilijk om Microsofts nieuwste model aan te bevelen wanneer deze exact hetzelfde beeldscherm biedt als de twee jaar oude Surface Pro 5 en ongeveer dezelfde CPU-prestaties als de Surface Pro 6 Core i7. Het komt allemaal neer op hoeveel je de geïntegreerde USB Type-C-poort en de snellere geïntegreerde grafische prestaties van de Iris Plus G4 of G7 waardeert. Vooral dat laatste kan zeker helpen bij lichte fotobewerking en beeldverwerkingstaken, maar als je de tablet vooral wilt gebruiken voor tekstverwerking, e-mailen, browsen of videostreaming, dan bieden de Surface Pro 6 Core i5 of Core i7 versies in wezen dezelfde ervaring voor minder geld.
De genummerde Surface Pro-serie lijkt stil te staan sinds de Surface Pro 5. Hoewel deze modellen nog steeds een van de betere Windows-tablets op de markt zijn, hopen we dat de 2020 Surface Pro meer een evolutie voor de serie zal zijn in plaats van nog een marginale verbetering.
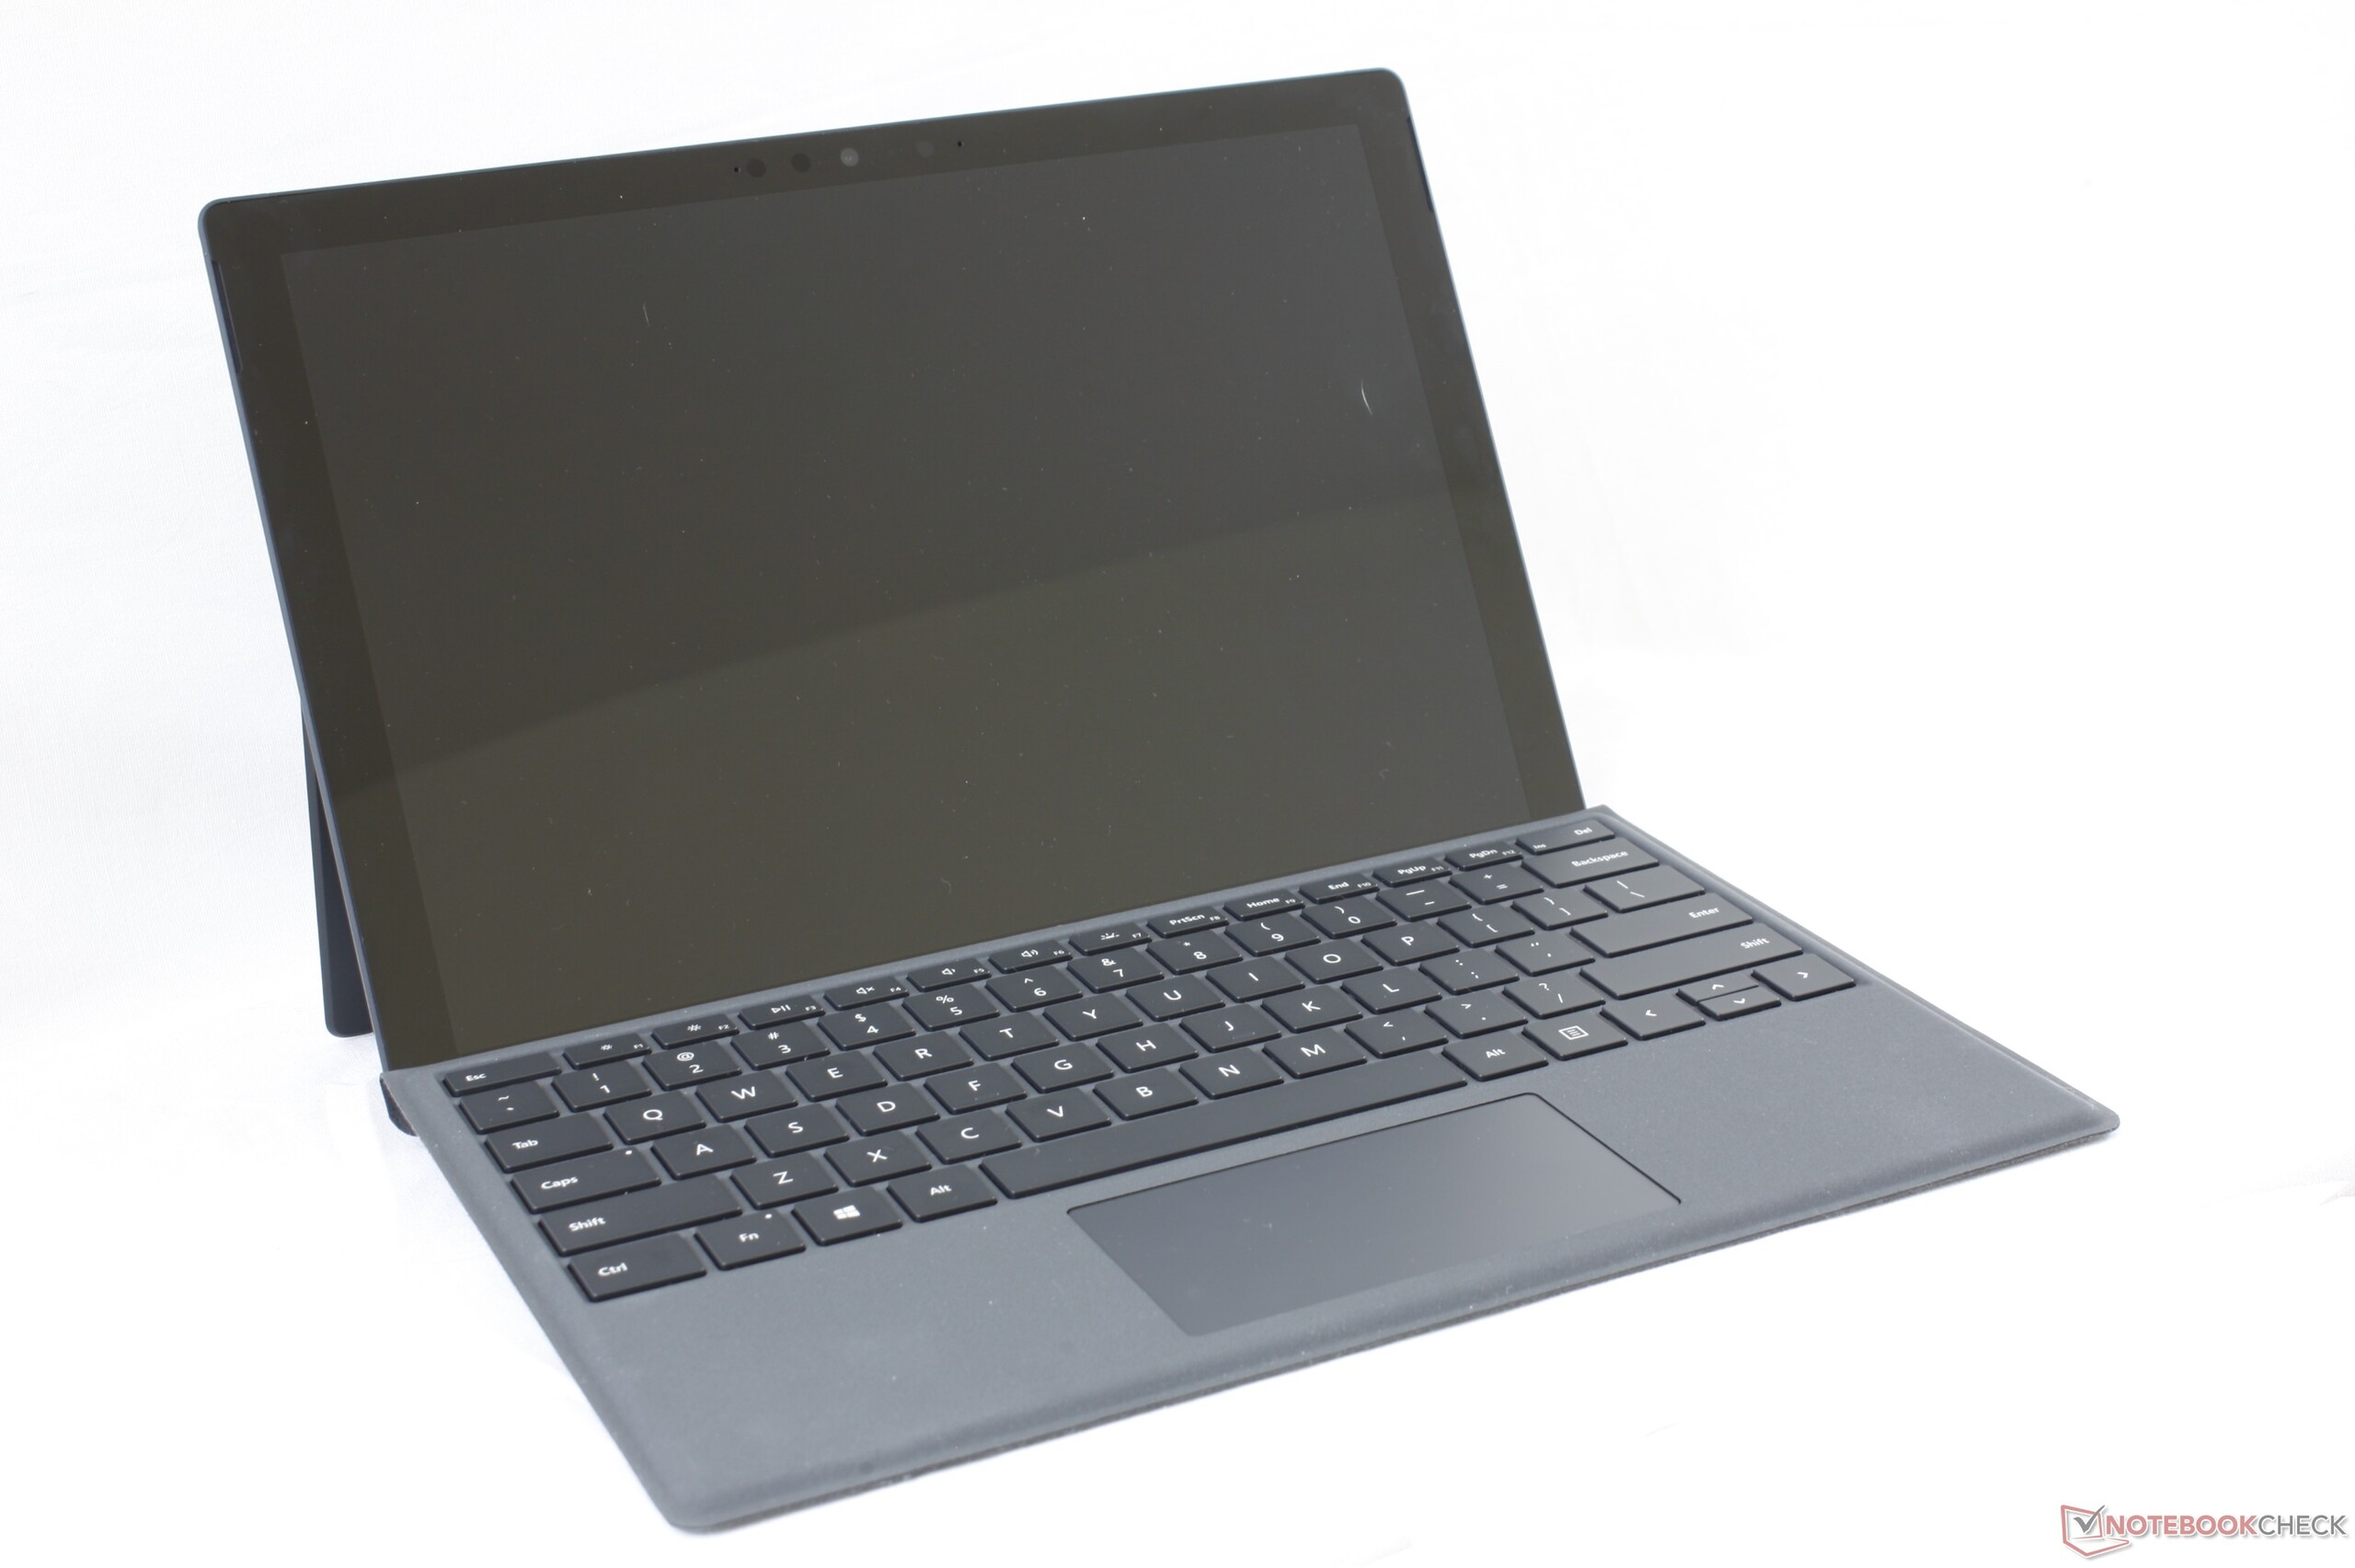
De Surface Pro 7 voelt meer als een variant op de Surface Pro 6 dan als een volledige genummerde opvolger. De upgrades zijn minimaal en meestal onmerkbaar voor de meeste gebruikers die alleen geïnteresseerd zijn in basistaken zoals tekstverwerking, browsen en videostreaming.
Microsoft Surface Pro 7 Core i5-1035G4
- 19-11-2019 v7 (old)
Allen Ngo
Price comparison
