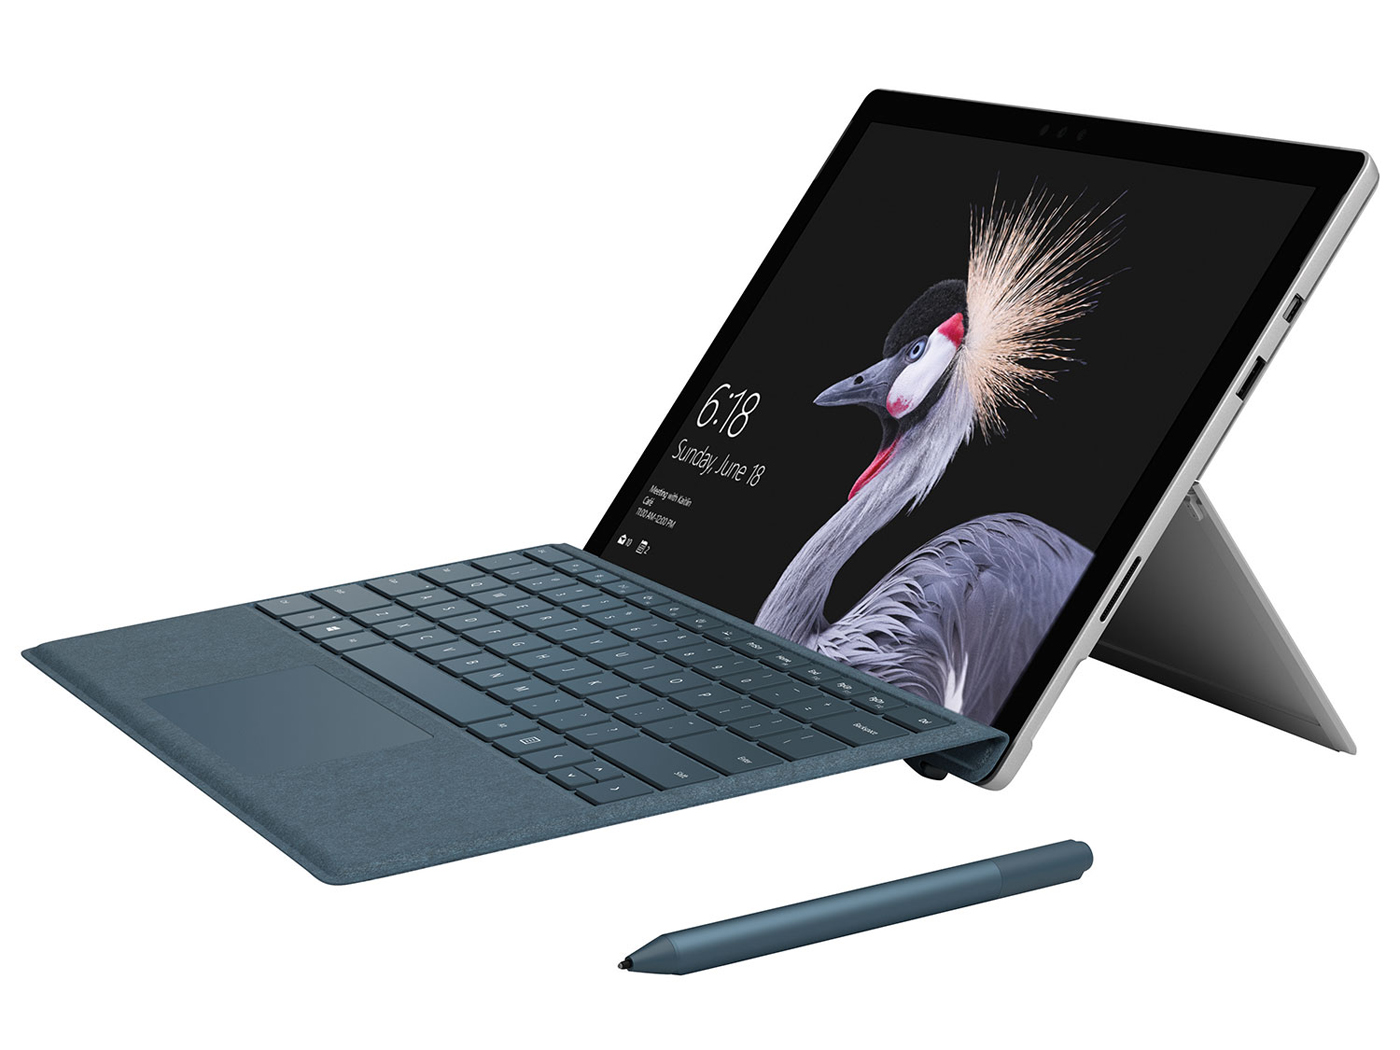
Kort testrapport Microsoft Surface Pro (2017) (i7, 512 GB, 16 GB) Convertible
| |||||||||||||||||||||||||
Helderheidsverdeling: 92 %
Helderheid in Batterij-modus: 482 cd/m²
Contrast: 1220:1 (Zwart: 0.395 cd/m²)
ΔE ColorChecker Calman: 4 | ∀{0.5-29.43 Ø4.73}
ΔE Greyscale Calman: 5.7 | ∀{0.09-98 Ø4.97}
98.7% sRGB (Calman 2D)
96% sRGB (Argyll 1.6.3 3D)
62% AdobeRGB 1998 (Argyll 1.6.3 3D)
67.8% AdobeRGB 1998 (Argyll 3D)
96.5% sRGB (Argyll 3D)
66.6% Display P3 (Argyll 3D)
Gamma: 2.28
CCT: 7950 K
| Microsoft Surface Pro (2017) i7 LG Display LP123WQ112604, , 2736x1824, 12.3" | Microsoft Surface Pro (2017) i5 LG Display LP123WQ112604, , 2736x1824, 12.3" | Lenovo Ideapad Miix 720-12IKB AUO B120YAN01 / AUO106F, , 2880x1920, 12" | Asus Transformer 3 Pro T303UA-GN050T BOE BOE06AC (NV126A1M-N51), , 2880x1920, 12.6" | Dell Latitude 12 5285 2-in-1 BOE06DC, , 1920x1280, 12.3" | Acer Switch 5 SW512-52-5819 WST KL.1200w.004, , 2160x1440, 12" | Toshiba Portege X30-D (PT274U-01N001) Toshiba TOS508F, , 1920x1080, 13.3" | |
|---|---|---|---|---|---|---|---|
| Display | 2% | -4% | 15% | -5% | -11% | -2% | |
| Display P3 Coverage (%) | 66.6 | 67.6 2% | 65.2 -2% | 81.8 23% | 62.8 -6% | 58.8 -12% | 66.4 0% |
| sRGB Coverage (%) | 96.5 | 99 3% | 91 -6% | 98.3 2% | 94 -3% | 87.5 -9% | 93.5 -3% |
| AdobeRGB 1998 Coverage (%) | 67.8 | 69.1 2% | 66.1 -3% | 82.2 21% | 64.7 -5% | 60.6 -11% | 66.6 -2% |
| Response Times | -15% | -9% | 2% | -19% | -2% | -9% | |
| Response Time Grey 50% / Grey 80% * (ms) | 37 ? | 42 ? -14% | 45 ? -22% | 30 ? 19% | 42.4 ? -15% | 37 ? -0% | 36.8 ? 1% |
| Response Time Black / White * (ms) | 25 ? | 29 ? -16% | 24 ? 4% | 29 ? -16% | 30.8 ? -23% | 26 ? -4% | 29.6 ? -18% |
| PWM Frequency (Hz) | 22130 ? | 21000 | 200 ? | 210.1 ? | |||
| Screen | 10% | -10% | -4% | 0% | -23% | 5% | |
| Brightness middle (cd/m²) | 482 | 417 -13% | 406 -16% | 316 -34% | 523.2 9% | 369 -23% | 332.6 -31% |
| Brightness (cd/m²) | 466 | 401 -14% | 396 -15% | 307 -34% | 522 12% | 331 -29% | 323 -31% |
| Brightness Distribution (%) | 92 | 88 -4% | 88 -4% | 91 -1% | 88 -4% | 75 -18% | 86 -7% |
| Black Level * (cd/m²) | 0.395 | 0.29 27% | 0.3 24% | 0.29 27% | 0.42 -6% | 0.46 -16% | 0.28 29% |
| Contrast (:1) | 1220 | 1438 18% | 1353 11% | 1090 -11% | 1246 2% | 802 -34% | 1188 -3% |
| Colorchecker dE 2000 * | 4 | 3.63 9% | 5.28 -32% | 3.91 2% | 4 -0% | 5.52 -38% | 2.6 35% |
| Colorchecker dE 2000 max. * | 7.2 | 6.74 6% | 9.83 -37% | 7.9 -10% | 8.6 -19% | 9.29 -29% | 6.7 7% |
| Greyscale dE 2000 * | 5.7 | 2.18 62% | 6.71 -18% | 5.37 6% | 5.5 4% | 6.95 -22% | 2.5 56% |
| Gamma | 2.28 96% | 3.09 71% | 2.29 96% | 2.36 93% | 2.16 102% | 2.58 85% | 2.12 104% |
| CCT | 7950 82% | 6767 96% | 6532 100% | 7812 83% | 7546 86% | 7009 93% | 6720 97% |
| Color Space (Percent of AdobeRGB 1998) (%) | 62 | 63 2% | 59 -5% | 72 16% | 64.86 5% | 56 -10% | 62 0% |
| Color Space (Percent of sRGB) (%) | 96 | 99 3% | 91 -5% | 98 2% | 93.97 -2% | 88 -8% | 94 -2% |
| Totaal Gemiddelde (Programma / Instellingen) | -1% /
5% | -8% /
-8% | 4% /
1% | -8% /
-3% | -12% /
-18% | -2% /
2% |
* ... kleiner is beter
Responstijd Scherm
| ↔ Responstijd Zwart naar Wit | ||
|---|---|---|
| 25 ms ... stijging ↗ en daling ↘ gecombineerd | ↗ 13 ms stijging | 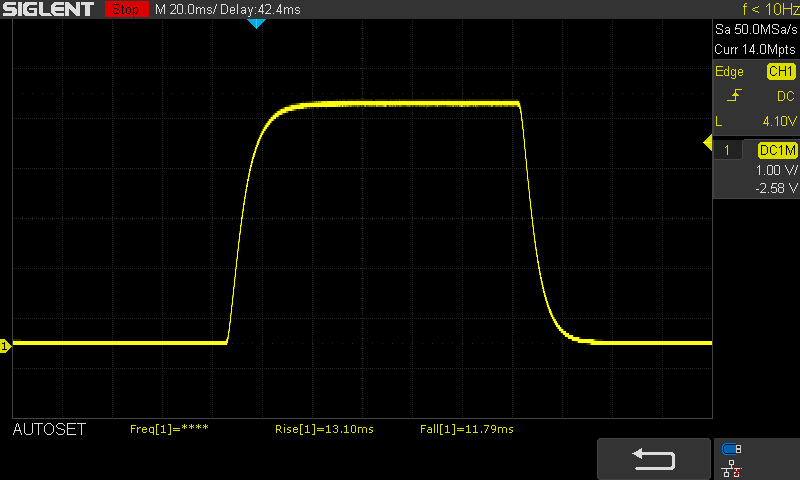 |
| ↘ 12 ms daling | ||
| Het scherm vertoonde relatief trage responstijden in onze tests en is misschien te traag voor games. Ter vergelijking: alle testtoestellen variëren van 0.1 (minimum) tot 240 (maximum) ms. » 59 % van alle toestellen zijn beter. Dit betekent dat de gemeten responstijd slechter is dan het gemiddelde (19.9 ms) van alle geteste toestellen. | ||
| ↔ Responstijd 50% Grijs naar 80% Grijs | ||
| 37 ms ... stijging ↗ en daling ↘ gecombineerd | ↗ 16 ms stijging | 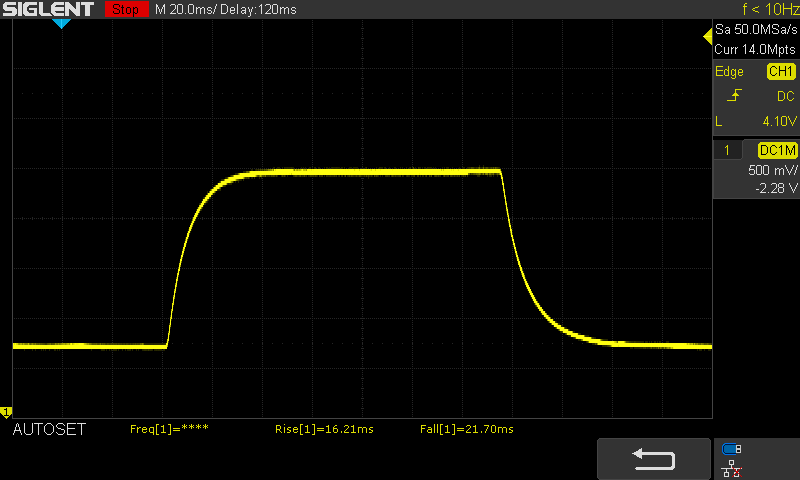 |
| ↘ 21 ms daling | ||
| Het scherm vertoonde trage responstijden in onze tests en is misschien te traag voor games. Ter vergelijking: alle testtoestellen variëren van 0.165 (minimum) tot 636 (maximum) ms. » 53 % van alle toestellen zijn beter. Dit betekent dat de gemeten responstijd slechter is dan het gemiddelde (31.1 ms) van alle geteste toestellen. | ||
Screen Flickering / PWM (Pulse-Width Modulation)
| Screen flickering / PWM waargenomen | 22130 Hz | ≤ 55 % helderheid instelling | 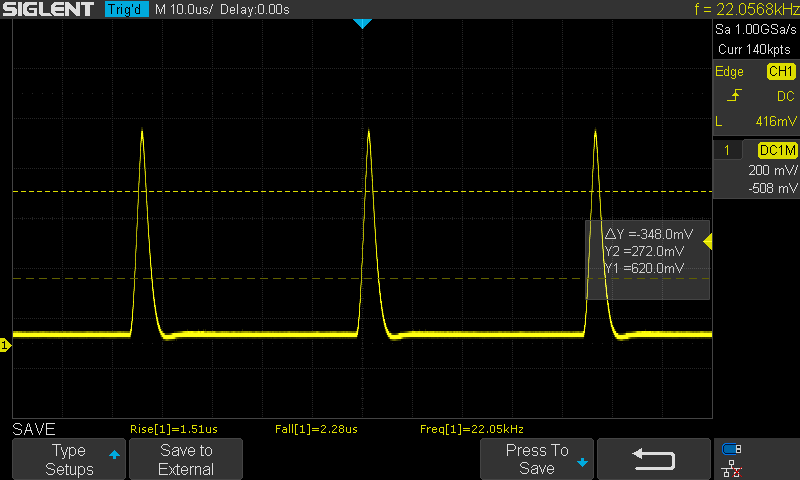 |
De achtergrondverlichting van het scherm flikkert op 22130 Hz (in het slechtste geval, bijvoorbeeld bij gebruik van PWM) aan een helderheid van 55 % en lager. Boven deze helderheid zou er geen flickering / PWM mogen optreden. De frequentie van 22130 Hz is redelijk hoog en de meeste mensen die gevoelig zijn aan flickering zouden dit dus niet mogen waarnemen of geïrriteerde ogen krijgen. Ter vergelijking: 52 % van alle geteste toestellen maakten geen gebruik van PWM om de schermhelderheid te verlagen. Als het wel werd gebruikt, werd een gemiddelde van 7798 (minimum: 5 - maximum: 343500) Hz waargenomen. | |||
Cinebench R15 CPU Multi 64 Bit - Surface Pro 2017 i7-7660U cooling fan
Cinebench R15 CPU Multi 64 Bit - Surface Pro 2017 i5-7300U fanless
Cinebench R15 CPU Multi 64 Bit - Switch 5 SW512 i7-7500U Liquid Loop
| PCMark 8 Home Score Accelerated v2 | 4095 punten | |
| PCMark 8 Creative Score Accelerated v2 | 5540 punten | |
| PCMark 8 Work Score Accelerated v2 | 4431 punten | |
| PCMark 10 Score | 3909 punten | |
Help | ||
| Microsoft Surface Pro (2017) i7 Samsung PM971 KUS040202M | Microsoft Surface Pro (2017) i5 Samsung PM971 KUS030202M | Microsoft Surface Pro 4, Core i5, 128GB Samsung MZFLV128 NVMe | Lenovo Ideapad Miix 720-12IKB Samsung SSD PM961 1TB M.2 PCIe 3.0 x4 NVMe (MZVLW1T0) | Lenovo ThinkPad X1 Tablet Gen 2 Samsung PM961 MZVLW256HEHP | Asus Transformer 3 Pro T303UA-GN050T SK Hynix Canvas SC300 512GB M.2 (HFS512G39MND) | Dell Latitude 12 5285 2-in-1 Samsung PM961 MZVLW256HEHP | Acer Switch 5 SW512-52-5819 Intel SSD 600p SSDPEKKW512G7 | |
|---|---|---|---|---|---|---|---|---|
| CrystalDiskMark 3.0 | -19% | -45% | 90% | 22% | -44% | -5% | 7% | |
| Read Seq (MB/s) | 1308 | 723 -45% | 666 -49% | 2408 84% | 1739 33% | 398.9 -70% | 1294 -1% | 1066 -19% |
| Write Seq (MB/s) | 961 | 853 -11% | 154.2 -84% | 1702 77% | 1259 31% | 402 -58% | 865 -10% | 593 -38% |
| Read 512 (MB/s) | 227.5 | 225 -1% | 266.3 17% | 1301 472% | 698 207% | 303.1 33% | 406 78% | 653 187% |
| Write 512 (MB/s) | 792 | 445 -44% | 154.2 -81% | 1288 63% | 869 10% | 320.3 -60% | 589 -26% | 535 -32% |
| Read 4k (MB/s) | 53.6 | 46 -14% | 28.51 -47% | 53.6 0% | 52.3 -2% | 26.11 -51% | 31.75 -41% | 35.92 -33% |
| Write 4k (MB/s) | 136.3 | 125 -8% | 101.5 -26% | 162.2 19% | 120 -12% | 57.7 -58% | 72.2 -47% | 128.3 -6% |
| Read 4k QD32 (MB/s) | 485.6 | 423 -13% | 368.3 -24% | 504 4% | 247.9 -49% | 245.8 -49% | 493.3 2% | 460.6 -5% |
| Write 4k QD32 (MB/s) | 421.5 | 373 -12% | 153.6 -64% | 420.8 0% | 259 -39% | 253.8 -40% | 434.5 3% | 425.4 1% |

| 3DMark 06 Standard Score | 15071 punten | |
| 3DMark 11 Performance | 2664 punten | |
| 3DMark Cloud Gate Standard Score | 8067 punten | |
| 3DMark Fire Strike Score | 1310 punten | |
| 3DMark Time Spy Score | 513 punten | |
Help | ||
| The Witcher 3 - 1024x768 Low Graphics & Postprocessing | |
| Asus Zenbook UX3430UQ-GV012T | |
| Lenovo Ideapad 310-15ISK | |
| Microsoft Surface Pro (2017) i7 | |
| Microsoft Surface Pro (2017) i5 | |
| Rise of the Tomb Raider - 1024x768 Lowest Preset | |
| Microsoft Surface Pro (2017) i7 | |
| Asus X302UV-FN016T | |
| Asus Transformer 3 Pro T303UA-GN050T | |
| Acer Switch 5 SW512-52-5819 | |
| Lenovo Ideapad Miix 720-12IKB | |
| Microsoft Surface Pro (2017) i5 | |
| Deus Ex Mankind Divided - 1280x720 Low Preset AF:1x | |
| Microsoft Surface Pro (2017) i7 | |
| Battlefield 1 - 1280x720 Low Preset | |
| Microsoft Surface Pro (2017) i7 | |
| Huawei MateBook X | |
| Rocket League - 1920x1080 High Quality AA:High FX | |
| Microsoft Surface Pro (2017) i7 | |
| Acer Switch 5 SW512-52-5819 | |
| Warhammer 40.000: Dawn of War III - 1280x720 Minimum / Off (100 % Gameplay Resolution) | |
| Acer TravelMate P658-G2-MG-7327 | |
| Microsoft Surface Pro (2017) i7 | |
| For Honor - 1280x720 Low Preset | |
| Microsoft Surface Pro (2017) i7 | |
| Huawei MateBook X | |
| Farming Simulator 17 - 1920x1080 High Preset AA:2xMS AF:2x | |
| Asus Zenbook UX3430UQ-GV012T | |
| Microsoft Surface Pro (2017) i7 | |
| Huawei MateBook X | |
| The Division - 1280x720 Low Preset AF:1x | |
| Asus X302UV-FN016T | |
| Microsoft Surface Pro (2017) i7 | |
| Rainbow Six Siege - 1366x768 Medium Preset AA:T AF:2x | |
| Asus X302UV-FN016T | |
| Microsoft Surface Pro (2017) i7 | |
| Thief - 1024x768 Very Low Preset | |
| Lenovo Ideapad Miix 720-12IKB | |
| Microsoft Surface Pro (2017) i5 | |
| Diablo III - 1366x768 High AA:on | |
| Asus Zenbook UX3430UQ-GV012T | |
| Asus X302UV-FN016T | |
| lage | gem. | hoge | ultra | |
|---|---|---|---|---|
| Sims 4 (2014) | 20.8 | |||
| GTA V (2015) | 56.7 | 28.9 | 11.8 | |
| The Witcher 3 (2015) | 21.7 | |||
| Dota 2 Reborn (2015) | 92 | 63.7 | 29.5 | 19.8 |
| Rainbow Six Siege (2015) | 45 (windowed) | 30 (windowed) | 16 (windowed) | |
| Rise of the Tomb Raider (2016) | 23.5 | 16.7 | 9.1 | |
| Far Cry Primal (2016) | 28 | 13 | ||
| The Division (2016) | 24.9 | |||
| Overwatch (2016) | 63.3 | 41 | 15.9 | |
| Deus Ex Mankind Divided (2016) | 20.2 | |||
| Battlefield 1 (2016) | 26.6 | 19.6 | 9.2 | |
| Farming Simulator 17 (2016) | 121 | 91 | 31.6 | 17.8 |
| For Honor (2017) | 33.5 | 12.7 | ||
| Ghost Recon Wildlands (2017) | 16 | |||
| Mass Effect Andromeda (2017) | 20.4 | |||
| Warhammer 40.000: Dawn of War III (2017) | 33.8 | |||
| Prey (2017) | 45.4 | 18.1 | ||
| Rocket League (2017) | 103 | 42.6 | 29.3 | |
| Dirt 4 (2017) | 27 |
Geluidsniveau
| Onbelast |
| 29.6 / 29.6 / 29.6 dB (A) |
| Belasting |
| 33.4 / 34.1 dB (A) |
 | ||
30 dB stil 40 dB(A) hoorbaar 50 dB(A) luid |
||
min: | ||
| Microsoft Surface Pro (2017) i7 Iris Plus Graphics 640, i7-7660U, Samsung PM971 KUS040202M | Microsoft Surface Pro 4, Core i5, 128GB HD Graphics 520, 6300U, Samsung MZFLV128 NVMe | Lenovo Ideapad Miix 720-12IKB HD Graphics 620, i7-7500U, Samsung SSD PM961 1TB M.2 PCIe 3.0 x4 NVMe (MZVLW1T0) | Asus Transformer 3 Pro T303UA-GN050T HD Graphics 520, 6500U, SK Hynix Canvas SC300 512GB M.2 (HFS512G39MND) | Dell Latitude 12 5285 2-in-1 HD Graphics 620, i7-7600U, Samsung PM961 MZVLW256HEHP | Toshiba Portege X30-D (PT274U-01N001) HD Graphics 620, i7-7600U, Samsung PM961 MZVLW256HEHP | |
|---|---|---|---|---|---|---|
| Emissions | ||||||
| Fan Noise (dB(A)) | 36.3 | 37.1 | 38.4 | |||
| Noise | -12% | -6% | -6% | 5% | 1% | |
| uit / omgeving * (dB) | 29.6 | 30.4 -3% | 30.7 -4% | 28.2 5% | 28.4 4% | |
| Idle Minimum * (dB) | 29.6 | 31.5 -6% | 30.4 -3% | 30.7 -4% | 28.2 5% | 28.4 4% |
| Idle Average * (dB) | 29.6 | 31.5 -6% | 32.4 -9% | 30.7 -4% | 28.2 5% | 28.4 4% |
| Idle Maximum * (dB) | 29.6 | 31.5 -6% | 32.4 -9% | 30.7 -4% | 28.2 5% | 28.4 4% |
| Load Average * (dB) | 33.4 | 40.5 -21% | 36 -8% | 37 -11% | 30.4 9% | 33.2 1% |
| Witcher 3 ultra * (dB) | 33.4 | |||||
| Load Maximum * (dB) | 34.1 | 40.7 -19% | 36.3 -6% | 37.1 -9% | 34 -0% | 37.9 -11% |
| Totaal Gemiddelde (Programma / Instellingen) | -12% /
-12% | -6% /
-6% | -6% /
-6% | 5% /
5% | 1% /
1% |
* ... kleiner is beter
(±) De maximumtemperatuur aan de bovenzijde bedraagt 42 °C / 108 F, vergeleken met het gemiddelde van 35.4 °C / 96 F, variërend van 19.6 tot 60 °C voor de klasse Convertible.
(±) De bodem warmt op tot een maximum van 42 °C / 108 F, vergeleken met een gemiddelde van 36.9 °C / 98 F
(+) Bij onbelast gebruik bedraagt de gemiddelde temperatuur voor de bovenzijde 28.6 °C / 83 F, vergeleken met het apparaatgemiddelde van 30.3 °C / 87 F.
(±) De palmsteunen en het touchpad kunnen zeer heet aanvoelen met een maximum van ###max## °C / 100.4 F.
(-) De gemiddelde temperatuur van de handpalmsteun van soortgelijke toestellen bedroeg 28 °C / 82.4 F (-10 °C / -18 F).
| Uit / Standby | |
| Inactief | |
| Belasting |
|
Key:
min: | |
| Microsoft Surface Pro (2017) i7 i7-7660U, Iris Plus Graphics 640, Samsung PM971 KUS040202M, IPS, 2736x1824, 12.3" | Microsoft Surface Pro (2017) i5 i5-7300U, HD Graphics 620, Samsung PM971 KUS030202M, IPS, 2736x1824, 12.3" | Microsoft Surface Pro 4, Core i5, 128GB 6300U, HD Graphics 520, Samsung MZFLV128 NVMe, IPS, 2736x1824, 12.3" | Lenovo Ideapad Miix 720-12IKB i7-7500U, HD Graphics 620, Samsung SSD PM961 1TB M.2 PCIe 3.0 x4 NVMe (MZVLW1T0), IPS, 2880x1920, 12" | Asus Transformer 3 Pro T303UA-GN050T 6500U, HD Graphics 520, SK Hynix Canvas SC300 512GB M.2 (HFS512G39MND), IPS, 2880x1920, 12.6" | Dell Latitude 12 5285 2-in-1 i7-7600U, HD Graphics 620, Samsung PM961 MZVLW256HEHP, IPS, 1920x1280, 12.3" | Acer Switch 5 SW512-52-5819 i7-7500U, HD Graphics 620, Intel SSD 600p SSDPEKKW512G7, IPS, 2160x1440, 12" | Huawei MateBook X i5-7200U, HD Graphics 620, LITEON CB1-SD256, , 2160x1440, 13.3" | |
|---|---|---|---|---|---|---|---|---|
| Power Consumption | 27% | 24% | 24% | -3% | 24% | 23% | -3% | |
| Idle Minimum * (Watt) | 4.2 | 3.6 14% | 4.4 -5% | 3.5 17% | 6.7 -60% | 2.85 32% | 3.86 8% | 4.6 -10% |
| Idle Average * (Watt) | 10.1 | 8.1 20% | 9 11% | 7.2 29% | 10.3 -2% | 6.76 33% | 6.4 37% | 11 -9% |
| Idle Maximum * (Watt) | 14 | 8.7 38% | 10.7 24% | 7.9 44% | 13.5 4% | 6.91 51% | 7.17 49% | 12 14% |
| Load Average * (Watt) | 37.4 | 25.5 32% | 19.6 48% | 29.6 21% | 26 30% | 32.88 12% | 30.5 18% | 39.5 -6% |
| Witcher 3 ultra * (Watt) | 38.1 | |||||||
| Load Maximum * (Watt) | 34 | 23.5 31% | 19.9 41% | 30.8 9% | 28.8 15% | 37.41 -10% | 32.4 5% | 34.6 -2% |
* ... kleiner is beter
| Microsoft Surface Pro (2017) i7 i7-7660U, Iris Plus Graphics 640, 45 Wh | Microsoft Surface Pro (2017) i5 i5-7300U, HD Graphics 620, 45 Wh | Microsoft Surface Pro 4, Core i5, 128GB 6300U, HD Graphics 520, 38 Wh | Lenovo Ideapad Miix 720-12IKB i7-7500U, HD Graphics 620, 41 Wh | Lenovo ThinkPad X1 Tablet Gen 2 i5-7Y54, HD Graphics 615, 37 Wh | Asus Transformer 3 Pro T303UA-GN050T 6500U, HD Graphics 520, 39 Wh | Dell Latitude 12 5285 2-in-1 i7-7600U, HD Graphics 620, 42 Wh | Acer Switch 5 SW512-52-5819 i7-7500U, HD Graphics 620, Wh | Huawei MateBook X i5-7200U, HD Graphics 620, 40 Wh | |
|---|---|---|---|---|---|---|---|---|---|
| Batterijduur | 49% | -7% | -15% | 3% | -44% | -3% | -22% | 5% | |
| H.264 (h) | 10.2 | 3.4 -67% | |||||||
| WiFi v1.3 (h) | 8.2 | 12.4 51% | 7.1 -13% | 5.8 -29% | 7.4 -10% | 3.7 -55% | 8.1 -1% | 5.9 -28% | 5.6 -32% |
| Witcher 3 ultra (h) | 1.9 | ||||||||
| Load (h) | 1.9 | 2.8 47% | 1.9 0% | 1.9 0% | 2.2 16% | 1.7 -11% | 1.8 -5% | 1.6 -16% | 2.7 42% |
| Reader / Idle (h) | 17.6 | 15 | 11.9 | 11 | 7.1 | 17.9 | 11.9 | 8.5 |
Pro
Contra
Voor het volledige, Engelse testrapport, klik hier.
De i7 2017 Surface Pro van Microsoft maakt veel, maar niet alle beloftes waar. Bouwkwaliteit, beeldscherm en batterijlevensduur zijn zonder twijfel extreem goed. Concurrenten zoals de Acer Switch 5 blijven hier achter.
Wanneer we de tablet als mogelijke laptop vervanging beschouwen, lopen we tegen dezelfde prestatieproblemen aan als bij de (ventilator-loze) i5 versie. Het verlies aan rekenkracht was niet zo erg (-17% in de eerste ronde vs. -33% bij de i5). Echter, de throttling wordt beter merkbaar in PCMark: de Surface Pro i7 (2017) staat de eerste plaats af aan convertibles van Acer en Dell.
Hoe dan ook geven we de Surface Pro i7 een goede eindscore van 90%, omdat prestaties (minus een straf voor throttling) slechts één onderdeel is van ons testrapport. Het systeemgeluid is ondanks de ventilator beperkt en de ventilator draait alleen indien het nodig is. Het apparaat bevat verder goede luidsprekers en de invoerapparaten (Type Cover) zijn extreem goed voor een convertible.
Alternatieven
De Dell Latitude 12 5285 biedt gelijksoortige prestaties met minder throttling (-9%). Het beeldscherm heeft dezelfde kwaliteit (helderheid, contrast, helderheidverdeling, kleurdekking), maar de resolutie is slechts Full HD. De Dell wordt echter relatief warm.
Dit geldt ook voor de Acer Switch 5 SW512-52, die ook nauwelijks last heeft van throttling (-9%). Echter, de looptijden zijn met 6 uur een stuk korter. Het beeldscherm komt niet de buurt van die van de Surface Pro of de Latitude 12 5285.
Indien looptijden van meer dan 10 uur gewenst zijn, zijn de i5 versie of zelfs de Core M versie van de Surface Pro 2017 een geldige optie. Immers, als de SoC niet constant maximaal kan presteren, waarom zou je dan niet kiezen voor de goedkopere Core M versie? Waarschijnlijk worden de Wi-Fi looptijden van de i5 versie (12,5 uur) met gemak overtroffen. Momenteel testen we het apparaat en we komen terug op de resultaten.
Microsoft Surface Pro (2017) i7
- 21-07-2017 v6 (old)
Sebastian Jentsch