Kort testrapport Microsoft Surface Pro 7: een i7-upgrade met extra GPU-prestaties
Evaluatie | Datum | Model | Gewicht | Hoogte | Formaat | Resolutie | Beste prijs |
|---|---|---|---|---|---|---|---|
| 88.1 % v7 (old) | 02-2020 | Microsoft Surface Pro 7 i7-1065G7, Iris Plus Graphics G7 (Ice Lake 64 EU) | 790 g | 8.5 mm | 12.30" | 2736x1824 | |
| 88.4 % v7 (old) | 12-2019 | Microsoft Surface Pro 7 Core i5-1035G4 i5-1035G4, Iris Plus Graphics G4 (Ice Lake 48 EU) | 1.1 kg | 8.5 mm | 12.30" | 2736x1824 | |
| 89.6 % v6 (old) | 07-2017 | Microsoft Surface Pro (2017) i7 i7-7660U, Iris Plus Graphics 640 | 1.1 kg | 8.5 mm | 12.30" | 2736x1824 | |
| 86.3 % v7 (old) | 11-2019 | Dell XPS 13 7390 2-in-1 Core i7 i7-1065G7, Iris Plus Graphics G7 (Ice Lake 64 EU) | 1.3 kg | 13 mm | 13.40" | 1920x1200 | |
| 88.4 % v7 (old) | 12-2019 | HP Spectre x360 13-aw0013dx i7-1065G7, Iris Plus Graphics G7 (Ice Lake 64 EU) | 1.2 kg | 16.9 mm | 13.30" | 1920x1080 |

| SD Card Reader | |
| average JPG Copy Test (av. of 3 runs) | |
| Microsoft Surface Book 2 15 (Toshiba Exceria Pro SDXC 64 GB UHS-II) | |
| Dell XPS 13 7390 2-in-1 Core i7 (Toshiba Exceria Pro M501 64 GB UHS-II) | |
| Microsoft Surface Pro 6, Core i7, 512 GB (Toshiba Exceria Pro M501 microSDXC 64GB) | |
| Microsoft Surface Pro 7 (Toshiba Exceria Pro M501 microSDXC 64GB) | |
| Chuwi UBook Pro (Toshiba Exceria Pro M501 64 GB UHS-II) | |
| Microsoft Surface Go MHN-00003 (Toshiba Exceria Pro M501) | |
| Gemiddelde van klas Convertible (28.1 - 197, n=23, laatste 2 jaar) | |
| Microsoft Surface Pro (2017) i7 (Toshiba Exceria Pro M401 64 GB) | |
| maximum AS SSD Seq Read Test (1GB) | |
| Microsoft Surface Book 2 15 (Toshiba Exceria Pro SDXC 64 GB UHS-II) | |
| Dell XPS 13 7390 2-in-1 Core i7 (Toshiba Exceria Pro M501 64 GB UHS-II) | |
| Gemiddelde van klas Convertible (28.9 - 254, n=22, laatste 2 jaar) | |
| Microsoft Surface Pro 7 (Toshiba Exceria Pro M501 microSDXC 64GB) | |
| Microsoft Surface Pro (2017) i7 (Toshiba Exceria Pro M401 64 GB) | |
| Microsoft Surface Pro 6, Core i7, 512 GB (Toshiba Exceria Pro M501 microSDXC 64GB) | |
| Microsoft Surface Go MHN-00003 (Toshiba Exceria Pro M501) | |
| Chuwi UBook Pro (Toshiba Exceria Pro M501 64 GB UHS-II) | |
| |||||||||||||||||||||||||
Helderheidsverdeling: 90 %
Helderheid in Batterij-modus: 435 cd/m²
Contrast: 1359:1 (Zwart: 0.32 cd/m²)
ΔE ColorChecker Calman: 1.18 | ∀{0.5-29.43 Ø4.73}
calibrated: 3.49
ΔE Greyscale Calman: 1.12 | ∀{0.09-98 Ø4.97}
96% sRGB (Argyll 1.6.3 3D)
60% AdobeRGB 1998 (Argyll 1.6.3 3D)
65.7% AdobeRGB 1998 (Argyll 3D)
95.8% sRGB (Argyll 3D)
63.7% Display P3 (Argyll 3D)
Gamma: 2.3
CCT: 6502 K
| Microsoft Surface Pro 7 LG Philips LP123WQ112604, IPS, 2736x1824, 12.3" | Microsoft Surface Pro 7 Core i5-1035G4 LG Philips LP123WQ112604, IPS, 2736x1824, 12.3" | Dell XPS 13 7390 2-in-1 Core i7 Sharp LQ134N1, IPS, 1920x1200, 13.4" | Chuwi UBook Pro BOE TV123WAM-ND0, IPS, 1920x1280, 12.3" | Microsoft Surface Pro 6, Core i7, 512 GB LGPhilips LP123WQ112604, IPS, 2736x1824, 12.3" | |
|---|---|---|---|---|---|
| Display | 1% | 8% | -1% | 3% | |
| Display P3 Coverage (%) | 63.7 | 66 4% | 69.9 10% | 63.3 -1% | 67.1 5% |
| sRGB Coverage (%) | 95.8 | 93.8 -2% | 99.2 4% | 94 -2% | 95.5 0% |
| AdobeRGB 1998 Coverage (%) | 65.7 | 66.9 2% | 71.5 9% | 65.1 -1% | 67.9 3% |
| Response Times | 10% | -12% | 14% | 2% | |
| Response Time Grey 50% / Grey 80% * (ms) | 40 ? | 34.8 ? 13% | 47.6 ? -19% | 30.8 ? 23% | 43 ? -8% |
| Response Time Black / White * (ms) | 28 ? | 26.4 ? 6% | 29.2 ? -4% | 26.8 ? 4% | 25 ? 11% |
| PWM Frequency (Hz) | 250 ? | 21550 ? | 2500 ? | 22000 ? | |
| Screen | -92% | -16% | -90% | -58% | |
| Brightness middle (cd/m²) | 435 | 480.4 10% | 549.8 26% | 867.6 99% | 484 11% |
| Brightness (cd/m²) | 422 | 485 15% | 520 23% | 818 94% | 473 12% |
| Brightness Distribution (%) | 90 | 91 1% | 86 -4% | 83 -8% | 91 1% |
| Black Level * (cd/m²) | 0.32 | 0.48 -50% | 0.39 -22% | 0.78 -144% | 0.33 -3% |
| Contrast (:1) | 1359 | 1001 -26% | 1410 4% | 1112 -18% | 1467 8% |
| Colorchecker dE 2000 * | 1.18 | 5 -324% | 2.12 -80% | 4.64 -293% | 4.29 -264% |
| Colorchecker dE 2000 max. * | 2.27 | 7.72 -240% | 3.66 -61% | 9.22 -306% | 6.46 -185% |
| Colorchecker dE 2000 calibrated * | 3.49 | 2.44 30% | 1.37 61% | 2.31 34% | 1.34 62% |
| Greyscale dE 2000 * | 1.12 | 5.9 -427% | 2.6 -132% | 6.1 -445% | 4.3 -284% |
| Gamma | 2.3 96% | 2.38 92% | 2.3 96% | 2.22 99% | 2.51 88% |
| CCT | 6502 100% | 7805 83% | 6884 94% | 7346 88% | 7315 89% |
| Color Space (Percent of AdobeRGB 1998) (%) | 60 | 60.3 0% | 65.4 9% | 59 -2% | 62 3% |
| Color Space (Percent of sRGB) (%) | 96 | 93.2 -3% | 99.7 4% | 93.7 -2% | 95 -1% |
| Totaal Gemiddelde (Programma / Instellingen) | -27% /
-62% | -7% /
-11% | -26% /
-61% | -18% /
-39% |
* ... kleiner is beter
Responstijd Scherm
| ↔ Responstijd Zwart naar Wit | ||
|---|---|---|
| 28 ms ... stijging ↗ en daling ↘ gecombineerd | ↗ 16 ms stijging | 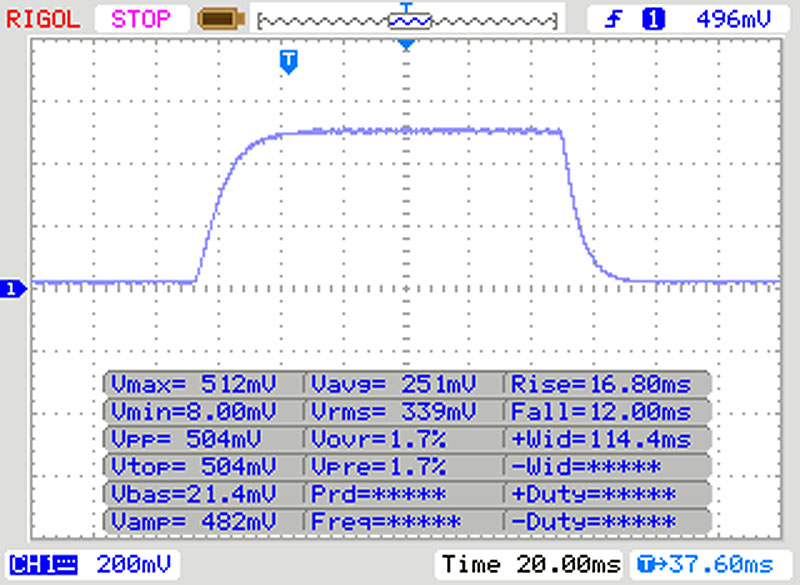 |
| ↘ 12 ms daling | ||
| Het scherm vertoonde relatief trage responstijden in onze tests en is misschien te traag voor games. Ter vergelijking: alle testtoestellen variëren van 0.1 (minimum) tot 240 (maximum) ms. » 71 % van alle toestellen zijn beter. Dit betekent dat de gemeten responstijd slechter is dan het gemiddelde (19.9 ms) van alle geteste toestellen. | ||
| ↔ Responstijd 50% Grijs naar 80% Grijs | ||
| 40 ms ... stijging ↗ en daling ↘ gecombineerd | ↗ 19 ms stijging | 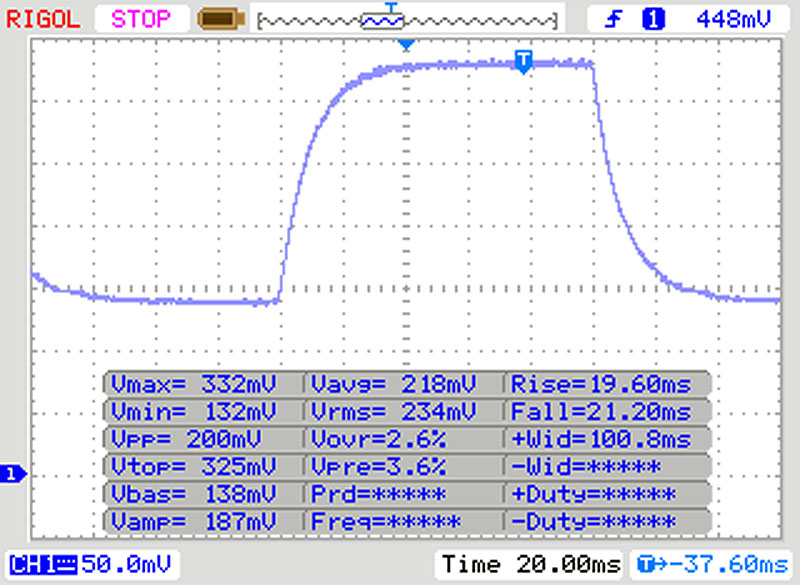 |
| ↘ 21 ms daling | ||
| Het scherm vertoonde trage responstijden in onze tests en is misschien te traag voor games. Ter vergelijking: alle testtoestellen variëren van 0.165 (minimum) tot 636 (maximum) ms. » 61 % van alle toestellen zijn beter. Dit betekent dat de gemeten responstijd slechter is dan het gemiddelde (31.1 ms) van alle geteste toestellen. | ||
Screen Flickering / PWM (Pulse-Width Modulation)
| Screen flickering / PWM waargenomen | 250 Hz | ≤ 50 % helderheid instelling | 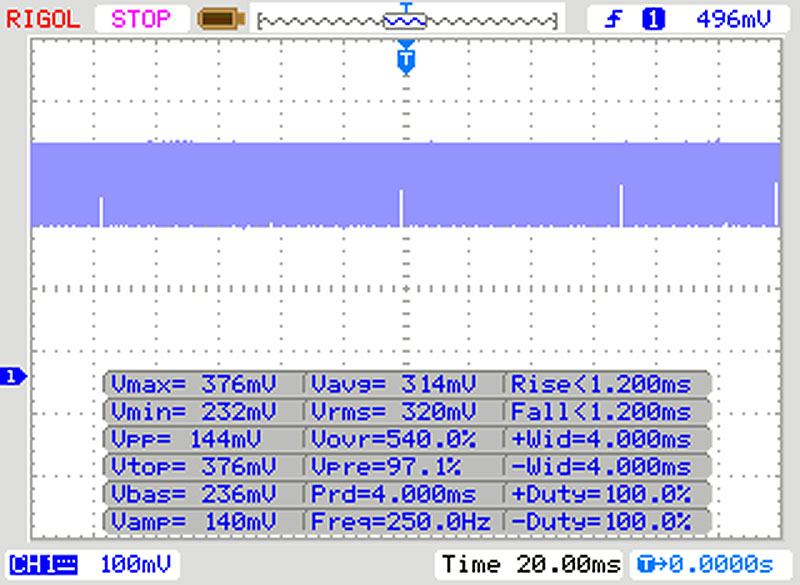 |
De achtergrondverlichting van het scherm flikkert op 250 Hz (in het slechtste geval, bijvoorbeeld bij gebruik van PWM) aan een helderheid van 50 % en lager. Boven deze helderheid zou er geen flickering / PWM mogen optreden. De frequentie van 250 Hz is redelijk laag en de meeste mensen die gevoelig zijn aan flickering kunnen dit dus waarnemen of geïrriteerde ogen krijgen (gebruikmakend van de vermelde helderheid en lager). Ter vergelijking: 52 % van alle geteste toestellen maakten geen gebruik van PWM om de schermhelderheid te verlagen. Als het wel werd gebruikt, werd een gemiddelde van 7784 (minimum: 5 - maximum: 343500) Hz waargenomen. | |||
| PCMark 8 Home Score Accelerated v2 | 3660 punten | |
| PCMark 8 Work Score Accelerated v2 | 3440 punten | |
| PCMark 10 Score | 4367 punten | |
Help | ||
| Microsoft Surface Pro 7 Toshiba KBG40ZNS256G NVMe | Microsoft Surface Pro 7 Core i5-1035G4 Toshiba BG4 KBG40ZPZ256G | Microsoft Surface Pro (2017) i7 Samsung PM971 KUS040202M | Microsoft Surface Pro 6, Core i7, 512 GB Toshiba KBG30ZPZ512G | Gemiddeld Toshiba KBG40ZNS256G NVMe | |
|---|---|---|---|---|---|
| CrystalDiskMark 5.2 / 6 | -5% | -16% | -39% | -13% | |
| Write 4K (MB/s) | 131.3 | 118.5 -10% | 131.6 0% | 83.2 -37% | 112.1 ? -15% |
| Read 4K (MB/s) | 52.4 | 54.1 3% | 43.34 -17% | 43.84 -16% | 50.6 ? -3% |
| Write Seq (MB/s) | 1613 | 1166 -28% | 905 -44% | 636 -61% | 961 ? -40% |
| Read Seq (MB/s) | 1613 | 1676 4% | 985 -39% | 900 -44% | 1562 ? -3% |
| Write 4K Q32T1 (MB/s) | 411.6 | 330.5 -20% | 421.6 2% | 192.9 -53% | 299 ? -27% |
| Read 4K Q32T1 (MB/s) | 415.6 | 393.1 -5% | 498.9 20% | 247.4 -40% | 359 ? -14% |
| Write Seq Q32T1 (MB/s) | 2340 | 1569 -33% | 970 -59% | 861 -63% | 1366 ? -42% |
| Read Seq Q32T1 (MB/s) | 1568 | 2390 52% | 1670 7% | 1615 3% | 2170 ? 38% |
| Write 4K Q8T8 (MB/s) | 410.9 | 380 ? -8% | |||
| Read 4K Q8T8 (MB/s) | 1033 | 852 ? -18% | |||
| AS SSD | -31% | -275% | -60% | -23% | |
| Seq Read (MB/s) | 1881 | 1590 -15% | 1070 -43% | 1154 -39% | 1752 ? -7% |
| Seq Write (MB/s) | 703 | 714 2% | 171 -76% | 393.6 -44% | 720 ? 2% |
| 4K Read (MB/s) | 52.3 | 50.7 -3% | 41 -22% | 34.42 -34% | 47.3 ? -10% |
| 4K Write (MB/s) | 154.1 | 109.4 -29% | 0.2 -100% | 68.9 -55% | 118.6 ? -23% |
| 4K-64 Read (MB/s) | 1048 | 924 -12% | 1015 -3% | 494.1 -53% | 866 ? -17% |
| 4K-64 Write (MB/s) | 703 | 294.6 -58% | 34 -95% | 171.3 -76% | 402 ? -43% |
| Access Time Read * (ms) | 0.069 | 0.066 4% | 0.04 42% | 0.213 -209% | 0.1034 ? -50% |
| Access Time Write * (ms) | 0.221 | 0.697 -215% | 7.6 -3339% | 0.3 -36% | 0.3076 ? -39% |
| Score Read (Points) | 1288 | 1133 -12% | 1164 -10% | 644 -50% | 1088 ? -16% |
| Score Write (Points) | 927 | 475 -49% | 52 -94% | 280 -70% | 592 ? -36% |
| Score Total (Points) | 2826 | 2157 -24% | 1774 -37% | 1225 -57% | 2197 ? -22% |
| Copy ISO MB/s (MB/s) | 1160 | 1177 1% | 1036 -11% | 985 -15% | 926 ? -20% |
| Copy Program MB/s (MB/s) | 454.7 | 406 -11% | 386 -15% | 143.1 -69% | 372 ? -18% |
| Copy Game MB/s (MB/s) | 991 | 923 -7% | 582 -41% | 676 -32% | 714 ? -28% |
| Totaal Gemiddelde (Programma / Instellingen) | -18% /
-21% | -146% /
-181% | -50% /
-52% | -18% /
-19% |
* ... kleiner is beter

| 3DMark 11 Performance | 4504 punten | |
| 3DMark Cloud Gate Standard Score | 14315 punten | |
| 3DMark Fire Strike Score | 2833 punten | |
| 3DMark Time Spy Score | 793 punten | |
Help | ||
| Rocket League | |
| 1920x1080 Quality AA:Medium FX | |
| Microsoft Surface Pro 7 | |
| Dell XPS 13 7390 2-in-1 Core i7 | |
| HP Spectre x360 13-aw0013dx | |
| Microsoft Surface Pro (2017) i7 | |
| Microsoft Surface Pro 7 Core i5-1035G4 | |
| 1920x1080 High Quality AA:High FX | |
| Microsoft Surface Pro 7 | |
| Dell XPS 13 7390 2-in-1 Core i7 | |
| HP Spectre x360 13-aw0013dx | |
| Microsoft Surface Pro (2017) i7 | |
| Microsoft Surface Pro 7 Core i5-1035G4 | |
| Shadow of the Tomb Raider - 1280x720 Lowest Preset | |
| Microsoft Surface Pro 7 | |
| Dell XPS 13 7390 2-in-1 Core i7 | |
| HP Spectre x360 13-aw0013dx | |
| Microsoft Surface Pro 7 Core i5-1035G4 | |
| Microsoft Surface Pro 6, Core i7, 512 GB | |
| lage | gem. | hoge | ultra | |
|---|---|---|---|---|
| BioShock Infinite (2013) | 112.5 | 72.8 | 60.2 | 21.96 |
| Rise of the Tomb Raider (2016) | 49.16 | 30 | 15.97 | 12.56 |
| Rocket League (2017) | 95.7 | 67.5 | 44.7 | |
| Shadow of the Tomb Raider (2018) | 33 | 14 | 13 |
Geluidsniveau
| Onbelast |
| 30.3 / 30.3 / 30.3 dB (A) |
| Belasting |
| 31.4 / 33.7 dB (A) |
 | ||
30 dB stil 40 dB(A) hoorbaar 50 dB(A) luid |
||
min: | ||
(±) De maximumtemperatuur aan de bovenzijde bedraagt 40.1 °C / 104 F, vergeleken met het gemiddelde van 35.4 °C / 96 F, variërend van 19.6 tot 60 °C voor de klasse Convertible.
(±) De bodem warmt op tot een maximum van 41 °C / 106 F, vergeleken met een gemiddelde van 36.9 °C / 98 F
(+) Bij onbelast gebruik bedraagt de gemiddelde temperatuur voor de bovenzijde 28.7 °C / 84 F, vergeleken met het apparaatgemiddelde van 30.3 °C / 87 F.
(±) De palmsteunen en het touchpad kunnen zeer heet aanvoelen met een maximum van ###max## °C / 102.9 F.
(-) De gemiddelde temperatuur van de handpalmsteun van soortgelijke toestellen bedroeg 28 °C / 82.4 F (-11.4 °C / -20.5 F).
Microsoft Surface Pro 7 audioanalyse
(-) | niet erg luide luidsprekers (65.2 dB)
Bas 100 - 315 Hz
(±) | verminderde zeebaars - gemiddeld 10.2% lager dan de mediaan
(±) | lineariteit van de lage tonen is gemiddeld (12.1% delta ten opzichte van de vorige frequentie)
Midden 400 - 2000 Hz
(+) | evenwichtige middens - slechts 4.6% verwijderd van de mediaan
(±) | lineariteit van de middentonen is gemiddeld (10.2% delta ten opzichte van de vorige frequentie)
Hoog 2 - 16 kHz
(+) | evenwichtige hoogtepunten - slechts 3.1% verwijderd van de mediaan
(+) | de hoge tonen zijn lineair (6.8% delta naar de vorige frequentie)
Algemeen 100 - 16.000 Hz
(±) | lineariteit van het totale geluid is gemiddeld (21.5% verschil met de mediaan)
Vergeleken met dezelfde klasse
» 58% van alle geteste apparaten in deze klasse waren beter, 10% vergelijkbaar, 31% slechter
» De beste had een delta van 6%, het gemiddelde was 20%, de slechtste was 57%
Vergeleken met alle geteste toestellen
» 61% van alle geteste apparaten waren beter, 7% gelijk, 33% slechter
» De beste had een delta van 4%, het gemiddelde was 24%, de slechtste was 134%
Apple MacBook 12 (Early 2016) 1.1 GHz audioanalyse
(+) | luidsprekers kunnen relatief luid spelen (83.6 dB)
Bas 100 - 315 Hz
(±) | verminderde zeebaars - gemiddeld 11.3% lager dan de mediaan
(±) | lineariteit van de lage tonen is gemiddeld (14.2% delta ten opzichte van de vorige frequentie)
Midden 400 - 2000 Hz
(+) | evenwichtige middens - slechts 2.4% verwijderd van de mediaan
(+) | de middentonen zijn lineair (5.5% delta ten opzichte van de vorige frequentie)
Hoog 2 - 16 kHz
(+) | evenwichtige hoogtepunten - slechts 2% verwijderd van de mediaan
(+) | de hoge tonen zijn lineair (4.5% delta naar de vorige frequentie)
Algemeen 100 - 16.000 Hz
(+) | het totale geluid is lineair (10.2% verschil met de mediaan)
Vergeleken met dezelfde klasse
» 7% van alle geteste apparaten in deze klasse waren beter, 2% vergelijkbaar, 91% slechter
» De beste had een delta van 5%, het gemiddelde was 18%, de slechtste was 53%
Vergeleken met alle geteste toestellen
» 5% van alle geteste apparaten waren beter, 1% gelijk, 94% slechter
» De beste had een delta van 4%, het gemiddelde was 24%, de slechtste was 134%
| Uit / Standby | |
| Inactief | |
| Belasting |
|
Key:
min: | |
| Microsoft Surface Pro 7 i7-1065G7, Iris Plus Graphics G7 (Ice Lake 64 EU), Toshiba KBG40ZNS256G NVMe, IPS, 2736x1824, 12.3" | Microsoft Surface Pro 6, Core i7, 512 GB i7-8650U, UHD Graphics 620, Toshiba KBG30ZPZ512G, IPS, 2736x1824, 12.3" | Microsoft Surface Pro (2017) i7 i7-7660U, Iris Plus Graphics 640, Samsung PM971 KUS040202M, IPS, 2736x1824, 12.3" | Microsoft Surface Pro 7 Core i5-1035G4 i5-1035G4, Iris Plus Graphics G4 (Ice Lake 48 EU), Toshiba BG4 KBG40ZPZ256G, IPS, 2736x1824, 12.3" | Dell XPS 13 7390 2-in-1 Core i7 i7-1065G7, Iris Plus Graphics G7 (Ice Lake 64 EU), Toshiba BG4 KBG40ZPZ512G, IPS, 1920x1200, 13.4" | Gemiddeld Intel Iris Plus Graphics G7 (Ice Lake 64 EU) | Gemiddelde van klas Convertible | |
|---|---|---|---|---|---|---|---|
| Power Consumption | 17% | 0% | -1% | 26% | 12% | 5% | |
| Idle Minimum * (Watt) | 4.4 | 3.2 27% | 4.2 5% | 4.5 -2% | 2.6 41% | 3.91 ? 11% | 4.24 ? 4% |
| Idle Average * (Watt) | 8.7 | 8.7 -0% | 10.1 -16% | 9.2 -6% | 5.3 39% | 7.33 ? 16% | 7.03 ? 19% |
| Idle Maximum * (Watt) | 9.6 | 10.4 -8% | 14 -46% | 9.6 -0% | 7 27% | 9.16 ? 5% | 8.61 ? 10% |
| Load Average * (Watt) | 44 | 29.2 34% | 37.4 15% | 42 5% | 43.1 2% | 39.2 ? 11% | 43.9 ? -0% |
| Load Maximum * (Watt) | 61 | 40.8 33% | 34 44% | 63.5 -4% | 49 20% | 49.8 ? 18% | 67.2 ? -10% |
| Witcher 3 ultra * (Watt) | 38.1 | 43.1 |
* ... kleiner is beter
| Microsoft Surface Pro 7 i7-1065G7, Iris Plus Graphics G7 (Ice Lake 64 EU), 45 Wh | Microsoft Surface Pro 7 Core i5-1035G4 i5-1035G4, Iris Plus Graphics G4 (Ice Lake 48 EU), 45 Wh | Microsoft Surface Pro (2017) i7 i7-7660U, Iris Plus Graphics 640, 45 Wh | Dell XPS 13 7390 2-in-1 Core i7 i7-1065G7, Iris Plus Graphics G7 (Ice Lake 64 EU), 51 Wh | Gemiddelde van klas Convertible | |
|---|---|---|---|---|---|
| Batterijduur | 32% | 12% | -8% | 72% | |
| Reader / Idle (h) | 11.5 | 22.3 94% | 27.7 ? 141% | ||
| H.264 (h) | 6.7 | 10.2 52% | 15.3 ? 128% | ||
| WiFi v1.3 (h) | 9.8 | 10 2% | 8.2 -16% | 9 -8% | 12.1 ? 23% |
| Load (h) | 1.9 | 1.9 0% | 1.9 0% | 1.779 ? -6% | |
| Witcher 3 ultra (h) | 1.9 |
Pro
Contra
Dit is de verkorte versie van het originele artikel. Het volledige, Engelse artikel vind je hier.
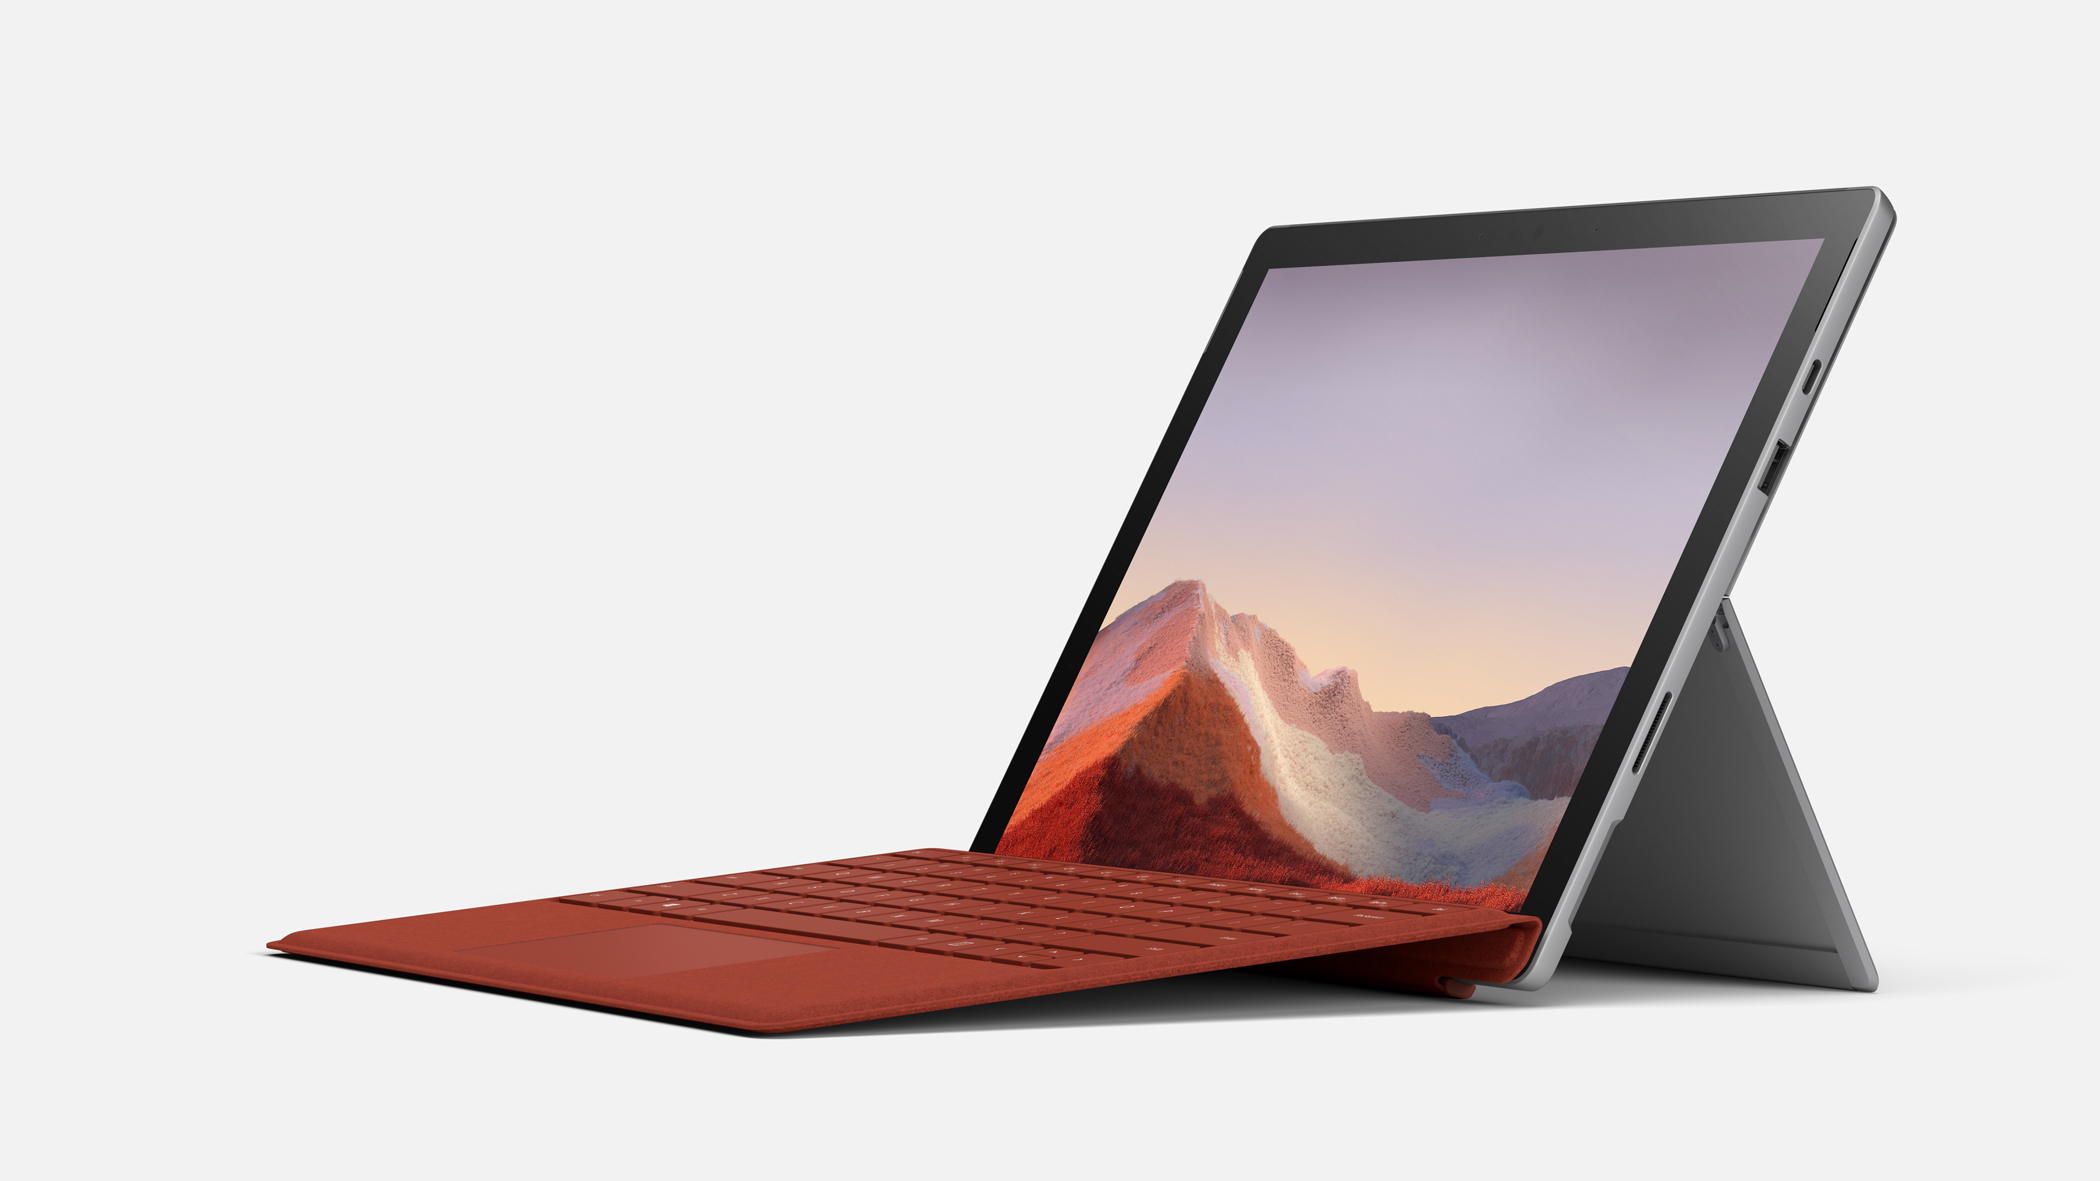
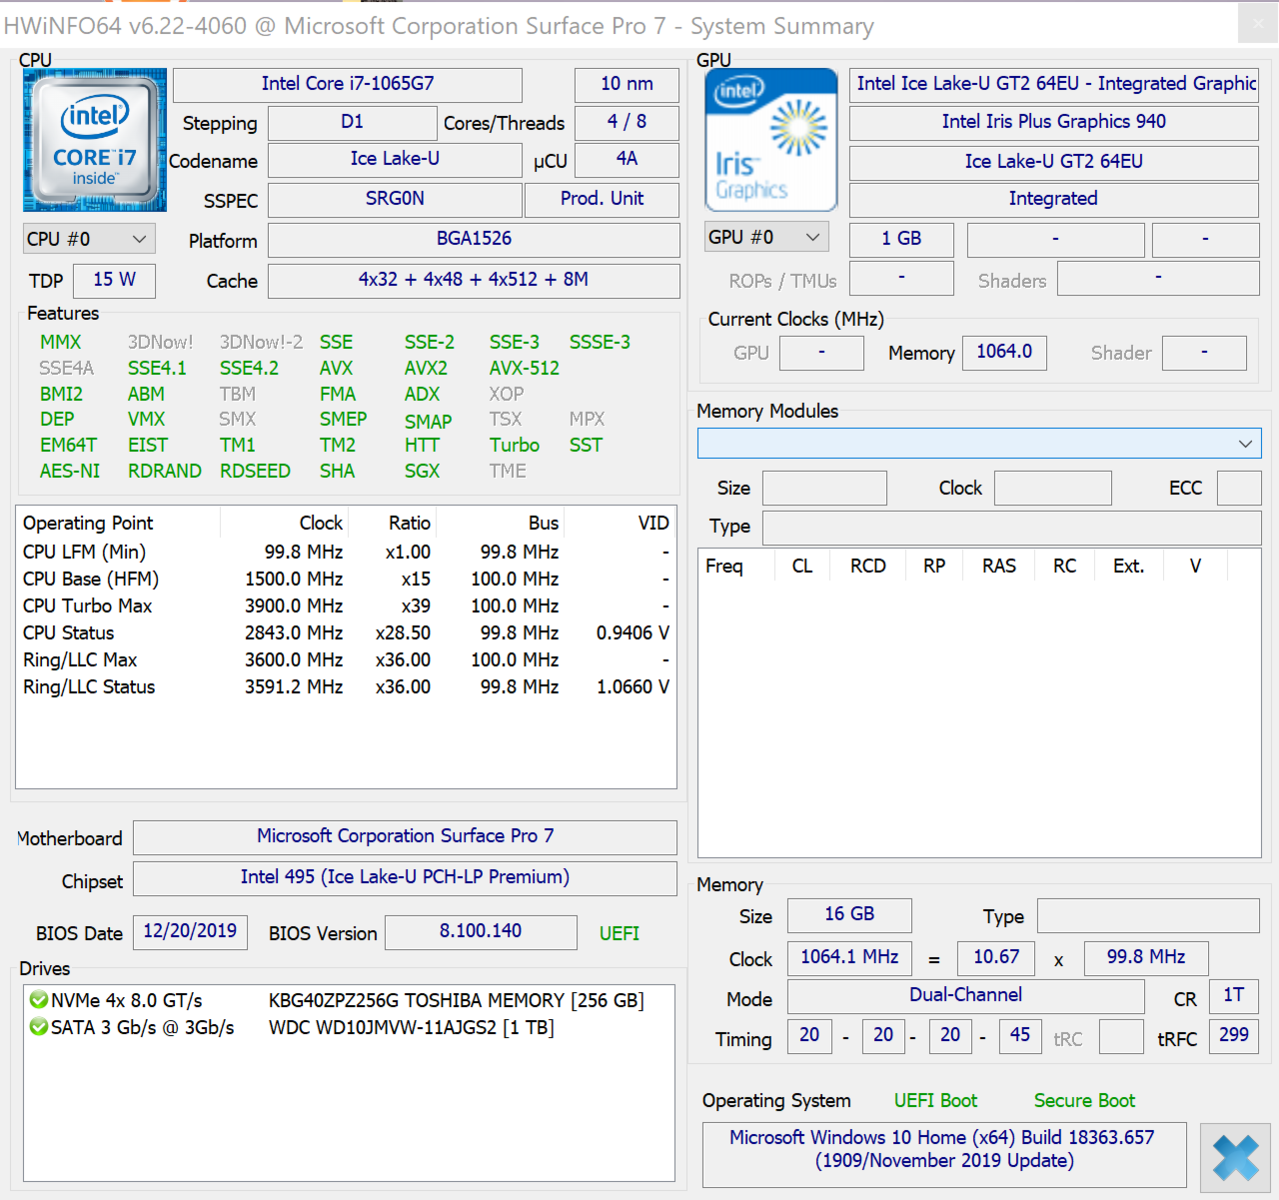
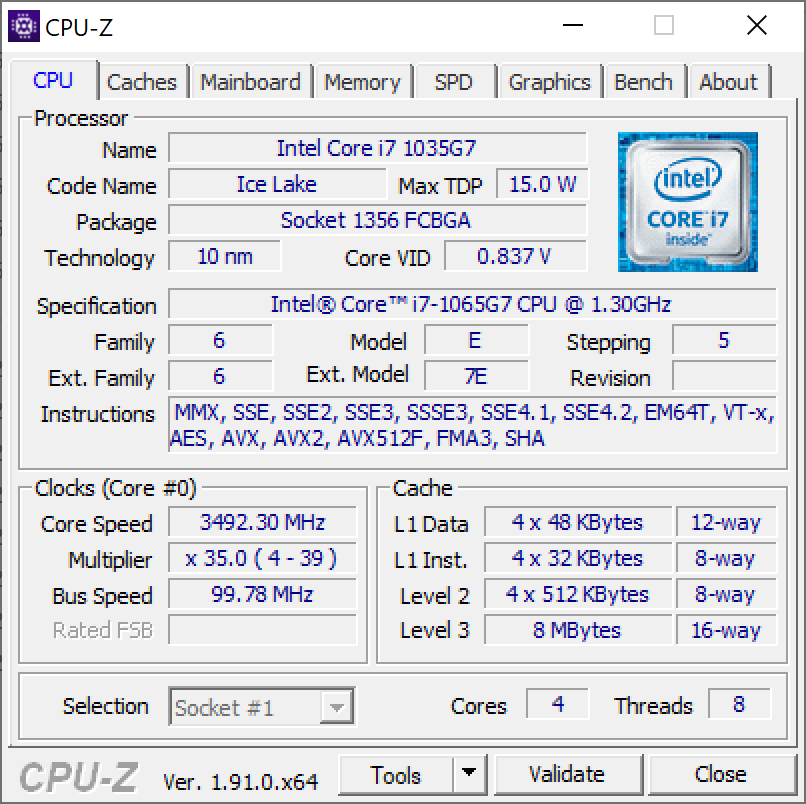
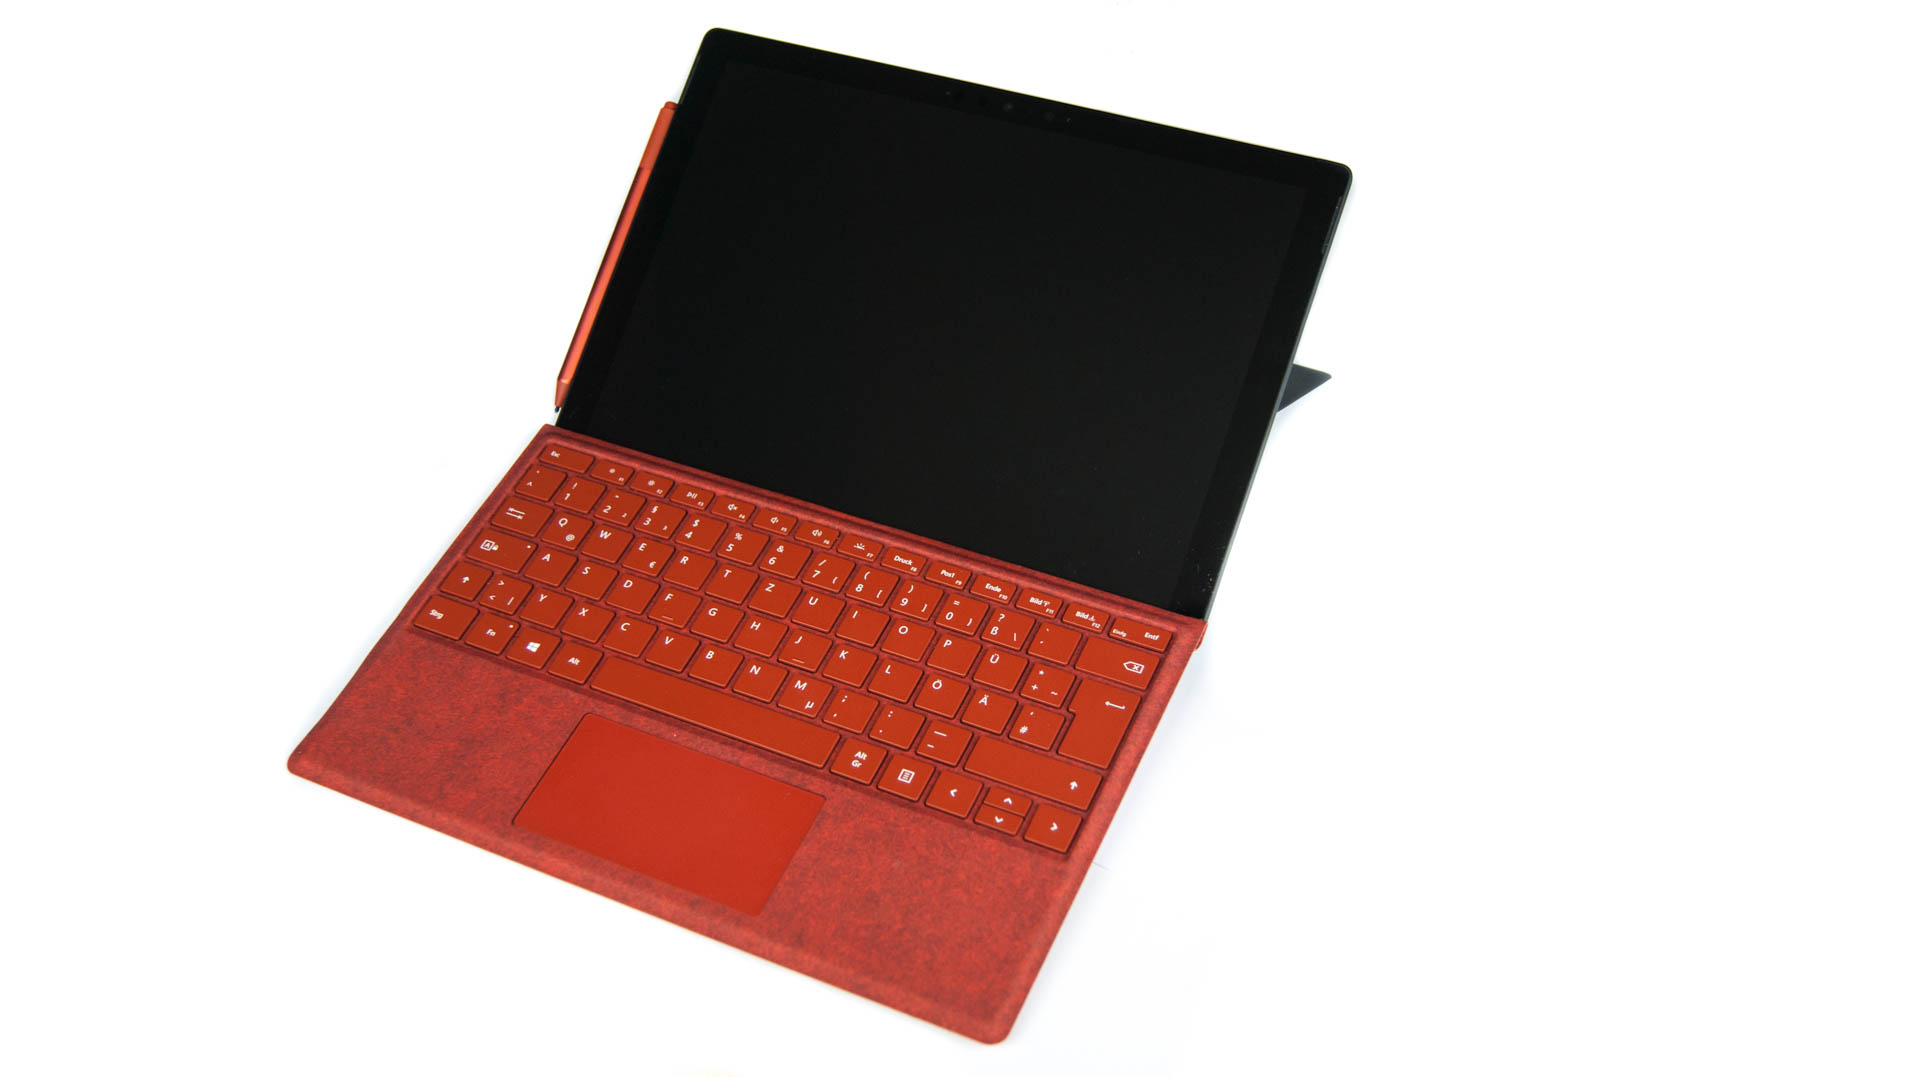
Na onze eerste uitgebreide review van de i5-versie van de Microsoft Surface Pro 7 (Core i5, 8 GB) kunnen we nu ook het krachtigste model testen. We merkten al snel dat het snellere model niet zo gek veel verschilt van zijn meer betaalbare zustermodel, zeker wanneer we de CPU-prestaties bij aanhoudende belasting in beschouwing nemen. De GPU-prestaties werden echter wel aanzienlijk verbeterd. Gelukkig ging deze extra rekenkracht niet ten koste van lage temperaturen en een goede batterijduur.
De vraag blijft: is het model de meerprijs waard?
De Surface Pro 7 met Intel Core i7 is bedoeld voor veeleisende gebruikers die het klein beetje extra rekenkracht kunnen benutten, zeker als het op grafische prestaties aankomt.
Zoals we konden aantonen in onze systeembenchmarks, zijn de CPU-prestaties niet de onderscheidende factor van het i7-model. De grafische prestaties zijn het echte uithangbord en de belangrijkste factor om de meerprijs te rechtvaardigen. Voor meer details over de Surface-serie kan je ons vorige testrapport raadplegen.
Microsoft Surface Pro 7
- 20-02-2020 v7 (old)
Nino Ricchizzi
Price comparison
