Kort testrapport van Acer Swift 3 SF313 met Ice Lake Processor
Evaluatie | Datum | Model | Gewicht | Hoogte | Formaat | Resolutie | Beste prijs |
|---|---|---|---|---|---|---|---|
| 87 % v7 (old) | 02-2020 | Acer Swift 3 SF313-52-71Y7 i7-1065G7, Iris Plus Graphics G7 (Ice Lake 64 EU) | 1.2 kg | 16.6 mm | 13.50" | 2256x1504 | |
| 88.2 % v7 (old) | 10-2019 | Lenovo Yoga C940-14IIL i7-1065G7, Iris Plus Graphics G7 (Ice Lake 64 EU) | 1.4 kg | 14.95 mm | 14.00" | 1920x1080 | |
| 85.7 % v6 (old) | 02-2019 | Acer Swift 3 SF313-51-59SZ i5-8250U, UHD Graphics 620 | 1.3 kg | 16 mm | 13.30" | 1920x1080 | |
| 88 % v6 (old) | 02-2019 | Dell XPS 13 9380 2019 i5-8265U, UHD Graphics 620 | 1.2 kg | 11.6 mm | 13.30" | 3840x2160 | |
| 86 % v7 (old) | 07-2019 | Lenovo ThinkBook 13s-20R90071GE i5-8265U, UHD Graphics 620 | 1.3 kg | 15.9 mm | 13.30" | 1920x1080 | |
| 84.5 % v7 (old) | 08-2019 | HP Envy 13-aq0003ng i7-8565U, GeForce MX250 | 1.2 kg | 14.7 mm | 13.30" | 1920x1080 |

| |||||||||||||||||||||||||
Helderheidsverdeling: 82 %
Helderheid in Batterij-modus: 466 cd/m²
Contrast: 1634:1 (Zwart: 0.29 cd/m²)
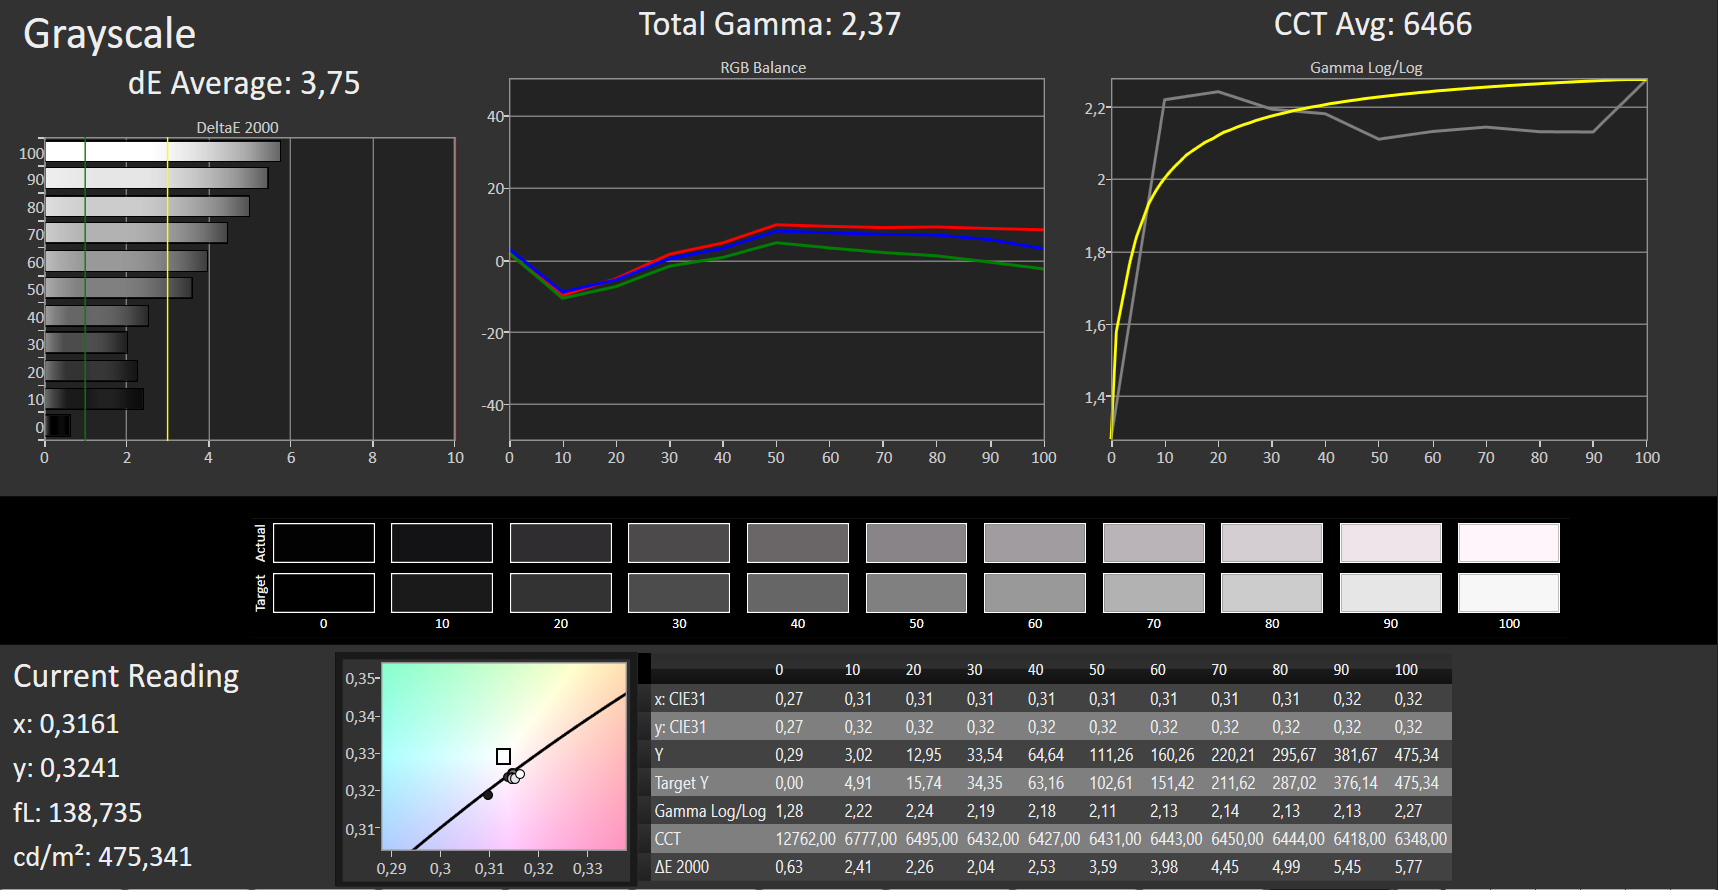
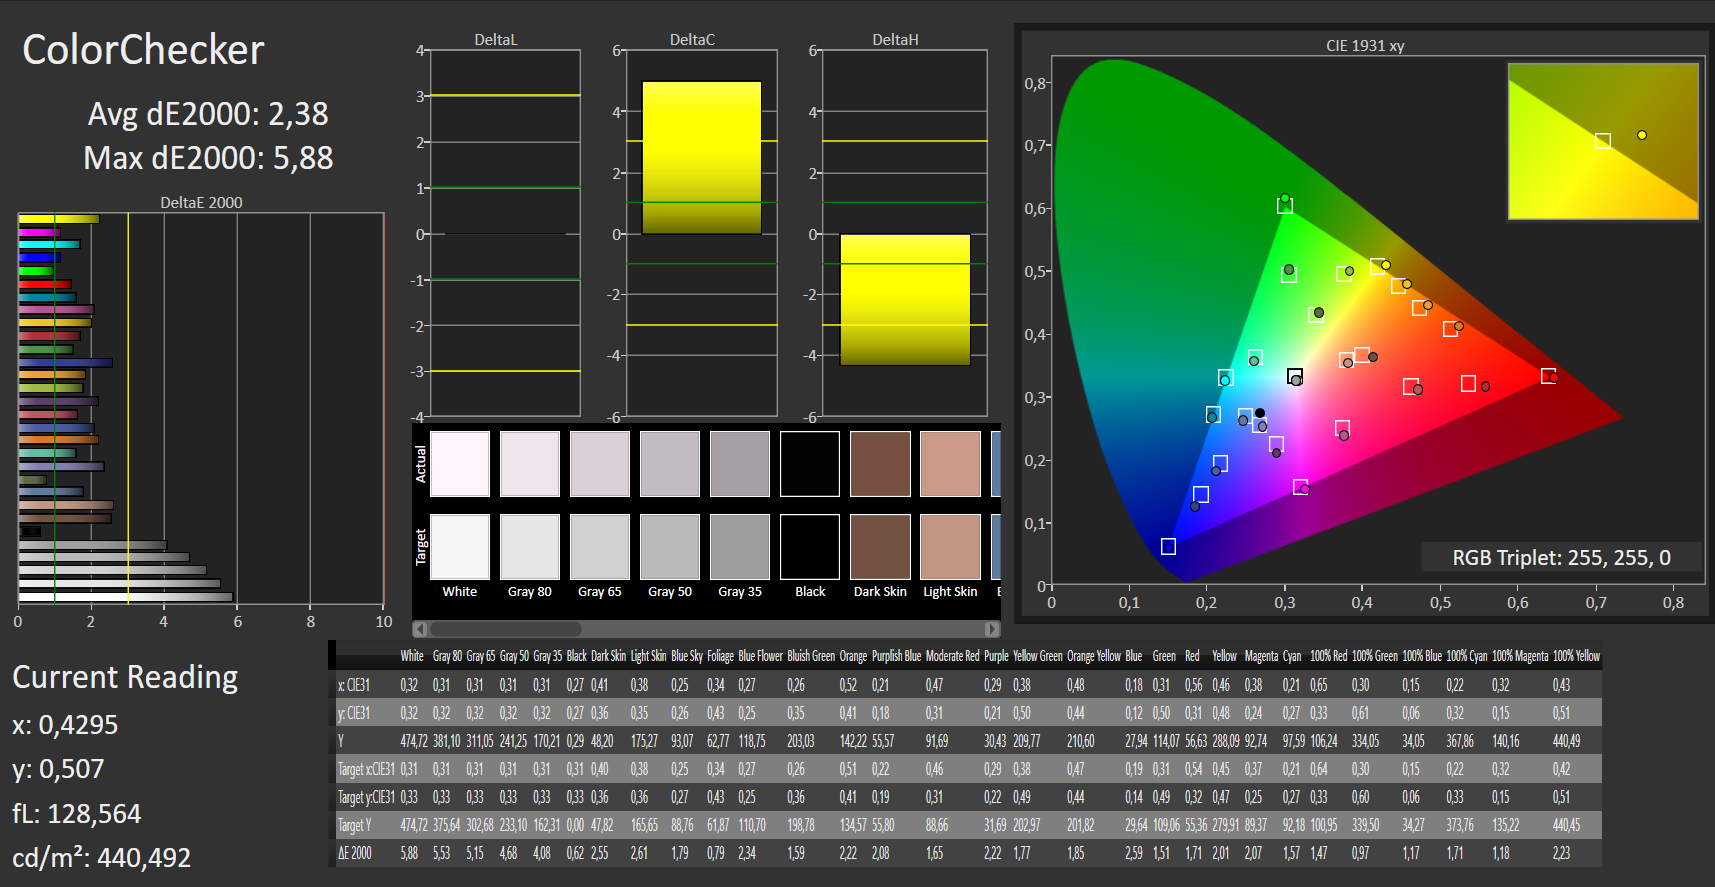
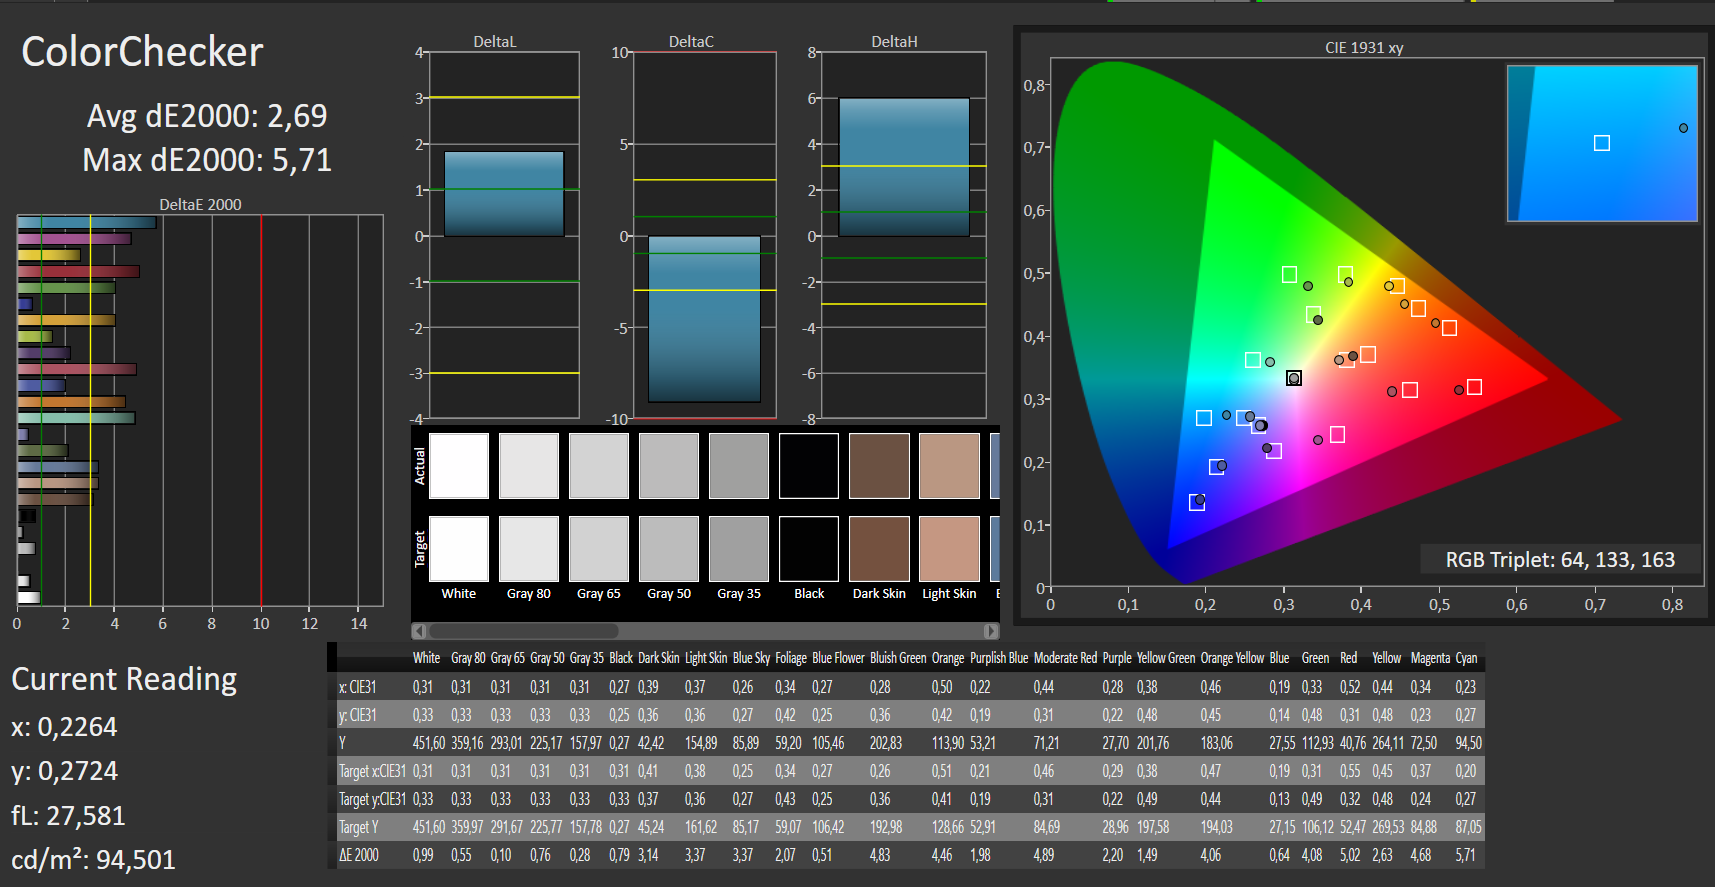
ΔE ColorChecker Calman: 2.38 | ∀{0.5-29.43 Ø4.72}
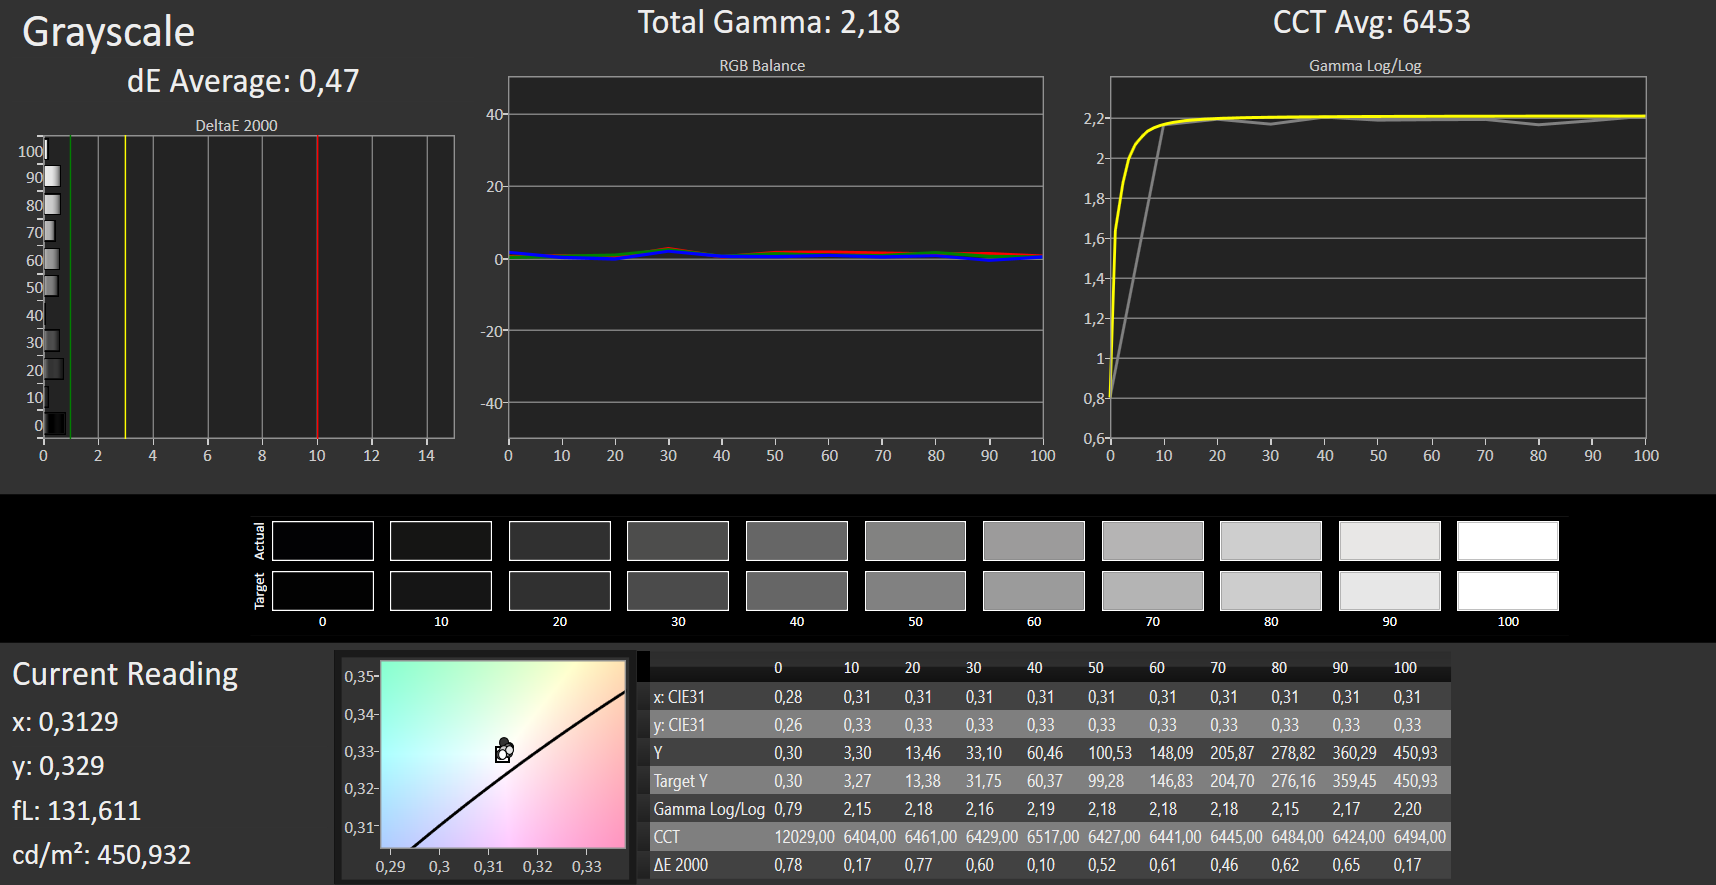
calibrated: 2.69
ΔE Greyscale Calman: 3.75 | ∀{0.09-98 Ø4.97}
100% sRGB (Argyll 1.6.3 3D)
65% AdobeRGB 1998 (Argyll 1.6.3 3D)
71.2% AdobeRGB 1998 (Argyll 3D)
99.8% sRGB (Argyll 3D)
70.1% Display P3 (Argyll 3D)
Gamma: 2.37
CCT: 6466 K
| Acer Swift 3 SF313-52-71Y7 BOE, NE135FBM-N41, IPS, 2256x1504, 13.5" | Lenovo Yoga C940-14IIL LP140WF9-SPE2, IPS LED, 1920x1080, 14" | Acer Swift 3 SF313-51-59SZ BOE NV133FHM-N62, IPS, 1920x1080, 13.3" | Dell XPS 13 9380 2019 ID: AUO 282B B133ZAN Dell: 90NTH, IPS, 3840x2160, 13.3" | Lenovo ThinkBook 13s-20R90071GE N133HCE-EN2, a-Si IPS LED, 1920x1080, 13.3" | HP Envy 13-aq0003ng InfoVision M133NVF3 R2, IPS, 1920x1080, 13.3" | |
|---|---|---|---|---|---|---|
| Display | -4% | -9% | -8% | -3% | -8% | |
| Display P3 Coverage (%) | 70.1 | 66 -6% | 67 -4% | 64.7 -8% | 67 -4% | 64.4 -8% |
| sRGB Coverage (%) | 99.8 | 97.9 -2% | 88 -12% | 93.1 -7% | 99.1 -1% | 91.7 -8% |
| AdobeRGB 1998 Coverage (%) | 71.2 | 67.3 -5% | 64.3 -10% | 65.3 -8% | 69.2 -3% | 65.2 -8% |
| Response Times | 7% | 2% | -11% | 17% | 34% | |
| Response Time Grey 50% / Grey 80% * (ms) | 55 ? | 49.6 ? 10% | 44 ? 20% | 58 ? -5% | 40.4 ? 27% | 31 ? 44% |
| Response Time Black / White * (ms) | 31 ? | 30 ? 3% | 36 ? -16% | 36 ? -16% | 28.8 ? 7% | 24 ? 23% |
| PWM Frequency (Hz) | 208 ? | 500 ? | 25000 ? | 4000 ? | ||
| Screen | 4% | -40% | -16% | -1% | 0% | |
| Brightness middle (cd/m²) | 474 | 384 -19% | 300 -37% | 404 -15% | 319 -33% | 768 62% |
| Brightness (cd/m²) | 426 | 363 -15% | 277 -35% | 389 -9% | 309 -27% | 778 83% |
| Brightness Distribution (%) | 82 | 90 10% | 87 6% | 85 4% | 92 12% | 82 0% |
| Black Level * (cd/m²) | 0.29 | 0.17 41% | 0.26 10% | 0.37 -28% | 0.28 3% | 0.48 -66% |
| Contrast (:1) | 1634 | 2259 38% | 1154 -29% | 1092 -33% | 1139 -30% | 1600 -2% |
| Colorchecker dE 2000 * | 2.38 | 3.5 -47% | 5.96 -150% | 3.72 -56% | 2.4 -1% | 3.49 -47% |
| Colorchecker dE 2000 max. * | 5.88 | 5.5 6% | 10.6 -80% | 7.38 -26% | 6.3 -7% | 7.41 -26% |
| Colorchecker dE 2000 calibrated * | 2.69 | 1 63% | 2.47 8% | 2.06 23% | 0.6 78% | 2.07 23% |
| Greyscale dE 2000 * | 3.75 | 4.6 -23% | 7.64 -104% | 4.44 -18% | 3.8 -1% | 4.09 -9% |
| Gamma | 2.37 93% | 2.32 95% | 2.44 90% | 2.34 94% | 2.16 102% | 2.54 87% |
| CCT | 6466 101% | 6884 94% | 6877 95% | 7095 92% | 7335 89% | 6452 101% |
| Color Space (Percent of AdobeRGB 1998) (%) | 65 | 62 -5% | 57 -12% | 60 -8% | 63.5 -2% | 60 -8% |
| Color Space (Percent of sRGB) (%) | 100 | 97.7 -2% | 88 -12% | 93 -7% | 99.1 -1% | 92 -8% |
| Totaal Gemiddelde (Programma / Instellingen) | 2% /
3% | -16% /
-29% | -12% /
-14% | 4% /
1% | 9% /
3% |
* ... kleiner is beter
Responstijd Scherm
| ↔ Responstijd Zwart naar Wit | ||
|---|---|---|
| 31 ms ... stijging ↗ en daling ↘ gecombineerd | ↗ 17 ms stijging | 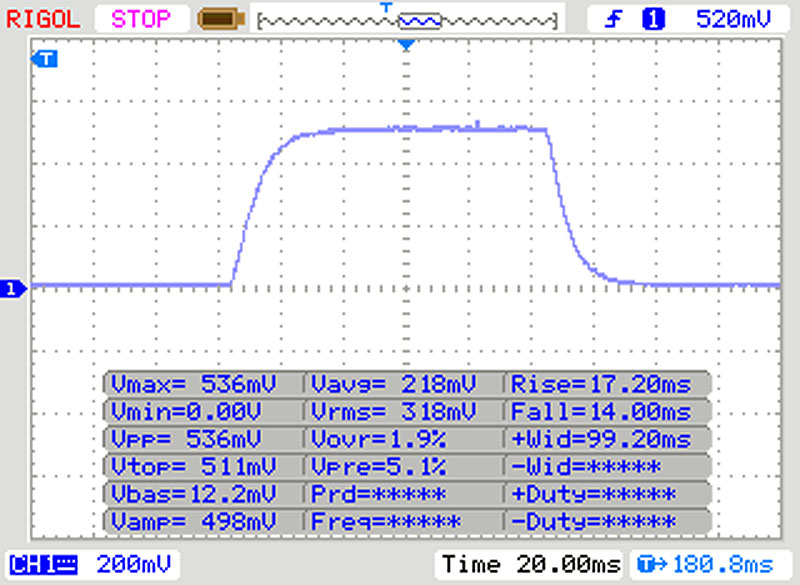 |
| ↘ 14 ms daling | ||
| Het scherm vertoonde trage responstijden in onze tests en is misschien te traag voor games. Ter vergelijking: alle testtoestellen variëren van 0.1 (minimum) tot 240 (maximum) ms. » 84 % van alle toestellen zijn beter. Dit betekent dat de gemeten responstijd slechter is dan het gemiddelde (19.8 ms) van alle geteste toestellen. | ||
| ↔ Responstijd 50% Grijs naar 80% Grijs | ||
| 55 ms ... stijging ↗ en daling ↘ gecombineerd | ↗ 25 ms stijging | 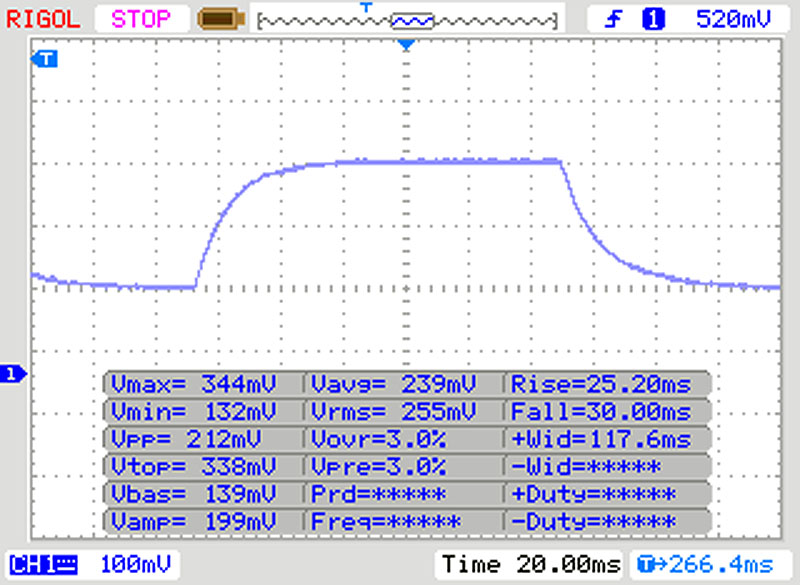 |
| ↘ 30 ms daling | ||
| Het scherm vertoonde trage responstijden in onze tests en is misschien te traag voor games. Ter vergelijking: alle testtoestellen variëren van 0.165 (minimum) tot 636 (maximum) ms. » 92 % van alle toestellen zijn beter. Dit betekent dat de gemeten responstijd slechter is dan het gemiddelde (31 ms) van alle geteste toestellen. | ||
Screen Flickering / PWM (Pulse-Width Modulation)
| Screen flickering / PWM waargenomen | 208 Hz | ≤ 90 % helderheid instelling | 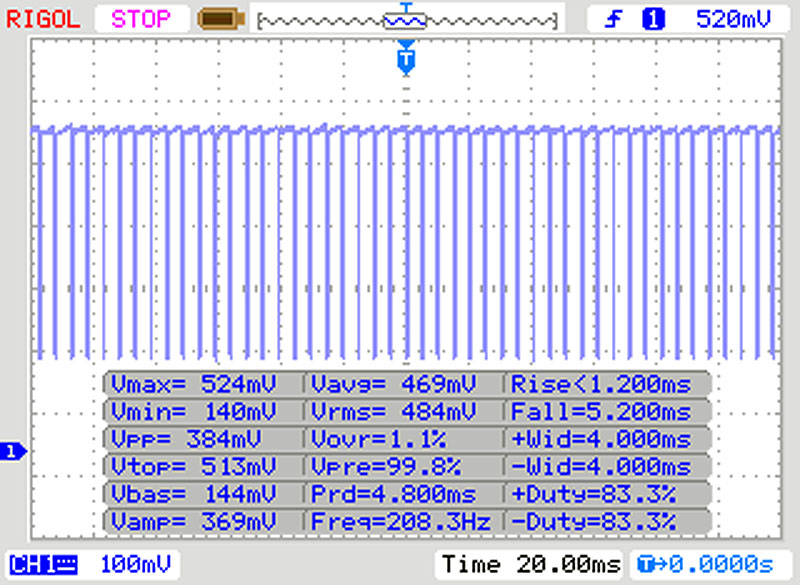 |
De achtergrondverlichting van het scherm flikkert op 208 Hz (in het slechtste geval, bijvoorbeeld bij gebruik van PWM) aan een helderheid van 90 % en lager. Boven deze helderheid zou er geen flickering / PWM mogen optreden. De frequentie van 208 Hz is redelijk laag en de meeste mensen die gevoelig zijn aan flickering kunnen dit dus waarnemen of geïrriteerde ogen krijgen (gebruikmakend van de vermelde helderheid en lager). Ter vergelijking: 52 % van alle geteste toestellen maakten geen gebruik van PWM om de schermhelderheid te verlagen. Als het wel werd gebruikt, werd een gemiddelde van 7781 (minimum: 5 - maximum: 343500) Hz waargenomen. | |||
* ... kleiner is beter
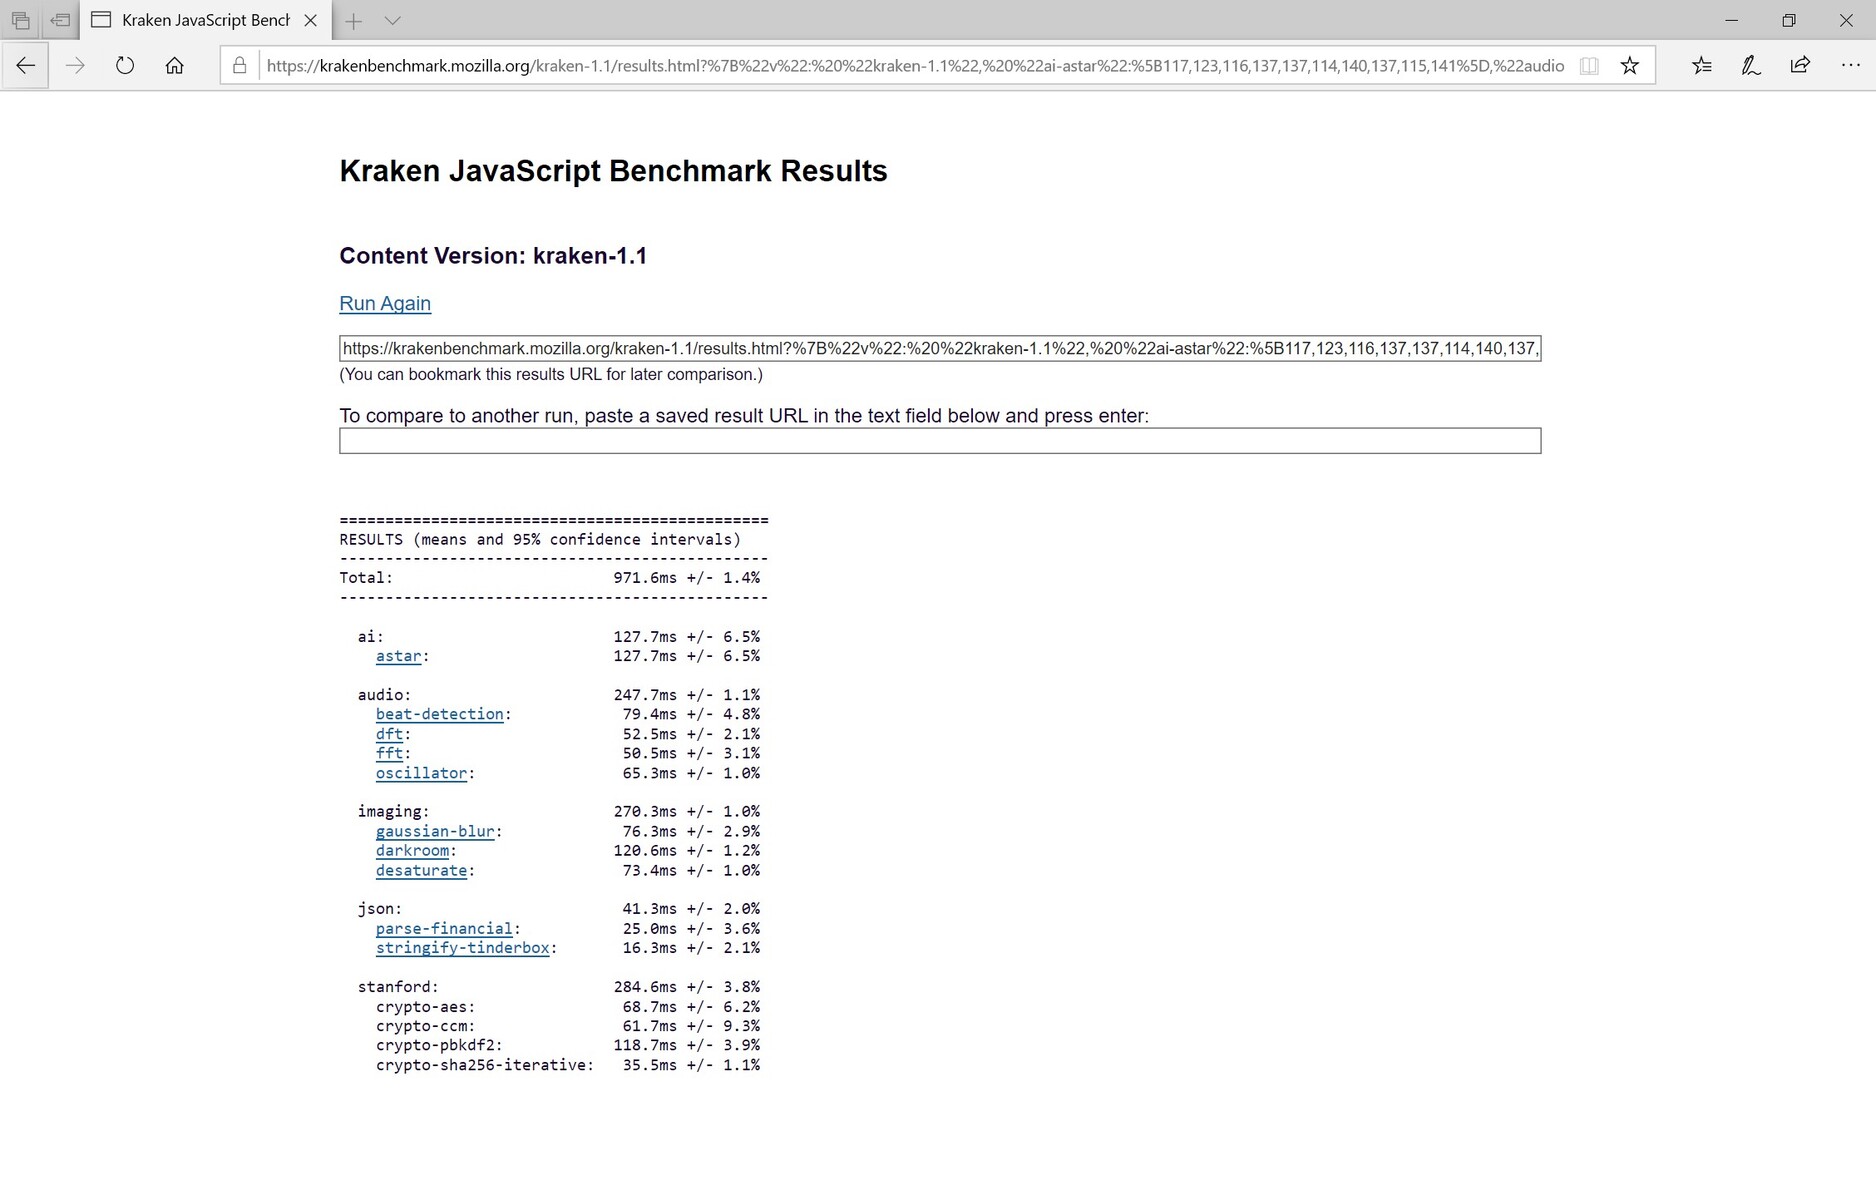
| PCMark 8 Home Score Accelerated v2 | 3759 punten | |
| PCMark 8 Creative Score Accelerated v2 | 5979 punten | |
| PCMark 8 Work Score Accelerated v2 | 4802 punten | |
| PCMark 10 Score | 3975 punten | |
Help | ||
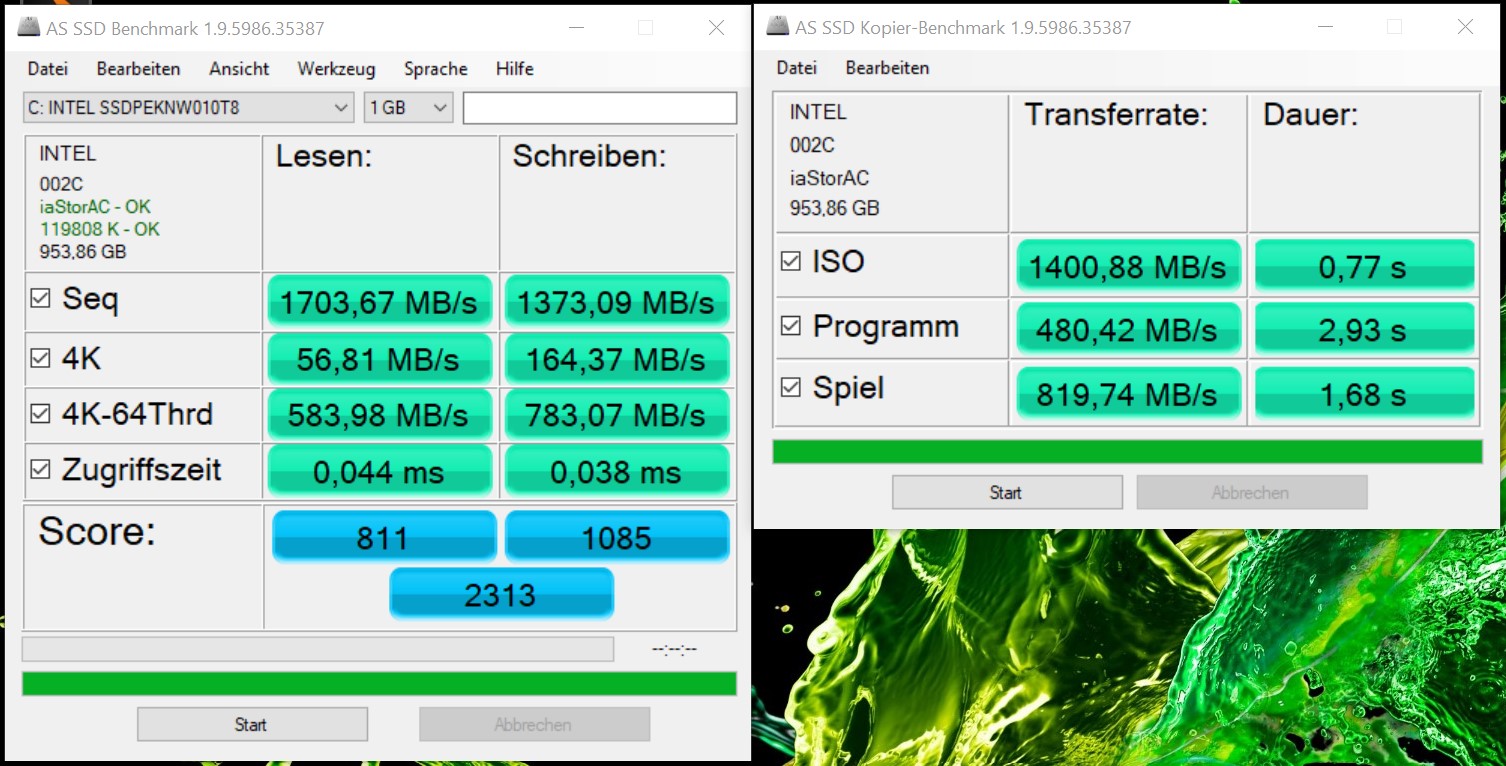
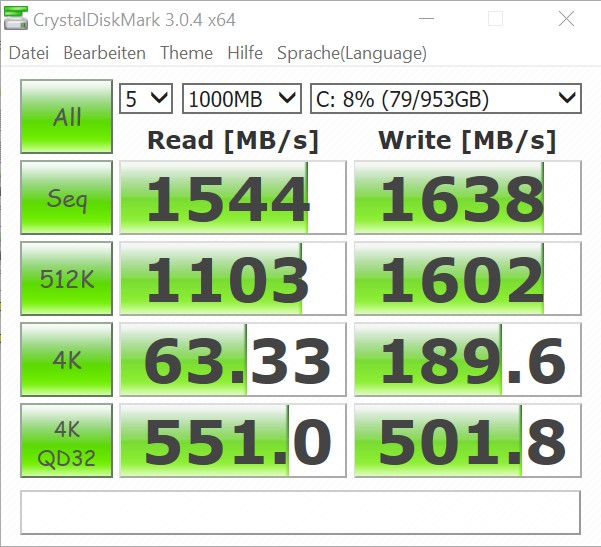
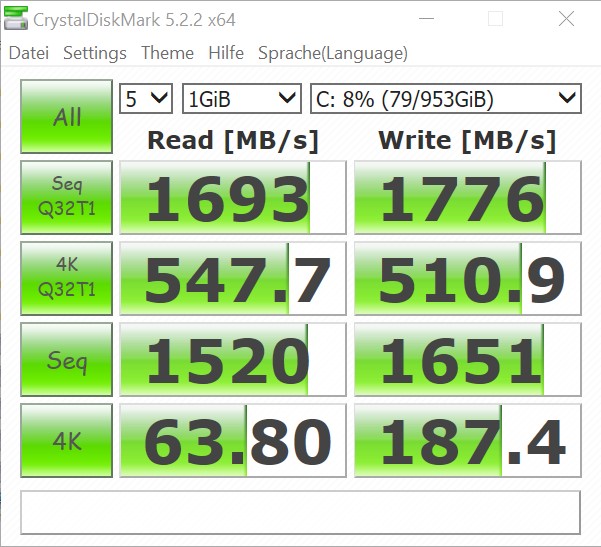
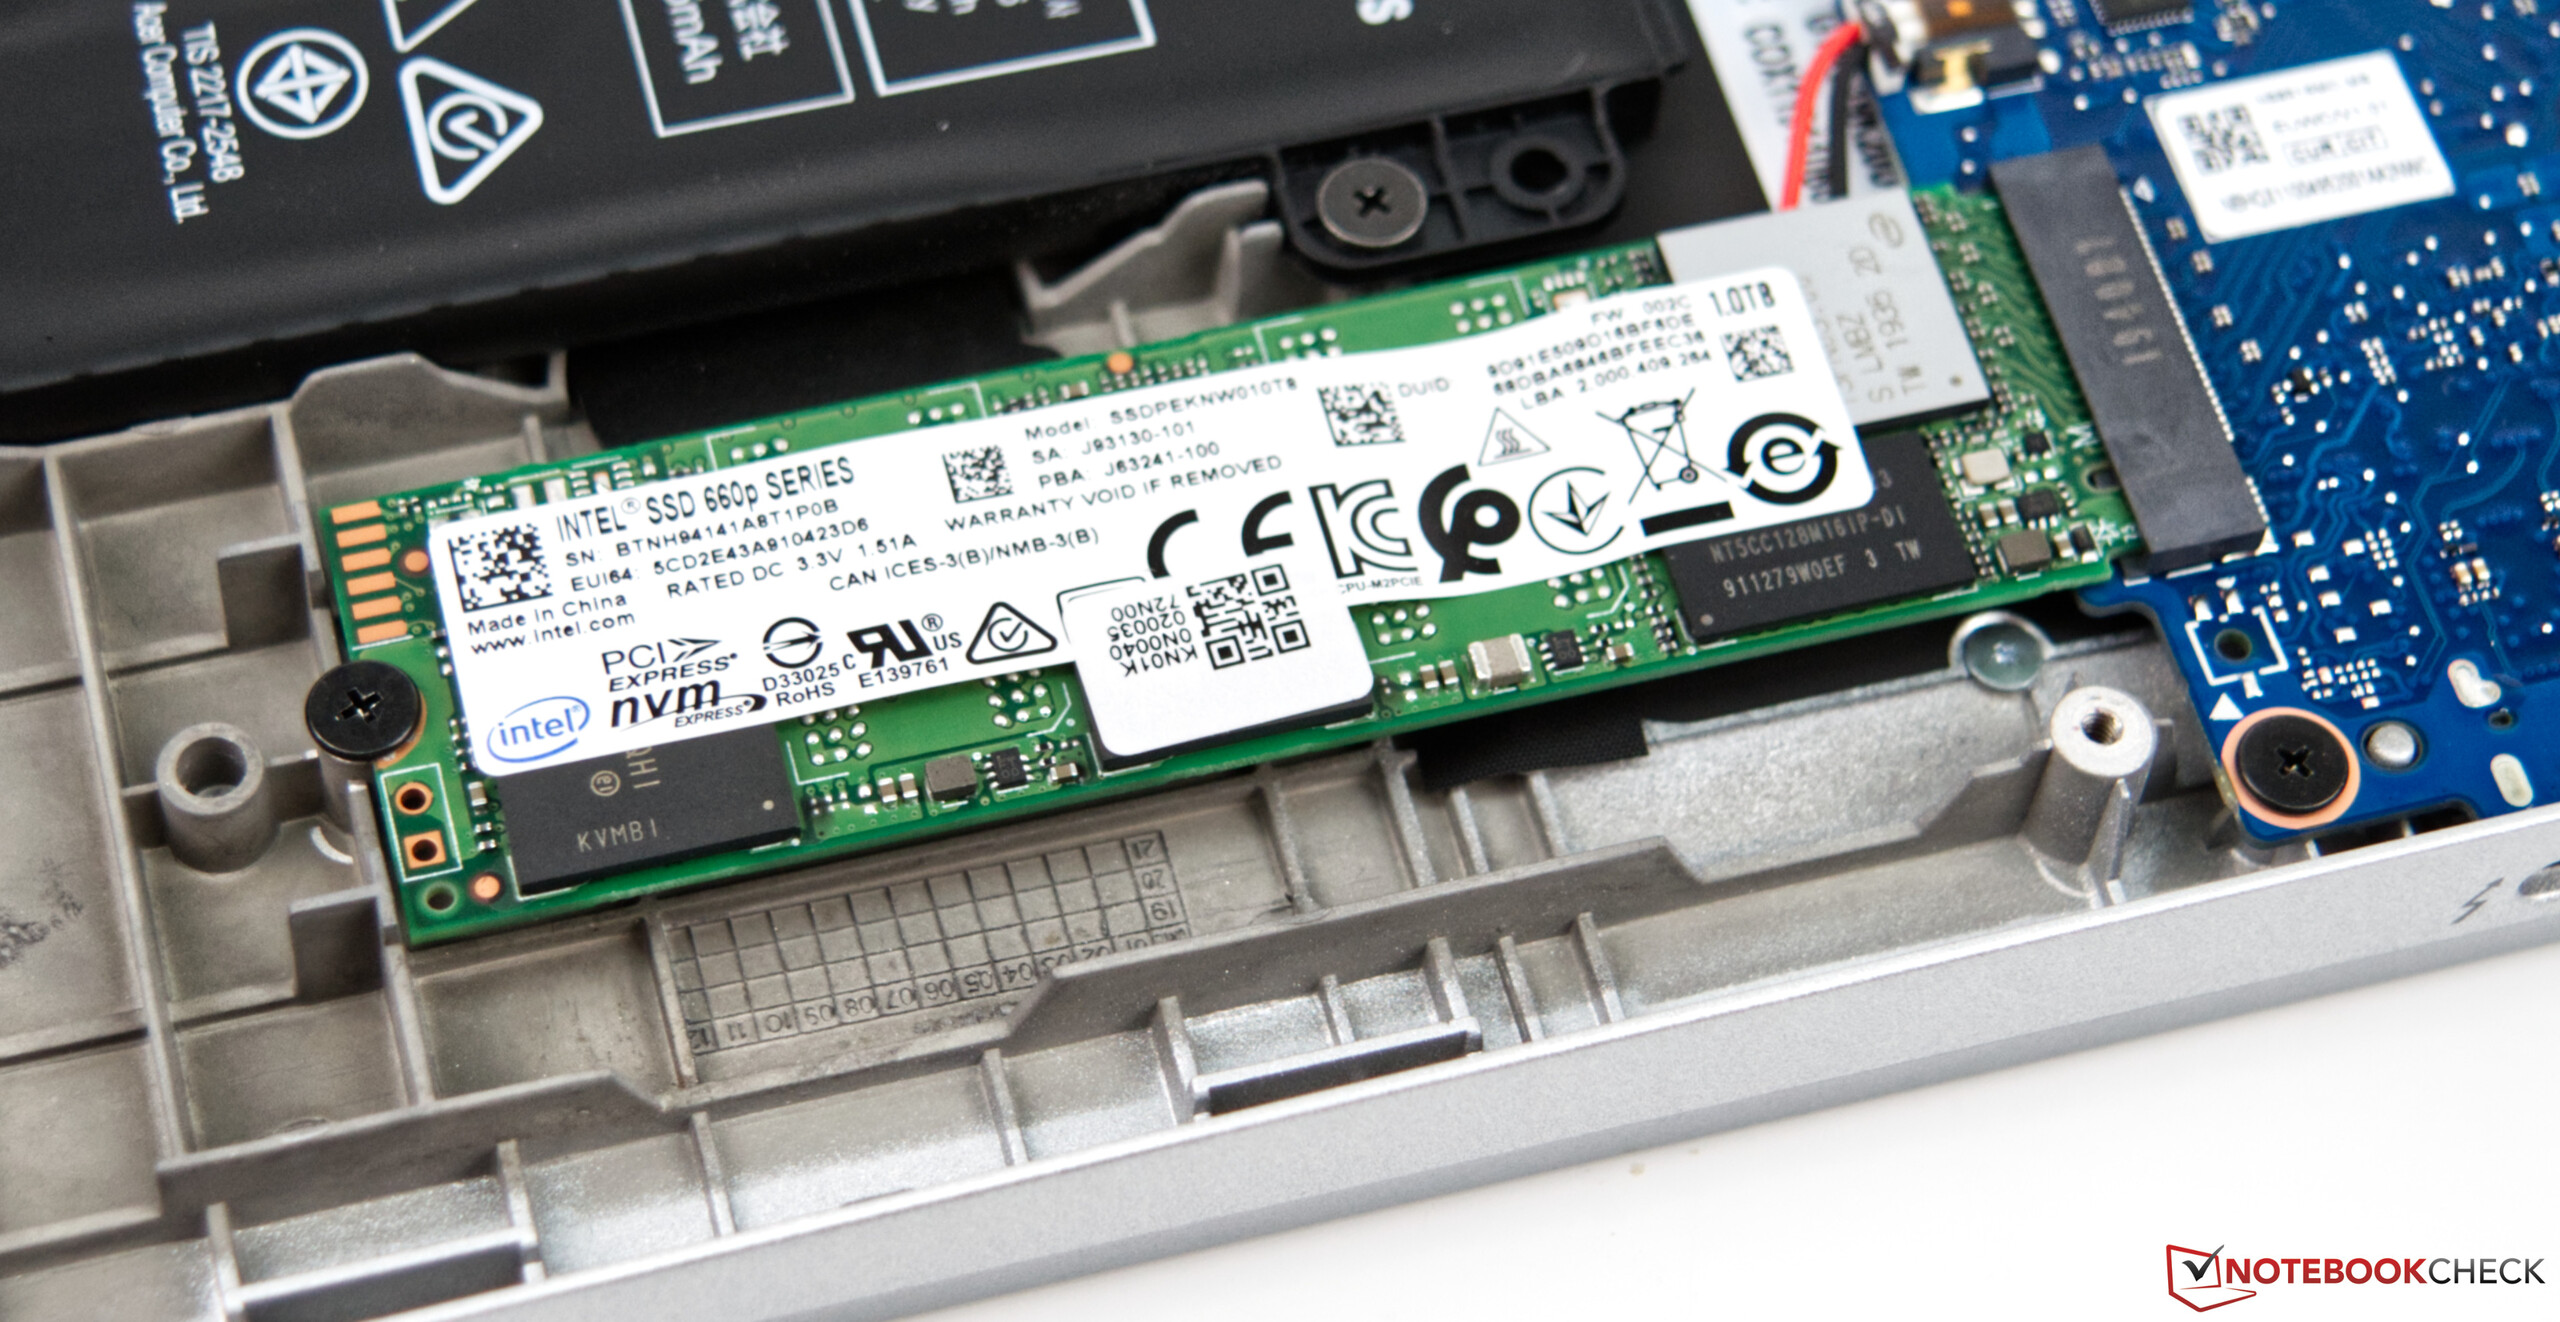
| Acer Swift 3 SF313-52-71Y7 Intel SSD 660p 1TB SSDPEKNW010T8 | Lenovo Yoga C940-14IIL Samsung SSD PM981 MZVLB512HAJQ | Acer Swift 3 SF313-51-59SZ Kingston RBUSNS8154P3256GJ1 | Dell XPS 13 9380 2019 SK hynix PC401 HFS256GD9TNG | Lenovo ThinkBook 13s-20R90071GE SK hynix BC501 HFM512GDHTNG-8310A | HP Envy 13-aq0003ng Toshiba KBG30ZMV512G | Gemiddeld Intel SSD 660p 1TB SSDPEKNW010T8 | |
|---|---|---|---|---|---|---|---|
| CrystalDiskMark 5.2 / 6 | 8% | -7% | -36% | -34% | -42% | -11% | |
| Write 4K (MB/s) | 187.4 | 128.4 -31% | 113.7 -39% | 84.6 -55% | 89.3 -52% | 106.2 -43% | 144.5 ? -23% |
| Read 4K (MB/s) | 63.8 | 46.37 -27% | 40.6 -36% | 38.52 -40% | 37.4 -41% | 44.89 -30% | 54.1 ? -15% |
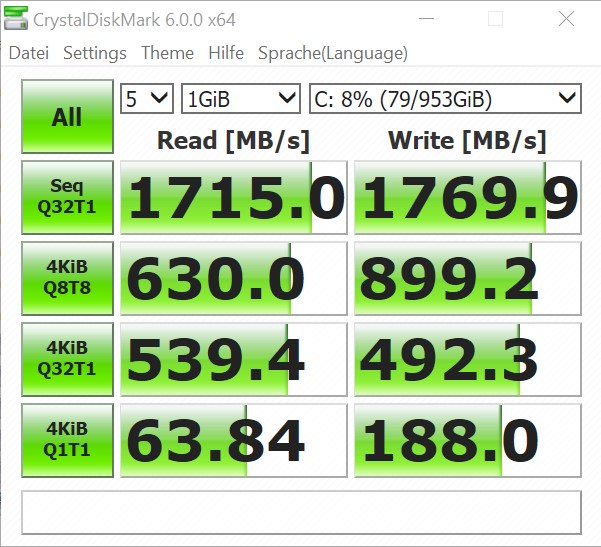
| Write Seq (MB/s) | 1776 | 1863 5% | 845 -52% | 557 -69% | 608 -66% | 639 -64% | 1445 ? -19% |
| Read Seq (MB/s) | 1693 | 2340 38% | 1137 -33% | 1393 -18% | 1019 -40% | 849 -50% | 1446 ? -15% |
| Write 4K Q32T1 (MB/s) | 492.3 | 451.1 -8% | 868 76% | 339.5 -31% | 487.9 -1% | 217.4 -56% | 427 ? -13% |
| Read 4K Q32T1 (MB/s) | 539 | 415.3 -23% | 1580 193% | 255.4 -53% | 284.8 -47% | 322.1 -40% | 456 ? -15% |
| Write Seq Q32T1 (MB/s) | 1770 | 2985 69% | 345.6 -80% | 558 -68% | 872 -51% | 865 -51% | 1650 ? -7% |
| Read Seq Q32T1 (MB/s) | 1715 | 2565 50% | 411.7 -76% | 2541 48% | 1635 -5% | 1630 -5% | 1728 ? 1% |
| Write 4K Q8T8 (MB/s) | 899 | 451.4 -50% | 647 -28% | 387.3 -57% | 880 ? -2% | ||
| Read 4K Q8T8 (MB/s) | 630 | 1004 59% | 685 9% | 757 20% | 629 ? 0% | ||
| AS SSD | 35% | -26% | -33% | -18% | -72% | -14% | |
| Seq Read (MB/s) | 1703 | 2525 48% | 1403 -18% | 2035 19% | 1264 -26% | 1295 -24% | 1456 ? -15% |
| Seq Write (MB/s) | 1373 | 1253 -9% | 836 -39% | 658 -52% | 518 -62% | 593 -57% | 1404 ? 2% |
| 4K Read (MB/s) | 56.8 | 59.1 4% | 42.19 -26% | 39.74 -30% | 40.31 -29% | 45.58 -20% | 48.7 ? -14% |
| 4K Write (MB/s) | 164.4 | 134.1 -18% | 99.7 -39% | 105.7 -36% | 119.1 -28% | 118.8 -28% | 131.6 ? -20% |
| 4K-64 Read (MB/s) | 584 | 1010 73% | 738 26% | 461 -21% | 772 32% | 604 3% | 586 ? 0% |
| 4K-64 Write (MB/s) | 783 | 1461 87% | 606 -23% | 300.1 -62% | 672 -14% | 272.4 -65% | 788 ? 1% |
| Access Time Read * (ms) | 0.044 | 0.052 -18% | 0.074 -68% | 0.061 -39% | 0.046 -5% | 0.147 -234% | 0.07236 ? -64% |
| Access Time Write * (ms) | 0.038 | 0.029 24% | 0.045 -18% | 0.051 -34% | 0.031 18% | 0.168 -342% | 0.07731 ? -103% |
| Score Read (Points) | 811 | 1322 63% | 921 14% | 704 -13% | 939 16% | 779 -4% | 780 ? -4% |
| Score Write (Points) | 1085 | 1721 59% | 789 -27% | 471 -57% | 843 -22% | 450 -59% | 1060 ? -2% |
| Score Total (Points) | 2313 | 3670 59% | 2163 -6% | 1479 -36% | 2234 -3% | 1607 -31% | 2252 ? -3% |
| Copy ISO MB/s (MB/s) | 1401 | 2016 44% | 586 -58% | 893 -36% | 943 -33% | 593 -58% | 1469 ? 5% |
| Copy Program MB/s (MB/s) | 480.4 | 542 13% | 315.2 -34% | 287.9 -40% | 292.2 -39% | 277.6 -42% | 484 ? 1% |
| Copy Game MB/s (MB/s) | 820 | 1278 56% | 478.5 -42% | 618 -25% | 374.1 -54% | 452.7 -45% | 997 ? 22% |
| Totaal Gemiddelde (Programma / Instellingen) | 22% /
24% | -17% /
-18% | -35% /
-34% | -26% /
-25% | -57% /
-61% | -13% /
-13% |
* ... kleiner is beter

| 3DMark 11 Performance | 4308 punten | |
| 3DMark Ice Storm Standard Score | 63796 punten | |
| 3DMark Cloud Gate Standard Score | 11959 punten | |
| 3DMark Fire Strike Score | 2508 punten | |
| 3DMark Fire Strike Extreme Score | 1252 punten | |
Help | ||
| lage | gem. | hoge | ultra | |
|---|---|---|---|---|
| BioShock Infinite (2013) | 91.6 | 58.6 | 50.9 | 19.4 |
| Dota 2 Reborn (2015) | 82.7 | 52.7 | 32.8 | 30 |
| Rise of the Tomb Raider (2016) | 38.9 | 23.4 | 13.6 | |
| Rocket League (2017) | 100 | 52.8 | 39.6 | |
| X-Plane 11.11 (2018) | 28.2 | 12.5 | 12.1 | |
| Borderlands 3 (2019) | 26.7 | 11.7 | 7.73 |
Geluidsniveau
| Onbelast |
| 30.3 / 30.3 / 30.3 dB (A) |
| Belasting |
| 31.7 / 32.7 dB (A) |
 | ||
30 dB stil 40 dB(A) hoorbaar 50 dB(A) luid |
||
min: | ||
| Acer Swift 3 SF313-52-71Y7 Iris Plus Graphics G7 (Ice Lake 64 EU), i7-1065G7, Intel SSD 660p 1TB SSDPEKNW010T8 | Lenovo Yoga C940-14IIL Iris Plus Graphics G7 (Ice Lake 64 EU), i7-1065G7, Samsung SSD PM981 MZVLB512HAJQ | Acer Swift 3 SF313-51-59SZ UHD Graphics 620, i5-8250U, Kingston RBUSNS8154P3256GJ1 | Dell XPS 13 9380 2019 UHD Graphics 620, i5-8265U, SK hynix PC401 HFS256GD9TNG | Lenovo ThinkBook 13s-20R90071GE UHD Graphics 620, i5-8265U, SK hynix BC501 HFM512GDHTNG-8310A | HP Envy 13-aq0003ng GeForce MX250, i7-8565U, Toshiba KBG30ZMV512G | |
|---|---|---|---|---|---|---|
| Noise | 1% | -2% | -3% | 1% | -3% | |
| uit / omgeving * (dB) | 30.3 | 29.3 3% | 30.4 -0% | 30.4 -0% | 28.8 5% | 30 1% |
| Idle Minimum * (dB) | 30.3 | 29.3 3% | 30.4 -0% | 30.4 -0% | 28.8 5% | 30 1% |
| Idle Average * (dB) | 30.3 | 29.3 3% | 30.4 -0% | 30.4 -0% | 28.8 5% | 30 1% |
| Idle Maximum * (dB) | 30.3 | 29.3 3% | 30.7 -1% | 30.4 -0% | 29.7 2% | 30 1% |
| Load Average * (dB) | 31.7 | 33.3 -5% | 33.7 -6% | 31.7 -0% | 30.7 3% | |
| Load Maximum * (dB) | 32.7 | 33.3 -2% | 34 -4% | 38.1 -17% | 38.3 -17% | 39.5 -21% |
* ... kleiner is beter
(+) De maximumtemperatuur aan de bovenzijde bedraagt 33.5 °C / 92 F, vergeleken met het gemiddelde van 35.9 °C / 97 F, variërend van 21.4 tot 59 °C voor de klasse Subnotebook.
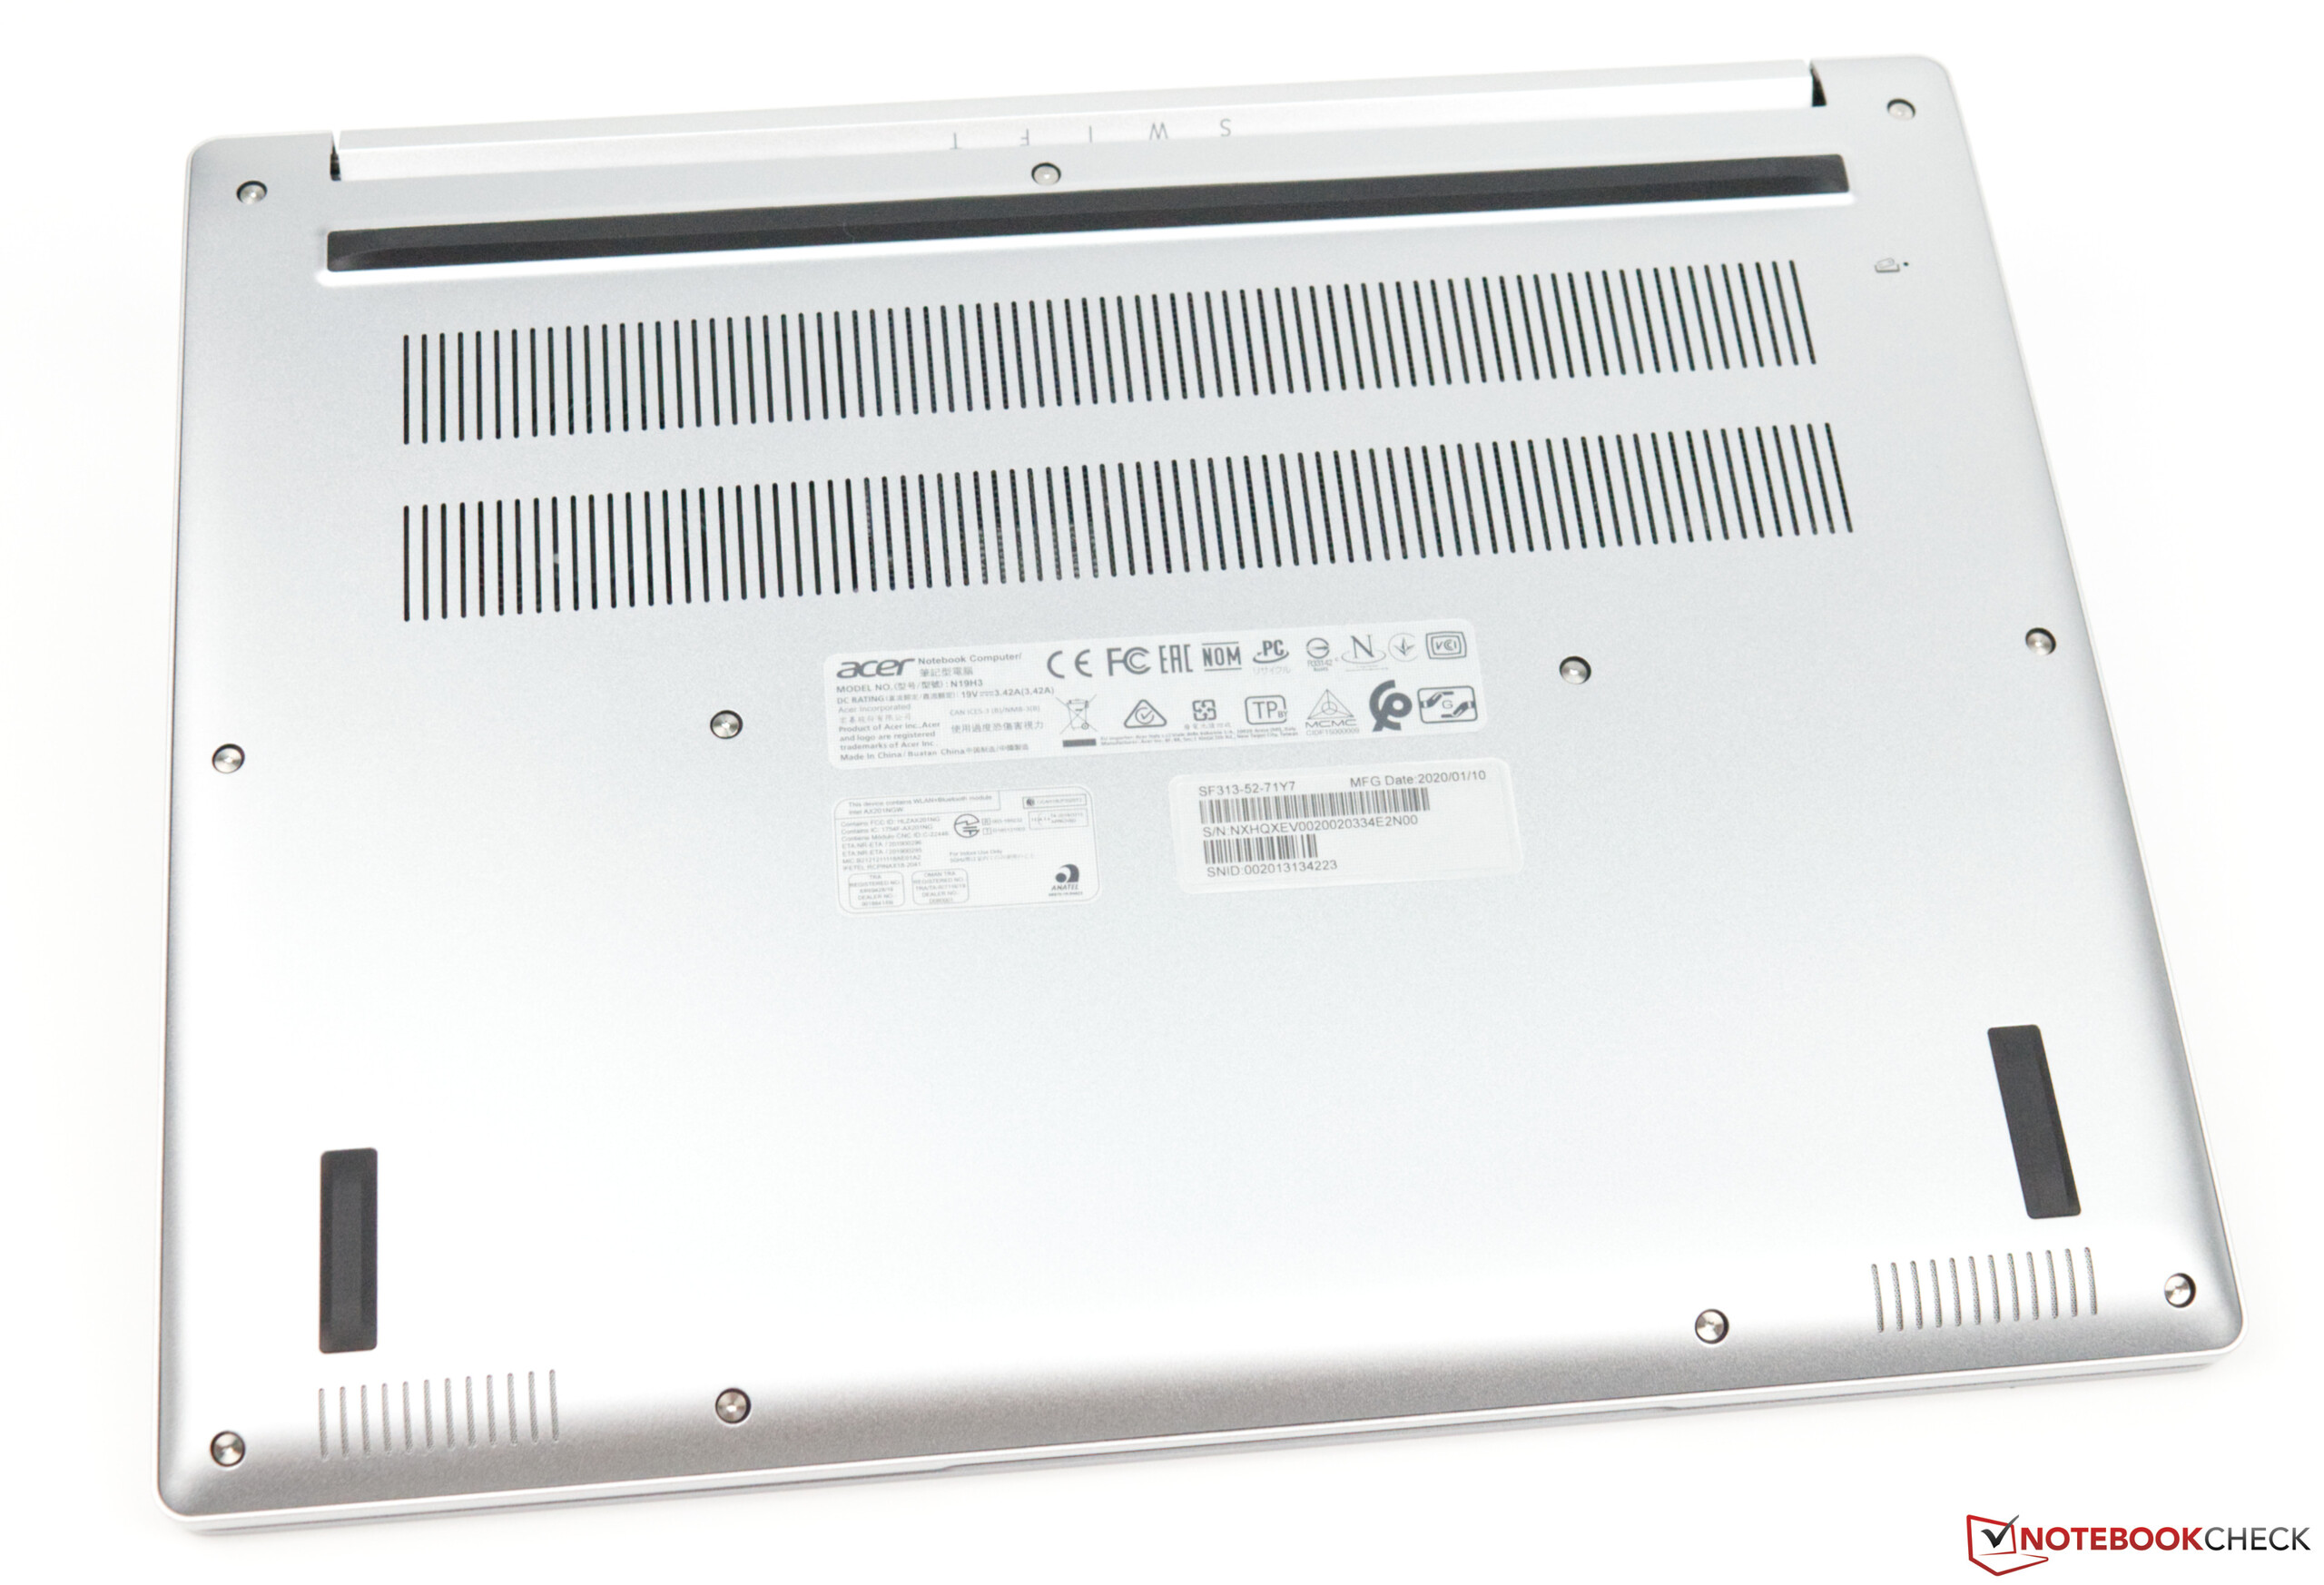
(+) De bodem warmt op tot een maximum van 35.6 °C / 96 F, vergeleken met een gemiddelde van 39.2 °C / 103 F
(+) Bij onbelast gebruik bedraagt de gemiddelde temperatuur voor de bovenzijde 23.9 °C / 75 F, vergeleken met het apparaatgemiddelde van 30.8 °C / 87 F.
(+) De palmsteunen en het touchpad zijn met een maximum van ###max## °C / 79 F koeler dan de huidtemperatuur en voelen daarom koel aan.
(+) De gemiddelde temperatuur van de handpalmsteun van soortgelijke toestellen bedroeg 28.2 °C / 82.8 F (+2.1 °C / 3.8 F).
| Acer Swift 3 SF313-52-71Y7 Iris Plus Graphics G7 (Ice Lake 64 EU), i7-1065G7, Intel SSD 660p 1TB SSDPEKNW010T8 | Lenovo Yoga C940-14IIL Iris Plus Graphics G7 (Ice Lake 64 EU), i7-1065G7, Samsung SSD PM981 MZVLB512HAJQ | Acer Swift 3 SF313-51-59SZ UHD Graphics 620, i5-8250U, Kingston RBUSNS8154P3256GJ1 | Dell XPS 13 9380 2019 UHD Graphics 620, i5-8265U, SK hynix PC401 HFS256GD9TNG | Lenovo ThinkBook 13s-20R90071GE UHD Graphics 620, i5-8265U, SK hynix BC501 HFM512GDHTNG-8310A | HP Envy 13-aq0003ng GeForce MX250, i7-8565U, Toshiba KBG30ZMV512G | |
|---|---|---|---|---|---|---|
| Heat | -11% | -12% | -22% | -10% | -20% | |
| Maximum Upper Side * (°C) | 33.5 | 41 -22% | 40.4 -21% | 47.2 -41% | 40.3 -20% | 41 -22% |
| Maximum Bottom * (°C) | 35.6 | 44.6 -25% | 42.1 -18% | 43.3 -22% | 44.6 -25% | 42.9 -21% |
| Idle Upper Side * (°C) | 24.9 | 24.4 2% | 26.2 -5% | 27.6 -11% | 24.3 2% | 29.3 -18% |
| Idle Bottom * (°C) | 25.4 | 25 2% | 26 -2% | 28.6 -13% | 24.4 4% | 30.2 -19% |
* ... kleiner is beter
Acer Swift 3 SF313-52-71Y7 audioanalyse
(-) | niet erg luide luidsprekers (71.7 dB)
Bas 100 - 315 Hz
(-) | bijna geen lage tonen - gemiddeld 26.5% lager dan de mediaan
(±) | lineariteit van de lage tonen is gemiddeld (9.8% delta ten opzichte van de vorige frequentie)
Midden 400 - 2000 Hz
(+) | evenwichtige middens - slechts 3.7% verwijderd van de mediaan
(±) | lineariteit van de middentonen is gemiddeld (8.8% delta ten opzichte van de vorige frequentie)
Hoog 2 - 16 kHz
(±) | higher highs - on average 5% higher than median
(+) | de hoge tonen zijn lineair (5.7% delta naar de vorige frequentie)
Algemeen 100 - 16.000 Hz
(±) | lineariteit van het totale geluid is gemiddeld (27.4% verschil met de mediaan)
Vergeleken met dezelfde klasse
» 89% van alle geteste apparaten in deze klasse waren beter, 3% vergelijkbaar, 8% slechter
» De beste had een delta van 5%, het gemiddelde was 18%, de slechtste was 53%
Vergeleken met alle geteste toestellen
» 83% van alle geteste apparaten waren beter, 4% gelijk, 13% slechter
» De beste had een delta van 4%, het gemiddelde was 24%, de slechtste was 134%
Lenovo Yoga C940-14IIL audioanalyse
(±) | luidspreker luidheid is gemiddeld maar goed (76.8 dB)
Bas 100 - 315 Hz
(±) | verminderde zeebaars - gemiddeld 6% lager dan de mediaan
(±) | lineariteit van de lage tonen is gemiddeld (9.9% delta ten opzichte van de vorige frequentie)
Midden 400 - 2000 Hz
(+) | evenwichtige middens - slechts 3.9% verwijderd van de mediaan
(+) | de middentonen zijn lineair (3.6% delta ten opzichte van de vorige frequentie)
Hoog 2 - 16 kHz
(±) | lagere maxima - gemiddeld 7.6% lager dan de mediaan
(+) | de hoge tonen zijn lineair (6.1% delta naar de vorige frequentie)
Algemeen 100 - 16.000 Hz
(±) | lineariteit van het totale geluid is gemiddeld (16.9% verschil met de mediaan)
Vergeleken met dezelfde klasse
» 31% van alle geteste apparaten in deze klasse waren beter, 7% vergelijkbaar, 61% slechter
» De beste had een delta van 6%, het gemiddelde was 20%, de slechtste was 57%
Vergeleken met alle geteste toestellen
» 30% van alle geteste apparaten waren beter, 8% gelijk, 62% slechter
» De beste had een delta van 4%, het gemiddelde was 24%, de slechtste was 134%
| Uit / Standby | |
| Inactief | |
| Belasting |
|
Key:
min: | |
| Acer Swift 3 SF313-52-71Y7 i7-1065G7, Iris Plus Graphics G7 (Ice Lake 64 EU), Intel SSD 660p 1TB SSDPEKNW010T8, IPS, 2256x1504, 13.5" | Lenovo Yoga C940-14IIL i7-1065G7, Iris Plus Graphics G7 (Ice Lake 64 EU), Samsung SSD PM981 MZVLB512HAJQ, IPS LED, 1920x1080, 14" | Acer Swift 3 SF313-51-59SZ i5-8250U, UHD Graphics 620, Kingston RBUSNS8154P3256GJ1, IPS, 1920x1080, 13.3" | Dell XPS 13 9380 2019 i5-8265U, UHD Graphics 620, SK hynix PC401 HFS256GD9TNG, IPS, 3840x2160, 13.3" | Lenovo ThinkBook 13s-20R90071GE i5-8265U, UHD Graphics 620, SK hynix BC501 HFM512GDHTNG-8310A, a-Si IPS LED, 1920x1080, 13.3" | HP Envy 13-aq0003ng i7-8565U, GeForce MX250, Toshiba KBG30ZMV512G, IPS, 1920x1080, 13.3" | Gemiddeld Intel Iris Plus Graphics G7 (Ice Lake 64 EU) | Gemiddelde van klas Subnotebook | |
|---|---|---|---|---|---|---|---|---|
| Power Consumption | -77% | -48% | -88% | -42% | -98% | -71% | -76% | |
| Idle Minimum * (Watt) | 1.8 | 3.2 -78% | 3.4 -89% | 4.8 -167% | 3.1 -72% | 3.9 -117% | 3.91 ? -117% | 3.86 ? -114% |
| Idle Average * (Watt) | 4.6 | 7 -52% | 5.8 -26% | 8.6 -87% | 5.87 -28% | 7.8 -70% | 7.33 ? -59% | 6.61 ? -44% |
| Idle Maximum * (Watt) | 6.1 | 8.9 -46% | 8.8 -44% | 10.4 -70% | 6.6 -8% | 10.8 -77% | 9.16 ? -50% | 8 ? -31% |
| Load Average * (Watt) | 27.4 | 47.6 -74% | 34 -24% | 37.9 -38% | 35.3 -29% | 53 -93% | 39.2 ? -43% | 42.2 ? -54% |
| Load Maximum * (Watt) | 27 | 63.1 -134% | 42 -56% | 48.5 -80% | 46.5 -72% | 62.7 -132% | 49.8 ? -84% | 64.5 ? -139% |
* ... kleiner is beter

| Acer Swift 3 SF313-52-71Y7 i7-1065G7, Iris Plus Graphics G7 (Ice Lake 64 EU), 54.5 Wh | Lenovo Yoga C940-14IIL i7-1065G7, Iris Plus Graphics G7 (Ice Lake 64 EU), 60 Wh | Acer Swift 3 SF313-51-59SZ i5-8250U, UHD Graphics 620, 48.8 Wh | Dell XPS 13 9380 2019 i5-8265U, UHD Graphics 620, 52 Wh | Lenovo ThinkBook 13s-20R90071GE i5-8265U, UHD Graphics 620, 45 Wh | HP Envy 13-aq0003ng i7-8565U, GeForce MX250, 53.2 Wh | Gemiddelde van klas Subnotebook | |
|---|---|---|---|---|---|---|---|
| Batterijduur | -8% | -10% | -12% | -16% | -17% | 26% | |
| Reader / Idle (h) | 21.4 | 18.6 -13% | 17.2 -20% | 28.6 ? 34% | |||
| H.264 (h) | 10.5 | 13.2 26% | 8.3 -21% | 10.8 3% | 15.4 ? 47% | ||
| WiFi v1.3 (h) | 10.3 | 10.6 3% | 9.6 -7% | 8.3 -19% | 9.1 -12% | 8.5 -17% | 14 ? 36% |
| Load (h) | 2.3 | 1.1 -52% | 2.3 0% | 2.4 4% | 1.4 -39% | 1.969 ? -14% |
Pro
Contra
Verdict – A Good Subnotebook with some Minor Flaws
Dit is de verkorte versie van het originele artikel. Het volledige, Engelse testrapport vind je hier.
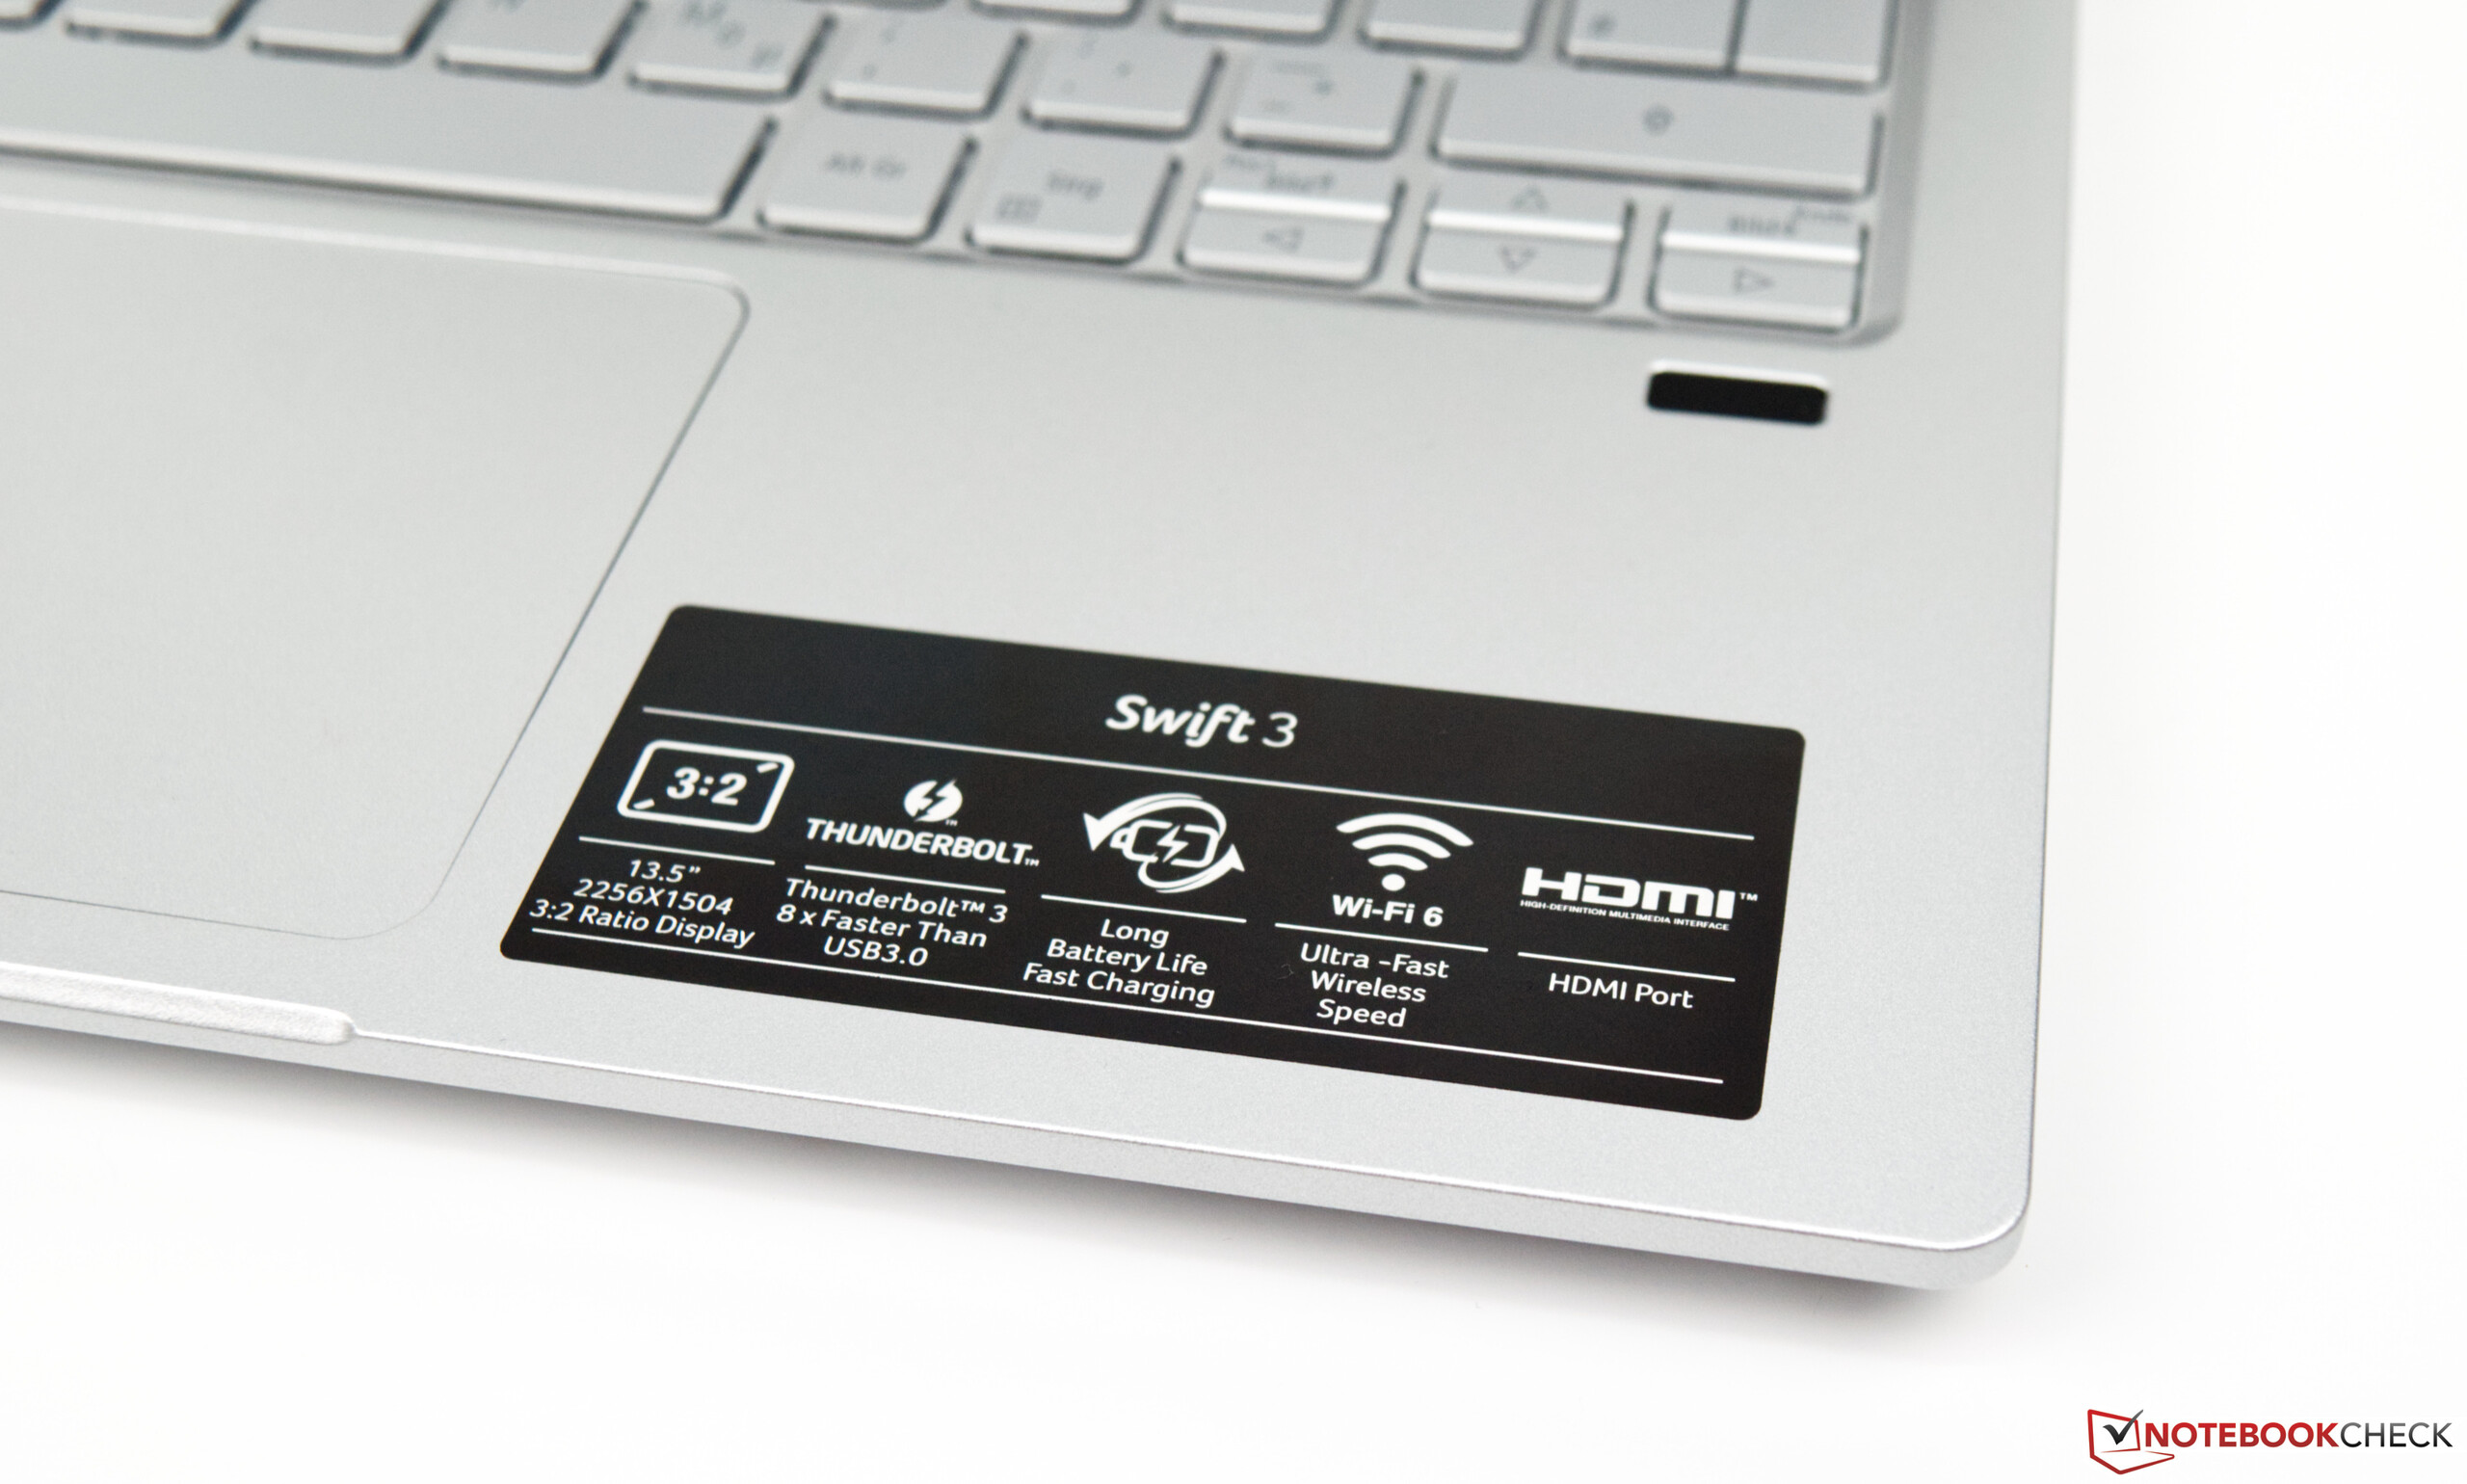
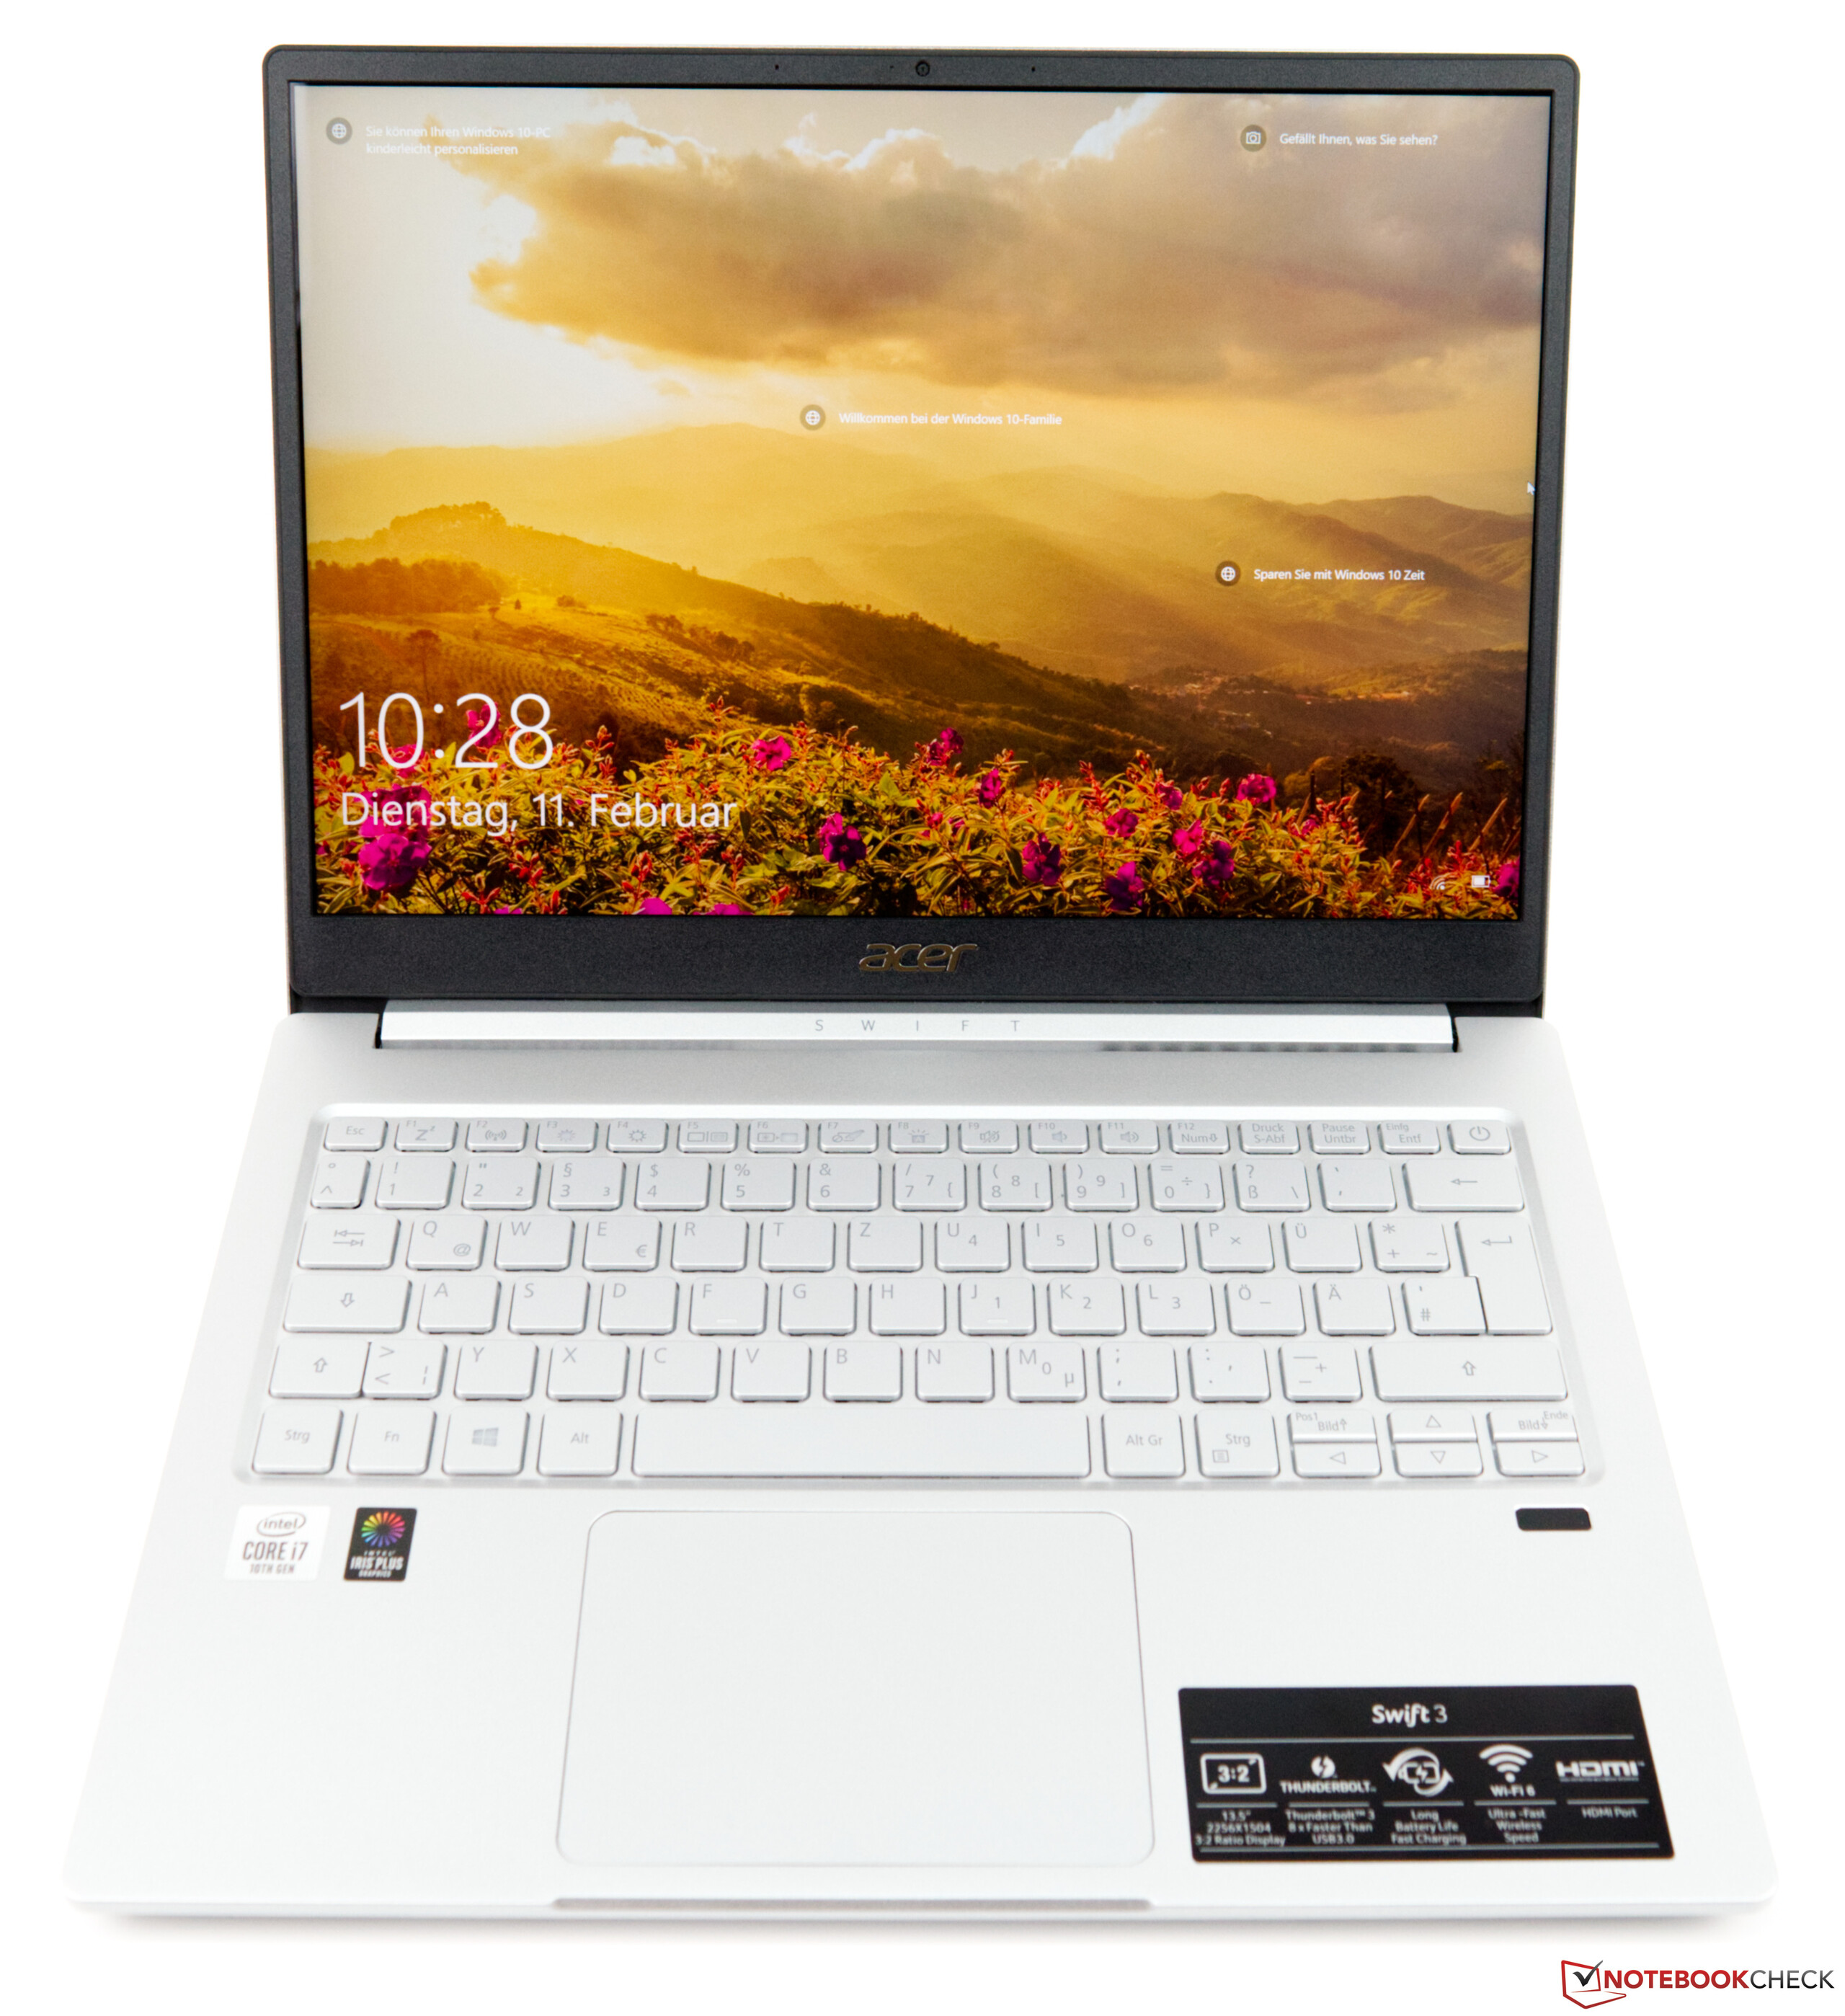
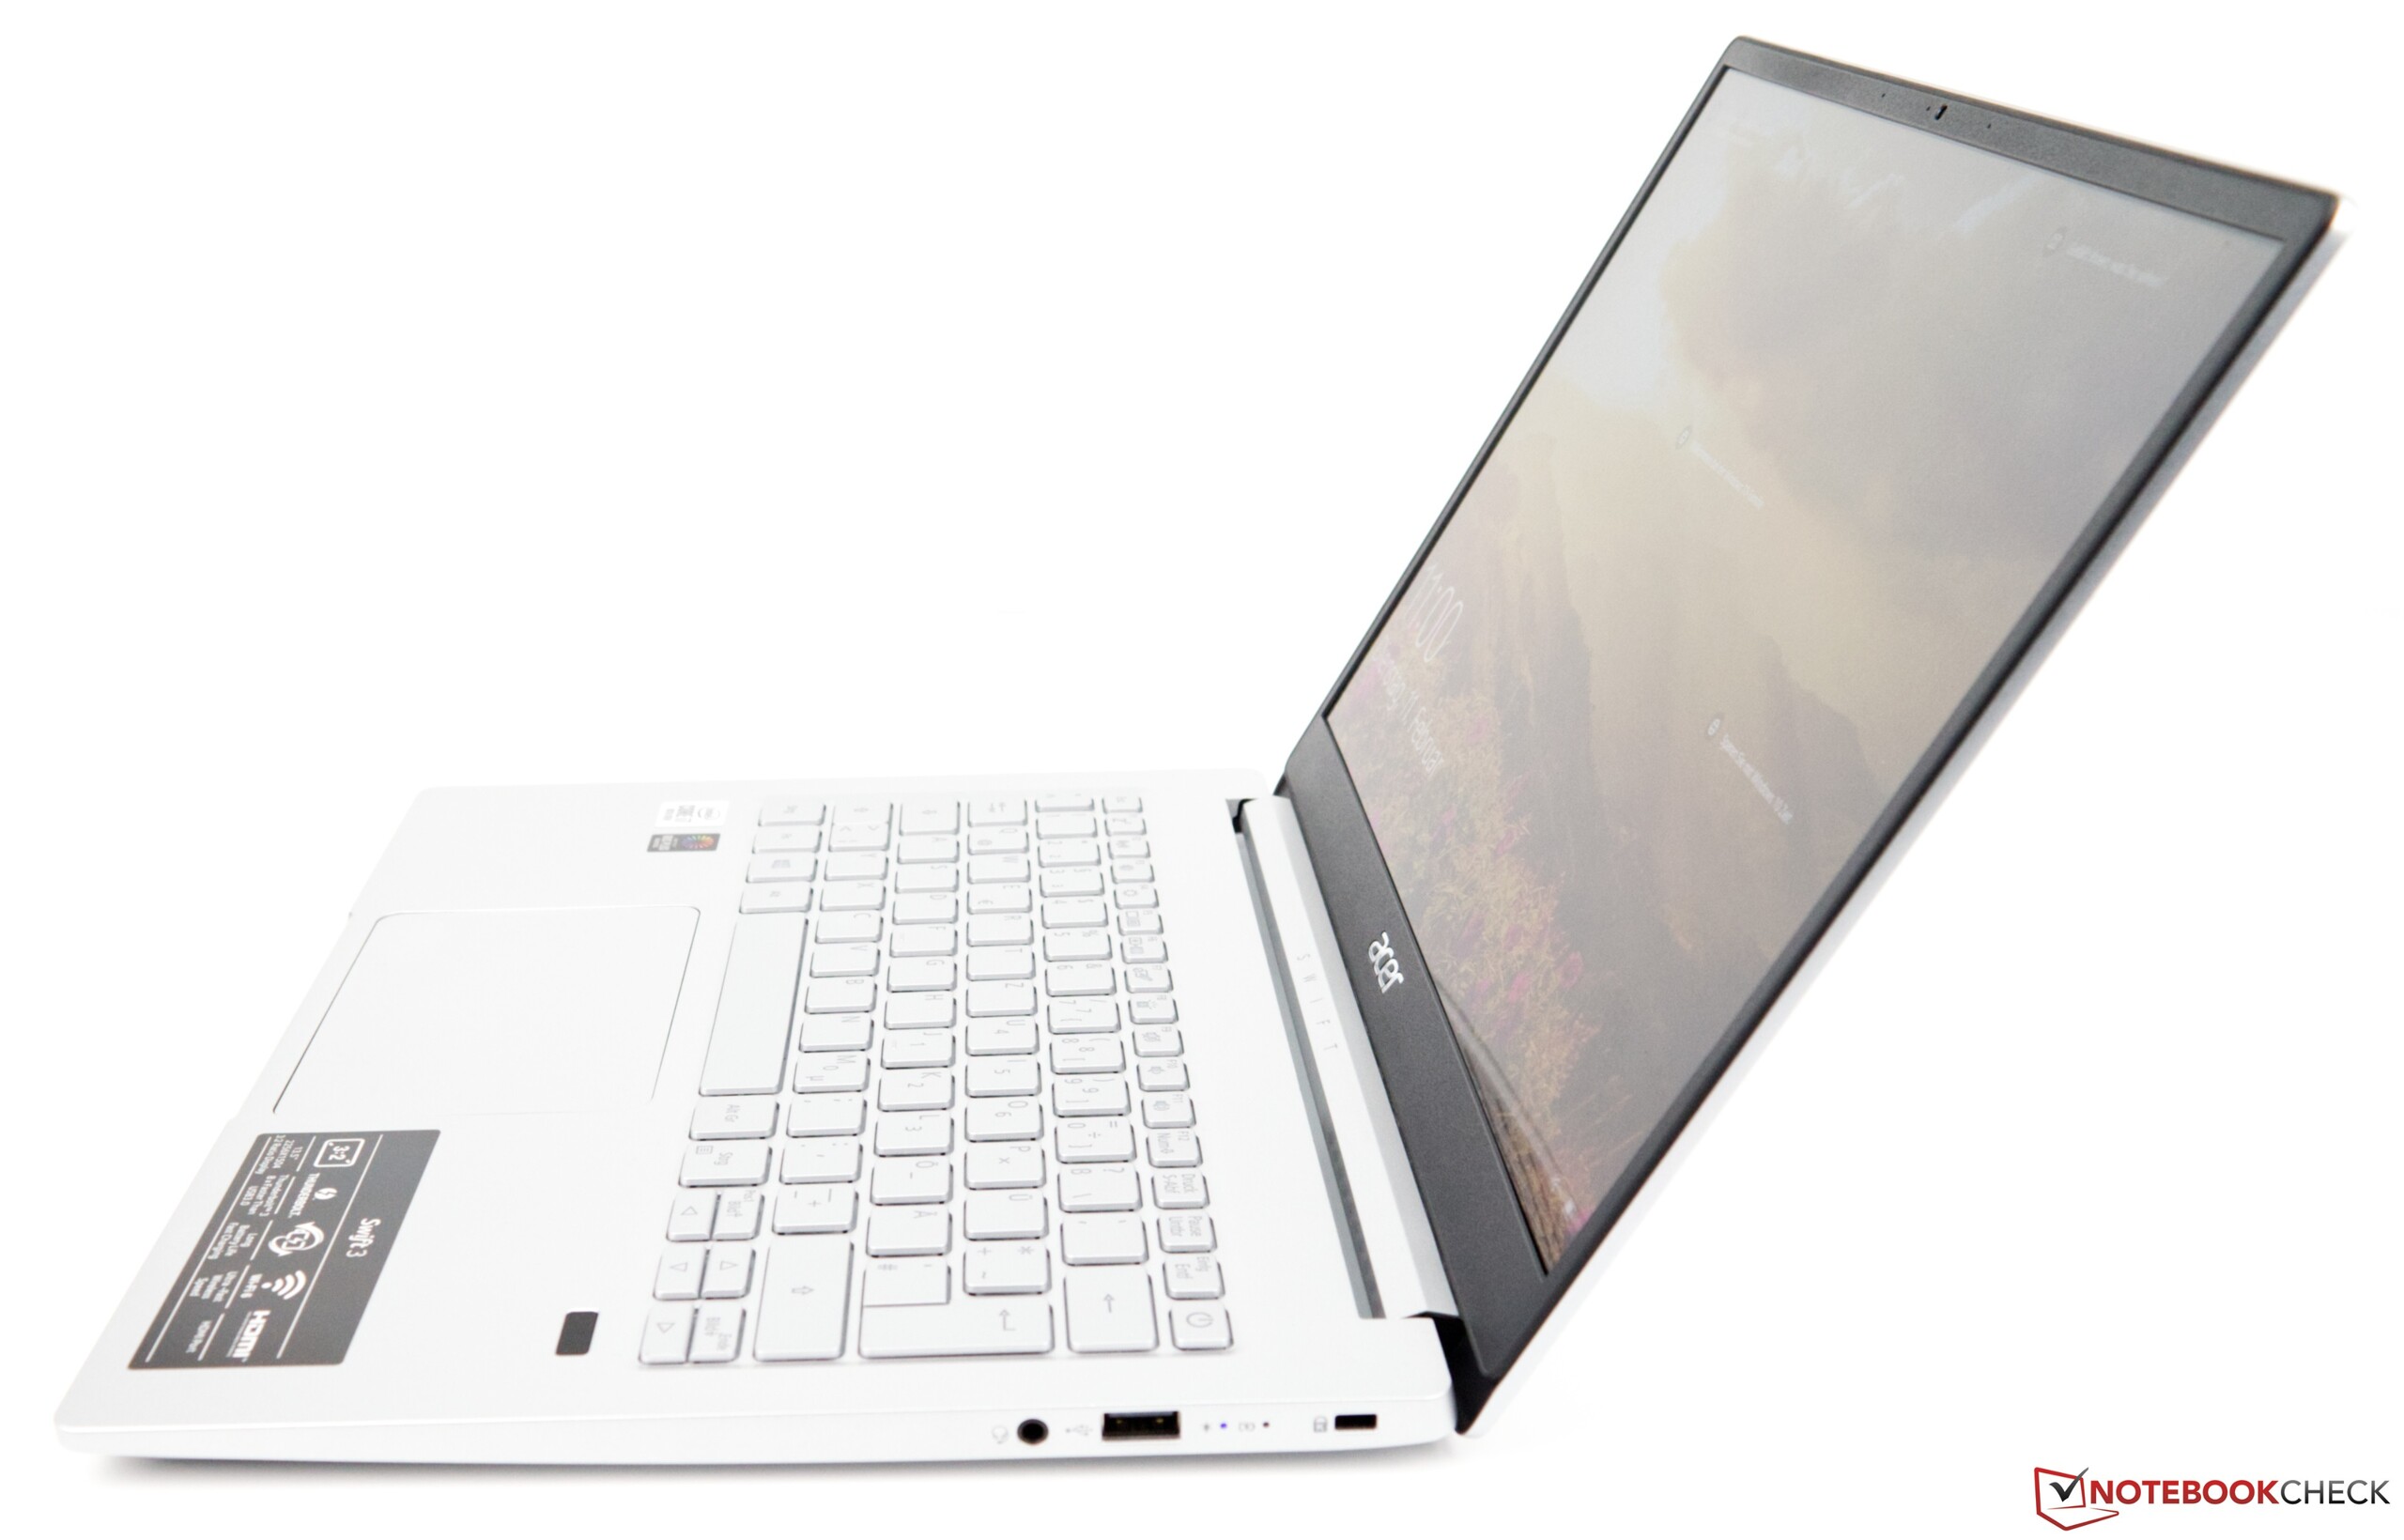
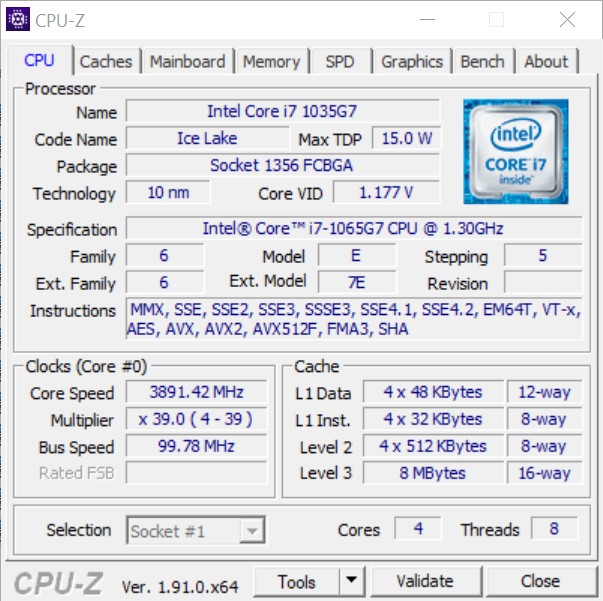
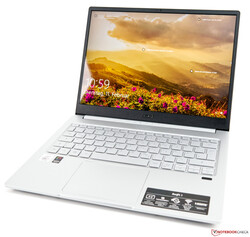
De nieuwe Acer Swift 3 SF313 is op alle vlakken verbeterd. Niet alleen qua uiterlijk, maar ook intern is de boel grondig aangepakt. Intel's nieuwste Ice Lake SoC komt met een kleine prestatieverbetering, die we, eerlijk gezegd, groter hadden verwacht. De Intel Core i7-1065G7 presteert erg goed en op alle vlakken beter dan zijn Kaby Lake voorgangers. In vergelijking met andere Ice Lake notebooks blijft de Swift 3 echter enigszins achter. Het notebook scoort goed met zijn fraaie design en robuuste bouwkwaliteit. het heldere IPS beeldscherm zal zeker herinnert worden en de 3:2 beeldverhouding past goed in het algehele concept van de Swift.
De Acer Swift 3 SF313 biedt goede prestaties, lange batterijduur en een fantastisch beeldscherm zonder een groot gat in je portemonnee te slaan.
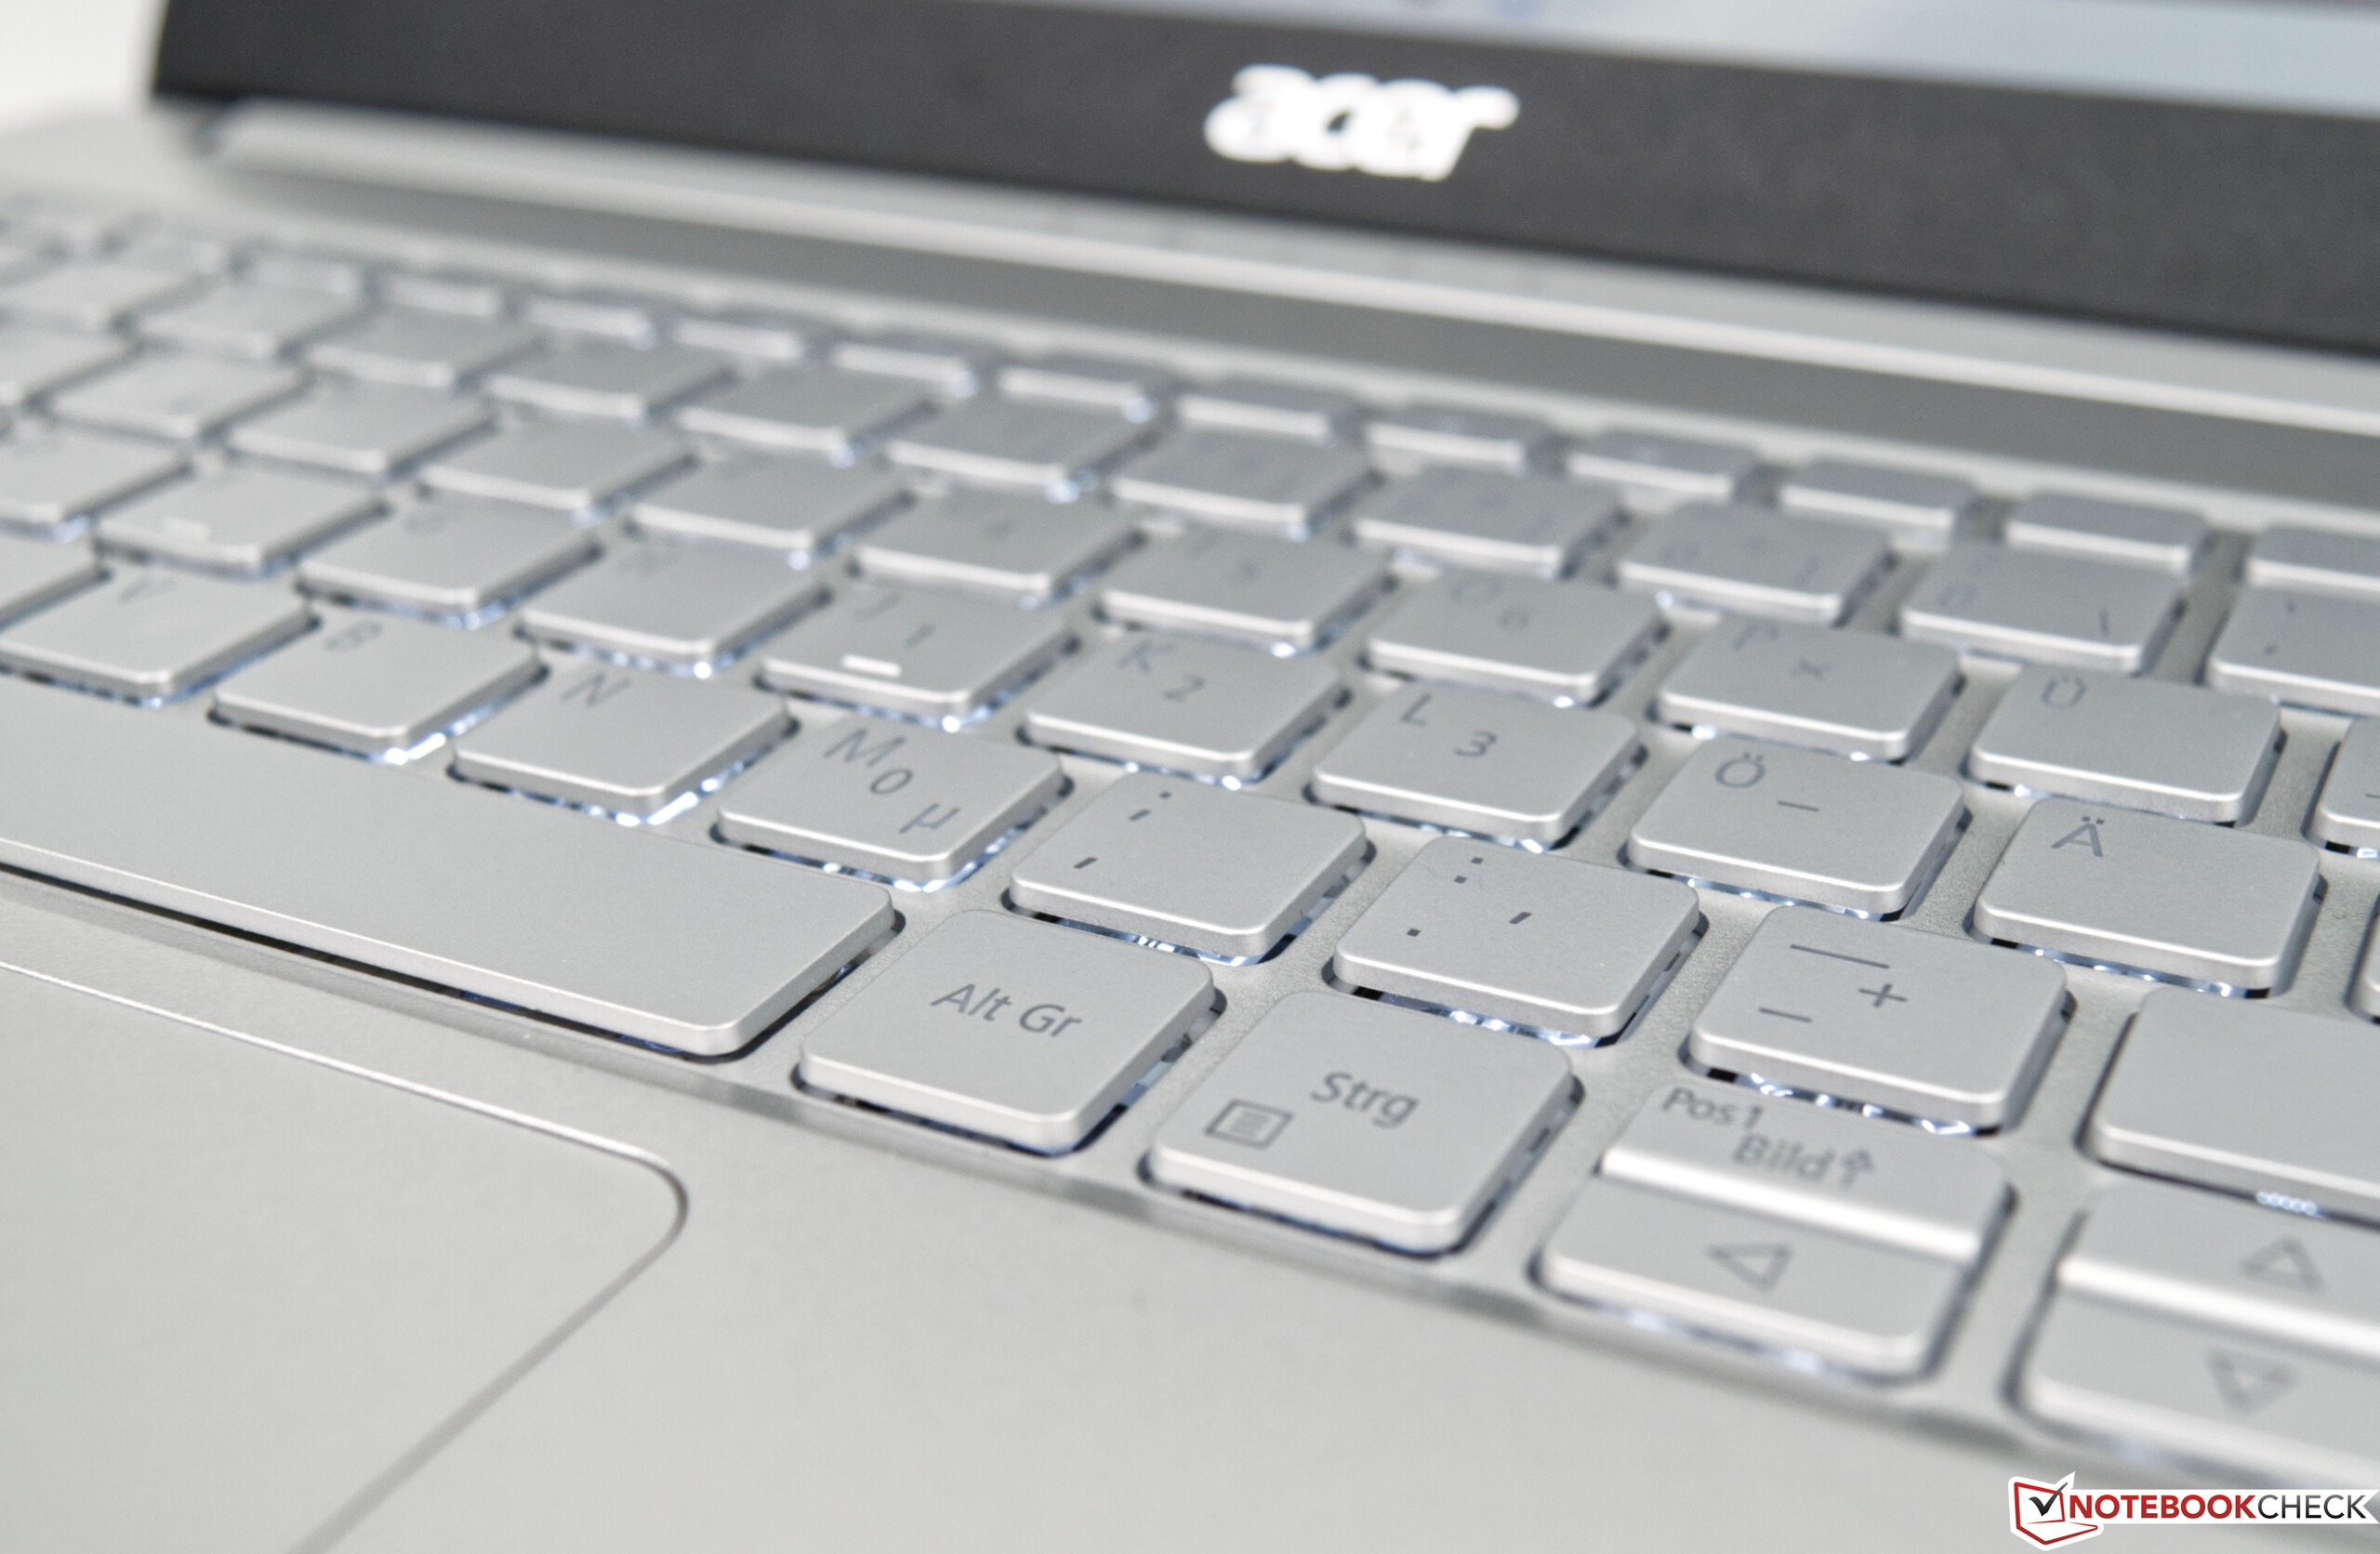
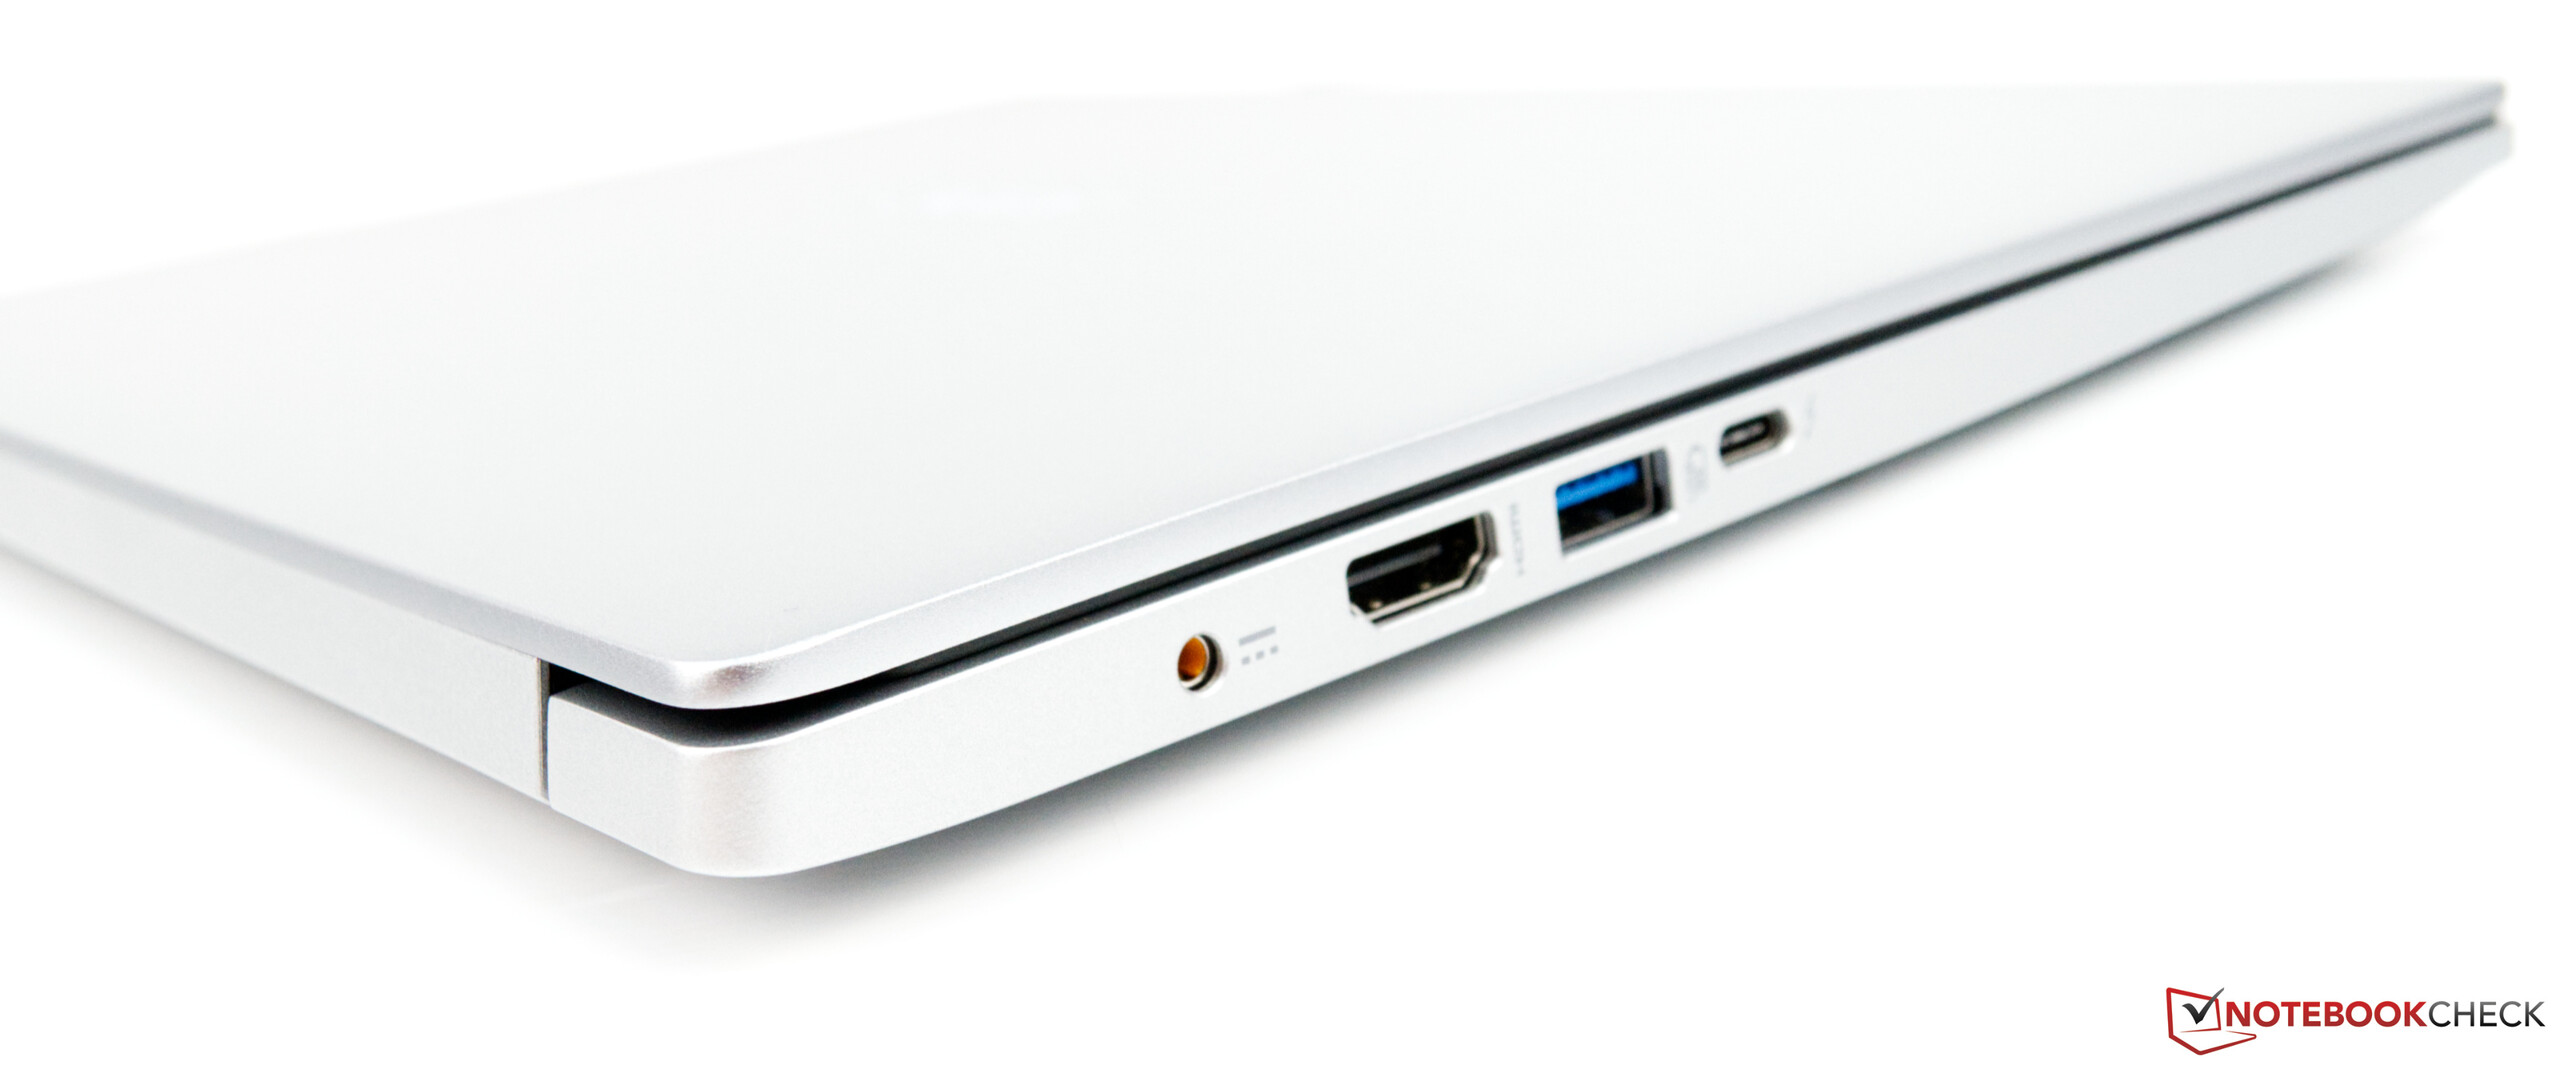
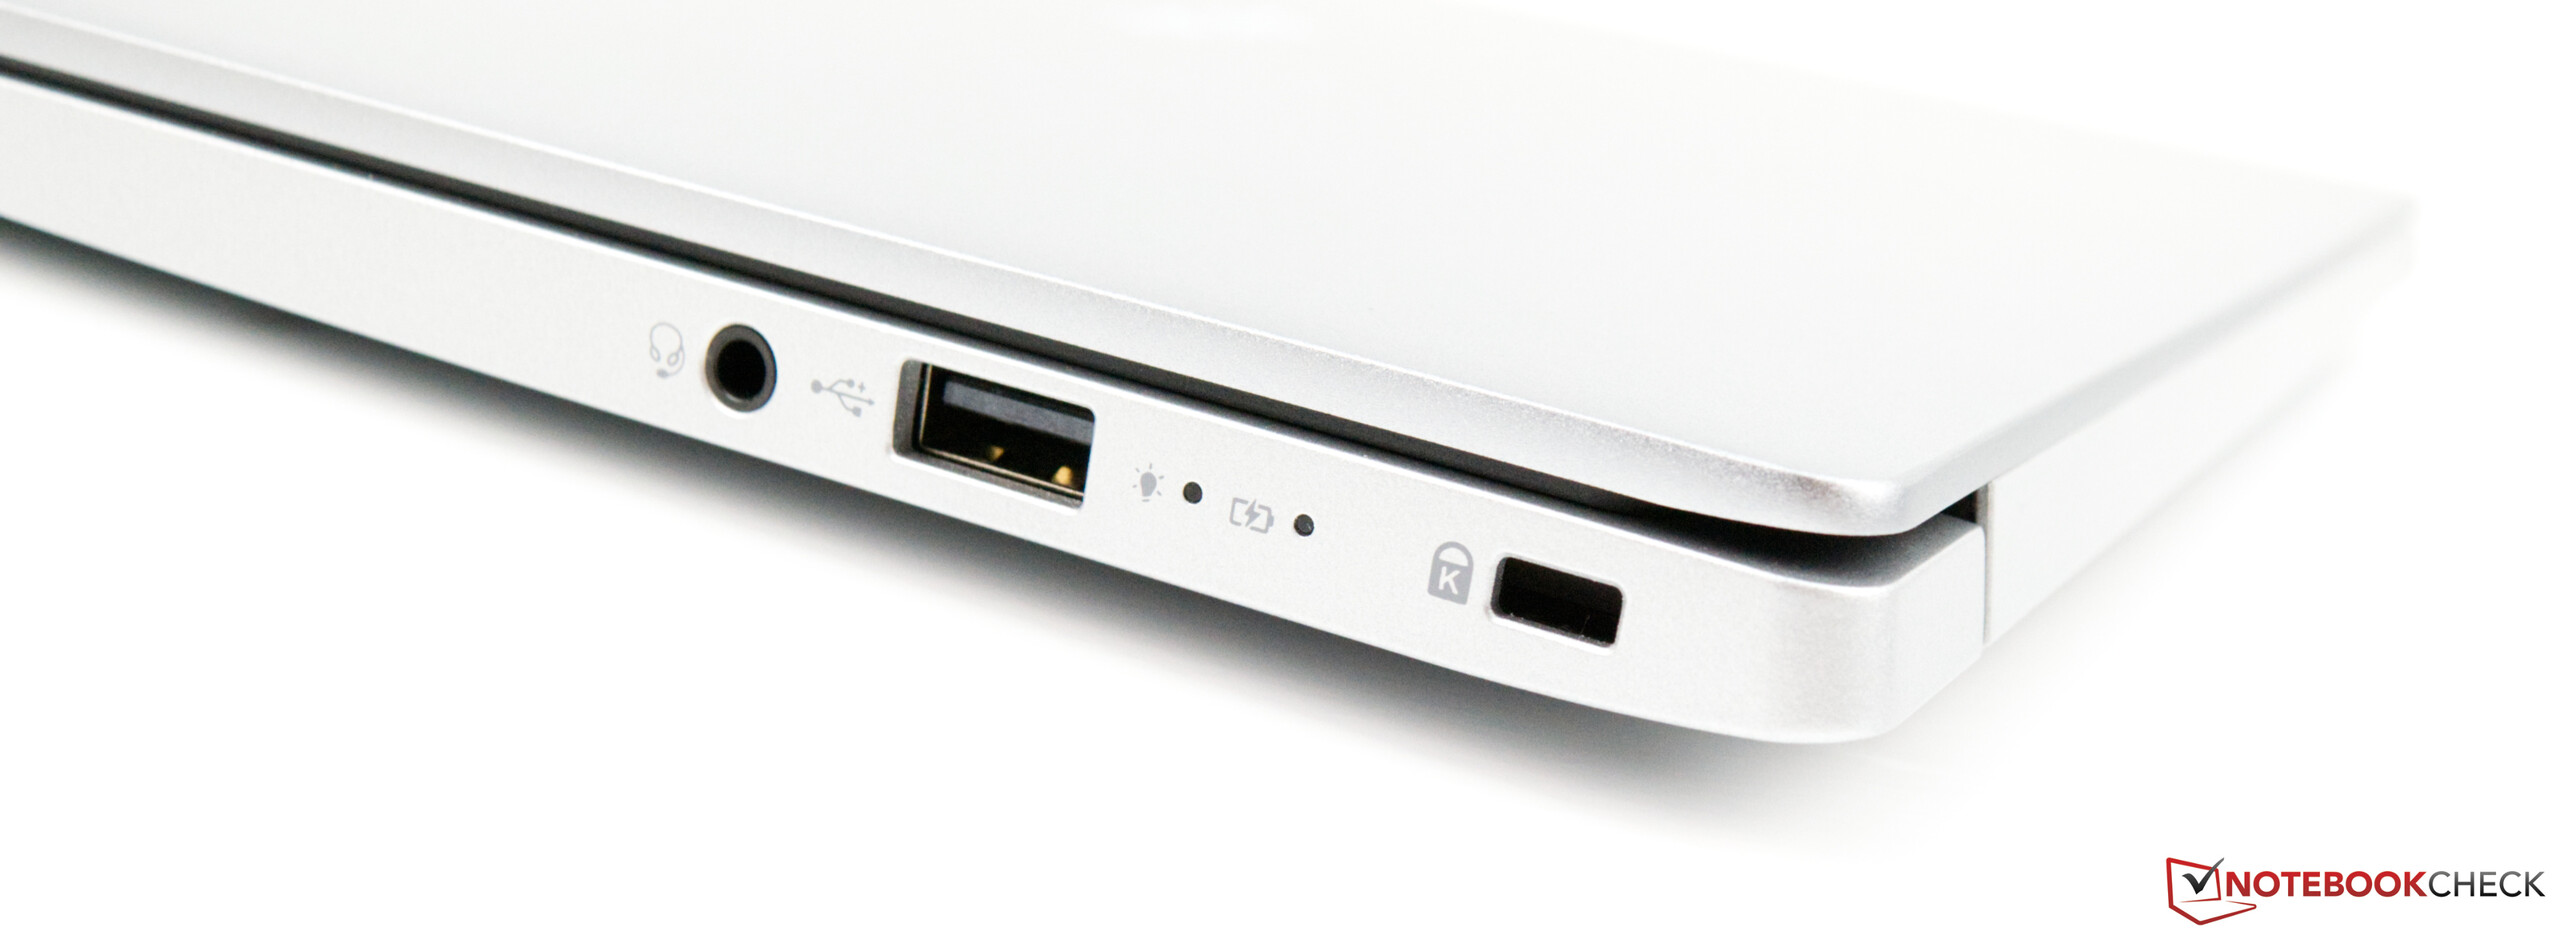
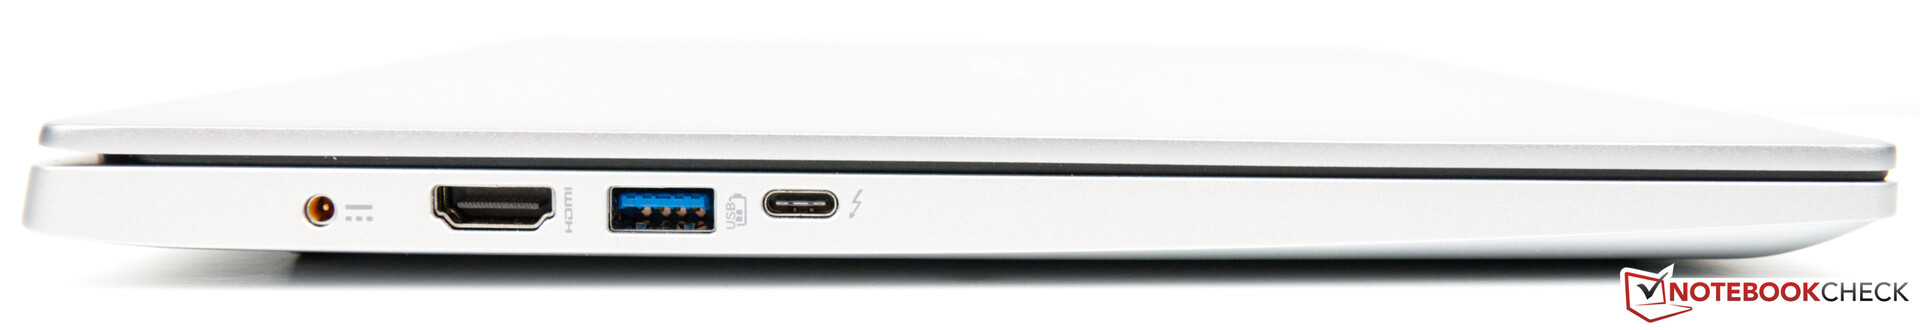
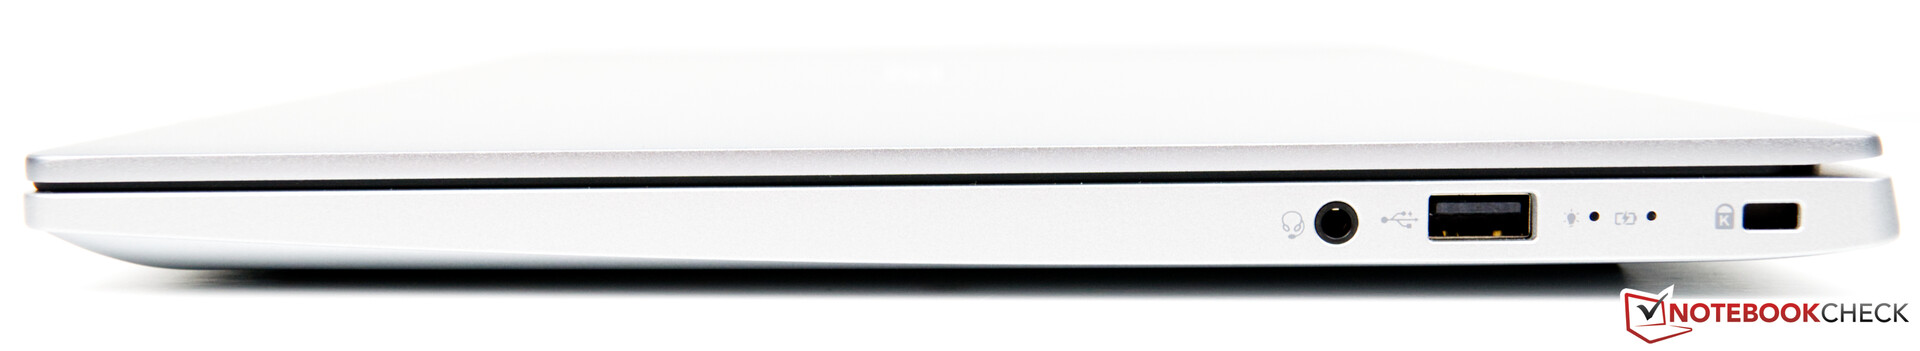
De minpunten omvatten de slechte Wi-Fi prestaties en het toetsenbord, dat bij daglicht nauwelijks te lezen was door het witte backlight. Dat gezegd hebbende kan dat wat verbeterd worden door de backlight van het toetsenbord uit te zetten. De aansluitingen zijn modern al was een tweede USB-C poort niet overbodig geweest. We zouden ook niet geklaagd hebben over de aanwezigheid van een kaartlezer of LTE-optie.
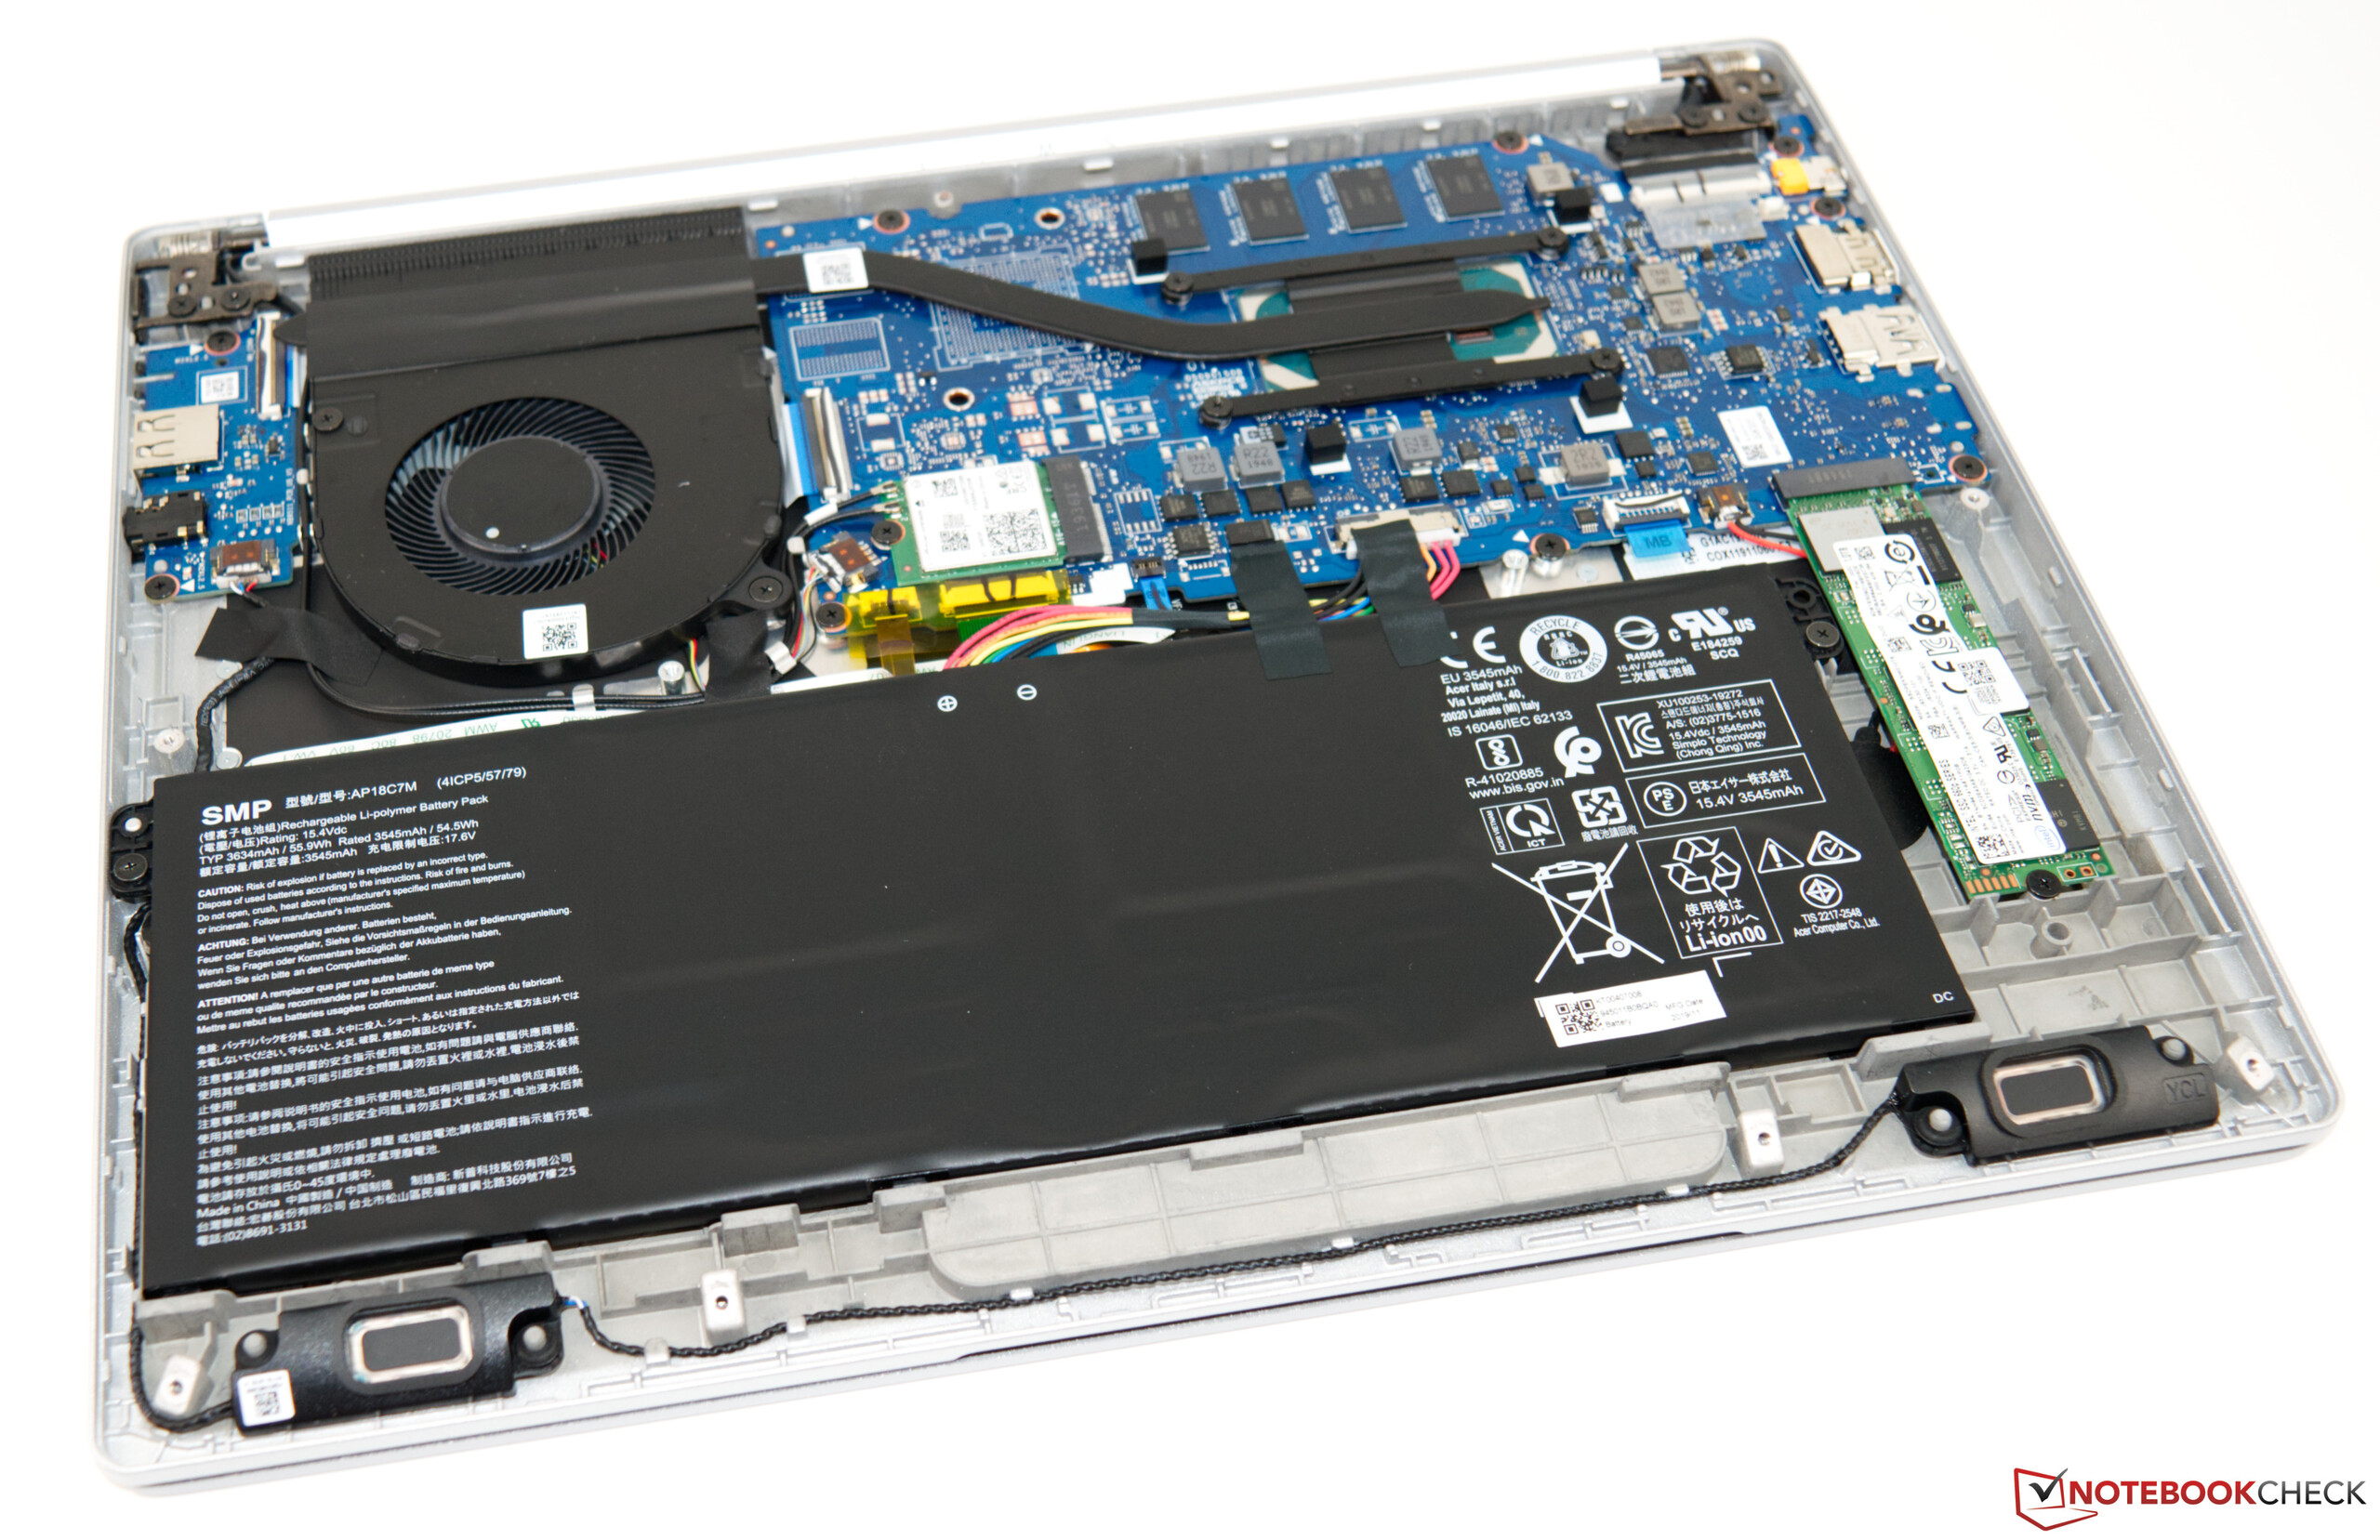
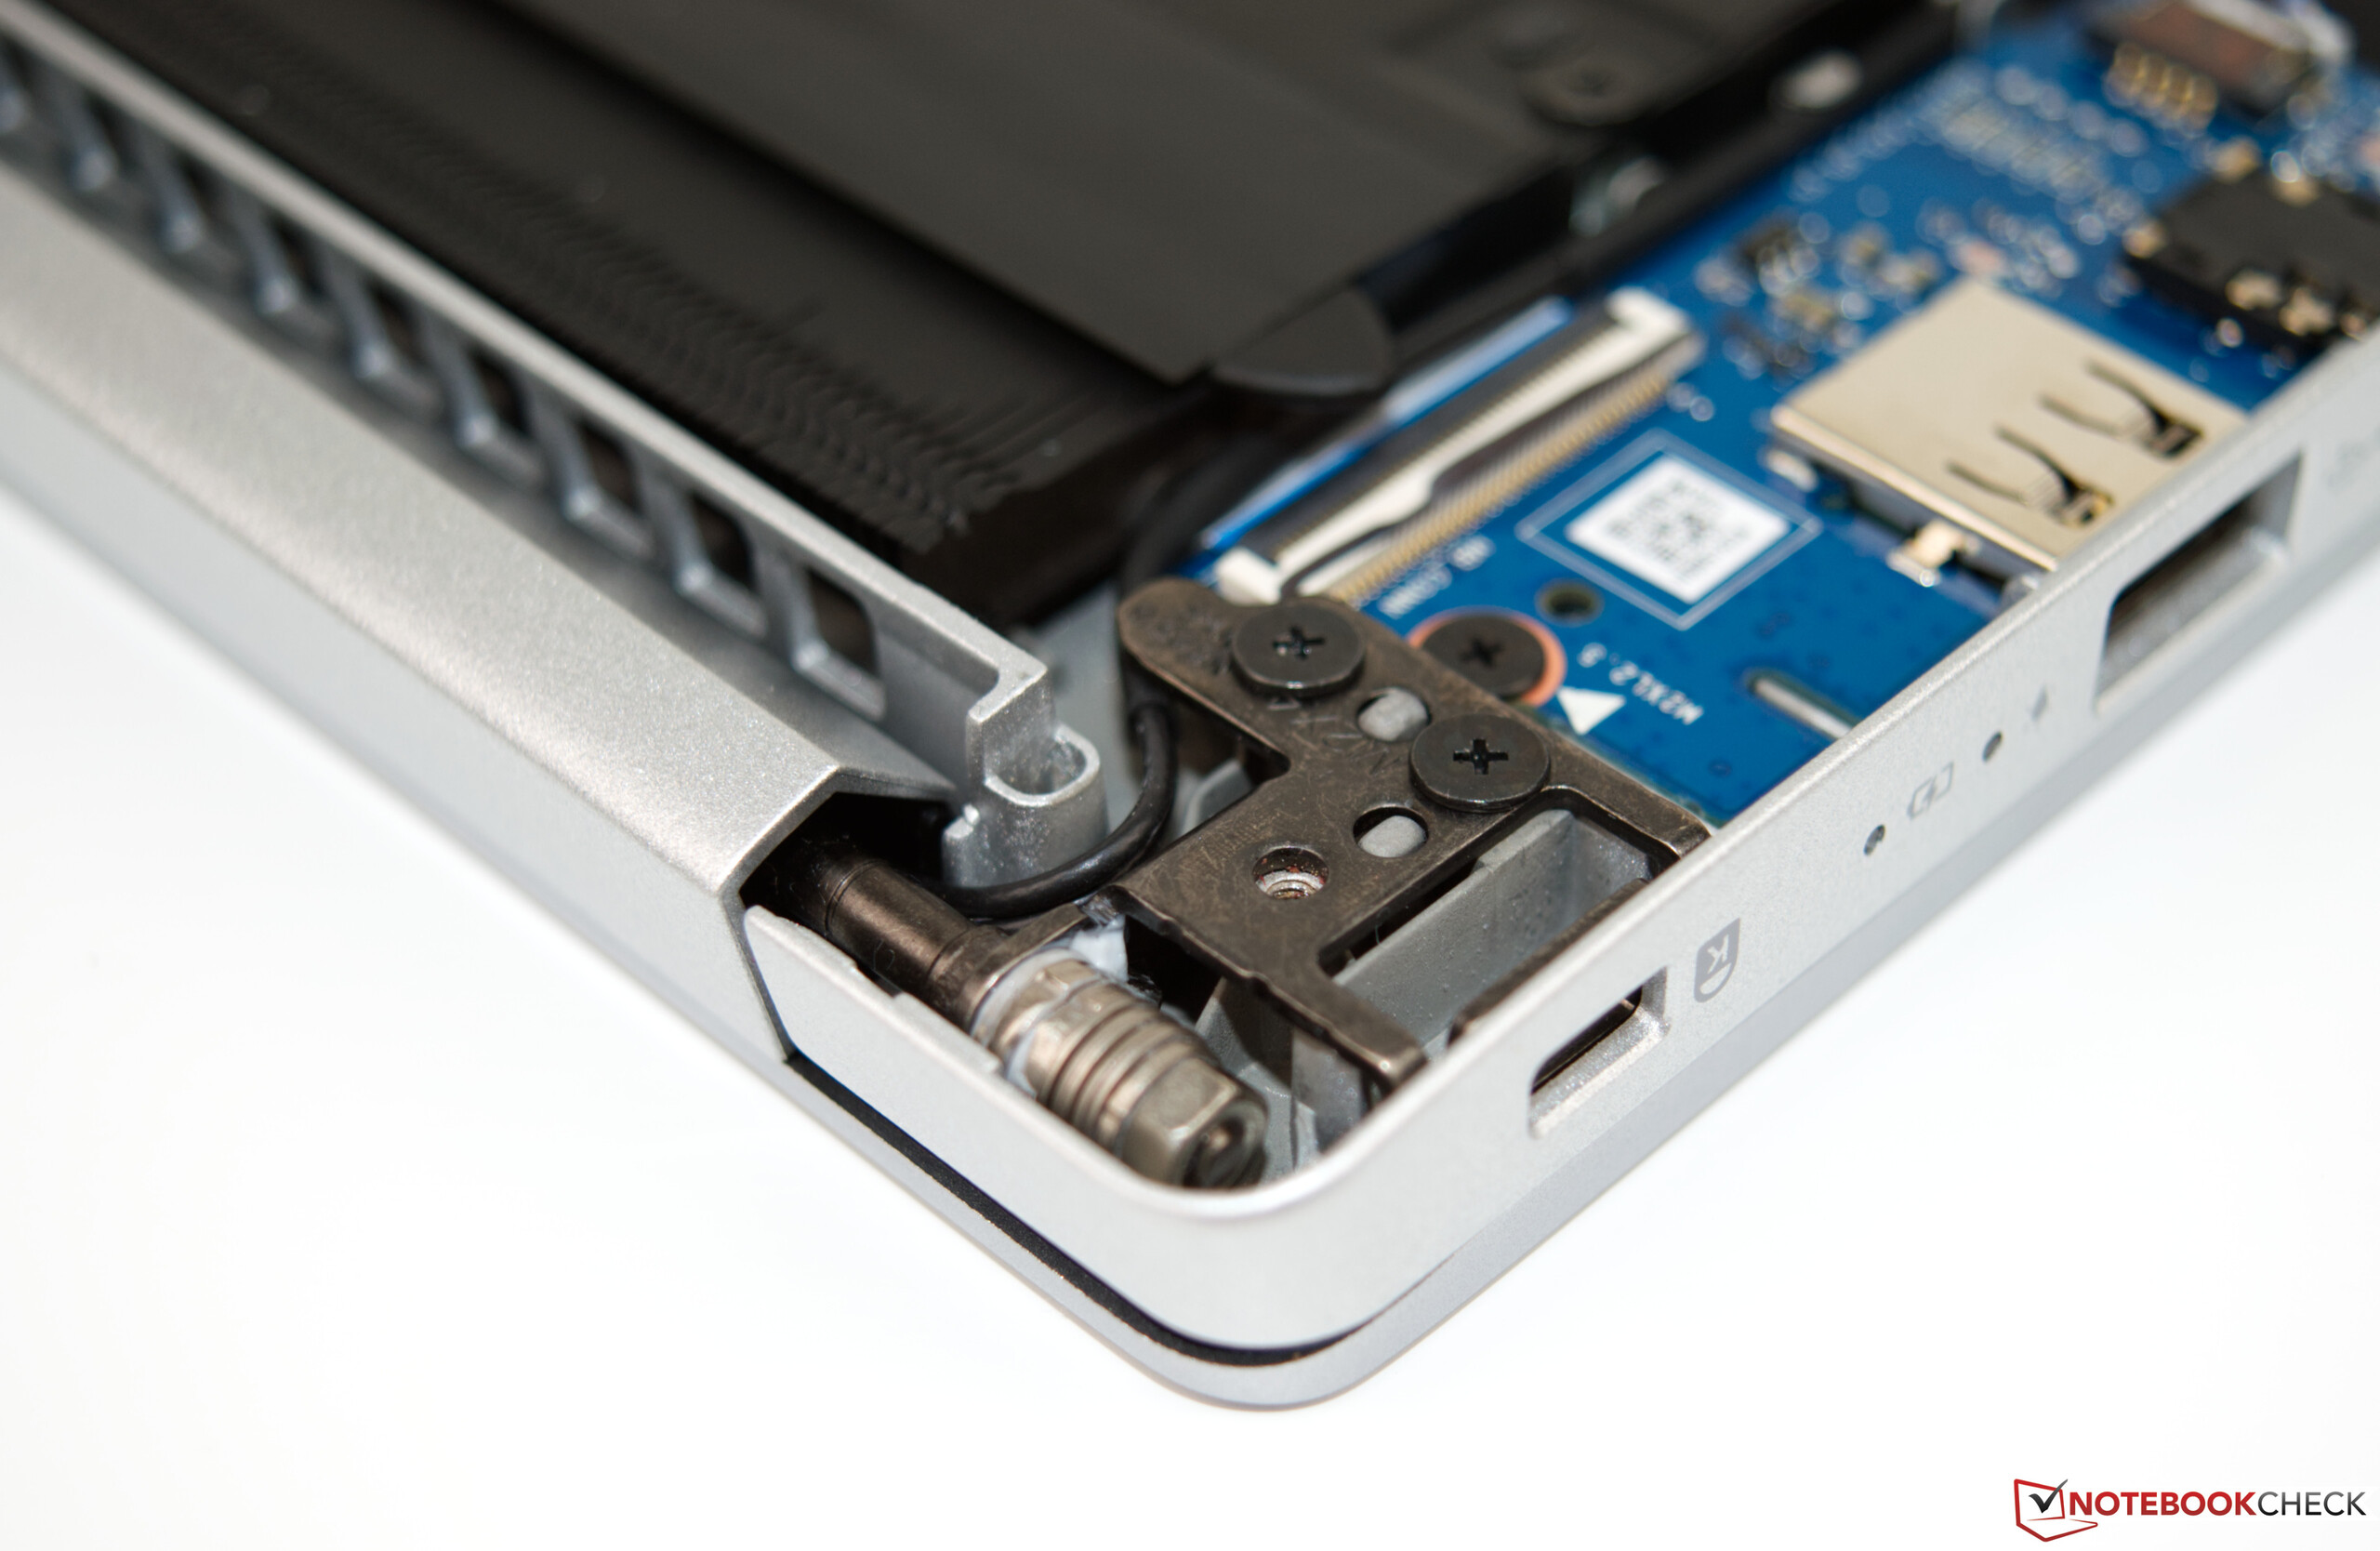
Al met al is de Swift 3 een verbetering ten opzicht van zijn voorganger in deze iver het geheel genomen solide subnotebook die het ook als multimedia notebook goed doet. Een tweede opslagapparaat en de mogelijkheid om het RAM te vervangen zouden het notebook nog beter gemaakt hebben.
Acer’s new Swift 3 SF313 is an overall improved device. It was not just redesigned to look better, but has received a major internal overhaul as well. Intel’s latest Ice Lake SoC makes for a small performance improvement, which, truth be told, we would have expected to be bigger. The Intel Core i7-1065G7 performed very well and better than its Kaby Lake predecessors. However, when compared to other similarly equipped devices, the Swift 3 fell behind. It scored with its great design and its robust build quality. The bright IPS display will definitely remain a memorable experience, and its 3:2 aspect ratio fit the Swift’s overall concept very well.
The Acer Swift 3 SF313 offers decent performance, long battery life, and a great display without stretching the budget too much.
Its flaws include the poor Wi-Fi performance and the keyboard, which was very hard to read in daylight due to its white backlight. That said, disabling the backlight in bright environments did improve upon the keyboard’s legibility somewhat. Connectivity is modern albeit a second USB-C port would not have hurt anyone. We would have also not complained about a card reader or an LTE option.
All things considered the Swift 3 is an improvement over its predecessor resulting in an all-over solid subnotebook that also does a great job as a multimedia device. Adding a secondary storage device and making the RAM upgradeable would have made the device even better than it already is.
Acer Swift 3 SF313-52-71Y7
- 17-02-2020 v7 (old)
Sebastian Bade
Price comparison
