Kort testrapport HP Spectre x360 13-aw0013dx Convertible: Aangedreven door Intel Ice Lake
Evaluatie | Datum | Model | Gewicht | Hoogte | Formaat | Resolutie | Beste prijs |
|---|---|---|---|---|---|---|---|
| 88.4 % v7 (old) | 12-2019 | HP Spectre x360 13-aw0013dx i7-1065G7, Iris Plus Graphics G7 (Ice Lake 64 EU) | 1.2 kg | 16.9 mm | 13.30" | 1920x1080 | |
| 86.3 % v7 (old) | 11-2019 | Dell XPS 13 7390 2-in-1 Core i7 i7-1065G7, Iris Plus Graphics G7 (Ice Lake 64 EU) | 1.3 kg | 13 mm | 13.40" | 1920x1200 | |
| 81.2 % v7 (old) | 03-2020 | Asus ZenBook Flip 14 UM462DA-AI023T R7 3700U, Vega 10 | 1.6 kg | 18.9 mm | 14.00" | 1920x1080 | |
| 86.3 % v7 (old) | 10-2019 | Razer Blade Stealth i7-1065G7 Iris Plus i7-1065G7, Iris Plus Graphics G7 (Ice Lake 64 EU) | 1.4 kg | 15.3 mm | 13.30" | 1920x1080 | |
| 87 % v7 (old) | 12-2019 | Lenovo Yoga C940-14IIL 81Q9 i7-1065G7, Iris Plus Graphics G7 (Ice Lake 64 EU) | 1.4 kg | 15.7 mm | 14.00" | 3840x2160 |
| SD Card Reader | |
| average JPG Copy Test (av. of 3 runs) | |
| HP Spectre x360 13-ap0312ng (Toshiba Exceria Pro M501 64 GB UHS-II) | |
| HP Spectre x360 13-aw0013dx (Toshiba Exceria Pro M501 microSDXC 64GB) | |
| Dell XPS 13 7390 2-in-1 Core i7 (Toshiba Exceria Pro M501 64 GB UHS-II) | |
| Asus ZenBook Flip 14 UM462DA-AI023T (Toshiba Exceria Pro M501 microSDXC 64GB) | |
| maximum AS SSD Seq Read Test (1GB) | |
| HP Spectre x360 13-ap0312ng (Toshiba Exceria Pro M501 64 GB UHS-II) | |
| Dell XPS 13 7390 2-in-1 Core i7 (Toshiba Exceria Pro M501 64 GB UHS-II) | |
| HP Spectre x360 13-aw0013dx (Toshiba Exceria Pro M501 microSDXC 64GB) | |
| Asus ZenBook Flip 14 UM462DA-AI023T (Toshiba Exceria Pro M501 microSDXC 64GB) | |
| Networking | |
| iperf3 transmit AX12 | |
| MSI Prestige 15 A10SC | |
| HP Spectre x360 13-ap0312ng | |
| Asus ZenBook Flip 14 UM462DA-AI023T | |
| iperf3 receive AX12 | |
| MSI Prestige 15 A10SC | |
| HP Spectre x360 13-ap0312ng | |
| Asus ZenBook Flip 14 UM462DA-AI023T | |
| |||||||||||||||||||||||||
Helderheidsverdeling: 85 %
Helderheid in Batterij-modus: 447.4 cd/m²
Contrast: 1443:1 (Zwart: 0.31 cd/m²)
ΔE ColorChecker Calman: 4.23 | ∀{0.5-29.43 Ø4.72}
calibrated: 1.32
ΔE Greyscale Calman: 6.1 | ∀{0.09-98 Ø4.97}
98.9% sRGB (Argyll 1.6.3 3D)
64.8% AdobeRGB 1998 (Argyll 1.6.3 3D)
71.5% AdobeRGB 1998 (Argyll 3D)
98.9% sRGB (Argyll 3D)
69.6% Display P3 (Argyll 3D)
Gamma: 2.11
CCT: 6136 K
| HP Spectre x360 13-aw0013dx AU Optronics AUO5E2D, IPS, 13.3", 1920x1080 | HP Spectre x360 13-ap0312ng M133NVF3, IPS, 13.3", 1920x1080 | Dell XPS 13 7390 2-in-1 Core i7 Sharp LQ134N1, IPS, 13.4", 1920x1200 | Razer Blade Stealth i7-1065G7 Iris Plus Sharp LQ133M1JW41, IPS, 13.3", 1920x1080 | Lenovo Yoga C940-14IIL 81Q9 BOE HF NV140QUM-N54, IPS, 14", 3840x2160 | Asus ZenBook Flip 14 UM462DA-AI023T IPS, 14", 1920x1080 | |
|---|---|---|---|---|---|---|
| Display | -9% | 0% | -4% | 13% | -11% | |
| Display P3 Coverage (%) | 69.6 | 63 -9% | 69.9 0% | 66.2 -5% | 83.8 20% | 65.5 -6% |
| sRGB Coverage (%) | 98.9 | 89.8 -9% | 99.2 0% | 97.2 -2% | 99.9 1% | 85.2 -14% |
| AdobeRGB 1998 Coverage (%) | 71.5 | 64.1 -10% | 71.5 0% | 67.1 -6% | 83.3 17% | 62.2 -13% |
| Response Times | 49% | 22% | 18% | 27% | 20% | |
| Response Time Grey 50% / Grey 80% * (ms) | 60.8 ? | 29.2 ? 52% | 47.6 ? 22% | 45.2 ? 26% | 44.4 ? 27% | 42 ? 31% |
| Response Time Black / White * (ms) | 36.8 ? | 20 ? 46% | 29.2 ? 21% | 33.2 ? 10% | 27.2 ? 26% | 34 ? 8% |
| PWM Frequency (Hz) | 1000 ? | 2500 ? | 22730 ? | |||
| Screen | -20% | 17% | 19% | -8% | -29% | |
| Brightness middle (cd/m²) | 447.4 | 272 -39% | 549.8 23% | 422.6 -6% | 501.7 12% | 306 -32% |
| Brightness (cd/m²) | 420 | 298 -29% | 520 24% | 404 -4% | 501 19% | 294 -30% |
| Brightness Distribution (%) | 85 | 84 -1% | 86 1% | 87 2% | 82 -4% | 81 -5% |
| Black Level * (cd/m²) | 0.31 | 0.39 -26% | 0.39 -26% | 0.35 -13% | 0.32 -3% | 0.39 -26% |
| Contrast (:1) | 1443 | 697 -52% | 1410 -2% | 1207 -16% | 1568 9% | 785 -46% |
| Colorchecker dE 2000 * | 4.23 | 4.3 -2% | 2.12 50% | 1.02 76% | 5.48 -30% | 5.16 -22% |
| Colorchecker dE 2000 max. * | 9.34 | 9 4% | 3.66 61% | 3.06 67% | 10.03 -7% | 9.9 -6% |
| Colorchecker dE 2000 calibrated * | 1.32 | 2.4 -82% | 1.37 -4% | 0.95 28% | 2.22 -68% | 3.07 -133% |
| Greyscale dE 2000 * | 6.1 | 4.4 28% | 2.6 57% | 1 84% | 8.1 -33% | 5.86 4% |
| Gamma | 2.11 104% | 1.97 112% | 2.3 96% | 2.21 100% | 2.07 106% | 2.31 95% |
| CCT | 6136 106% | 5825 112% | 6884 94% | 6502 100% | 6730 97% | 6349 102% |
| Color Space (Percent of AdobeRGB 1998) (%) | 64.8 | 58.9 -9% | 65.4 1% | 62.1 -4% | 74.1 14% | 56 -14% |
| Color Space (Percent of sRGB) (%) | 98.9 | 89.8 -9% | 99.7 1% | 97.1 -2% | 100 1% | 85 -14% |
| Totaal Gemiddelde (Programma / Instellingen) | 7% /
-9% | 13% /
14% | 11% /
15% | 11% /
0% | -7% /
-20% |
* ... kleiner is beter
Responstijd Scherm
| ↔ Responstijd Zwart naar Wit | ||
|---|---|---|
| 36.8 ms ... stijging ↗ en daling ↘ gecombineerd | ↗ 15.6 ms stijging | 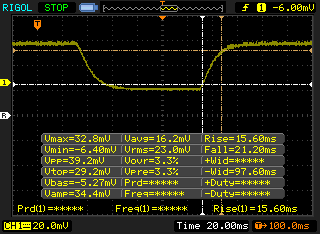 |
| ↘ 21.2 ms daling | ||
| Het scherm vertoonde trage responstijden in onze tests en is misschien te traag voor games. Ter vergelijking: alle testtoestellen variëren van 0.1 (minimum) tot 240 (maximum) ms. » 95 % van alle toestellen zijn beter. Dit betekent dat de gemeten responstijd slechter is dan het gemiddelde (19.8 ms) van alle geteste toestellen. | ||
| ↔ Responstijd 50% Grijs naar 80% Grijs | ||
| 60.8 ms ... stijging ↗ en daling ↘ gecombineerd | ↗ 26 ms stijging | 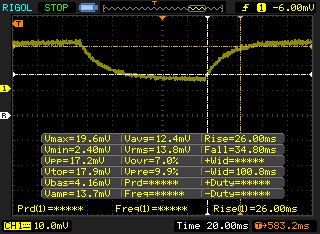 |
| ↘ 34.8 ms daling | ||
| Het scherm vertoonde trage responstijden in onze tests en is misschien te traag voor games. Ter vergelijking: alle testtoestellen variëren van 0.165 (minimum) tot 636 (maximum) ms. » 96 % van alle toestellen zijn beter. Dit betekent dat de gemeten responstijd slechter is dan het gemiddelde (31 ms) van alle geteste toestellen. | ||
Screen Flickering / PWM (Pulse-Width Modulation)
| Screen flickering / PWM niet waargenomen | 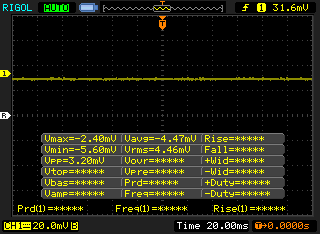 | ||
Ter vergelijking: 52 % van alle geteste toestellen maakten geen gebruik van PWM om de schermhelderheid te verlagen. Als het wel werd gebruikt, werd een gemiddelde van 7775 (minimum: 5 - maximum: 343500) Hz waargenomen. | |||
| PCMark 8 Home Score Accelerated v2 | 3911 punten | |
| PCMark 8 Work Score Accelerated v2 | 5227 punten | |
| PCMark 10 Score | 4522 punten | |
Help | ||
| HP Spectre x360 13-aw0013dx Intel Optane Memory H10 with Solid State Storage 32GB + 512GB HBRPEKNX0202A(L/H) | HP Spectre x360 13-ap0312ng Toshiba XG5 KXG50ZNV512G | Dell XPS 13 7390 2-in-1 Core i7 Toshiba BG4 KBG40ZPZ512G | Asus ZenBook Flip 14 UM462DA-AI023T | Razer Blade Stealth i7-1065G7 Iris Plus Samsung SSD PM981 MZVLB256HAHQ | Lenovo Yoga C940-14IIL 81Q9 Samsung PM981a MZVLB1T0HBLR | |
|---|---|---|---|---|---|---|
| AS SSD | 27% | 28% | -25% | 21% | 115% | |
| Seq Read (MB/s) | 1039 | 2197 111% | 1801 73% | 424.5 -59% | 1989 91% | 2213 113% |
| Seq Write (MB/s) | 310.1 | 493 59% | 1125 263% | 374.5 21% | 827 167% | 1401 352% |
| 4K Read (MB/s) | 76 | 31.4 -59% | 39.7 -48% | 19.38 -74% | 40.12 -47% | 55.2 -27% |
| 4K Write (MB/s) | 118 | 123.9 5% | 67 -43% | 34.69 -71% | 135.1 14% | 130.3 10% |
| 4K-64 Read (MB/s) | 371.8 | 674 81% | 1253 237% | 430.2 16% | 531 43% | 878 136% |
| 4K-64 Write (MB/s) | 469.5 | 479.3 2% | 209 -55% | 377.2 -20% | 309.9 -34% | 1478 215% |
| Access Time Read * (ms) | 0.067 | 0.117 -75% | 0.069 -3% | 0.13 -94% | 0.085 -27% | 0.036 46% |
| Access Time Write * (ms) | 0.138 | 0.049 64% | 0.625 -353% | 0.084 39% | 0.09 35% | 0.086 38% |
| Score Read (Points) | 552 | 925 68% | 1472 167% | 492 -11% | 770 39% | 1154 109% |
| Score Write (Points) | 618 | 653 6% | 388 -37% | 449 -27% | 528 -15% | 1748 183% |
| Score Total (Points) | 1448 | 1971 36% | 2583 78% | 1194 -18% | 1644 14% | 3467 139% |
| Copy ISO MB/s (MB/s) | 764 | 1293 69% | 1024 34% | 1418 86% | 2161 183% | |
| Copy Program MB/s (MB/s) | 465.8 | 560 20% | 203.6 -56% | 382.7 -18% | 572 23% | |
| Copy Game MB/s (MB/s) | 764 | 927 21% | 552 -28% | 334.2 -56% | 1433 88% | |
| CrystalDiskMark 5.2 / 6 | -1% | 24% | -12% | 43% | 75% | |
| Write 4K (MB/s) | 112.6 | 105.1 -7% | 106.7 -5% | 142.1 26% | 176.8 57% | 128.6 14% |
| Read 4K (MB/s) | 131 | 42.3 -68% | 49.94 -62% | 44.75 -66% | 48.38 -63% | 45.25 -65% |
| Write Seq (MB/s) | 458.9 | 677 48% | 1223 167% | 1332 190% | 1949 325% | |
| Read Seq (MB/s) | 1355 | 2092 54% | 1801 33% | 1644 21% | 2359 74% | |
| Write 4K Q32T1 (MB/s) | 341.3 | 378.8 11% | 325.3 -5% | 252.4 -26% | 440.6 29% | 445 30% |
| Read 4K Q32T1 (MB/s) | 320.6 | 271.3 -15% | 551 72% | 340.9 6% | 559 74% | 404.5 26% |
| Write Seq Q32T1 (MB/s) | 1219 | 527 -57% | 1224 0% | 1457 20% | 1104 -9% | 3019 148% |
| Read Seq Q32T1 (MB/s) | 2462 | 3175 29% | 2350 -5% | 1723 -30% | 3481 41% | 3564 45% |
| Write 4K Q8T8 (MB/s) | 1164 | |||||
| Read 4K Q8T8 (MB/s) | 1103 | |||||
| Totaal Gemiddelde (Programma / Instellingen) | 13% /
15% | 26% /
27% | -19% /
-21% | 32% /
29% | 95% /
100% |
* ... kleiner is beter

| 3DMark 11 | |
| 1280x720 Performance GPU | |
| Asus FX504GD | |
| Dell XPS 13 7390 2-in-1 Core i7 | |
| HP Spectre x360 13-aw0013dx | |
| Huawei MateBook 14 KLV-W29 | |
| Dell Inspiron 15 5000 5585 | |
| Lenovo Yoga 530-14ARR-81H9000VGE | |
| Gemiddeld Intel Iris Plus Graphics G7 (Ice Lake 64 EU) (2112 - 4630, n=28) | |
| Asus Zenbook 14 UX433FN-A6023T | |
| Dell XPS 13 7390 Core i7-10710U | |
| 1280x720 Performance Combined | |
| Asus FX504GD | |
| Huawei MateBook 14 KLV-W29 | |
| Dell XPS 13 7390 2-in-1 Core i7 | |
| HP Spectre x360 13-aw0013dx | |
| Asus Zenbook 14 UX433FN-A6023T | |
| Dell Inspiron 15 5000 5585 | |
| Gemiddeld Intel Iris Plus Graphics G7 (Ice Lake 64 EU) (1319 - 4163, n=28) | |
| Lenovo Yoga 530-14ARR-81H9000VGE | |
| Dell XPS 13 7390 Core i7-10710U | |
| 3DMark 11 Performance | 4777 punten | |
| 3DMark Ice Storm Standard Score | 70068 punten | |
| 3DMark Cloud Gate Standard Score | 13766 punten | |
| 3DMark Fire Strike Score | 2673 punten | |
| 3DMark Time Spy Score | 771 punten | |
Help | ||
| Shadow of the Tomb Raider - 1280x720 Lowest Preset | |
| Asus GL753VD | |
| MSI PE60 2QD | |
| Acer Aspire 5 A515-52G-723L | |
| Acer Aspire 5 A515-52G-53PU | |
| Dell Inspiron 15 5000 5585 | |
| Gemiddeld Intel Iris Plus Graphics G7 (Ice Lake 64 EU) (15.6 - 33, n=13) | |
| Acer Nitro 5 | |
| HP Spectre x360 13-aw0013dx | |
| Dell XPS 13 7390 Core i7-10710U | |
| Dell Inspiron 14 5000 5482 2-in-1 | |
| lage | gem. | hoge | ultra | |
|---|---|---|---|---|
| BioShock Infinite (2013) | 89.4 | 47.9 | 47.3 | 17.3 |
| The Witcher 3 (2015) | 43.9 | 28.9 | 13.8 | 7.2 |
| Rocket League (2017) | 87.9 | 44 | 29.7 | |
| Shadow of the Tomb Raider (2018) | 21 |
| HP Spectre x360 13-aw0013dx Iris Plus Graphics G7 (Ice Lake 64 EU), i7-1065G7, Intel Optane Memory H10 with Solid State Storage 32GB + 512GB HBRPEKNX0202A(L/H) | HP Spectre x360 13-ap0312ng UHD Graphics 620, i7-8565U, Toshiba XG5 KXG50ZNV512G | Dell XPS 13 7390 2-in-1 Core i7 Iris Plus Graphics G7 (Ice Lake 64 EU), i7-1065G7, Toshiba BG4 KBG40ZPZ512G | Asus ZenBook Flip 14 UM462DA-AI023T Vega 10, R7 3700U | Razer Blade Stealth i7-1065G7 Iris Plus Iris Plus Graphics G7 (Ice Lake 64 EU), i7-1065G7, Samsung SSD PM981 MZVLB256HAHQ | Lenovo Yoga C940-14IIL 81Q9 Iris Plus Graphics G7 (Ice Lake 64 EU), i7-1065G7, Samsung PM981a MZVLB1T0HBLR | |
|---|---|---|---|---|---|---|
| Noise | -2% | -8% | -8% | -7% | -6% | |
| uit / omgeving * (dB) | 28.5 | 29.2 -2% | 28.1 1% | 30 -5% | 28.3 1% | 28.5 -0% |
| Idle Minimum * (dB) | 28.5 | 29.2 -2% | 28.1 1% | 30 -5% | 28.3 1% | 28.5 -0% |
| Idle Average * (dB) | 28.5 | 29.2 -2% | 28.1 1% | 30 -5% | 28.3 1% | 28.5 -0% |
| Idle Maximum * (dB) | 28.5 | 30.4 -7% | 28.1 1% | 30 -5% | 28.3 1% | 29 -2% |
| Load Average * (dB) | 28.5 | 31 -9% | 31.7 -11% | 34.2 -20% | 33.5 -18% | 33 -16% |
| Witcher 3 ultra * (dB) | 35.3 | 43.4 -23% | 34.5 2% | 40.7 -15% | ||
| Load Maximum * (dB) | 35.3 | 32.1 9% | 43.4 -23% | 37.5 -6% | 49.4 -40% | 39.5 -12% |
* ... kleiner is beter
Geluidsniveau
| Onbelast |
| 28.5 / 28.5 / 28.5 dB (A) |
| HDD |
| 28.5 dB (A) |
| Belasting |
| 28.5 / 35.3 dB (A) |
 | ||
30 dB stil 40 dB(A) hoorbaar 50 dB(A) luid |
||
min: | ||
(+) De maximumtemperatuur aan de bovenzijde bedraagt 37.2 °C / 99 F, vergeleken met het gemiddelde van 35.4 °C / 96 F, variërend van 19.6 tot 60 °C voor de klasse Convertible.
(±) De bodem warmt op tot een maximum van 42.2 °C / 108 F, vergeleken met een gemiddelde van 36.9 °C / 98 F
(+) Bij onbelast gebruik bedraagt de gemiddelde temperatuur voor de bovenzijde 23.5 °C / 74 F, vergeleken met het apparaatgemiddelde van 30.3 °C / 87 F.
(+) De palmsteunen en het touchpad zijn met een maximum van ###max## °C / 76.3 F koeler dan de huidtemperatuur en voelen daarom koel aan.
(+) De gemiddelde temperatuur van de handpalmsteun van soortgelijke toestellen bedroeg 28 °C / 82.4 F (+3.4 °C / 6.1 F).
HP Spectre x360 13-aw0013dx audioanalyse
(±) | luidspreker luidheid is gemiddeld maar goed (81.6 dB)
Bas 100 - 315 Hz
(±) | verminderde zeebaars - gemiddeld 13.2% lager dan de mediaan
(±) | lineariteit van de lage tonen is gemiddeld (12.8% delta ten opzichte van de vorige frequentie)
Midden 400 - 2000 Hz
(+) | evenwichtige middens - slechts 2.3% verwijderd van de mediaan
(+) | de middentonen zijn lineair (3.6% delta ten opzichte van de vorige frequentie)
Hoog 2 - 16 kHz
(+) | evenwichtige hoogtepunten - slechts 2.7% verwijderd van de mediaan
(+) | de hoge tonen zijn lineair (6.9% delta naar de vorige frequentie)
Algemeen 100 - 16.000 Hz
(±) | lineariteit van het totale geluid is gemiddeld (16.7% verschil met de mediaan)
Vergeleken met dezelfde klasse
» 31% van alle geteste apparaten in deze klasse waren beter, 5% vergelijkbaar, 64% slechter
» De beste had een delta van 6%, het gemiddelde was 20%, de slechtste was 57%
Vergeleken met alle geteste toestellen
» 29% van alle geteste apparaten waren beter, 7% gelijk, 64% slechter
» De beste had een delta van 4%, het gemiddelde was 24%, de slechtste was 134%
Apple MacBook 12 (Early 2016) 1.1 GHz audioanalyse
(+) | luidsprekers kunnen relatief luid spelen (83.6 dB)
Bas 100 - 315 Hz
(±) | verminderde zeebaars - gemiddeld 11.3% lager dan de mediaan
(±) | lineariteit van de lage tonen is gemiddeld (14.2% delta ten opzichte van de vorige frequentie)
Midden 400 - 2000 Hz
(+) | evenwichtige middens - slechts 2.4% verwijderd van de mediaan
(+) | de middentonen zijn lineair (5.5% delta ten opzichte van de vorige frequentie)
Hoog 2 - 16 kHz
(+) | evenwichtige hoogtepunten - slechts 2% verwijderd van de mediaan
(+) | de hoge tonen zijn lineair (4.5% delta naar de vorige frequentie)
Algemeen 100 - 16.000 Hz
(+) | het totale geluid is lineair (10.2% verschil met de mediaan)
Vergeleken met dezelfde klasse
» 7% van alle geteste apparaten in deze klasse waren beter, 2% vergelijkbaar, 91% slechter
» De beste had een delta van 5%, het gemiddelde was 18%, de slechtste was 53%
Vergeleken met alle geteste toestellen
» 5% van alle geteste apparaten waren beter, 1% gelijk, 94% slechter
» De beste had een delta van 4%, het gemiddelde was 24%, de slechtste was 134%
| Uit / Standby | |
| Inactief | |
| Belasting |
|
Key:
min: | |
| HP Spectre x360 13-aw0013dx i7-1065G7, Iris Plus Graphics G7 (Ice Lake 64 EU), Intel Optane Memory H10 with Solid State Storage 32GB + 512GB HBRPEKNX0202A(L/H), IPS, 1920x1080, 13.3" | HP Spectre x360 13-ap0312ng i7-8565U, UHD Graphics 620, Toshiba XG5 KXG50ZNV512G, IPS, 1920x1080, 13.3" | Dell XPS 13 7390 2-in-1 Core i7 i7-1065G7, Iris Plus Graphics G7 (Ice Lake 64 EU), Toshiba BG4 KBG40ZPZ512G, IPS, 1920x1200, 13.4" | Asus ZenBook Flip 14 UM462DA-AI023T R7 3700U, Vega 10, , IPS, 1920x1080, 14" | Razer Blade Stealth i7-1065G7 Iris Plus i7-1065G7, Iris Plus Graphics G7 (Ice Lake 64 EU), Samsung SSD PM981 MZVLB256HAHQ, IPS, 1920x1080, 13.3" | Lenovo Yoga C940-14IIL 81Q9 i7-1065G7, Iris Plus Graphics G7 (Ice Lake 64 EU), Samsung PM981a MZVLB1T0HBLR, IPS, 3840x2160, 14" | |
|---|---|---|---|---|---|---|
| Power Consumption | -7% | -6% | -4% | -38% | -57% | |
| Idle Minimum * (Watt) | 3.9 | 4.32 -11% | 2.6 33% | 3.7 5% | 5.9 -51% | 5.6 -44% |
| Idle Average * (Watt) | 6.3 | 6.84 -9% | 5.3 16% | 6.9 -10% | 8.1 -29% | 10.5 -67% |
| Idle Maximum * (Watt) | 6.8 | 8.64 -27% | 7 -3% | 9.4 -38% | 11.2 -65% | 12 -76% |
| Load Average * (Watt) | 32.6 | 31.8 2% | 43.1 -32% | 34 -4% | 44.3 -36% | 53.3 -63% |
| Witcher 3 ultra * (Watt) | 25.6 | 43.1 -68% | 41.9 -64% | 46.9 -83% | ||
| Load Maximum * (Watt) | 59 | 53 10% | 49 17% | 44 25% | 50.2 15% | 64.6 -9% |
* ... kleiner is beter
| HP Spectre x360 13-aw0013dx i7-1065G7, Iris Plus Graphics G7 (Ice Lake 64 EU), 60 Wh | HP Spectre x360 13-ap0312ng i7-8565U, UHD Graphics 620, 61 Wh | Dell XPS 13 7390 2-in-1 Core i7 i7-1065G7, Iris Plus Graphics G7 (Ice Lake 64 EU), 51 Wh | Asus ZenBook Flip 14 UM462DA-AI023T R7 3700U, Vega 10, 42 Wh | Razer Blade Stealth i7-1065G7 Iris Plus i7-1065G7, Iris Plus Graphics G7 (Ice Lake 64 EU), 53.1 Wh | Lenovo Yoga C940-14IIL 81Q9 i7-1065G7, Iris Plus Graphics G7 (Ice Lake 64 EU), 60 Wh | |
|---|---|---|---|---|---|---|
| Batterijduur | -13% | -9% | -24% | -2% | -26% | |
| Reader / Idle (h) | 37.1 | |||||
| WiFi v1.3 (h) | 9.9 | 8.9 -10% | 9 -9% | 7.5 -24% | 9.7 -2% | 7.3 -26% |
| Load (h) | 2.7 | 2.3 -15% |
Pro
Contra
Voor het volledige, Engelse testrapport, klik hier.
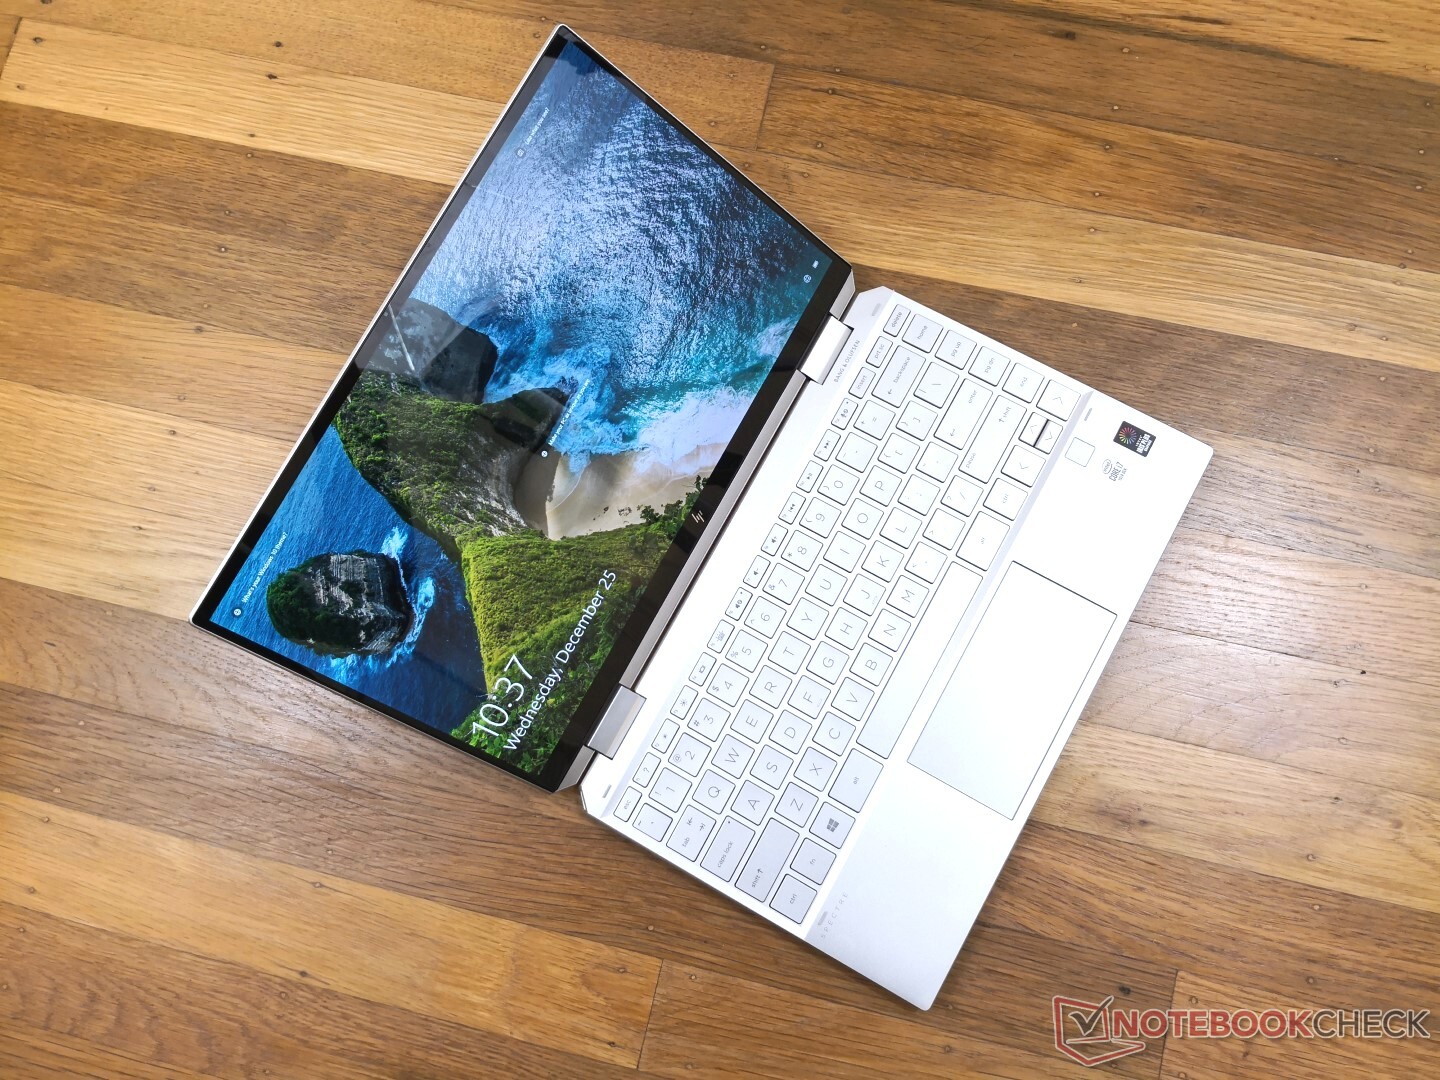
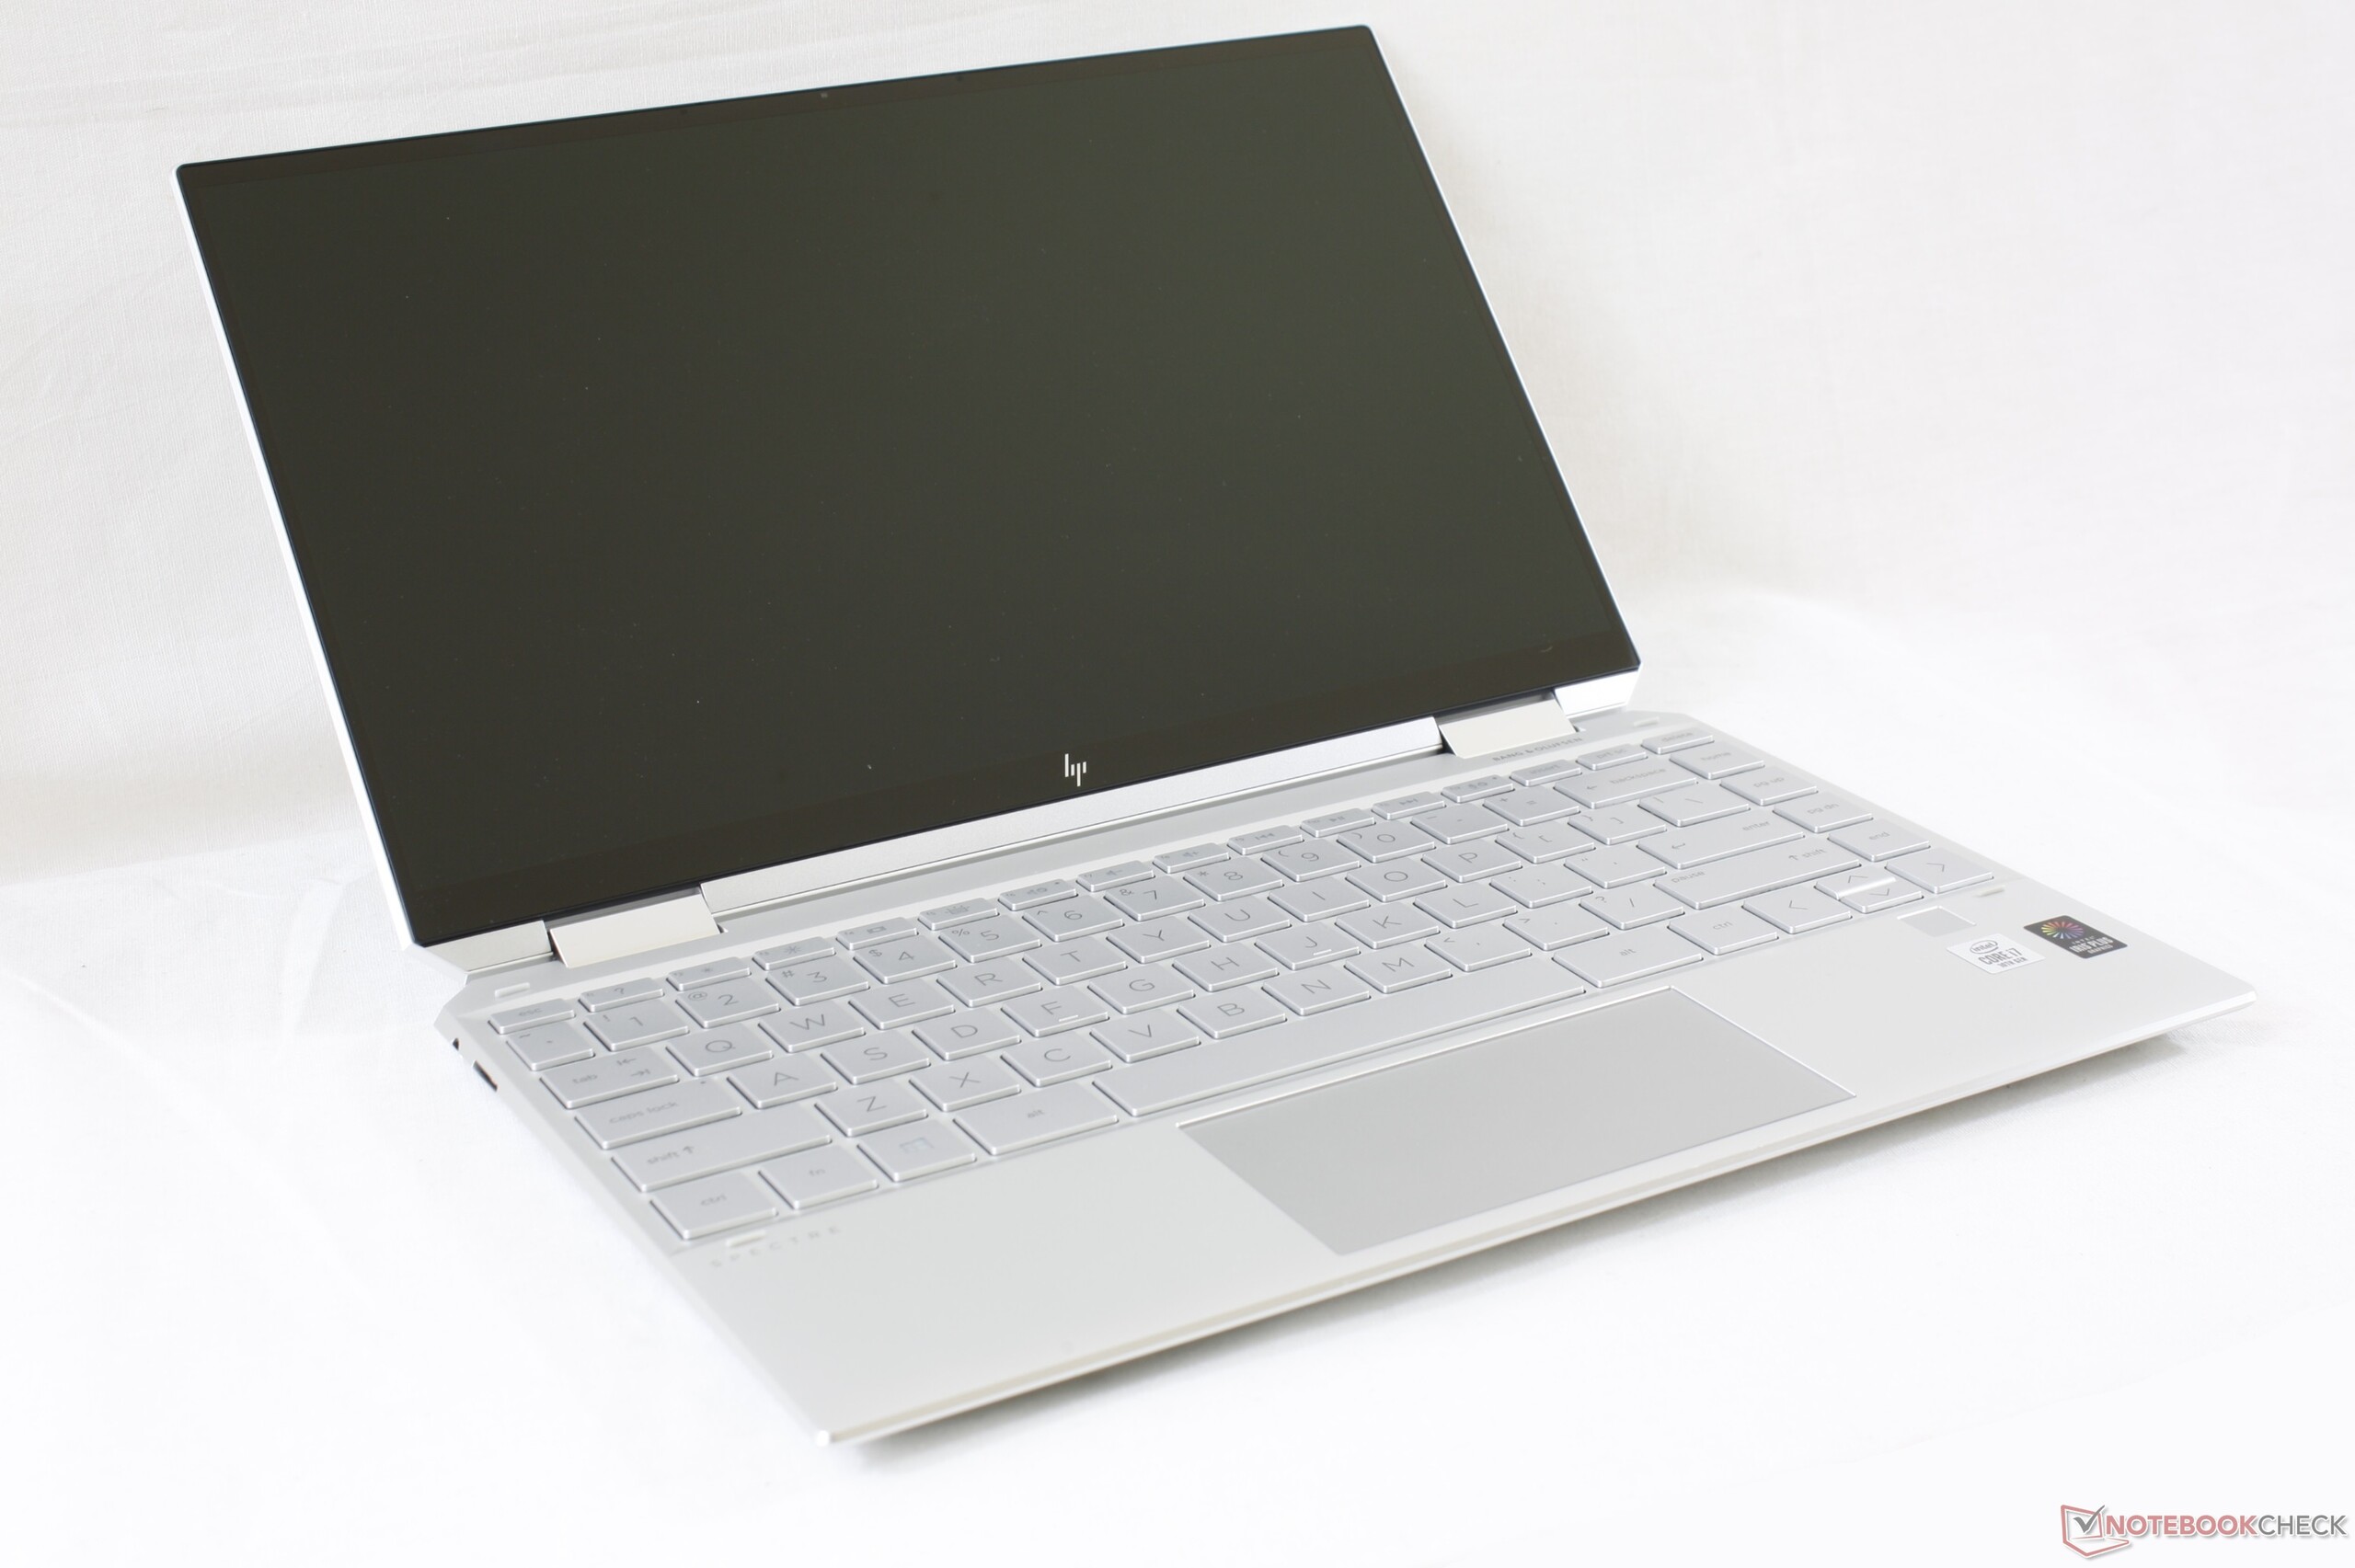
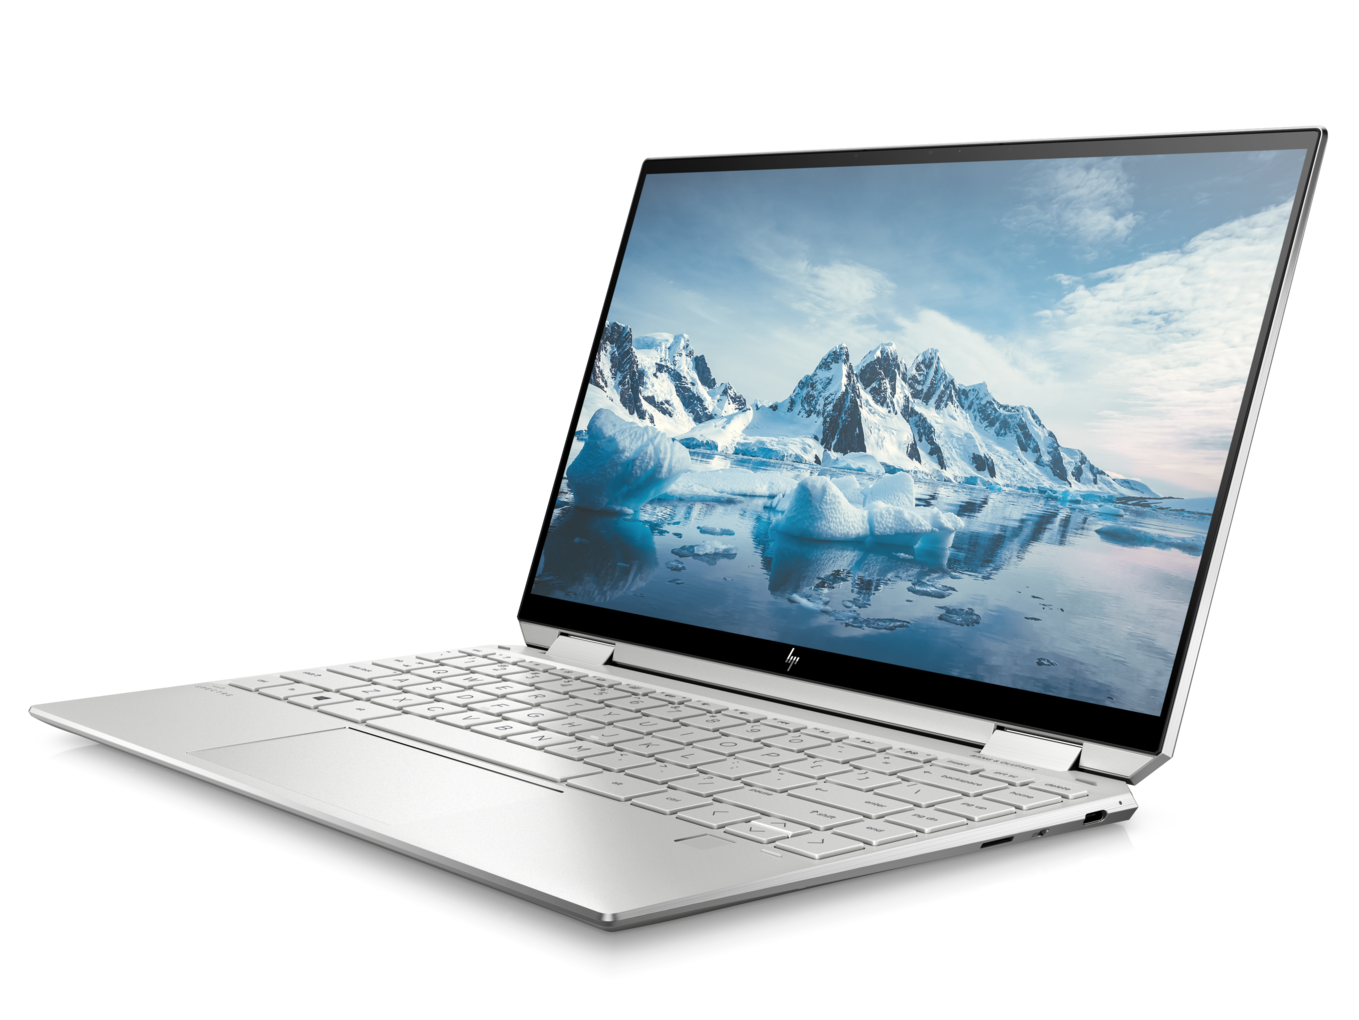
Als je op zoek bent naar een hoogwaardige 13-inch convertible met de nieuwste Intel 10e generatie CPU, dan heb je momenteel twee primaire keuzes: de HP Spectre x360 13 of de Dell XPS 13 7390 2-in-1. De HP voelt sterker in de hand met verwijderbare M.2-opslag, grotere batterij, optionele WWAN en een full-size USB Type-A-poort - functies die allemaal ontbreken op het Dell-alternatief. Als je deze extra's het meest waardeert, zul je meer waarde uit de Spectre x360 13 halen.
De HP-laptop verliest punten als het gaat om het benutten van de hoogst mogelijke prestaties van de Ice Lake-processor. De fluctuerende CPU-kloksnelheden, GPU-kloksnelheden, ventilatorruis, stroomverbruik en framesnelheden tijdens het gamen zijn een slechte weerspiegeling van wat Intel Ice Lake te bieden heeft. We weten dat de Core i7-1065G7 het beter kan doen, zoals geïllustreerd door de XPS 13 7390 2-in-1 of Yoga C940 en hun consistentere prestatienummers. Het is nog steeds een upgrade van de Whiskey Lake-U Spectre x360 13, vooral in termen van draagbaarheid en schermhelderheid, maar het prestatiesverschil tussen hen is kleiner dan we hadden verwacht.
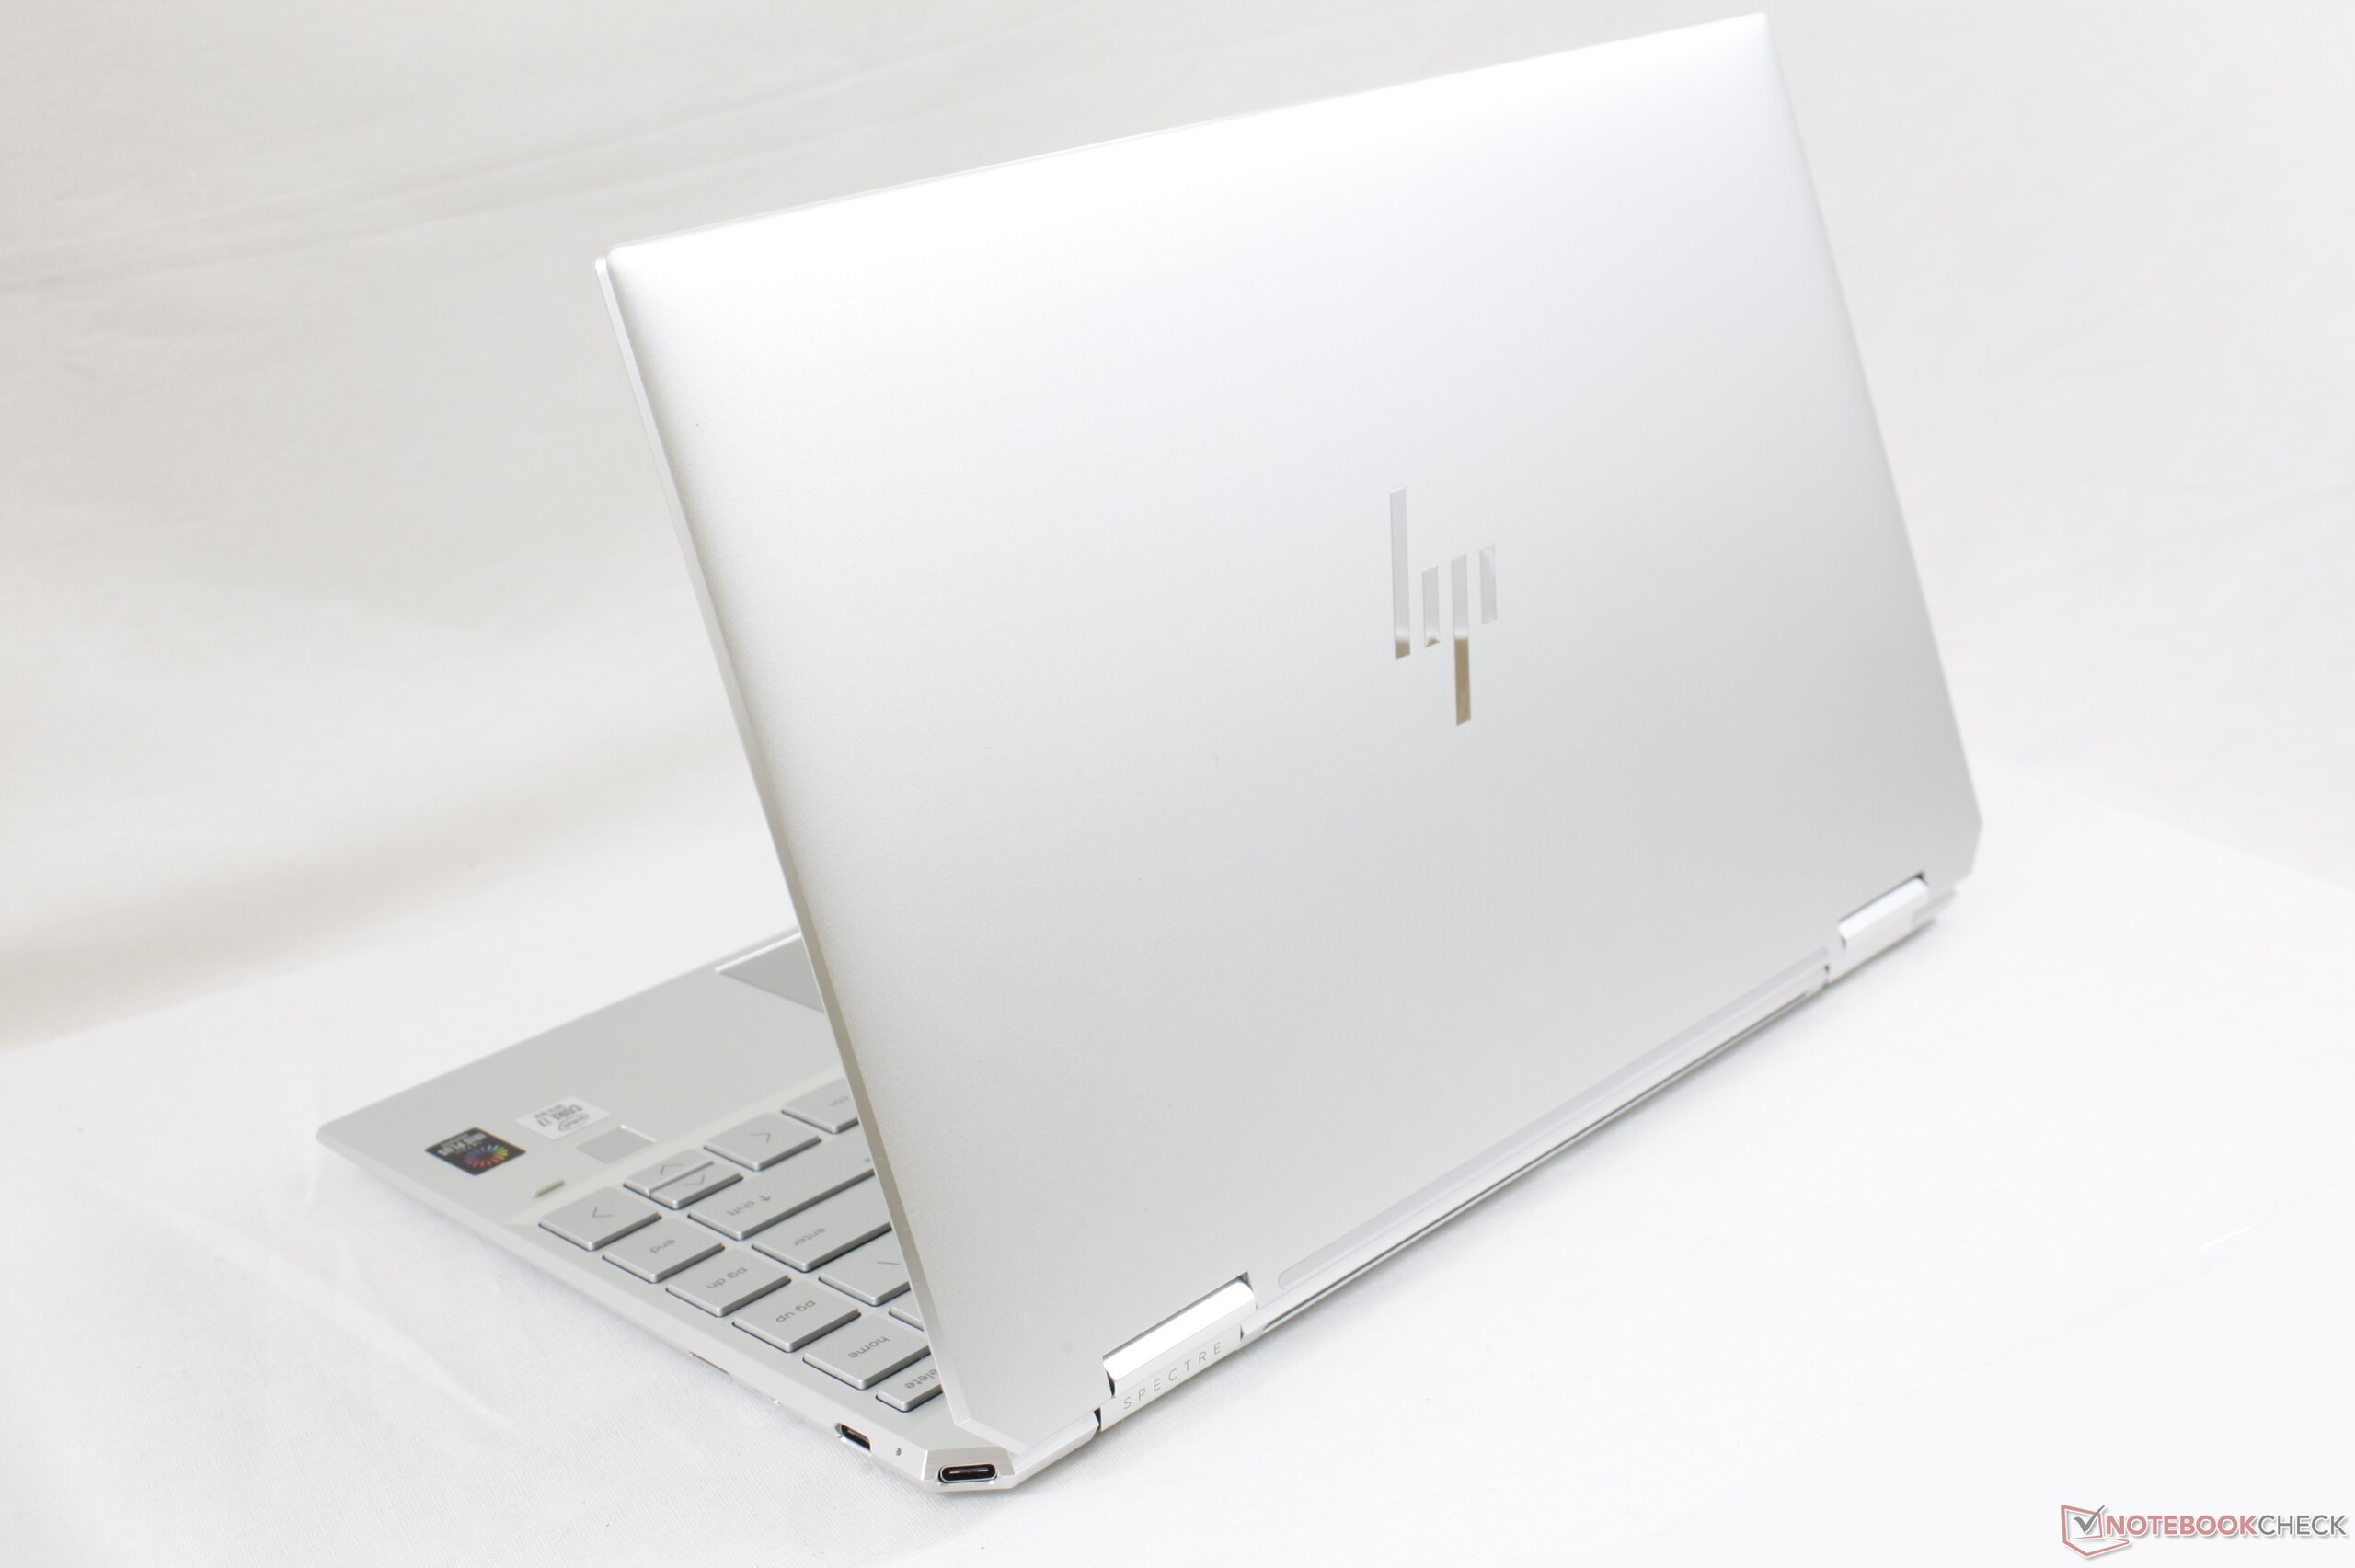
Uitstekende behuizing dat nu nog kleiner is dan voorheen en met meer functies dan de meeste andere converteerbare consumentenproducten. HP's implementatie van Ice Lake is echter ondermaats en zeker een om te vermijden als je een casual gamer bent.
HP Spectre x360 13-aw0013dx
- 27-12-2019 v7 (old)
Allen Ngo
Price comparison
