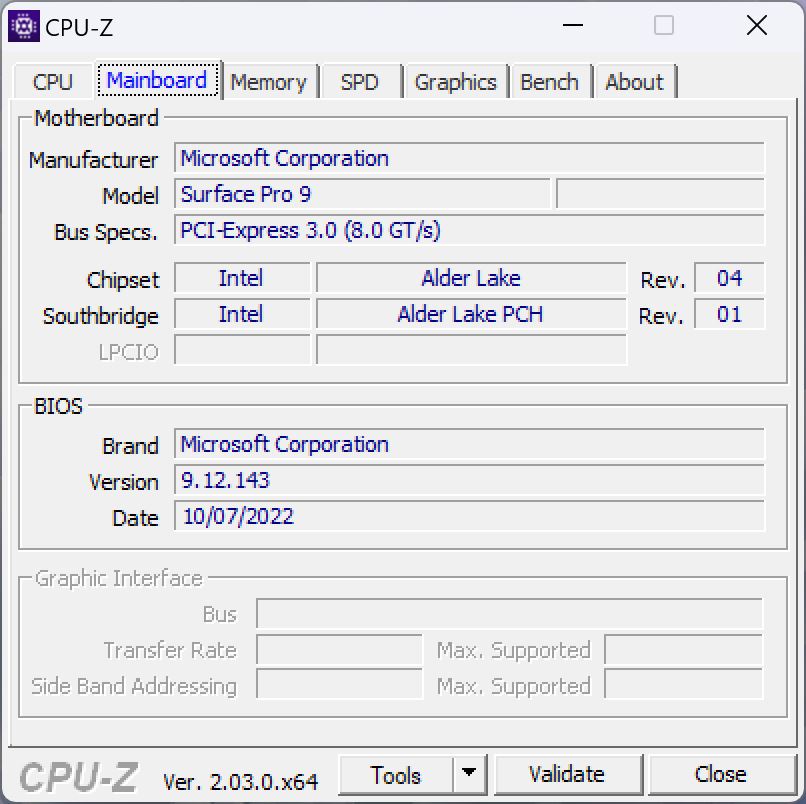
Microsoft Surface Pro 9 review: Convertible nu met aanzienlijk meer CPU-kracht
Microsoft heeft een aantal wijzigingen doorgevoerd in zijn Surface-producten, want de vorige Surface Pro X ARM-tablet is niet langer een zelfstandig product en gaat voortaan verder onder de naam Surface Pro 9. Dat betekent dat er nu twee varianten van de Surface Pro 9 zijn, namelijk eentje met een reguliere Intel-processor (vanaf US$989,00) en de andere met een ARM-chip (US$1357,12), die ook 5G-connectiviteit ondersteunt. We zullen binnenkort ook de nieuwe ARM-variant met de Microsoft SQ3 Adreno 8CX Gen3 reviewen, maar de Surface Pro 9 met zijn Alder Lake-U-processor is ons eerste testonderwerp voor vandaag.
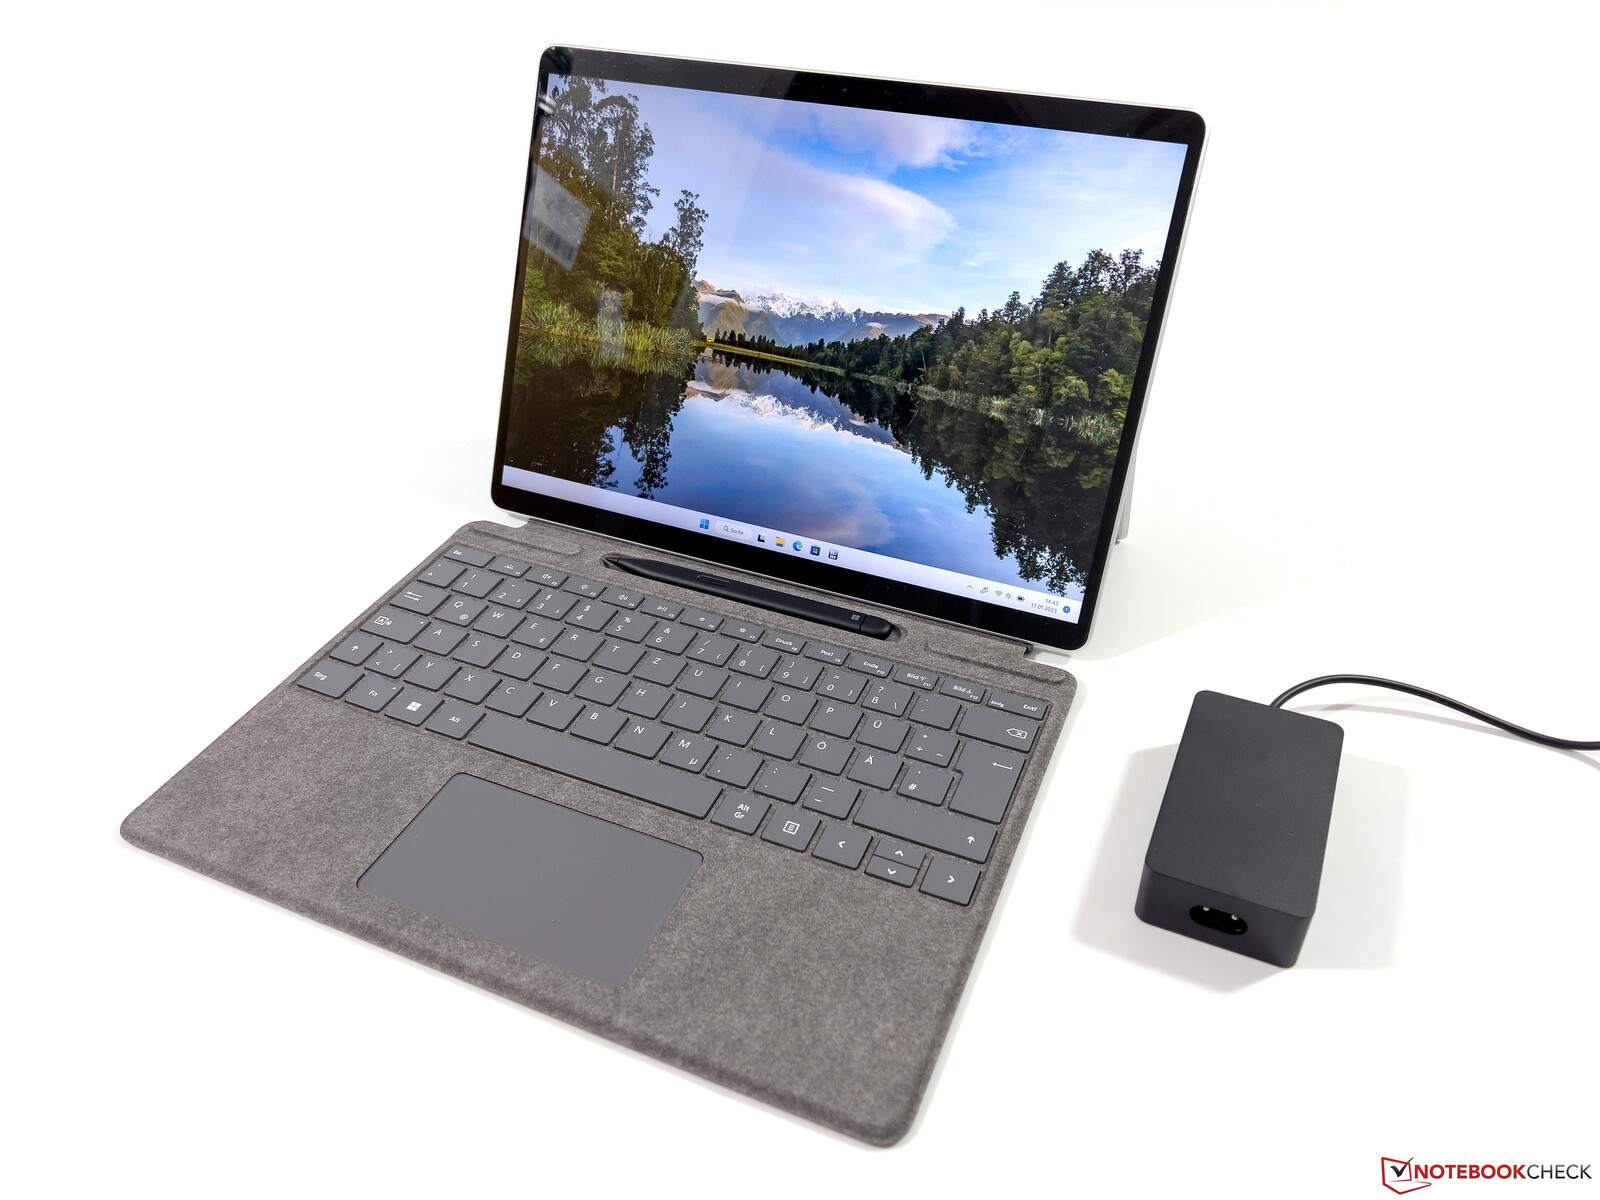
Ons recensie-exemplaar is de top CPU-variant met een Core i7 1255U, 16 GB RAM en 512 GB PCIe-SSD. In deze configuratie kost de convertible US$1.879,99, hoewel je nog eens ~US$300 moet rekenen voor het Signature Keyboard en de Surface Slim Pen 2. Een aantal online retailers (afhankelijk van je locatie) kan dergelijke bundels goedkoper aanbieden - onze bundel is bijvoorbeeld verkrijgbaar vanaf EUR 2130 (~US$2320). Een andere verandering betreft de zakelijke versie van de Surface Pro 9, die ook niet langer beschikbaar is met een WWAN-module in de Intel-variant.
Afgezien van de nieuwe Alder Lake-processor, de bijgewerkte WLAN-module en de verwijdering van de audio-aansluiting zijn er geen grote technische wijzigingen, noch aan de Surface Pro zelf, noch aan de invoerapparaten. Voor meer informatie verwijzen we naar onze reviews van eerdere Surface Pro-modellen:
Potentiële concurrenten in vergelijking
Evaluatie | Datum | Model | Gewicht | Hoogte | Formaat | Resolutie | Beste prijs |
|---|---|---|---|---|---|---|---|
| 88.4 % v7 (old) | 01-2023 | Microsoft Surface Pro 9, i7-1255U i7-1255U, Iris Xe G7 96EUs | 877 g | 9.3 mm | 13.00" | 2880x1920 | |
| 90.1 % v7 (old) | 11-2022 | Dell XPS 13 9315 2-in-1 Core i5-1230U i5-1230U, Iris Xe G7 80EUs | 764 g | 7.4 mm | 13.00" | 2880x1920 | |
| 88.5 % v7 (old) | 04-2021 | Lenovo ThinkPad X12 20UVS03G00 i7-1160G7, Iris Xe G7 96EUs | 1.1 kg | 14.5 mm | 12.30" | 1920x1280 | |
| 90.3 % v7 (old) | 12-2022 | HP Elite Dragonfly Folio 13.5 G3 i7-1265U, Iris Xe G7 96EUs | 1.4 kg | 17.8 mm | 13.50" | 1920x1280 | |
| 91.8 % v7 (old) | 11-2022 | Apple iPad Pro 12.9 2022 M2, M2 10-Core GPU | 682 g | 6.4 mm | 12.90" | 2732x2048 | |
| 86.8 % v7 (old) | 03-2022 | Asus ROG Flow Z13 GZ301ZE i9-12900H, GeForce RTX 3050 Ti Laptop GPU | 1.2 kg | 12 mm | 13.40" | 1920x1200 |
Zaak - Kleine wijzigingen aan de cabriolet
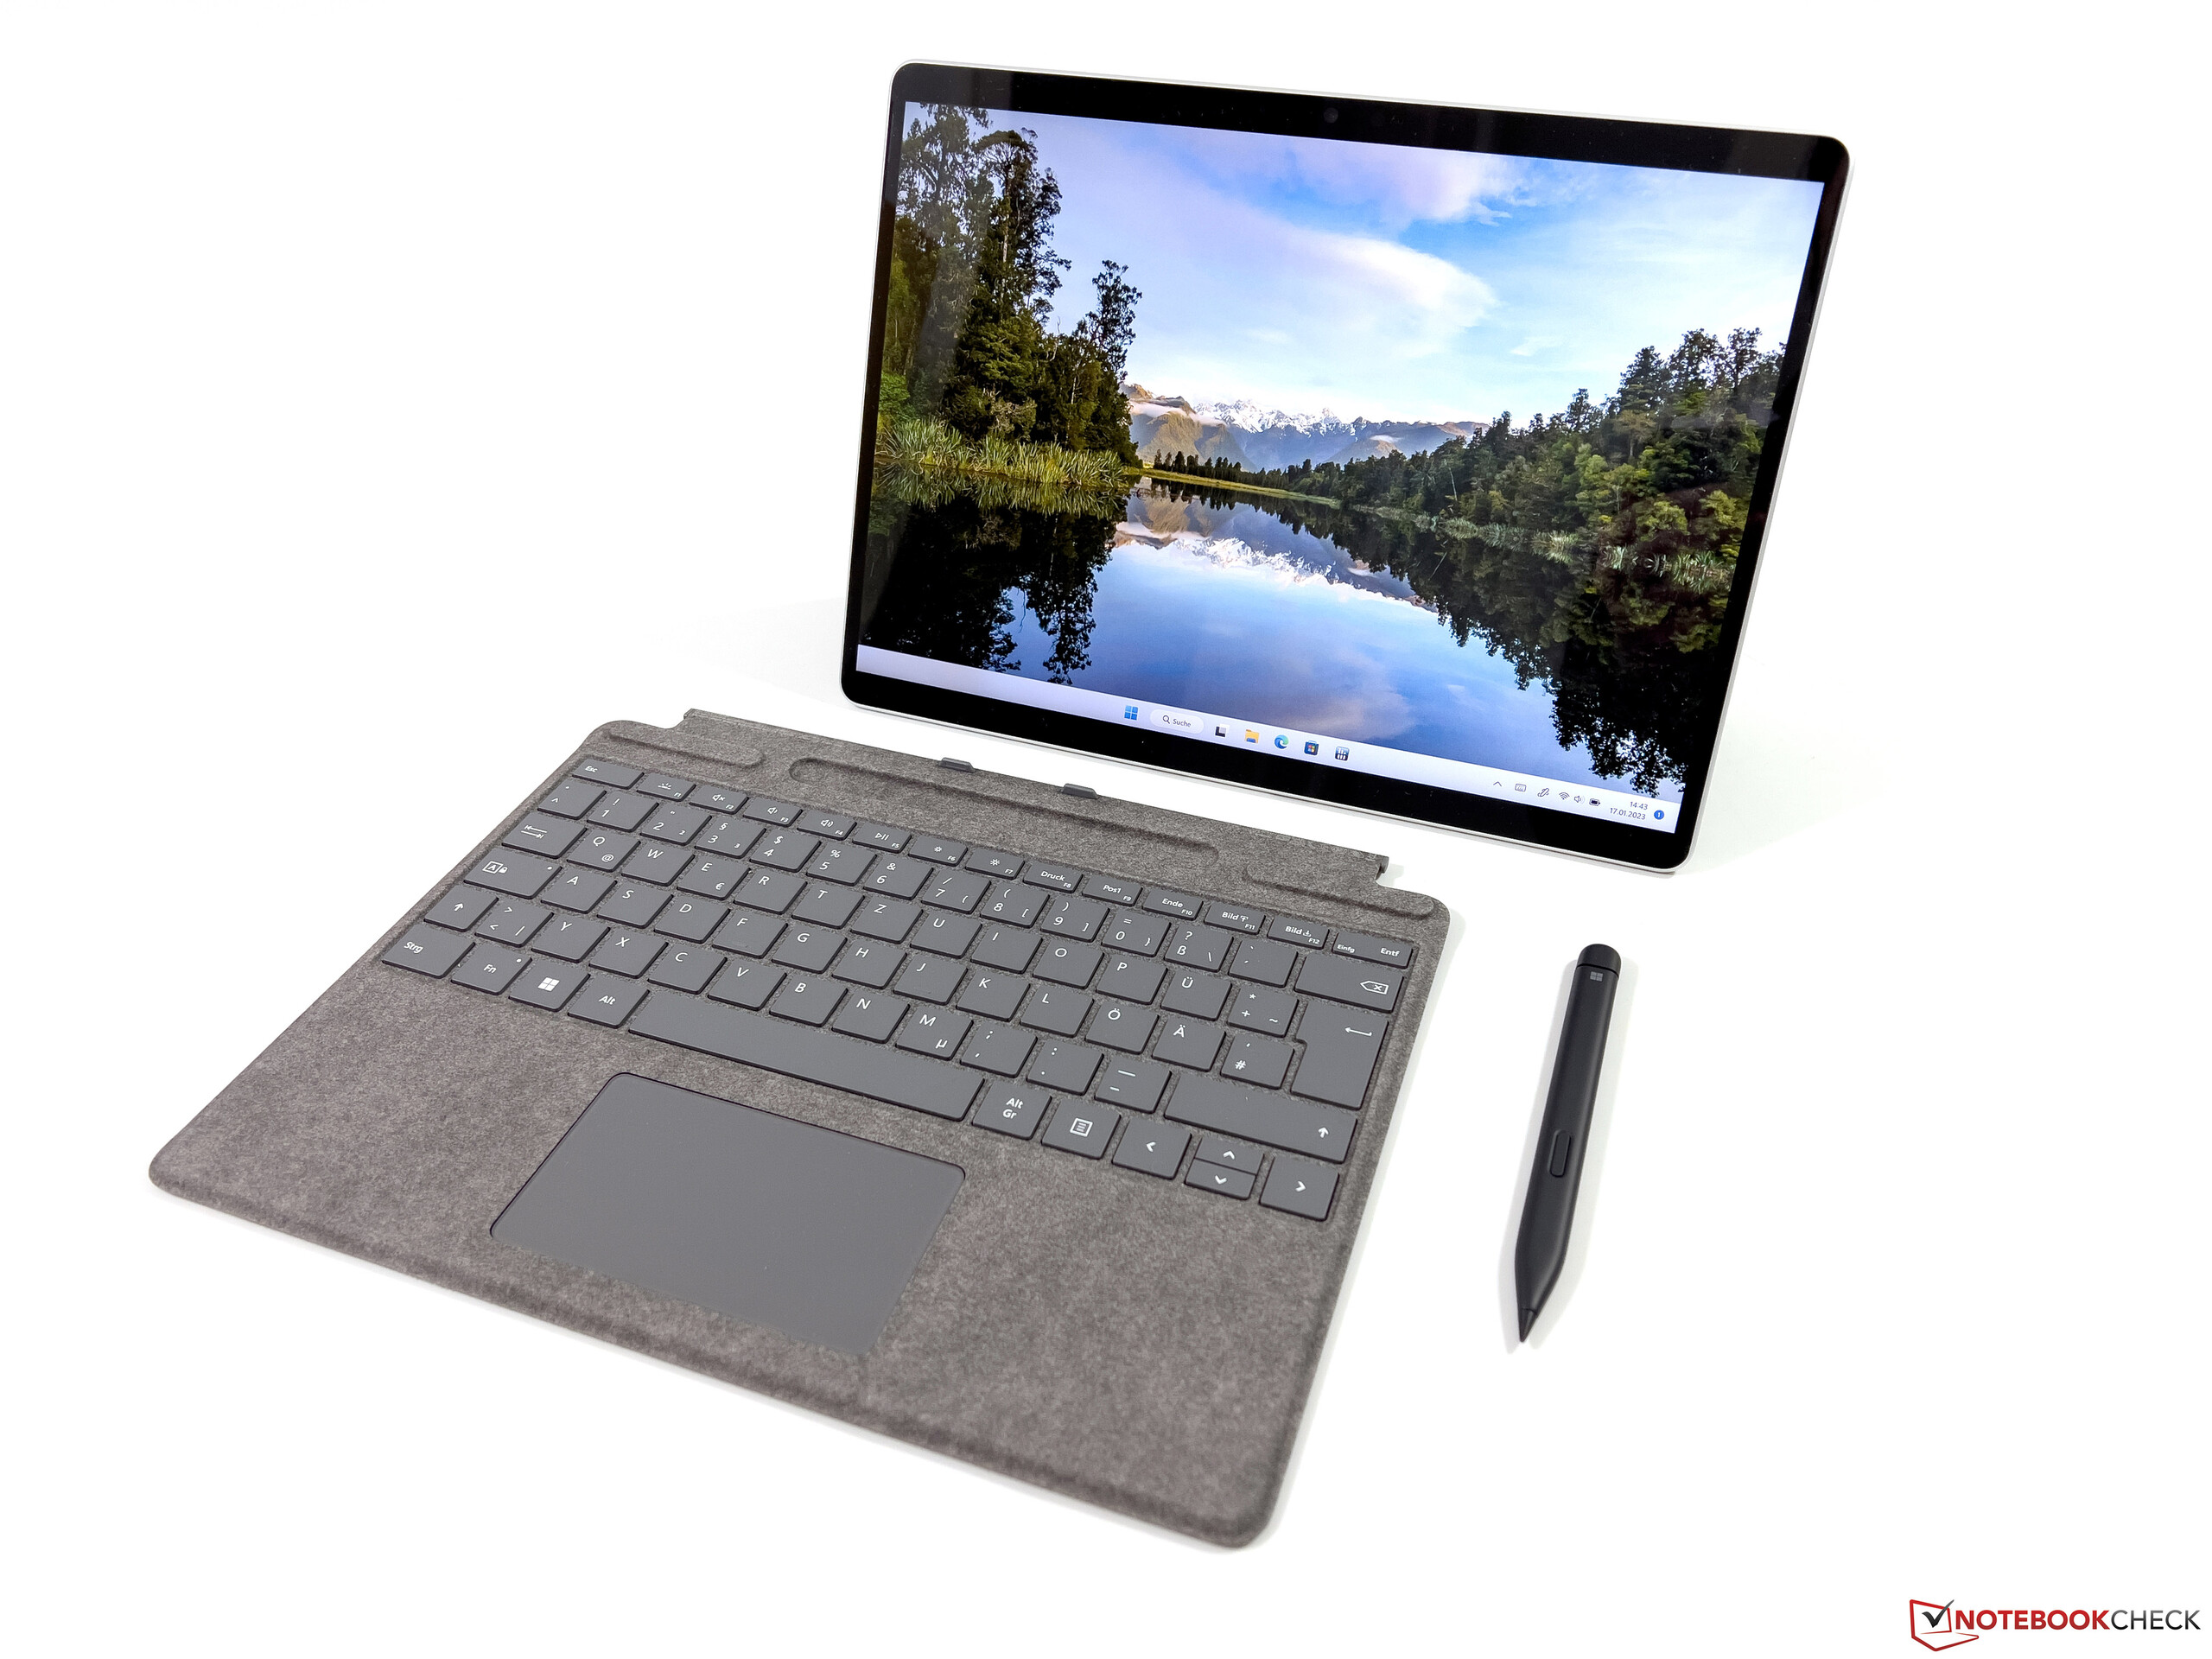
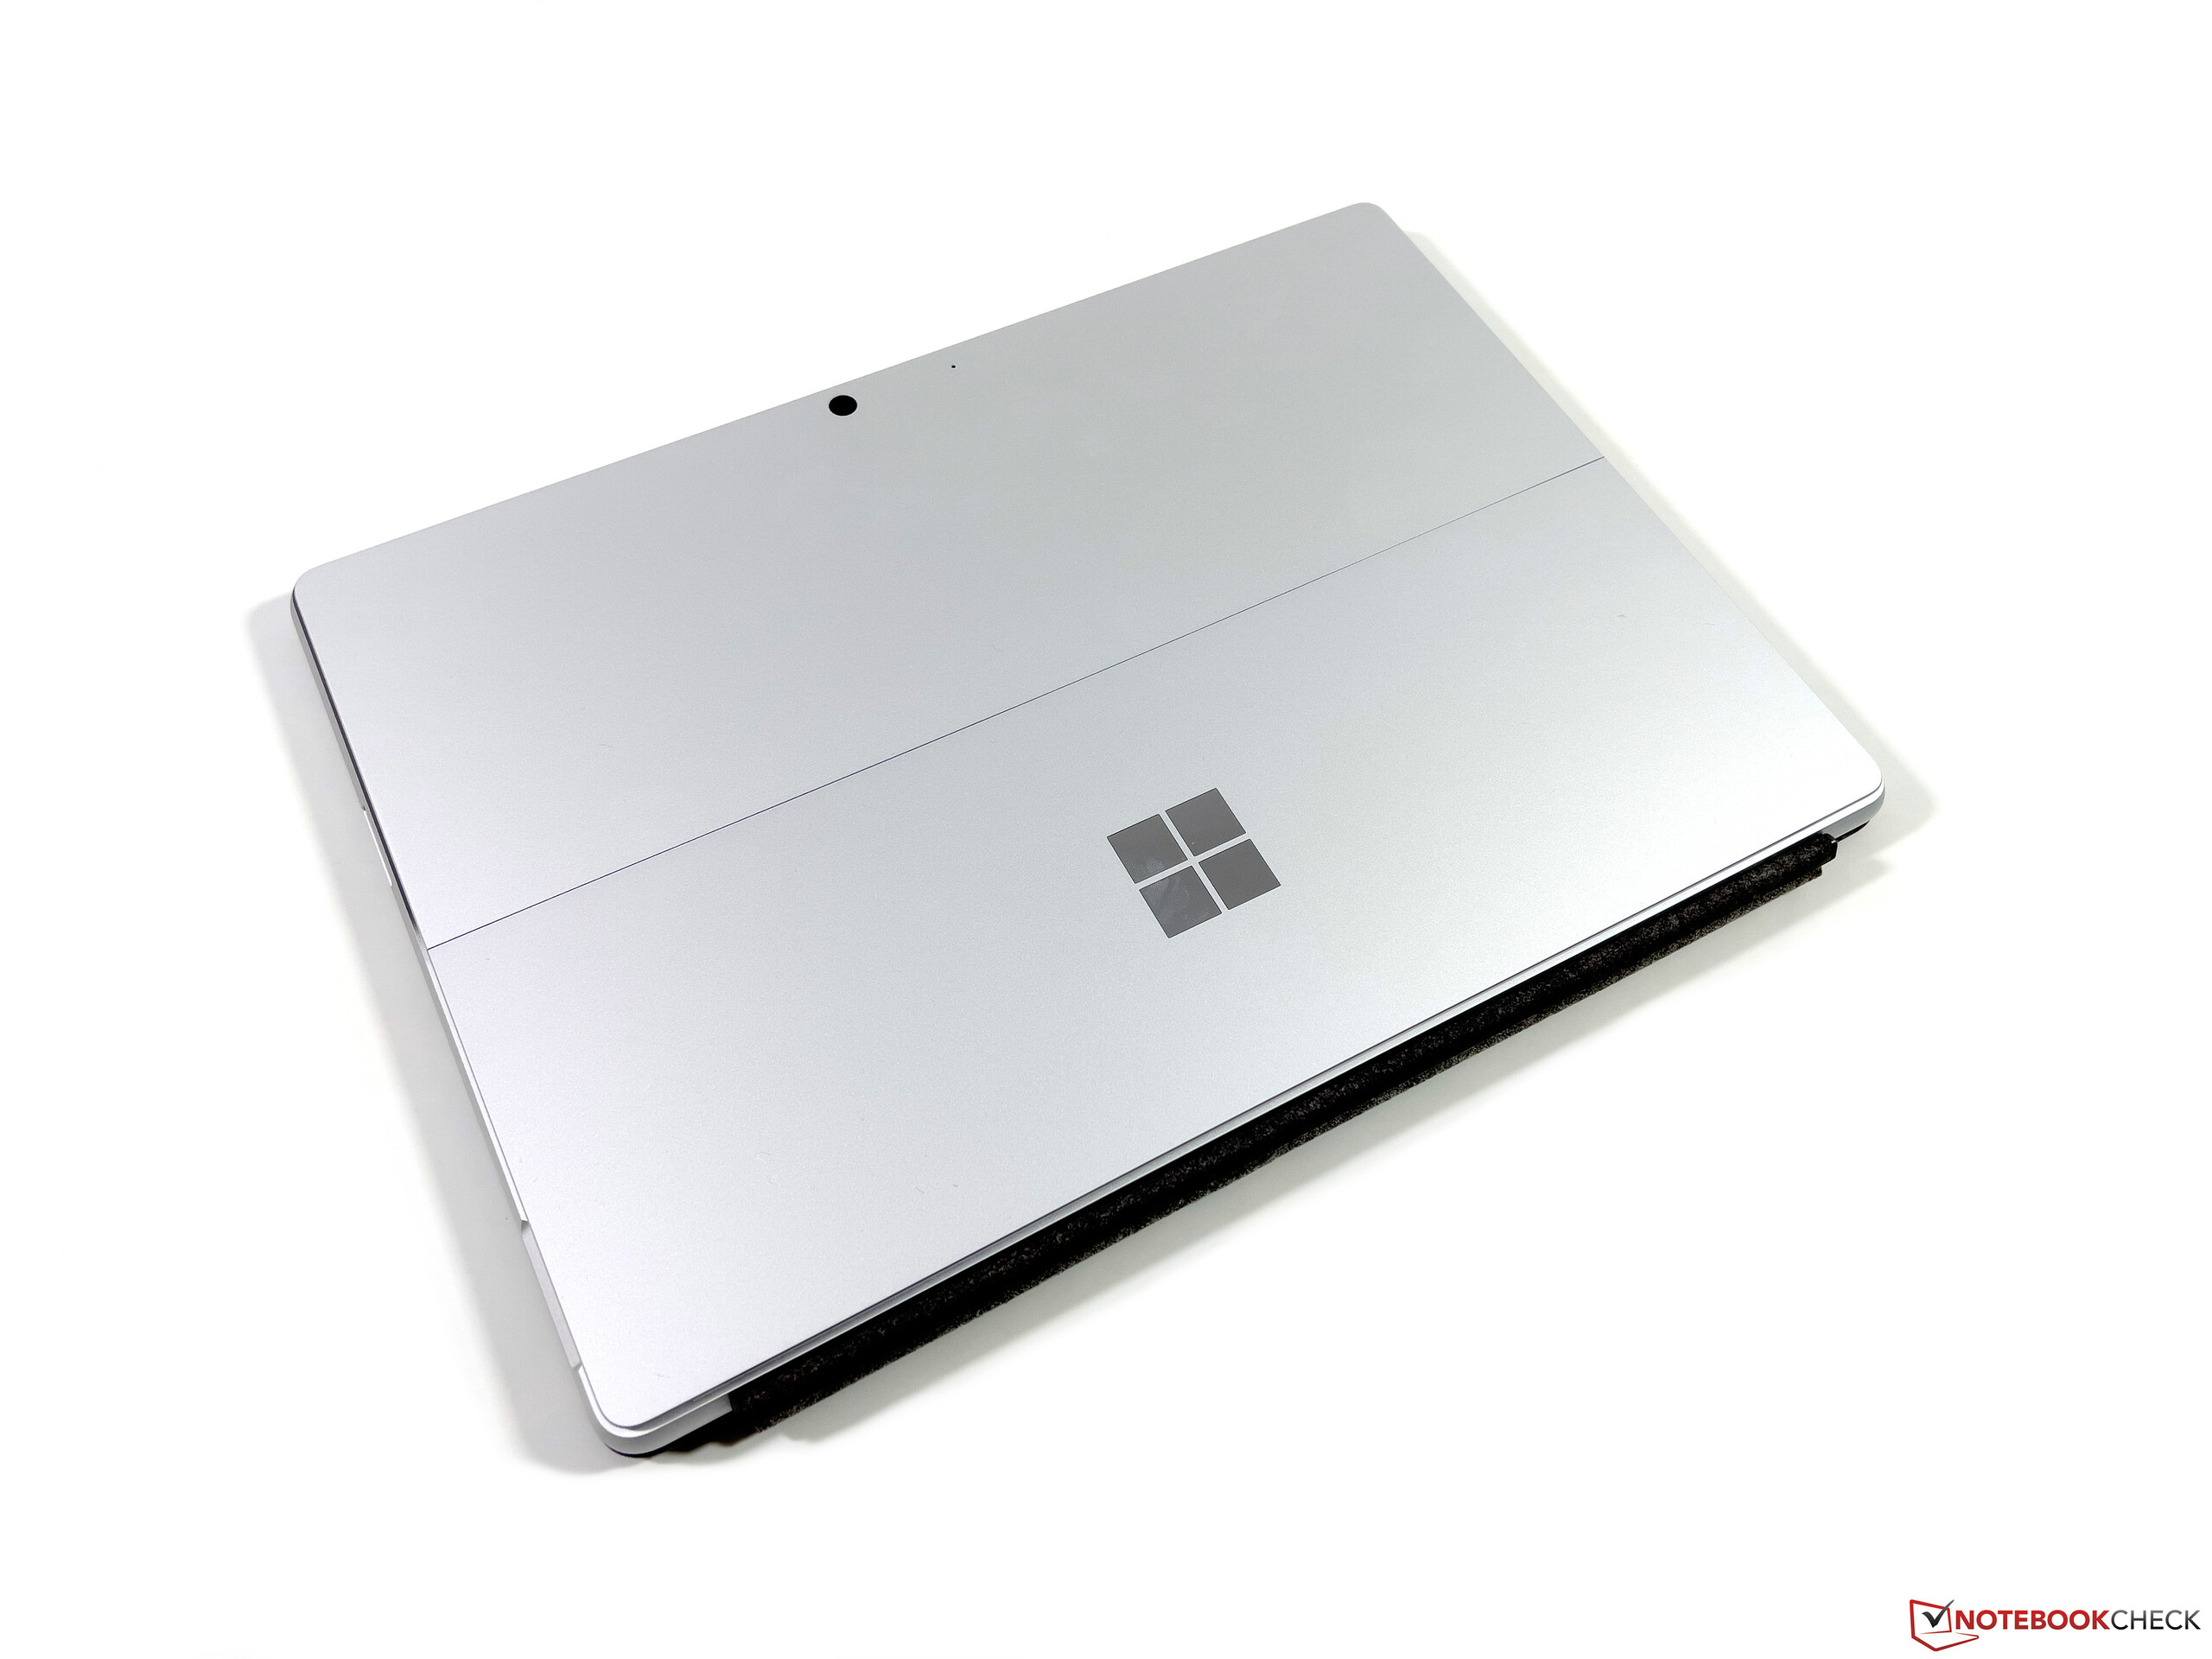
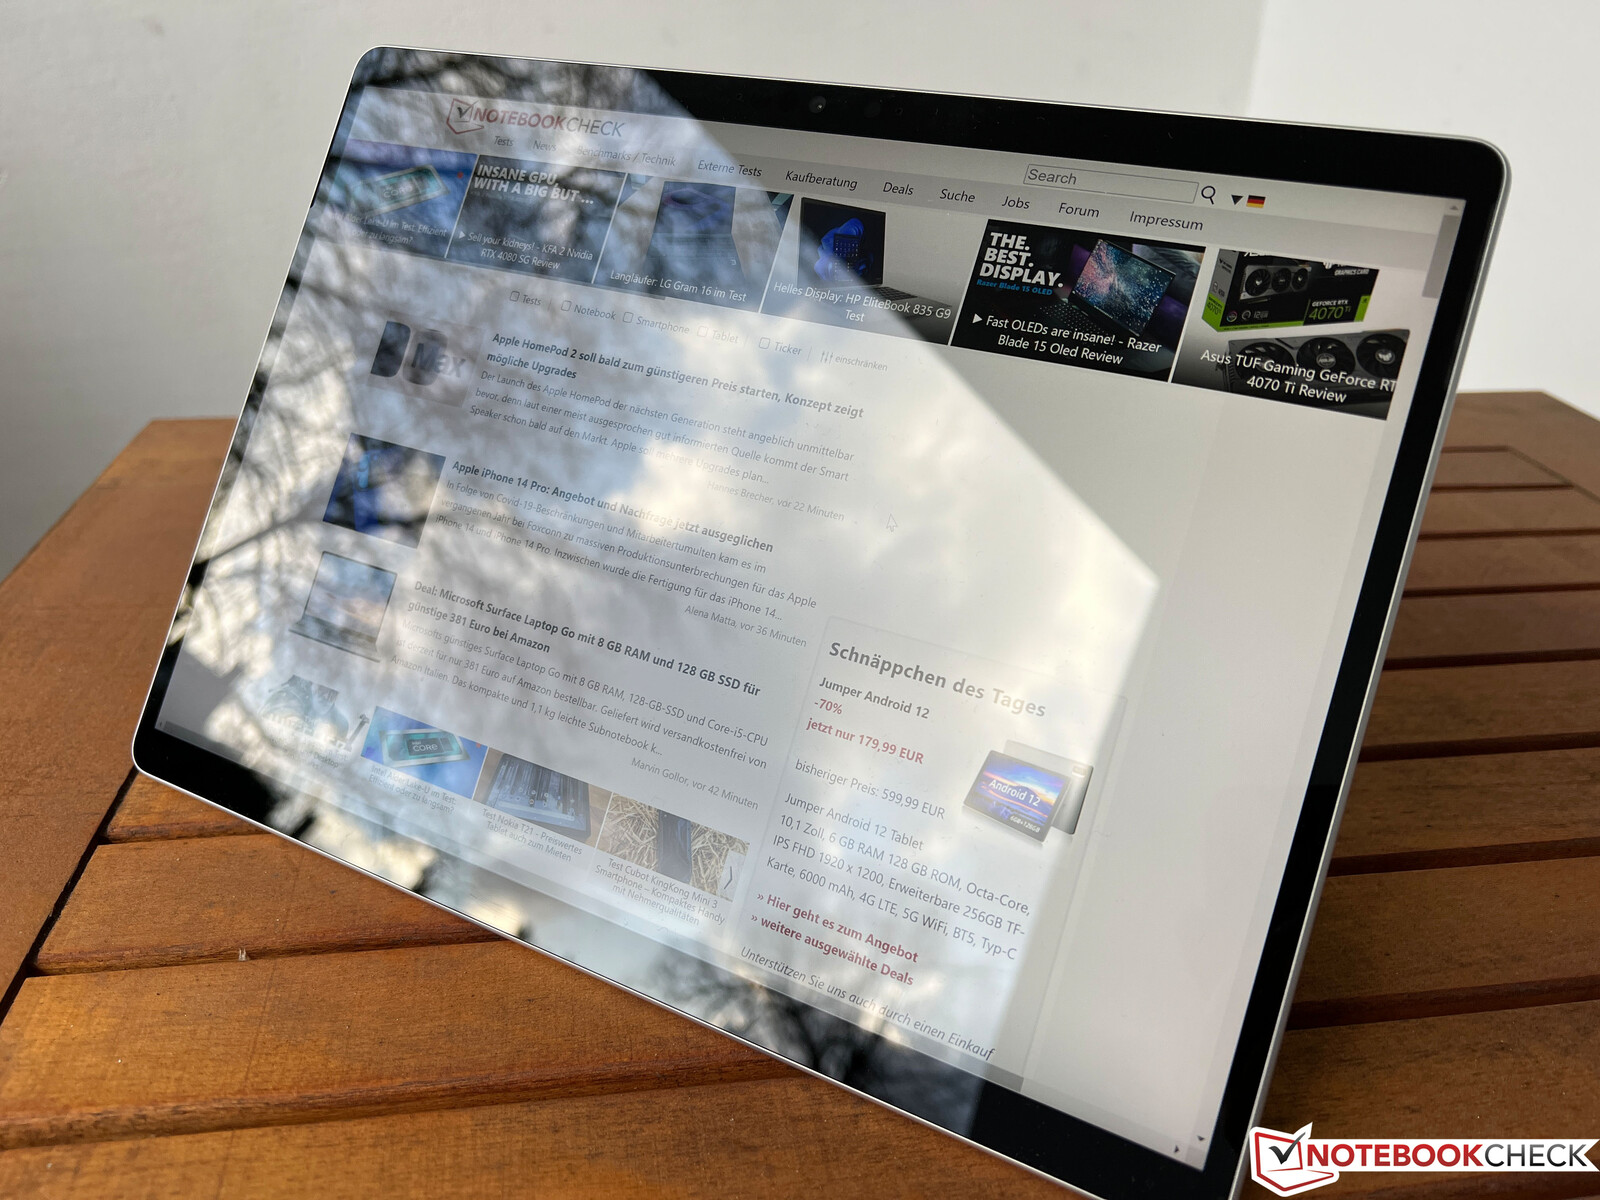
Op het eerste gezicht is er niets veranderd aan de behuizing van de Surface Pro 9, afgezien van de nieuwe indeling van de poorten. Het gewicht verschilt enigszins, dus er zijn waarschijnlijk ook kleine wijzigingen aangebracht in de interne lay-out. Microsoft biedt de convertible aan in vier verschillende kleuren, gaande van het zilver (platin) van ons reviewtoestel, saffierblauw, bosgroen tot grafiet (donkergrijs). Het ARM-model is daarentegen alleen beschikbaar in platin.
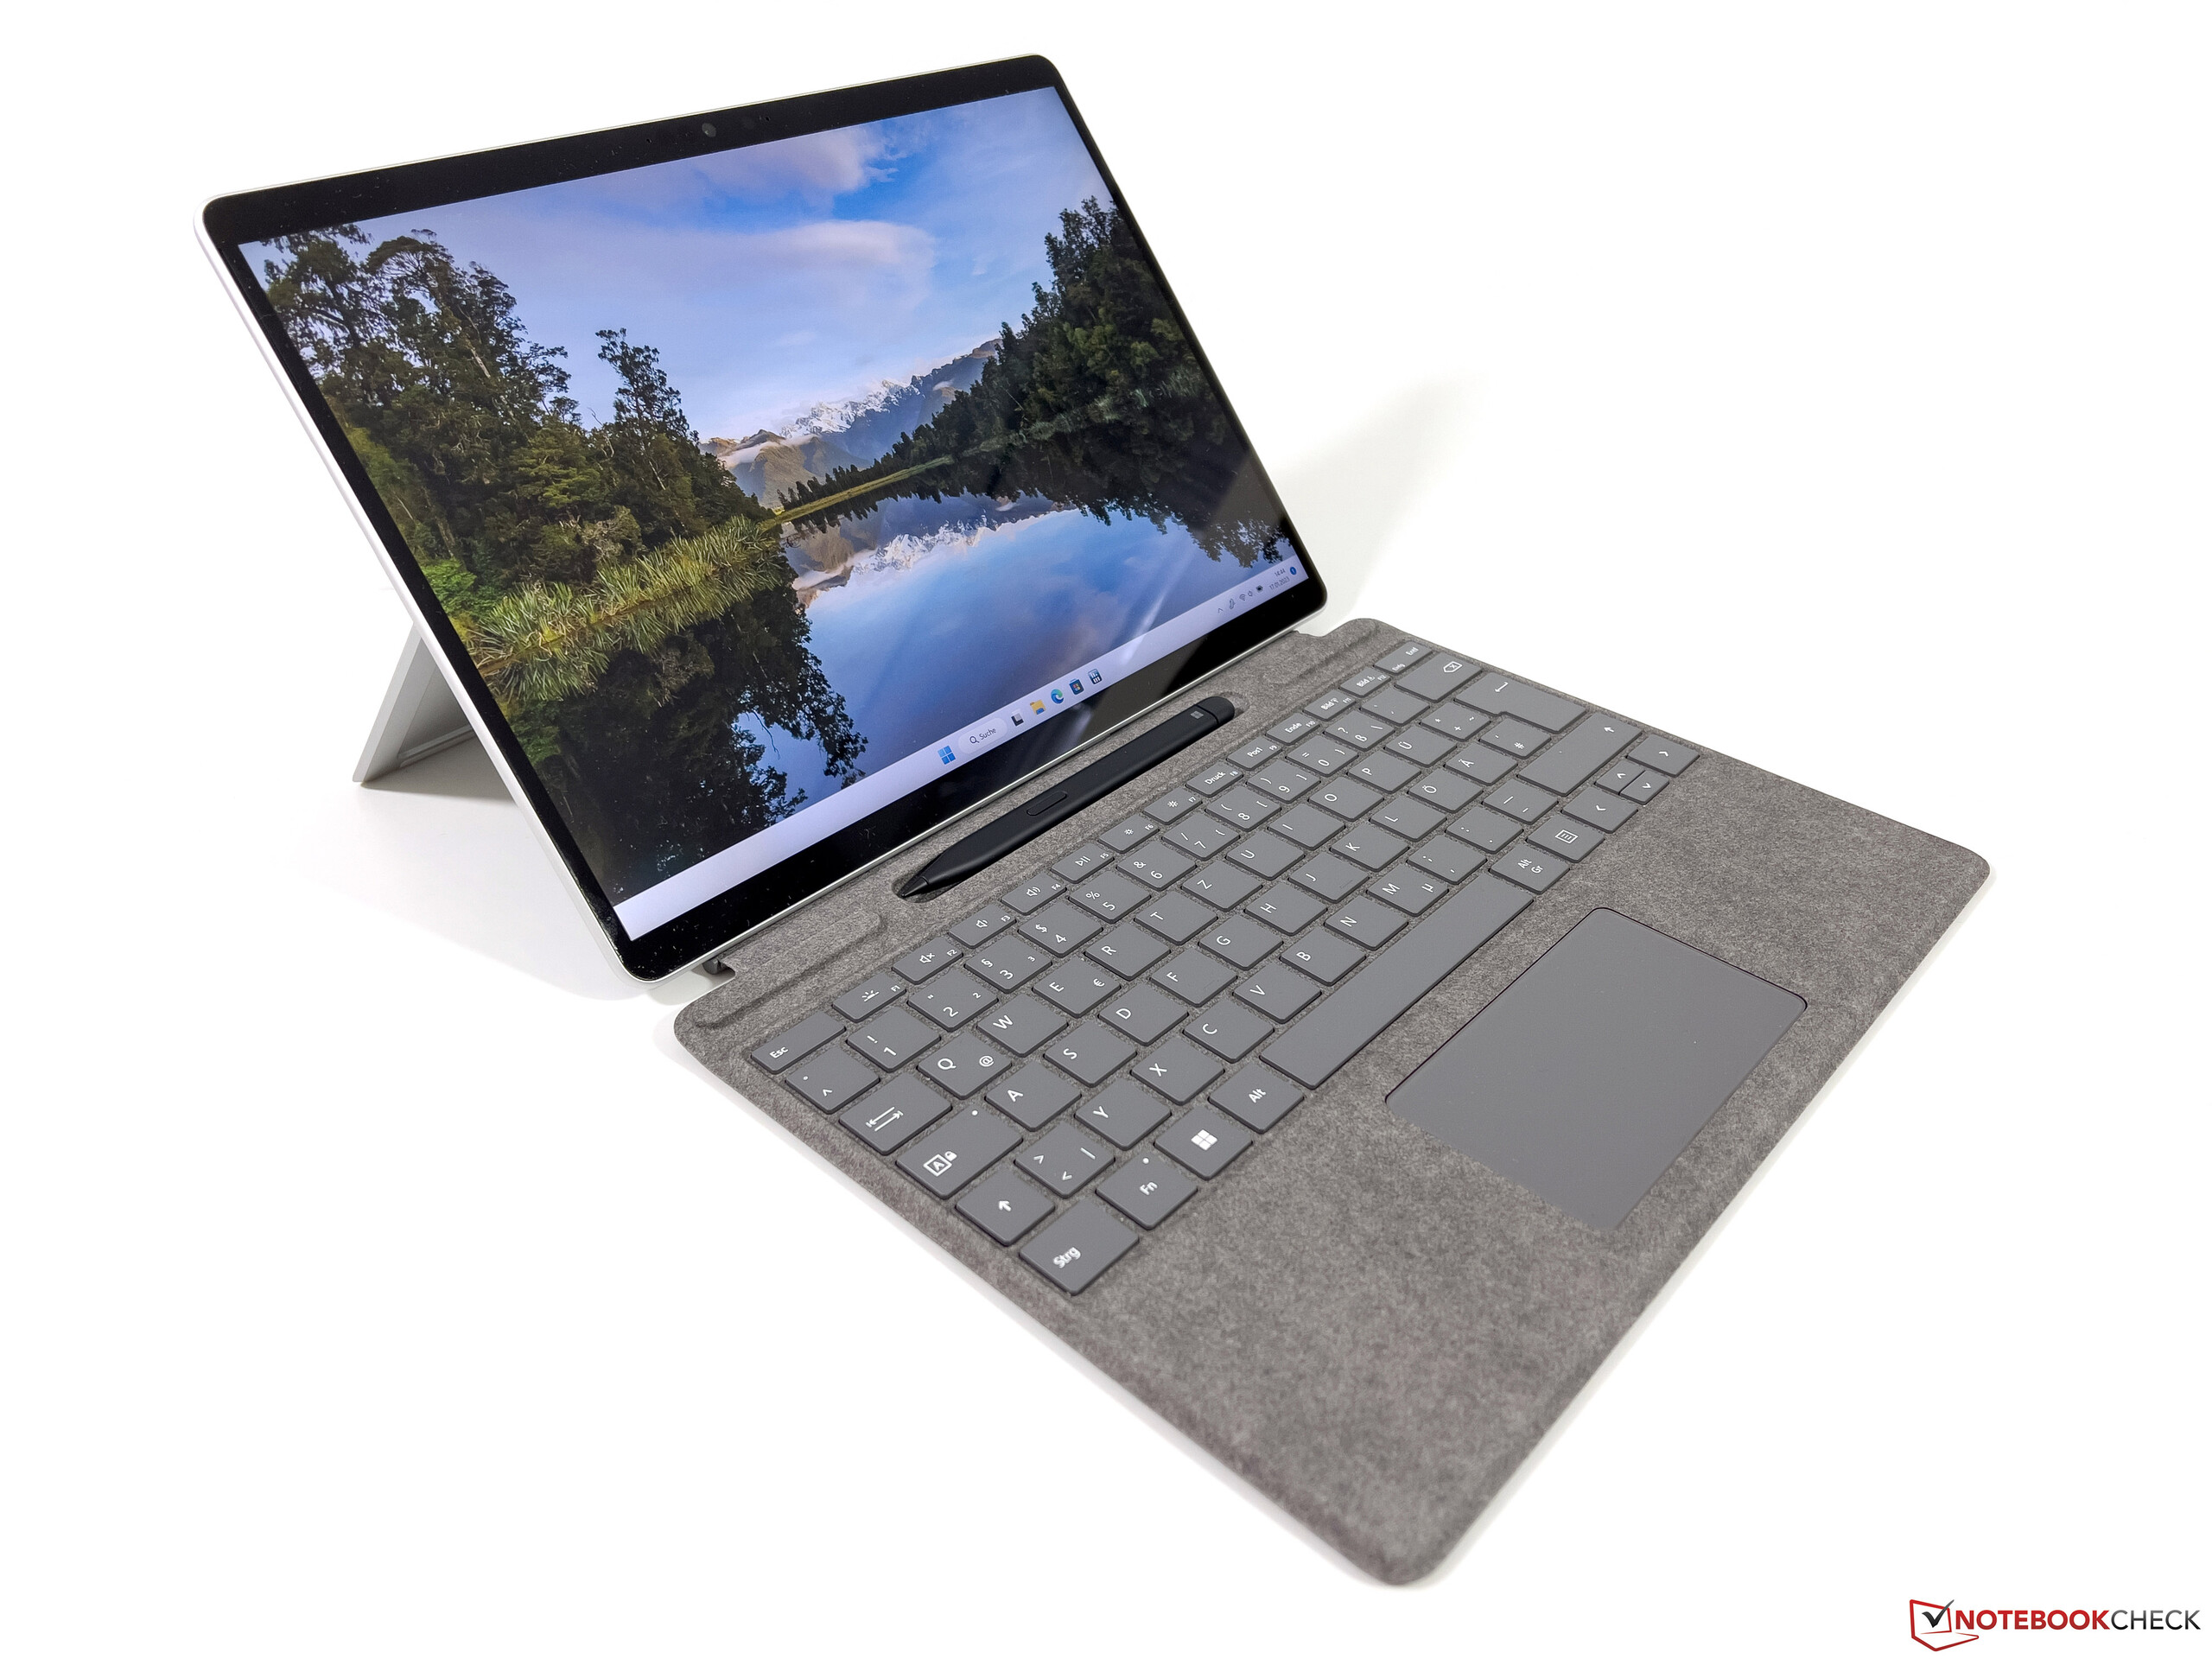
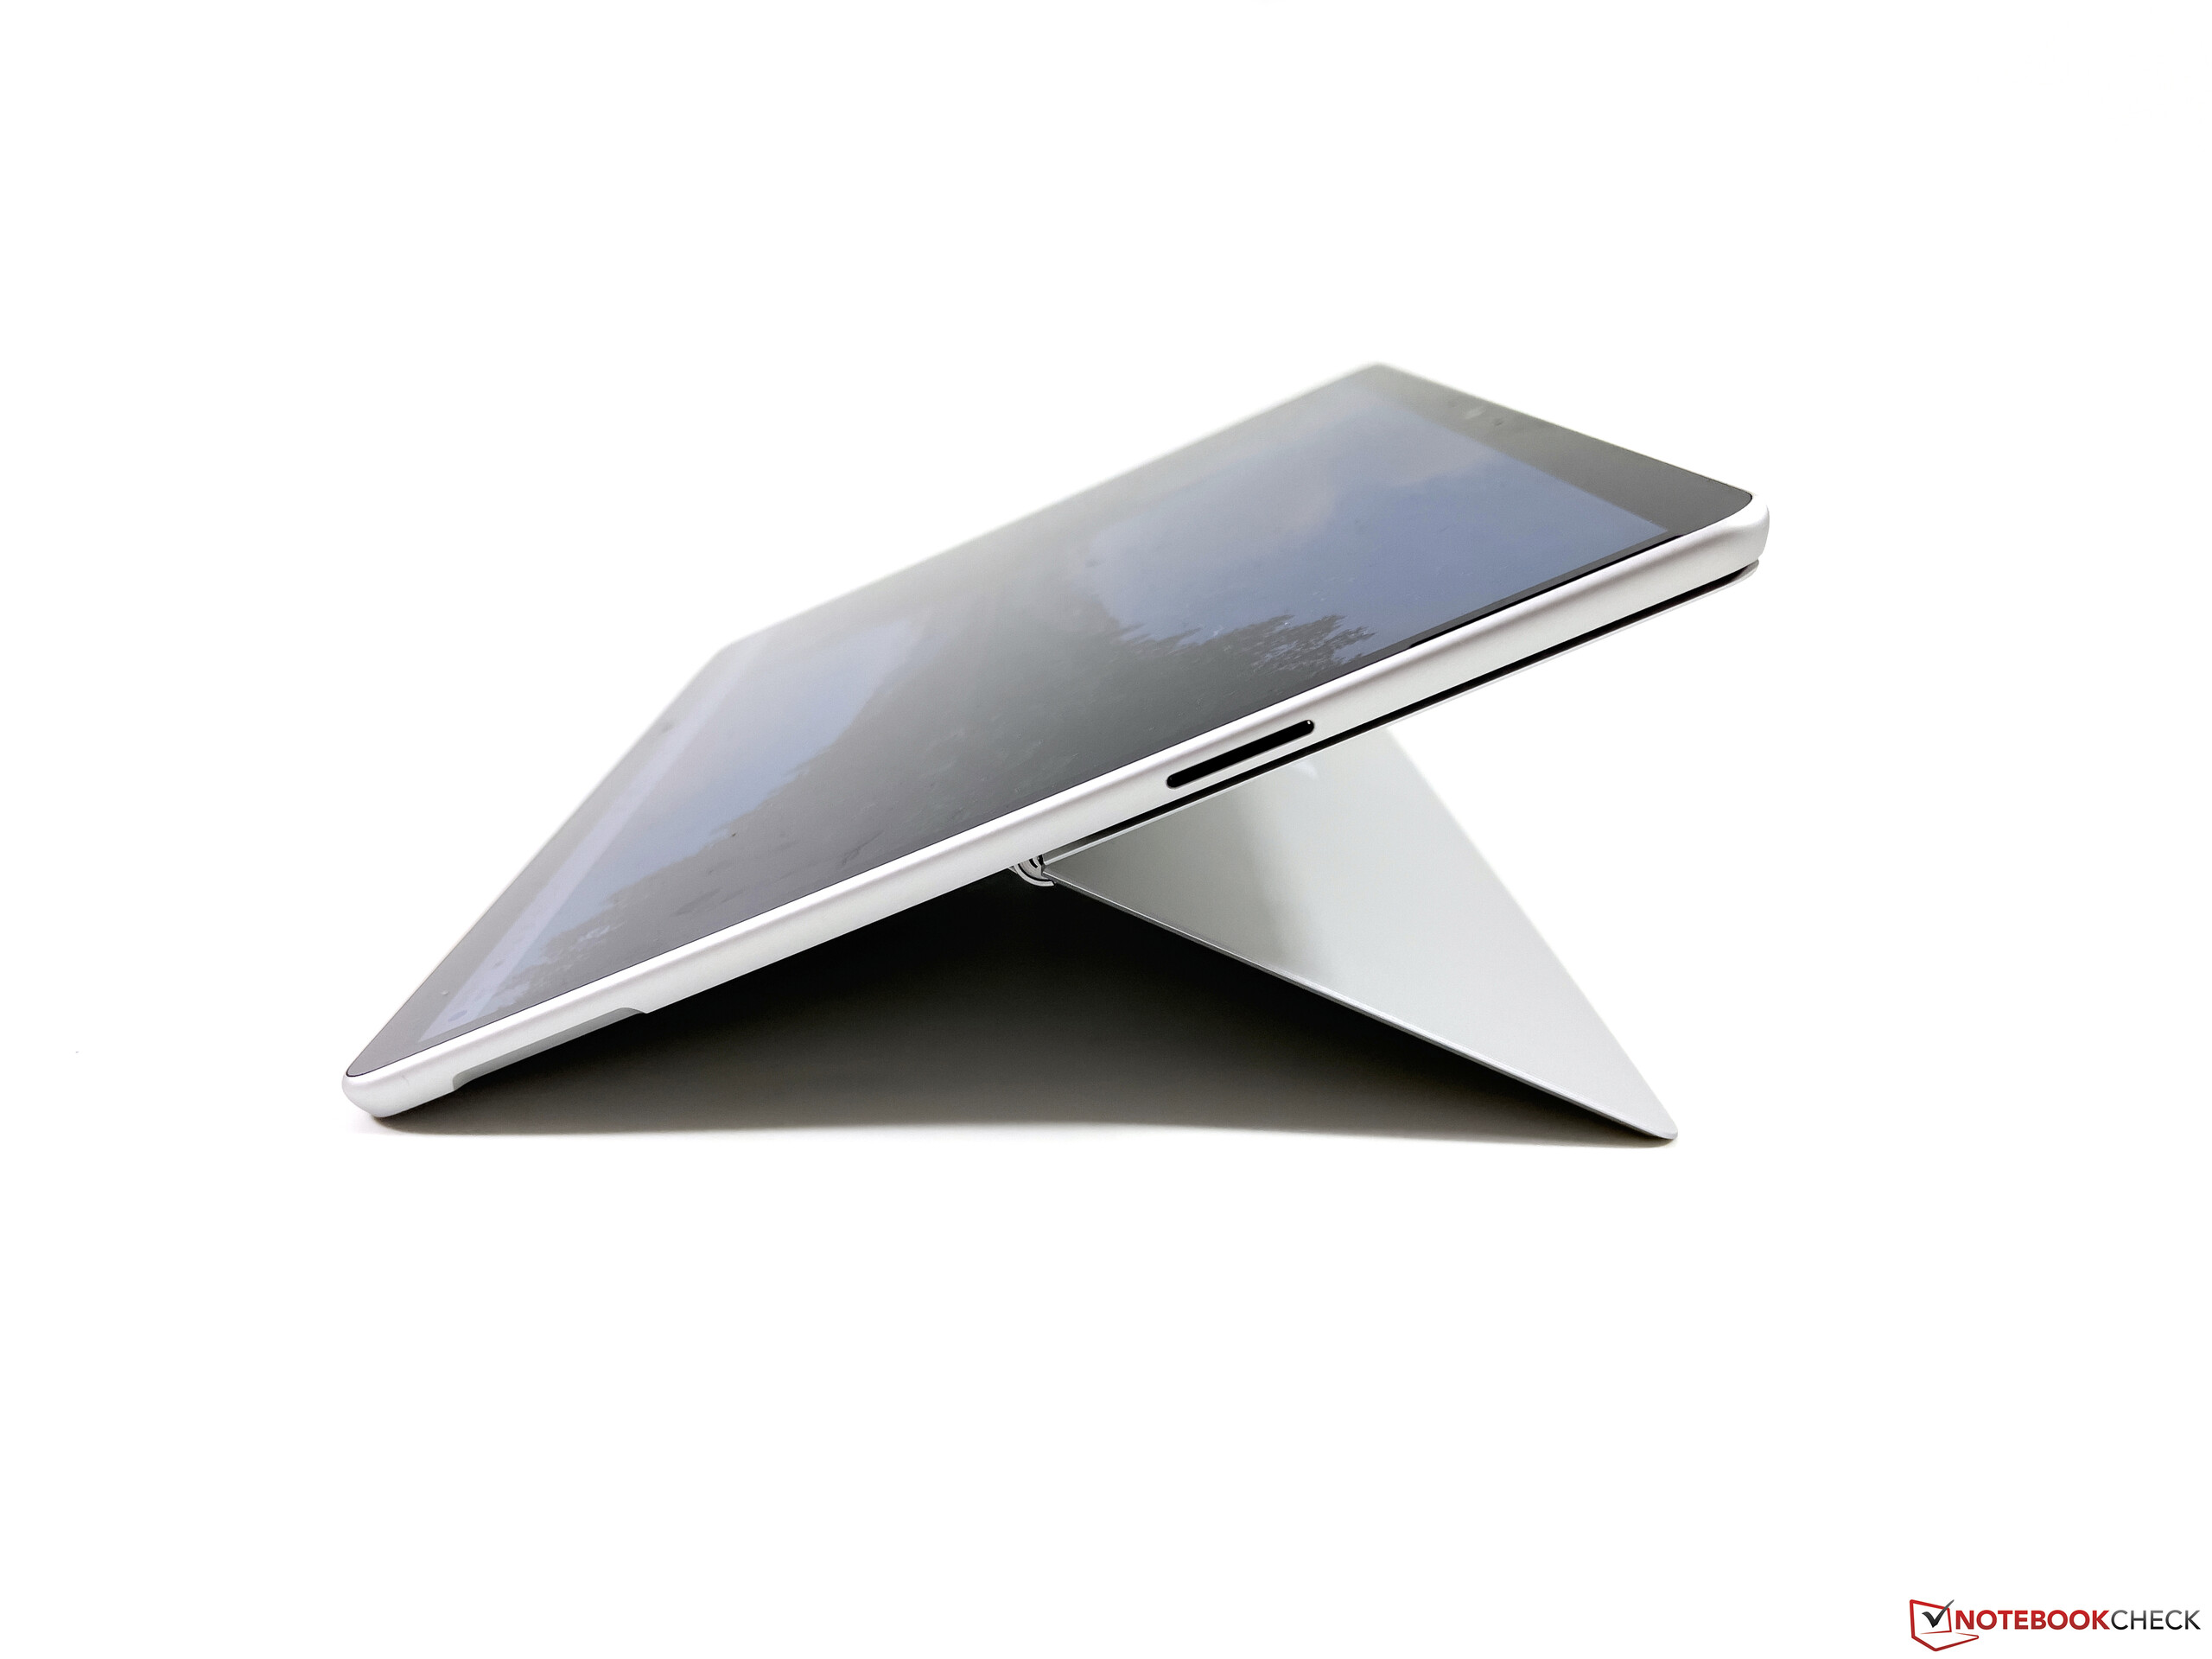
De bouwkwaliteit is zoals voorheen uitstekend en de aluminium behuizing is uiterst stevig. Er zijn geen krakende geluiden of beeldvervormingen, hoewel de geïntegreerde kickstand een zwak punt blijft. De case is erg dun, waardoor de randen snel in de huid drukken als je de Surface Pro 9 bijvoorbeeld op je dijen plaatst. De standaard is ook erg flexibel en de scharnieren doen hun werk altijd goed.
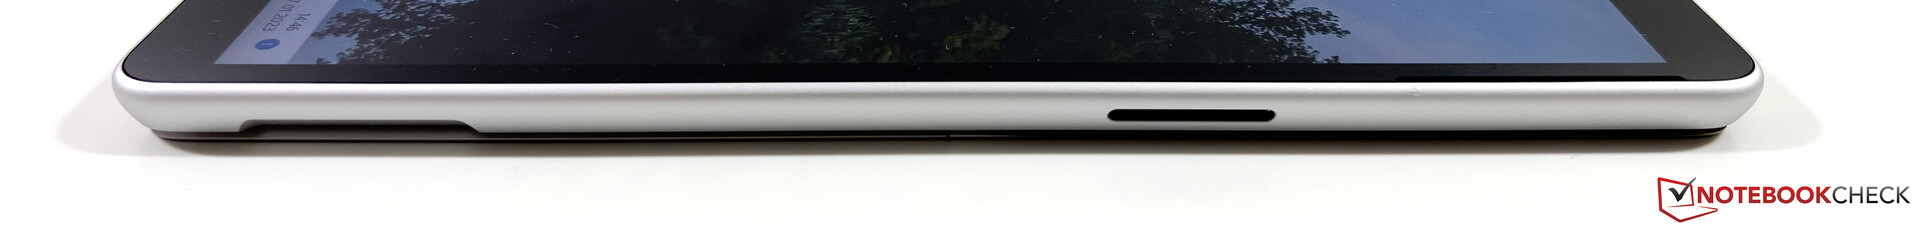
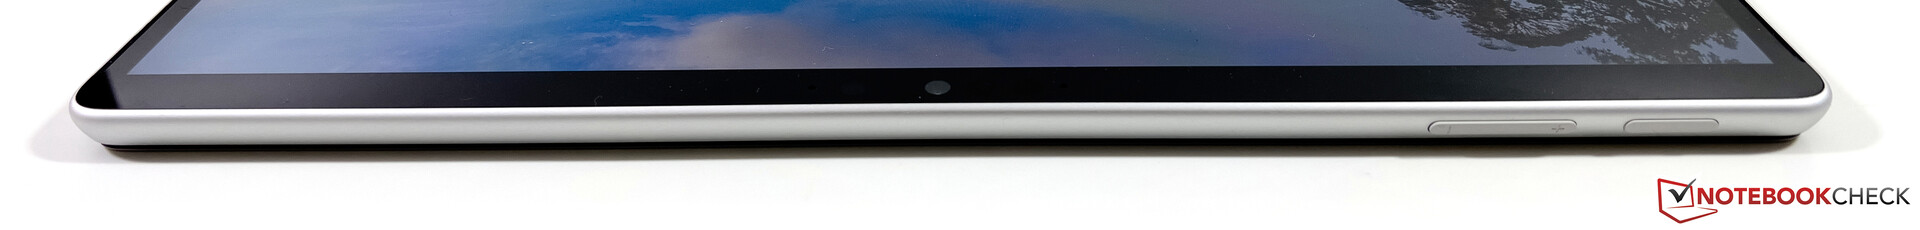
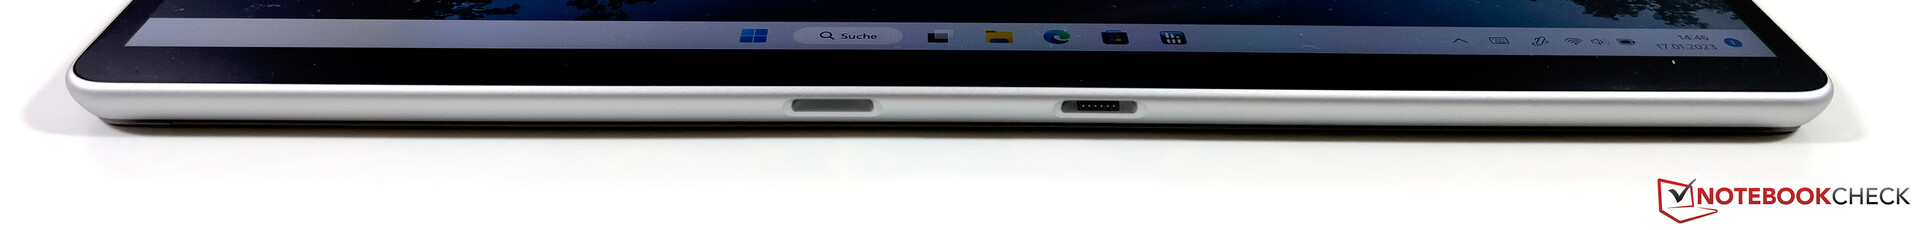
Apparatuur - Surface Pro met Thunderbolt 4
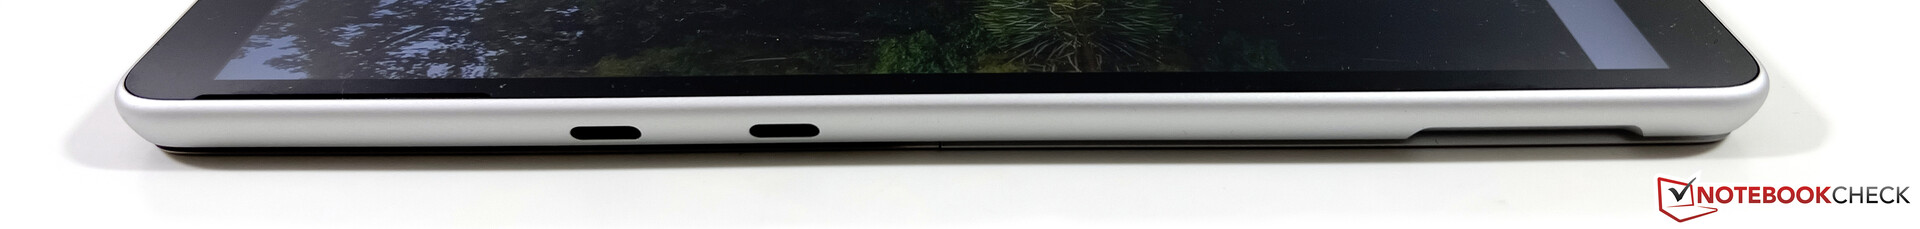
De poorten zijn verplaatst en de 2x USB-C-poorten (inclusief Thunderbolt 4) en de eigen Surface Connect-poort blijven bestaan, maar Microsoft heeft de 3,5 mm-aansluiting verwijderd. De bijbehorende voedingsadapter maakt gebruik van de Surface Connect-poort, maar de convertible kan ook via USB-C worden opgeladen. Enigszins teleurstellend is het nog steeds ontbreken van een kaartlezer, die in het vorige model was vervangen door het optionele Nano SIM-slot. Aangezien het Intel-model nu niet meer wordt geleverd met een WWAN-module, had Microsoft gemakkelijk opnieuw een micro SD-kaartlezer kunnen inbouwen.
Communicatie
Zoals eerder vermeld biedt alleen de ARM-variant van de Surface Pro 9 mobiel internet, terwijl de Intel-versie dat niet doet. In ieder geval is de WLAN module bijgewerkt en wordt de moderne WiFi 6E standaard nu ondersteund dankzij de AX211 module van Intel. We konden zonder problemen verbinding maken met het 6 GHZ netwerk van onze Asus referentie router, waarbij de overdrachtssnelheden zeer hoog en stabiel bleken te zijn.
| Networking | |
| Microsoft Surface Pro 9, i7-1255U | |
| iperf3 receive AXE11000 6GHz | |
| iperf3 transmit AXE11000 6GHz | |
| Dell XPS 13 9315 2-in-1 Core i5-1230U | |
| iperf3 receive AXE11000 6GHz | |
| iperf3 transmit AXE11000 6GHz | |
| Lenovo ThinkPad X12 20UVS03G00 | |
| iperf3 transmit AX12 | |
| iperf3 receive AX12 | |
| HP Elite Dragonfly Folio 13.5 G3 | |
| iperf3 receive AXE11000 6GHz | |
| iperf3 receive AXE11000 | |
| iperf3 transmit AXE11000 6GHz | |
| iperf3 transmit AXE11000 | |
| Apple iPad Pro 12.9 2022 | |
| iperf3 receive AXE11000 6GHz | |
| iperf3 receive AXE11000 | |
| iperf3 transmit AXE11000 6GHz | |
| iperf3 transmit AXE11000 | |
| Asus ROG Flow Z13 GZ301ZE | |
| iperf3 transmit AX12 | |
| iperf3 receive AX12 | |
| Microsoft Surface Pro 8, i7-1185G7 | |
| iperf3 transmit AX12 | |
| iperf3 receive AX12 | |
Webcam
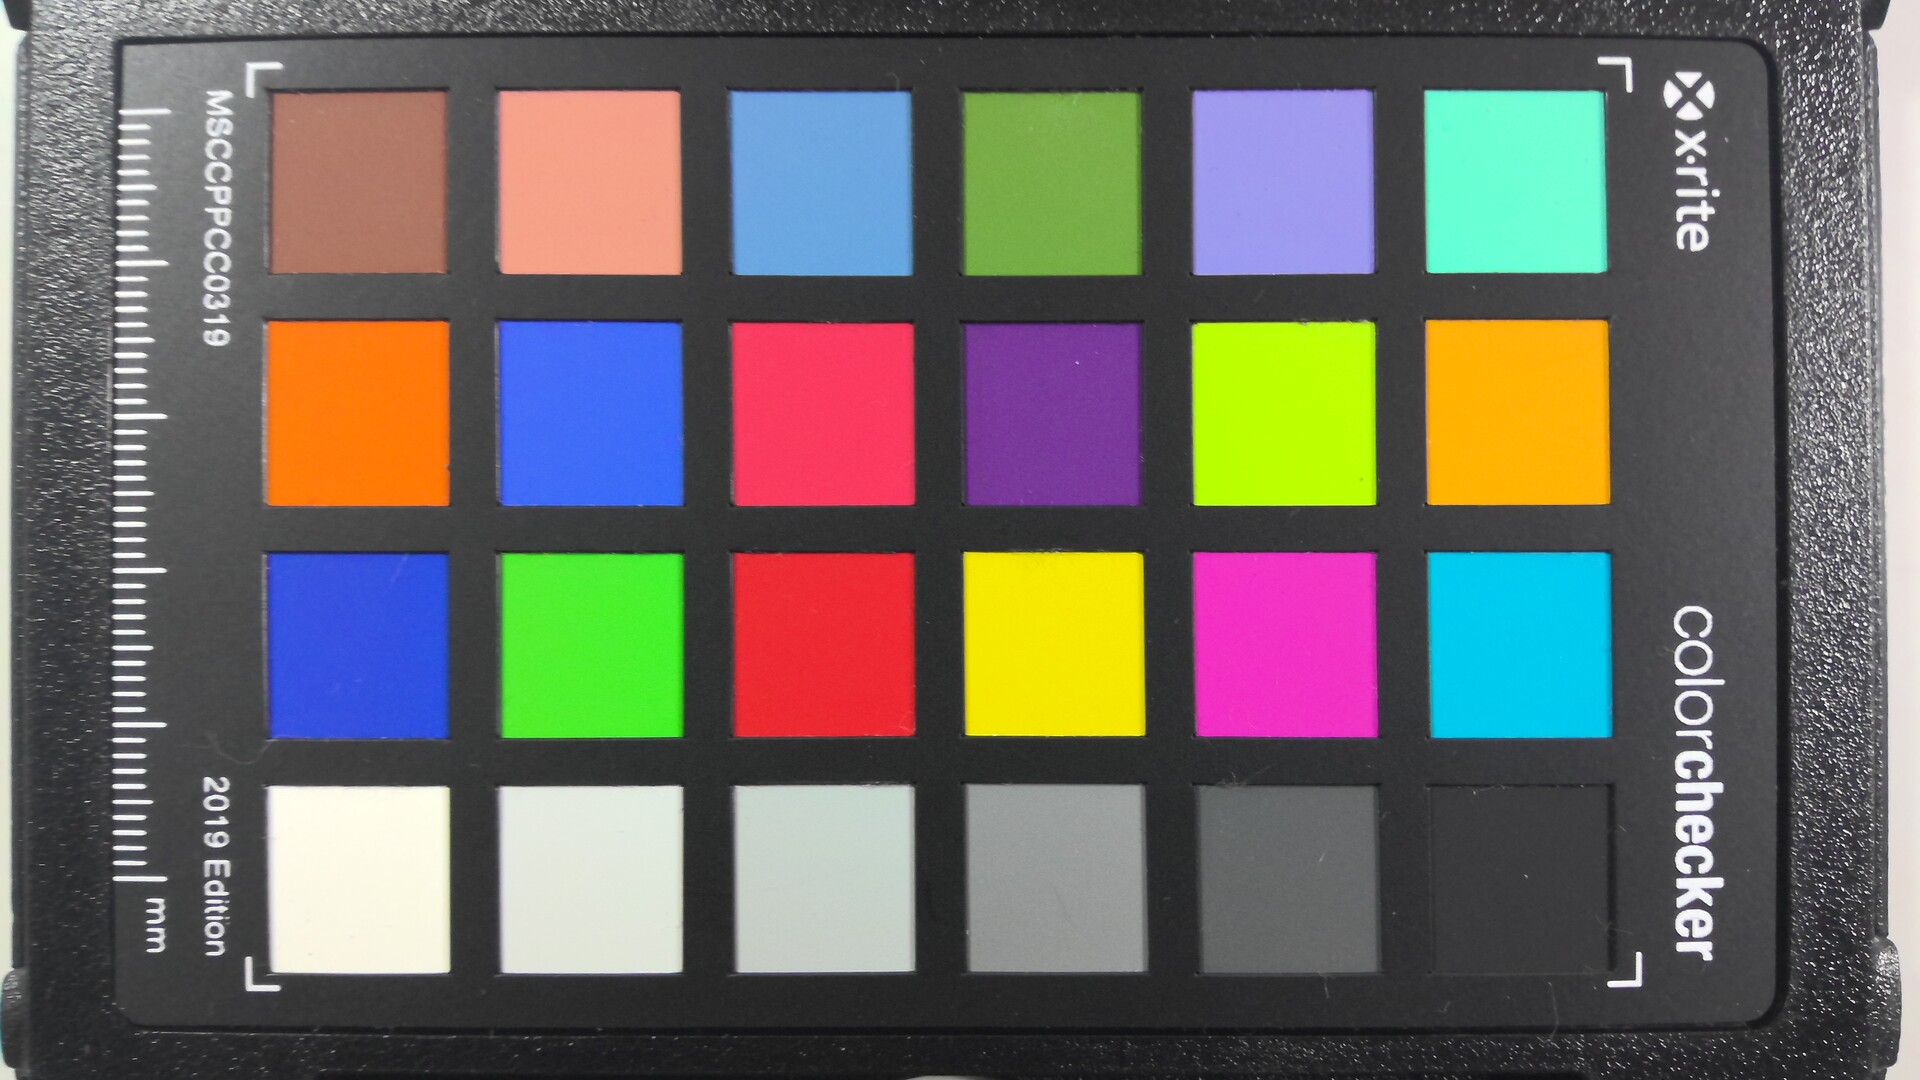
Aan de webcamconfiguratie zijn geen wijzigingen aangebracht, met een 5 MP camera aan de voorkant en een 10 MP camera aan de achterkant. De Surface Pro 9 blijft daarmee tot de beste Windows-apparaten behoren wat betreft cameraprestaties. Nog meer camerafuncties worden aangeboden in de ARM-variant van de Surface Pro 9, zoals soft focus (of bokeh-effect) voor de achtergrond, automatisch oogcontact of automatisch bijsnijden van het beeld.


Onderhoud
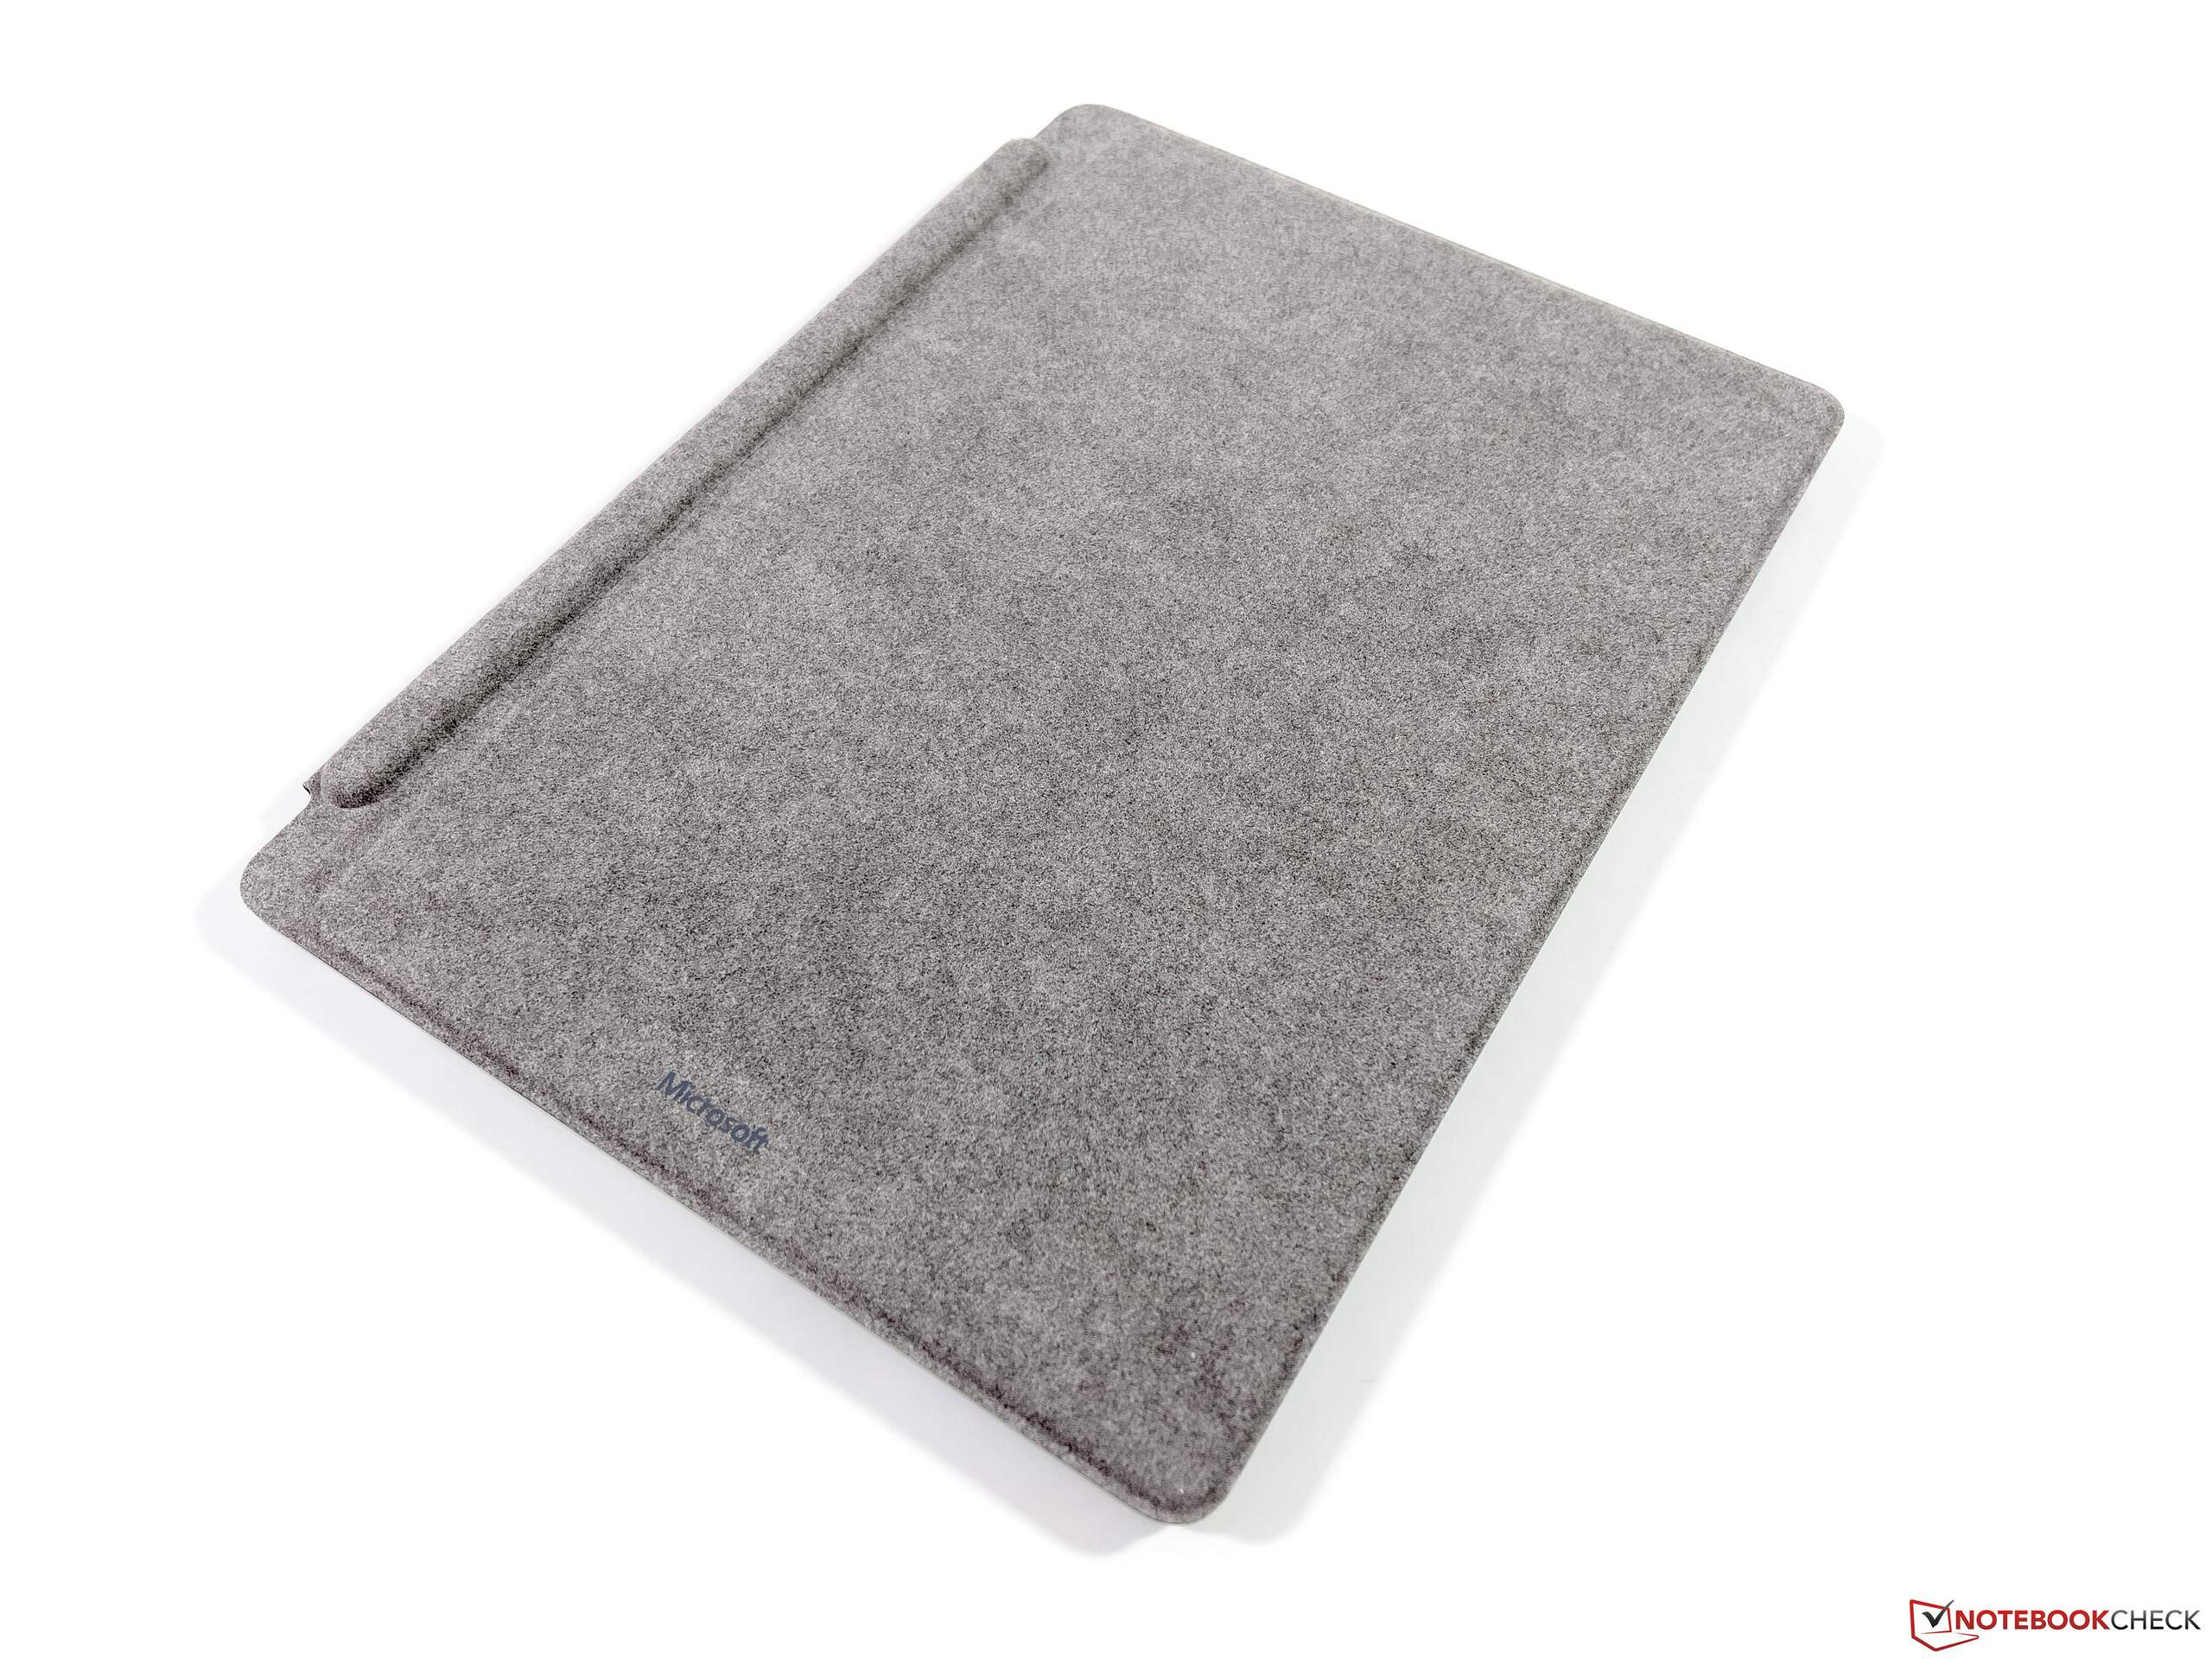
Net als voorheen biedt de Surface Pro 9 gebruikers nog steeds de mogelijkheid om de compacte M.2-2230 SSD te vervangen en Microsoft heeft dit proces nog eenvoudiger gemaakt, aangezien er geen SIM-tools meer nodig zijn om de cover te openen. In plaats daarvan is er een kleine uitsparing waarin je je vinger duwt, waardoor de tegenoverliggende zijde (die magnetisch op zijn plaats wordt gehouden) wordt geopend en de cover gemakkelijk kan worden verwijderd. De overige interne onderdelen zijn echter niet toegankelijk.
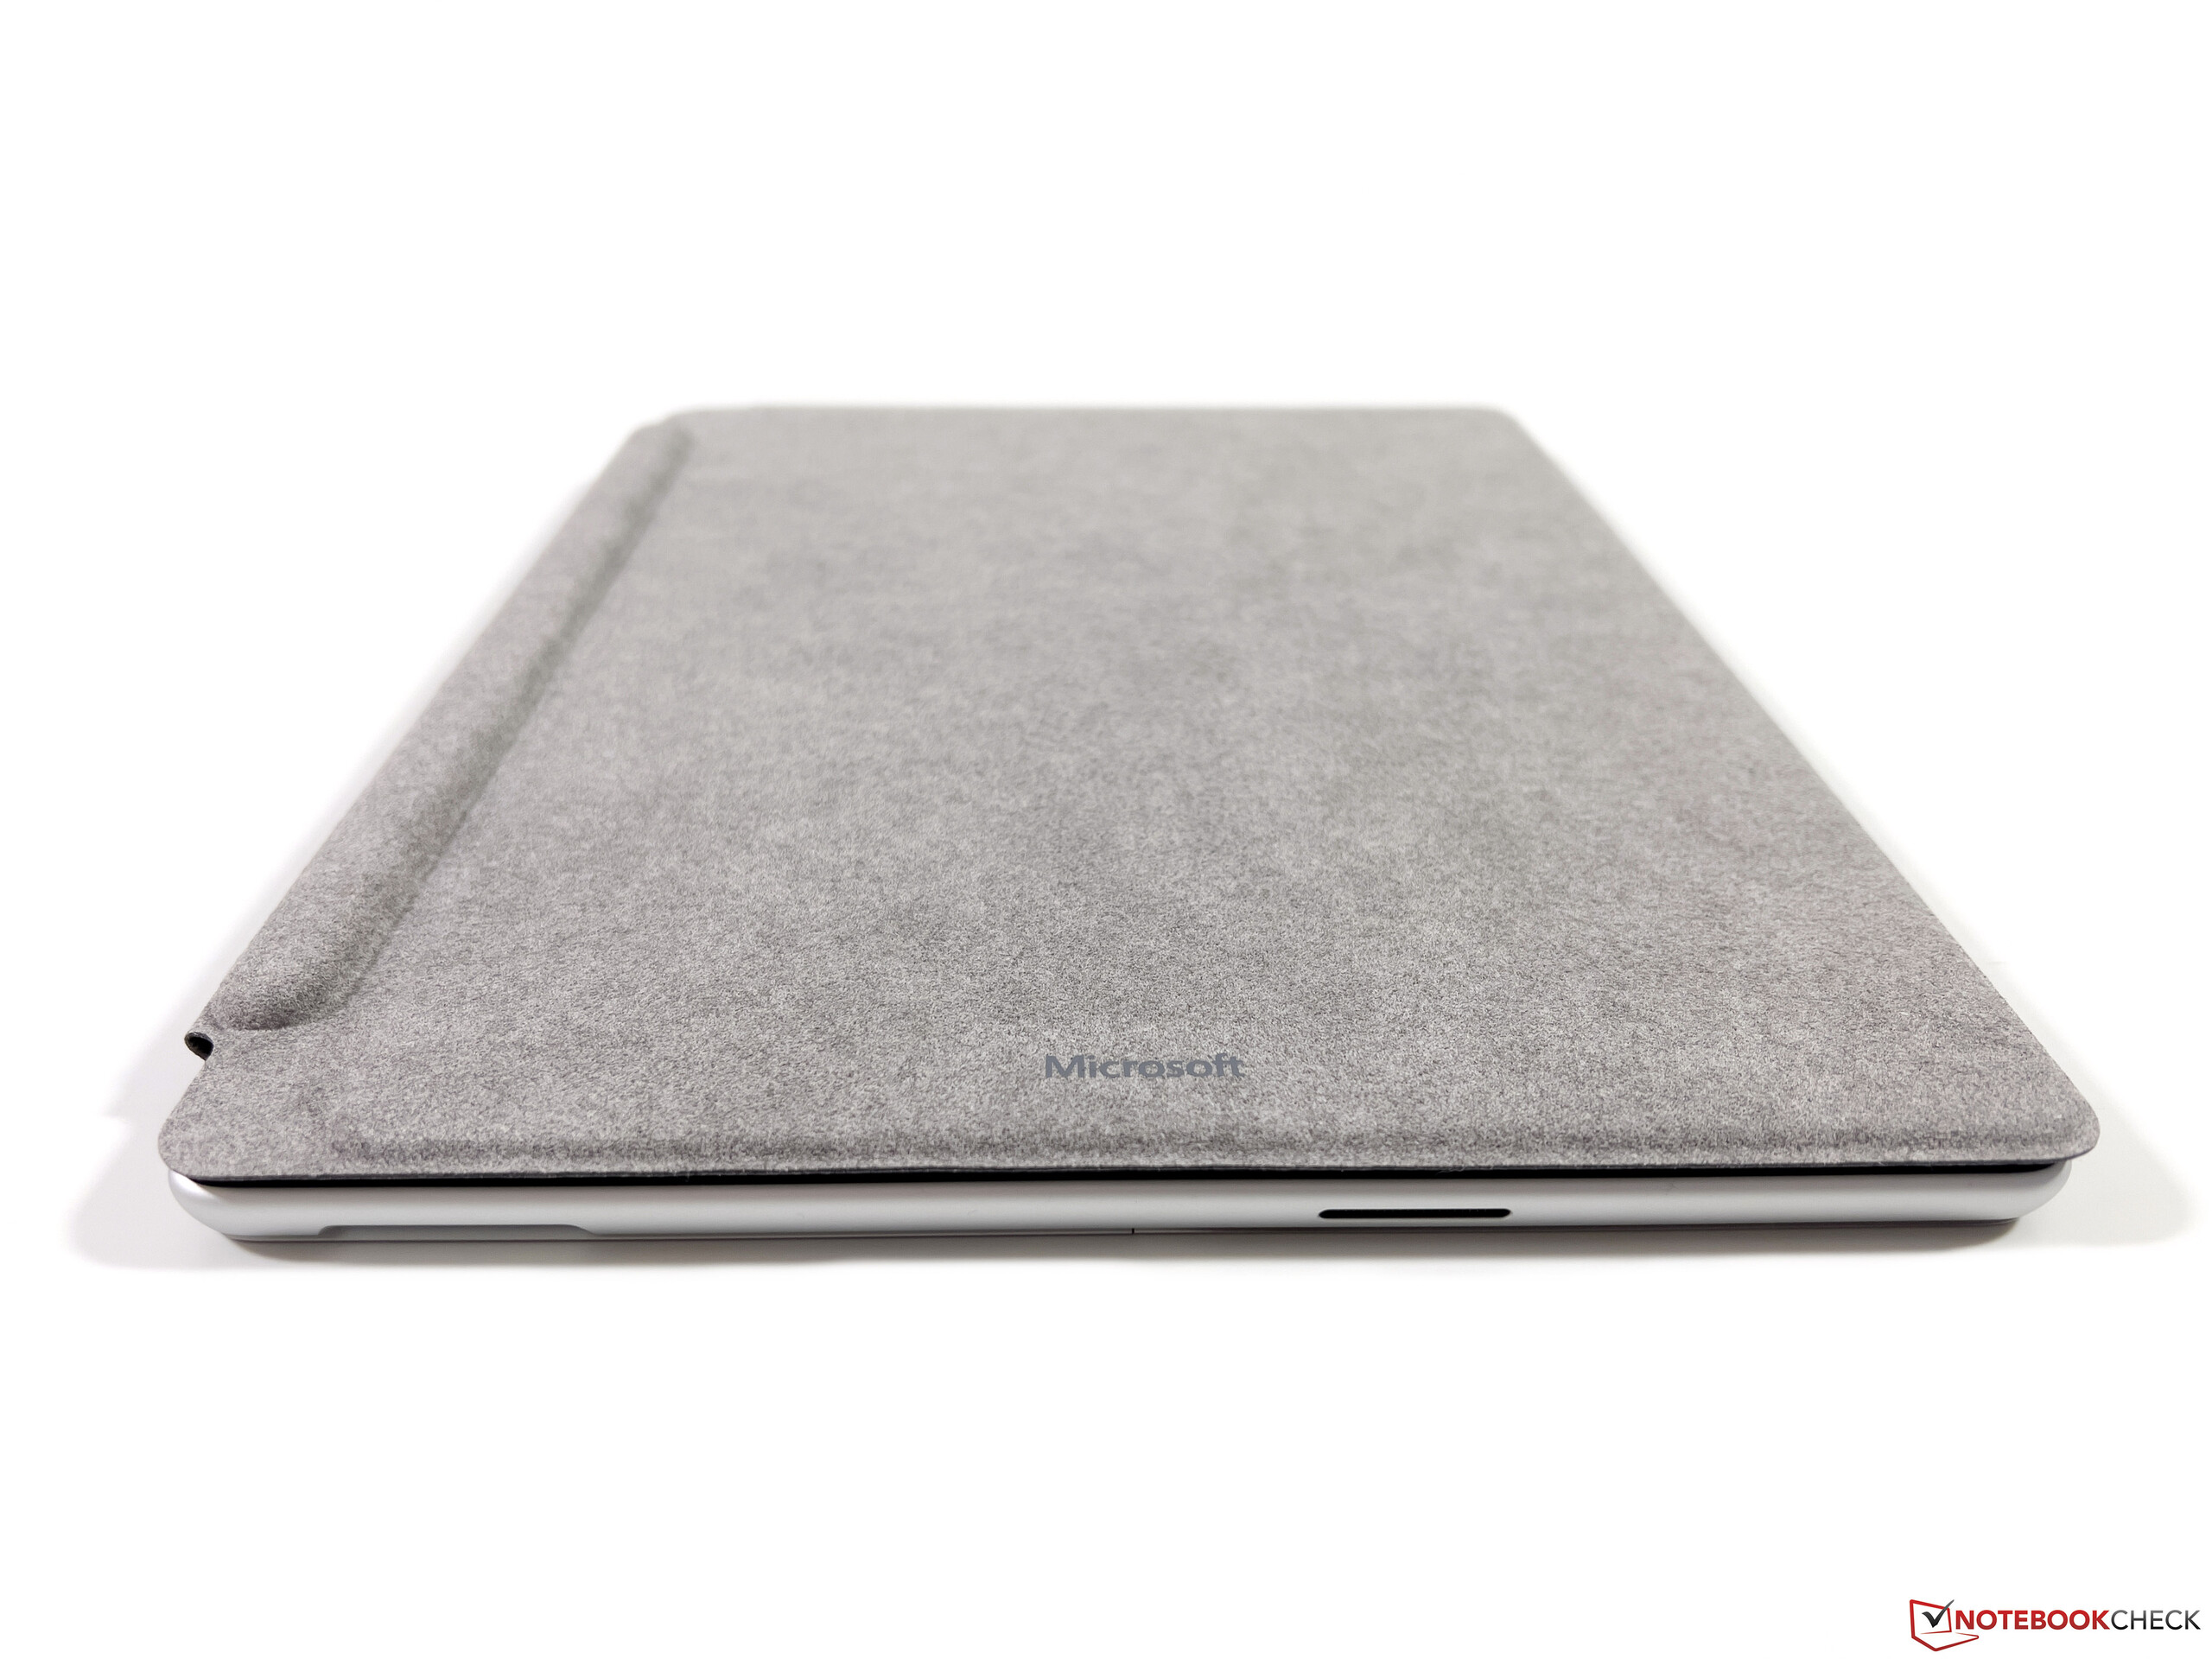
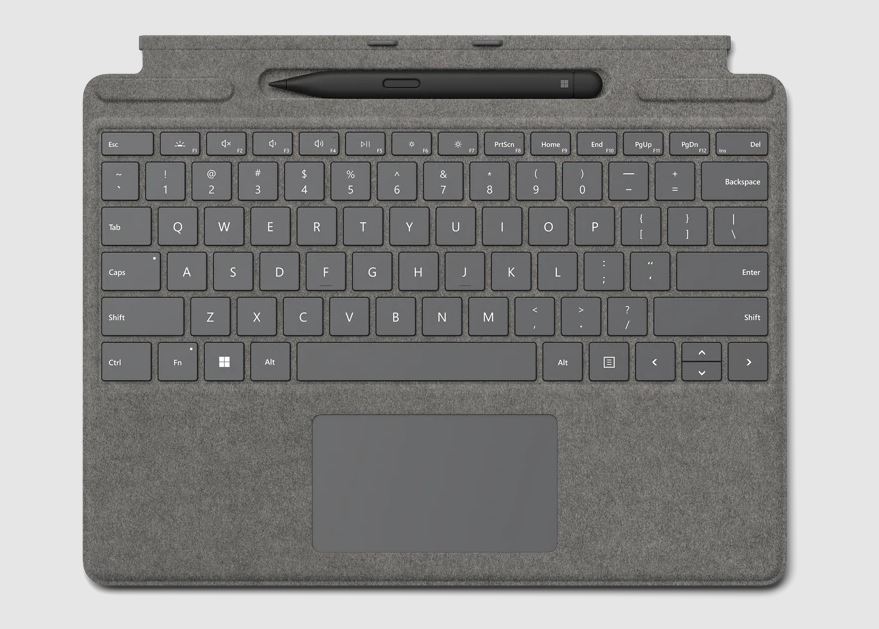
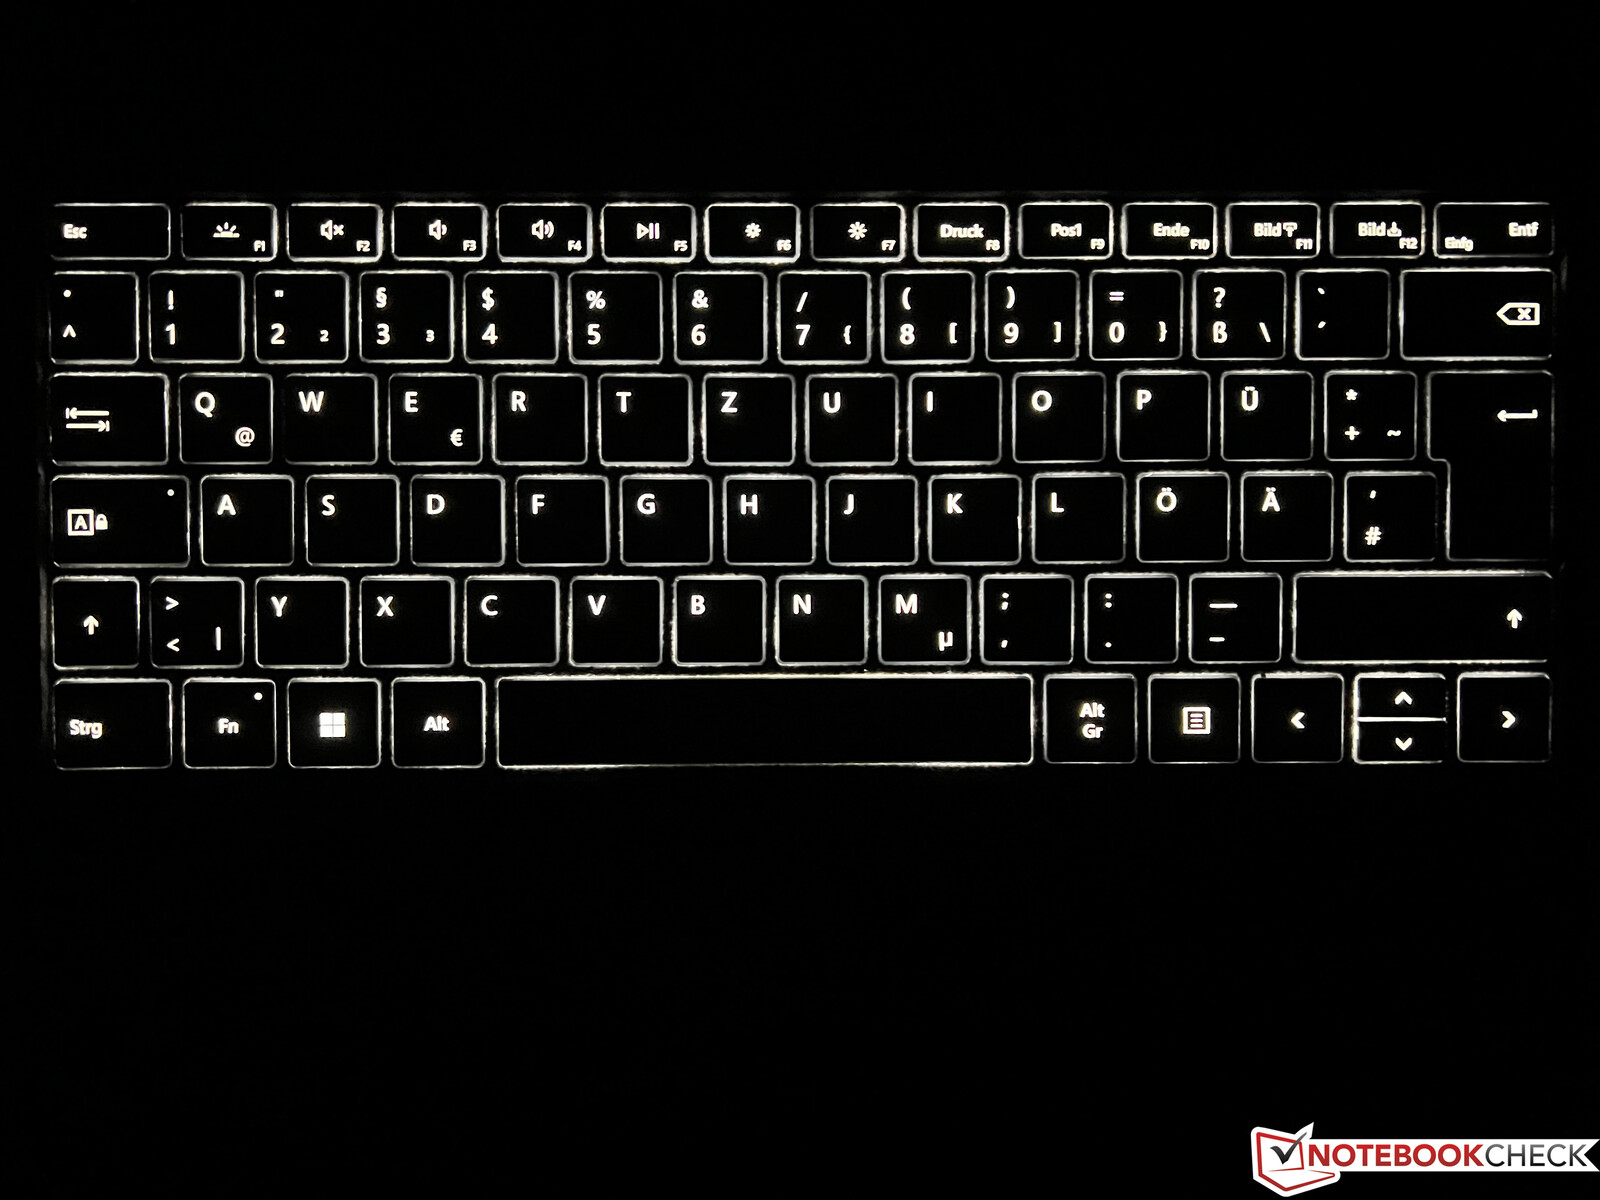
Invoerapparaten - Signature Keyboard blijft ongewijzigd
Aangezien de afmetingen van de Surface Pro niet zijn veranderd, blijft Microsoft twee verschillende toetsenbordcovers aanbieden. Net als bij het vorige model hebben we weer het Signature Keyboard en de Slim Pen 2, die in de toetsenbordcover kan worden opgeborgen en opgeladen. De stylus blijft zeer goed functioneren en er is ook ondersteuning voor haptische feedback. De bediening van de pen is echter niet meer zo ergonomisch door de afgeplatte vorm.
Het toetsenbord zelf biedt een fatsoenlijk typegevoel en is ook verlicht. Bovendien kan het toetsenbord in een lichte hoek worden geplaatst (dankzij magneten), maar de stabiliteit wordt dan beperkt. Vooral onderweg is het typecomfort lang niet zo goed als op een normale laptop, en de Surface vereist in zijn geheel een groot instelgebied door de ingebouwde scharnieren (maar dat geldt ook voor de meeste convertibles met een toetsenbordcover).
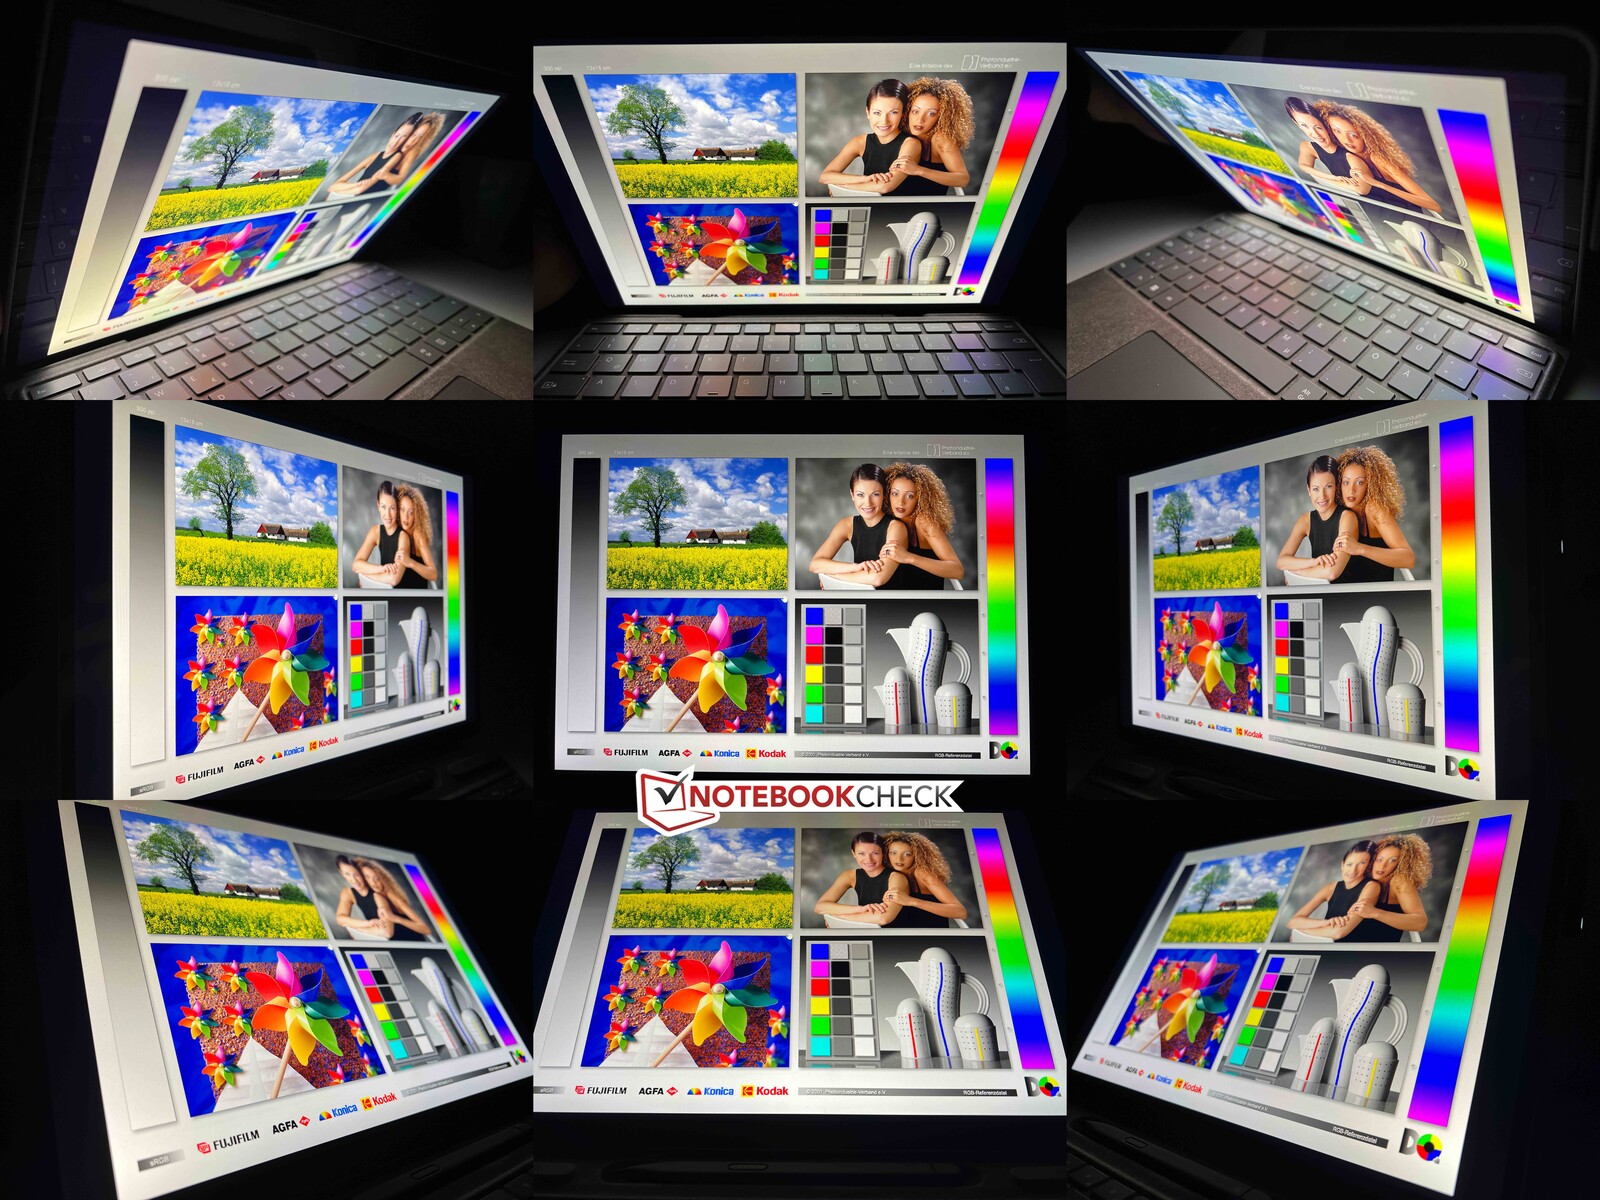
Beeldscherm - 3:2 IPS bij 120 Hz
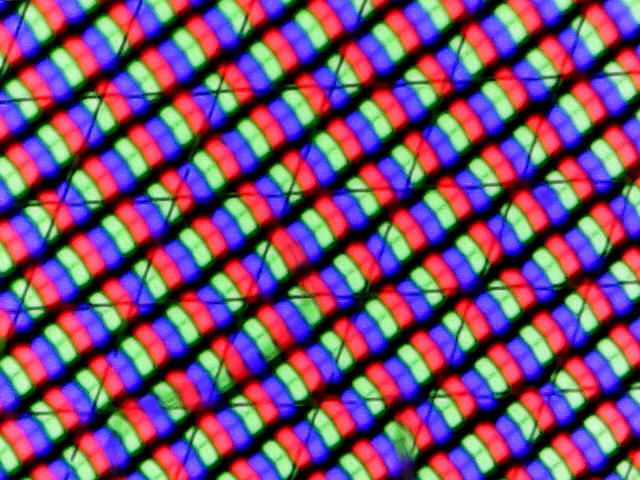
Er is niets veranderd aan de fundamentele kenmerken van het scherm, dat een IPS-touchscreen in 3:2-formaat blijft, een resolutie van 2880 x 1920 (267 PPI) en een verversingssnelheid tot 120 Hz biedt. 60 Hz is vooraf ingesteld als de standaardsnelheid, dus 120 Hz moet handmatig worden geselecteerd in de instellingen. Onze subjectieve indruk van het glanzende scherm is nog steeds erg goed. Dankzij sensoren worden de helderheid en kleurtemperatuur automatisch aangepast en ook dit werkt goed.
Het paneel is opnieuw afkomstig van LG Philips, maar de paneel-ID is veranderd. Fundamenteel zijn de waarden vergelijkbaar, want de maximale helderheid schommelt weer rond de 450 cd/m². Het zwartniveau is iets beter, waardoor ook de contrastverhouding met bijna 1.200:1 iets beter lijkt. Maar concurrerende apparaten doen het hier beter, vooral qua contrast, zoals het Mini-LED-Display van de iPad Pro.
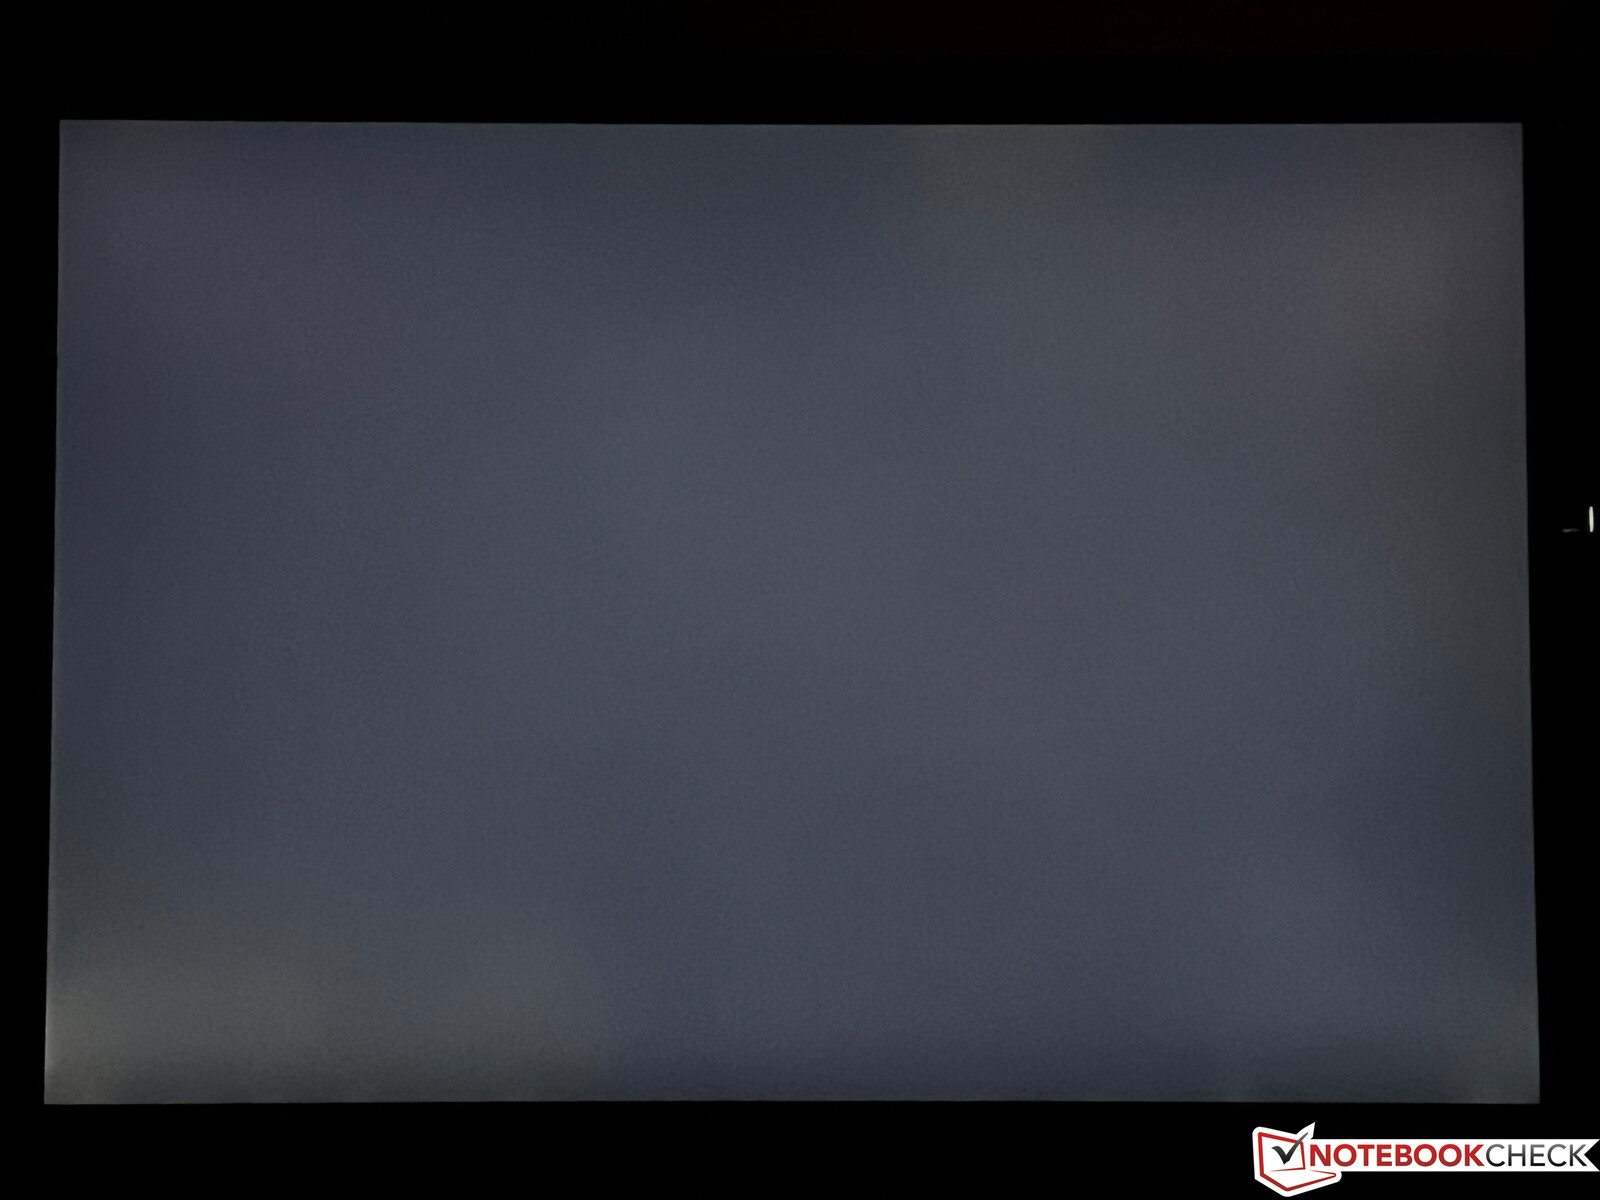
Er is geen klassieke PWM flikkering aanwezig, maar we registreerden opnieuw flikkering bij ~30 KHz bij een helderheid van 55% of lager. Maar dit zou geen probleem moeten zijn vanwege de hoge frequentie. Dit geldt ook voor halo's, want alleen bij volledige helderheid merken we een lichtere vlek linksonder op een donker scherm.
| |||||||||||||||||||||||||
Helderheidsverdeling: 94 %
Helderheid in Batterij-modus: 454 cd/m²
Contrast: 1197:1 (Zwart: 0.38 cd/m²)
ΔE ColorChecker Calman: 1.7 | ∀{0.5-29.43 Ø4.71}
calibrated: 1.5
ΔE Greyscale Calman: 1.5 | ∀{0.09-98 Ø4.96}
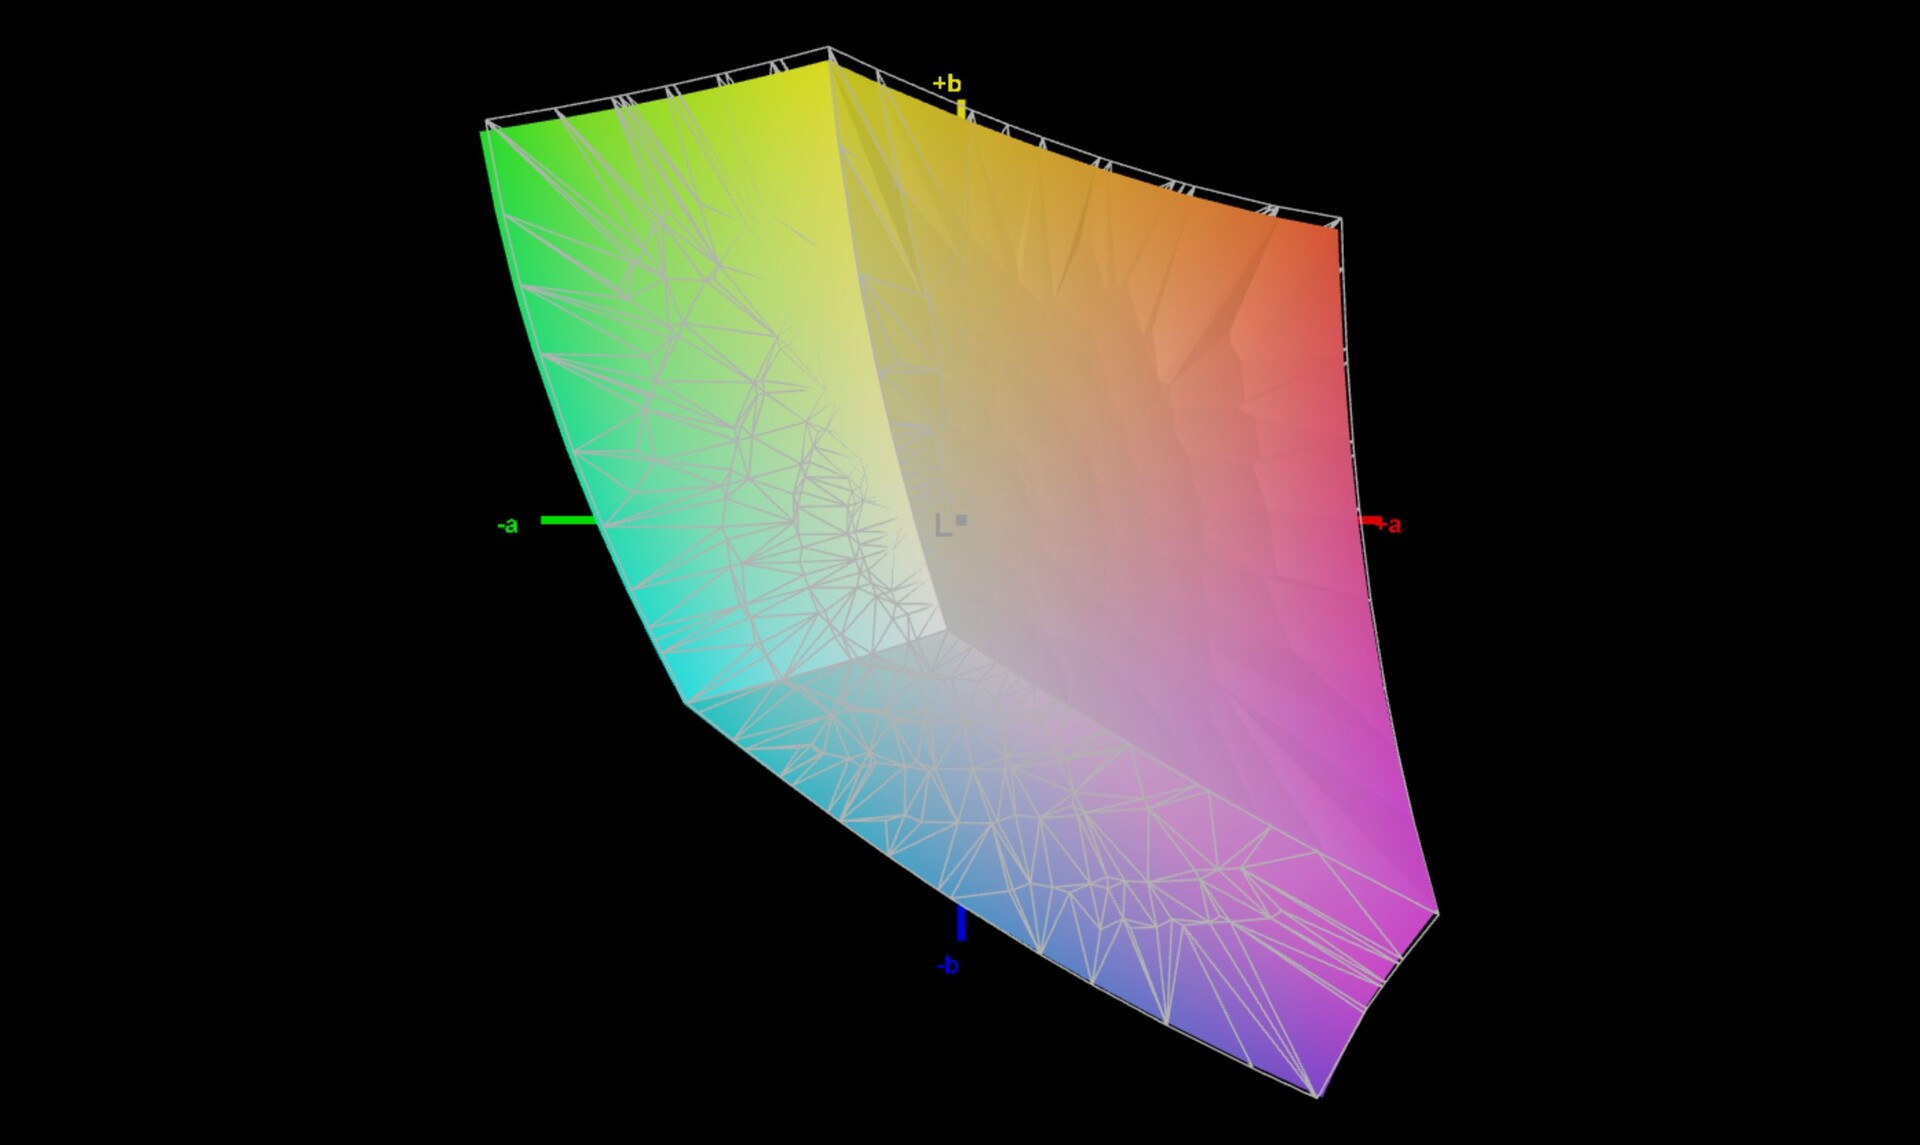
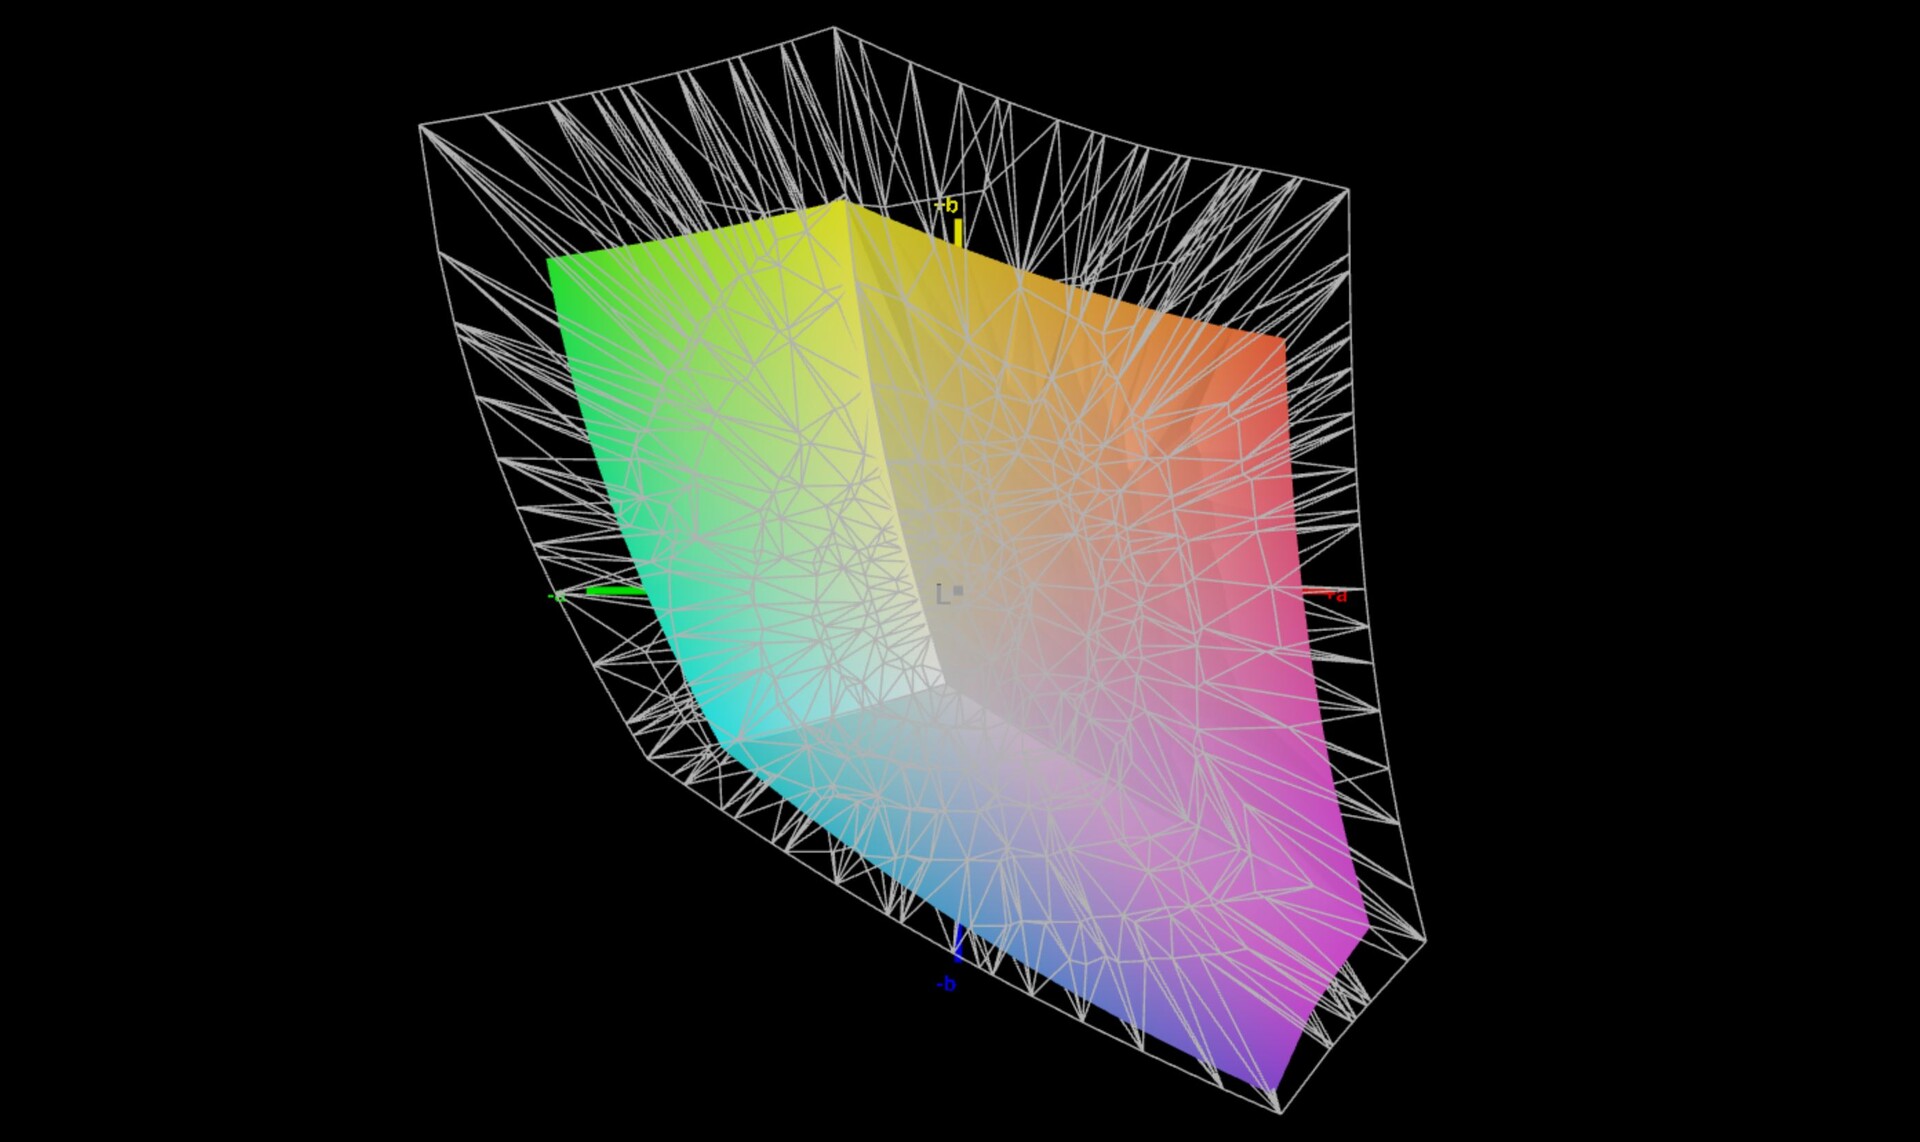
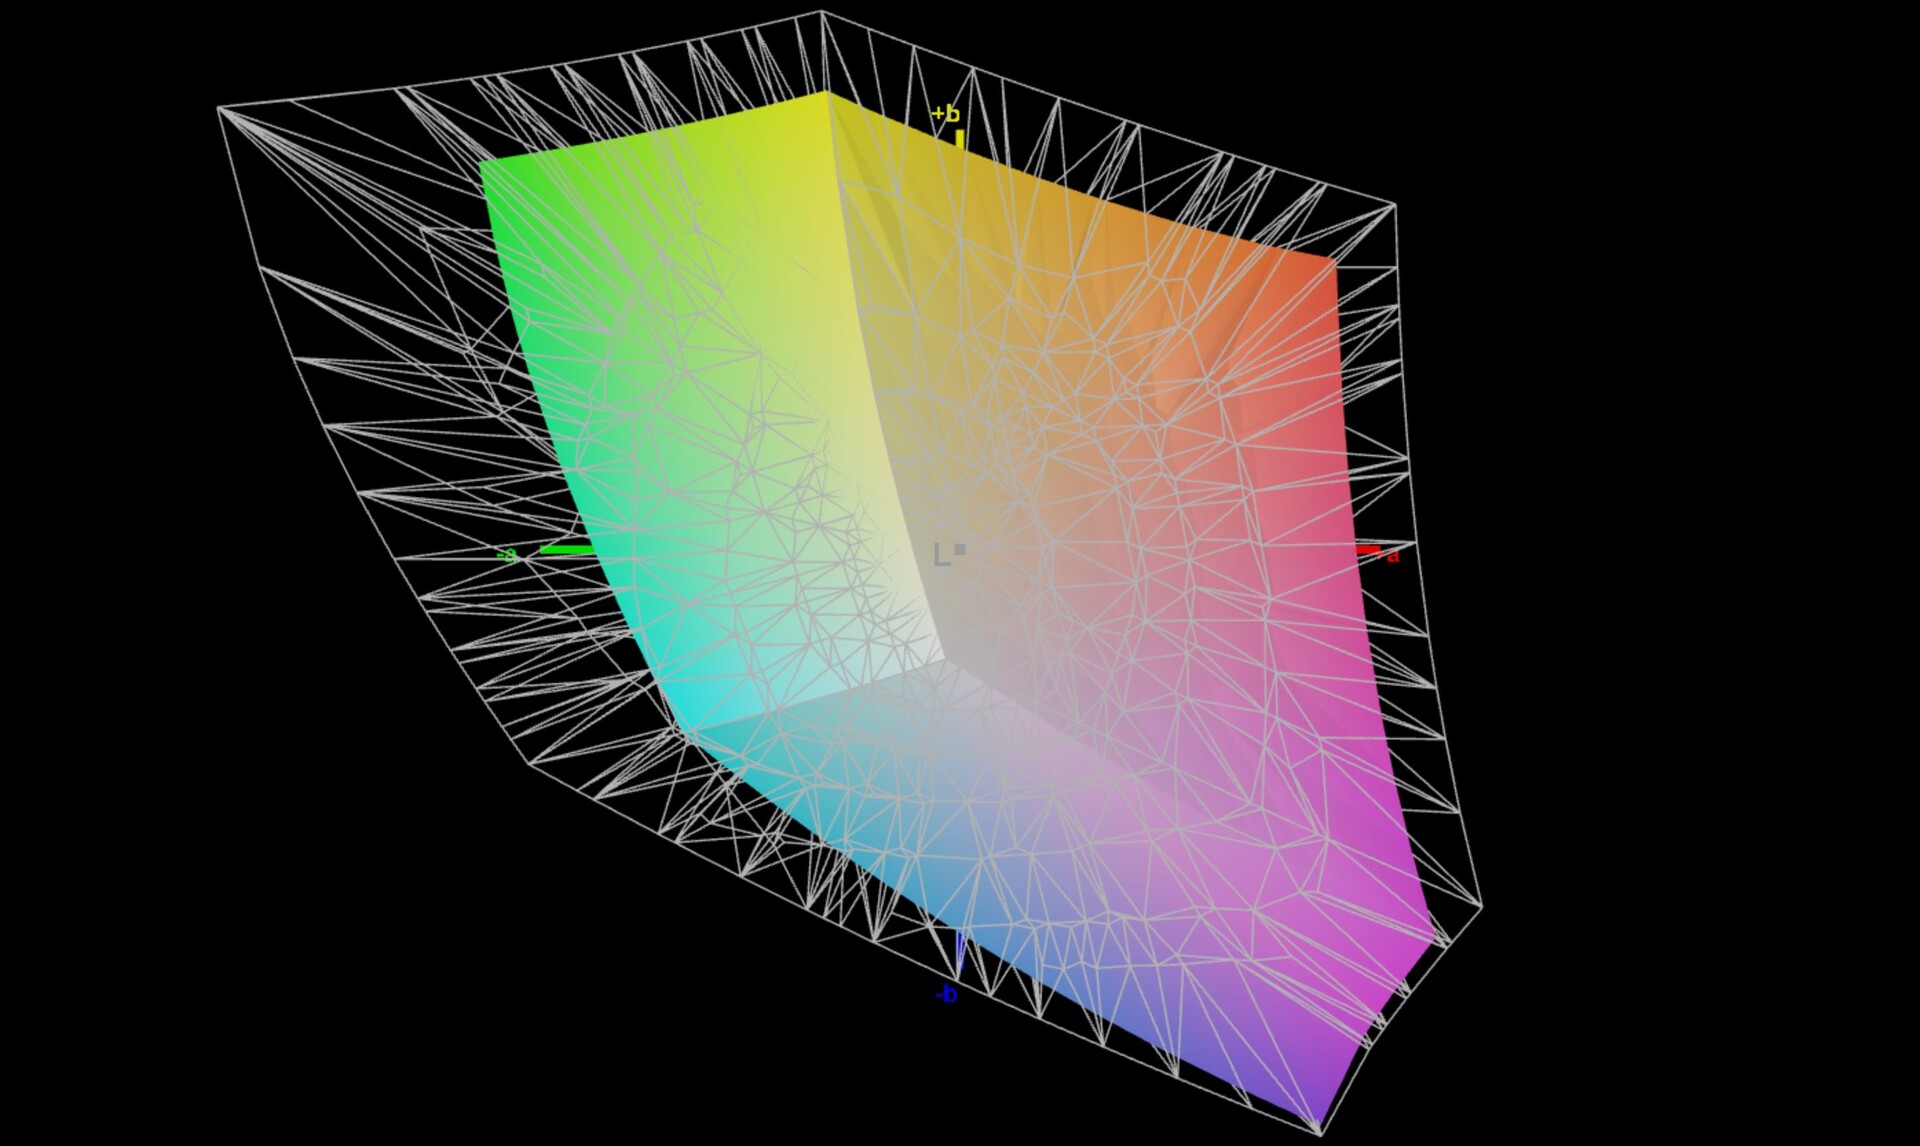
67.7% AdobeRGB 1998 (Argyll 3D)
97.7% sRGB (Argyll 3D)
65.6% Display P3 (Argyll 3D)
Gamma: 2.17
CCT: 6761 K
| Microsoft Surface Pro 9, i7-1255U LP129WT2-SPA6, IPS, 2880x1920, 13" | Dell XPS 13 9315 2-in-1 Core i5-1230U BOE NE13A1M, IPS, 2880x1920, 13" | Lenovo ThinkPad X12 20UVS03G00 N123NCA-GS1, a-Si IPS LED, 1920x1280, 12.3" | HP Elite Dragonfly Folio 13.5 G3 Chi Mei CMN13C0, IPS, 1920x1280, 13.5" | Apple iPad Pro 12.9 2022 Liquid Retina XDR Display, Mini-LED, 2732x2048, 12.9" | Asus ROG Flow Z13 GZ301ZE LQ134N1JW54, IPS, 1920x1200, 13.4" | Microsoft Surface Pro 8, i7-1185G7 LP129WT212166, IPS, 2880x1920, 13" | |
|---|---|---|---|---|---|---|---|
| Display | 6% | 2% | 3% | 1% | 12% | ||
| Display P3 Coverage (%) | 65.6 | 70.7 8% | 67 2% | 68.3 4% | 67.5 3% | 78.2 19% | |
| sRGB Coverage (%) | 97.7 | 99.8 2% | 99.2 2% | 98.6 1% | 97.1 -1% | 100 2% | |
| AdobeRGB 1998 Coverage (%) | 67.7 | 72.6 7% | 68.8 2% | 70.2 4% | 69.3 2% | 77.6 15% | |
| Response Times | -133% | -236% | -272% | -133% | -115% | -139% | |
| Response Time Grey 50% / Grey 80% * (ms) | 13 ? | 44 ? -238% | 63.2 ? -386% | 66.8 ? -414% | 35.3 ? -172% | 44 ? -238% | 46.4 ? -257% |
| Response Time Black / White * (ms) | 19.4 ? | 24.8 ? -28% | 36 ? -86% | 44.4 ? -129% | 37.53 ? -93% | 17.6 ? 9% | 23.2 ? -20% |
| PWM Frequency (Hz) | 29896 ? | 6401 ? | 29760 ? | ||||
| Screen | 8% | 24% | -9% | 7% | -0% | -7% | |
| Brightness middle (cd/m²) | 455 | 507 11% | 419 -8% | 369.5 -19% | 611 34% | 515 13% | 444 -2% |
| Brightness (cd/m²) | 453 | 486 7% | 406 -10% | 350 -23% | 605 34% | 476 5% | 451 0% |
| Brightness Distribution (%) | 94 | 87 -7% | 94 0% | 87 -7% | 92 -2% | 87 -7% | 91 -3% |
| Black Level * (cd/m²) | 0.38 | 0.34 11% | 0.23 39% | 0.24 37% | 0.35 8% | 0.43 -13% | |
| Contrast (:1) | 1197 | 1491 25% | 1822 52% | 1540 29% | 1471 23% | 1033 -14% | |
| Colorchecker dE 2000 * | 1.7 | 2.04 -20% | 1.1 35% | 2.3 -35% | 1.4 18% | 1.6 6% | 2 -18% |
| Colorchecker dE 2000 max. * | 3.8 | 3.1 18% | 2.2 42% | 4.34 -14% | 3.3 13% | 4 -5% | 3.2 16% |
| Colorchecker dE 2000 calibrated * | 1.5 | 0.86 43% | 0.5 67% | 0.6 60% | 1.2 20% | 1.7 -13% | |
| Greyscale dE 2000 * | 1.5 | 1.8 -20% | 1.5 -0% | 3.1 -107% | 2.3 -53% | 2.5 -67% | 1.8 -20% |
| Gamma | 2.17 101% | 2.12 104% | 2.06 107% | 2.1 105% | 2.22 99% | 2.2 100% | 2.11 104% |
| CCT | 6761 96% | 6561 99% | 6524 100% | 6248 104% | 6930 94% | 6939 94% | 6417 101% |
| Color Space (Percent of AdobeRGB 1998) (%) | 62.8 | ||||||
| Color Space (Percent of sRGB) (%) | 99.2 | ||||||
| Totaal Gemiddelde (Programma / Instellingen) | -40% /
-13% | -70% /
-18% | -93% /
-44% | -63% /
-28% | -38% /
-16% | -45% /
-22% |
* ... kleiner is beter
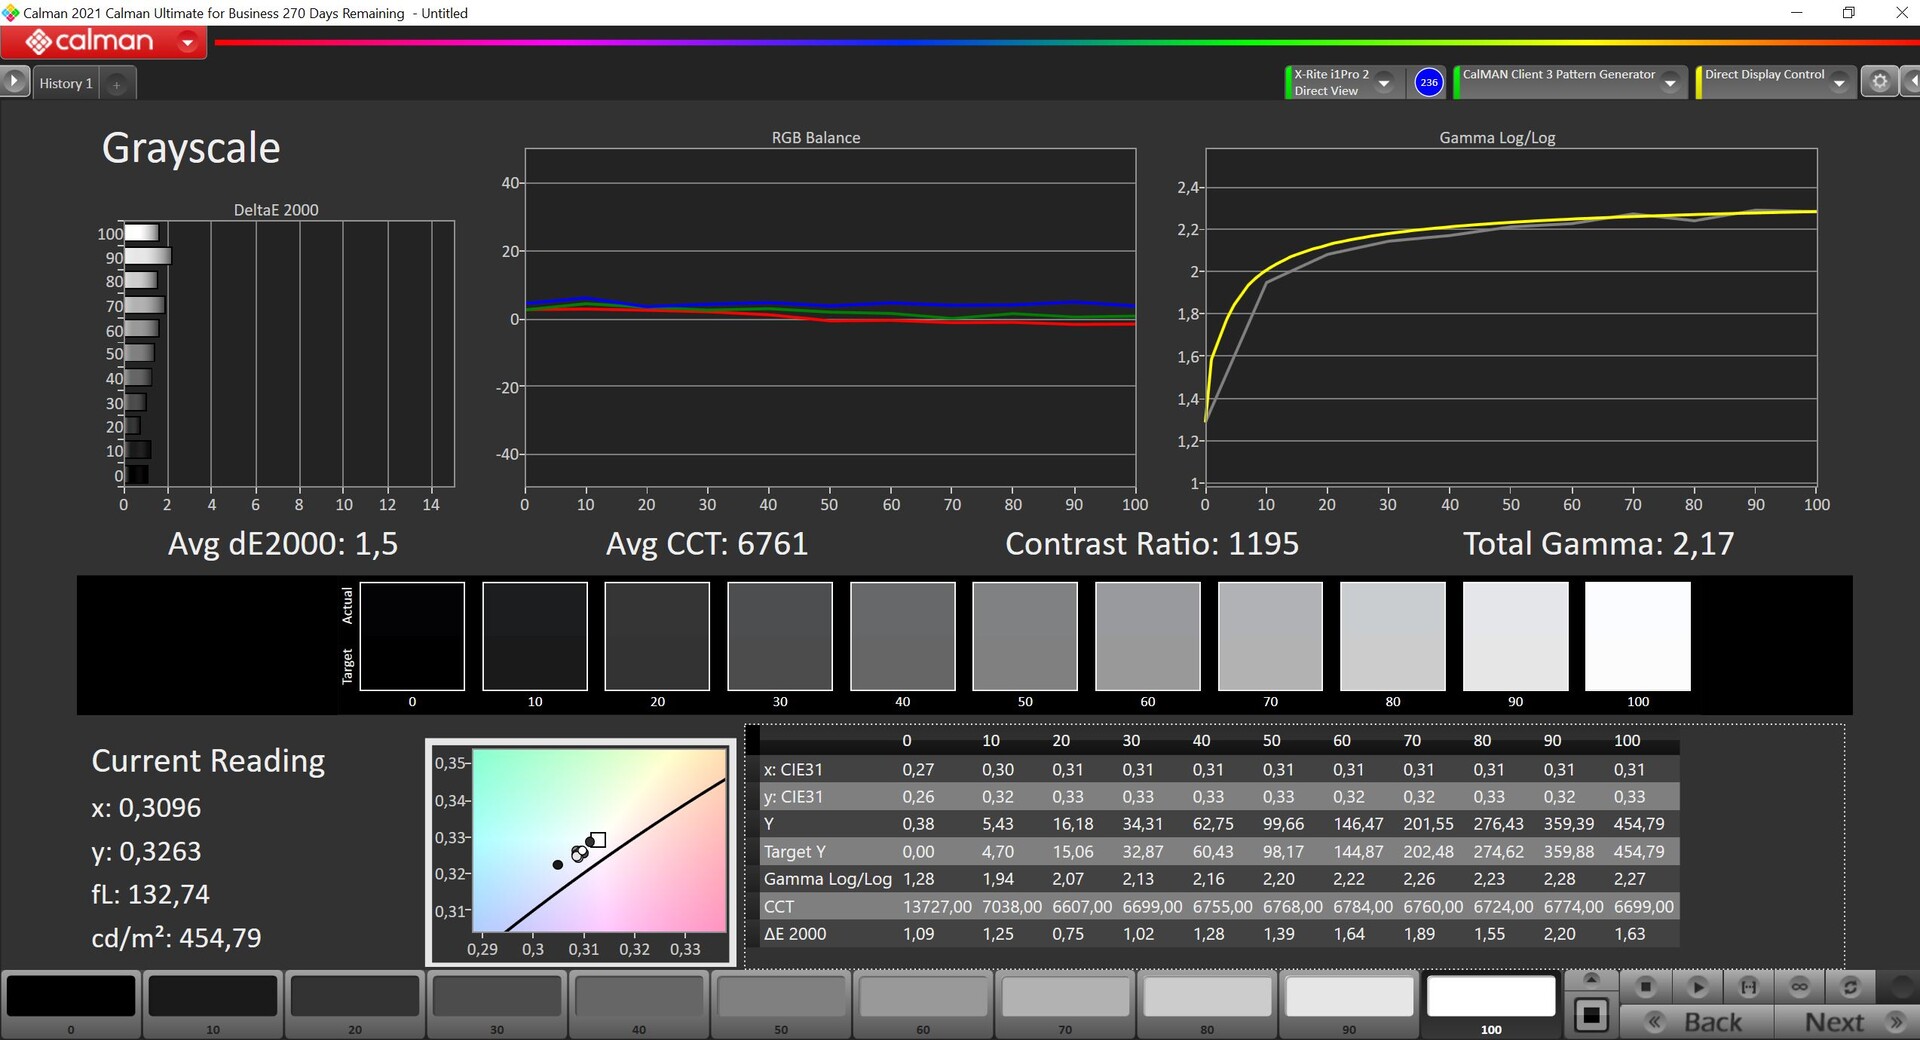
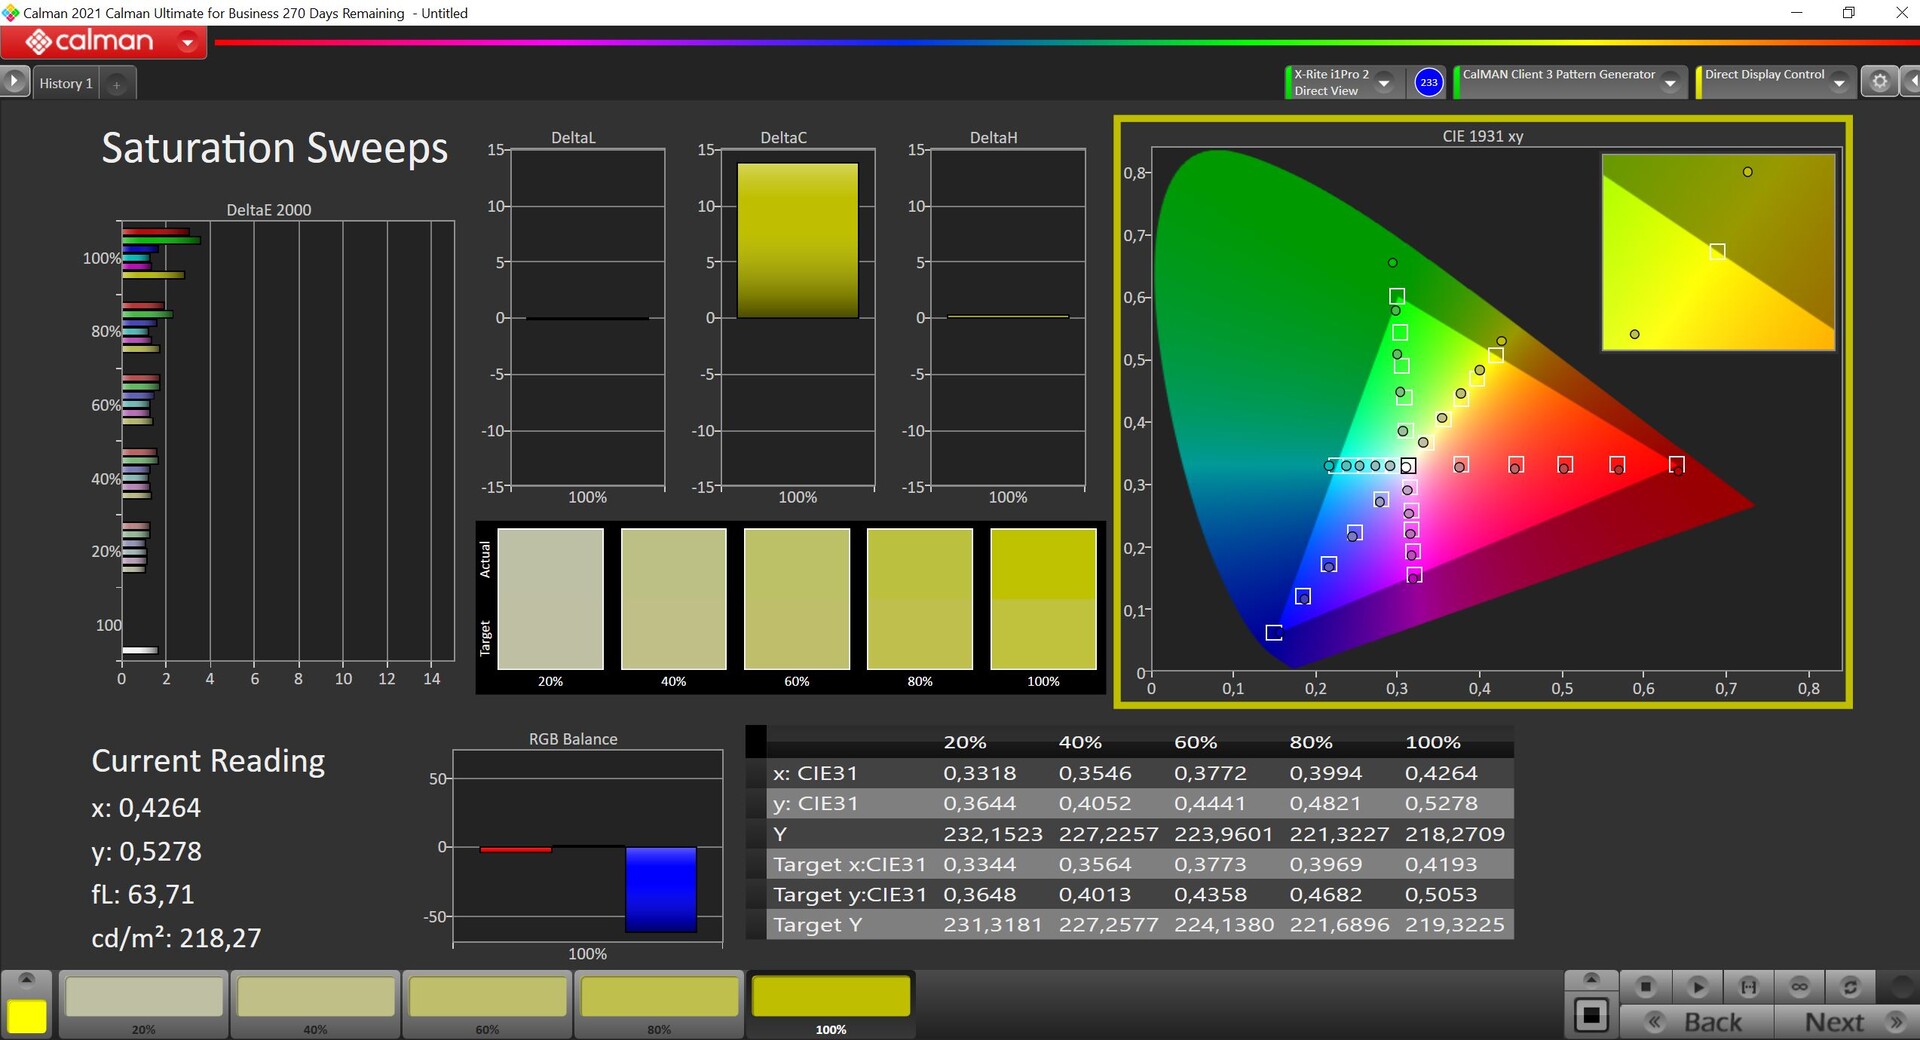
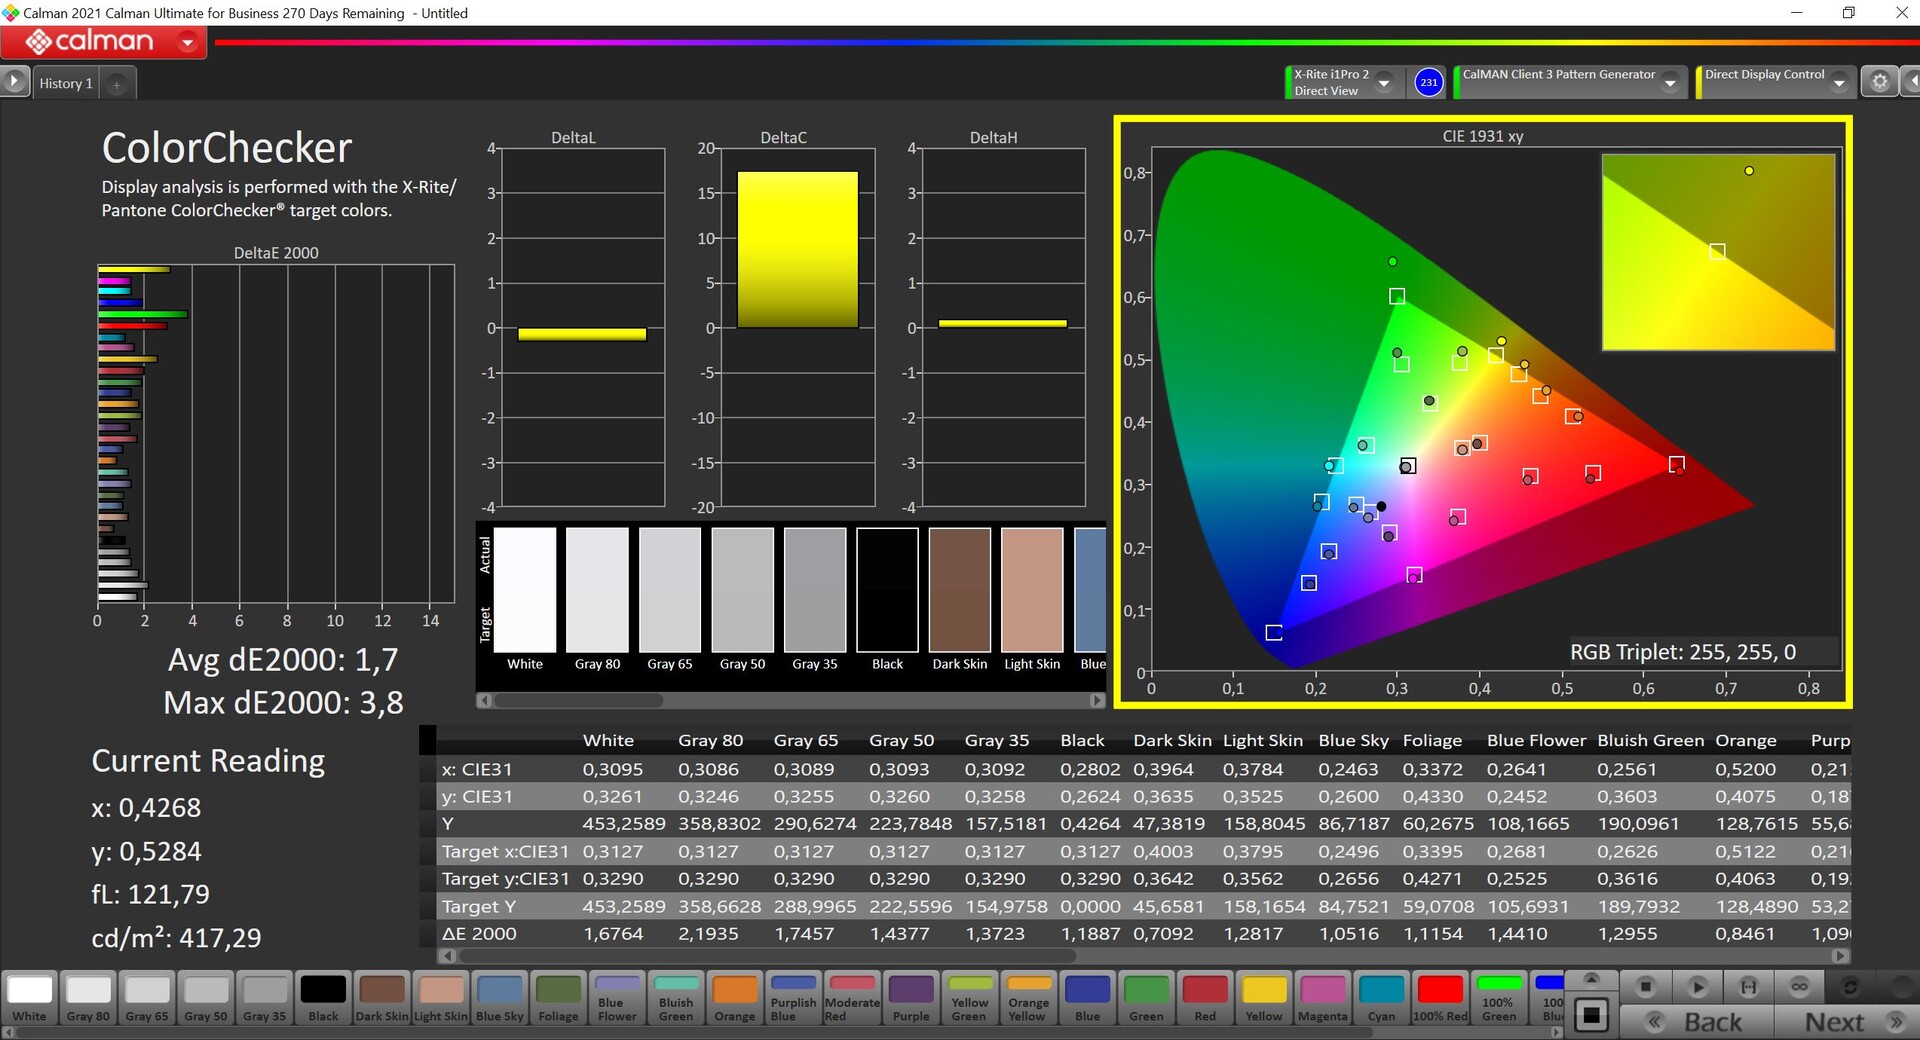
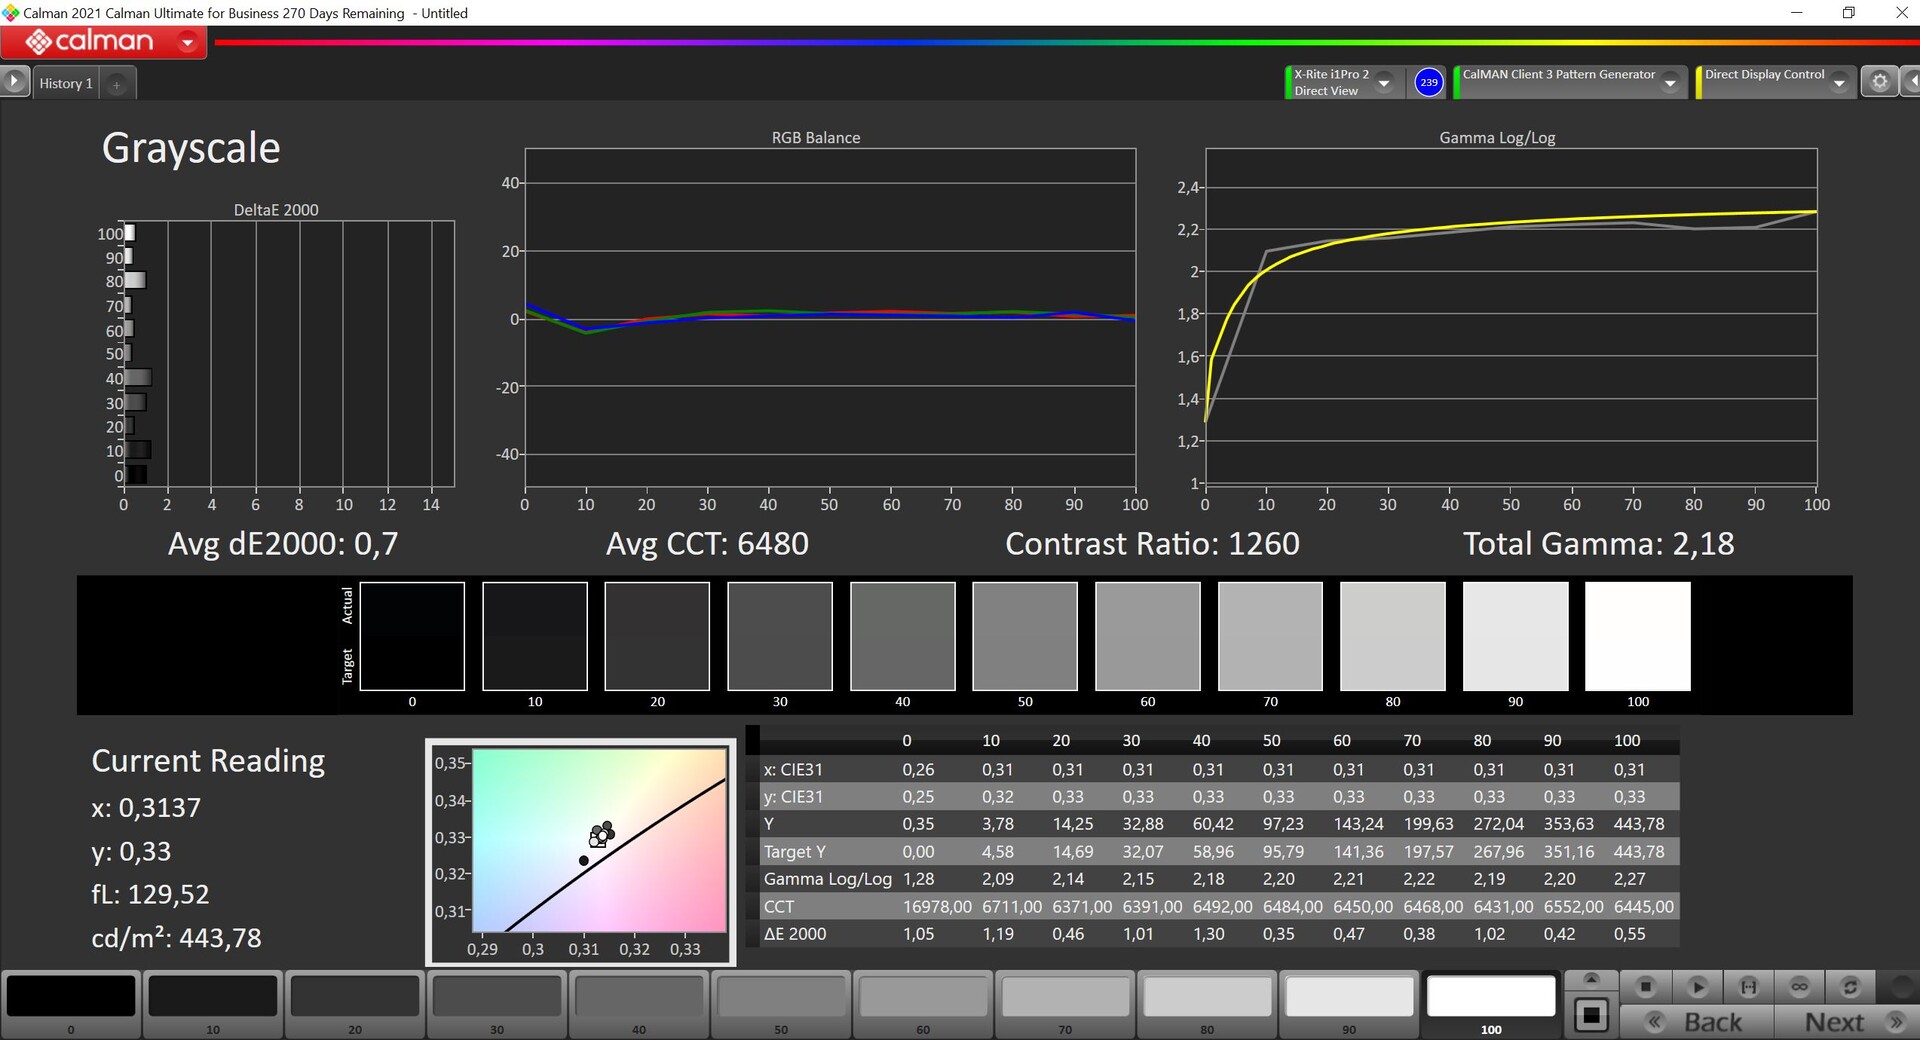
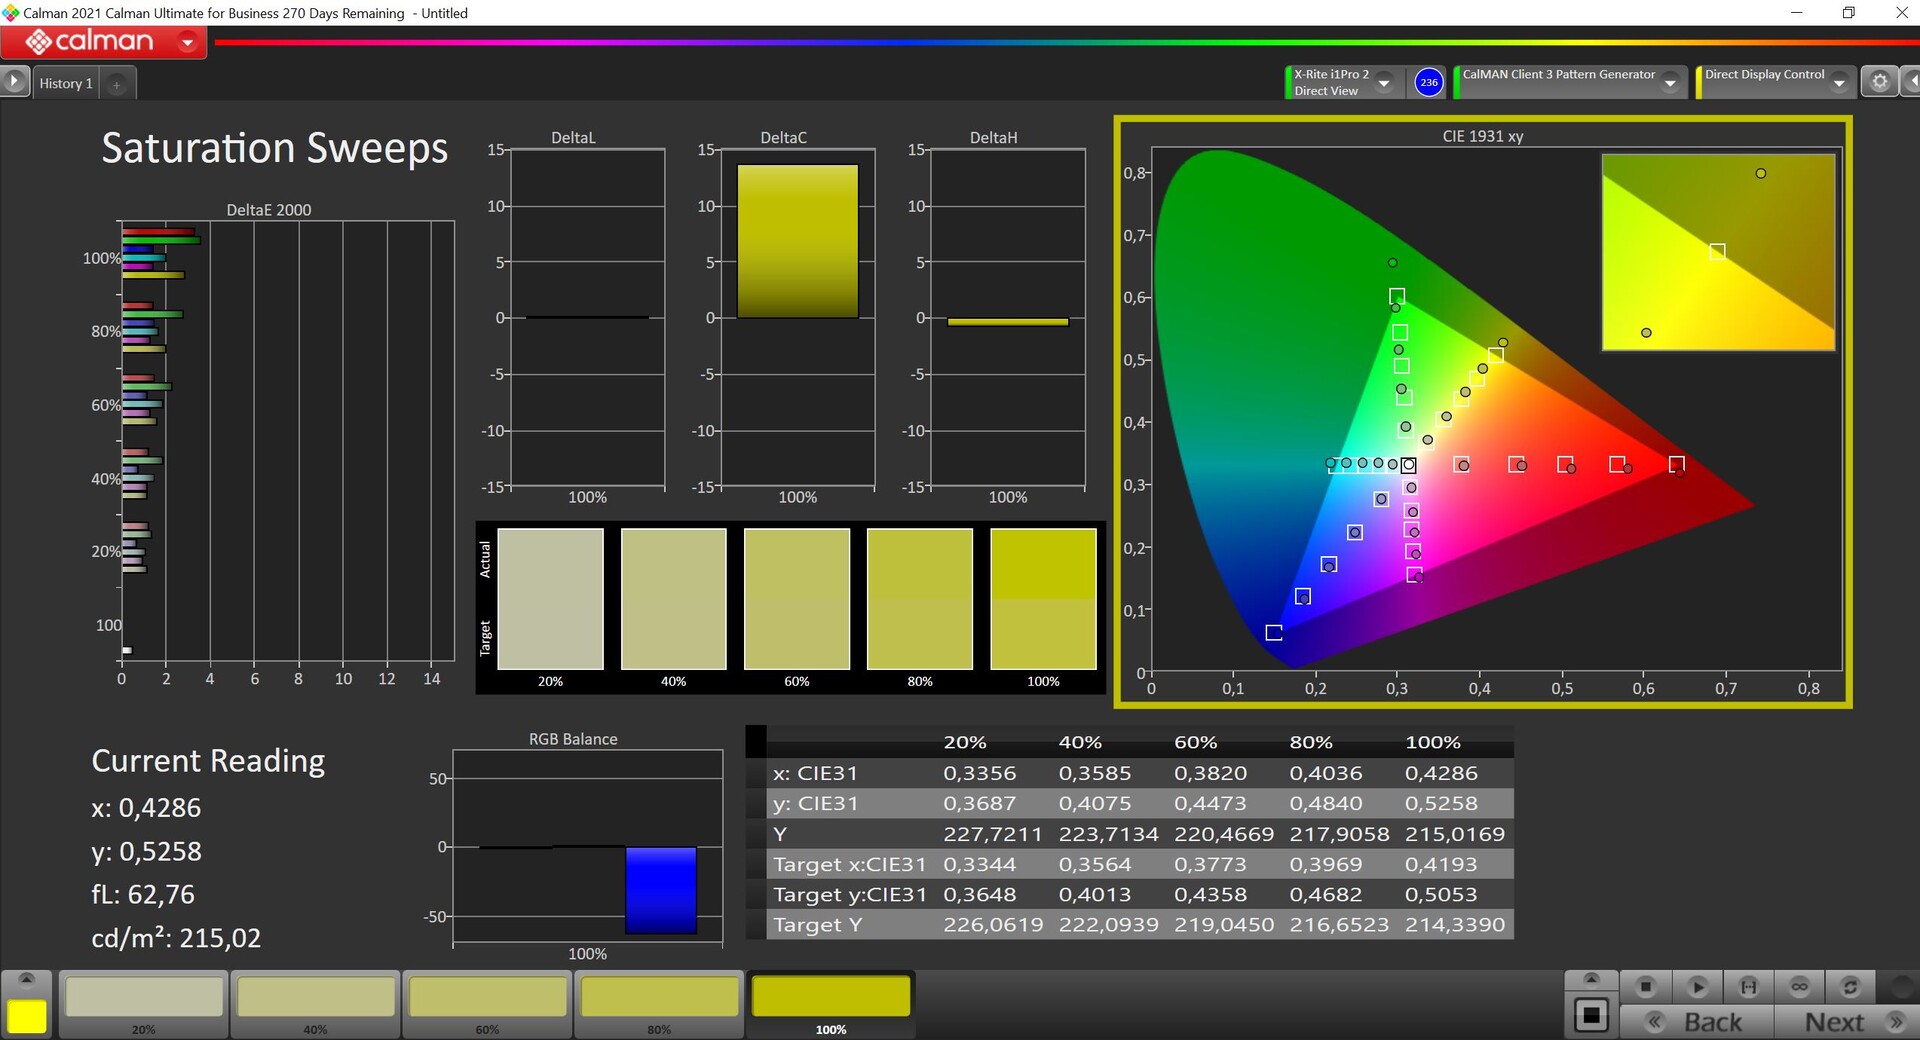
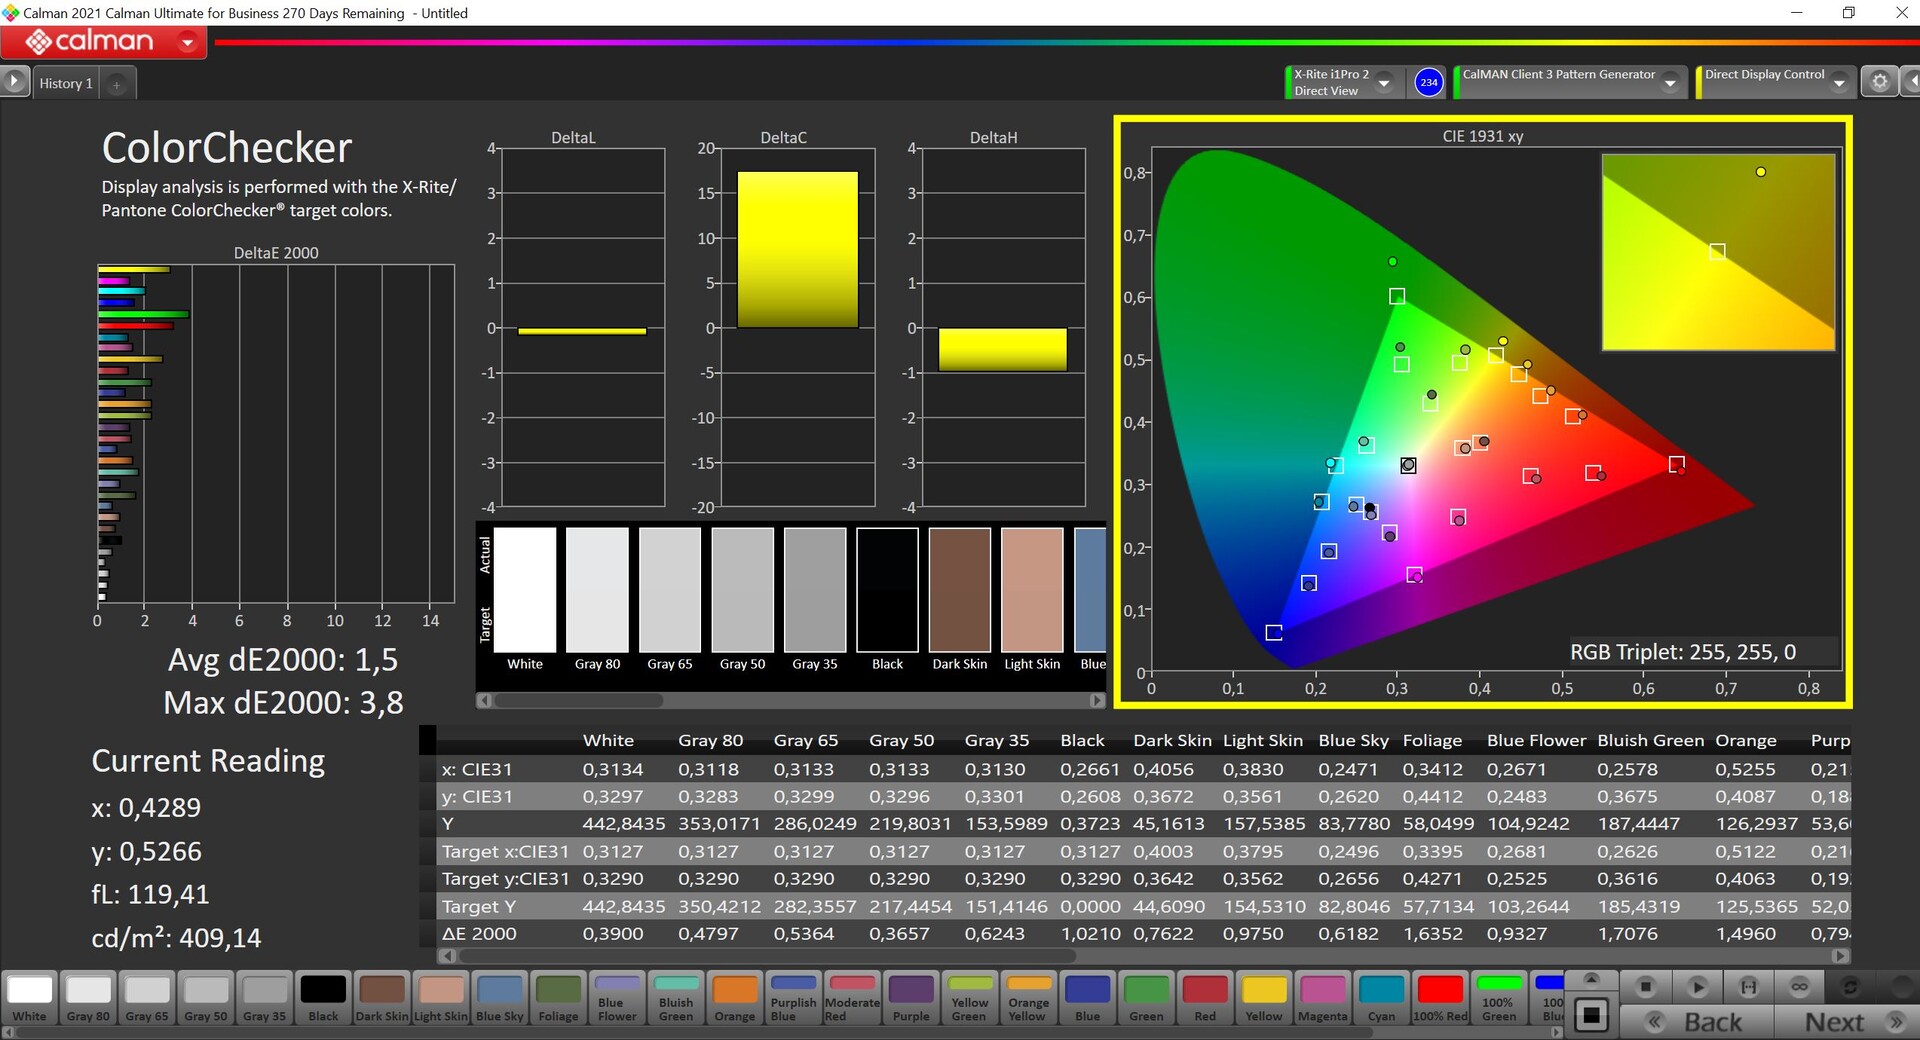
We hebben het paneel getest met professionele CalMAN-software (X-Rite i1 Pro 2): de prestaties bij levering zijn al zeer goed, hoewel we geen verschillen konden ontdekken tussen de sRGB- en Vivid-profielen. Grijstinten vertonen een lichte kleurzweem, maar dit is in de praktijk niet merkbaar. Kleurafwijkingen liggen op koers; alleen de 100%-kleuren vertonen iets grotere afwijkingen (waarbij alleen groen boven de streefwaarde van 3 ligt). We konden deze waarden nog verbeteren via onze eigen kalibratie (profiel hierboven gratis te downloaden), maar dit was niet echt nodig. Qua kleurruimtedekking is het nieuwe paneel echter wat slechter, want sRGB haalt slechts 97,7% dekking (voorheen 100%) en zowel P3 als AdobeRGB zijn ook wat lager dan voorheen.
Responstijd Scherm
| ↔ Responstijd Zwart naar Wit | ||
|---|---|---|
| 19.4 ms ... stijging ↗ en daling ↘ gecombineerd | ↗ 6.8 ms stijging | 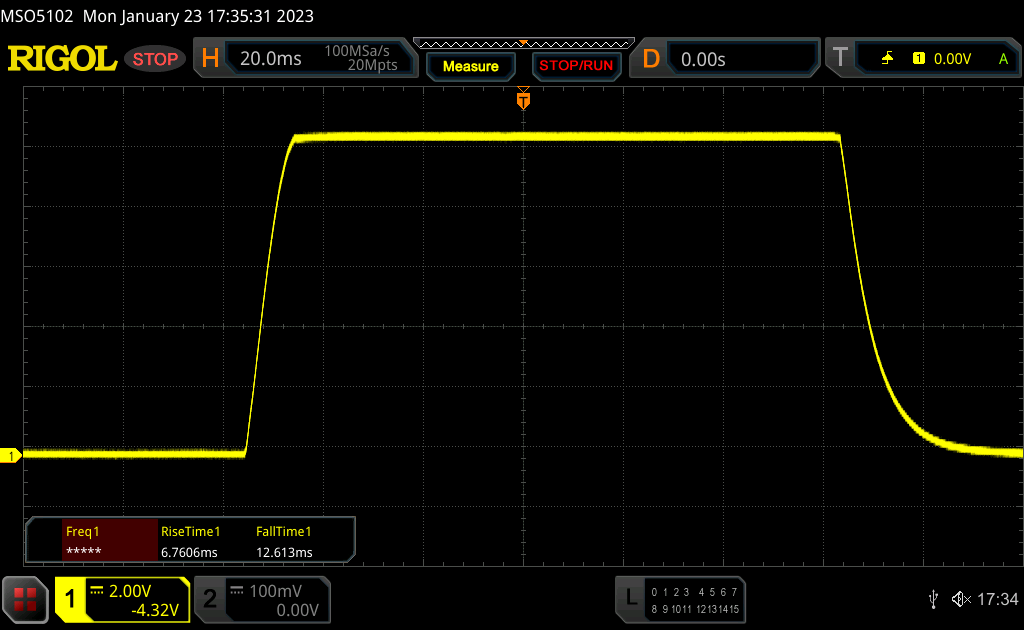 |
| ↘ 12.6 ms daling | ||
| Het scherm vertoonde prima responstijden in onze tests maar is misschien wat te traag voor competitieve games. Ter vergelijking: alle testtoestellen variëren van 0.1 (minimum) tot 240 (maximum) ms. » 43 % van alle toestellen zijn beter. Dit betekent dat de gemeten responstijd vergelijkbaar is met het gemiddelde (19.8 ms) van alle geteste toestellen. | ||
| ↔ Responstijd 50% Grijs naar 80% Grijs | ||
| 13 ms ... stijging ↗ en daling ↘ gecombineerd | ↗ 6 ms stijging | 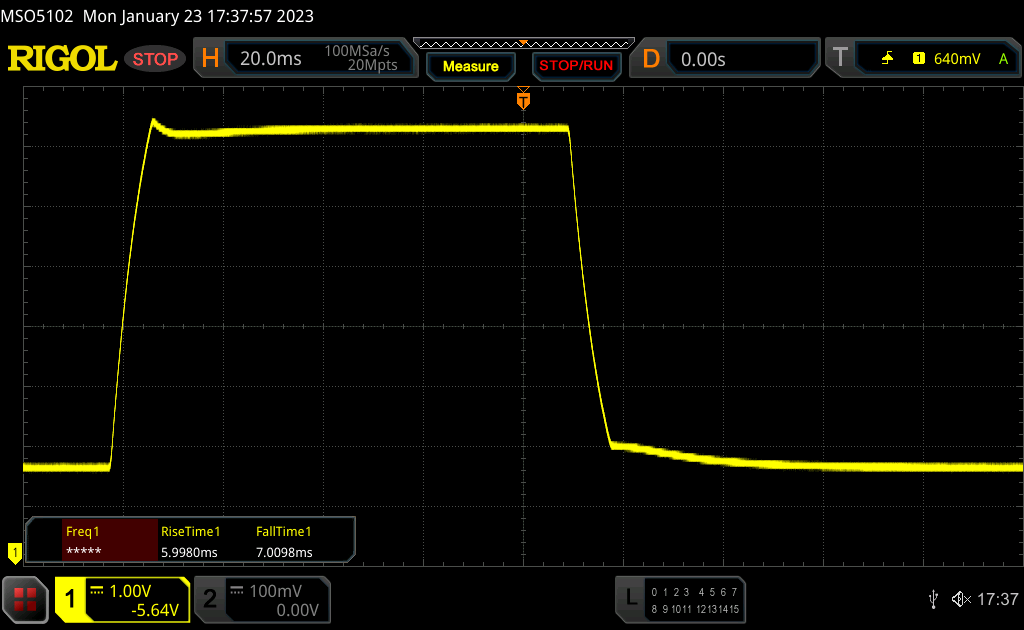 |
| ↘ 7 ms daling | ||
| Het scherm vertoonde prima responstijden in onze tests maar is misschien wat te traag voor competitieve games. Ter vergelijking: alle testtoestellen variëren van 0.165 (minimum) tot 636 (maximum) ms. » 27 % van alle toestellen zijn beter. Dit betekent dat de gemeten responstijd beter is dan het gemiddelde (31 ms) van alle geteste toestellen. | ||
Screen Flickering / PWM (Pulse-Width Modulation)
| Screen flickering / PWM waargenomen | 29896 Hz | ≤ 55 % helderheid instelling | 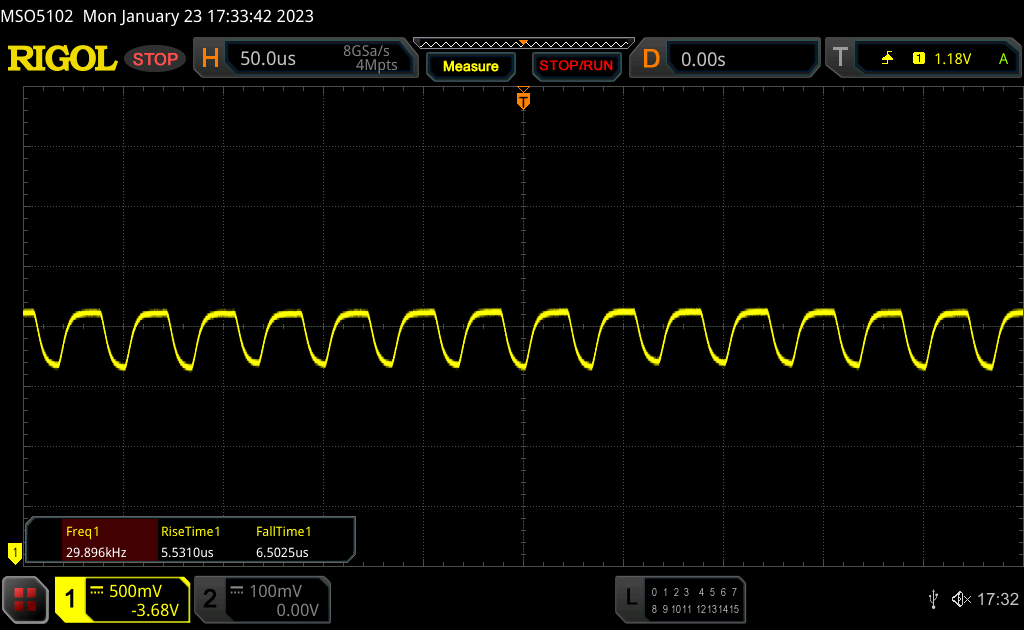 |
De achtergrondverlichting van het scherm flikkert op 29896 Hz (in het slechtste geval, bijvoorbeeld bij gebruik van PWM) aan een helderheid van 55 % en lager. Boven deze helderheid zou er geen flickering / PWM mogen optreden. De frequentie van 29896 Hz is redelijk hoog en de meeste mensen die gevoelig zijn aan flickering zouden dit dus niet mogen waarnemen of geïrriteerde ogen krijgen. Ter vergelijking: 52 % van alle geteste toestellen maakten geen gebruik van PWM om de schermhelderheid te verlagen. Als het wel werd gebruikt, werd een gemiddelde van 7754 (minimum: 5 - maximum: 343500) Hz waargenomen. | |||
Een glanzend schermoppervlak is niet ideaal voor gebruik buitenshuis, zodat u reflecties van lichtbronnen zoveel mogelijk moet vermijden. Alleen dan is het maximale helderheidsniveau voldoende voor het comfortabel bekijken van beeldscherminhoud. De kijkhoekstabiliteit laat geen ruimte voor kritiek.
Prestaties - Alder Lake-U levert aanzienlijk meer vermogen
De Intel-varianten van de nieuwe Surface Pro 9 zijn alleen verkrijgbaar met Alder Lake-processoren in de 15-watt-klasse, ofwel de Core i5 1235Uof de Core i7 1255U. Wie 16 GB RAM of 256 GB opslagruimte nodig heeft, zal moeten kiezen voor de i7-variant. Maximaal 32 GB RAM en een 1 TB SDD is mogelijk (US$2499,99).
Testomstandigheden
Microsoft gebruikt alleen de energie-instellingen van Windows, die qua naam iets afwijken van andere Windows-apparaten(Aanbevolen, Betere prestaties en Beste prestaties). Wij gebruikten Beste prestaties voor de benchmarks en de standaard 60 Hz modus werd gebruikt voor de energiemetingen.
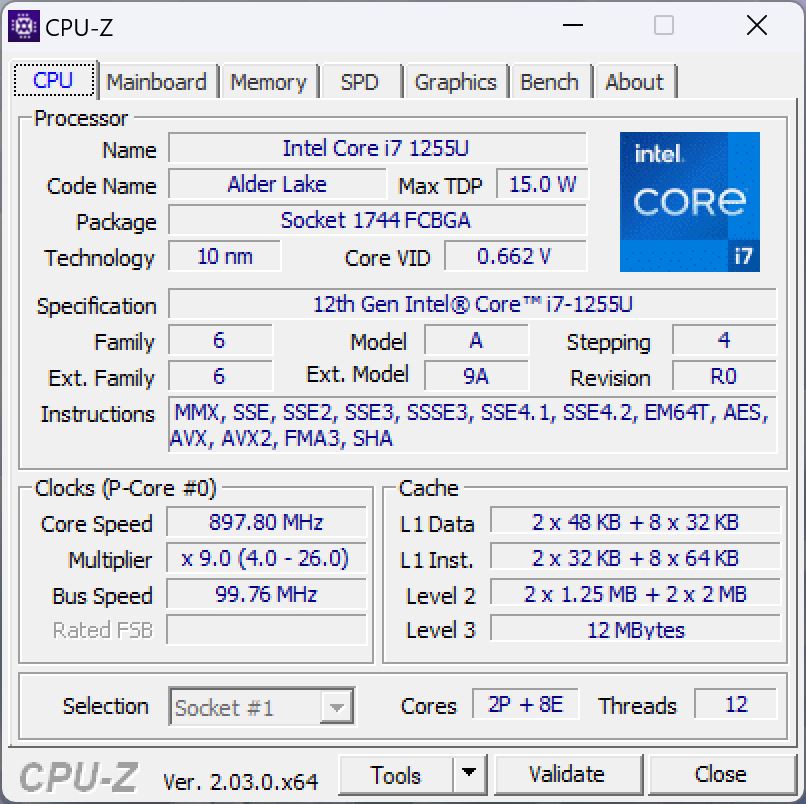
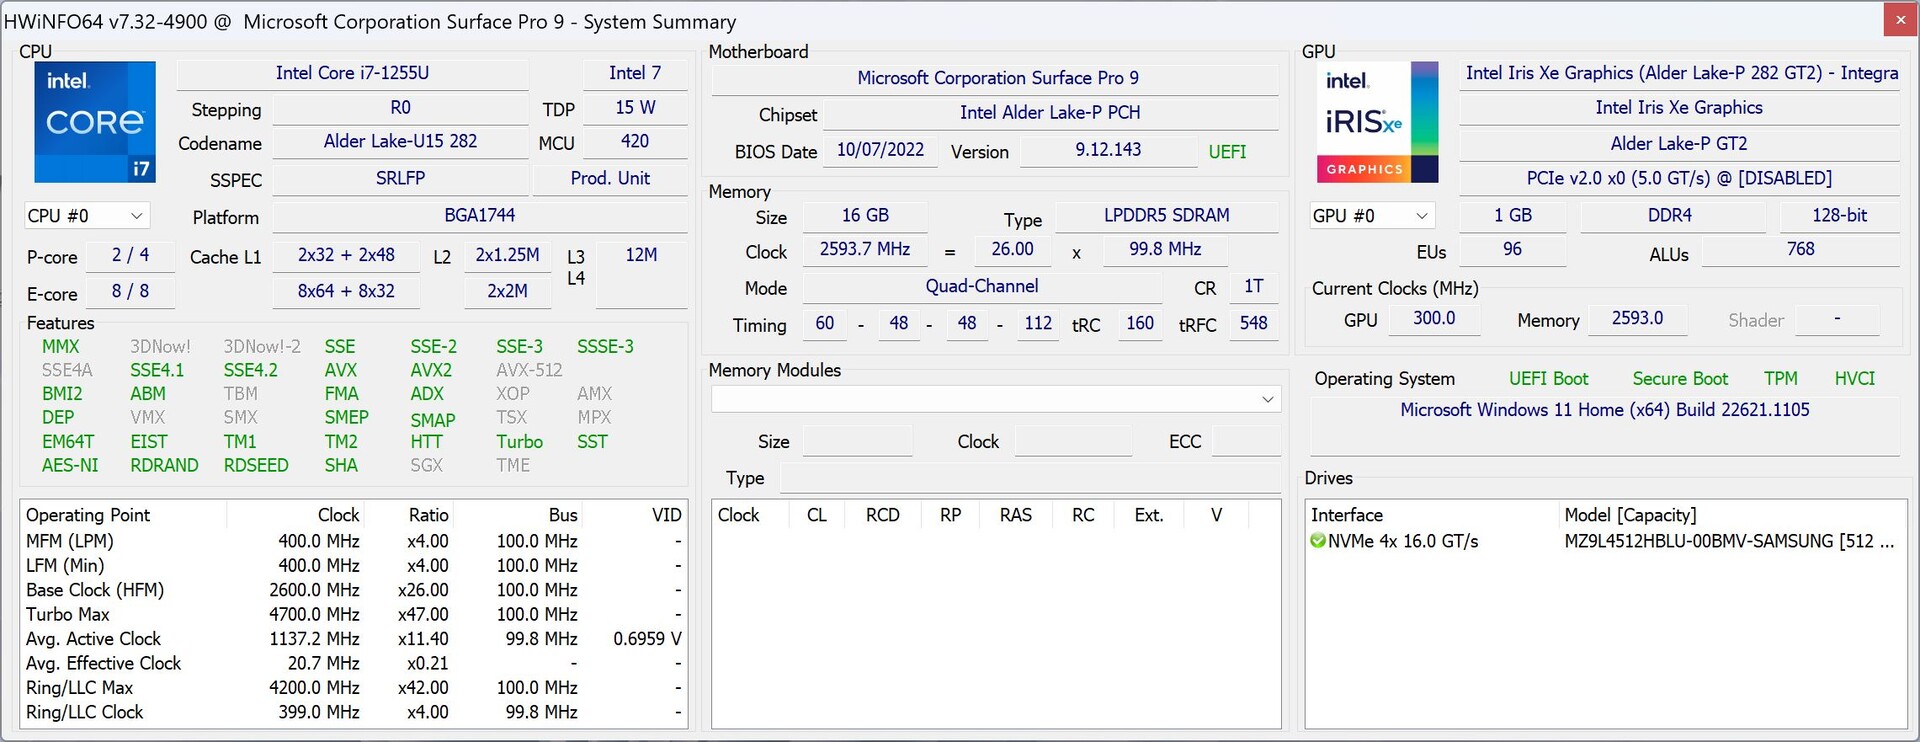
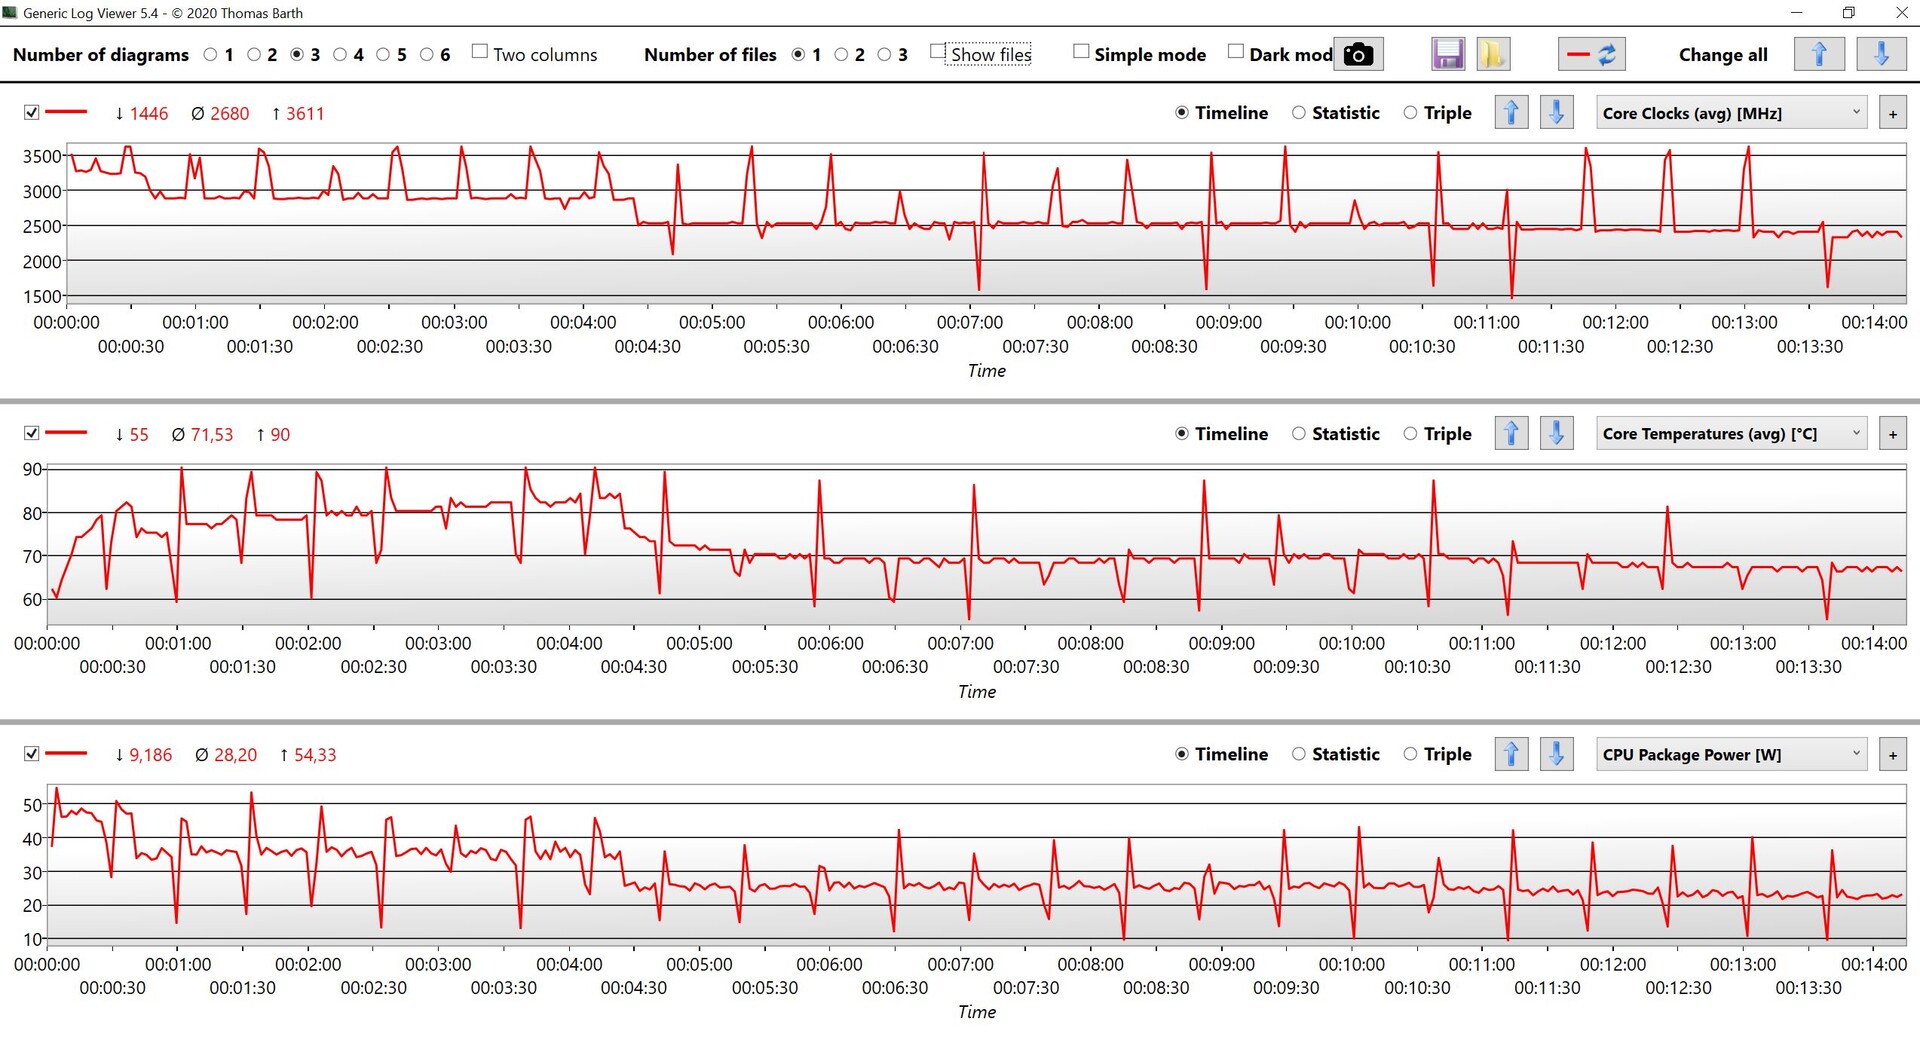
Processor - Core i7-1255U
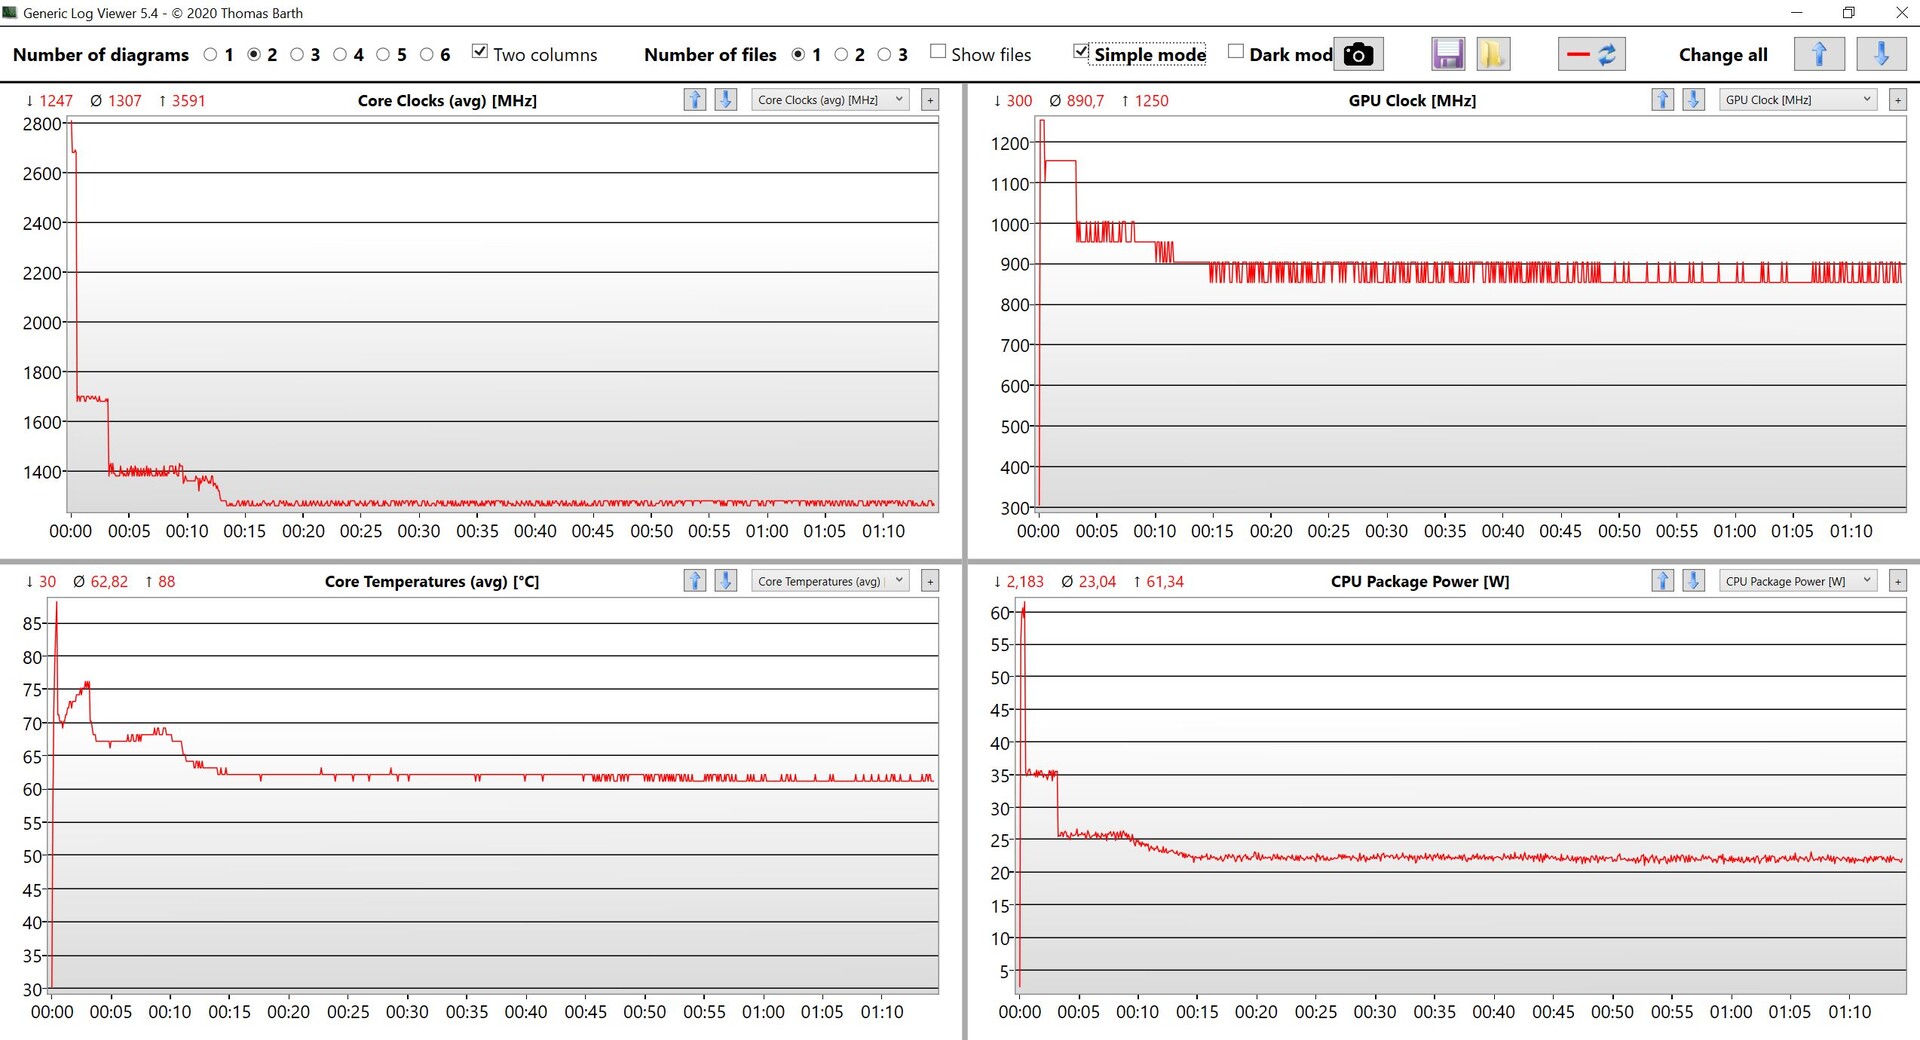
De Core i7 1255Ubehoort tot Intels huidige Alder Lake-generatie en combineert twee snelle prestatiekernen met 8 efficiencykernen. Het is in principe een 15-watt CPU, maar Microsoft geeft de processor hier vrij spel en we namen een maximaal verbruik waar van ongeveer 20 watt onder single-core belasting en tot 54 watt onder multi-core belasting, wat ook in de buurt komt van de maximale limiet van de Alder Lake-U processoren zoals gespecificeerd door Intel. Natuurlijk worden deze waarden maar heel kort volgehouden, maar de Surface Pro 9 kan 35 watt onder constante belasting ongeveer 4,5 minuten volhouden, voordat hij daalt naar ongeveer 25 watt en zelfs verder naar 22 watt. Of deze hoge waarden zinvol zijn, is natuurlijk een andere vraag, want onze recente analyse van de Alder Lake-U CPU's onthulde dat een Alder Lake-P chip (bijvoorbeeld de Core i7 1260P) met twee extra kernen meer prestaties biedt bij dergelijke waarden.
Cinebench R15 Multi Sustained Load
In de CPU-tests wordt de Surface Pro 9 alleen verslagen door deAsus ROG Flow Z13gaming convertible, die ook is uitgerust met de Core i9 12900H.zowel single-core als multi-core prestaties zijn aanzienlijk beter dan in de oude Surface Pro 8 met zijn Core i7 1185G7. Ter vergelijking met de M2-processor in de iPad Pro, hebben we de resultaten van de MacBook Airomdat niet alle benchmarks op de iPad worden ondersteund. De Apple M2 is niet zo snel, maar wel veel efficiënter (~5 watt single-core en ~20 watt multi-core).
In batterijmodus zijn de prestaties van de CPU iets slechter, omdat de vermogensgrenzen zijn verlaagd tot 45/30 watt. In de Cinebench R23 multi-core test leidt dit tot een prestatievermindering van iets minder dan 5%, maar de single-core prestaties zijn niet slechter. Meer CPU-benchmarks zijn beschikbaarhier.
Cinebench R23: Multi Core | Single Core
Cinebench R20: CPU (Multi Core) | CPU (Single Core)
Cinebench R15: CPU Multi 64Bit | CPU Single 64Bit
Blender: v2.79 BMW27 CPU
7-Zip 18.03: 7z b 4 | 7z b 4 -mmt1
Geekbench 5.5: Multi-Core | Single-Core
HWBOT x265 Benchmark v2.2: 4k Preset
LibreOffice : 20 Documents To PDF
R Benchmark 2.5: Overall mean
| CPU Performance rating | |
| Asus ROG Flow Z13 GZ301ZE | |
| Gemiddelde van klas Convertible | |
| Microsoft Surface Pro 9, i7-1255U | |
| Apple MacBook Air M2 10C GPU -5! | |
| HP Elite Dragonfly Folio 13.5 G3 | |
| Gemiddeld Intel Core i7-1255U | |
| Dell XPS 13 9315 2-in-1 Core i5-1230U | |
| Microsoft Surface Pro 8, i7-1185G7 | |
| Lenovo ThinkPad X12 20UVS03G00 -1! | |
| Cinebench R23 / Multi Core | |
| Asus ROG Flow Z13 GZ301ZE | |
| Gemiddelde van klas Convertible (1317 - 30959, n=48, laatste 2 jaar) | |
| Microsoft Surface Pro 9, i7-1255U | |
| Apple MacBook Air M2 10C GPU | |
| Gemiddeld Intel Core i7-1255U (5269 - 9628, n=11) | |
| HP Elite Dragonfly Folio 13.5 G3 | |
| Dell XPS 13 9315 2-in-1 Core i5-1230U | |
| Microsoft Surface Pro 8, i7-1185G7 | |
| Lenovo ThinkPad X12 20UVS03G00 | |
| Cinebench R23 / Single Core | |
| Asus ROG Flow Z13 GZ301ZE | |
| Gemiddelde van klas Convertible (740 - 2188, n=48, laatste 2 jaar) | |
| HP Elite Dragonfly Folio 13.5 G3 | |
| Microsoft Surface Pro 9, i7-1255U | |
| Gemiddeld Intel Core i7-1255U (1408 - 1775, n=11) | |
| Apple MacBook Air M2 10C GPU | |
| Microsoft Surface Pro 8, i7-1185G7 | |
| Dell XPS 13 9315 2-in-1 Core i5-1230U | |
| Lenovo ThinkPad X12 20UVS03G00 | |
| Cinebench R20 / CPU (Multi Core) | |
| Asus ROG Flow Z13 GZ301ZE | |
| Gemiddelde van klas Convertible (595 - 12102, n=48, laatste 2 jaar) | |
| Microsoft Surface Pro 9, i7-1255U | |
| Gemiddeld Intel Core i7-1255U (2095 - 3702, n=11) | |
| HP Elite Dragonfly Folio 13.5 G3 | |
| Dell XPS 13 9315 2-in-1 Core i5-1230U | |
| Apple MacBook Air M2 10C GPU | |
| Microsoft Surface Pro 8, i7-1185G7 | |
| Lenovo ThinkPad X12 20UVS03G00 | |
| Cinebench R20 / CPU (Single Core) | |
| Asus ROG Flow Z13 GZ301ZE | |
| Gemiddelde van klas Convertible (273 - 834, n=48, laatste 2 jaar) | |
| HP Elite Dragonfly Folio 13.5 G3 | |
| Microsoft Surface Pro 9, i7-1255U | |
| Gemiddeld Intel Core i7-1255U (550 - 682, n=11) | |
| Dell XPS 13 9315 2-in-1 Core i5-1230U | |
| Microsoft Surface Pro 8, i7-1185G7 | |
| Lenovo ThinkPad X12 20UVS03G00 | |
| Apple MacBook Air M2 10C GPU | |
| Cinebench R15 / CPU Multi 64Bit | |
| Asus ROG Flow Z13 GZ301ZE | |
| Gemiddelde van klas Convertible (478 - 4940, n=47, laatste 2 jaar) | |
| Microsoft Surface Pro 9, i7-1255U | |
| HP Elite Dragonfly Folio 13.5 G3 | |
| Gemiddeld Intel Core i7-1255U (919 - 1577, n=11) | |
| Dell XPS 13 9315 2-in-1 Core i5-1230U | |
| Apple MacBook Air M2 10C GPU | |
| Microsoft Surface Pro 8, i7-1185G7 | |
| Lenovo ThinkPad X12 20UVS03G00 | |
| Cinebench R15 / CPU Single 64Bit | |
| Asus ROG Flow Z13 GZ301ZE | |
| Gemiddelde van klas Convertible (149.8 - 317, n=47, laatste 2 jaar) | |
| HP Elite Dragonfly Folio 13.5 G3 | |
| Gemiddeld Intel Core i7-1255U (161 - 251, n=12) | |
| Microsoft Surface Pro 8, i7-1185G7 | |
| Apple MacBook Air M2 10C GPU | |
| Microsoft Surface Pro 9, i7-1255U | |
| Dell XPS 13 9315 2-in-1 Core i5-1230U | |
| Lenovo ThinkPad X12 20UVS03G00 | |
| Blender / v2.79 BMW27 CPU | |
| Lenovo ThinkPad X12 20UVS03G00 | |
| Apple MacBook Air M2 10C GPU | |
| Microsoft Surface Pro 8, i7-1185G7 | |
| Dell XPS 13 9315 2-in-1 Core i5-1230U | |
| Gemiddeld Intel Core i7-1255U (372 - 601, n=11) | |
| HP Elite Dragonfly Folio 13.5 G3 | |
| Microsoft Surface Pro 9, i7-1255U | |
| Gemiddelde van klas Convertible (105 - 1051, n=47, laatste 2 jaar) | |
| Asus ROG Flow Z13 GZ301ZE | |
| 7-Zip 18.03 / 7z b 4 | |
| Asus ROG Flow Z13 GZ301ZE | |
| Gemiddelde van klas Convertible (12977 - 121368, n=47, laatste 2 jaar) | |
| Microsoft Surface Pro 9, i7-1255U | |
| Dell XPS 13 9315 2-in-1 Core i5-1230U | |
| HP Elite Dragonfly Folio 13.5 G3 | |
| Gemiddeld Intel Core i7-1255U (24126 - 37365, n=11) | |
| Microsoft Surface Pro 8, i7-1185G7 | |
| Lenovo ThinkPad X12 20UVS03G00 | |
| 7-Zip 18.03 / 7z b 4 -mmt1 | |
| Asus ROG Flow Z13 GZ301ZE | |
| Gemiddelde van klas Convertible (3672 - 6655, n=47, laatste 2 jaar) | |
| Gemiddeld Intel Core i7-1255U (5059 - 5529, n=11) | |
| HP Elite Dragonfly Folio 13.5 G3 | |
| Microsoft Surface Pro 8, i7-1185G7 | |
| Microsoft Surface Pro 9, i7-1255U | |
| Dell XPS 13 9315 2-in-1 Core i5-1230U | |
| Geekbench 5.5 / Multi-Core | |
| Asus ROG Flow Z13 GZ301ZE | |
| Gemiddelde van klas Convertible (1608 - 22023, n=48, laatste 2 jaar) | |
| Apple MacBook Air M2 10C GPU | |
| Microsoft Surface Pro 9, i7-1255U | |
| HP Elite Dragonfly Folio 13.5 G3 | |
| Gemiddeld Intel Core i7-1255U (4463 - 8821, n=12) | |
| Dell XPS 13 9315 2-in-1 Core i5-1230U | |
| Microsoft Surface Pro 8, i7-1185G7 | |
| Lenovo ThinkPad X12 20UVS03G00 | |
| Geekbench 5.5 / Single-Core | |
| Apple MacBook Air M2 10C GPU | |
| Asus ROG Flow Z13 GZ301ZE | |
| Gemiddelde van klas Convertible (806 - 2275, n=48, laatste 2 jaar) | |
| Microsoft Surface Pro 9, i7-1255U | |
| HP Elite Dragonfly Folio 13.5 G3 | |
| Gemiddeld Intel Core i7-1255U (1560 - 1712, n=12) | |
| Microsoft Surface Pro 8, i7-1185G7 | |
| Dell XPS 13 9315 2-in-1 Core i5-1230U | |
| Lenovo ThinkPad X12 20UVS03G00 | |
| HWBOT x265 Benchmark v2.2 / 4k Preset | |
| Asus ROG Flow Z13 GZ301ZE | |
| Gemiddelde van klas Convertible (3.43 - 36.2, n=47, laatste 2 jaar) | |
| Microsoft Surface Pro 9, i7-1255U | |
| HP Elite Dragonfly Folio 13.5 G3 | |
| Gemiddeld Intel Core i7-1255U (6.31 - 10.1, n=11) | |
| Dell XPS 13 9315 2-in-1 Core i5-1230U | |
| Microsoft Surface Pro 8, i7-1185G7 | |
| Lenovo ThinkPad X12 20UVS03G00 | |
| LibreOffice / 20 Documents To PDF | |
| Lenovo ThinkPad X12 20UVS03G00 | |
| Gemiddelde van klas Convertible (42.5 - 84.3, n=47, laatste 2 jaar) | |
| Microsoft Surface Pro 9, i7-1255U | |
| Dell XPS 13 9315 2-in-1 Core i5-1230U | |
| Microsoft Surface Pro 8, i7-1185G7 | |
| HP Elite Dragonfly Folio 13.5 G3 | |
| Gemiddeld Intel Core i7-1255U (35.6 - 52.5, n=11) | |
| Asus ROG Flow Z13 GZ301ZE | |
| R Benchmark 2.5 / Overall mean | |
| Lenovo ThinkPad X12 20UVS03G00 | |
| Microsoft Surface Pro 8, i7-1185G7 | |
| Dell XPS 13 9315 2-in-1 Core i5-1230U | |
| Microsoft Surface Pro 9, i7-1255U | |
| Gemiddeld Intel Core i7-1255U (0.4688 - 0.558, n=11) | |
| Gemiddelde van klas Convertible (0.3915 - 0.84, n=47, laatste 2 jaar) | |
| HP Elite Dragonfly Folio 13.5 G3 | |
| Asus ROG Flow Z13 GZ301ZE | |
* ... kleiner is beter
AIDA64: FP32 Ray-Trace | FPU Julia | CPU SHA3 | CPU Queen | FPU SinJulia | FPU Mandel | CPU AES | CPU ZLib | FP64 Ray-Trace | CPU PhotoWorxx
| Performance rating | |
| Gemiddelde van klas Convertible | |
| Asus ROG Flow Z13 GZ301ZE | |
| Microsoft Surface Pro 9, i7-1255U | |
| HP Elite Dragonfly Folio 13.5 G3 | |
| Gemiddeld Intel Core i7-1255U | |
| Microsoft Surface Pro 8, i7-1185G7 | |
| Dell XPS 13 9315 2-in-1 Core i5-1230U | |
| Lenovo ThinkPad X12 20UVS03G00 | |
| AIDA64 / FP32 Ray-Trace | |
| Gemiddelde van klas Convertible (1480 - 64158, n=47, laatste 2 jaar) | |
| Microsoft Surface Pro 9, i7-1255U | |
| Asus ROG Flow Z13 GZ301ZE | |
| Microsoft Surface Pro 8, i7-1185G7 | |
| Gemiddeld Intel Core i7-1255U (4313 - 8127, n=11) | |
| HP Elite Dragonfly Folio 13.5 G3 | |
| Dell XPS 13 9315 2-in-1 Core i5-1230U | |
| Lenovo ThinkPad X12 20UVS03G00 | |
| AIDA64 / FPU Julia | |
| Gemiddelde van klas Convertible (11392 - 184800, n=47, laatste 2 jaar) | |
| Microsoft Surface Pro 9, i7-1255U | |
| Asus ROG Flow Z13 GZ301ZE | |
| HP Elite Dragonfly Folio 13.5 G3 | |
| Gemiddeld Intel Core i7-1255U (19813 - 41353, n=11) | |
| Dell XPS 13 9315 2-in-1 Core i5-1230U | |
| Microsoft Surface Pro 8, i7-1185G7 | |
| Lenovo ThinkPad X12 20UVS03G00 | |
| AIDA64 / CPU SHA3 | |
| Gemiddelde van klas Convertible (797 - 8291, n=47, laatste 2 jaar) | |
| Asus ROG Flow Z13 GZ301ZE | |
| Microsoft Surface Pro 9, i7-1255U | |
| Microsoft Surface Pro 8, i7-1185G7 | |
| Gemiddeld Intel Core i7-1255U (1325 - 2135, n=11) | |
| HP Elite Dragonfly Folio 13.5 G3 | |
| Dell XPS 13 9315 2-in-1 Core i5-1230U | |
| Lenovo ThinkPad X12 20UVS03G00 | |
| AIDA64 / CPU Queen | |
| Asus ROG Flow Z13 GZ301ZE | |
| Microsoft Surface Pro 9, i7-1255U | |
| HP Elite Dragonfly Folio 13.5 G3 | |
| Gemiddeld Intel Core i7-1255U (61375 - 65892, n=11) | |
| Gemiddelde van klas Convertible (14686 - 148874, n=38, laatste 2 jaar) | |
| Dell XPS 13 9315 2-in-1 Core i5-1230U | |
| Microsoft Surface Pro 8, i7-1185G7 | |
| Lenovo ThinkPad X12 20UVS03G00 | |
| AIDA64 / FPU SinJulia | |
| Asus ROG Flow Z13 GZ301ZE | |
| Gemiddelde van klas Convertible (1120 - 29155, n=47, laatste 2 jaar) | |
| Microsoft Surface Pro 9, i7-1255U | |
| Microsoft Surface Pro 8, i7-1185G7 | |
| Gemiddeld Intel Core i7-1255U (3577 - 5095, n=11) | |
| HP Elite Dragonfly Folio 13.5 G3 | |
| Dell XPS 13 9315 2-in-1 Core i5-1230U | |
| Lenovo ThinkPad X12 20UVS03G00 | |
| AIDA64 / FPU Mandel | |
| Gemiddelde van klas Convertible (4929 - 97193, n=47, laatste 2 jaar) | |
| Asus ROG Flow Z13 GZ301ZE | |
| Microsoft Surface Pro 9, i7-1255U | |
| Microsoft Surface Pro 8, i7-1185G7 | |
| HP Elite Dragonfly Folio 13.5 G3 | |
| Gemiddeld Intel Core i7-1255U (11759 - 20187, n=11) | |
| Dell XPS 13 9315 2-in-1 Core i5-1230U | |
| Lenovo ThinkPad X12 20UVS03G00 | |
| AIDA64 / CPU AES | |
| Asus ROG Flow Z13 GZ301ZE | |
| Lenovo ThinkPad X12 20UVS03G00 | |
| Gemiddelde van klas Convertible (5271 - 190280, n=47, laatste 2 jaar) | |
| Microsoft Surface Pro 9, i7-1255U | |
| Microsoft Surface Pro 8, i7-1185G7 | |
| Gemiddeld Intel Core i7-1255U (27900 - 67458, n=11) | |
| HP Elite Dragonfly Folio 13.5 G3 | |
| Dell XPS 13 9315 2-in-1 Core i5-1230U | |
| AIDA64 / CPU ZLib | |
| Asus ROG Flow Z13 GZ301ZE | |
| Gemiddelde van klas Convertible (218 - 2017, n=47, laatste 2 jaar) | |
| Microsoft Surface Pro 9, i7-1255U | |
| Gemiddeld Intel Core i7-1255U (393 - 640, n=11) | |
| HP Elite Dragonfly Folio 13.5 G3 | |
| Dell XPS 13 9315 2-in-1 Core i5-1230U | |
| Microsoft Surface Pro 8, i7-1185G7 | |
| Lenovo ThinkPad X12 20UVS03G00 | |
| AIDA64 / FP64 Ray-Trace | |
| Gemiddelde van klas Convertible (1169 - 34297, n=47, laatste 2 jaar) | |
| Asus ROG Flow Z13 GZ301ZE | |
| Microsoft Surface Pro 9, i7-1255U | |
| Microsoft Surface Pro 8, i7-1185G7 | |
| HP Elite Dragonfly Folio 13.5 G3 | |
| Gemiddeld Intel Core i7-1255U (2474 - 4400, n=11) | |
| Dell XPS 13 9315 2-in-1 Core i5-1230U | |
| Lenovo ThinkPad X12 20UVS03G00 | |
| AIDA64 / CPU PhotoWorxx | |
| Gemiddelde van klas Convertible (14193 - 85327, n=47, laatste 2 jaar) | |
| Microsoft Surface Pro 9, i7-1255U | |
| Asus ROG Flow Z13 GZ301ZE | |
| HP Elite Dragonfly Folio 13.5 G3 | |
| Microsoft Surface Pro 8, i7-1185G7 | |
| Lenovo ThinkPad X12 20UVS03G00 | |
| Dell XPS 13 9315 2-in-1 Core i5-1230U | |
| Gemiddeld Intel Core i7-1255U (13899 - 44054, n=11) | |
Systeemprestaties
De subjectieve prestaties van de Surface Pro 9 zijn zeer goed en alle ingangen worden zonder vertragingen of hangs uitgevoerd. De PCIe SSD is hier ongetwijfeld verantwoordelijk voor. De prestaties in de synthetische benchmarks zijn ook erg goed.
CrossMark: Overall | Productivity | Creativity | Responsiveness
Jetstream 2: 2.0 Total
Speedometer 2.0: Result 2.0
WebXPRT 3: Overall
WebXPRT 4: Overall
| PCMark 10 / Score | |
| Gemiddelde van klas Convertible (3229 - 10123, n=45, laatste 2 jaar) | |
| Asus ROG Flow Z13 GZ301ZE | |
| HP Elite Dragonfly Folio 13.5 G3 | |
| Gemiddeld Intel Core i7-1255U, Intel Iris Xe Graphics G7 96EUs (4676 - 5523, n=9) | |
| Microsoft Surface Pro 9, i7-1255U | |
| Microsoft Surface Pro 8, i7-1185G7 | |
| Dell XPS 13 9315 2-in-1 Core i5-1230U | |
| Lenovo ThinkPad X12 20UVS03G00 | |
| PCMark 10 / Essentials | |
| HP Elite Dragonfly Folio 13.5 G3 | |
| Asus ROG Flow Z13 GZ301ZE | |
| Gemiddelde van klas Convertible (7233 - 12222, n=45, laatste 2 jaar) | |
| Gemiddeld Intel Core i7-1255U, Intel Iris Xe Graphics G7 96EUs (9381 - 11654, n=9) | |
| Dell XPS 13 9315 2-in-1 Core i5-1230U | |
| Microsoft Surface Pro 9, i7-1255U | |
| Lenovo ThinkPad X12 20UVS03G00 | |
| Microsoft Surface Pro 8, i7-1185G7 | |
| PCMark 10 / Productivity | |
| Gemiddelde van klas Convertible (5062 - 17914, n=45, laatste 2 jaar) | |
| Asus ROG Flow Z13 GZ301ZE | |
| HP Elite Dragonfly Folio 13.5 G3 | |
| Gemiddeld Intel Core i7-1255U, Intel Iris Xe Graphics G7 96EUs (6530 - 7418, n=9) | |
| Dell XPS 13 9315 2-in-1 Core i5-1230U | |
| Microsoft Surface Pro 9, i7-1255U | |
| Microsoft Surface Pro 8, i7-1185G7 | |
| Lenovo ThinkPad X12 20UVS03G00 | |
| PCMark 10 / Digital Content Creation | |
| Gemiddelde van klas Convertible (2496 - 16551, n=45, laatste 2 jaar) | |
| Asus ROG Flow Z13 GZ301ZE | |
| HP Elite Dragonfly Folio 13.5 G3 | |
| Microsoft Surface Pro 9, i7-1255U | |
| Gemiddeld Intel Core i7-1255U, Intel Iris Xe Graphics G7 96EUs (4498 - 6203, n=9) | |
| Microsoft Surface Pro 8, i7-1185G7 | |
| Dell XPS 13 9315 2-in-1 Core i5-1230U | |
| Lenovo ThinkPad X12 20UVS03G00 | |
| CrossMark / Overall | |
| Asus ROG Flow Z13 GZ301ZE | |
| HP Elite Dragonfly Folio 13.5 G3 | |
| Gemiddelde van klas Convertible (524 - 2274, n=48, laatste 2 jaar) | |
| Apple iPad Pro 12.9 2022 | |
| Microsoft Surface Pro 9, i7-1255U | |
| Gemiddeld Intel Core i7-1255U, Intel Iris Xe Graphics G7 96EUs (1329 - 1573, n=9) | |
| Microsoft Surface Pro 8, i7-1185G7 | |
| Dell XPS 13 9315 2-in-1 Core i5-1230U | |
| CrossMark / Productivity | |
| Asus ROG Flow Z13 GZ301ZE | |
| HP Elite Dragonfly Folio 13.5 G3 | |
| Gemiddelde van klas Convertible (554 - 1942, n=48, laatste 2 jaar) | |
| Microsoft Surface Pro 9, i7-1255U | |
| Gemiddeld Intel Core i7-1255U, Intel Iris Xe Graphics G7 96EUs (1364 - 1554, n=9) | |
| Apple iPad Pro 12.9 2022 | |
| Microsoft Surface Pro 8, i7-1185G7 | |
| Dell XPS 13 9315 2-in-1 Core i5-1230U | |
| CrossMark / Creativity | |
| Asus ROG Flow Z13 GZ301ZE | |
| Apple iPad Pro 12.9 2022 | |
| Gemiddelde van klas Convertible (550 - 2949, n=48, laatste 2 jaar) | |
| HP Elite Dragonfly Folio 13.5 G3 | |
| Microsoft Surface Pro 9, i7-1255U | |
| Gemiddeld Intel Core i7-1255U, Intel Iris Xe Graphics G7 96EUs (1372 - 1660, n=9) | |
| Microsoft Surface Pro 8, i7-1185G7 | |
| Dell XPS 13 9315 2-in-1 Core i5-1230U | |
| CrossMark / Responsiveness | |
| Asus ROG Flow Z13 GZ301ZE | |
| HP Elite Dragonfly Folio 13.5 G3 | |
| Gemiddelde van klas Convertible (381 - 1719, n=48, laatste 2 jaar) | |
| Microsoft Surface Pro 9, i7-1255U | |
| Gemiddeld Intel Core i7-1255U, Intel Iris Xe Graphics G7 96EUs (1117 - 1434, n=9) | |
| Dell XPS 13 9315 2-in-1 Core i5-1230U | |
| Apple iPad Pro 12.9 2022 | |
| Microsoft Surface Pro 8, i7-1185G7 | |
| Jetstream 2 / 2.0 Total | |
| Gemiddelde van klas Convertible (127.2 - 454, n=15, laatste 2 jaar) | |
| Microsoft Surface Pro 9, i7-1255U | |
| Gemiddeld Intel Core i7-1255U, Intel Iris Xe Graphics G7 96EUs (206 - 249, n=7) | |
| Dell XPS 13 9315 2-in-1 Core i5-1230U | |
| Apple iPad Pro 12.9 2022 | |
| Asus ROG Flow Z13 GZ301ZE | |
| Microsoft Surface Pro 8, i7-1185G7 | |
| Lenovo ThinkPad X12 20UVS03G00 | |
| Speedometer 2.0 / Result 2.0 | |
| Gemiddelde van klas Convertible (168.2 - 644, n=12, laatste 2 jaar) | |
| Apple iPad Pro 12.9 2022 | |
| Gemiddeld Intel Core i7-1255U, Intel Iris Xe Graphics G7 96EUs (222 - 299, n=5) | |
| Microsoft Surface Pro 9, i7-1255U | |
| Microsoft Surface Pro 8, i7-1185G7 | |
| Asus ROG Flow Z13 GZ301ZE | |
| WebXPRT 3 / Overall | |
| Apple iPad Pro 12.9 2022 | |
| Asus ROG Flow Z13 GZ301ZE | |
| Gemiddelde van klas Convertible (171 - 426, n=48, laatste 2 jaar) | |
| HP Elite Dragonfly Folio 13.5 G3 | |
| Gemiddeld Intel Core i7-1255U, Intel Iris Xe Graphics G7 96EUs (200 - 366, n=9) | |
| Microsoft Surface Pro 9, i7-1255U | |
| Microsoft Surface Pro 8, i7-1185G7 | |
| Dell XPS 13 9315 2-in-1 Core i5-1230U | |
| Lenovo ThinkPad X12 20UVS03G00 | |
| WebXPRT 4 / Overall | |
| Gemiddelde van klas Convertible (91.2 - 317, n=47, laatste 2 jaar) | |
| HP Elite Dragonfly Folio 13.5 G3 | |
| Gemiddeld Intel Core i7-1255U, Intel Iris Xe Graphics G7 96EUs (183.4 - 249, n=9) | |
| Microsoft Surface Pro 9, i7-1255U | |
| Apple iPad Pro 12.9 2022 | |
| Dell XPS 13 9315 2-in-1 Core i5-1230U | |
| PCMark 10 Score | 5257 punten | |
Help | ||
| AIDA64 / Memory Copy | |
| Gemiddelde van klas Convertible (23880 - 161475, n=47, laatste 2 jaar) | |
| Asus ROG Flow Z13 GZ301ZE | |
| Microsoft Surface Pro 9, i7-1255U | |
| HP Elite Dragonfly Folio 13.5 G3 | |
| Dell XPS 13 9315 2-in-1 Core i5-1230U | |
| Microsoft Surface Pro 8, i7-1185G7 | |
| Lenovo ThinkPad X12 20UVS03G00 | |
| Gemiddeld Intel Core i7-1255U (22846 - 67017, n=11) | |
| AIDA64 / Memory Read | |
| Gemiddelde van klas Convertible (19931 - 131960, n=47, laatste 2 jaar) | |
| Asus ROG Flow Z13 GZ301ZE | |
| HP Elite Dragonfly Folio 13.5 G3 | |
| Microsoft Surface Pro 9, i7-1255U | |
| Microsoft Surface Pro 8, i7-1185G7 | |
| Lenovo ThinkPad X12 20UVS03G00 | |
| Dell XPS 13 9315 2-in-1 Core i5-1230U | |
| Gemiddeld Intel Core i7-1255U (22877 - 67398, n=11) | |
| AIDA64 / Memory Write | |
| Gemiddelde van klas Convertible (17473 - 216896, n=47, laatste 2 jaar) | |
| HP Elite Dragonfly Folio 13.5 G3 | |
| Dell XPS 13 9315 2-in-1 Core i5-1230U | |
| Asus ROG Flow Z13 GZ301ZE | |
| Microsoft Surface Pro 9, i7-1255U | |
| Lenovo ThinkPad X12 20UVS03G00 | |
| Microsoft Surface Pro 8, i7-1185G7 | |
| Gemiddeld Intel Core i7-1255U (22883 - 65839, n=11) | |
| AIDA64 / Memory Latency | |
| Gemiddelde van klas Convertible (6.9 - 536, n=47, laatste 2 jaar) | |
| HP Elite Dragonfly Folio 13.5 G3 | |
| Asus ROG Flow Z13 GZ301ZE | |
| Dell XPS 13 9315 2-in-1 Core i5-1230U | |
| Microsoft Surface Pro 9, i7-1255U | |
| Microsoft Surface Pro 8, i7-1185G7 | |
| Lenovo ThinkPad X12 20UVS03G00 | |
| Gemiddeld Intel Core i7-1255U (76 - 163.2, n=11) | |
* ... kleiner is beter
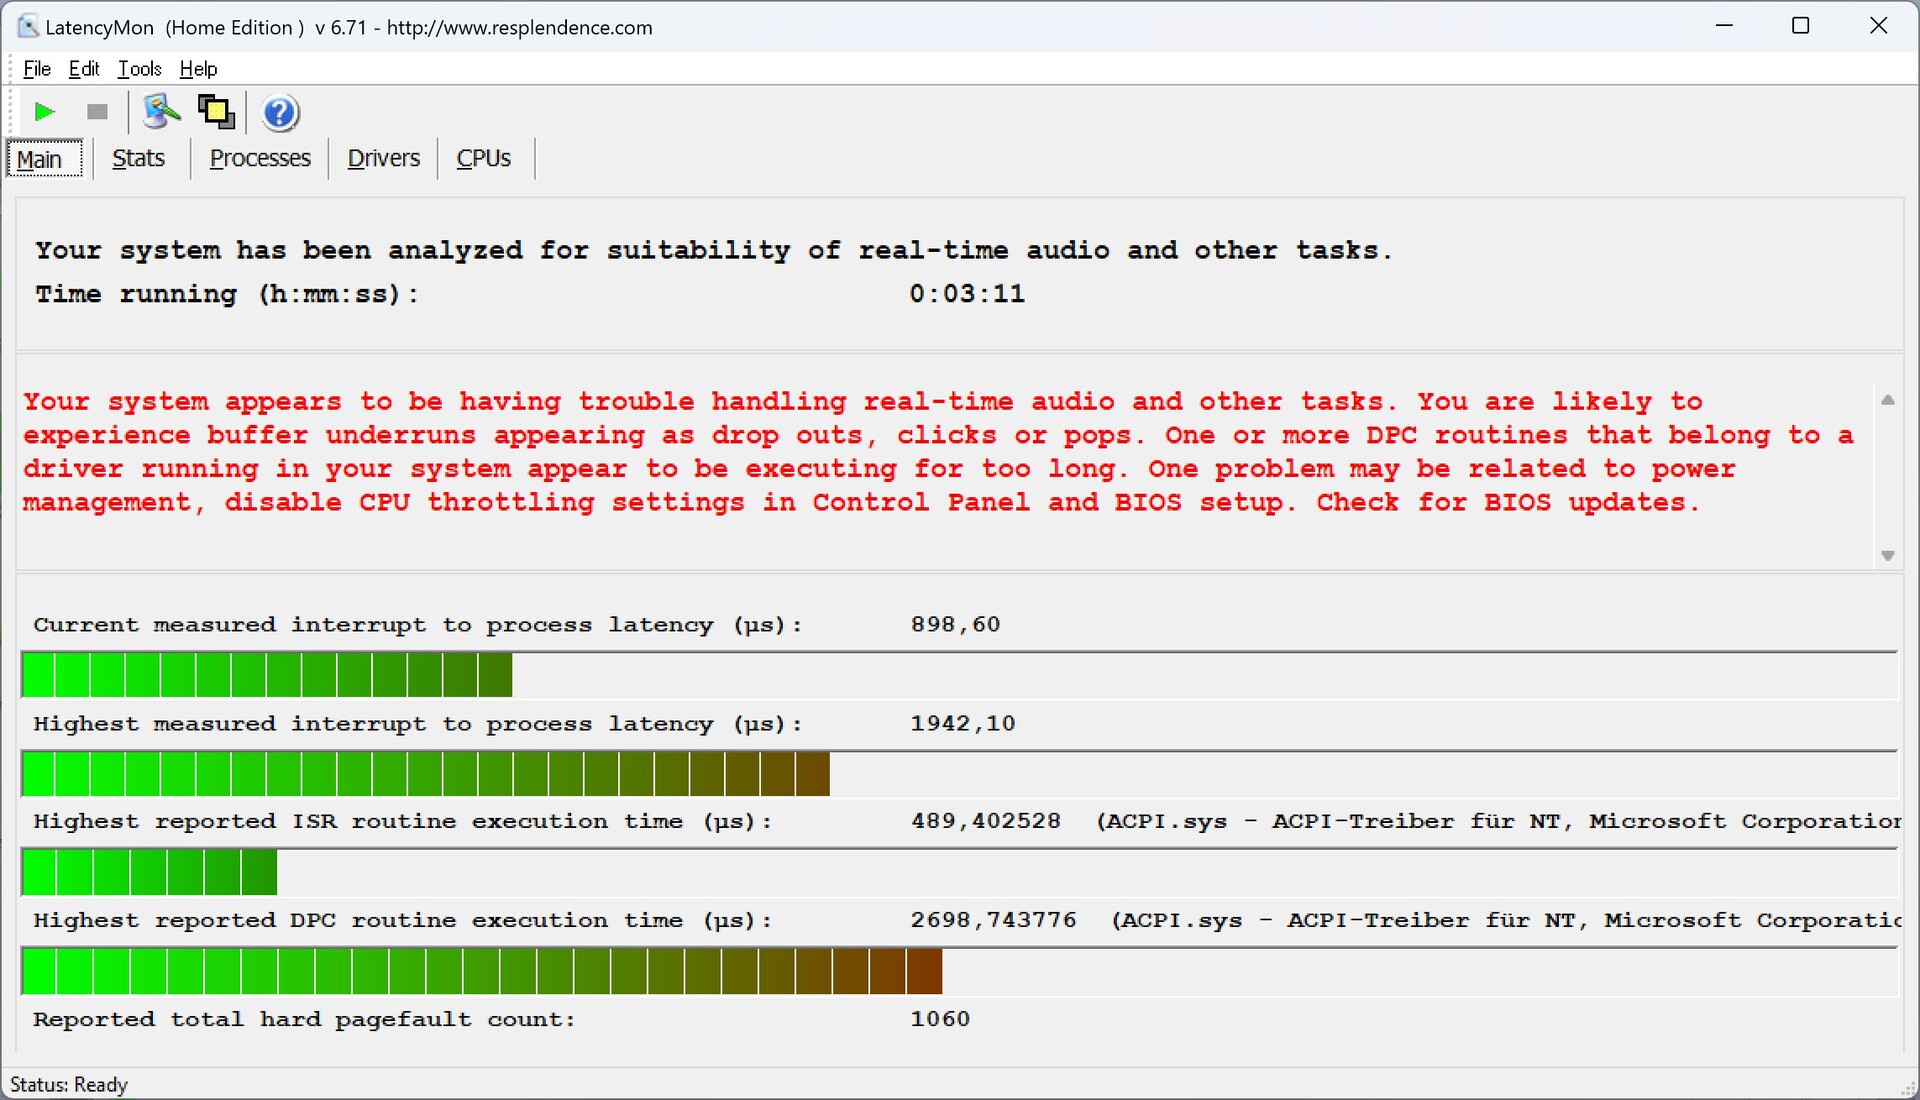
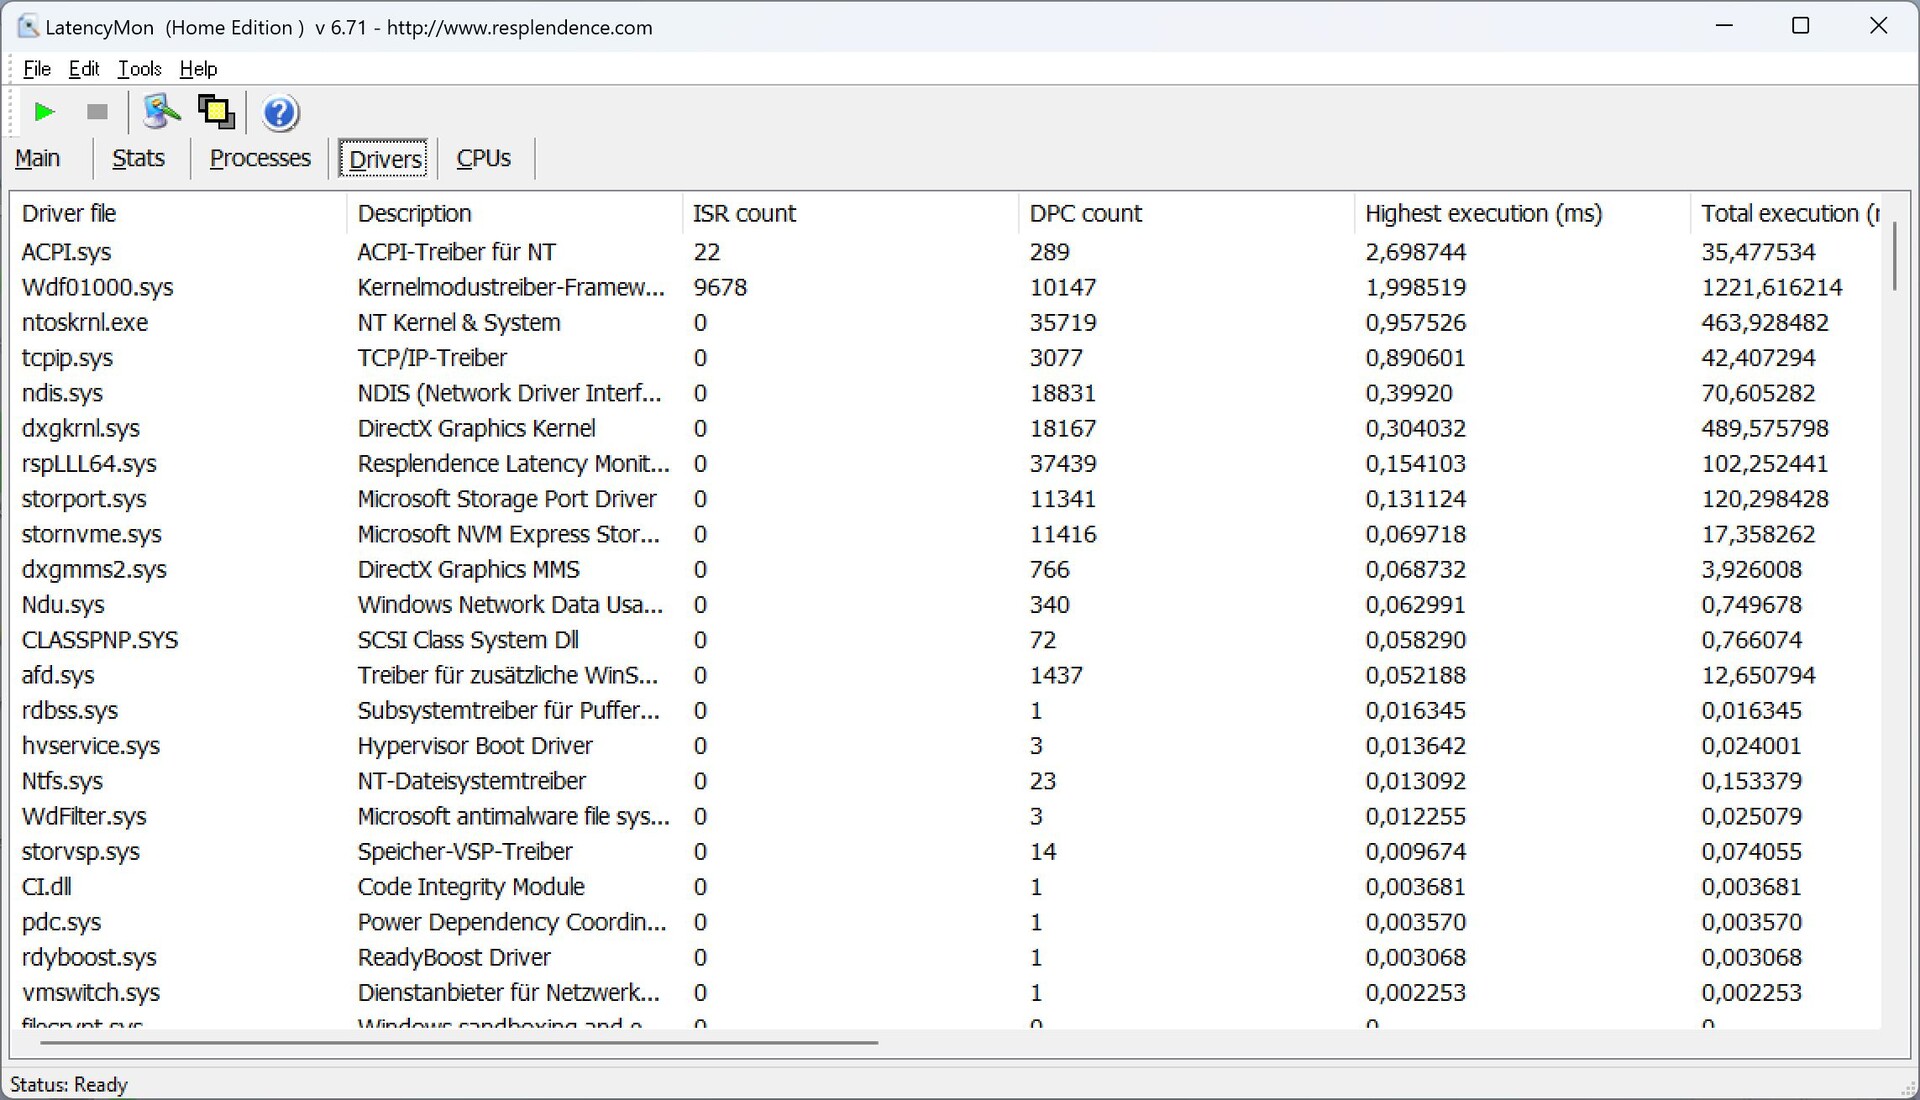
DPC latentie
In onze gestandaardiseerde latentietest (surfen op het web, YouTube 4K afspelen, CPU-belasting) presteert de nieuwe Surface Pro 9 met de huidige BIOS-versie slechter dan zijnvoorgangeren is dus slechts voorwaardelijk geschikt voor real-time audiotoepassingen.
| DPC Latencies / LatencyMon - interrupt to process latency (max), Web, Youtube, Prime95 | |
| HP Elite Dragonfly Folio 13.5 G3 | |
| Dell XPS 13 9315 2-in-1 Core i5-1230U | |
| Microsoft Surface Pro 9, i7-1255U | |
| Asus ROG Flow Z13 GZ301ZE | |
| Microsoft Surface Pro 8, i7-1185G7 | |
| Lenovo ThinkPad X12 20UVS03G00 | |
* ... kleiner is beter
Opslagapparaten
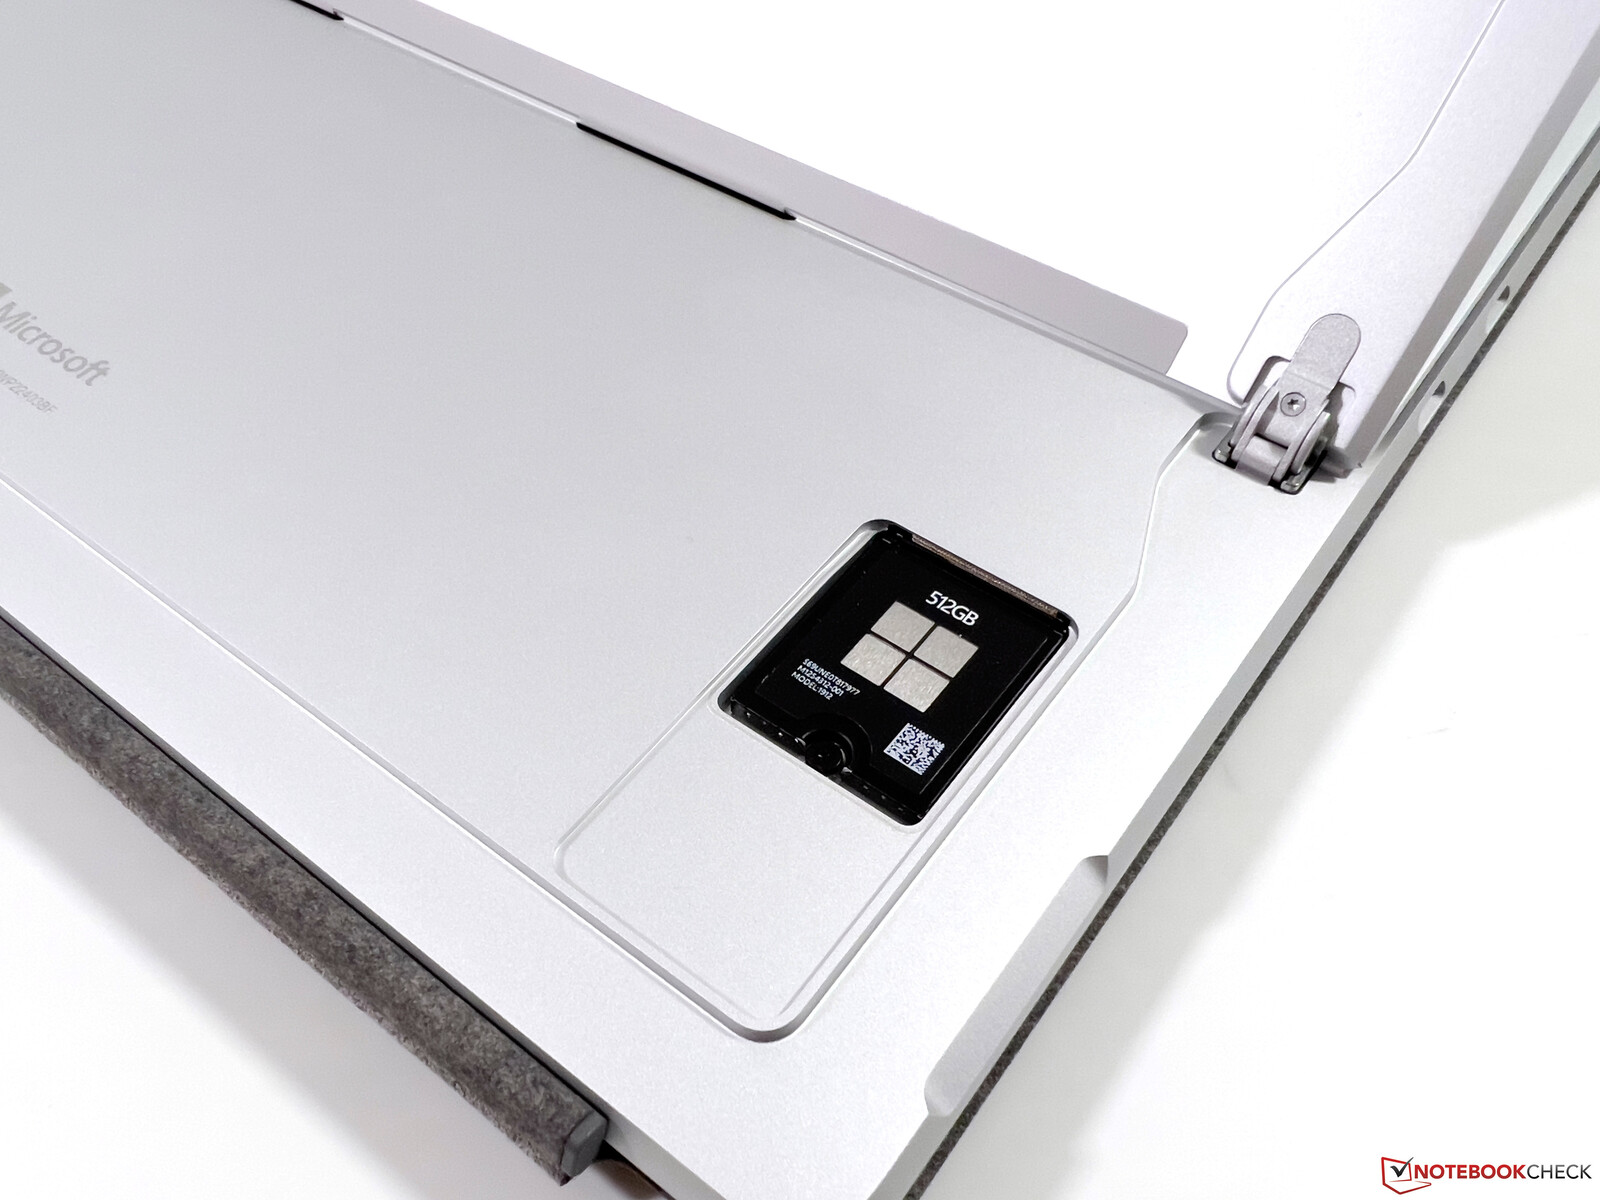
Microsoft gebruikt nog steeds compacte M.2-2230 SSD's en de apparaten kunnen ook door de gebruiker worden vervangen. In ons recensie-exemplaar wordt een 512 GB schijf van Samsung gebruikt, die volgens Microsoft Tools via PCIe 4.0 aangesloten blijkt te zijn. De maximale overdrachtssnelheden zijn echter beperkt tot ongeveer 3,4 GB/s en we weten niet precies of de SSD of de Surface Pro hier de oorzaak van is. Dan nog, dit speelt geen grote rol in het dagelijks gebruik en de snelheid is perfect voldoende. Van de 512 GB is nog 429 GB beschikbaar na installatie van het besturingssysteem. Meer SSD benchmarks staan inonze tech sectie.

* ... kleiner is beter
Dauerleistung Lesen: DiskSpd Read Loop, Queue Depth 8
Grafische kaart
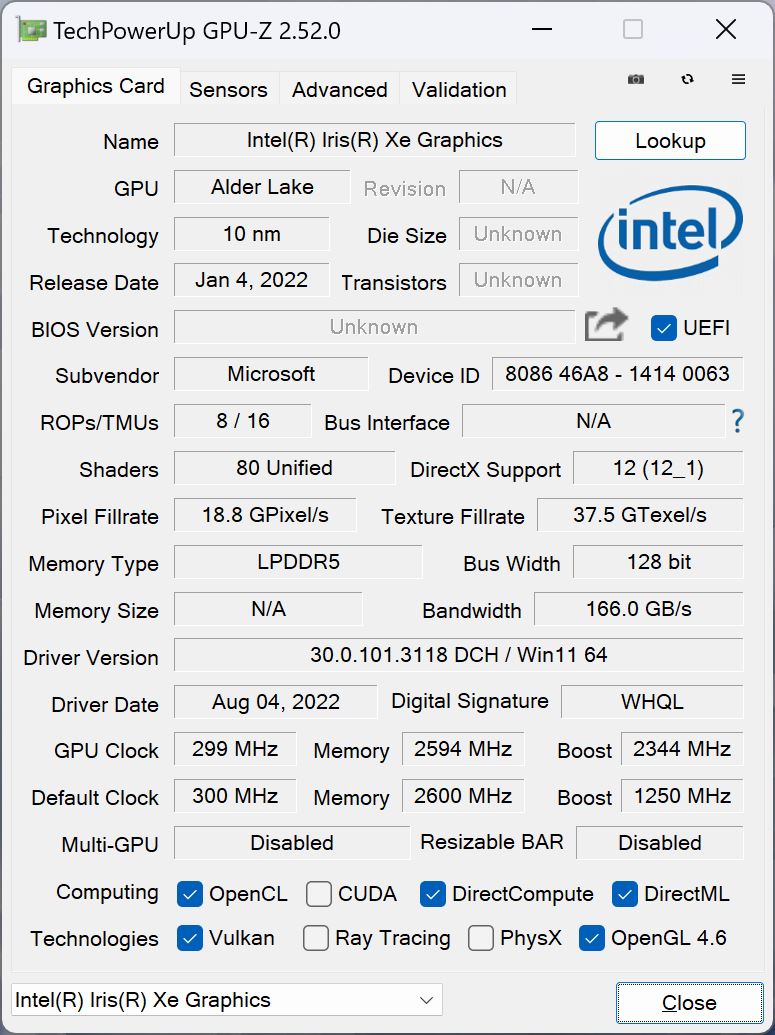
Intels Alder Lake CPU's zijn nog steeds uitgerust met de bekendeIris Xe Graphics G7. In combinatie met de Core i5 1235U wordt de chip met 80 uitvoeringseenheden gebruikt; in ons recensie-exemplaar met de Core i7 hebben we de snellere chip met 96 EU's. Qua prestaties zijn er geen verschillen met het oude model en de geïntegreerde GPU's van AMD en Apple zijn aanzienlijk sneller (hoewel er momenteel vrijwel geen vergelijkbare convertibles/tablets met AMD-hardware zijn).
De prestaties zijn ruim voldoende voor dagelijks gebruik en ook video's in hoge resolutie draaien zonder problemen, maar gamen blijft meestal beperkt tot minimale of gemiddelde details en lagere resoluties. Liefhebbers van gamen kunnen een externe GPU aansluiten of kijken naar deROG Flow Z13die meer gaming prestaties biedt met zijn RTX 3050.
De GPU-prestaties blijven in ieder geval stabiel tijdens lange gamesessies. Op batterijvermogen dalen de prestaties echter met ongeveer 75%. Meer GPU benchmarks zijn beschikbaarhier.
| 3DMark 11 Performance | 6903 punten | |
| 3DMark Fire Strike Score | 4873 punten | |
| 3DMark Time Spy Score | 1821 punten | |
Help | ||
* ... kleiner is beter
| The Witcher 3 - 1920x1080 Ultra Graphics & Postprocessing (HBAO+) | |
| Gemiddelde van klas Convertible (13.4 - 101, n=3, laatste 2 jaar) | |
| Asus ROG Flow Z13 GZ301ZE | |
| Microsoft Surface Pro 8, i7-1185G7 | |
| HP Elite Dragonfly Folio 13.5 G3 | |
| Microsoft Surface Pro 9, i7-1255U | |
| Dell XPS 13 9315 2-in-1 Core i5-1230U | |
| Final Fantasy XV Benchmark - 1920x1080 High Quality | |
| Asus ROG Flow Z13 GZ301ZE | |
| Gemiddelde van klas Convertible (4.48 - 86.6, n=44, laatste 2 jaar) | |
| Microsoft Surface Pro 8, i7-1185G7 | |
| Microsoft Surface Pro 9, i7-1255U | |
| HP Elite Dragonfly Folio 13.5 G3 | |
| Strange Brigade - 1920x1080 ultra AA:ultra AF:16 | |
| Asus ROG Flow Z13 GZ301ZE | |
| Gemiddelde van klas Convertible (10.8 - 176.8, n=44, laatste 2 jaar) | |
| Microsoft Surface Pro 8, i7-1185G7 | |
| Microsoft Surface Pro 9, i7-1255U | |
| HP Elite Dragonfly Folio 13.5 G3 | |
Witcher 3 FPS Chart
| lage | gem. | hoge | ultra | |
|---|---|---|---|---|
| GTA V (2015) | 104.3 | 93.1 | 24.7 | 10.6 |
| The Witcher 3 (2015) | 91 | 59 | 33 | 12.8 |
| Dota 2 Reborn (2015) | 104.2 | 82.2 | 64.8 | 57 |
| Final Fantasy XV Benchmark (2018) | 42.9 | 24.2 | 16.8 | |
| X-Plane 11.11 (2018) | 46.3 | 36.6 | 31.6 | |
| Far Cry 5 (2018) | 28 | 24 | 20 | |
| Strange Brigade (2018) | 88.9 | 41.7 | 32.5 | 26.2 |
| F1 2021 (2021) | 107.8 | 51.6 | 40.6 | 27.8 |
| Farming Simulator 22 (2021) | 81 | 37 | 28 | 26 |
| F1 22 (2022) | 47.4 | 43.5 | 30.7 |
Emissies - Snellere CPU leidt tot meer ventilatoractiviteit
Lawaai
De ventilator van de Surface Pro 9 is vergelijkbaar met de oude Surface Pro 8 op maximale snelheid en bereikt bijna 42 dB(A) bij volle belasting. De kleine ventilator is duidelijk hoorbaar, maar problematischer is dat de ventilator bij dagelijks gebruik vaker aanslaat door de hoge vermogensgrenzen. Kies daarom een zwakkere energiestand voor eenvoudige taken, dan blijft de convertible langer stil bij gewoon gebruik. Er zijn geen andere elektronische geluiden waargenomen. Zowel de XPS 13 9315 en de iPad Prohebben hier natuurlijk een duidelijk voordeel, omdat ze passief gekoeld worden en dus stil blijven.
Geluidsniveau
| Onbelast |
| 24.3 / 24.3 / 24.3 dB (A) |
| Belasting |
| 37.9 / 41.8 dB (A) |
 | ||
30 dB stil 40 dB(A) hoorbaar 50 dB(A) luid |
||
min: | ||
| Microsoft Surface Pro 9, i7-1255U Iris Xe G7 96EUs, i7-1255U, Samsung MZ9L4512HBLU-00BMV | Dell XPS 13 9315 2-in-1 Core i5-1230U Iris Xe G7 80EUs, i5-1230U | Lenovo ThinkPad X12 20UVS03G00 Iris Xe G7 96EUs, i7-1160G7, Toshiba BG4 KBG40ZNT512G | HP Elite Dragonfly Folio 13.5 G3 Iris Xe G7 96EUs, i7-1265U, Samsung PM9A1 MZVL2512HCJQ | Apple iPad Pro 12.9 2022 M2 10-Core GPU, M2, 128 GB NVMe | Asus ROG Flow Z13 GZ301ZE GeForce RTX 3050 Ti Laptop GPU, i9-12900H, Micron 2450 1TB MTFDKBK1T0TFK | Microsoft Surface Pro 8, i7-1185G7 Iris Xe G7 96EUs, i7-1185G7, Toshiba KBG40ZNS256G NVMe | |
|---|---|---|---|---|---|---|---|
| Noise | 2% | 8% | -2% | -0% | |||
| uit / omgeving * (dB) | 24.3 | 25.1 -3% | 24.6 -1% | 24.5 -1% | 24.7 -2% | ||
| Idle Minimum * (dB) | 24.3 | 25.1 -3% | 24.6 -1% | 24.5 -1% | 24.7 -2% | ||
| Idle Average * (dB) | 24.3 | 25.1 -3% | 24.6 -1% | 24.5 -1% | 24.7 -2% | ||
| Idle Maximum * (dB) | 24.3 | 26 -7% | 24.6 -1% | 24.5 -1% | 24.7 -2% | ||
| Load Average * (dB) | 37.9 | 34.6 9% | 27.8 27% | 41 -8% | 36.8 3% | ||
| Witcher 3 ultra * (dB) | 39.6 | 34.6 13% | 33.4 16% | 41 -4% | 36.8 7% | ||
| Load Maximum * (dB) | 41.8 | 37 11% | 33.4 20% | 41 2% | 43.8 -5% |
* ... kleiner is beter
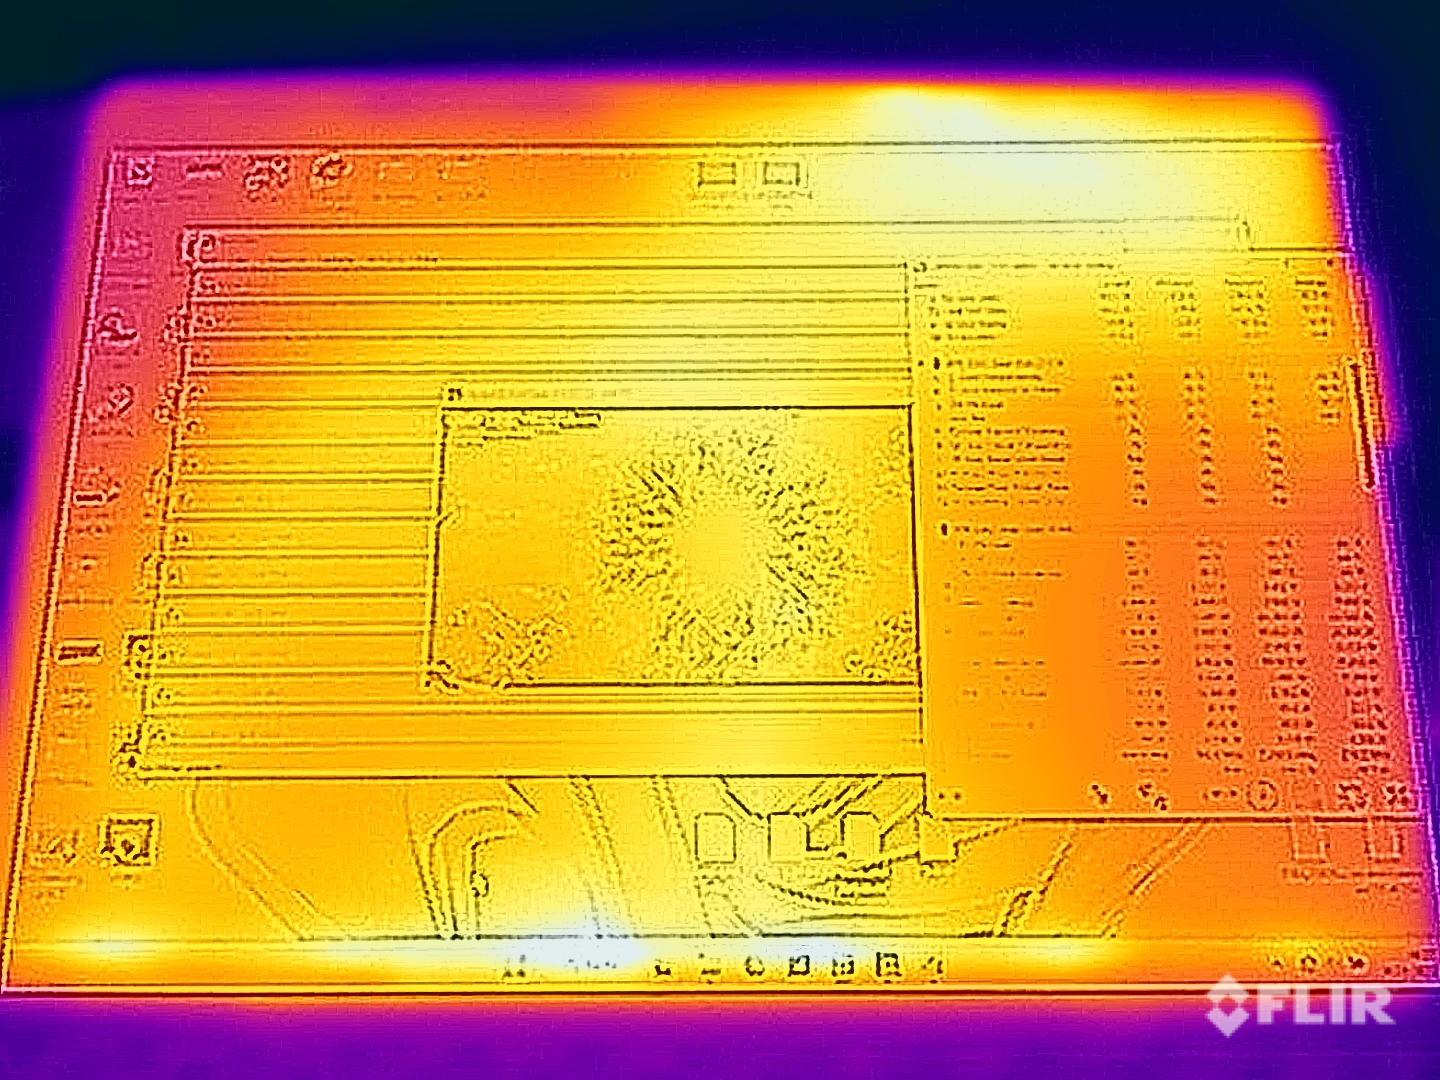
Temperatuur
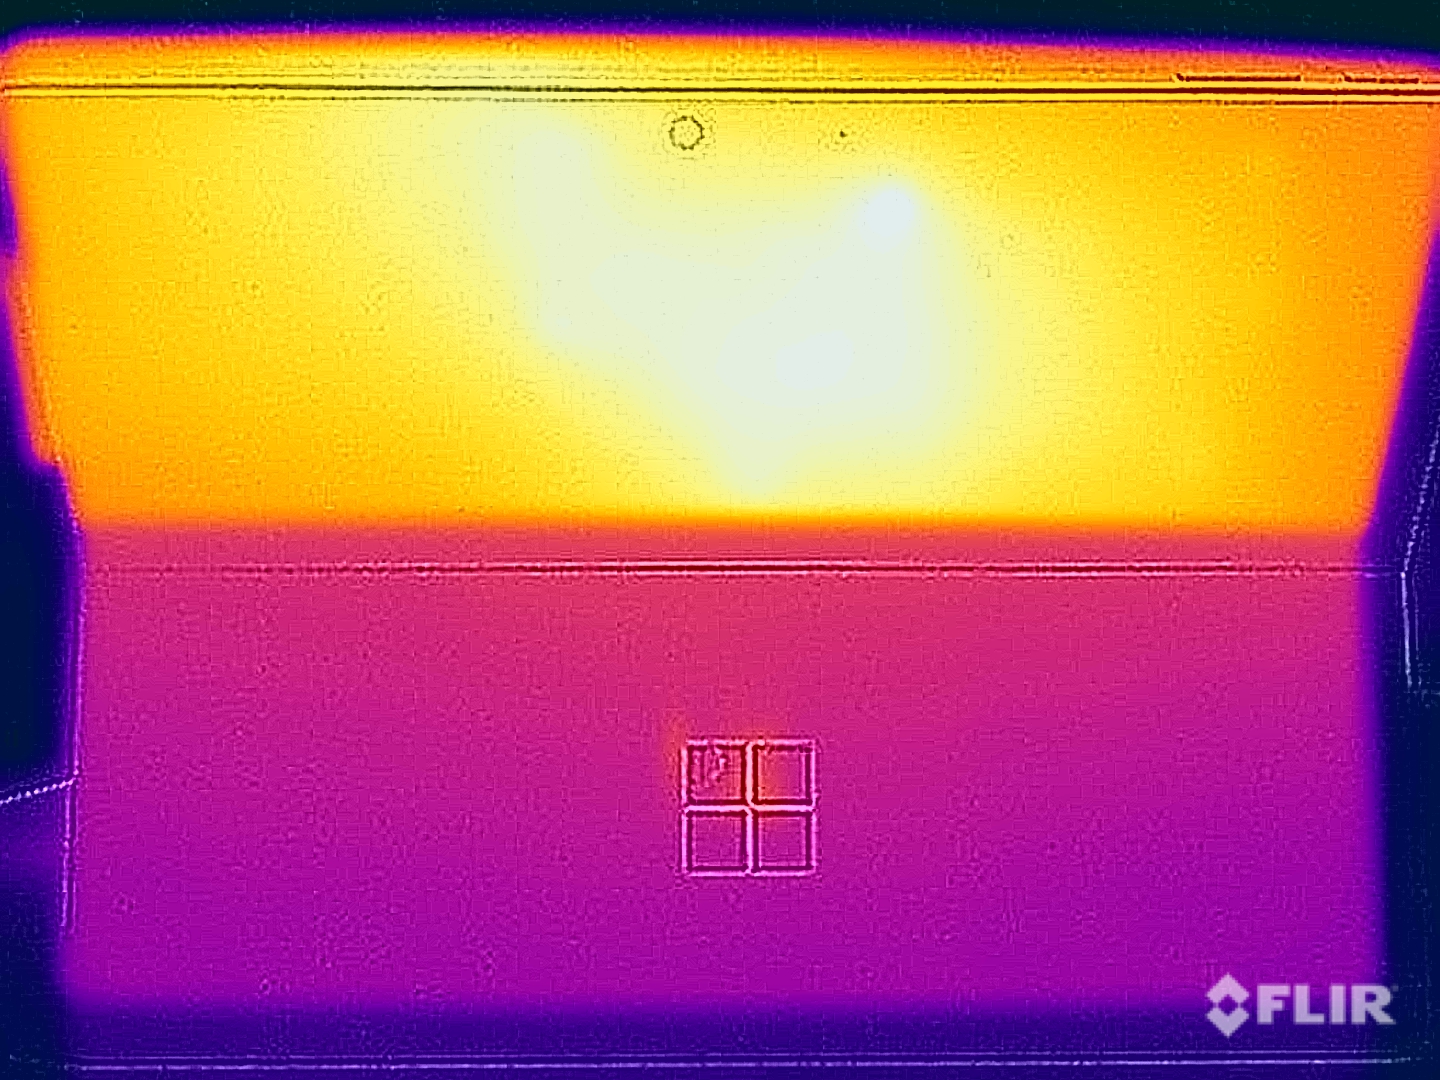
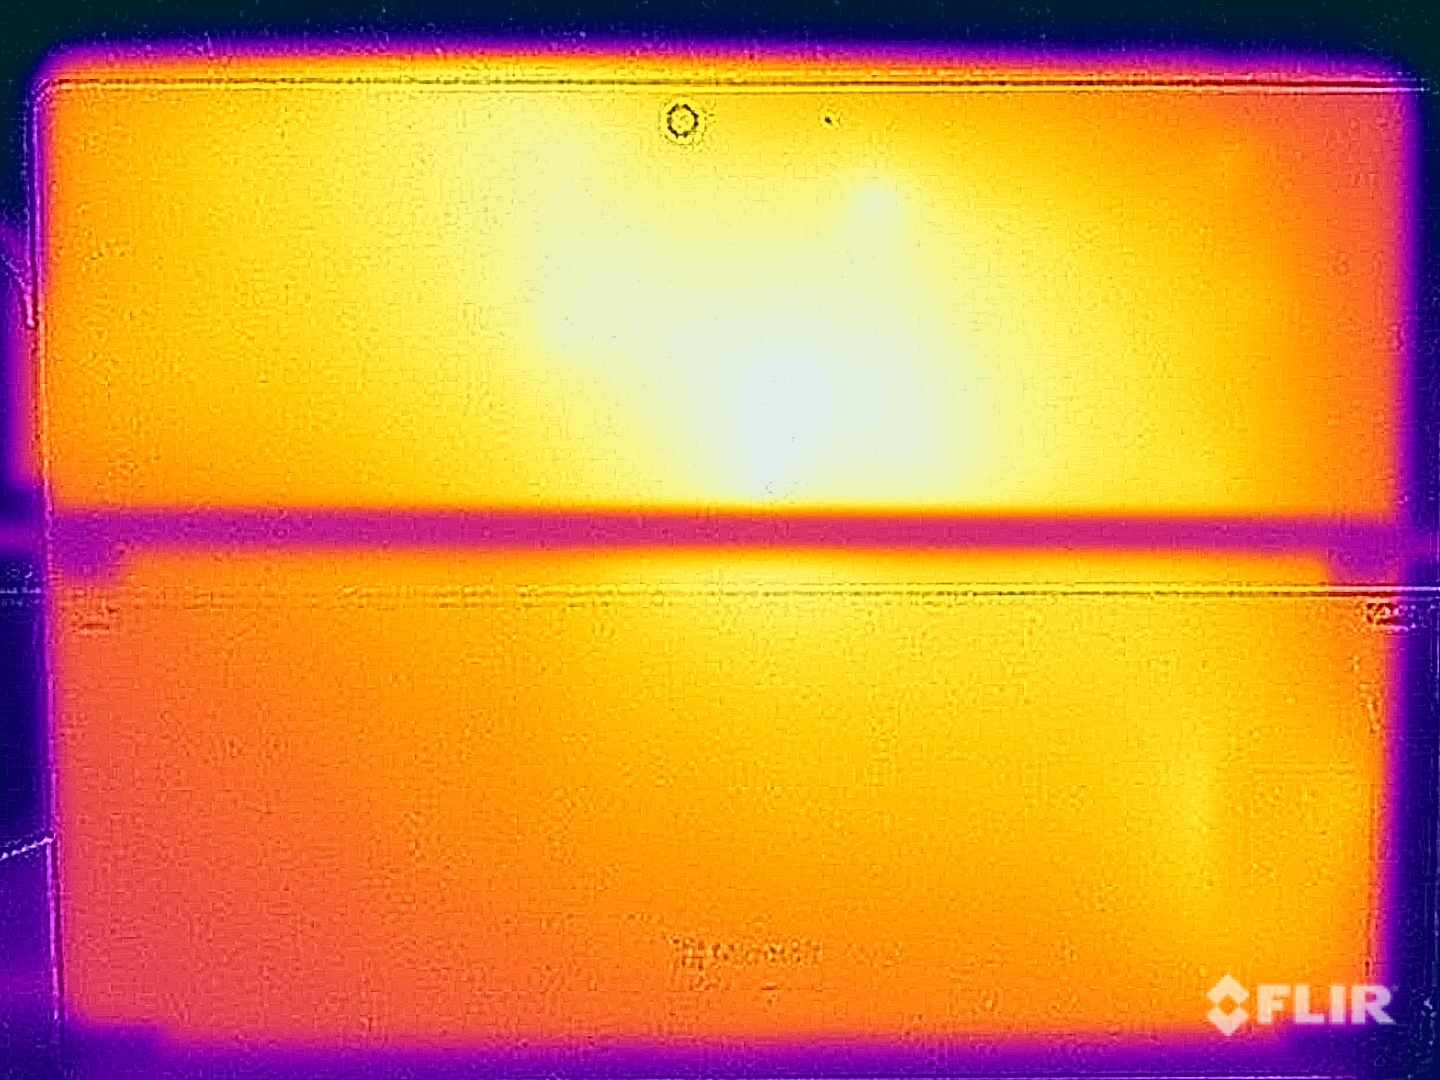
De metalen behuizing van de Surface Pro 9 warmt nauwelijks op bij dagelijks gebruik en tijdens lichte taken, maar we maten meer dan 45 °C op de achterkant onder hoge belasting (bijvoorbeeld hoge CPU-belasting of tijdens het gamen). Door het metalen oppervlak voelt dit onprettig aan en kun je het apparaat in dergelijke situaties beter niet in je handen houden, maar op je bovenbenen of een tafel leggen.
De stresstest toont hetzelfde gedrag als bij pure CPU-belasting. Na een piek van 60 watt, blijft de processor een paar minuten op 35 watt, voordat hij zich vestigt op 22 watt. Het is interessant om hier op te merken dat Microsoft zelfs het maximale verbruik van 55 watt dat (door Intel) voor de Alder Lake-U CPU is opgegeven, overschrijdt.
(±) De maximumtemperatuur aan de bovenzijde bedraagt 44.6 °C / 112 F, vergeleken met het gemiddelde van 35.4 °C / 96 F, variërend van 19.6 tot 60 °C voor de klasse Convertible.
(-) De bodem warmt op tot een maximum van 45.9 °C / 115 F, vergeleken met een gemiddelde van 36.9 °C / 98 F
(+) Bij onbelast gebruik bedraagt de gemiddelde temperatuur voor de bovenzijde 24.6 °C / 76 F, vergeleken met het apparaatgemiddelde van 30.3 °C / 87 F.
(-) Bij het spelen van The Witcher 3 is de gemiddelde temperatuur voor de bovenzijde 41.5 °C / 107 F, vergeleken met het apparaatgemiddelde van 30.3 °C / 87 F.
(-) De palmsteunen en het touchpad kunnen zeer heet aanvoelen met een maximum van ###max## °C / 108.7 F.
(-) De gemiddelde temperatuur van de handpalmsteun van soortgelijke toestellen bedroeg 28 °C / 82.4 F (-14.6 °C / -26.3 F).
| Microsoft Surface Pro 9, i7-1255U Intel Core i7-1255U, Intel Iris Xe Graphics G7 96EUs | Dell XPS 13 9315 2-in-1 Core i5-1230U Intel Core i5-1230U, Intel Iris Xe Graphics G7 80EUs | Lenovo ThinkPad X12 20UVS03G00 Intel Core i7-1160G7, Intel Iris Xe Graphics G7 96EUs | HP Elite Dragonfly Folio 13.5 G3 Intel Core i7-1265U, Intel Iris Xe Graphics G7 96EUs | Apple iPad Pro 12.9 2022 Apple M2, Apple M2 10-Core GPU | Asus ROG Flow Z13 GZ301ZE Intel Core i9-12900H, NVIDIA GeForce RTX 3050 Ti Laptop GPU | Microsoft Surface Pro 8, i7-1185G7 Intel Core i7-1185G7, Intel Iris Xe Graphics G7 96EUs | |
|---|---|---|---|---|---|---|---|
| Heat | 1% | 5% | 14% | -3% | -11% | 2% | |
| Maximum Upper Side * (°C) | 44.6 | 41.8 6% | 39 13% | 32.8 26% | 36.9 17% | 45.3 -2% | 45 -1% |
| Maximum Bottom * (°C) | 45.9 | 38.2 17% | 41.7 9% | 33.4 27% | 37.6 18% | 48.3 -5% | 47.2 -3% |
| Idle Upper Side * (°C) | 24.8 | 27.4 -10% | 25.6 -3% | 24.6 1% | 31.9 -29% | 29.2 -18% | 24.1 3% |
| Idle Bottom * (°C) | 25.3 | 27.2 -8% | 25.6 -1% | 24.6 3% | 29.4 -16% | 30 -19% | 23.4 8% |
* ... kleiner is beter
Luidsprekers
De twee stereoluidsprekers (2 watt) zijn nog steeds erg goed en klinken behoorlijk volumineus. Qua bas moet je echter niet te veel verwachten, wat over het algemeen geldt voor deze apparaatcategorie (bijv. ook voor de luidsprekers van deiPad Pro).
Microsoft Surface Pro 9, i7-1255U audioanalyse
(±) | luidspreker luidheid is gemiddeld maar goed (79.4 dB)
Bas 100 - 315 Hz
(±) | verminderde zeebaars - gemiddeld 11.7% lager dan de mediaan
(±) | lineariteit van de lage tonen is gemiddeld (8.8% delta ten opzichte van de vorige frequentie)
Midden 400 - 2000 Hz
(±) | hogere middens - gemiddeld 5.1% hoger dan de mediaan
(+) | de middentonen zijn lineair (3% delta ten opzichte van de vorige frequentie)
Hoog 2 - 16 kHz
(+) | evenwichtige hoogtepunten - slechts 4% verwijderd van de mediaan
(+) | de hoge tonen zijn lineair (3.4% delta naar de vorige frequentie)
Algemeen 100 - 16.000 Hz
(+) | het totale geluid is lineair (14.9% verschil met de mediaan)
Vergeleken met dezelfde klasse
» 24% van alle geteste apparaten in deze klasse waren beter, 5% vergelijkbaar, 72% slechter
» De beste had een delta van 6%, het gemiddelde was 20%, de slechtste was 57%
Vergeleken met alle geteste toestellen
» 20% van alle geteste apparaten waren beter, 4% gelijk, 76% slechter
» De beste had een delta van 4%, het gemiddelde was 23%, de slechtste was 134%
Apple iPad Pro 12.9 2022 audioanalyse
(+) | luidsprekers kunnen relatief luid spelen (84.3 dB)
Bas 100 - 315 Hz
(±) | verminderde zeebaars - gemiddeld 9.6% lager dan de mediaan
(±) | lineariteit van de lage tonen is gemiddeld (9% delta ten opzichte van de vorige frequentie)
Midden 400 - 2000 Hz
(+) | evenwichtige middens - slechts 2.4% verwijderd van de mediaan
(+) | de middentonen zijn lineair (3.4% delta ten opzichte van de vorige frequentie)
Hoog 2 - 16 kHz
(+) | evenwichtige hoogtepunten - slechts 1.5% verwijderd van de mediaan
(+) | de hoge tonen zijn lineair (3.2% delta naar de vorige frequentie)
Algemeen 100 - 16.000 Hz
(+) | het totale geluid is lineair (8.8% verschil met de mediaan)
Vergeleken met dezelfde klasse
» 2% van alle geteste apparaten in deze klasse waren beter, 2% vergelijkbaar, 96% slechter
» De beste had een delta van 7%, het gemiddelde was 20%, de slechtste was 129%
Vergeleken met alle geteste toestellen
» 3% van alle geteste apparaten waren beter, 1% gelijk, 97% slechter
» De beste had een delta van 4%, het gemiddelde was 23%, de slechtste was 134%
Dell XPS 13 9315 2-in-1 Core i5-1230U audioanalyse
(±) | luidspreker luidheid is gemiddeld maar goed (80.3 dB)
Bas 100 - 315 Hz
(±) | verminderde zeebaars - gemiddeld 8.9% lager dan de mediaan
(+) | de lage tonen zijn lineair (5.7% delta naar de vorige frequentie)
Midden 400 - 2000 Hz
(+) | evenwichtige middens - slechts 2.2% verwijderd van de mediaan
(+) | de middentonen zijn lineair (5.2% delta ten opzichte van de vorige frequentie)
Hoog 2 - 16 kHz
(±) | higher highs - on average 5.5% higher than median
(+) | de hoge tonen zijn lineair (6.8% delta naar de vorige frequentie)
Algemeen 100 - 16.000 Hz
(+) | het totale geluid is lineair (11.9% verschil met de mediaan)
Vergeleken met dezelfde klasse
» 11% van alle geteste apparaten in deze klasse waren beter, 3% vergelijkbaar, 85% slechter
» De beste had een delta van 6%, het gemiddelde was 20%, de slechtste was 57%
Vergeleken met alle geteste toestellen
» 9% van alle geteste apparaten waren beter, 2% gelijk, 89% slechter
» De beste had een delta van 4%, het gemiddelde was 23%, de slechtste was 134%
Energiebeheer - 120 Hz kost batterijduur
Stroomverbruik
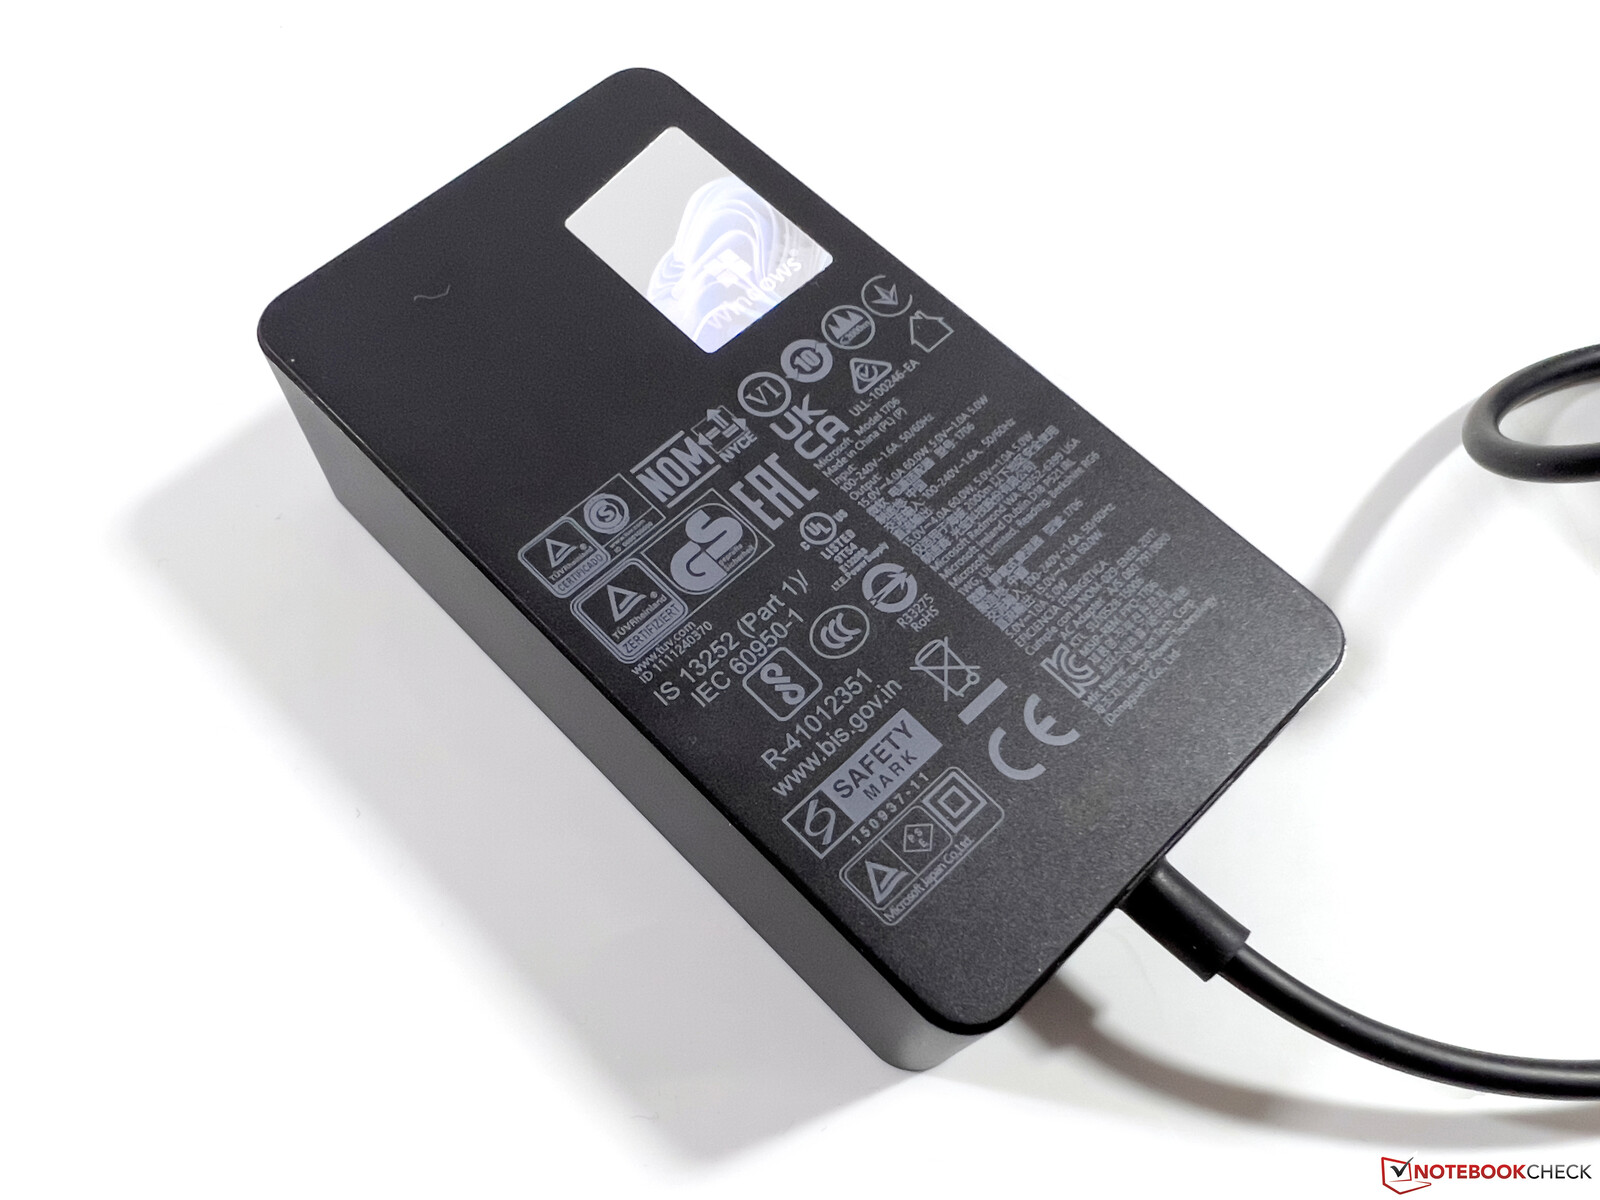
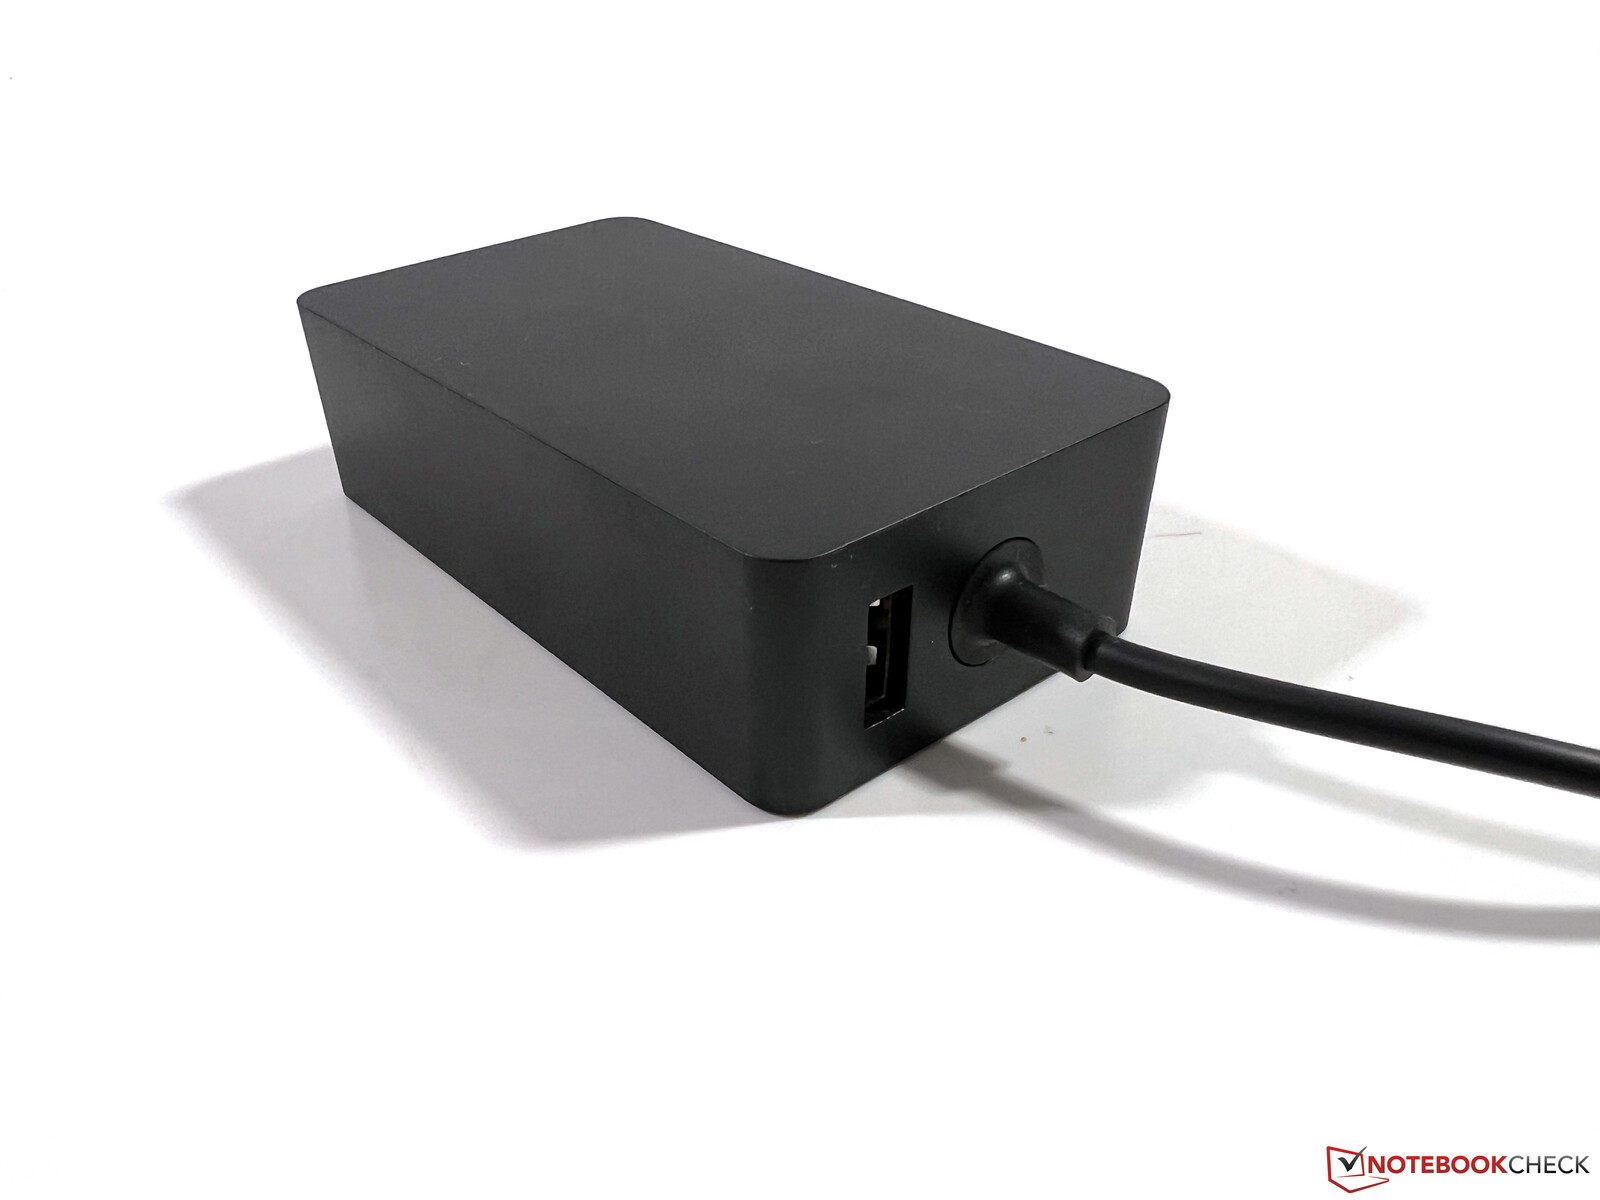
We hebben de vermogensmetingen ook uitgevoerd in 60 Hz modus, maar de rustwaarden van 5,1 tot 11,3 watt zijn iets hoger dan bij het oude model. De waarden zijn vergelijkbaar onder belasting, maar de hoge vermogensgrenzen van de processor worden merkbaar onder volledige belasting, want we bereikten de limiet van de voeding van 68 watt in de eerste ~30 seconden. Hier moet het apparaat even de batterij aanspreken om de benodigde energie te leveren. Daarna vlakt het verbruik af op lagere waarden (eerst ~58 en dan ~46 watt), dus de 60 watt voeding is in de praktijk nog steeds voldoende.
Microsoft is erin geslaagd het stroomverbruik bij uitschakeling en in stand-by te verminderen. De voeding biedt ook een USB-A-poort, waarmee bijvoorbeeld een smartphone kan worden opgeladen (max. 5 watt).
| Uit / Standby | |
| Inactief | |
| Belasting |
|
Key:
min: | |
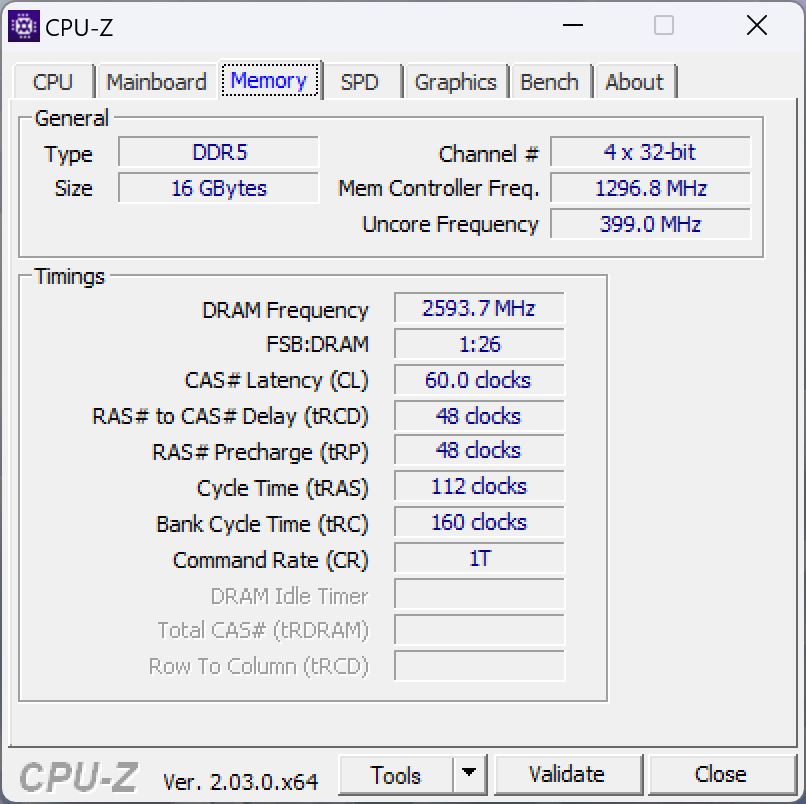
| Microsoft Surface Pro 9, i7-1255U i7-1255U, Iris Xe G7 96EUs, Samsung MZ9L4512HBLU-00BMV, IPS, 2880x1920, 13" | Dell XPS 13 9315 2-in-1 Core i5-1230U i5-1230U, Iris Xe G7 80EUs, , IPS, 2880x1920, 13" | Lenovo ThinkPad X12 20UVS03G00 i7-1160G7, Iris Xe G7 96EUs, Toshiba BG4 KBG40ZNT512G, a-Si IPS LED, 1920x1280, 12.3" | HP Elite Dragonfly Folio 13.5 G3 i7-1265U, Iris Xe G7 96EUs, Samsung PM9A1 MZVL2512HCJQ, IPS, 1920x1280, 13.5" | Apple iPad Pro 12.9 2022 M2, M2 10-Core GPU, 128 GB NVMe, Mini-LED, 2732x2048, 12.9" | Asus ROG Flow Z13 GZ301ZE i9-12900H, GeForce RTX 3050 Ti Laptop GPU, Micron 2450 1TB MTFDKBK1T0TFK, IPS, 1920x1200, 13.4" | Microsoft Surface Pro 8, i7-1185G7 i7-1185G7, Iris Xe G7 96EUs, Toshiba KBG40ZNS256G NVMe, IPS, 2880x1920, 13" | Gemiddeld Intel Iris Xe Graphics G7 96EUs | Gemiddelde van klas Convertible | |
|---|---|---|---|---|---|---|---|---|---|
| Power Consumption | 22% | 26% | 19% | 36% | -54% | 7% | 3% | 16% | |
| Idle Minimum * (Watt) | 5.1 | 5.2 -2% | 4 22% | 3.4 33% | 2.54 50% | 8.8 -73% | 3.9 24% | 5.51 ? -8% | 4.2 ? 18% |
| Idle Average * (Watt) | 9.8 | 7.9 19% | 5.9 40% | 4.9 50% | 11.24 -15% | 12.1 -23% | 8.5 13% | 8.66 ? 12% | 6.89 ? 30% |
| Idle Maximum * (Watt) | 11.3 | 8 29% | 8.3 27% | 9.3 18% | 11.48 -2% | 12.7 -12% | 9.8 13% | 10.9 ? 4% | 8.63 ? 24% |
| Load Average * (Watt) | 47.5 | 31.2 34% | 30.1 37% | 41.9 12% | 12.97 73% | 72.3 -52% | 48 -1% | 45.6 ? 4% | 44.1 ? 7% |
| Witcher 3 ultra * (Watt) | 36 | 28.2 22% | 30.8 14% | 36.4 -1% | 77.3 -115% | 41.5 -15% | |||
| Load Maximum * (Watt) | 68.5 | 47.6 31% | 59 14% | 67.5 1% | 16.6 76% | 103.1 -51% | 63 8% | 67.8 ? 1% | 66.5 ? 3% |
* ... kleiner is beter
Power Consumption Witcher 3 / Stress Test
Power Consumption with an External Monitor
Levensduur van de batterij
Microsoft heeft de batterijcapaciteit teruggebracht van 51,5 naar 47,7 Wh, maar over het algemeen zijn de runtimes zeer vergelijkbaar met de oude Surface Pro 8bij een helderheid van 150 cd/m² (overeenkomend met 62% van de maximale helderheid op het reviewtoestel). In de videotest was bijna 9,5 uur mogelijk, en 7,5 uur voor de Wi-Fi-test. Onze Wi-Fi-test loopt iets langer dan 5 uur op maximale helderheid.
Zodra je overschakelt naar de 120 Hz modus daalt de looptijd weer merkbaar. We hebben de waarden voor de drie scenario's in de onderstaande tabel opgesomd. Je kunt de 120 Hz modus dus beter vermijden als je onderweg bent.
| WLAN-test maximale helderheid | WLAN-test 150 cd/m² | Videotest | |
|---|---|---|---|
| 60 Hz | 314 minuten | 451 minuten | 562 minuten |
| 120 Hz | 274 minuten | 369 minuten | 529 minuten |
In vergelijking met zijn concurrenten ligt de Surface Pro 9 alleen voor op deAsus ROG Flow Z13 gaming convertible, maar alle andere concurrenten bieden meer uithoudingsvermogen. Een volledige lading duurt ongeveer 2 uur met het apparaat ingeschakeld, waarbij 35% beschikbaar is na 21 minuten en 80% na ongeveer 63 minuten.
Opmerking: de beweringen van Microsoft over de batterijduur zijn aanzienlijk hoger met maximaal 15,5 uur normaal gebruik, maar omvatten ook tijden in stand-by modus.
| Microsoft Surface Pro 9, i7-1255U i7-1255U, Iris Xe G7 96EUs, 47.7 Wh | Dell XPS 13 9315 2-in-1 Core i5-1230U i5-1230U, Iris Xe G7 80EUs, 49.5 Wh | Lenovo ThinkPad X12 20UVS03G00 i7-1160G7, Iris Xe G7 96EUs, 42 Wh | HP Elite Dragonfly Folio 13.5 G3 i7-1265U, Iris Xe G7 96EUs, 53 Wh | Apple iPad Pro 12.9 2022 M2, M2 10-Core GPU, 40.88 Wh | Asus ROG Flow Z13 GZ301ZE i9-12900H, GeForce RTX 3050 Ti Laptop GPU, 56 Wh | Microsoft Surface Pro 8, i7-1185G7 i7-1185G7, Iris Xe G7 96EUs, 51.5 Wh | Gemiddelde van klas Convertible | |
|---|---|---|---|---|---|---|---|---|
| Batterijduur | 32% | 19% | 56% | 67% | -25% | -2% | 47% | |
| H.264 (h) | 9.4 | 10 6% | 13.6 45% | 6 -36% | 10.1 7% | 15 ? 60% | ||
| WiFi v1.3 (h) | 7.5 | 9 20% | 8.2 9% | 9.4 25% | 11.2 49% | 5.6 -25% | 7.6 1% | 12 ? 60% |
| Load (h) | 1.4 | 2 43% | 2 43% | 2.6 86% | 2.9 107% | 1.2 -14% | 1.2 -14% | 1.713 ? 22% |
| Witcher 3 ultra (h) | 0.8 |
Pro
Contra
Verdict: Surface Pro 9 heeft meer kracht, maar verliest functies

Van de buitenkant lijkt de nieuwe Surface Pro 9 meer op een kleine upgrade met een nieuwe processor. In detail heeft Microsoft echter enkele veranderingen doorgevoerd en die zijn niet allemaal positief. Allereerst moeten we vermelden dat de CPU-prestaties aanzienlijk zijn toegenomen dankzij de nieuwe Alder Lake-U-processor. Er gaat hier echter nog wat potentieel verloren, omdat een Alder Lake P-chip met twee extra prestatiekernen meer prestaties genereert bij deze TDP-waarden, zoals blijkt uit onze Alder Lake-U analyse.
Microsoft heeft de Surface Pro 9 een up-to-date WLAN-module gegeven met ondersteuning voor 6 GHz-netwerken. Tegelijkertijd is de LTE-versie van het Intel-model komen te vervallen, aangezien de voormalige Surface Pro X nu ook als Surface Pro 9 wordt verkocht. Of de ARM-versie met Windows echt een complete vervanger kan zijn, valt nog te bezien. Wij hadden graag een optioneel Intel-model met LTE of 5G gezien. Wat dat betreft staan we ook kritisch tegenover de eerdere beslissing van Microsoft om de microSD-lezer te schrappen voor het optionele SIM-slot. Aangezien het Intel-model geen simslot meer heeft, had er weer een kaartlezer ingebouwd kunnen worden. Aan de andere kant is de weggelaten 3,5 mm jack veel onopvallender, maar ook deze beslissing vinden we onbegrijpelijk.
De nieuwe Microsoft Surface Pro 9 biedt nu meer CPU-kracht, maar het optionele WWAN-model is komen te vervallen en de audio-aansluiting is verwijderd. Verder blijft de batterijduur een zwak punt van de convertible.
Op de andere gebieden zijn de prestaties solide, maar vooral het beeldscherm heeft snel een update nodig. 120 Hz is in de praktijk erg prettig, maar concurrerende apparaten bieden meestal meer op het gebied van kleurruimtedekking en contrastverhouding. Bovendien is de convertible met de Core i7 vrij duur en voldoet de basisversie met de Core i5, 8 GB RAM en 256 GB SSD-opslag nauwelijks aan de eisen van een "Pro"-apparaat in 2023.
We zullen binnenkort ook de ARM-versie van de Surface Pro 9 + 5G reviewen en we zijn benieuwd of Windows nu beter werkt met de ARM SoC en of het een echt alternatief is voor de Apple iPad Pro 12.9. De Dell XPS 13 9315 biedt minder CPU-kracht, maar het is meestal voldoende voor dagelijks gebruik en je profiteert ook van de passieve koeling.
Prijs en beschikbaarheid
De Microsoft Surface Pro 9 lijkt in alle configuraties ruim beschikbaar te zijn, rechtstreeks via de officiële online winkel van Microsoft of via typische leveranciers zoals Amazon. Onze reviewconfiguratie (Core i7, 16GB RAM, 512 GB) staat op US$1.879,99 op Amazon US, en op £1.799,00 op Amazon UK. Geïnteresseerde kopers in Australië of Singapore kunnen bijvoorbeeld rechtstreeks bij Microsoft kopen, waar de prijzen beginnen bij AU$1.649,00 en SG$1.608,00respectievelijk.
Bovengenoemde voorbeelden zijn niet volledig. De prijzen gelden per 25.01.2023 en kunnen worden gewijzigd.
Microsoft Surface Pro 9, i7-1255U
- 24-01-2023 v7 (old)
Andreas Osthoff
Transparantie
De selectie van te beoordelen apparaten wordt gemaakt door onze redactie. Het testexemplaar werd ten behoeve van deze beoordeling door de fabrikant of detailhandelaar in bruikleen aan de auteur verstrekt. De kredietverstrekker had geen invloed op deze recensie, noch ontving de fabrikant vóór publicatie een exemplaar van deze recensie. Er bestond geen verplichting om deze recensie te publiceren. Als onafhankelijk mediabedrijf is Notebookcheck niet onderworpen aan het gezag van fabrikanten, detailhandelaren of uitgevers.
[transparency_disclaimer]Dit is hoe Notebookcheck test
Elk jaar beoordeelt Notebookcheck onafhankelijk honderden laptops en smartphones met behulp van gestandaardiseerde procedures om ervoor te zorgen dat alle resultaten vergelijkbaar zijn. We hebben onze testmethoden al zo'n 20 jaar voortdurend ontwikkeld en daarbij de industriestandaard bepaald. In onze testlaboratoria wordt gebruik gemaakt van hoogwaardige meetapparatuur door ervaren technici en redacteuren. Deze tests omvatten een validatieproces in meerdere fasen. Ons complexe beoordelingssysteem is gebaseerd op honderden goed onderbouwde metingen en benchmarks, waardoor de objectiviteit behouden blijft. Meer informatie over onze testmethoden kunt u hier vinden.
Price comparison

