De Dell Surface Pro 8: XPS 13 9315 2-in-1 convertible review
Dell heeft op CES 2022 drie verschillende XPS 13-modellen onthuld: de XPS 13 9320 Plus clamshell, XPS 13 9315 clamshellen XPS 13 9315 2-in-1. Nadat we de twee clamshell-modellen hebben bekeken, zijn we nu klaar om het 2-in-1-model aan te pakken dat toevallig het eerste afneembare XPS model in bijna een decennium.
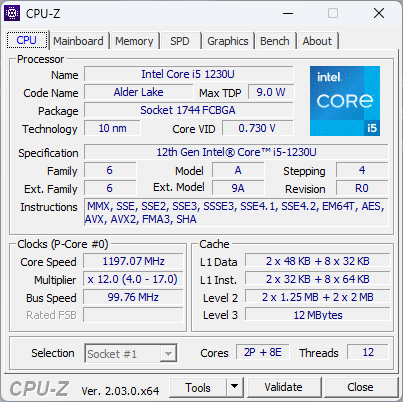
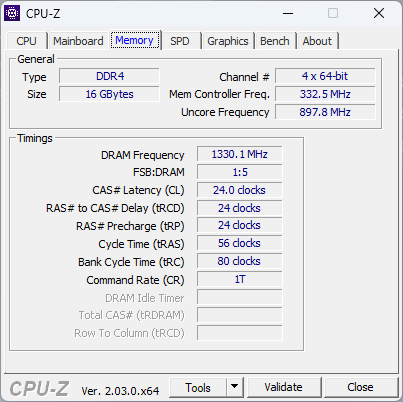
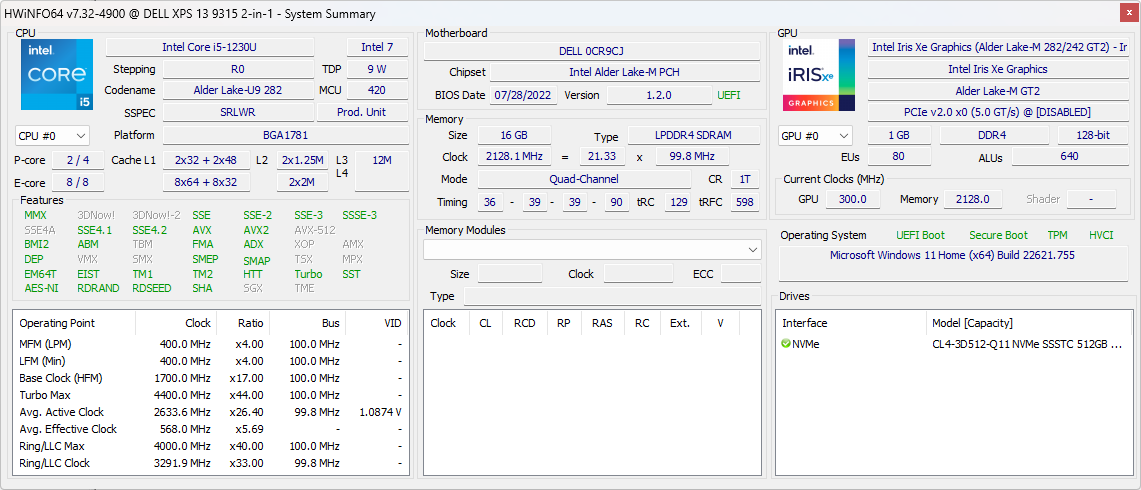
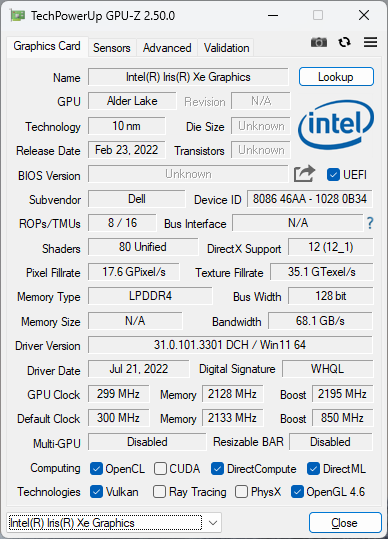
Onze configuratie in beoordeling is uitgerust met de 12e gen Alder Lake Core i5-1230U CPU, 16 GB LPDDR4x RAM en 512 GB NVMe SSD voor ongeveer $ 1400 USD. Andere SKU's met de Core i7-1250U CPU, 5G eSIM, en verschillende RAM/SSD capaciteiten zijn ook beschikbaar, maar alle opties komen anders met dezelfde 3:2 2880 x 1920 IPS touchscreen.
Directe concurrenten op dit gebied zijn andere Windows-tablets of afneembare tablets, met name de Microsoft Surface Pro 8 en de duurdere HP Elite x2 serie in mindere mate.
Meer Dell beoordelingen:
Potentiële concurrenten in vergelijking
Evaluatie | Datum | Model | Gewicht | Hoogte | Formaat | Resolutie | Beste prijs |
|---|---|---|---|---|---|---|---|
| 90.1 % v7 (old) | 11-2022 | Dell XPS 13 9315 2-in-1 Core i5-1230U i5-1230U, Iris Xe G7 80EUs | 764 g | 7.4 mm | 13.00" | 2880x1920 | |
| 87.3 % v7 (old) | 09-2022 | Dell XPS 13 Plus 9320 i7-1280P OLED i7-1280P, Iris Xe G7 96EUs | 1.3 kg | 15.28 mm | 13.40" | 3456x2160 | |
| 89.1 % v7 (old) | 11-2021 | Microsoft Surface Pro 8, i7-1185G7 i7-1185G7, Iris Xe G7 96EUs | 891 g | 8.5 mm | 13.00" | 2880x1920 | |
| 90.3 % v7 (old) | 08-2022 | HP Spectre x360 13.5 14t-ef000 i7-1255U, Iris Xe G7 96EUs | 1.4 kg | 17 mm | 13.50" | 3000x2000 | |
| 86.1 % v7 (old) | 10-2021 | Lenovo ThinkBook Plus Gen2 Core i5 i5-1130G7, Iris Xe G7 80EUs | 1.2 kg | 13.9 mm | 13.30" | 2560x1600 | |
| 92.3 % v7 (old) | 07-2022 | Apple MacBook Air M2 Entry M2, M2 8-Core GPU | 1.2 kg | 11.3 mm | 13.60" | 2560x1664 |
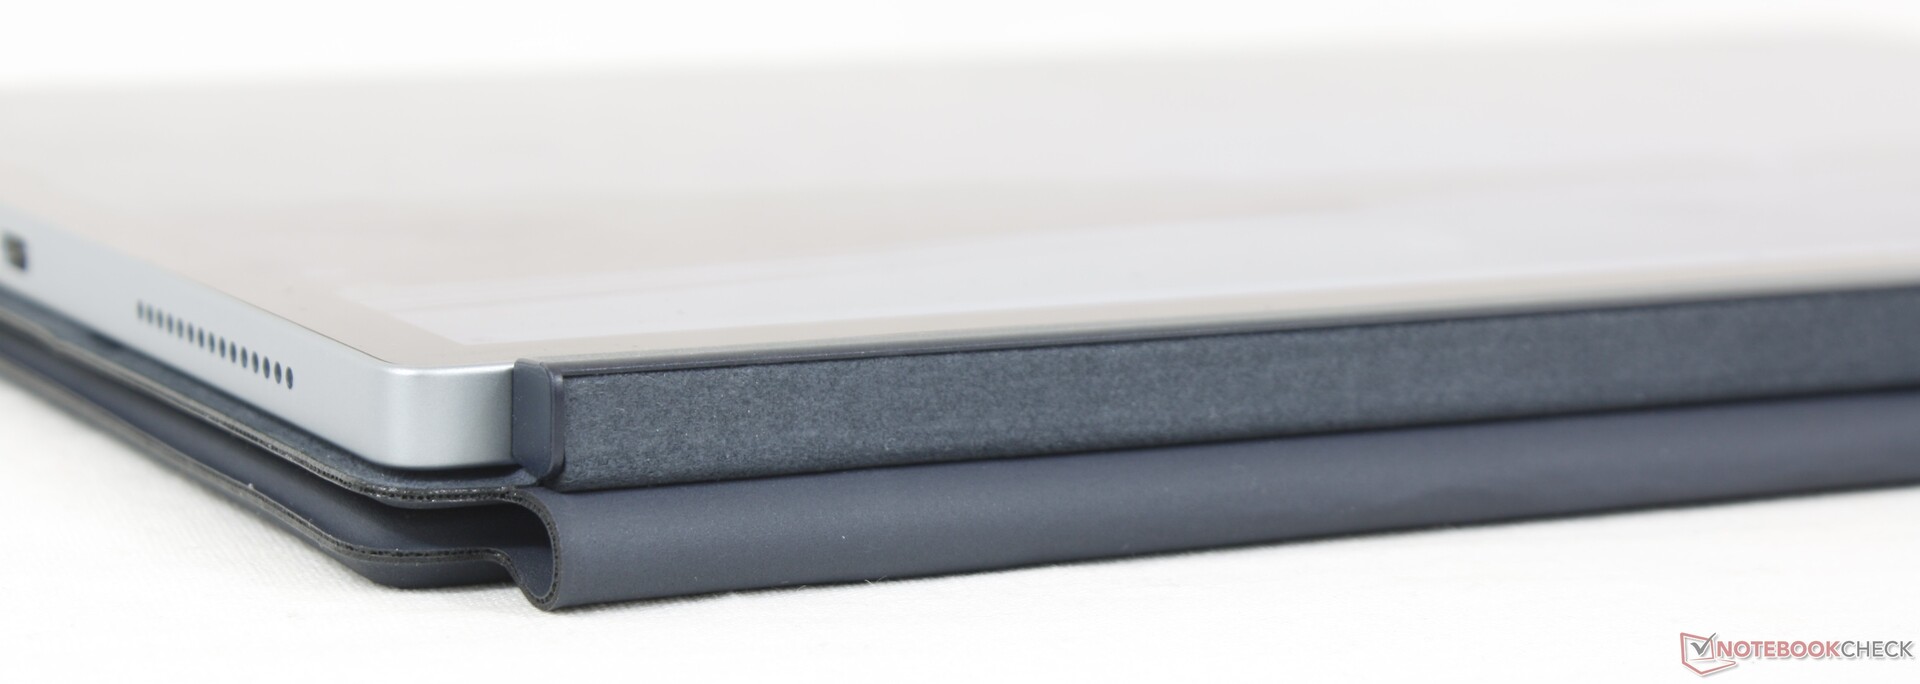
Case - Lichter dan een Surface Pro 8
Het skelet is van aluminium aan de achterkant en de randen, terwijl de voorkant van rand tot rand bestaat uit Gorilla Glass. Het is een stevige, hoogwaardige matte afwerking zoals je zou verwachten, met een kleur en textuur die vergelijkbaar is met de buitenste deksels van de XPS 13 9300 of XPS 15 serie. Er is een zeer lichte kromming wanneer u probeert het apparaat te draaien, maar het is niet genoeg om u zorgen te maken.
Druk uitoefenen op het midden van de achterkant resulteert in lichte depressies en hoorbare geluiden. Dit is waarschijnlijk te wijten aan de kleine luchtspleet tussen de buitenkant en de binnenste componenten, wat opnieuw niets is om je zorgen over te maken.
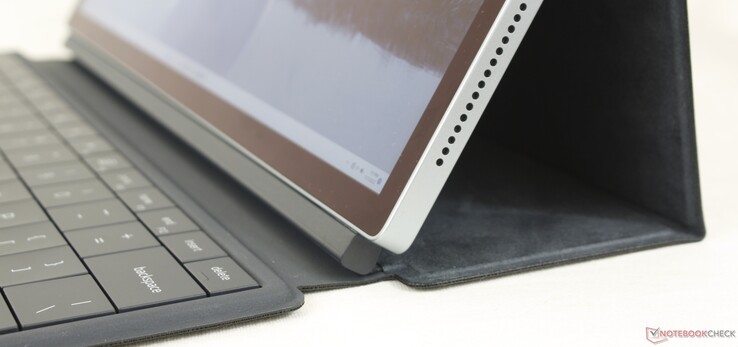
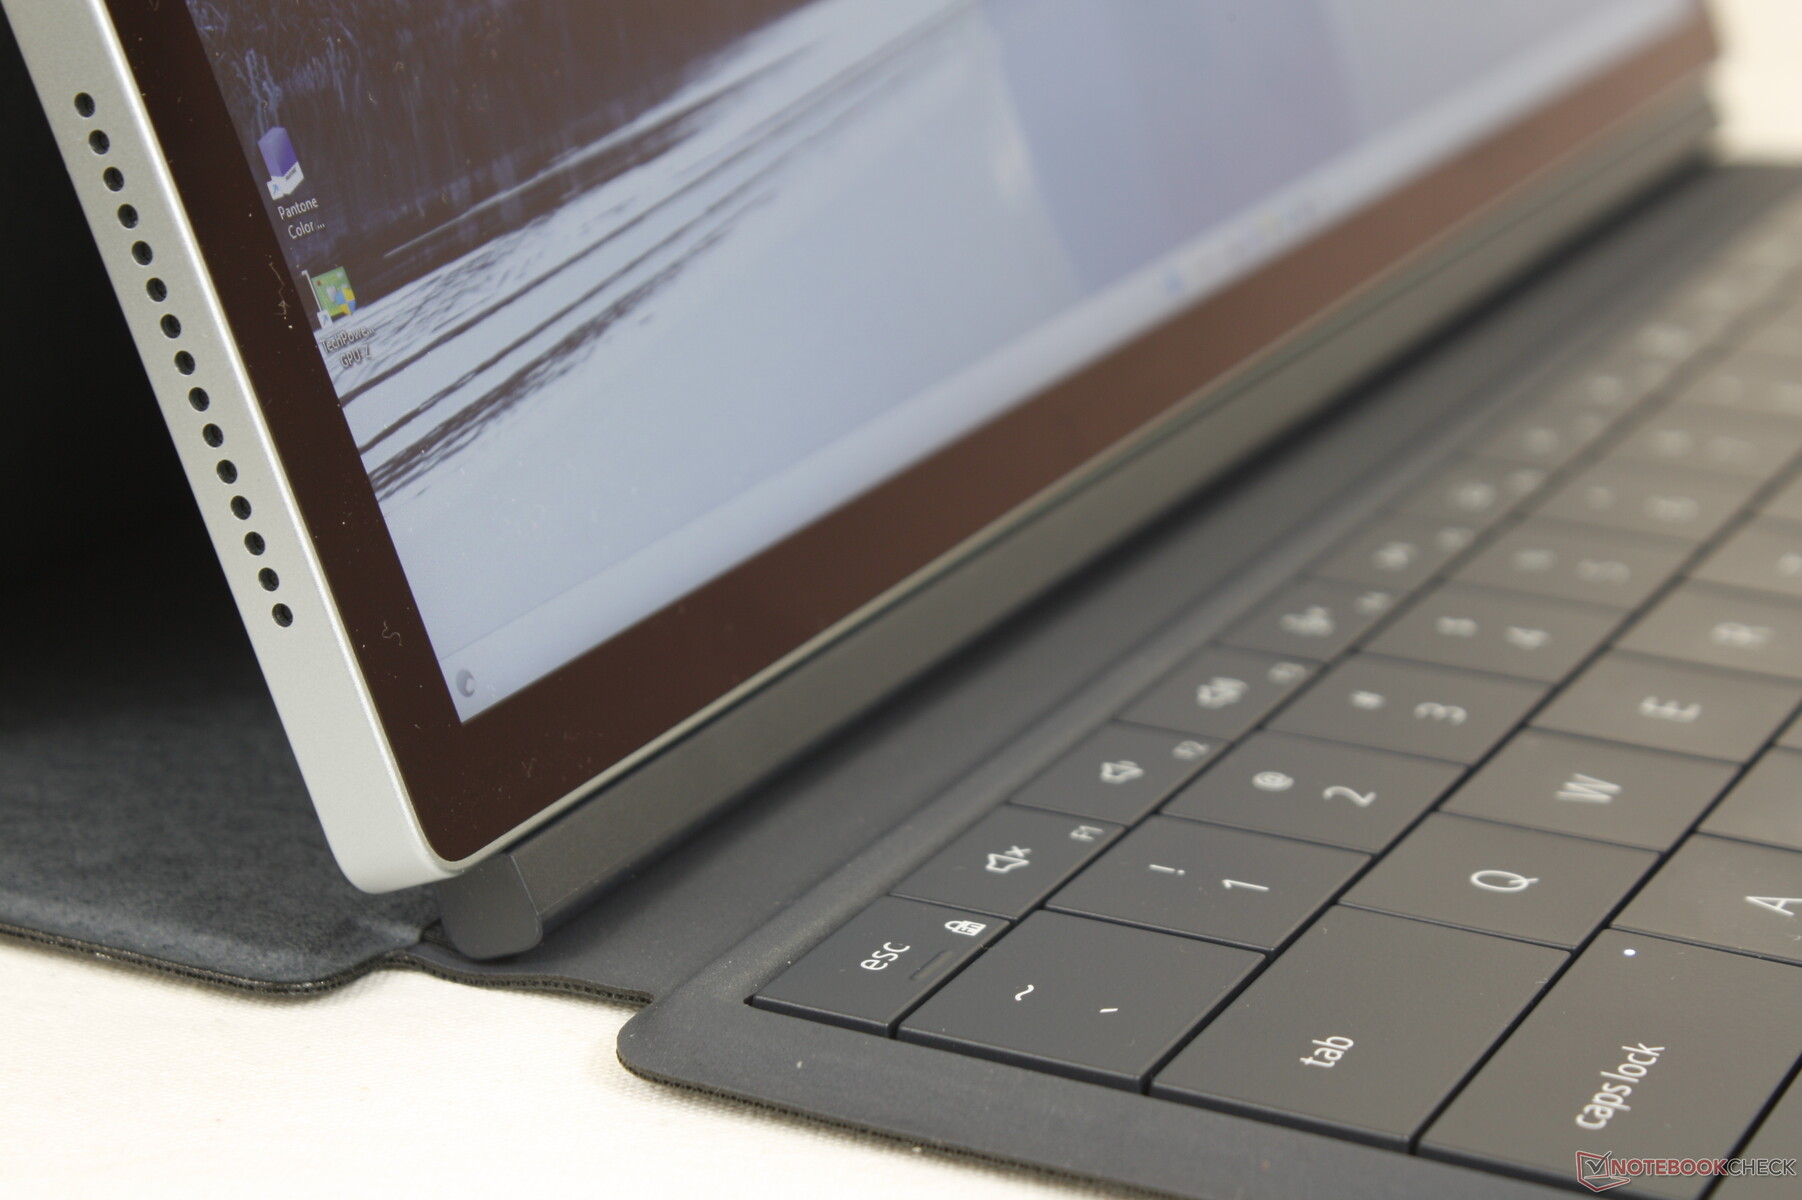
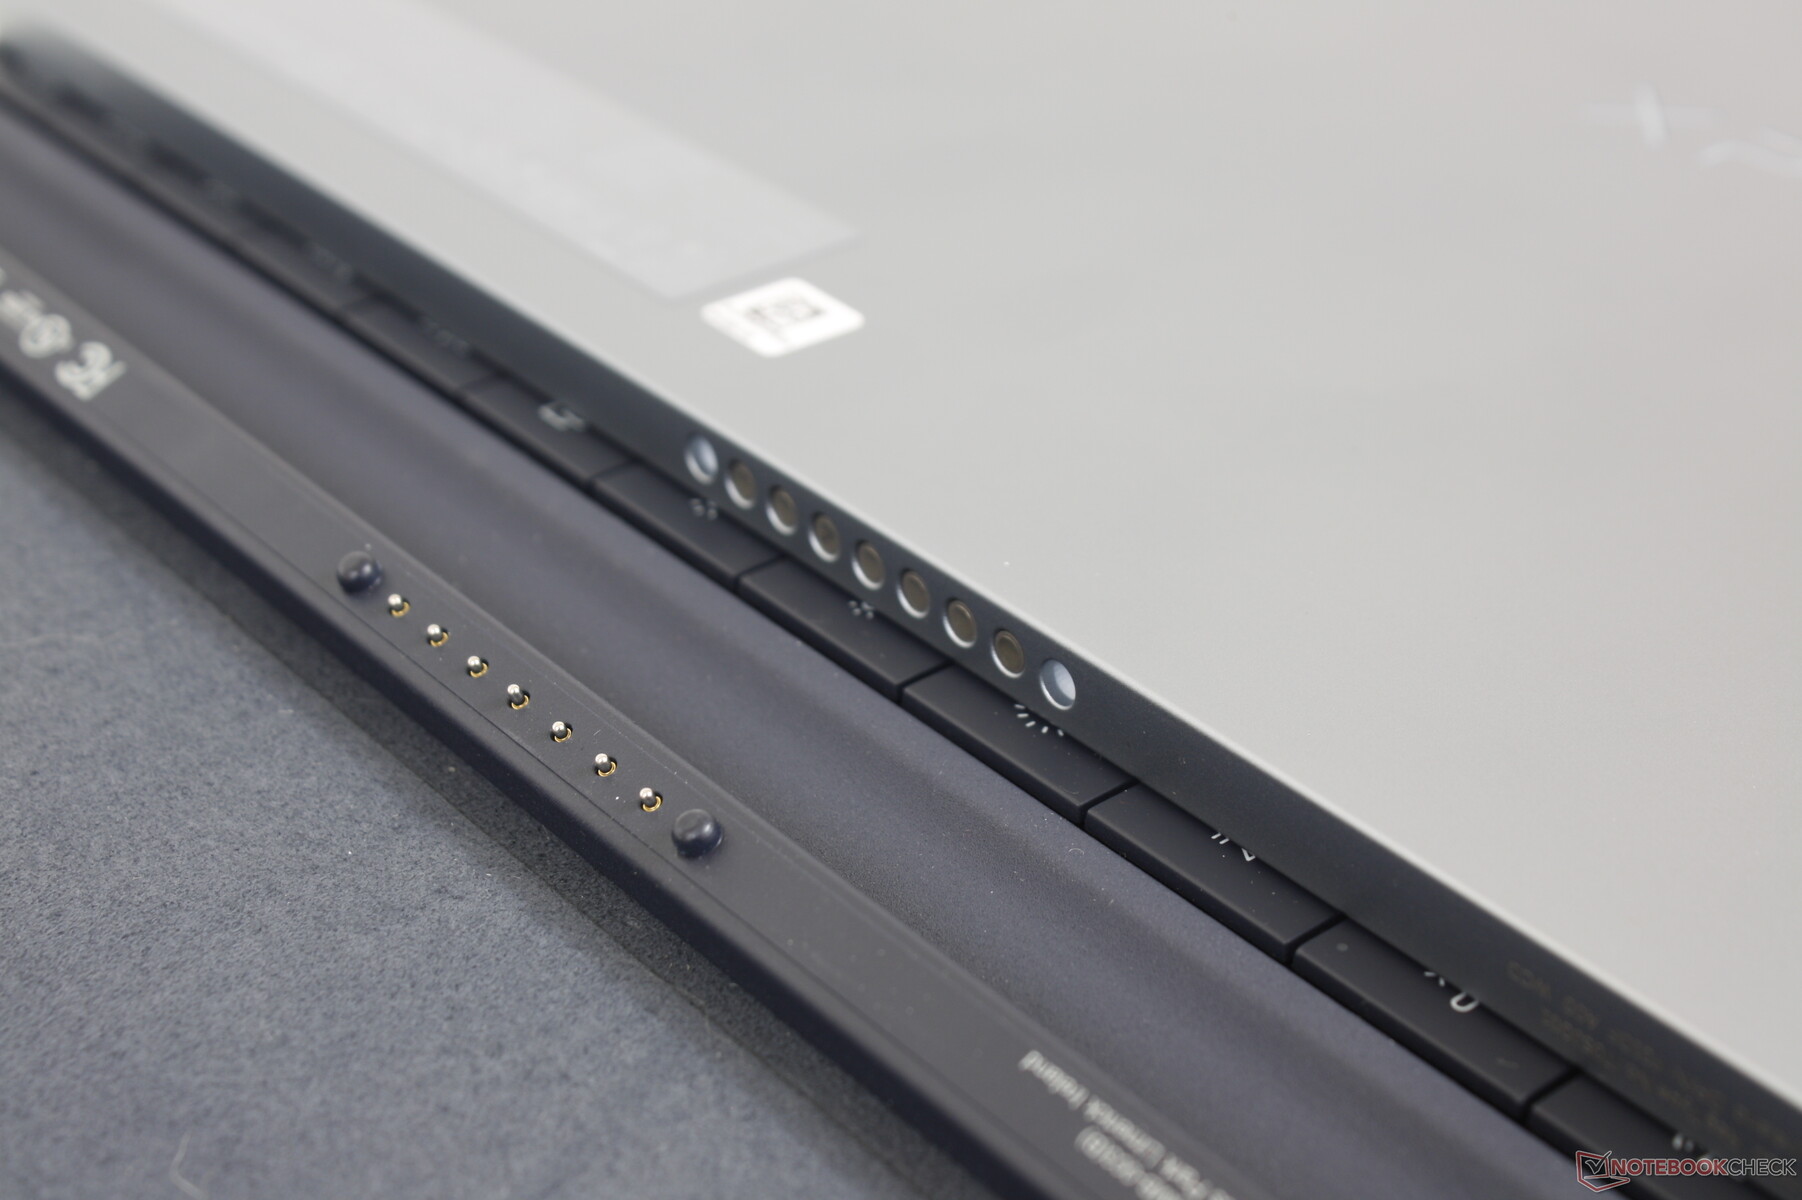
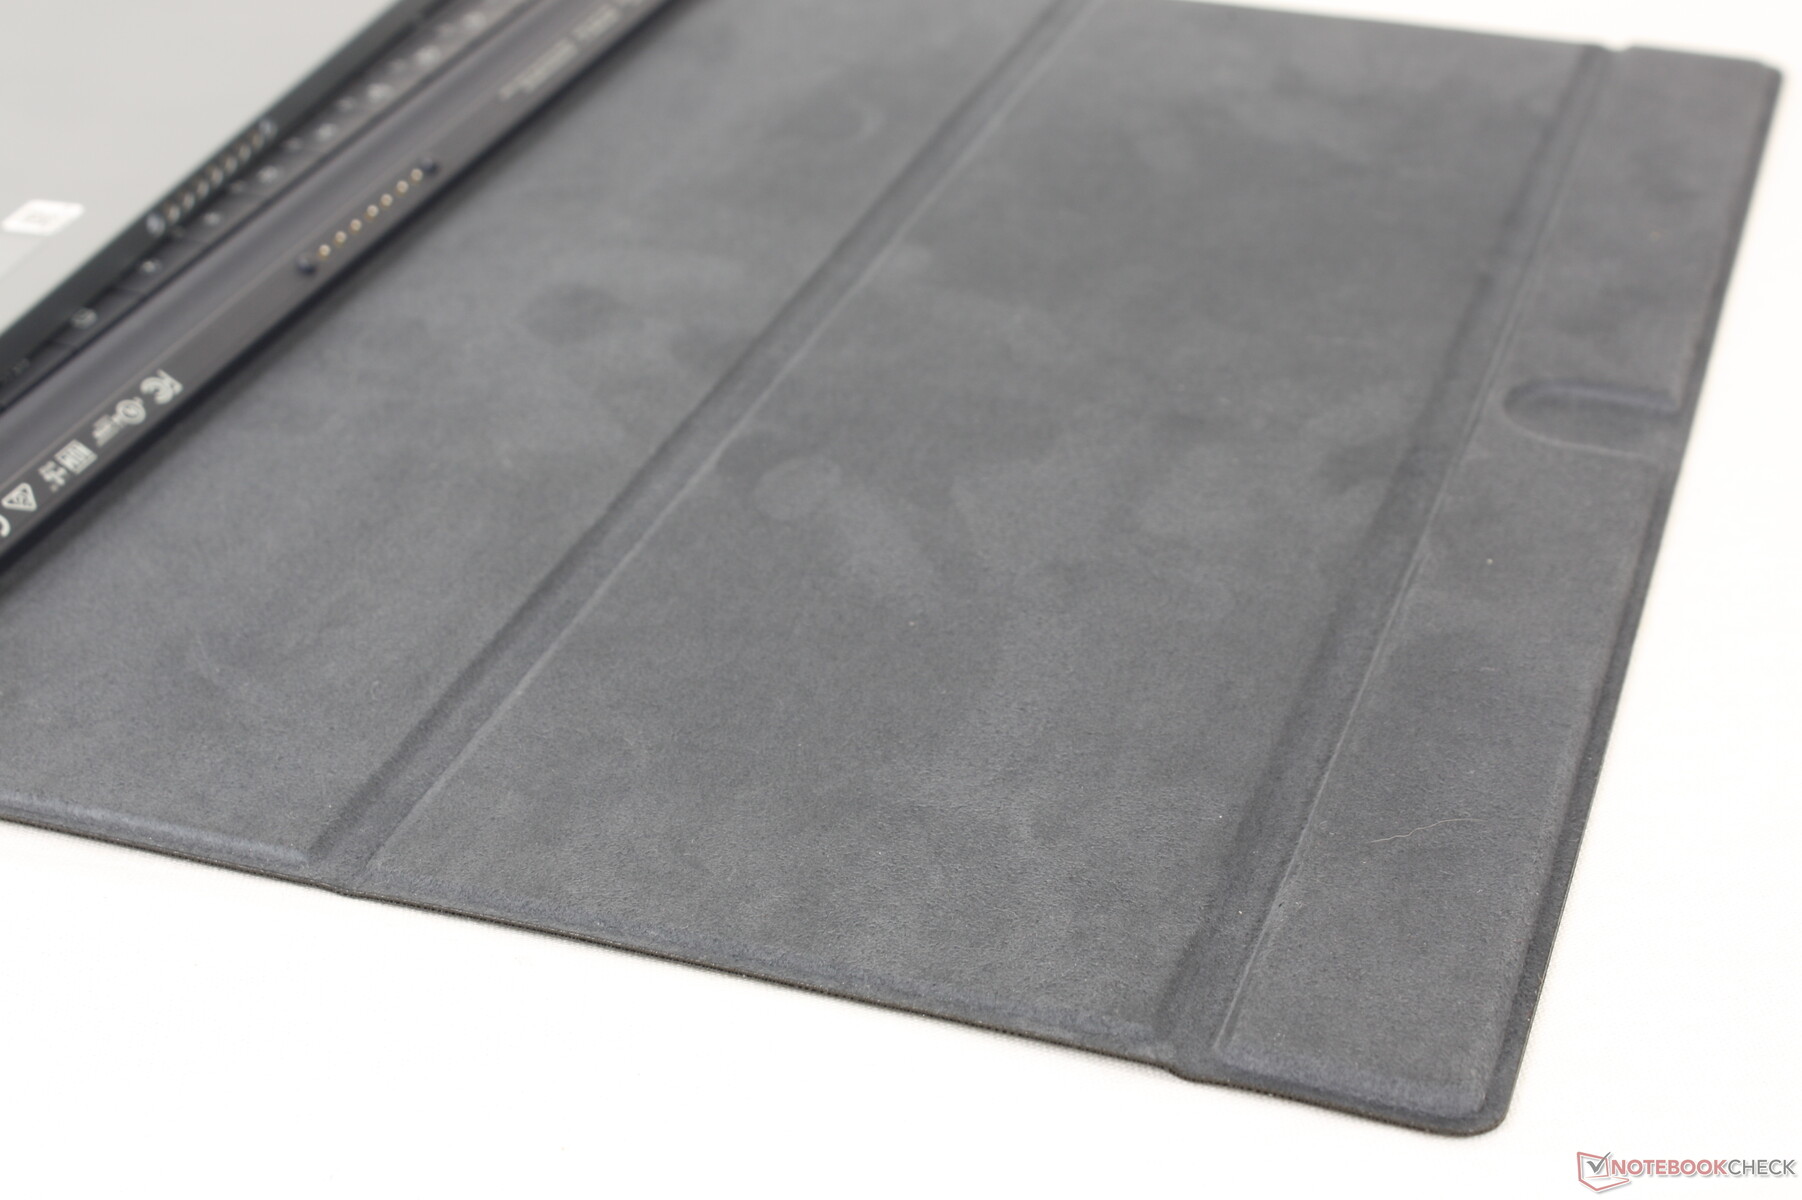
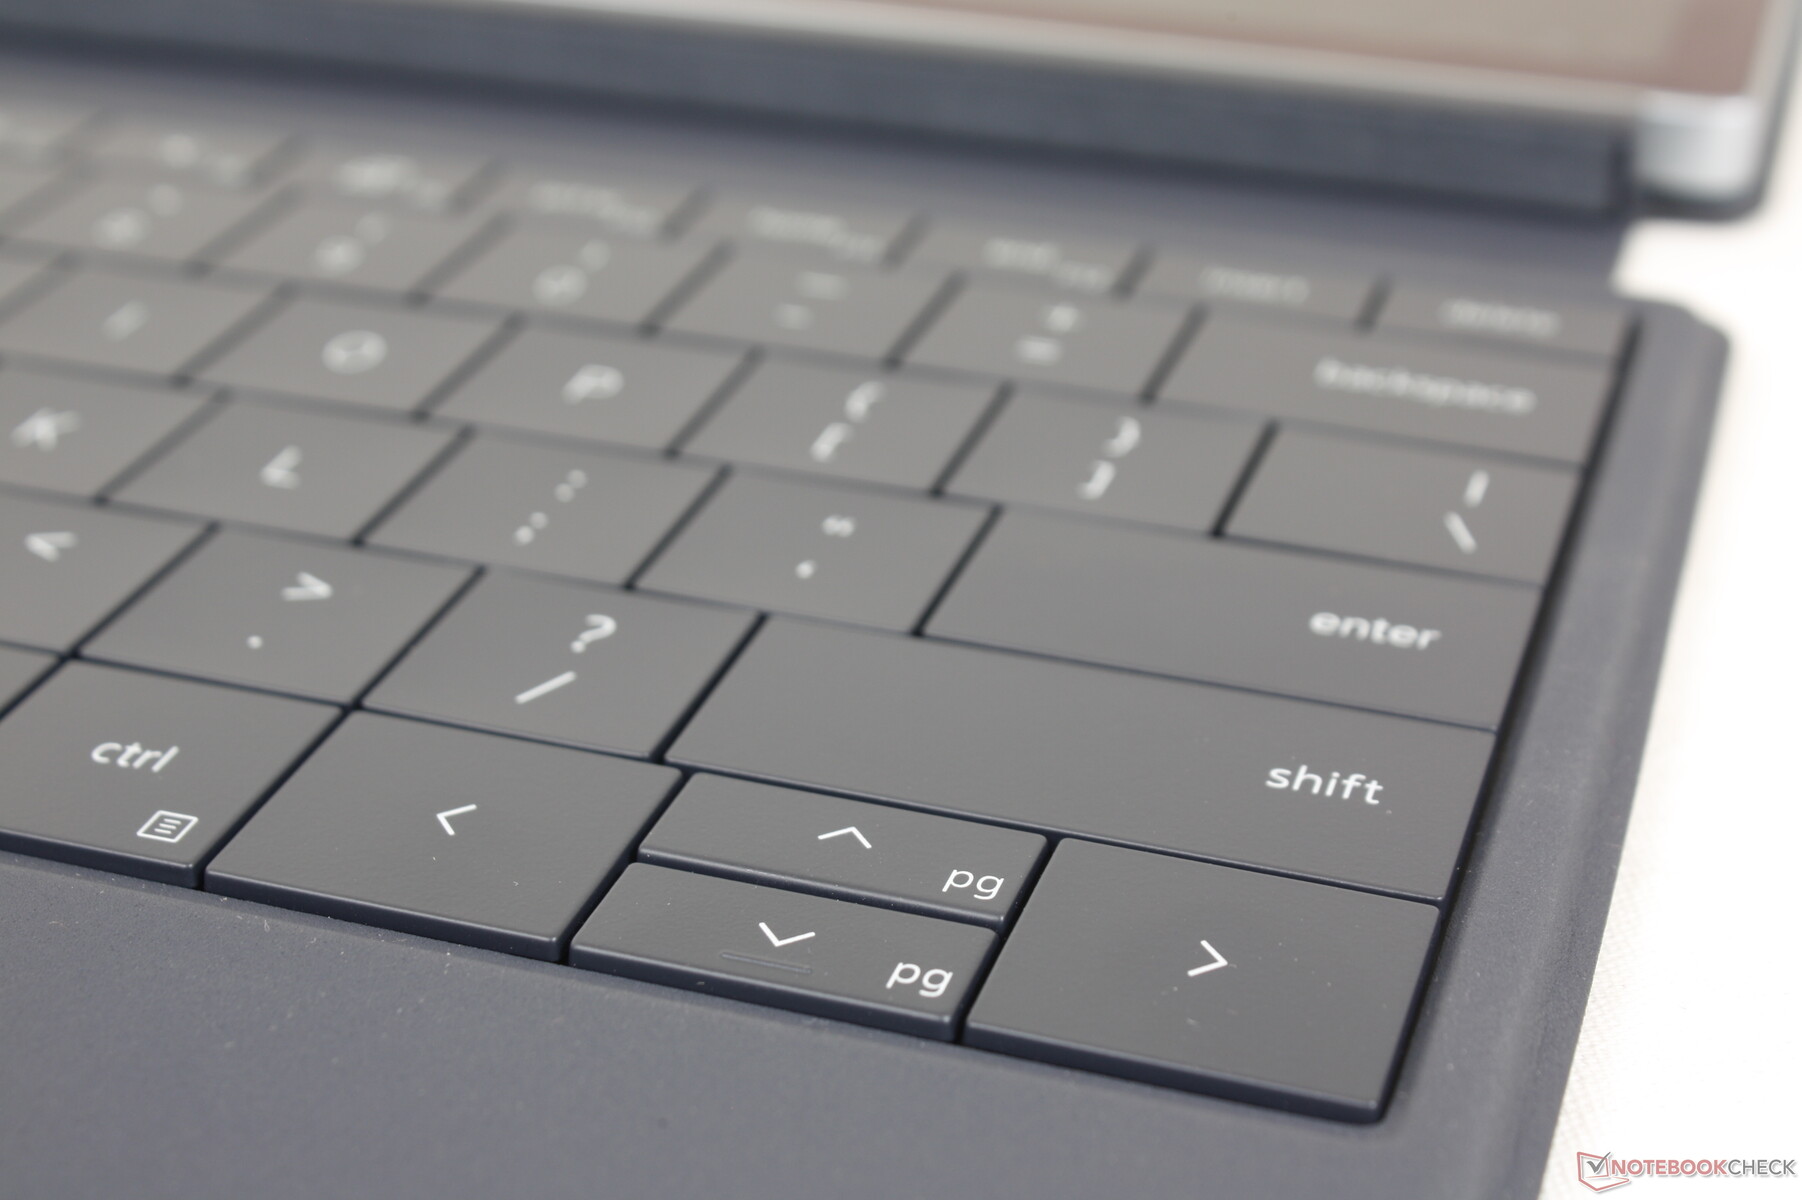
Het magnetische toetsenborddock (of folio) is van zacht aanvoelend materiaal, niet anders dan de Alcantara oppervlakken van het Surface Pro 8 toetsenborddock. De Dell-oplossing verschilt echter aanzienlijk van de Microsoft-versie omdat het een achterkant bevat, terwijl de Surface Pro Type Cover alleen een toetsenbord en touchpad is. Deze achterkant biedt extra bescherming tegen slijtage en krassen ten koste van extra gewicht.
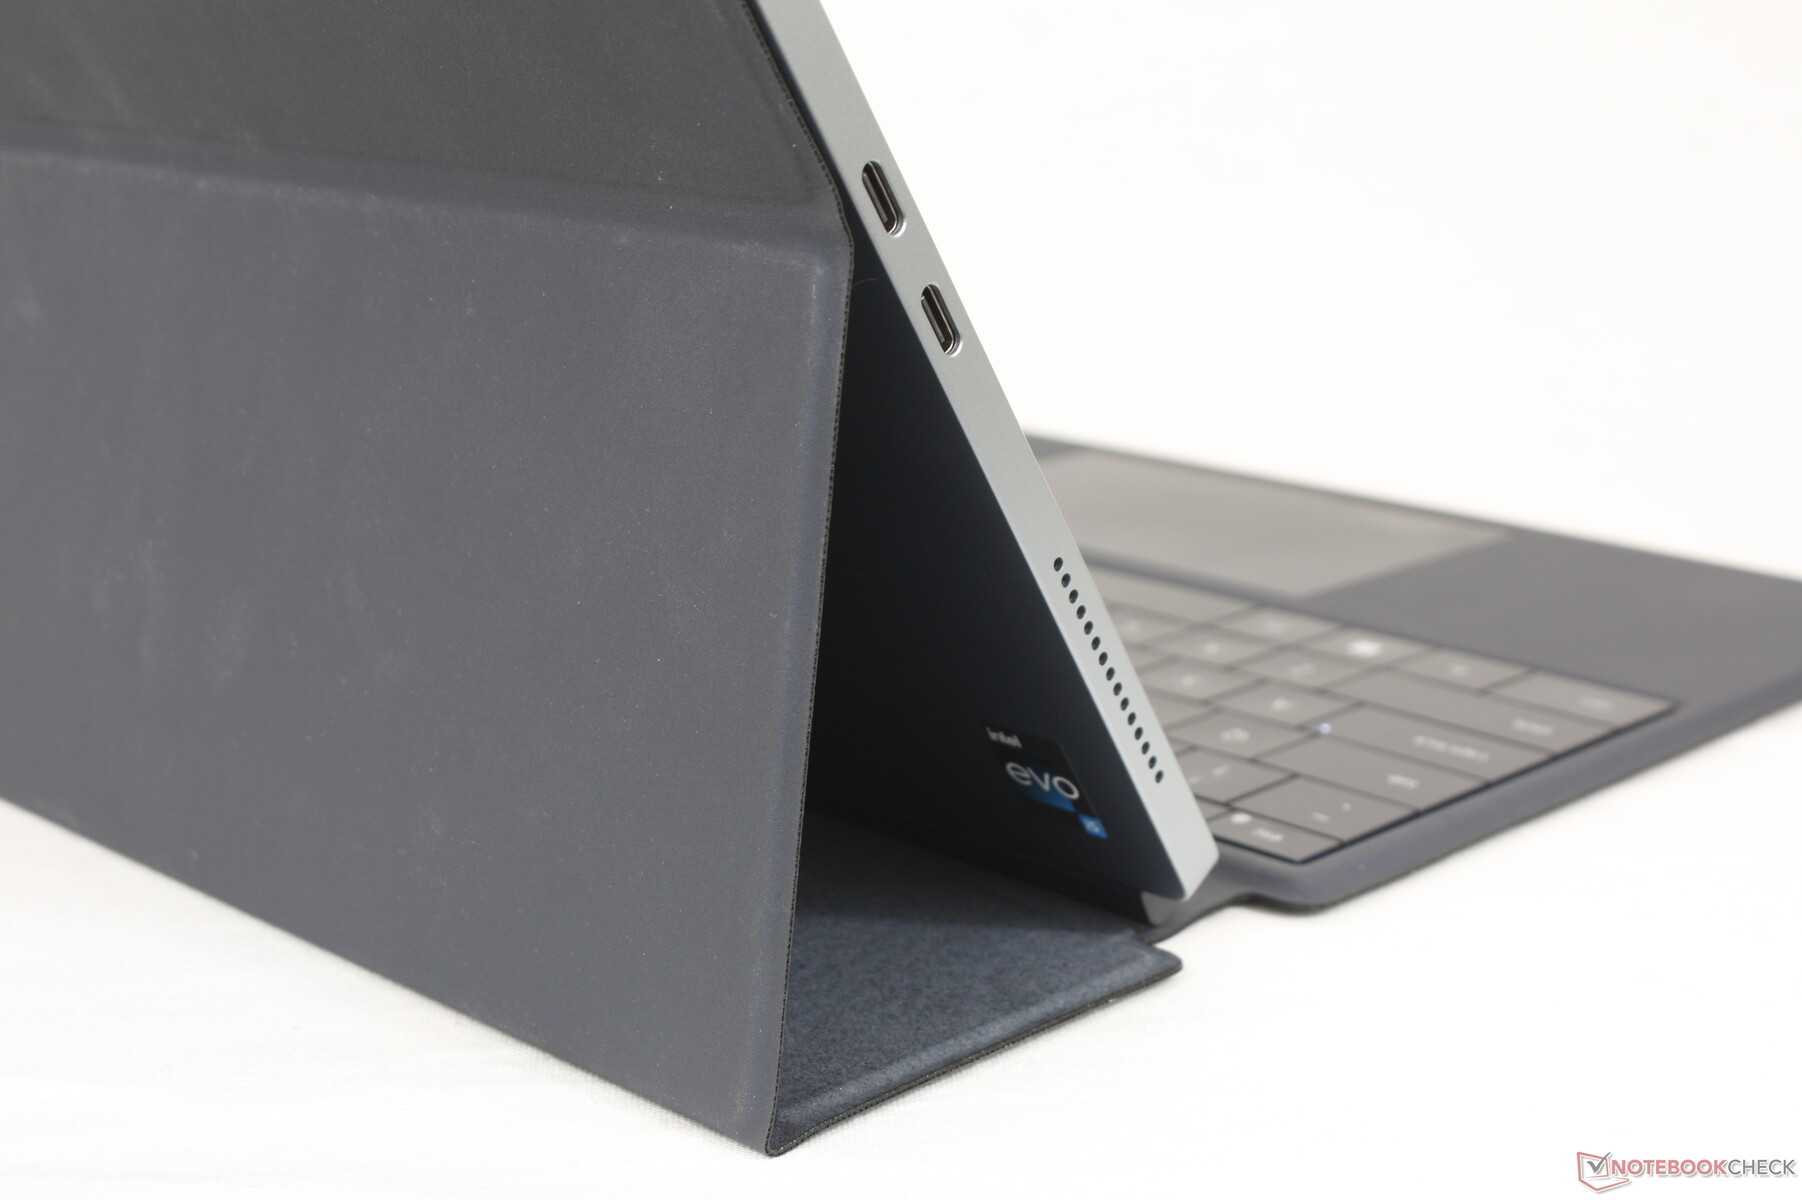
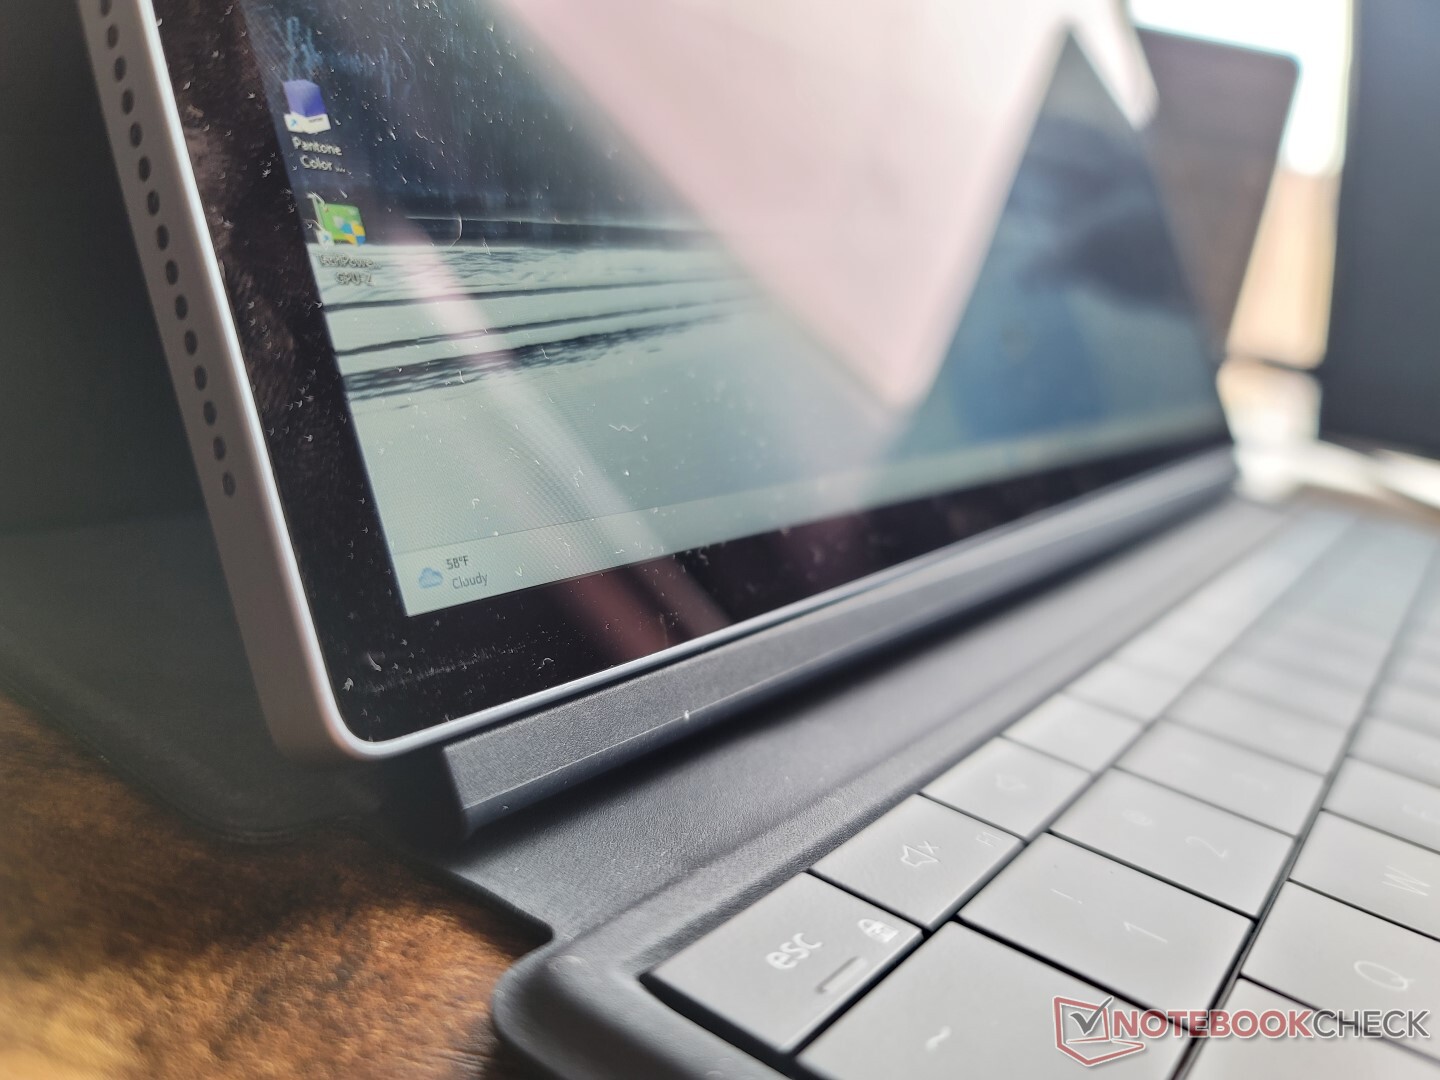
Om de Dell tablet in laptopmodus te verankeren, kan de achterkant van de folio slechts tot 100, 115 en 125 graden worden versteld, terwijl het scharnier van de Surface Pro 8 vrijer kan bewegen. Met andere woorden, de XPS 13 9315 2-in-1 vereist het optionele foliodock om zichzelf overeind te houden, terwijl de Surface Pro 8 een handigere ingebouwde standaard heeft.
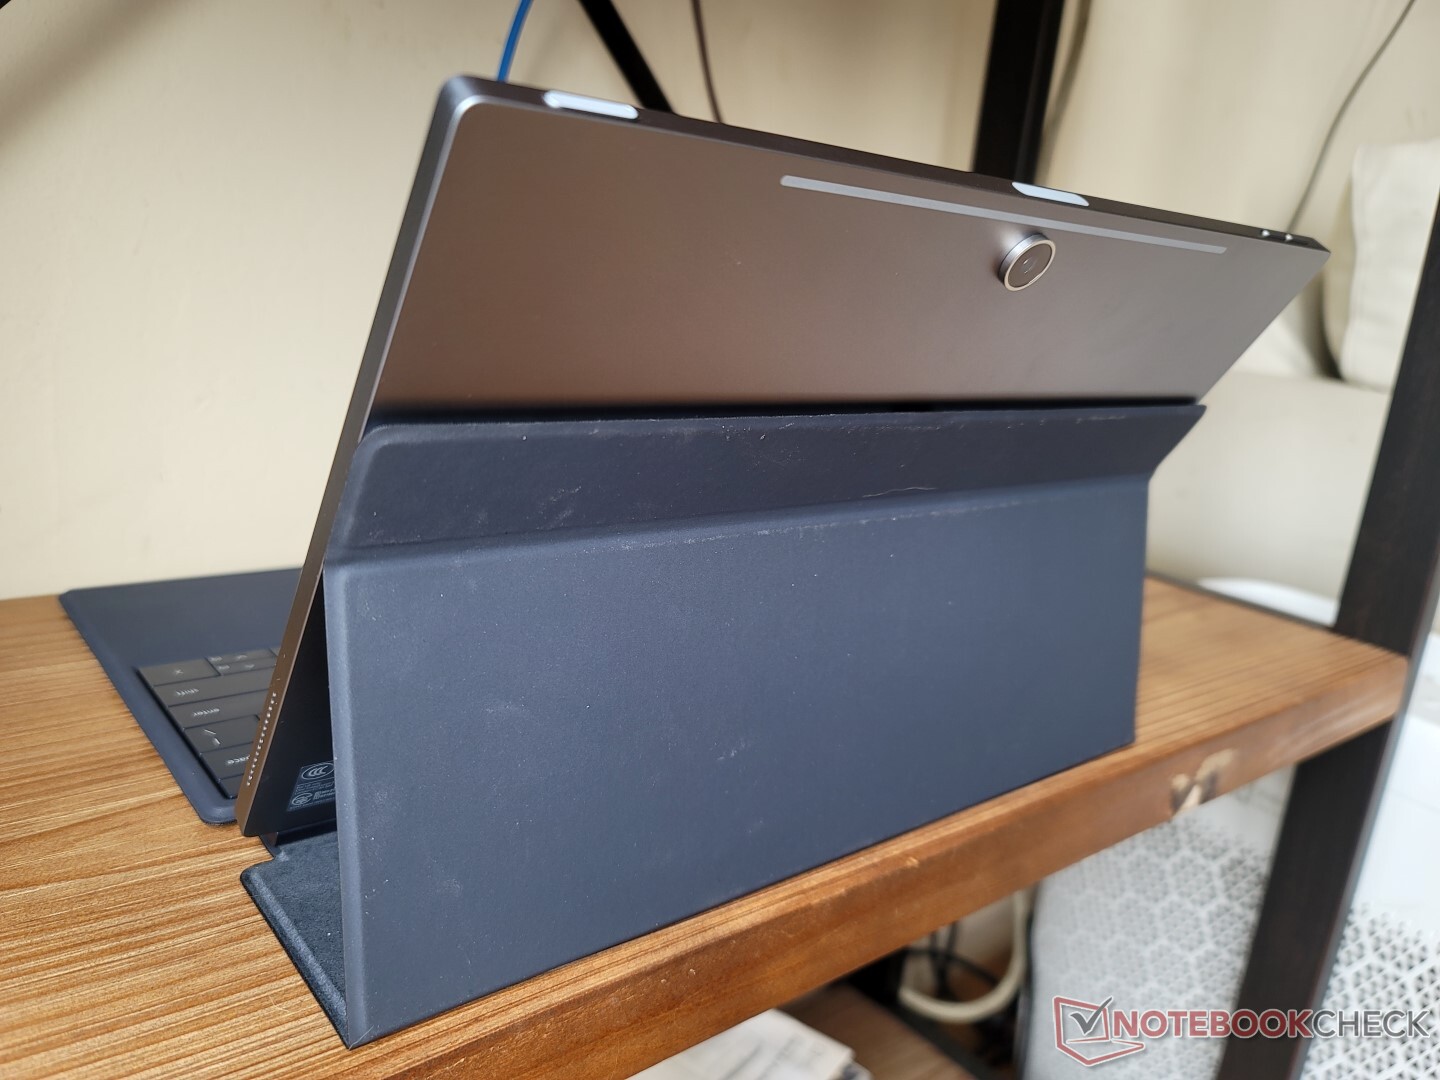
De tablet zelf is zeer licht met slechts 764 g in vergelijking met bijna 900 g voor de Surface Pro 8. Veel van de gewichtsbesparing kan worden toegeschreven aan het ventilatorloze ontwerp van de Dell, terwijl het Microsoft-model een ventilator bevat voor betere koeling. Het gecombineerde gewicht tussen de tablet en de behuizing is 1305 g, wat dicht in de buurt komt van veel 13,5-inch clamshells zoals deHP Spectre x360 13.5.
De 5G-configuraties van de XPS 13 9315 2-in-1 zijn iets dikker met 4/10e millimeter (7,8 vs. 7,4 mm). Alle opties zijn nog steeds een fractie dunner dan de Surface Pro 8, terwijl de lengte en breedte vrijwel identiek zijn.
Connectiviteit - Geen audio-aansluiting
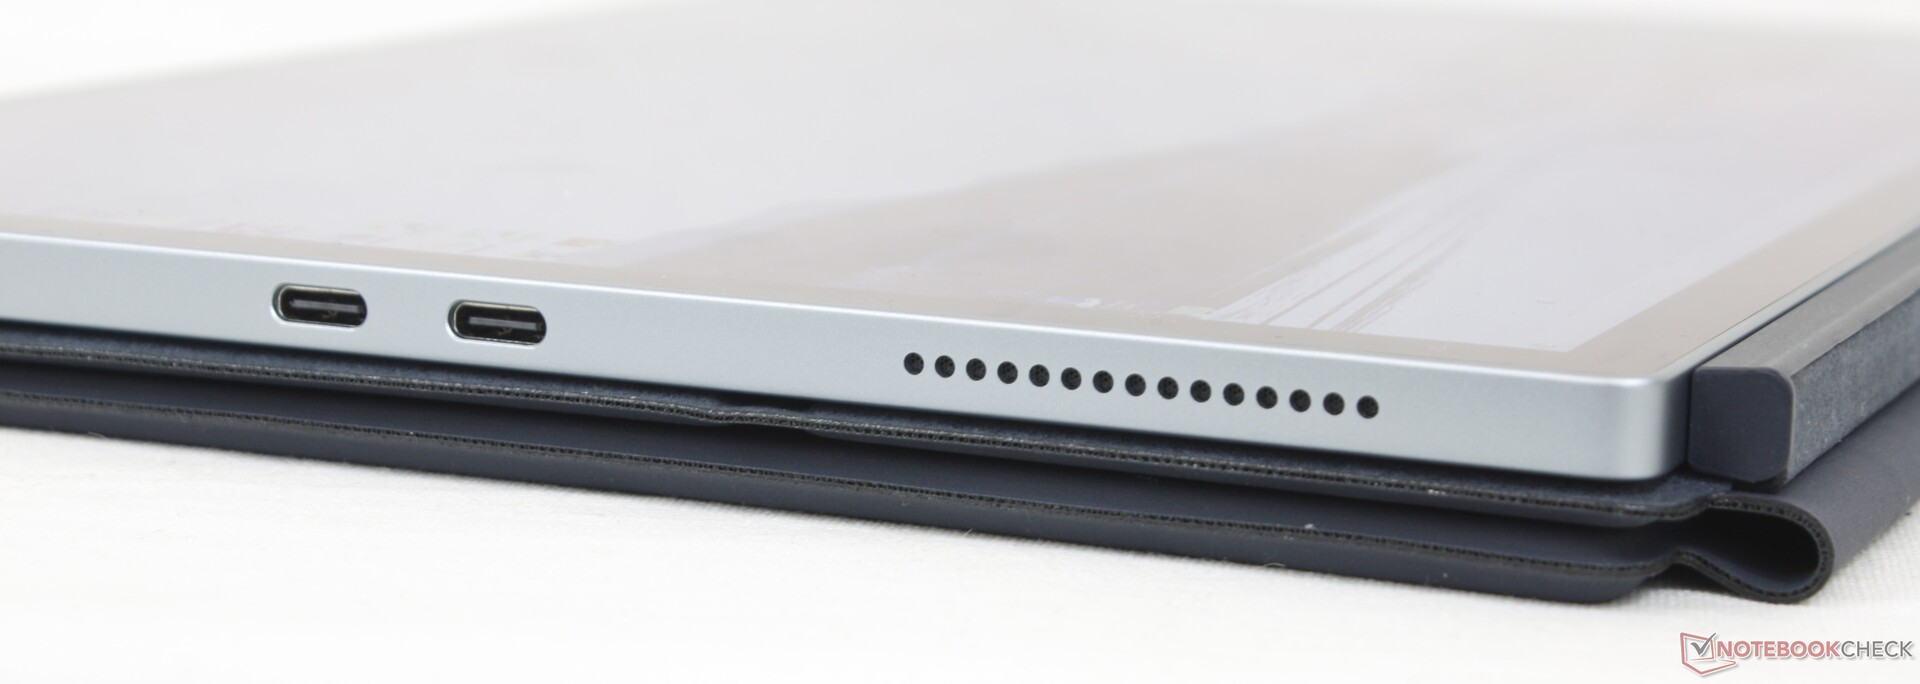
Er zijn slechts twee USB-C-poorten langs de linkerrand die elk compatibel zijn met Thunderbolt 4-apparaten. Gebruikers zullen naar verwachting docking stations en adapters klaar hebben staan om de twee poorten beter te benutten. Houd in gedachten dat er niet eens een 3,5 mm audio-aansluiting is, terwijl de Surface Pro 8 er een bevat.
Communicatie
Een Intel 1675 AX211 wordt standaard geleverd voor Wi-Fi 6E en Bluetooth 5.2 compatibiliteit. De overdrachtssnelheden zijn snel en stabiel bij koppeling aan ons 6 GHz netwerk, maar de gemiddelde ontvangstsnelheden zijn iets langzamer dan verwacht.
| Networking | |
| iperf3 transmit AX12 | |
| Microsoft Surface Pro 8, i7-1185G7 | |
| Lenovo ThinkBook Plus Gen2 Core i5 | |
| iperf3 receive AX12 | |
| Microsoft Surface Pro 8, i7-1185G7 | |
| Lenovo ThinkBook Plus Gen2 Core i5 | |
| iperf3 receive AXE11000 6GHz | |
| HP Spectre x360 13.5 14t-ef000 | |
| Dell XPS 13 9315 2-in-1 Core i5-1230U | |
| iperf3 receive AXE11000 | |
| Apple MacBook Air M2 Entry | |
| iperf3 transmit AXE11000 | |
| Apple MacBook Air M2 Entry | |
| iperf3 transmit AXE11000 6GHz | |
| HP Spectre x360 13.5 14t-ef000 | |
| Dell XPS 13 9315 2-in-1 Core i5-1230U | |
Webcam
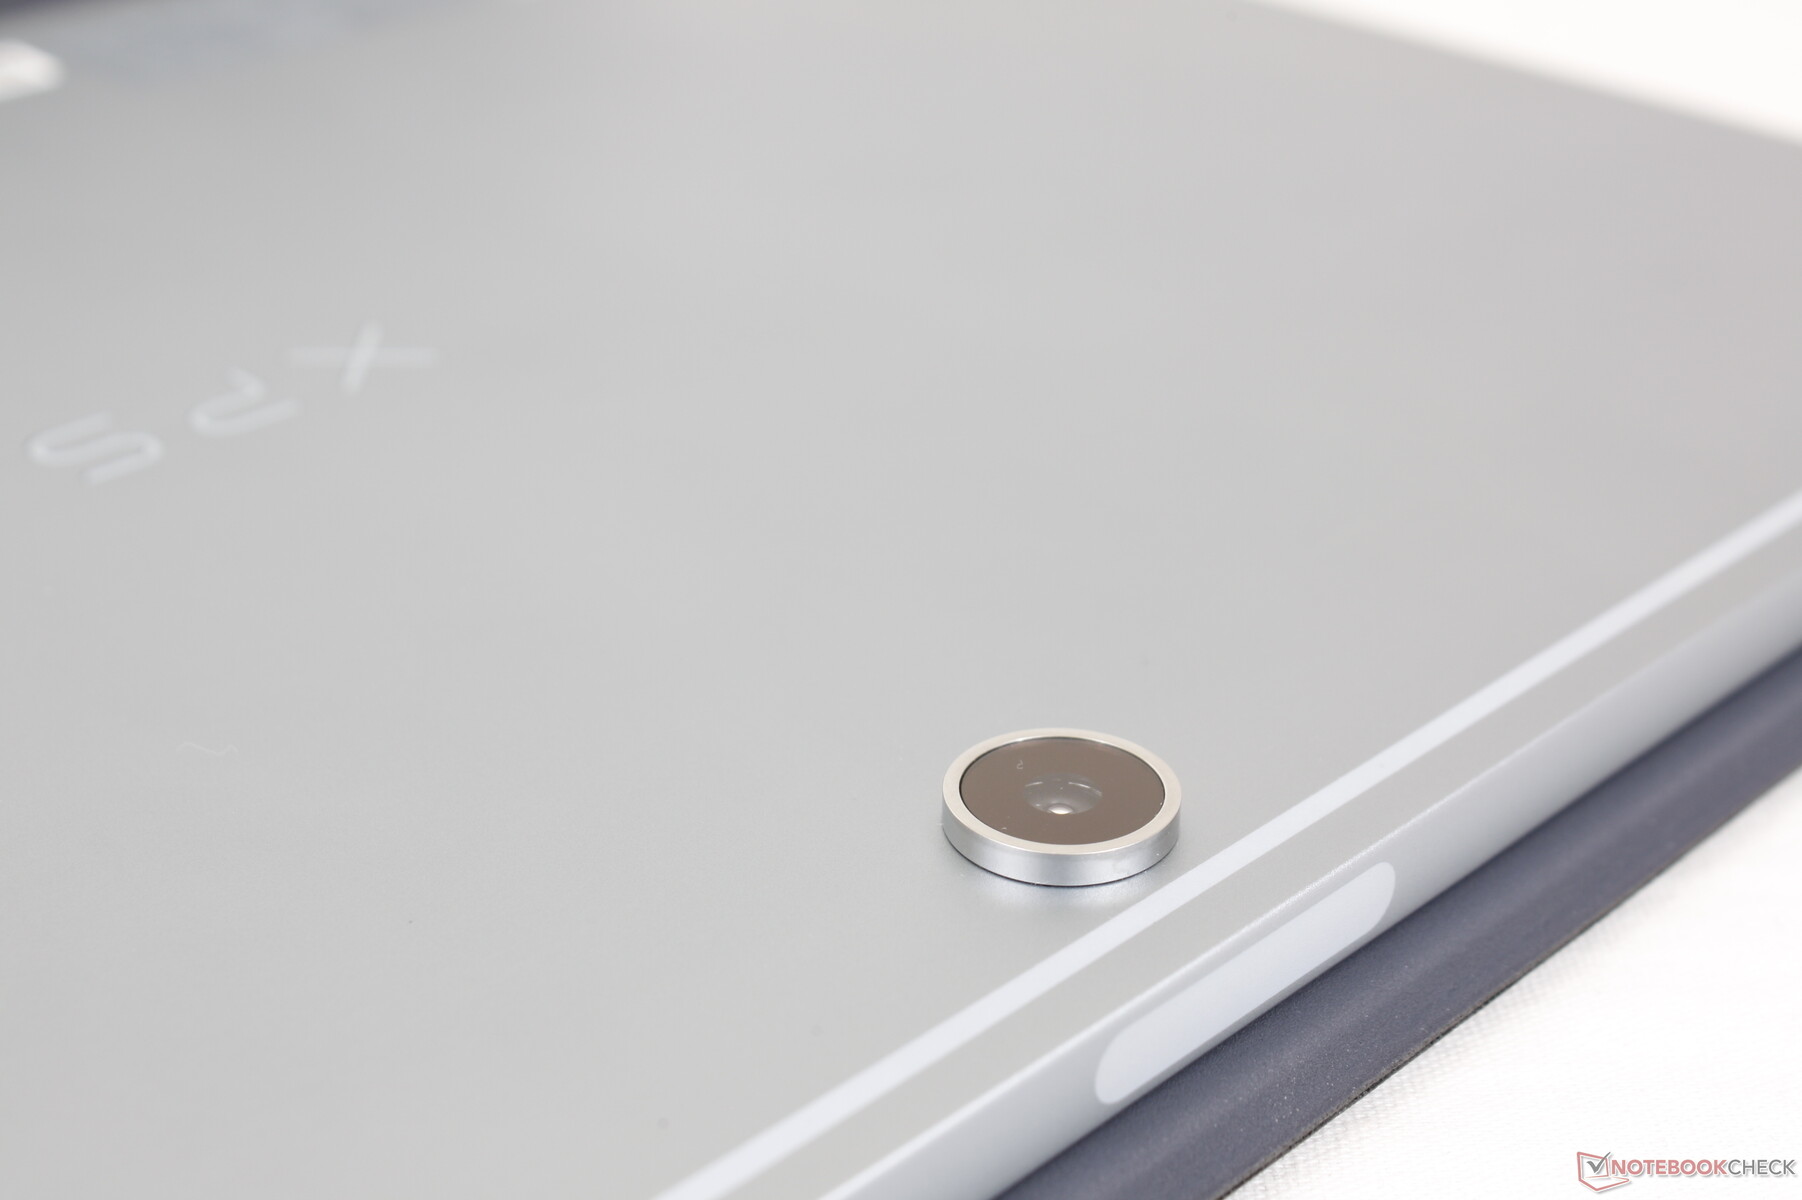
De camera aan de achterzijde is 11 MP, wat, misschien niet toevallig, 1 MP meer is dan de camera op de Surface Pro 8. De beeldkwaliteit is aanzienlijk scherper dan alles op een laptop webcam, ook al heeft de kleurnauwkeurigheid nog een lange weg te gaan.
IR is aanwezig voor Windows Hello ondersteuning. Er is helaas geen sluiter voor de webcam omwille van de privacy.


Accessoires en garantie
De verkoopdoos bevat twee handige USB-C-adapters voor het omzetten naar USB-A en 3,5 mm audio. Net als Microsoft en zijn Surface Pro-tabletreeks worden de afneembare toetsenbordvoet en de magnetische actieve stylus echter afzonderlijk verkocht voor 100 USD extra per stuk. Met andere woorden, je moet 200 dollar bovenop de initiële prijs toevoegen als je zowel het toetsenbord als de pen wilt.
De standaard beperkte fabrieksgarantie van een jaar geldt bij aankoop in de VS.
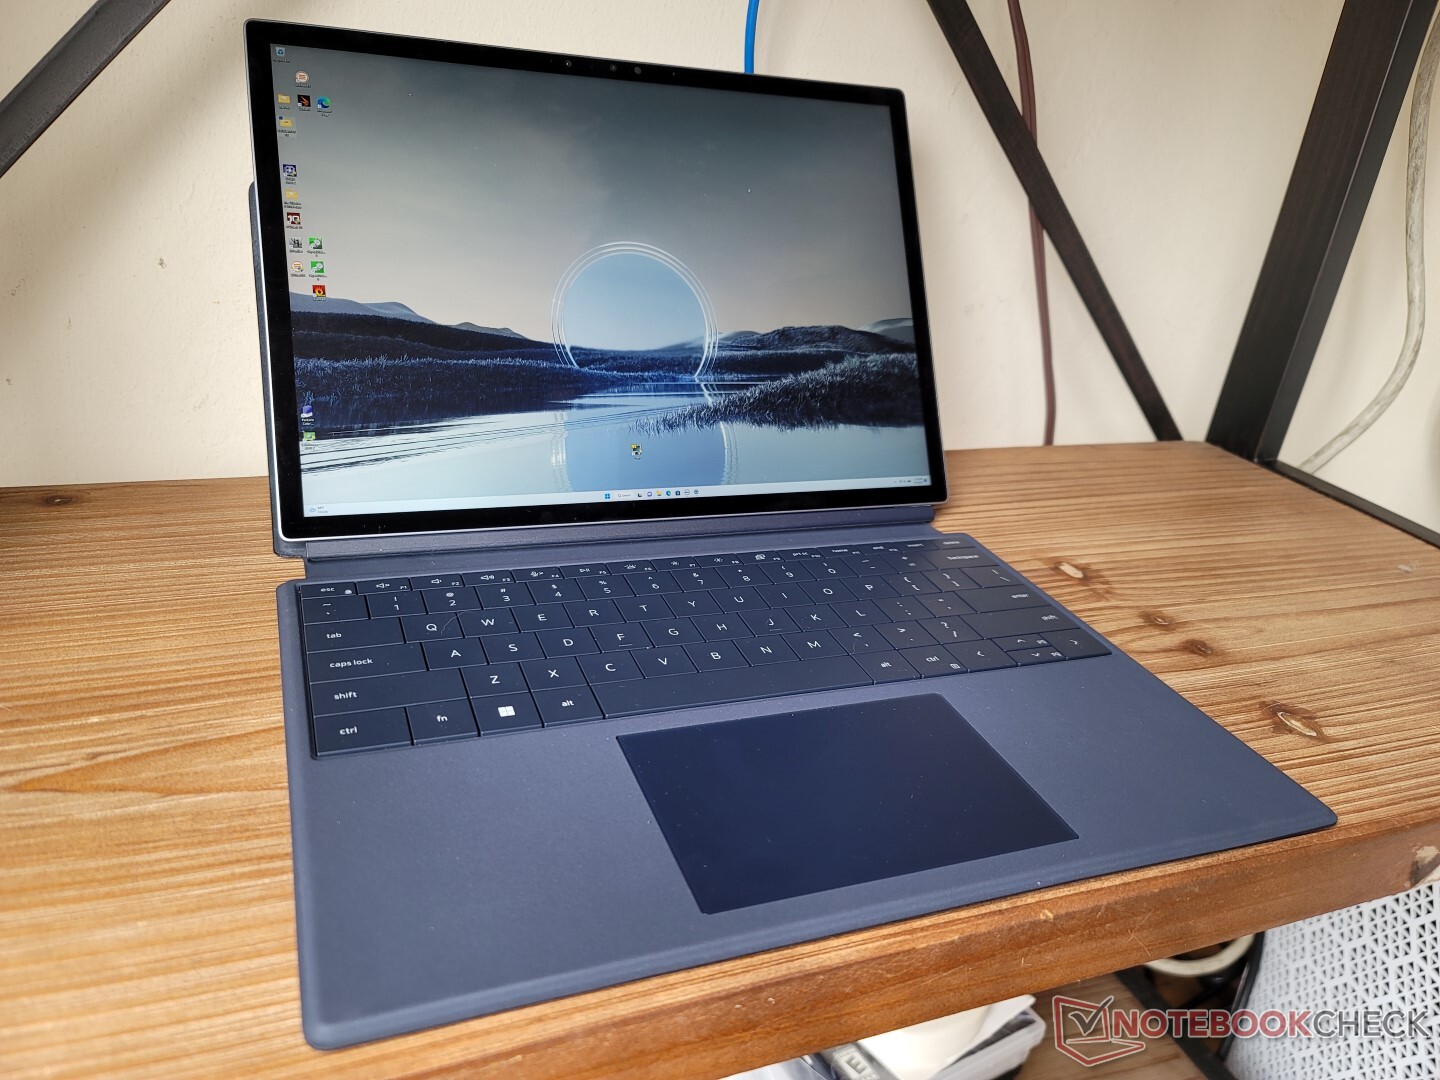
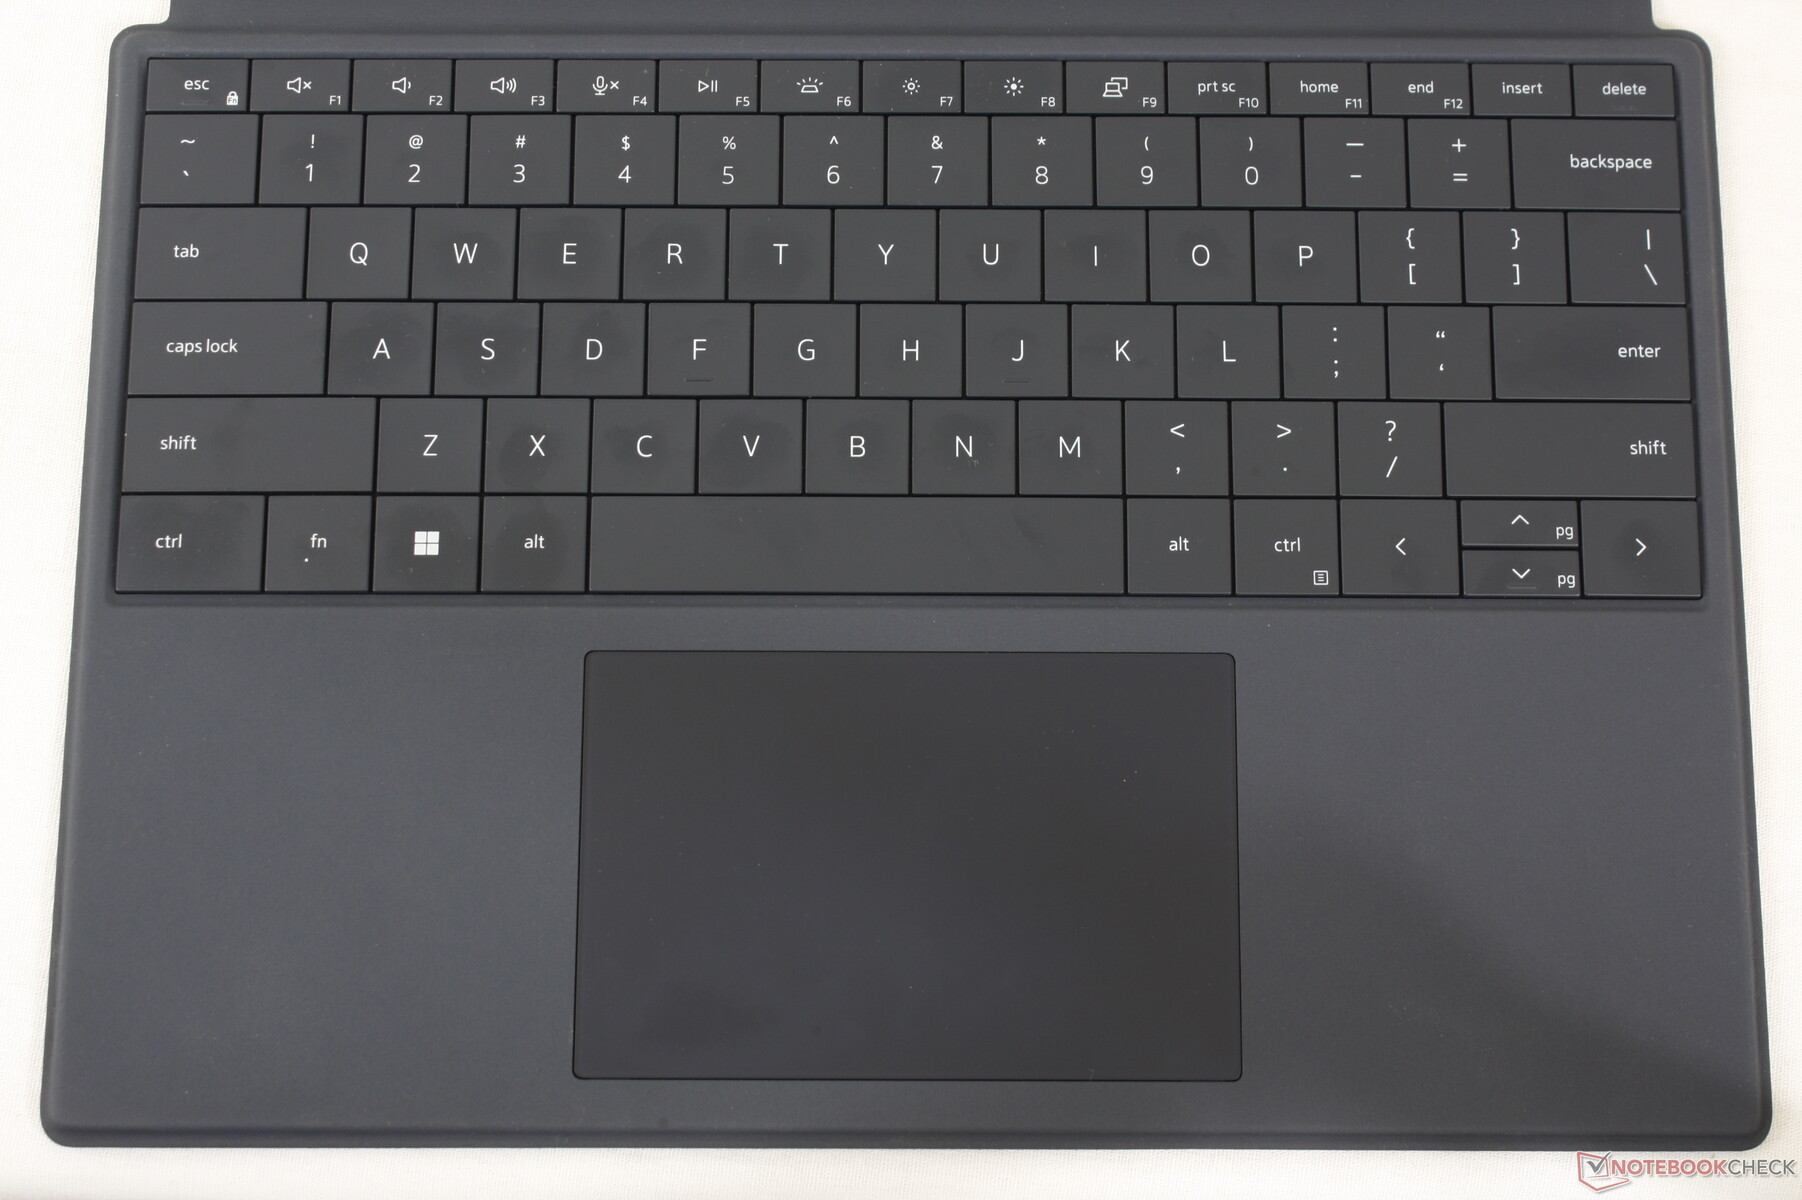
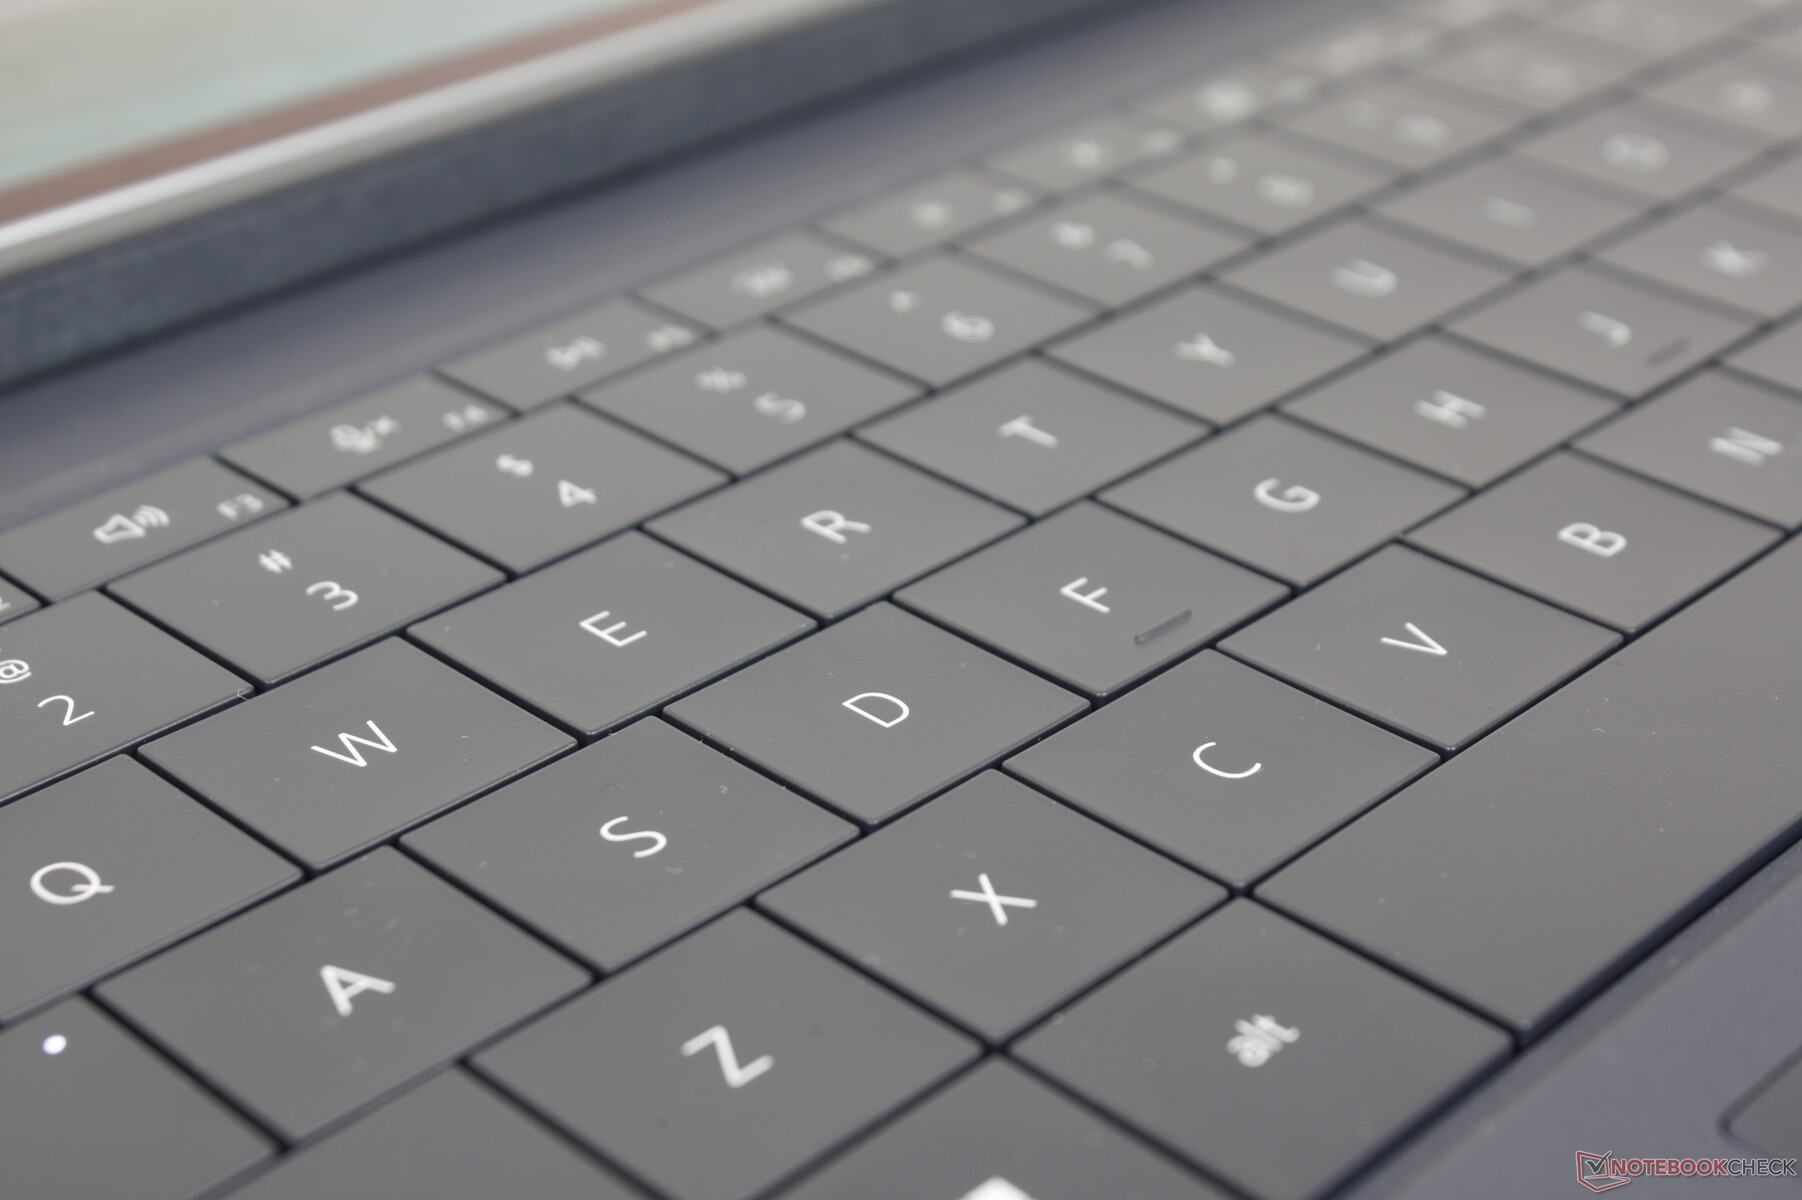
Invoerapparaten - Een van de meest comfortabele afneembare toetsenborden
Toetsenbord
Het toetsenbord is gemodelleerd naar het toetsenbord van de XPS 13 Plus 9320 en dus voelen ze bijna hetzelfde aan als het gaat om travel en feedback. Sommigen vinden de 1,0 mm toets travel te ondiep, maar het algemene gevoel is nog steeds veel beter dan verwacht voor een afneembare basis, omdat veel in de categorie zijn berucht om hun slechte toets feedback, goedkoop gevoel, en sponzige toetsen. Het XPS 13 9315 2-in-1 toetsenbord komt tot nu toe het dichtst bij een echt Ultrabook-toetsenbord
Met dat gezegd, de toetsenbordindeling is niet een-op-een met de XPS 13 Plus 9320. Dit laatste toetsenbord is iets breder en bevat zowel de aan/uit-knop als de capacitieve rij met functieopdrachten. Het lettertype styling en witte achtergrondverlichting zijn verder in wezen identiek.
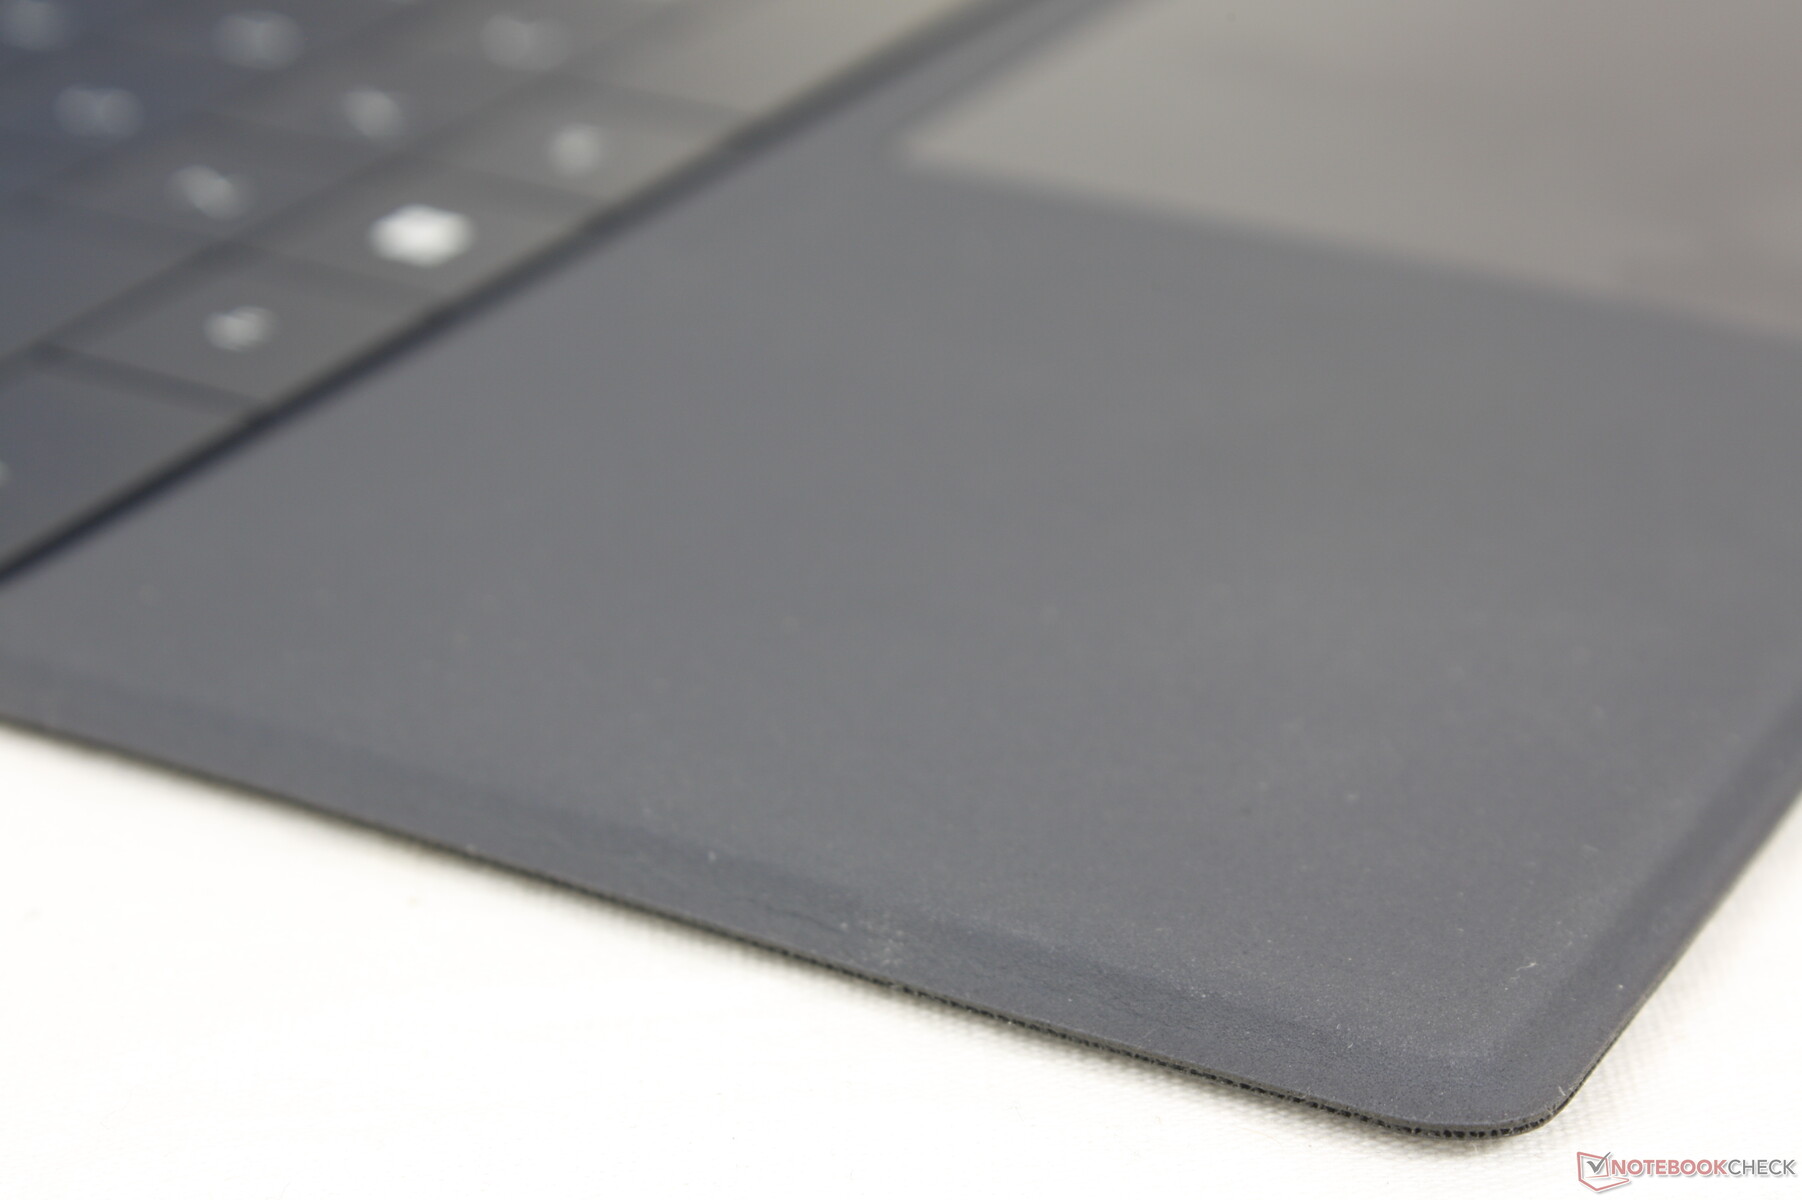
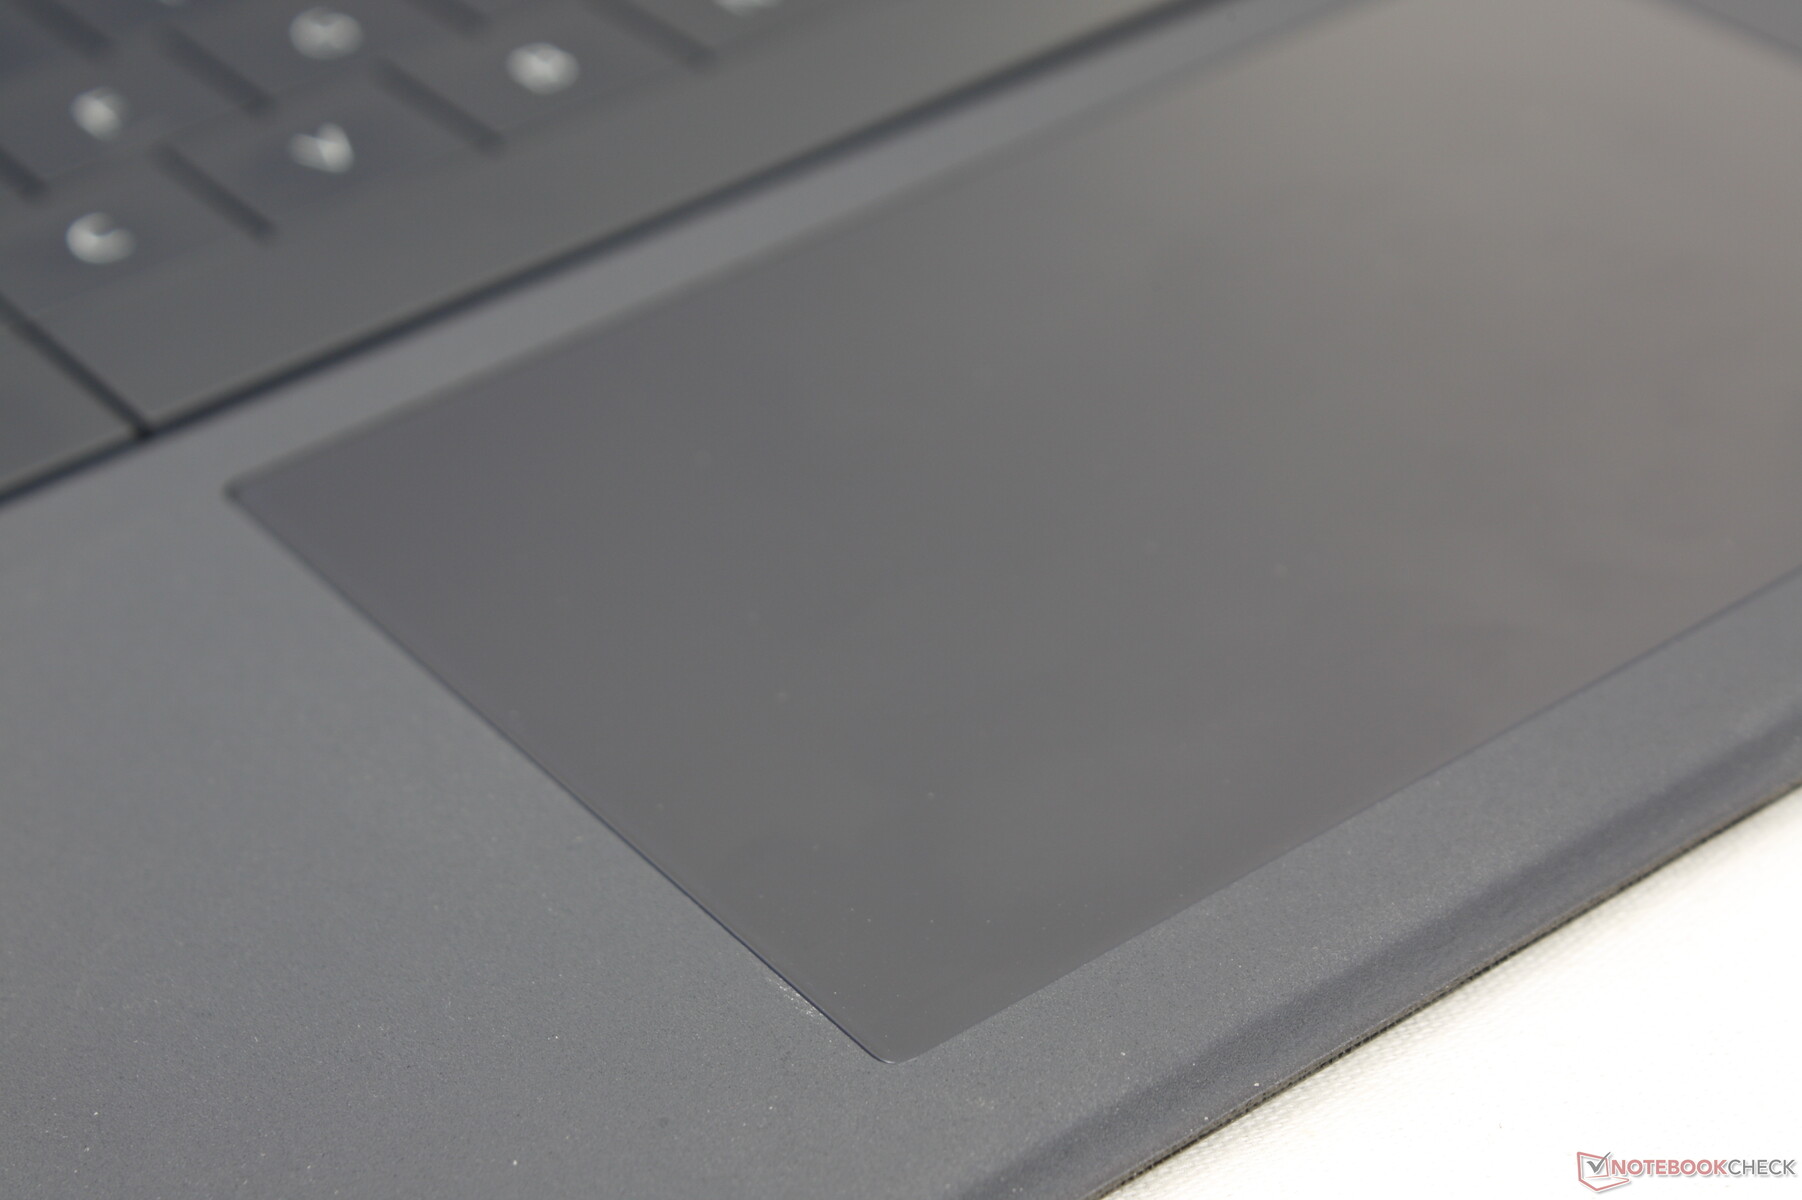
Touchpad
Het clickpad is groter dan dat van de Surface Pro-reeks (11,4 x 7,5 vs. 10,2 x 5,3 cm) om gemakkelijker te scrollen en multi-touch inputs uit te voeren. Het oppervlak is volledig glad en plakt zeer weinig, zelfs bij glijden op douchesnelheden. De feedback bij het klikken is echter veel ondieper dan op de meeste laptops, en dus is het niet zo bevredigend om te gebruiken als het clickpad op de meer traditionele XPS 13 9315 clamshell.
Display - alleen 60 Hz
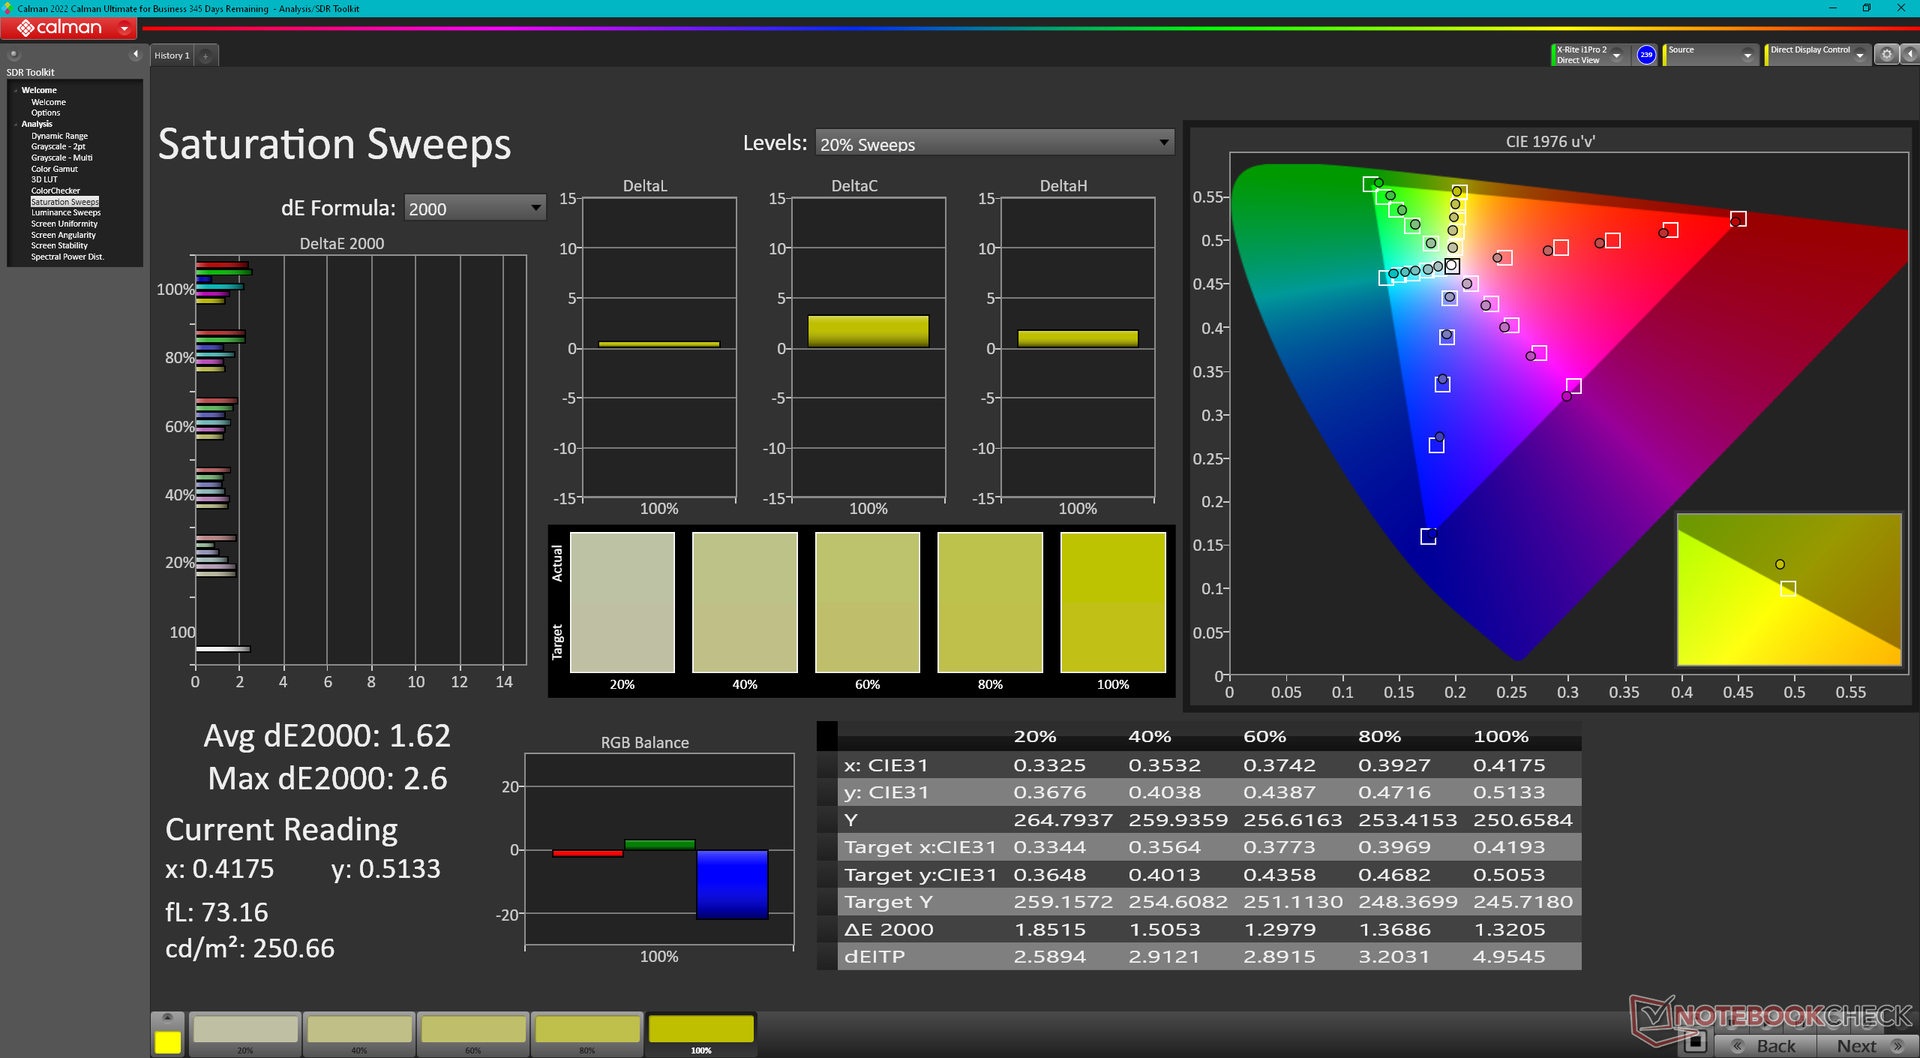
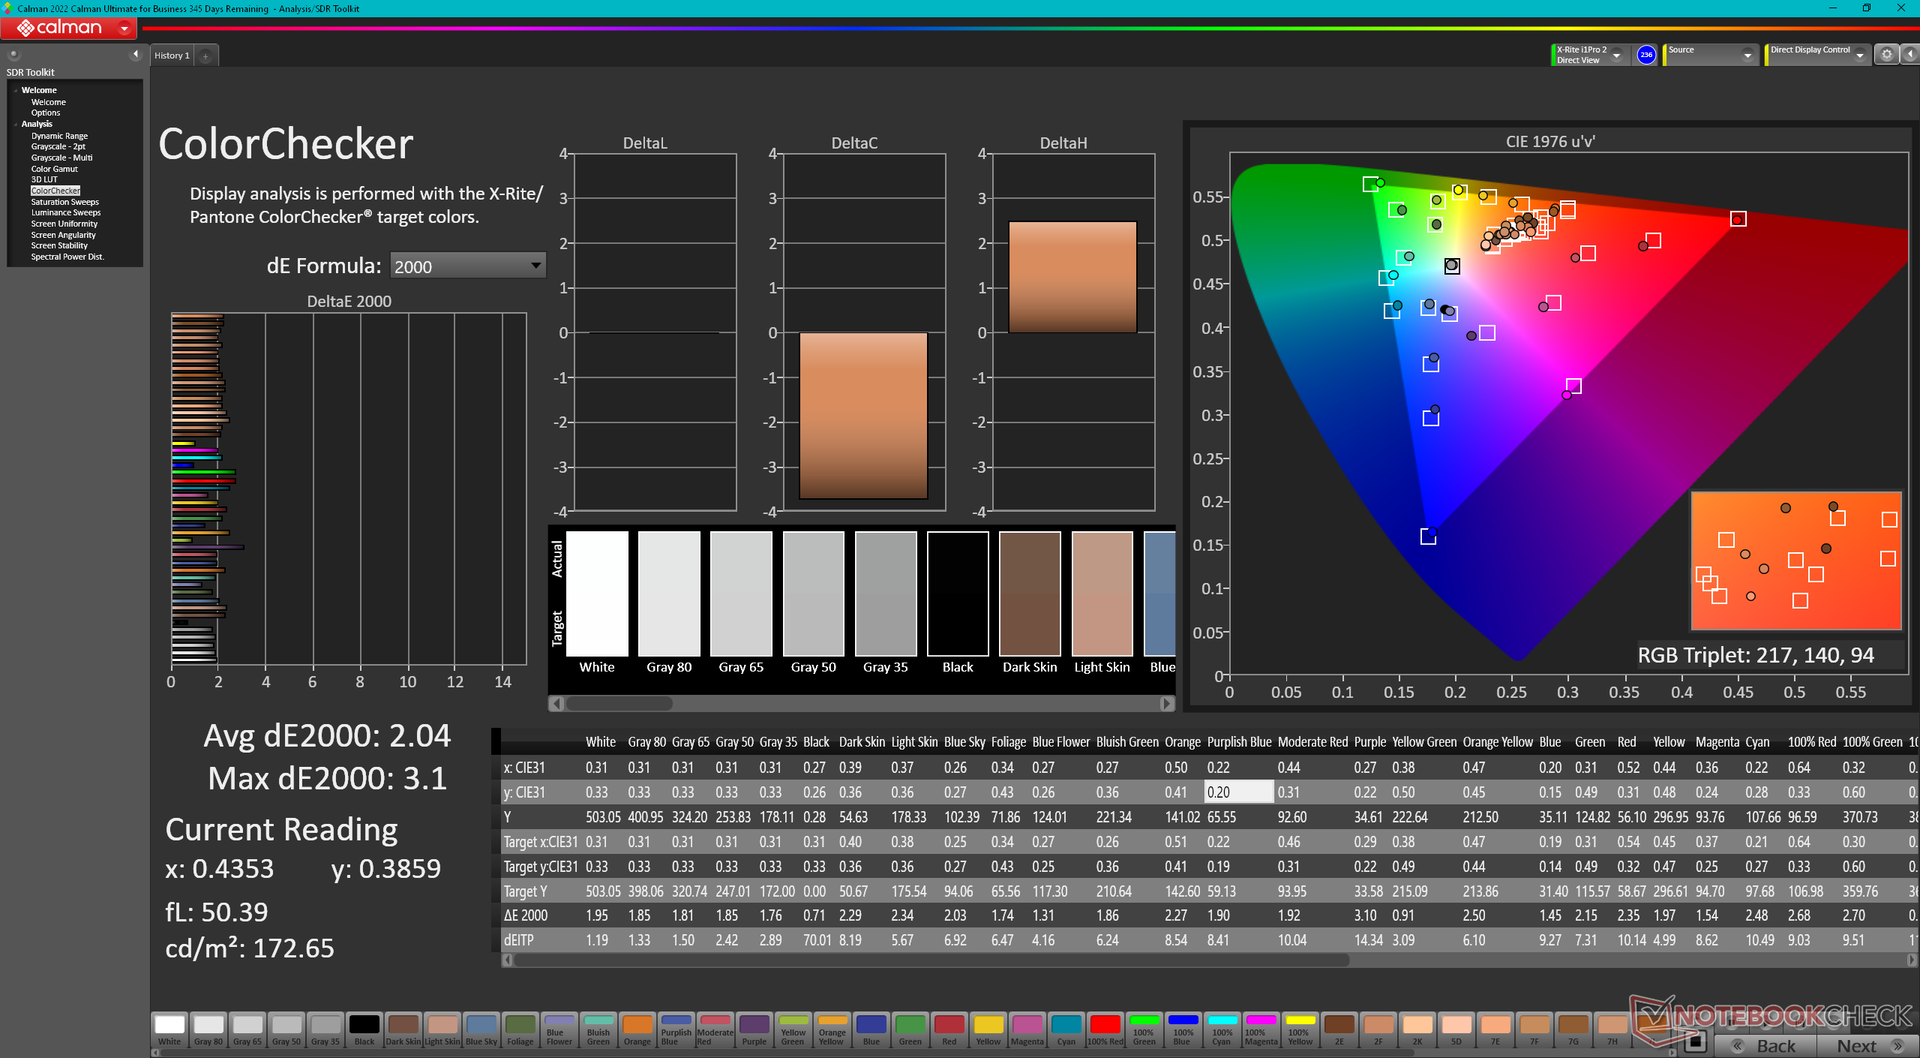
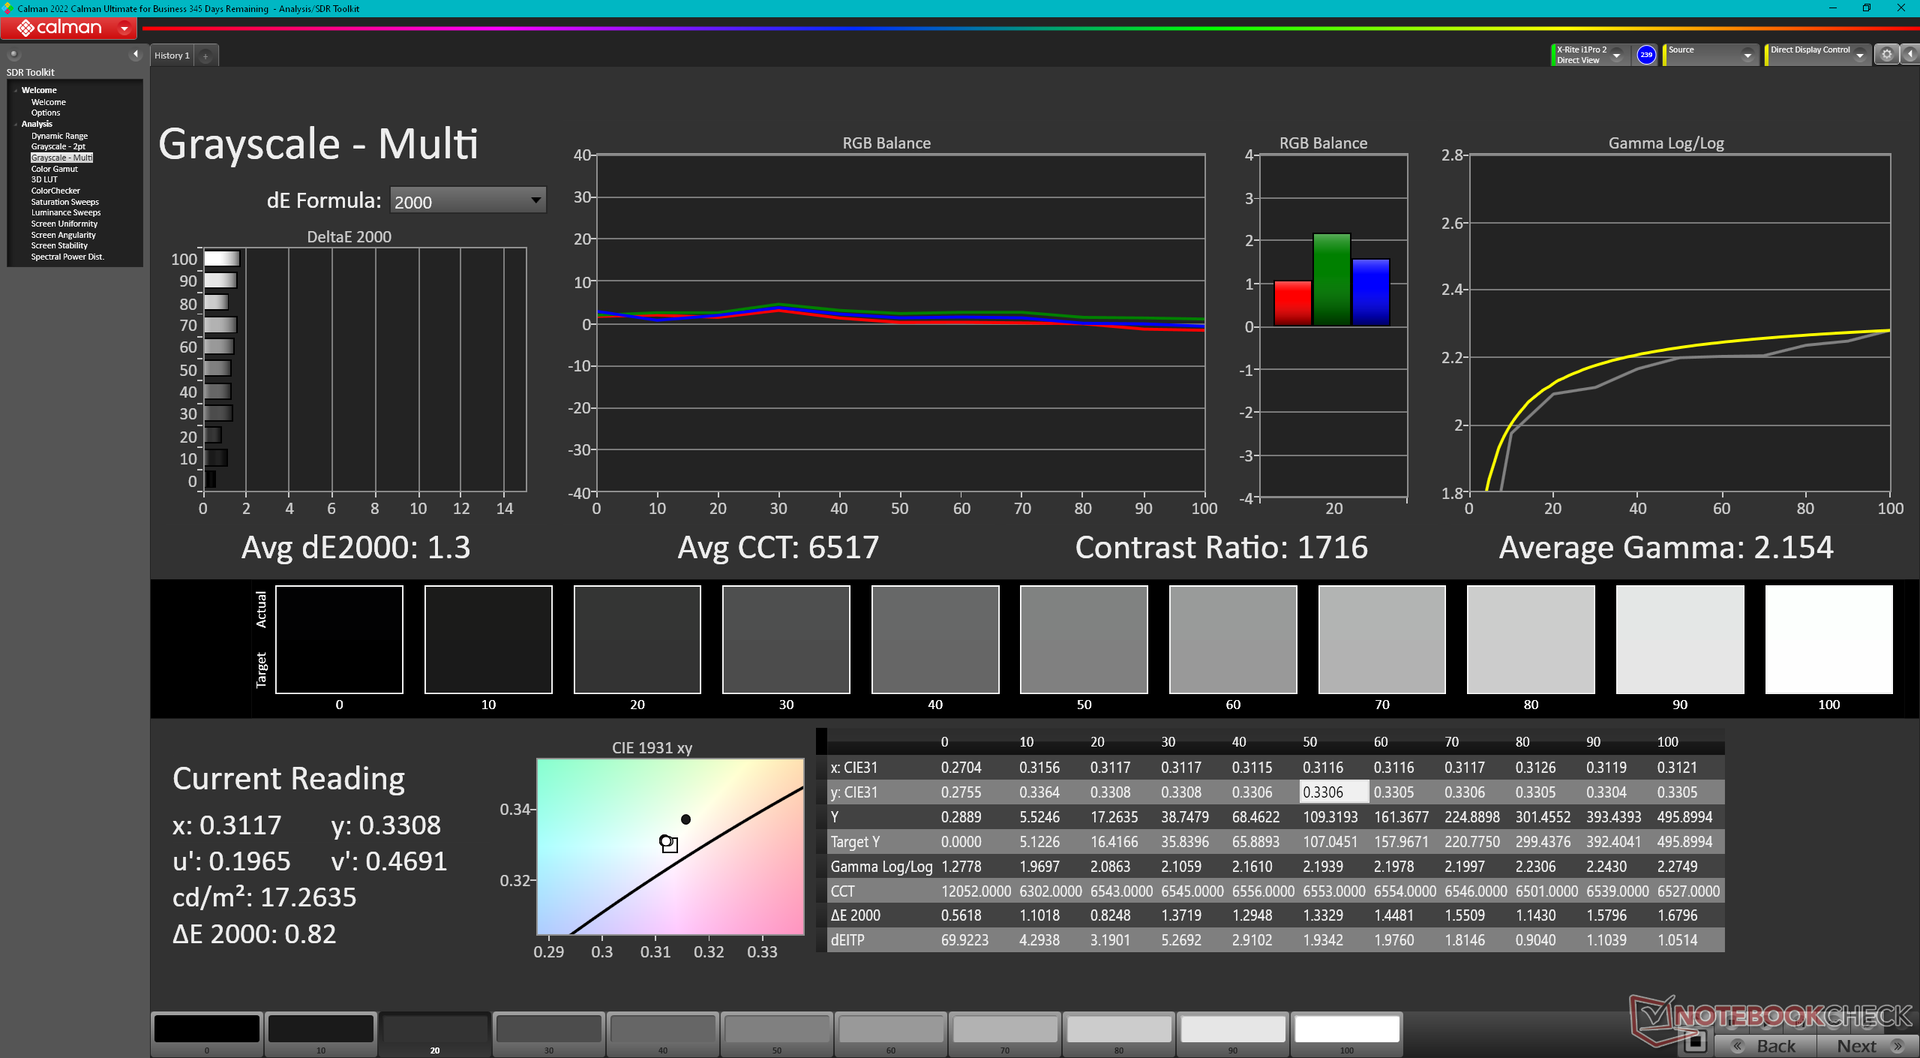
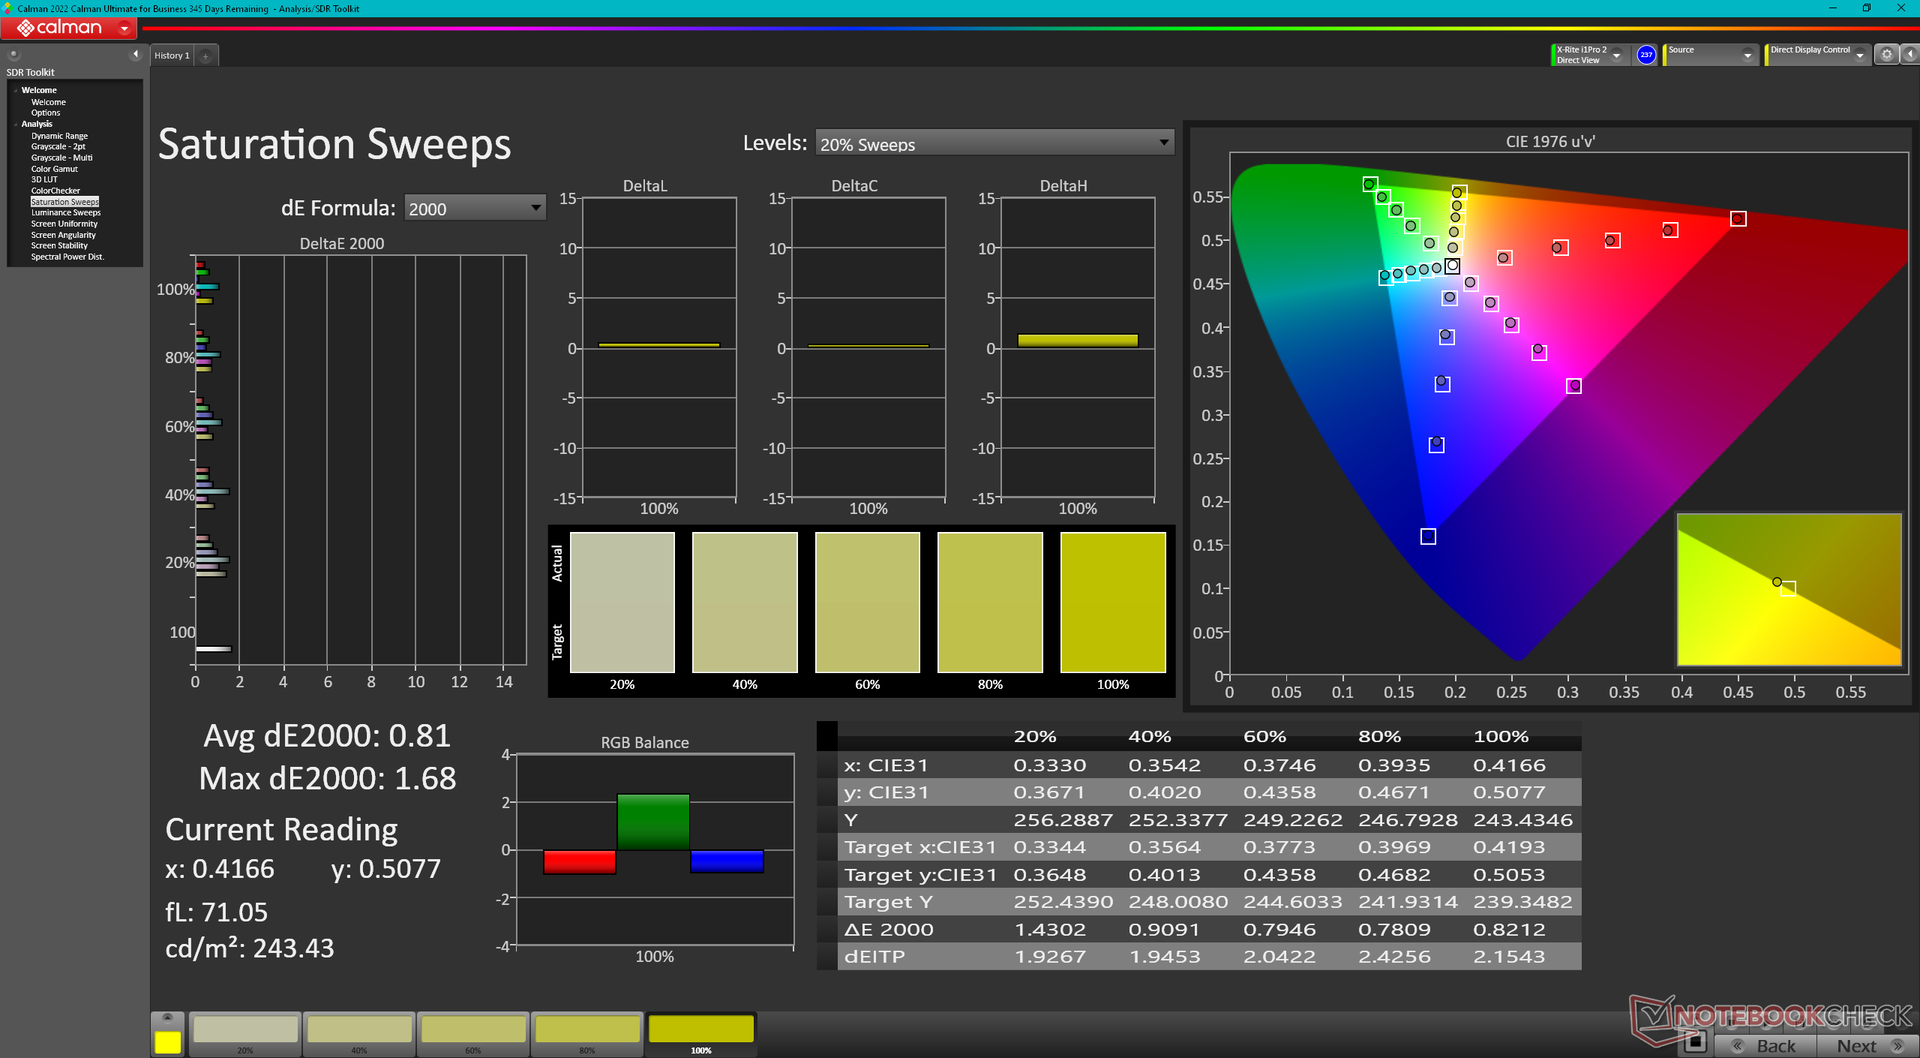
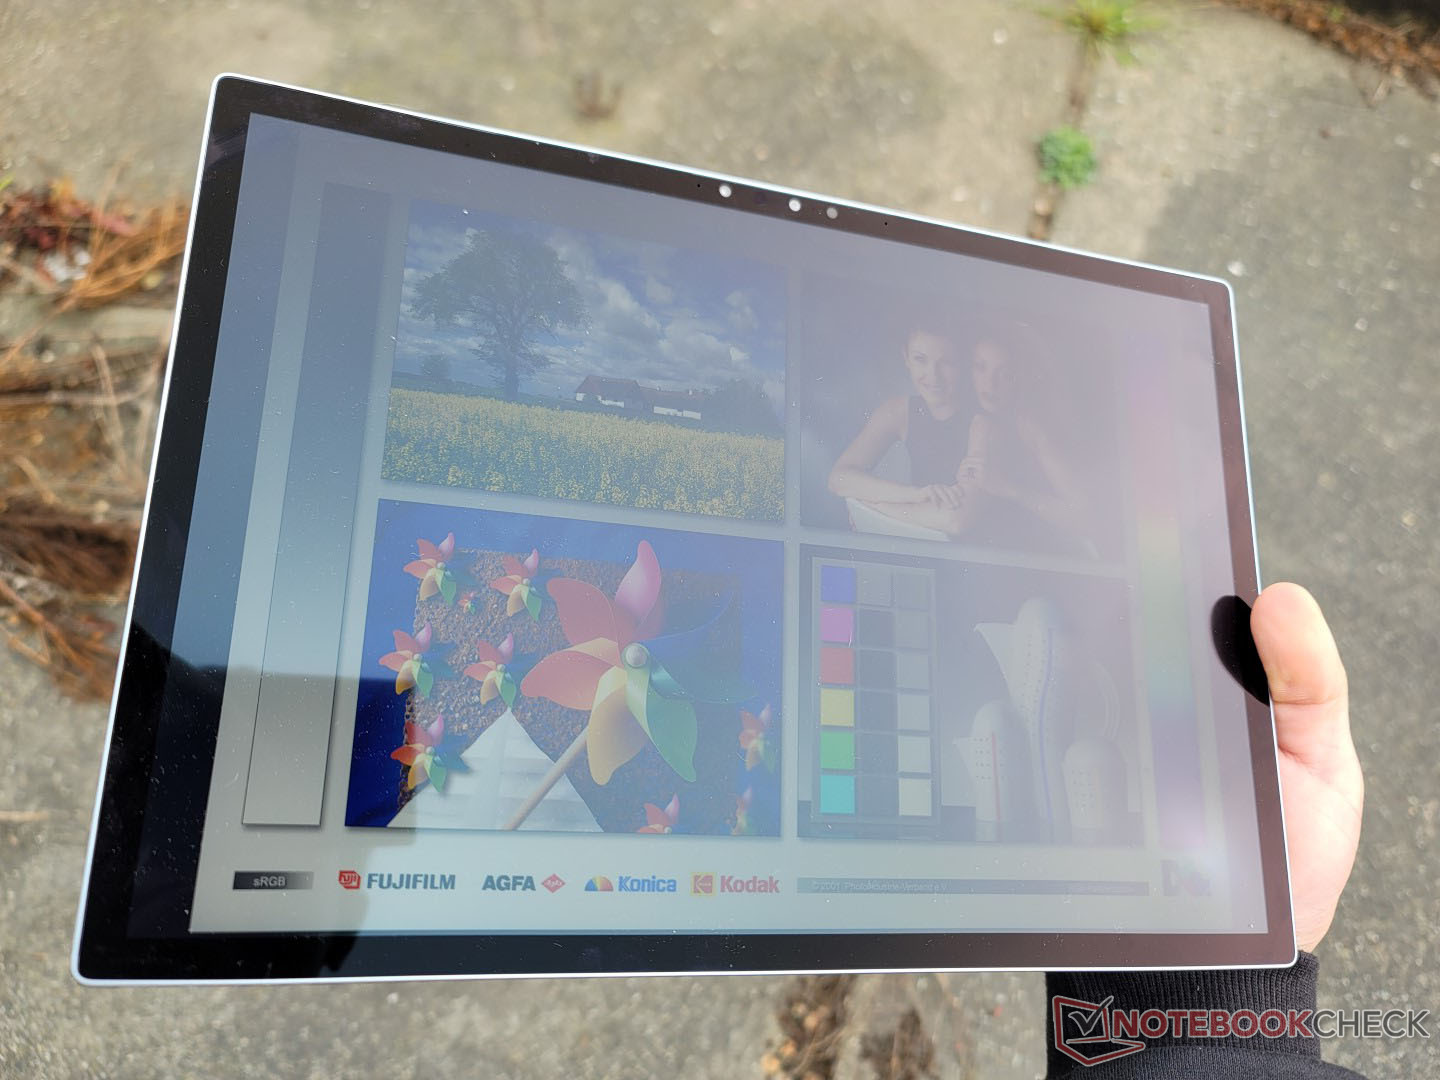
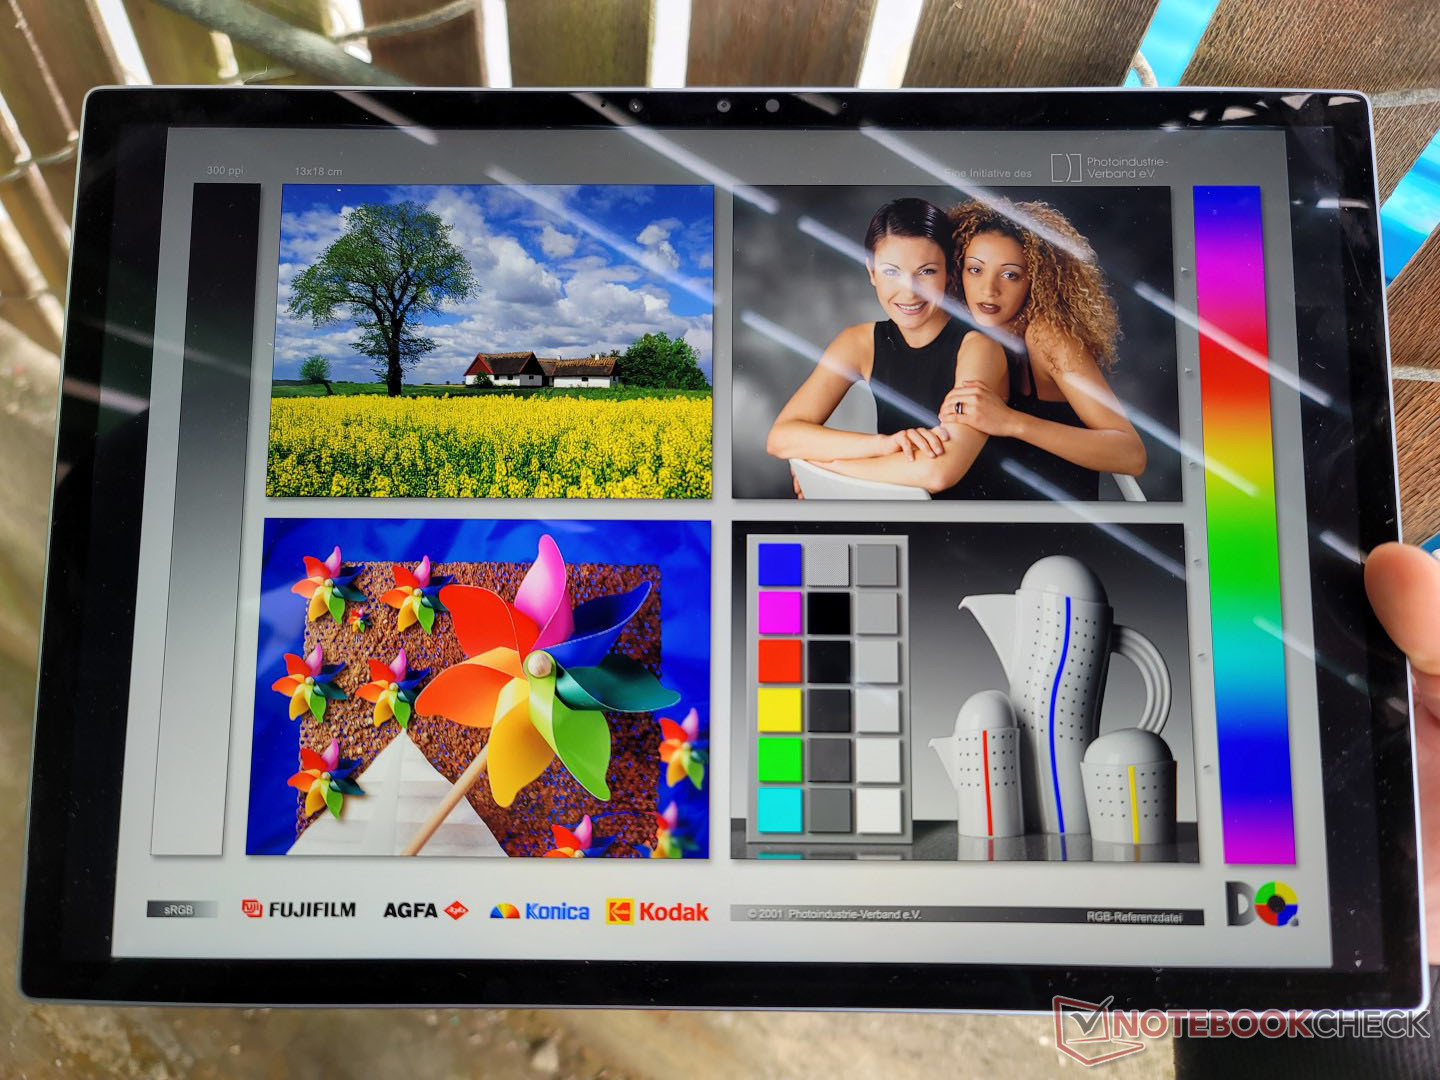
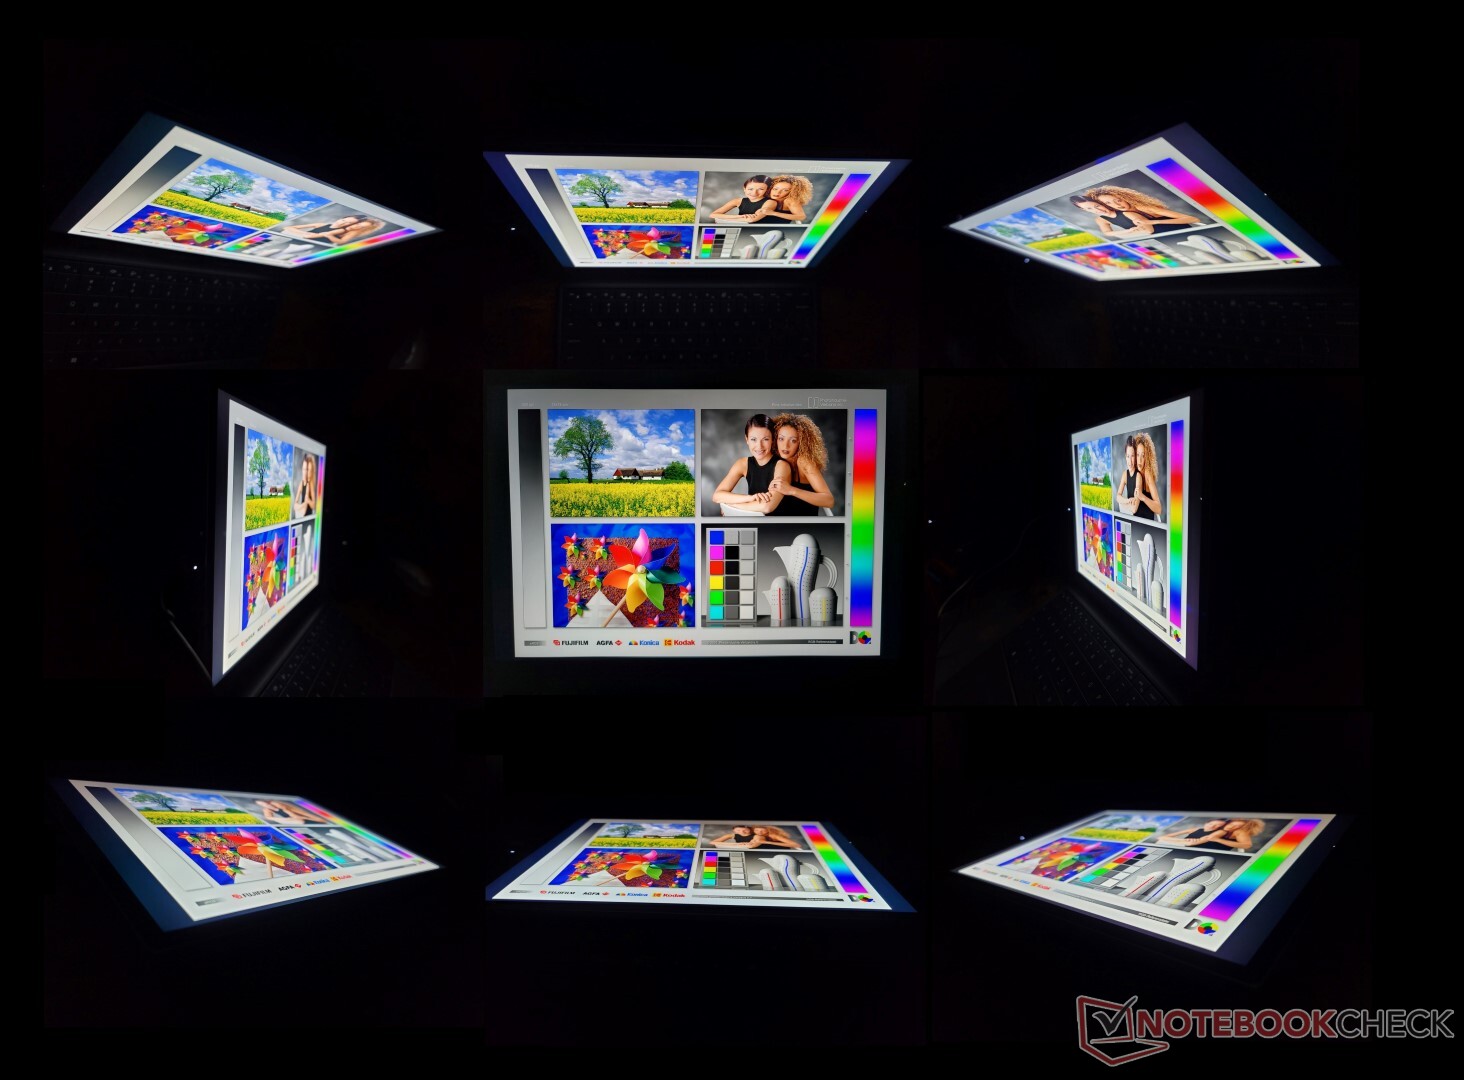
Dell adverteert met een 500-nit scherm met volledige sRGB dekking, wat we kunnen bevestigen met onze eigen onafhankelijke metingen. De contrast ratio is ook erg goed voor een IPS paneel met ongeveer 1500:1 en er is geen PWM op lagere helderheidsniveaus in tegenstelling tot op het Microsoft equivalent. De visuele ervaring is geschikt voor een high-end Windows-tablet, althans op het eerste gezicht.
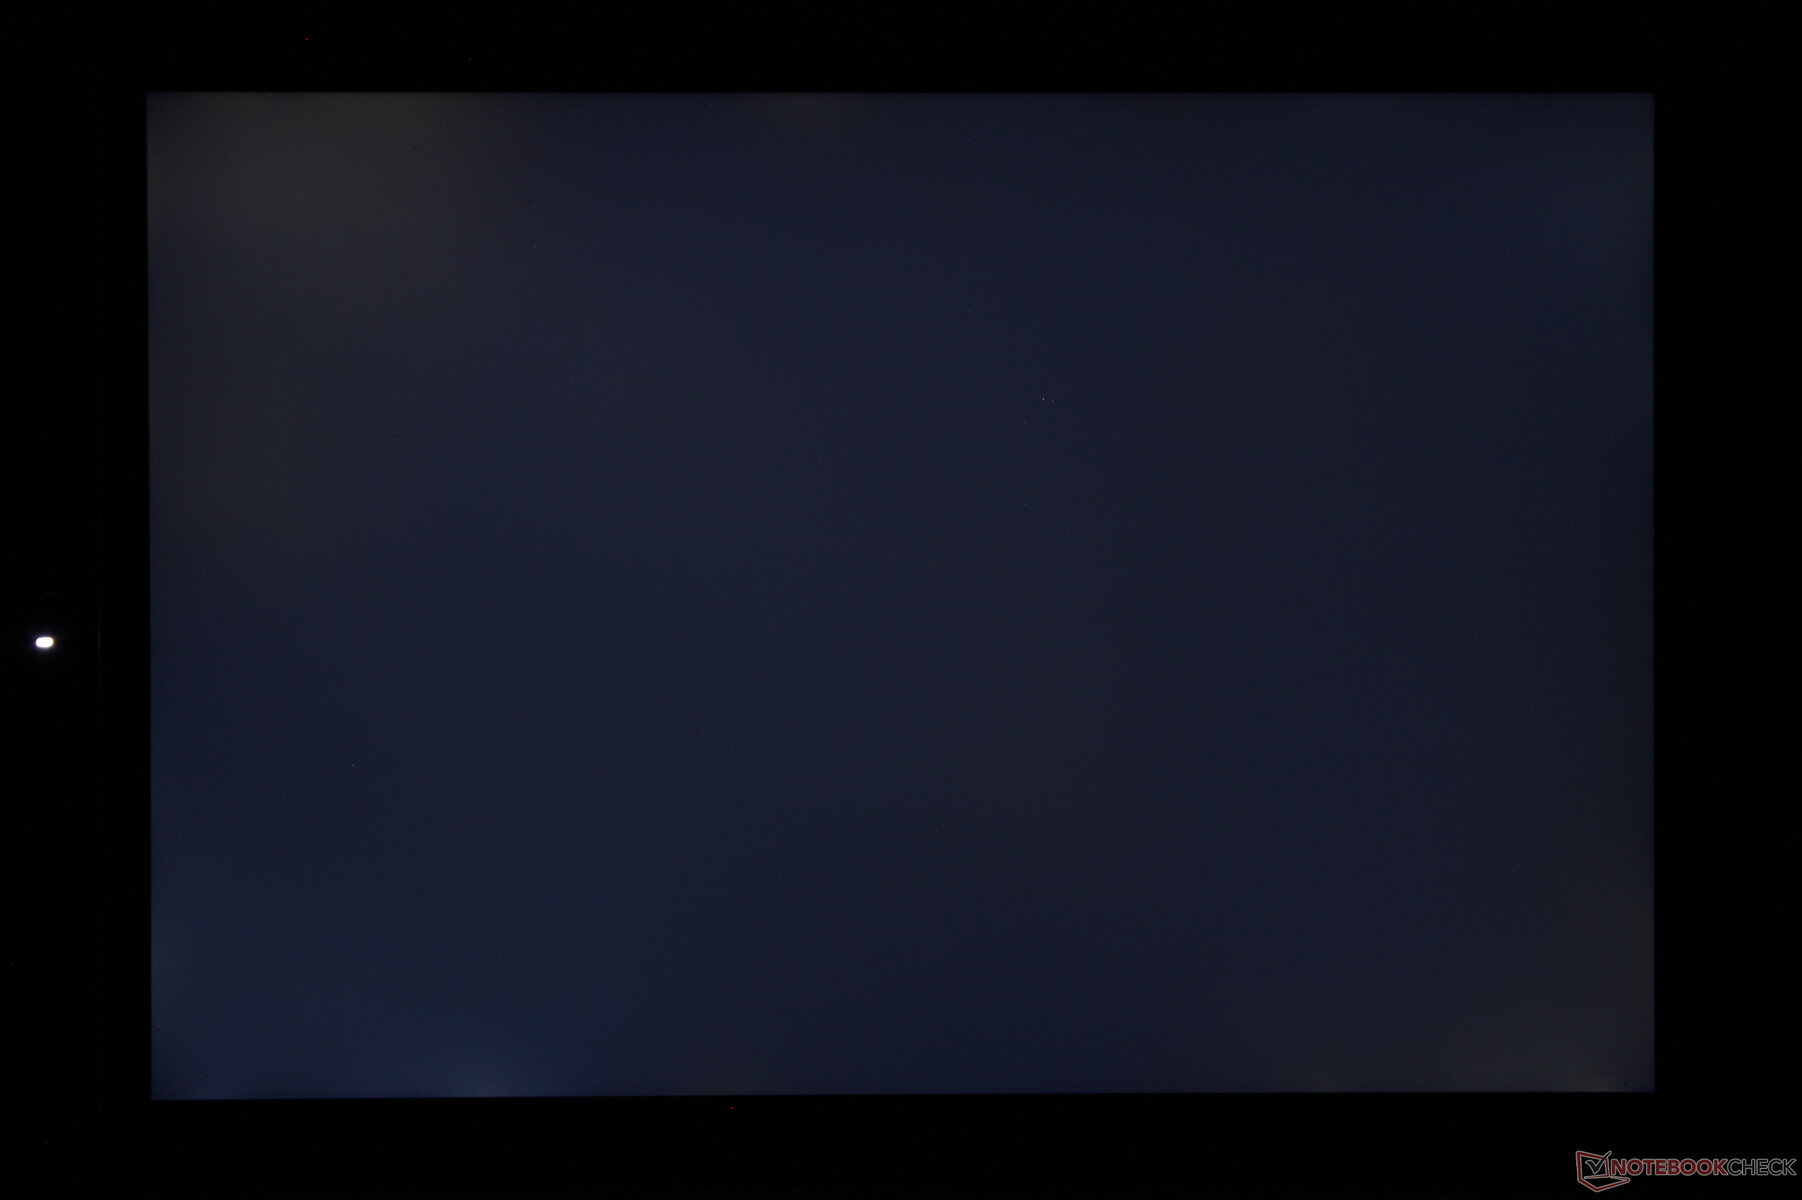
Er zijn twee opmerkelijke nadelen die het vermelden waard zijn. Ten eerste zijn de zwart-wit en grijs-grijs reactietijden relatief traag voor merkbare ghosting bij het verplaatsen van de cursor of het scrollen door webpagina's. Ten tweede had de uniformiteit van de helderheid beter gekund, want linksboven op het scherm is ongeveer 50 nits helderder dan rechtsonder. Het is niets bijzonders, maar een OLED-optie had deze beide nadelen gemakkelijk kunnen verhelpen.
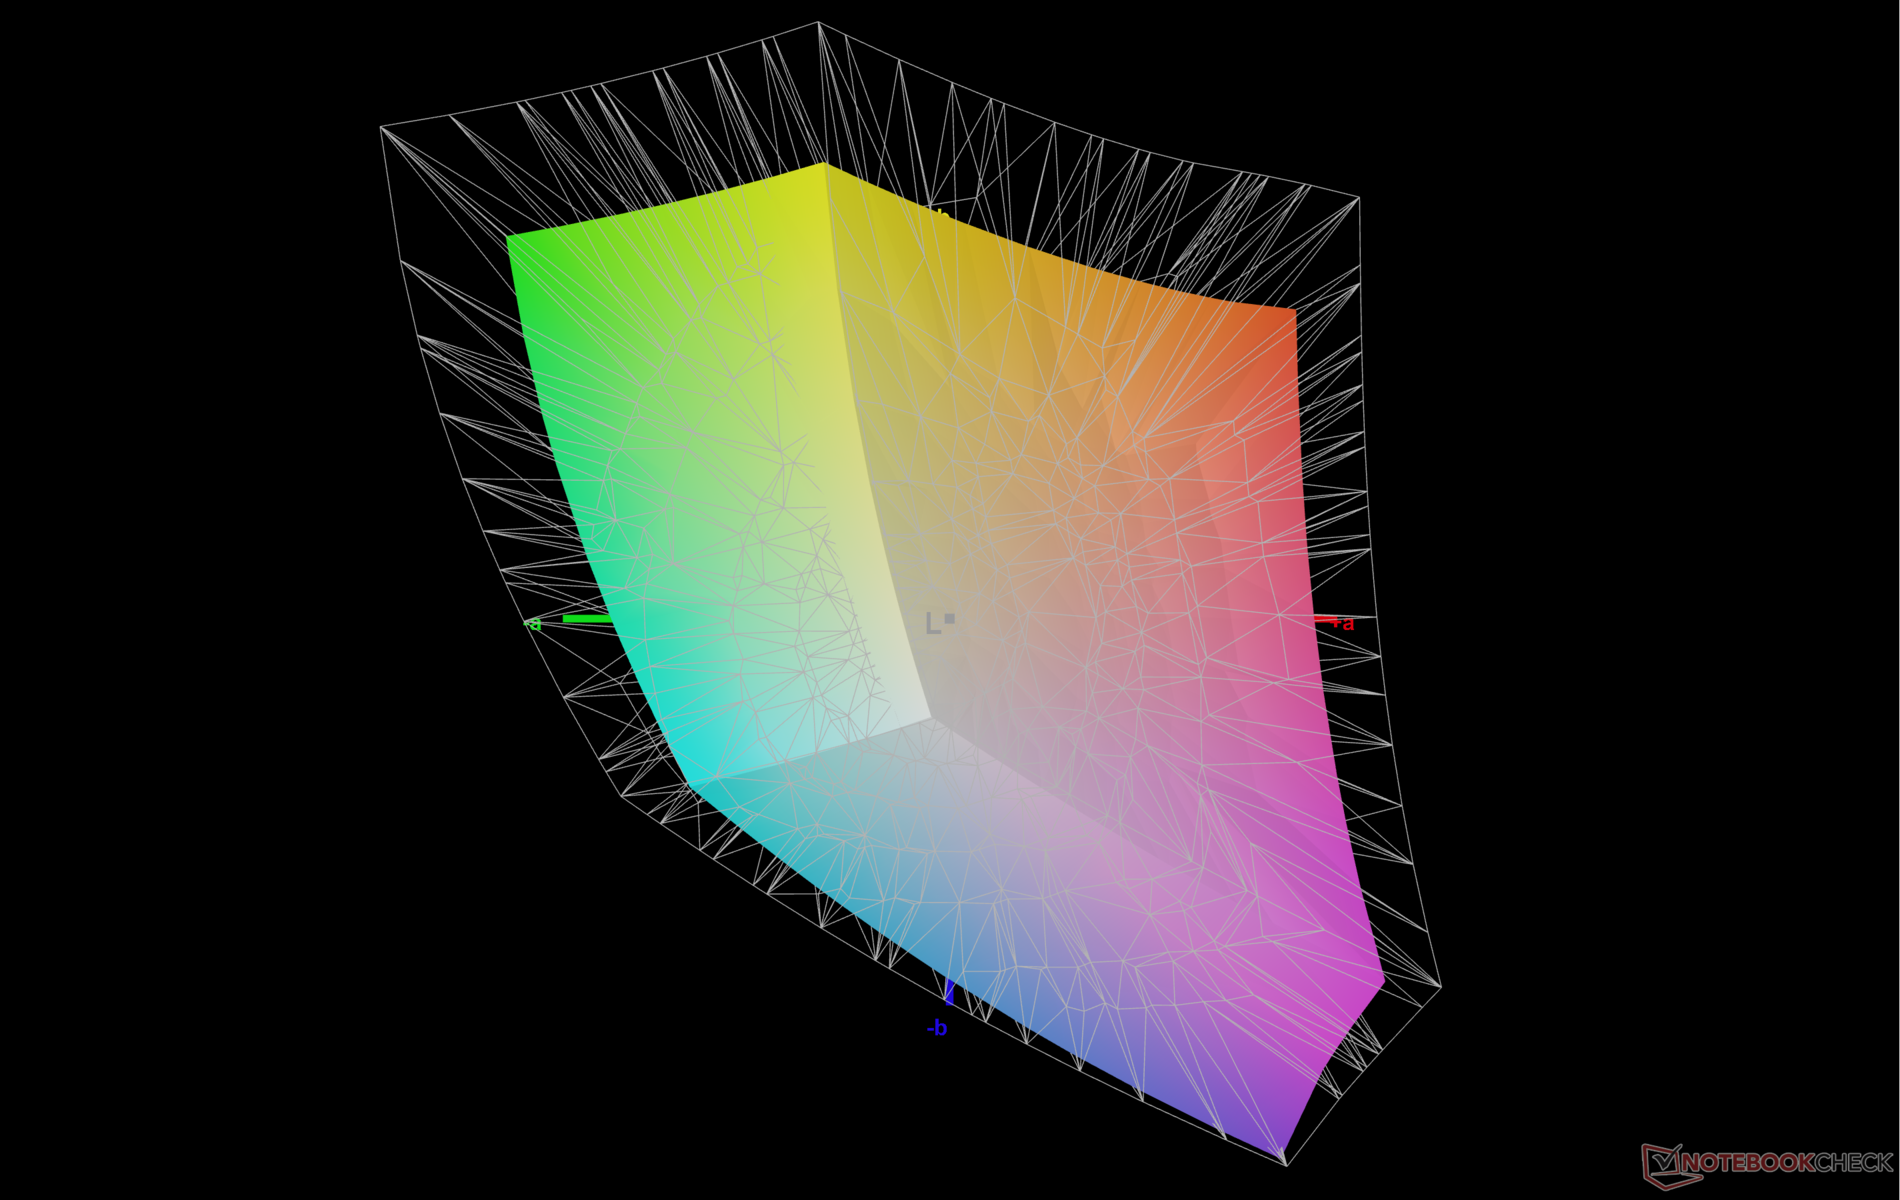
We zouden graag panelen met een hogere verversingssnelheid zien en misschien volledige P3-kleuren op toekomstige SKU's. De Surface Pro 8 heeft bijvoorbeeld opties met een verversingssnelheid van 120 Hz om de reactiesnelheid van de UI te verbeteren. Ondertussen zullen gebruikers moeten overwegen om laptops te kopen zoals de Dell XPS 13 Plus 9320 of de Asus VivoBook voor OLED-functies.
| |||||||||||||||||||||||||
Helderheidsverdeling: 87 %
Helderheid in Batterij-modus: 507 cd/m²
Contrast: 1491:1 (Zwart: 0.34 cd/m²)
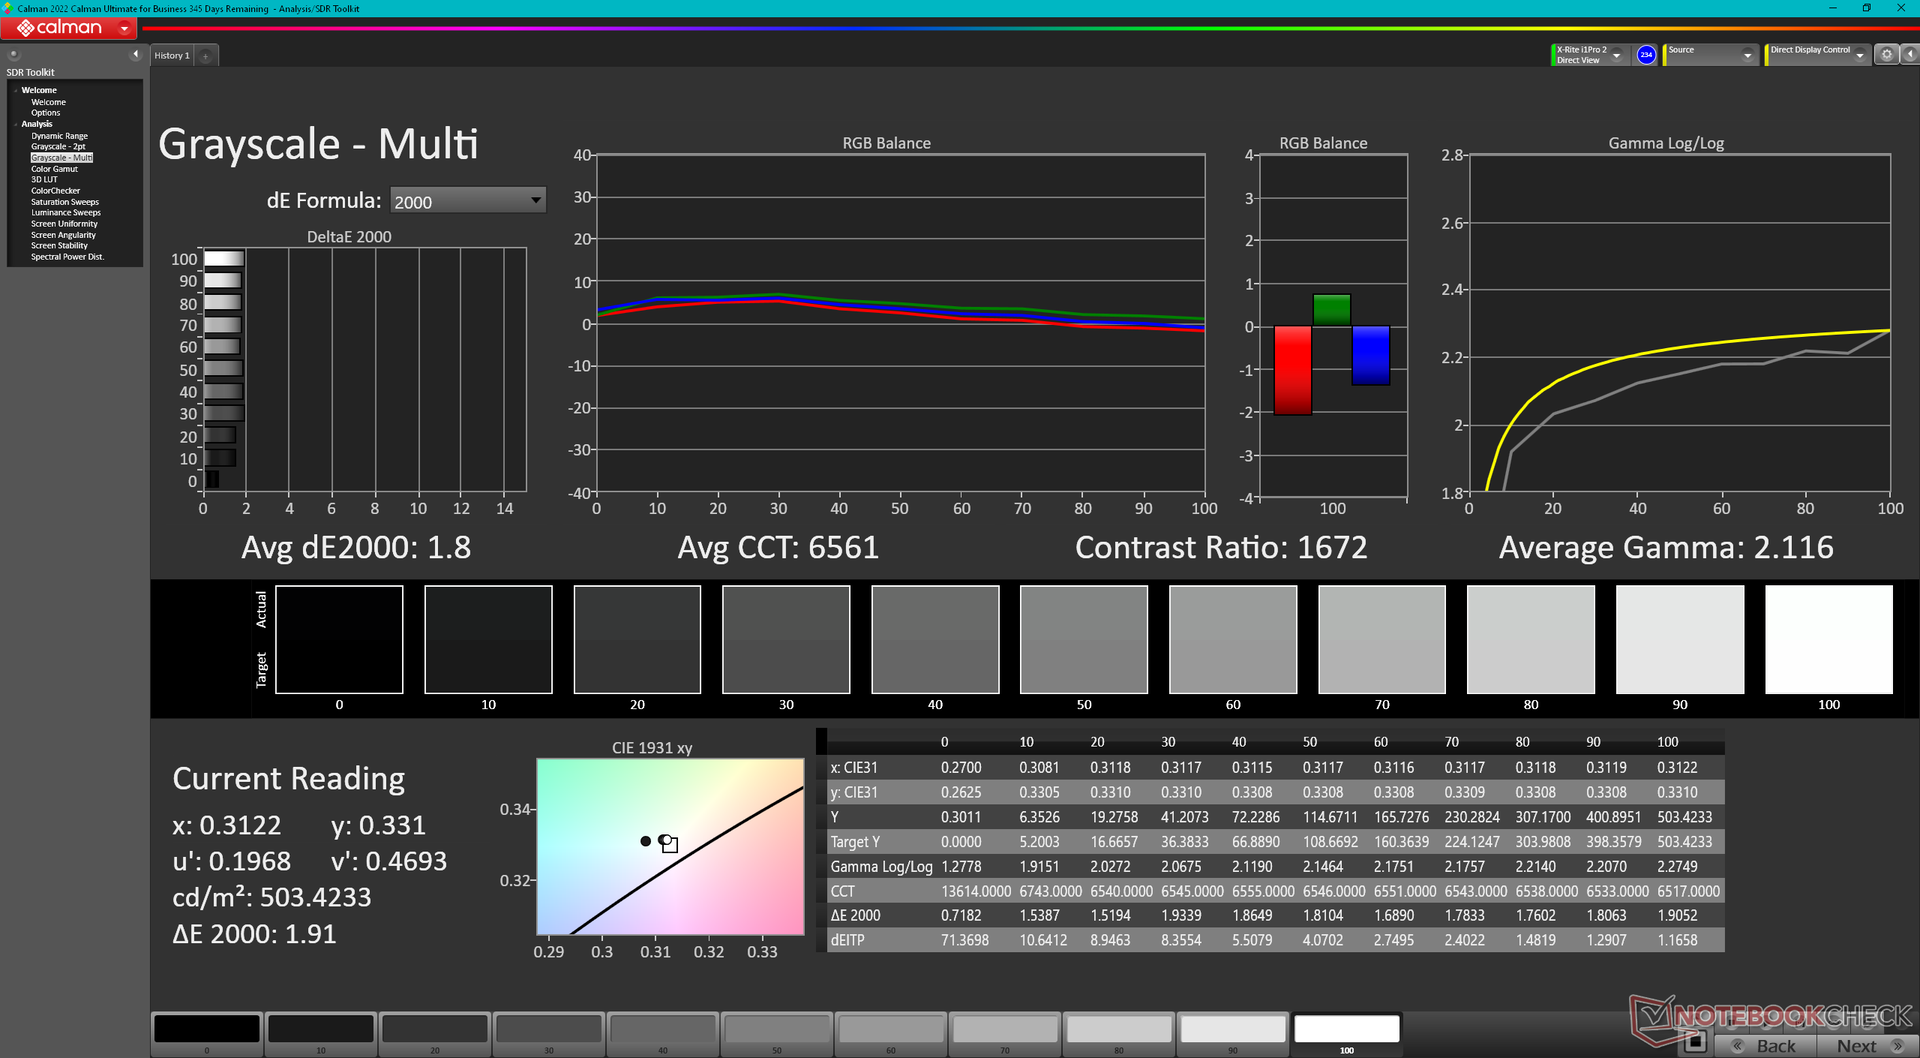
ΔE ColorChecker Calman: 2.04 | ∀{0.5-29.43 Ø4.71}
calibrated: 0.86
ΔE Greyscale Calman: 1.8 | ∀{0.09-98 Ø4.96}
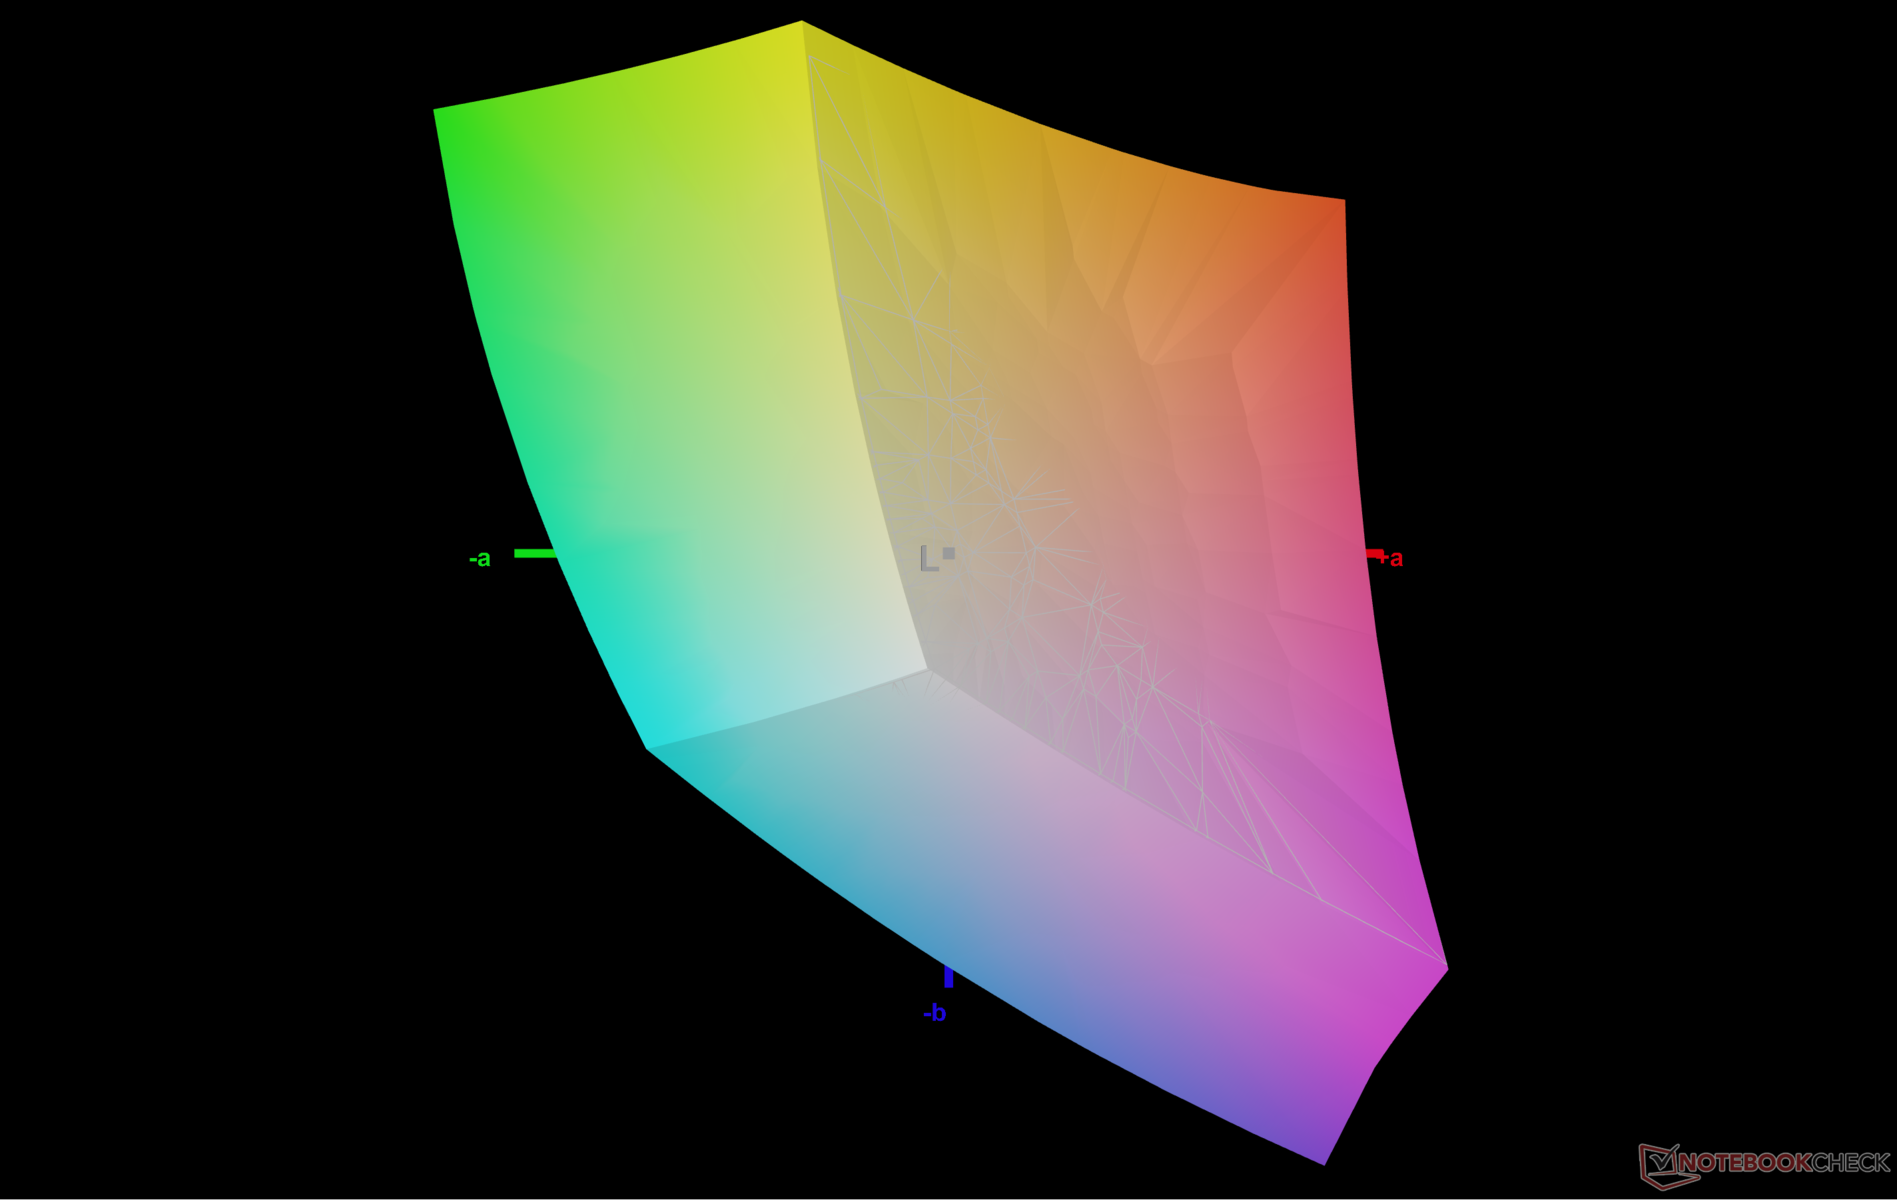
72.6% AdobeRGB 1998 (Argyll 3D)
99.8% sRGB (Argyll 3D)
70.7% Display P3 (Argyll 3D)
Gamma: 2.12
CCT: 6561 K
| Dell XPS 13 9315 2-in-1 Core i5-1230U BOE NE13A1M, IPS, 2880x1920, 13" | Dell XPS 13 Plus 9320 i7-1280P OLED Samsung 134XK04, OLED, 3456x2160, 13.4" | Microsoft Surface Pro 8, i7-1185G7 LP129WT212166, IPS, 2880x1920, 13" | HP Spectre x360 13.5 14t-ef000 SDC4160, OLED, 3000x2000, 13.5" | Lenovo ThinkBook Plus Gen2 Core i5 CSOT T3 MND307DA1-5 (LCD), IPS, E-Ink, 2560x1600, 13.3" | Apple MacBook Air M2 Entry IPS, 2560x1664, 13.6" | |
|---|---|---|---|---|---|---|
| Display | 26% | 6% | 22% | -1% | 20% | |
| Display P3 Coverage (%) | 70.7 | 99.5 41% | 78.2 11% | 99.9 41% | 70.1 -1% | 98.4 39% |
| sRGB Coverage (%) | 99.8 | 100 0% | 100 0% | 100 0% | 98 -2% | 99.9 0% |
| AdobeRGB 1998 Coverage (%) | 72.6 | 98.4 36% | 77.6 7% | 90.8 25% | 72.2 -1% | 87.6 21% |
| Response Times | 93% | 1% | 94% | -5% | 13% | |
| Response Time Grey 50% / Grey 80% * (ms) | 44 ? | 2.6 ? 94% | 46.4 ? -5% | 1.9 ? 96% | 42.8 ? 3% | 32.9 ? 25% |
| Response Time Black / White * (ms) | 24.8 ? | 2.1 ? 92% | 23.2 ? 6% | 2.16 ? 91% | 28 ? -13% | 24.9 ? -0% |
| PWM Frequency (Hz) | 59.5 | 29760 ? | 60.2 ? | |||
| Screen | -27% | -19% | -29% | -36% | 5% | |
| Brightness middle (cd/m²) | 507 | 371.8 -27% | 444 -12% | 351.7 -31% | 404 -20% | 526 4% |
| Brightness (cd/m²) | 486 | 374 -23% | 451 -7% | 351 -28% | 388 -20% | 486 0% |
| Brightness Distribution (%) | 87 | 98 13% | 91 5% | 87 0% | 94 8% | 87 0% |
| Black Level * (cd/m²) | 0.34 | 0.43 -26% | 0.24 29% | 0.38 -12% | ||
| Contrast (:1) | 1491 | 1033 -31% | 1683 13% | 1384 -7% | ||
| Colorchecker dE 2000 * | 2.04 | 2.37 -16% | 2 2% | 1.78 13% | 3.1 -52% | 1.3 36% |
| Colorchecker dE 2000 max. * | 3.1 | 6.1 -97% | 3.2 -3% | 6.14 -98% | 6.9 -123% | 2.7 13% |
| Colorchecker dE 2000 calibrated * | 0.86 | 1.7 -98% | 1.3 -51% | 0.7 19% | ||
| Greyscale dE 2000 * | 1.8 | 2 -11% | 1.8 -0% | 2.3 -28% | 3.7 -106% | 2 -11% |
| Gamma | 2.12 104% | 2.29 96% | 2.11 104% | 2.11 104% | 2.26 97% | 2.25 98% |
| CCT | 6561 99% | 6261 104% | 6417 101% | 6683 97% | 5936 110% | 6858 95% |
| Totaal Gemiddelde (Programma / Instellingen) | 31% /
9% | -4% /
-11% | 29% /
7% | -14% /
-24% | 13% /
9% |
* ... kleiner is beter
Het scherm is al goed gekalibreerd uit de doos met gemiddelde grijswaarden en kleurendeltawaarden van respectievelijk slechts 1,8 en 2,04. Door het scherm zelf nog verder te kalibreren met een X-Rite colorimeter zouden de gemiddelden dalen tot slechts 1,3 en 0,86, maar kalibratie door de eindgebruiker zal voor de meesten niet nodig zijn.
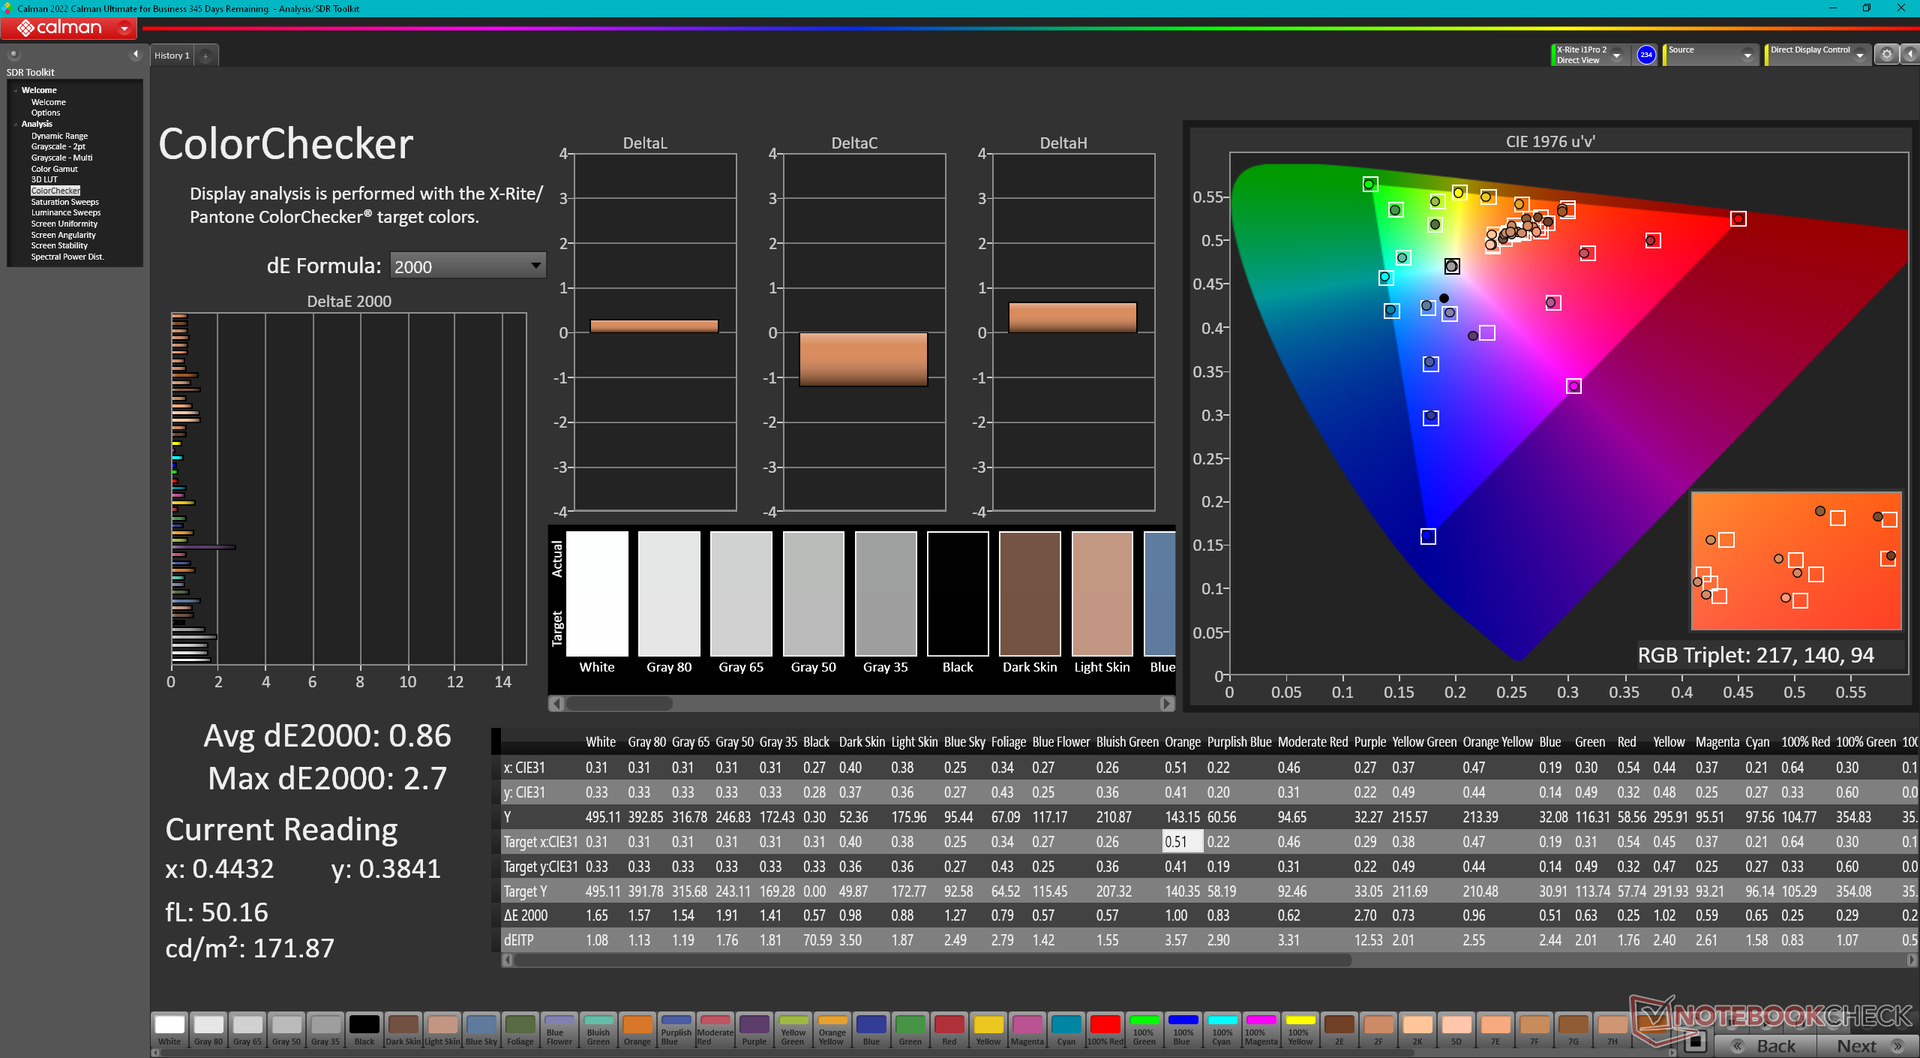
Responstijd Scherm
| ↔ Responstijd Zwart naar Wit | ||
|---|---|---|
| 24.8 ms ... stijging ↗ en daling ↘ gecombineerd | ↗ 11.6 ms stijging | 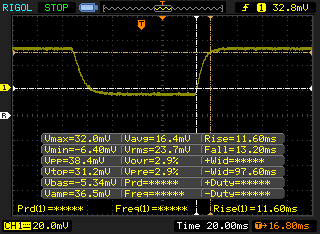 |
| ↘ 13.2 ms daling | ||
| Het scherm vertoonde prima responstijden in onze tests maar is misschien wat te traag voor competitieve games. Ter vergelijking: alle testtoestellen variëren van 0.1 (minimum) tot 240 (maximum) ms. » 58 % van alle toestellen zijn beter. Dit betekent dat de gemeten responstijd slechter is dan het gemiddelde (19.8 ms) van alle geteste toestellen. | ||
| ↔ Responstijd 50% Grijs naar 80% Grijs | ||
| 44 ms ... stijging ↗ en daling ↘ gecombineerd | ↗ 23.6 ms stijging | 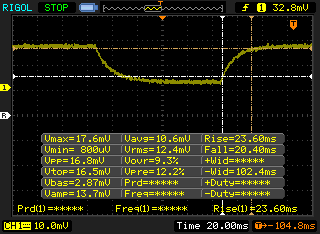 |
| ↘ 20.4 ms daling | ||
| Het scherm vertoonde trage responstijden in onze tests en is misschien te traag voor games. Ter vergelijking: alle testtoestellen variëren van 0.165 (minimum) tot 636 (maximum) ms. » 73 % van alle toestellen zijn beter. Dit betekent dat de gemeten responstijd slechter is dan het gemiddelde (31 ms) van alle geteste toestellen. | ||
Screen Flickering / PWM (Pulse-Width Modulation)
| Screen flickering / PWM niet waargenomen |  | ||
Ter vergelijking: 52 % van alle geteste toestellen maakten geen gebruik van PWM om de schermhelderheid te verlagen. Als het wel werd gebruikt, werd een gemiddelde van 7757 (minimum: 5 - maximum: 343500) Hz waargenomen. | |||
Verblinding is altijd aanwezig en in wezen onvermijdelijk op het glanzende touchscreen. Het scherm is gelukkig helder genoeg om schittering tot een minimum te beperken als je buiten in de schaduw werkt. Onder fellere omstandigheden gaan de kleuren en kijkervaring echter snel achteruit. Bepaalde HP Elite x2 modellen hebben 1000-nit display opties die het 2x helderder zouden maken dan de Dell voor betere leesbaarheid buitenshuis.
Prestaties - Goede CPU prestaties, Meh GPU prestaties
Testomstandigheden
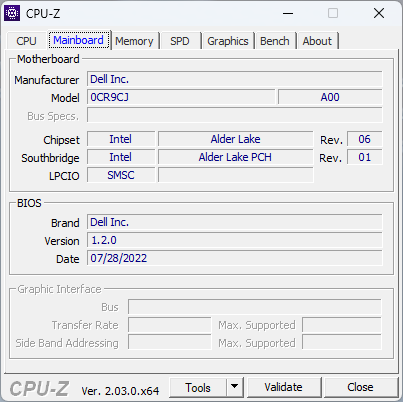
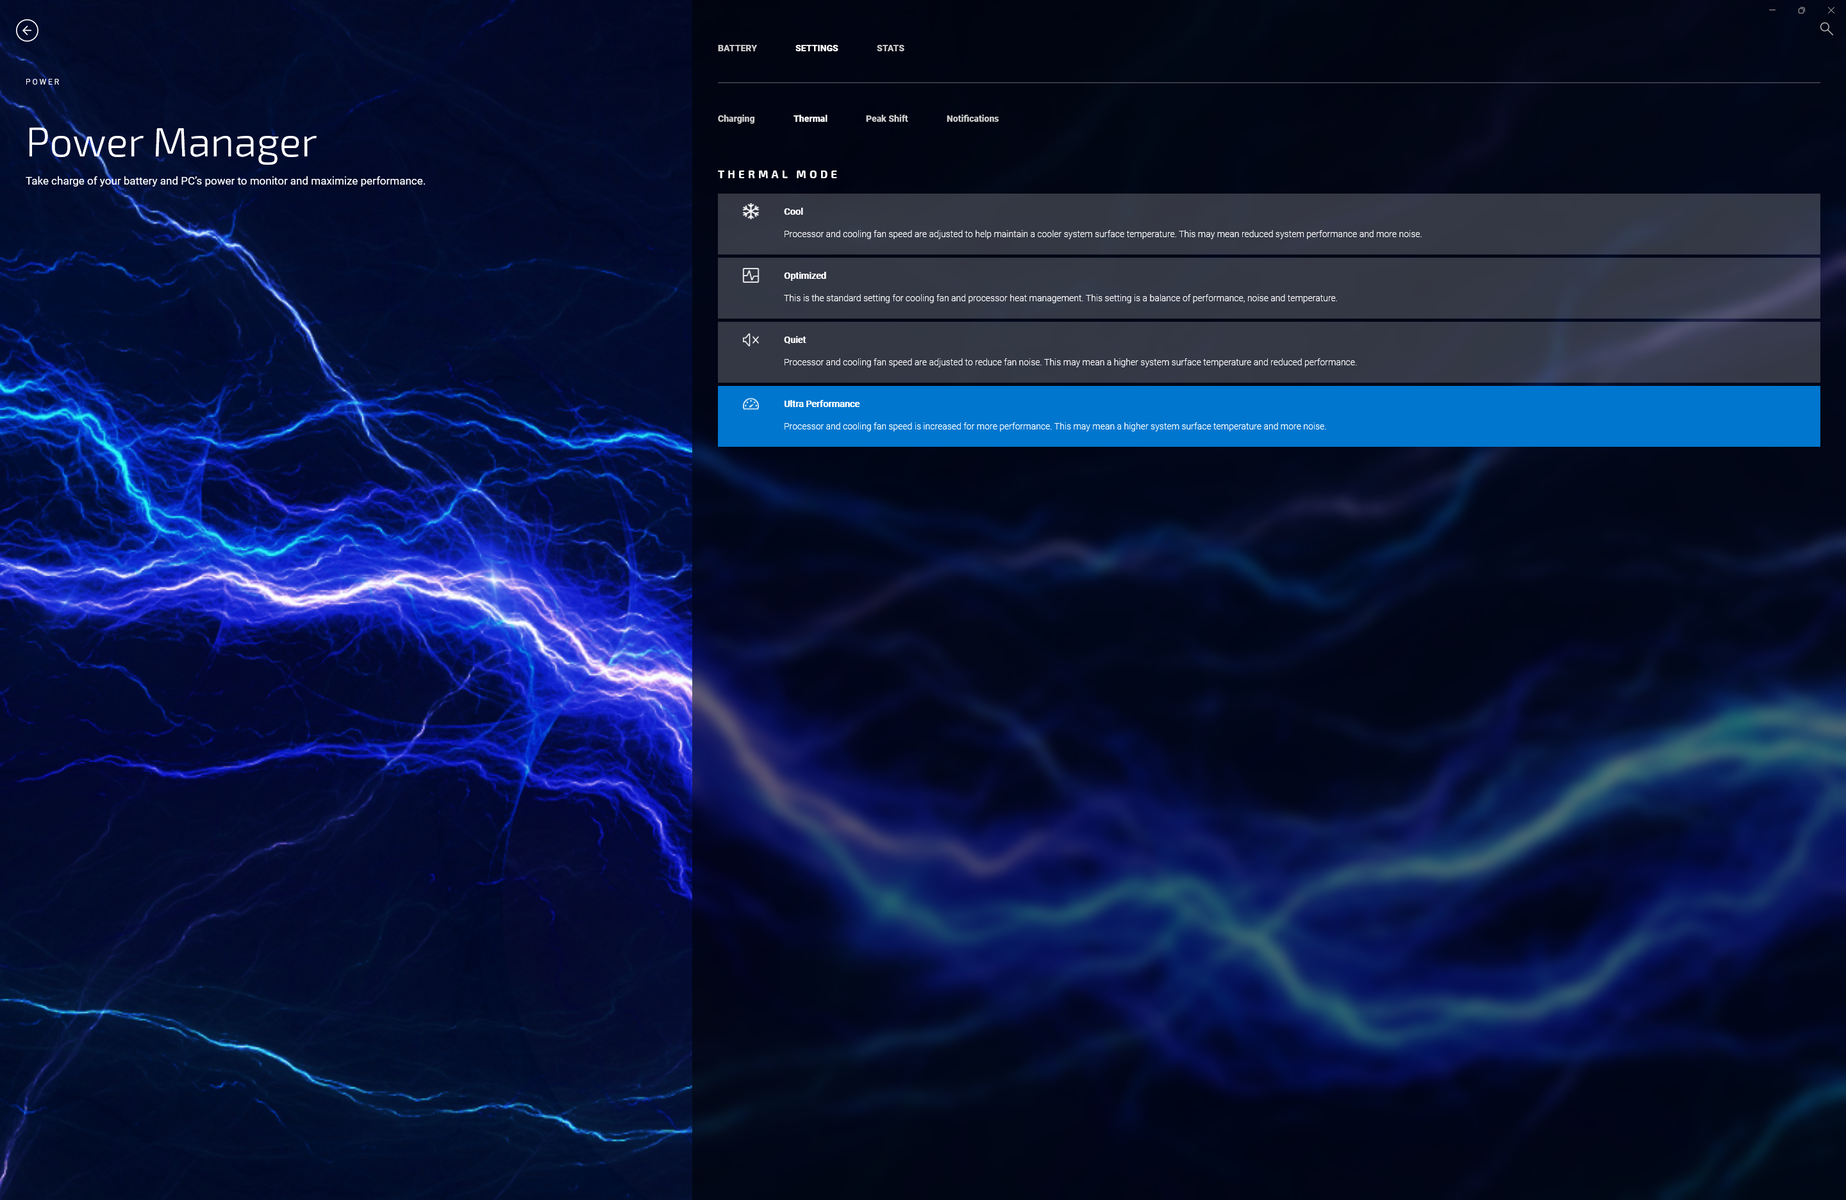
We hebben ons toestel via Dell Power Manager en Windows respectievelijk ingesteld op 'Ultra performance mode' en 'Best performance' voordat we onderstaande benchmarks uitvoerden. Bezitters moeten vertrouwd raken met de My Dell software, aangezien dit de controle hub is voor het aanpassen van laadgedrag, systeemprestaties, meldingen en meer, zoals blijkt uit de onderstaande screenshots.

Processor
De XPS 13 9315 2-in-1 deelt dezelfde Core i5-1230U CPU van de XPS 13 9315 clamshell. Je zou verwachten dat het clamshell model iets sneller presteert dan het 2-in-1 model, maar het tegendeel is waar. Onze resultaten hieronder laten zien dat de XPS 13 9315 2-in-1 consequent voorloopt op de XPS 13 9315 clamshell met aanzienlijke marges van ongeveer 70 procent in multi-threaded workloads. De resultaten zijn breed genoeg om zelfs de Core i7-1185G7 in de Surface Pro 8.
Een upgrade naar de Core i7-1250U SKU zal de prestaties naar verwachting slechts met ongeveer 5 procent verbeteren, gebaseerd op onze ervaring met de nieuwste HP Envy x360 13. Voor veel snellere prestaties, zult u willen overwegen de XPS 13 Plus 9320 en zijn P-serie CPU-opties in plaats daarvan.
De duurzaamheid van de prestaties is beperkt op de XPS 13 9315 2-in-1 omdat het een ventilatorloos ontwerp is. Bij het uitvoeren van CineBench R15 xT in een loop, bijvoorbeeld, zou de oorspronkelijke score van 1252 punten gestaag dalen tot 750 punten na verloop van tijd, wat neerkomt op een prestatieverlies van 40 procent. Niettemin zijn de prestaties nog steeds sneller dan dezelfde CPU in de XPS 13 9315 clamshell met ongeveer 50 procent, zelfs na rekening te houden met throttling op beide machines.
Cinebench R15 Multi Loop
Cinebench R23: Multi Core | Single Core
Cinebench R15: CPU Multi 64Bit | CPU Single 64Bit
Blender: v2.79 BMW27 CPU
7-Zip 18.03: 7z b 4 | 7z b 4 -mmt1
Geekbench 5.5: Multi-Core | Single-Core
HWBOT x265 Benchmark v2.2: 4k Preset
LibreOffice : 20 Documents To PDF
R Benchmark 2.5: Overall mean
| HWBOT x265 Benchmark v2.2 / 4k Preset | |
| Dell XPS 13 Plus 9320 i7-1280P OLED | |
| HP Spectre x360 13.5 14t-ef000 | |
| Dell XPS 13 9315 2-in-1 Core i5-1230U | |
| Microsoft Surface Pro 8, i7-1185G7 | |
* ... kleiner is beter
AIDA64: FP32 Ray-Trace | FPU Julia | CPU SHA3 | CPU Queen | FPU SinJulia | FPU Mandel | CPU AES | CPU ZLib | FP64 Ray-Trace | CPU PhotoWorxx
| Performance rating | |
| Dell XPS 13 Plus 9320 i7-1280P OLED | |
| HP Spectre x360 13.5 14t-ef000 | |
| Microsoft Surface Pro 8, i7-1185G7 | |
| Dell XPS 13 9315 2-in-1 Core i5-1230U | |
| Lenovo ThinkBook Plus Gen2 Core i5 | |
| Gemiddeld Intel Core i5-1230U | |
| AIDA64 / FP32 Ray-Trace | |
| Dell XPS 13 Plus 9320 i7-1280P OLED | |
| HP Spectre x360 13.5 14t-ef000 | |
| Microsoft Surface Pro 8, i7-1185G7 | |
| Dell XPS 13 9315 2-in-1 Core i5-1230U | |
| Lenovo ThinkBook Plus Gen2 Core i5 | |
| Gemiddeld Intel Core i5-1230U (2344 - 6360, n=3) | |
| AIDA64 / FPU Julia | |
| Dell XPS 13 Plus 9320 i7-1280P OLED | |
| HP Spectre x360 13.5 14t-ef000 | |
| Dell XPS 13 9315 2-in-1 Core i5-1230U | |
| Microsoft Surface Pro 8, i7-1185G7 | |
| Lenovo ThinkBook Plus Gen2 Core i5 | |
| Gemiddeld Intel Core i5-1230U (11867 - 31714, n=3) | |
| AIDA64 / CPU SHA3 | |
| Dell XPS 13 Plus 9320 i7-1280P OLED | |
| HP Spectre x360 13.5 14t-ef000 | |
| Microsoft Surface Pro 8, i7-1185G7 | |
| Dell XPS 13 9315 2-in-1 Core i5-1230U | |
| Lenovo ThinkBook Plus Gen2 Core i5 | |
| Gemiddeld Intel Core i5-1230U (772 - 1711, n=3) | |
| AIDA64 / CPU Queen | |
| Dell XPS 13 Plus 9320 i7-1280P OLED | |
| HP Spectre x360 13.5 14t-ef000 | |
| Dell XPS 13 9315 2-in-1 Core i5-1230U | |
| Microsoft Surface Pro 8, i7-1185G7 | |
| Gemiddeld Intel Core i5-1230U (30824 - 52533, n=3) | |
| Lenovo ThinkBook Plus Gen2 Core i5 | |
| AIDA64 / FPU SinJulia | |
| Dell XPS 13 Plus 9320 i7-1280P OLED | |
| Microsoft Surface Pro 8, i7-1185G7 | |
| HP Spectre x360 13.5 14t-ef000 | |
| Dell XPS 13 9315 2-in-1 Core i5-1230U | |
| Lenovo ThinkBook Plus Gen2 Core i5 | |
| Gemiddeld Intel Core i5-1230U (2269 - 3947, n=3) | |
| AIDA64 / FPU Mandel | |
| Dell XPS 13 Plus 9320 i7-1280P OLED | |
| HP Spectre x360 13.5 14t-ef000 | |
| Microsoft Surface Pro 8, i7-1185G7 | |
| Dell XPS 13 9315 2-in-1 Core i5-1230U | |
| Lenovo ThinkBook Plus Gen2 Core i5 | |
| Gemiddeld Intel Core i5-1230U (6379 - 15896, n=3) | |
| AIDA64 / CPU AES | |
| HP Spectre x360 13.5 14t-ef000 | |
| Lenovo ThinkBook Plus Gen2 Core i5 | |
| Dell XPS 13 Plus 9320 i7-1280P OLED | |
| Microsoft Surface Pro 8, i7-1185G7 | |
| Dell XPS 13 9315 2-in-1 Core i5-1230U | |
| Gemiddeld Intel Core i5-1230U (18011 - 31941, n=3) | |
| AIDA64 / CPU ZLib | |
| Dell XPS 13 Plus 9320 i7-1280P OLED | |
| HP Spectre x360 13.5 14t-ef000 | |
| Dell XPS 13 9315 2-in-1 Core i5-1230U | |
| Gemiddeld Intel Core i5-1230U (229 - 495, n=3) | |
| Lenovo ThinkBook Plus Gen2 Core i5 | |
| Microsoft Surface Pro 8, i7-1185G7 | |
| AIDA64 / FP64 Ray-Trace | |
| Dell XPS 13 Plus 9320 i7-1280P OLED | |
| HP Spectre x360 13.5 14t-ef000 | |
| Microsoft Surface Pro 8, i7-1185G7 | |
| Dell XPS 13 9315 2-in-1 Core i5-1230U | |
| Lenovo ThinkBook Plus Gen2 Core i5 | |
| Gemiddeld Intel Core i5-1230U (1328 - 3305, n=3) | |
| AIDA64 / CPU PhotoWorxx | |
| Dell XPS 13 Plus 9320 i7-1280P OLED | |
| HP Spectre x360 13.5 14t-ef000 | |
| Lenovo ThinkBook Plus Gen2 Core i5 | |
| Microsoft Surface Pro 8, i7-1185G7 | |
| Dell XPS 13 9315 2-in-1 Core i5-1230U | |
| Gemiddeld Intel Core i5-1230U (17516 - 37042, n=3) | |
Systeemprestaties
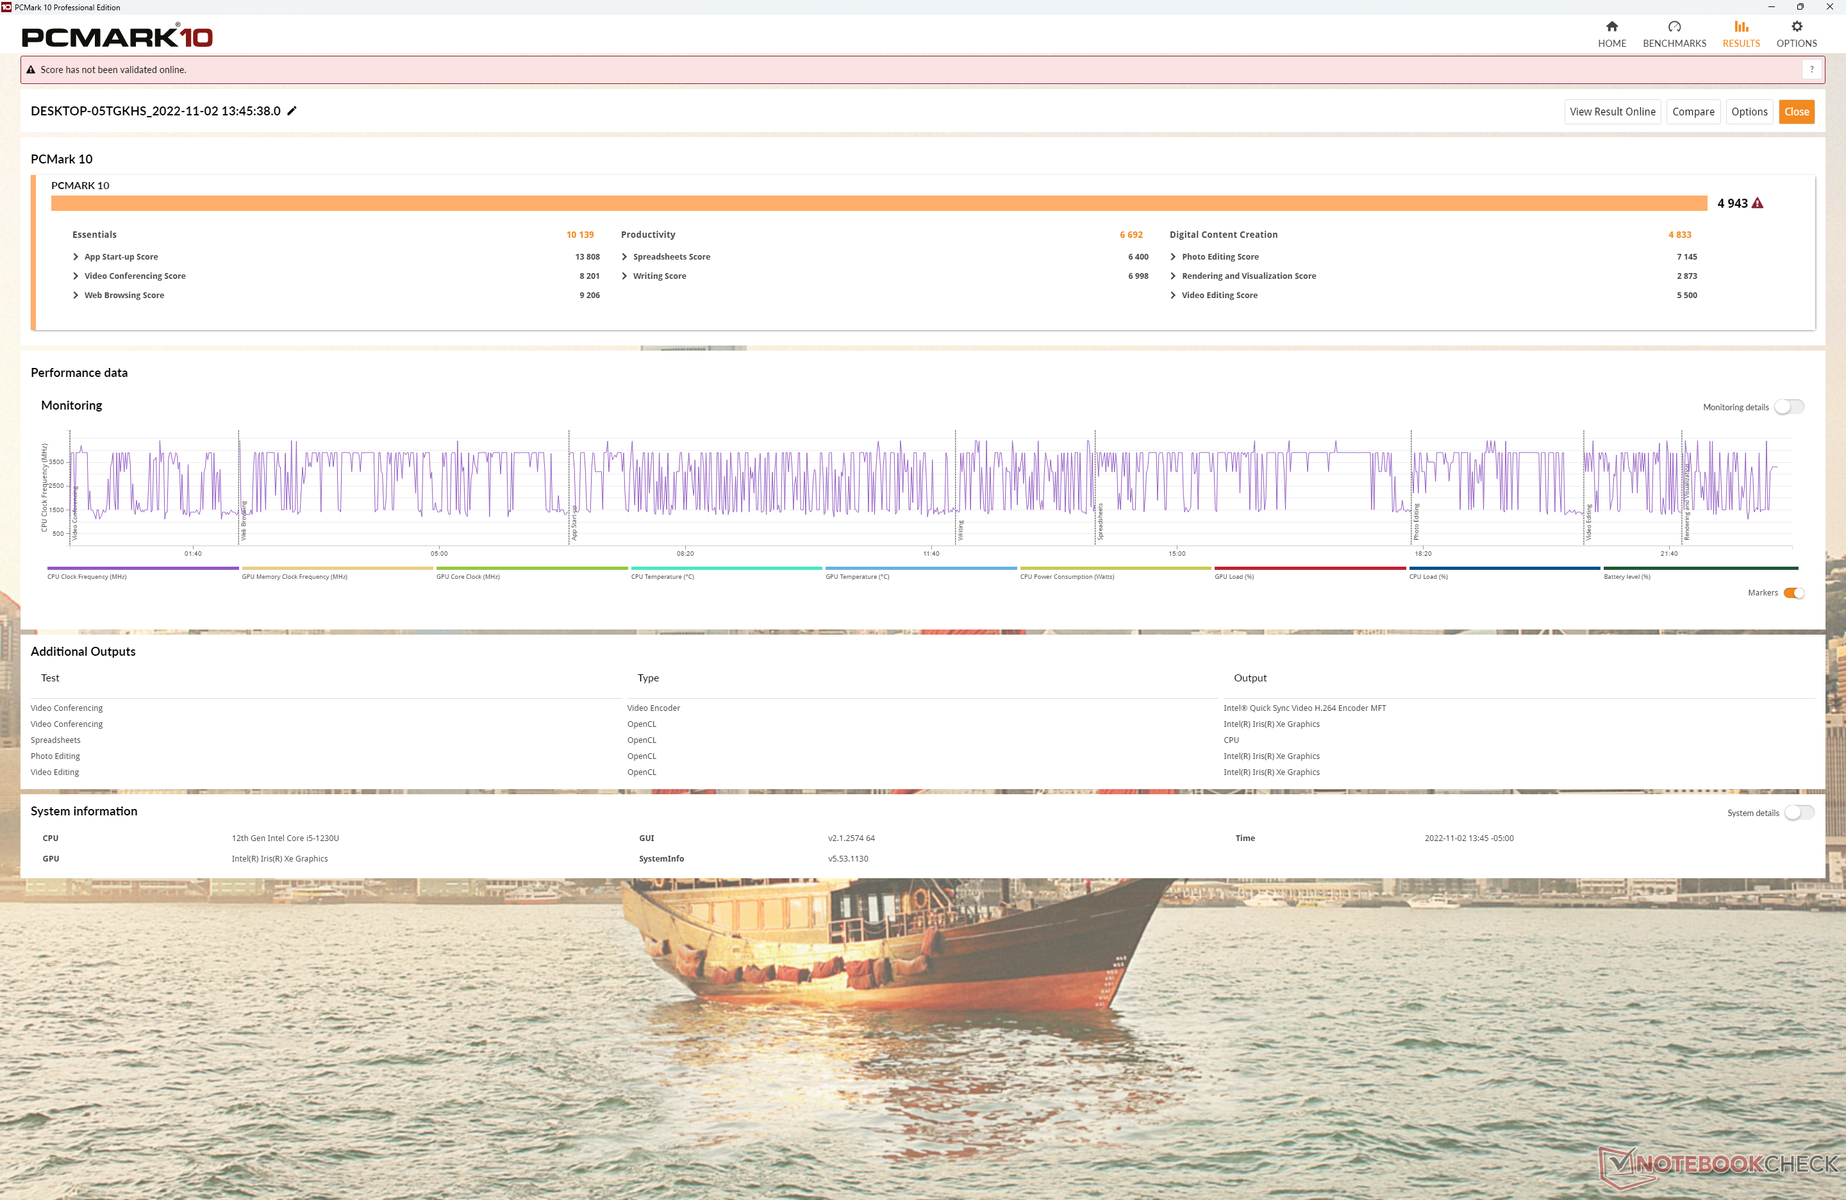
De resultaten van PCMark 10 zijn vergelijkbaar met die van de Surface Pro 8, behalve in de subtest Digital Content Creation, waar de grafische prestaties het belangrijkst zijn. Dit komt overeen met onze GPU-testresultaten hieronder, waar de XPS 13 9315 2-in-1 langzamer dan gemiddelde grafische prestaties voor de categorie zou vertonen.
CrossMark: Overall | Productivity | Creativity | Responsiveness
| PCMark 10 / Score | |
| Dell XPS 13 Plus 9320 i7-1280P OLED | |
| HP Spectre x360 13.5 14t-ef000 | |
| Microsoft Surface Pro 8, i7-1185G7 | |
| Dell XPS 13 9315 2-in-1 Core i5-1230U | |
| Gemiddeld Intel Core i5-1230U, Intel Iris Xe Graphics G7 80EUs (4001 - 4943, n=3) | |
| Lenovo ThinkBook Plus Gen2 Core i5 | |
| PCMark 10 / Essentials | |
| HP Spectre x360 13.5 14t-ef000 | |
| Dell XPS 13 Plus 9320 i7-1280P OLED | |
| Lenovo ThinkBook Plus Gen2 Core i5 | |
| Dell XPS 13 9315 2-in-1 Core i5-1230U | |
| Microsoft Surface Pro 8, i7-1185G7 | |
| Gemiddeld Intel Core i5-1230U, Intel Iris Xe Graphics G7 80EUs (8348 - 10139, n=3) | |
| PCMark 10 / Productivity | |
| HP Spectre x360 13.5 14t-ef000 | |
| Dell XPS 13 Plus 9320 i7-1280P OLED | |
| Dell XPS 13 9315 2-in-1 Core i5-1230U | |
| Microsoft Surface Pro 8, i7-1185G7 | |
| Gemiddeld Intel Core i5-1230U, Intel Iris Xe Graphics G7 80EUs (5735 - 6692, n=3) | |
| Lenovo ThinkBook Plus Gen2 Core i5 | |
| PCMark 10 / Digital Content Creation | |
| Dell XPS 13 Plus 9320 i7-1280P OLED | |
| Microsoft Surface Pro 8, i7-1185G7 | |
| HP Spectre x360 13.5 14t-ef000 | |
| Dell XPS 13 9315 2-in-1 Core i5-1230U | |
| Gemiddeld Intel Core i5-1230U, Intel Iris Xe Graphics G7 80EUs (3632 - 4833, n=3) | |
| Lenovo ThinkBook Plus Gen2 Core i5 | |
| CrossMark / Overall | |
| Dell XPS 13 Plus 9320 i7-1280P OLED | |
| HP Spectre x360 13.5 14t-ef000 | |
| Apple MacBook Air M2 Entry | |
| Microsoft Surface Pro 8, i7-1185G7 | |
| Dell XPS 13 9315 2-in-1 Core i5-1230U | |
| Gemiddeld Intel Core i5-1230U, Intel Iris Xe Graphics G7 80EUs (1117 - 1383, n=3) | |
| CrossMark / Productivity | |
| Dell XPS 13 Plus 9320 i7-1280P OLED | |
| HP Spectre x360 13.5 14t-ef000 | |
| Microsoft Surface Pro 8, i7-1185G7 | |
| Apple MacBook Air M2 Entry | |
| Dell XPS 13 9315 2-in-1 Core i5-1230U | |
| Gemiddeld Intel Core i5-1230U, Intel Iris Xe Graphics G7 80EUs (1187 - 1356, n=3) | |
| CrossMark / Creativity | |
| Dell XPS 13 Plus 9320 i7-1280P OLED | |
| Apple MacBook Air M2 Entry | |
| HP Spectre x360 13.5 14t-ef000 | |
| Microsoft Surface Pro 8, i7-1185G7 | |
| Dell XPS 13 9315 2-in-1 Core i5-1230U | |
| Gemiddeld Intel Core i5-1230U, Intel Iris Xe Graphics G7 80EUs (1095 - 1469, n=3) | |
| CrossMark / Responsiveness | |
| Dell XPS 13 Plus 9320 i7-1280P OLED | |
| HP Spectre x360 13.5 14t-ef000 | |
| Dell XPS 13 9315 2-in-1 Core i5-1230U | |
| Gemiddeld Intel Core i5-1230U, Intel Iris Xe Graphics G7 80EUs (990 - 1224, n=3) | |
| Microsoft Surface Pro 8, i7-1185G7 | |
| Apple MacBook Air M2 Entry | |
| PCMark 10 Score | 4943 punten | |
Help | ||
| AIDA64 / Memory Copy | |
| Dell XPS 13 Plus 9320 i7-1280P OLED | |
| HP Spectre x360 13.5 14t-ef000 | |
| Dell XPS 13 9315 2-in-1 Core i5-1230U | |
| Microsoft Surface Pro 8, i7-1185G7 | |
| Lenovo ThinkBook Plus Gen2 Core i5 | |
| Gemiddeld Intel Core i5-1230U (32539 - 60944, n=3) | |
| AIDA64 / Memory Read | |
| Dell XPS 13 Plus 9320 i7-1280P OLED | |
| Lenovo ThinkBook Plus Gen2 Core i5 | |
| HP Spectre x360 13.5 14t-ef000 | |
| Microsoft Surface Pro 8, i7-1185G7 | |
| Dell XPS 13 9315 2-in-1 Core i5-1230U | |
| Gemiddeld Intel Core i5-1230U (31342 - 60435, n=3) | |
| AIDA64 / Memory Write | |
| Dell XPS 13 9315 2-in-1 Core i5-1230U | |
| Lenovo ThinkBook Plus Gen2 Core i5 | |
| HP Spectre x360 13.5 14t-ef000 | |
| Dell XPS 13 Plus 9320 i7-1280P OLED | |
| Microsoft Surface Pro 8, i7-1185G7 | |
| Gemiddeld Intel Core i5-1230U (33224 - 65665, n=3) | |
| AIDA64 / Memory Latency | |
| Dell XPS 13 9315 2-in-1 Core i5-1230U | |
| Dell XPS 13 Plus 9320 i7-1280P OLED | |
| Microsoft Surface Pro 8, i7-1185G7 | |
| HP Spectre x360 13.5 14t-ef000 | |
| Lenovo ThinkBook Plus Gen2 Core i5 | |
| Gemiddeld Intel Core i5-1230U (104.3 - 105.3, n=3) | |
* ... kleiner is beter
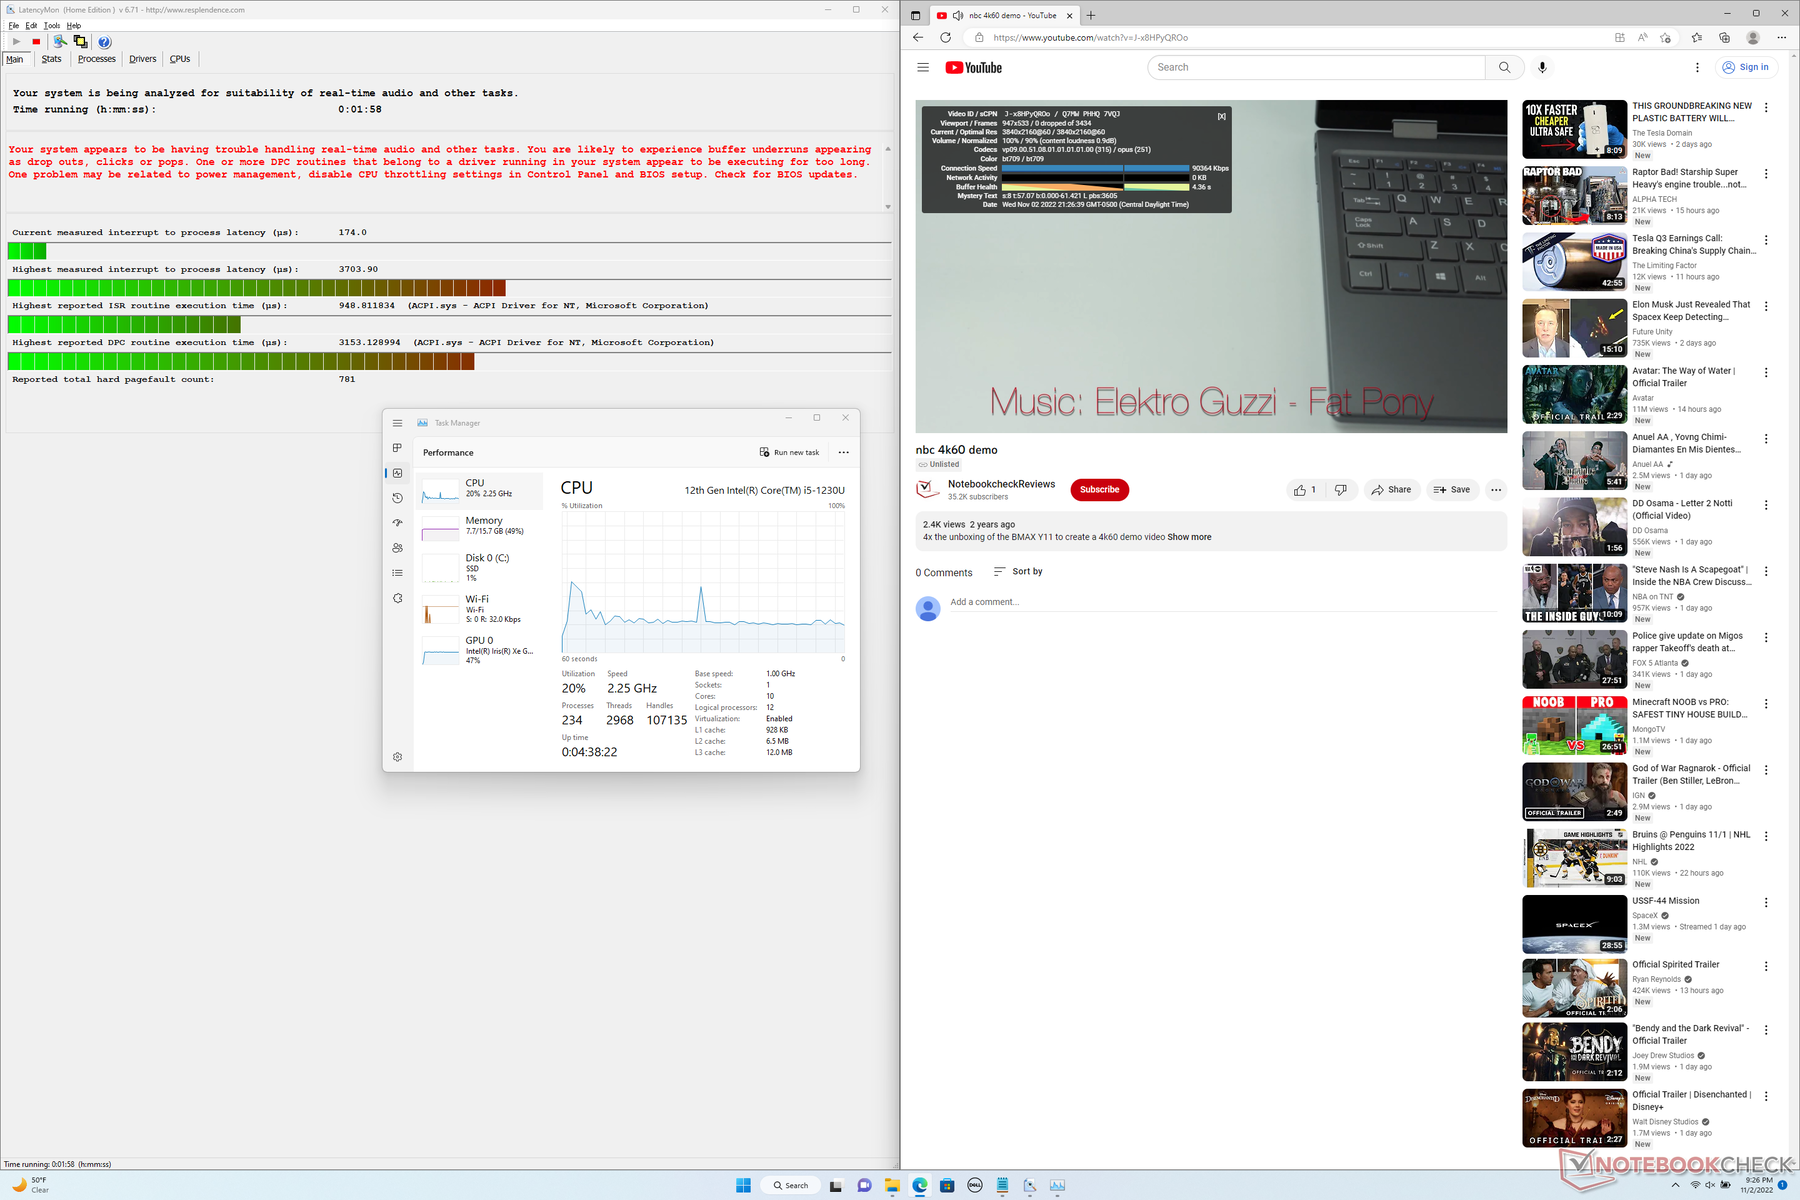
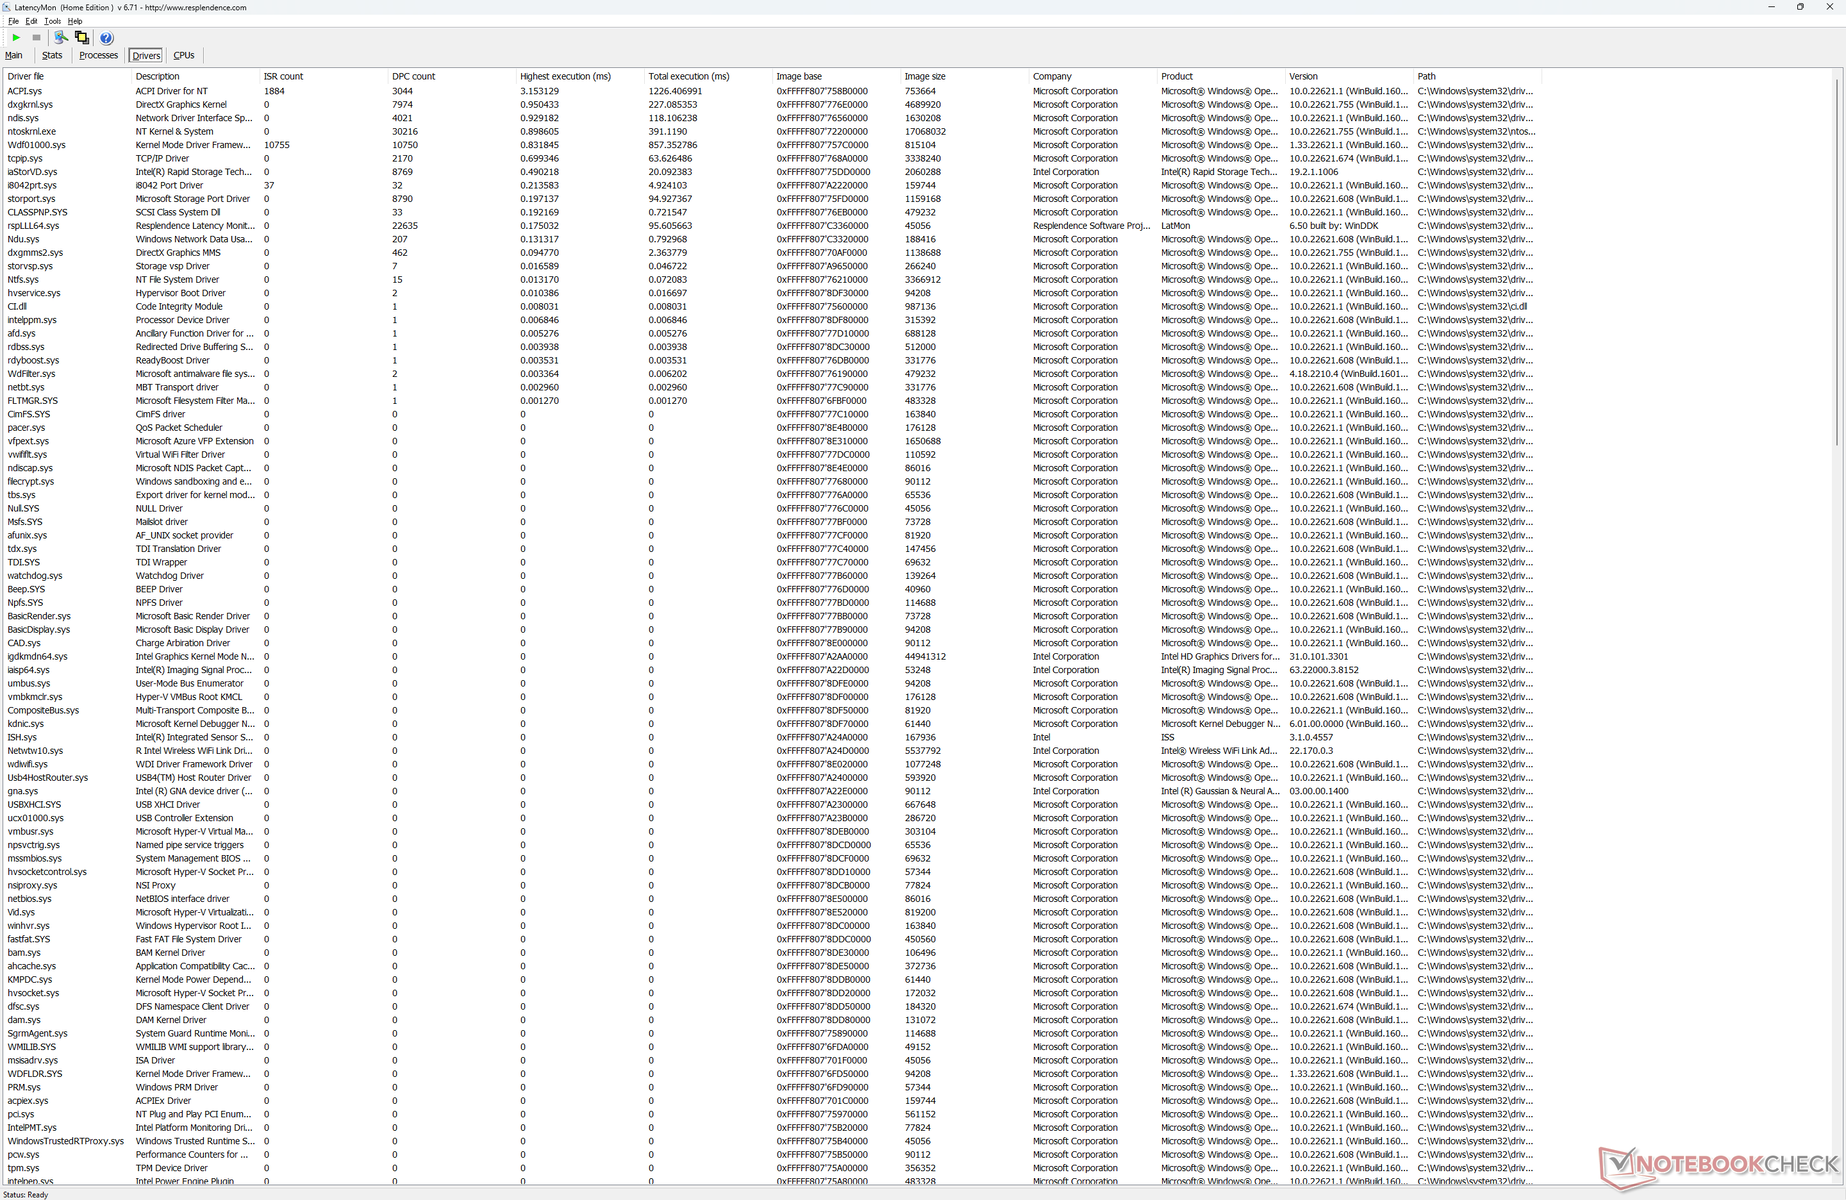
DPC latentie
LatencyMon onthult DPC-problemen bij het openen van meerdere browsertabbladen van onze homepage. het afspelen van 4K-video's met 60 FPS is verder perfect zonder dropped frames.
| DPC Latencies / LatencyMon - interrupt to process latency (max), Web, Youtube, Prime95 | |
| Dell XPS 13 9315 2-in-1 Core i5-1230U | |
| Lenovo ThinkBook Plus Gen2 Core i5 | |
| HP Spectre x360 13.5 14t-ef000 | |
| Microsoft Surface Pro 8, i7-1185G7 | |
| Dell XPS 13 Plus 9320 i7-1280P OLED | |
* ... kleiner is beter
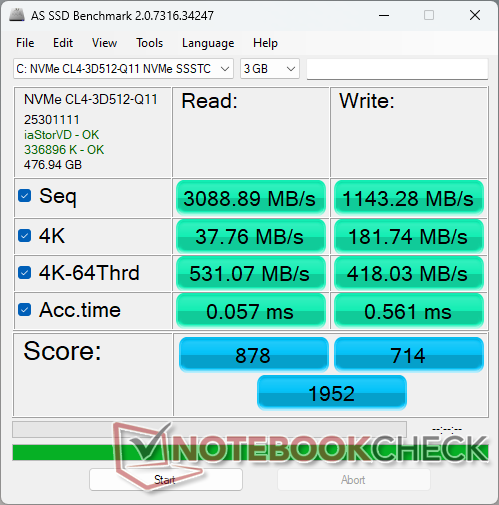
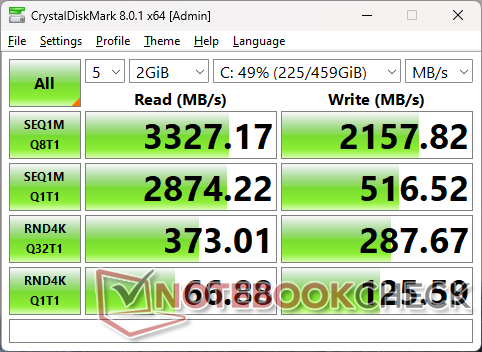
Opslagapparaten - PCIe4 bij PCIe3-snelheden
Dell biedt 256 GB, 512 GB en 1 TB PCIe4 x4 opslagmogelijkheden. Helaas liggen de prestaties dichter bij de meeste PCIe3 x4-schijven dan bij PCIe4 x4. Benchmarks zoals CrystalDiskMark en DiskSpd tonen maximale lees- en schrijfsnelheden van respectievelijk slechts 3300 MB/s en 2200 MB/s, vergeleken met 7000 MB/s of sneller op de Samsung 980 Pro PCIe4 x4 serie. Toch is de 3000 MB/s range meer dan voldoende gezien de vormfactor en Core U-serie CPU.

* ... kleiner is beter
Disk Throttling: DiskSpd Read Loop, Queue Depth 8
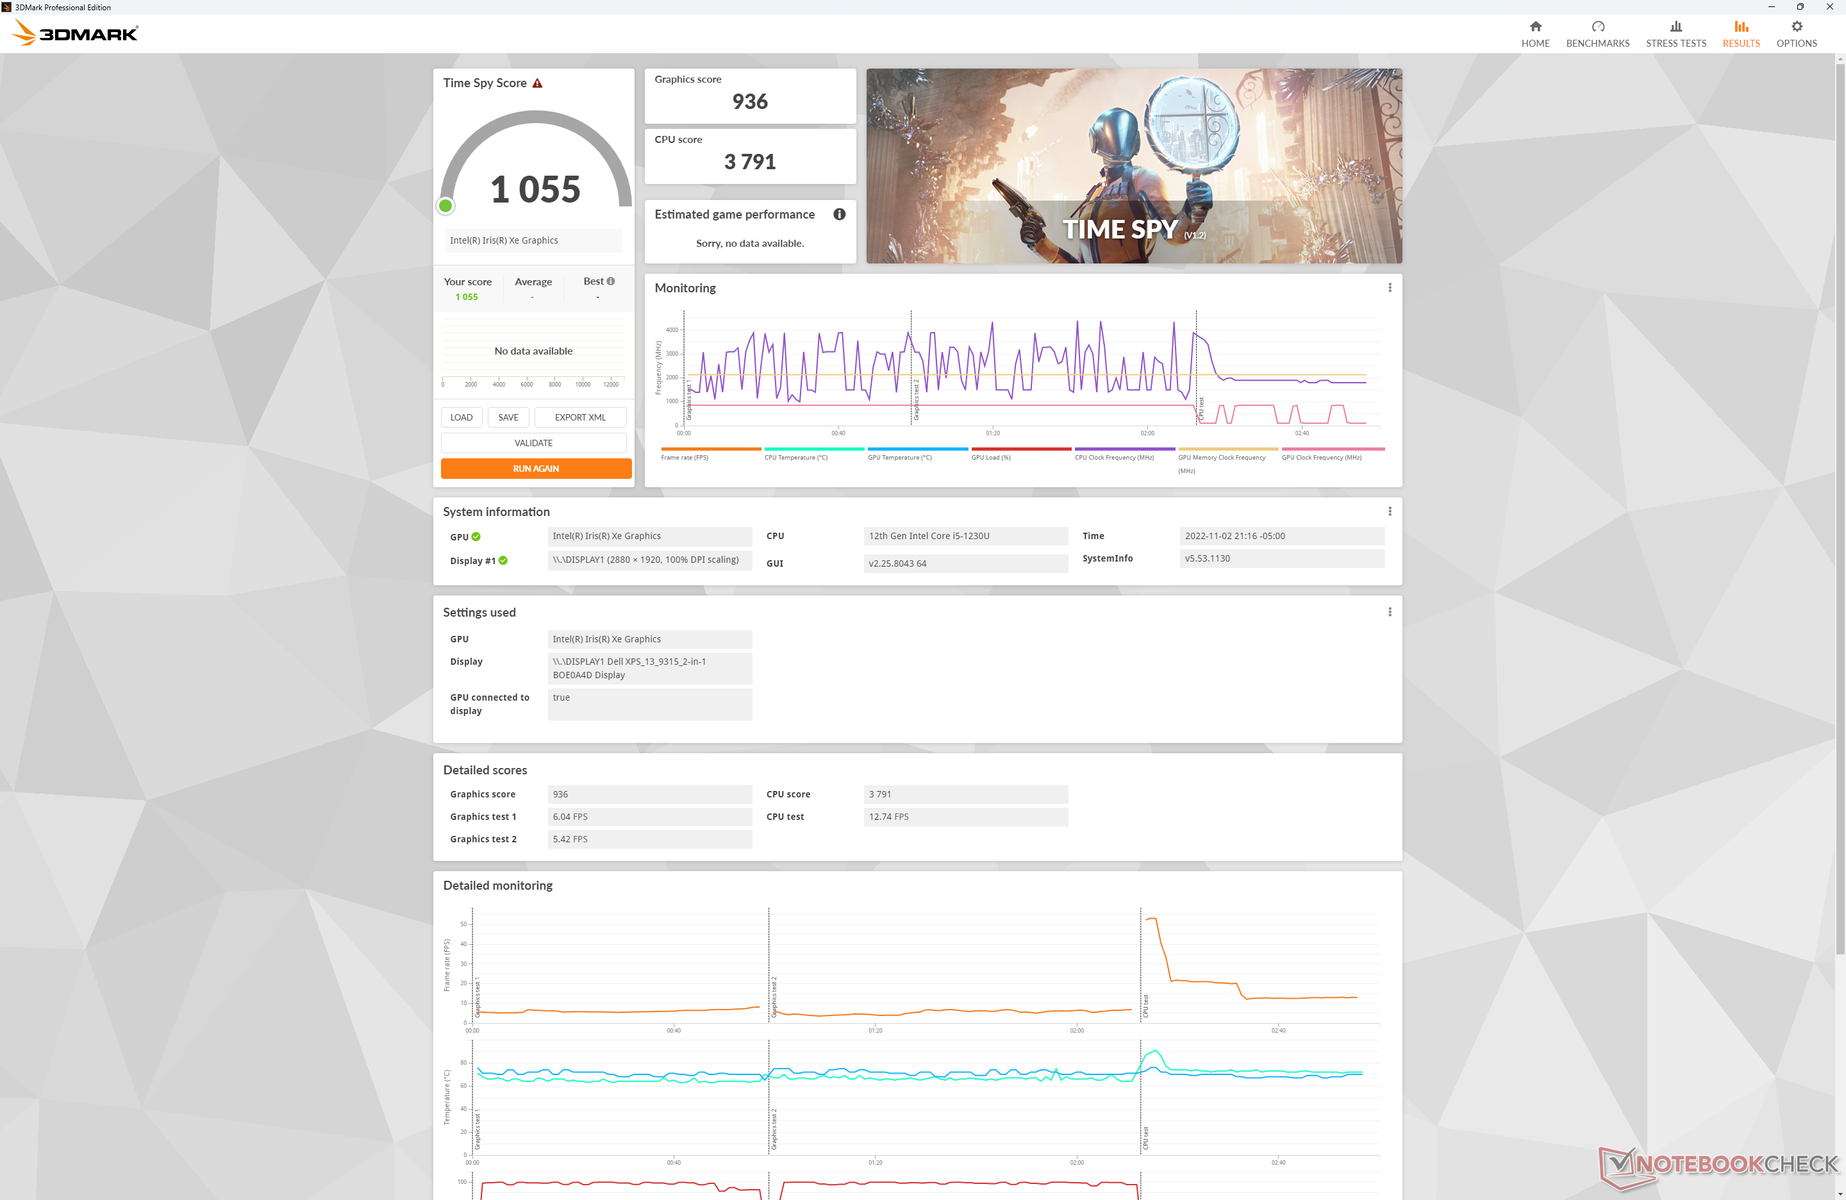
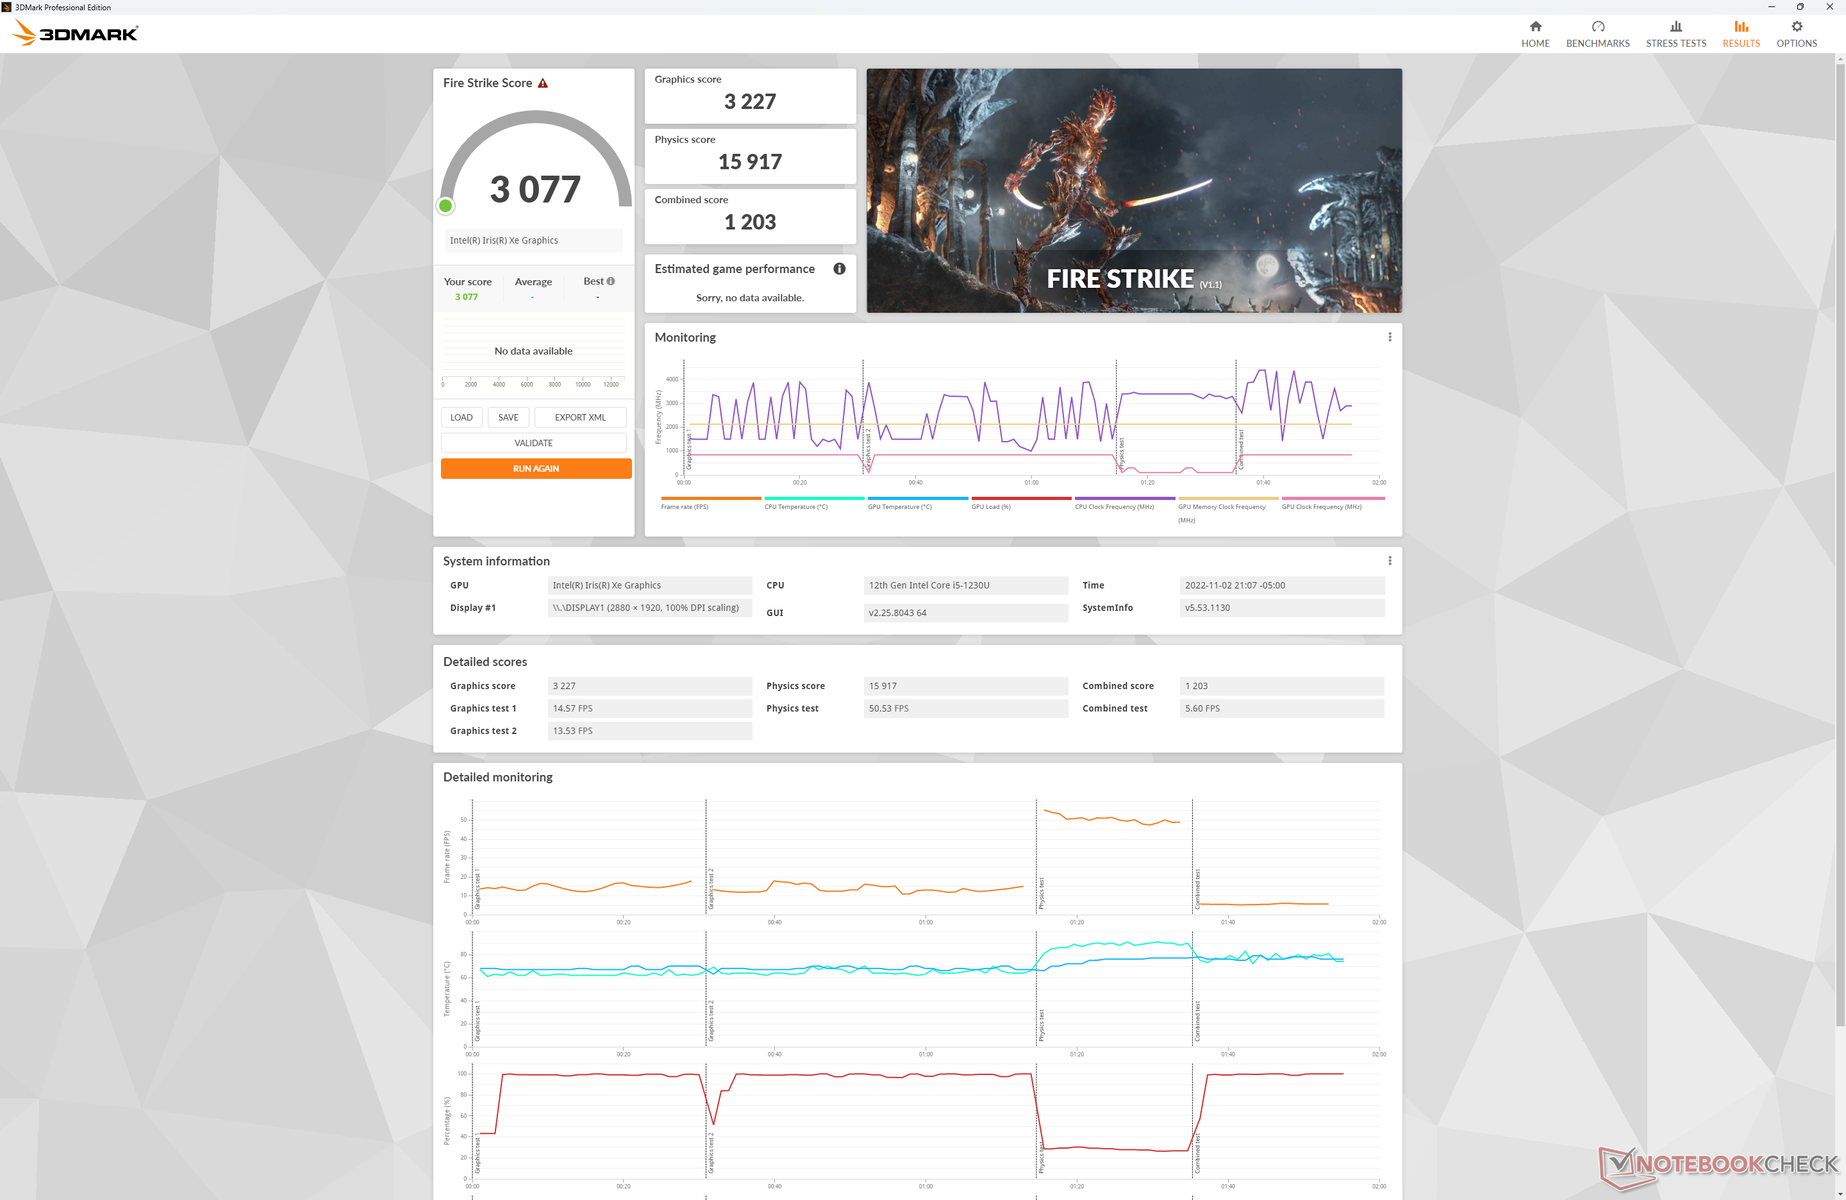
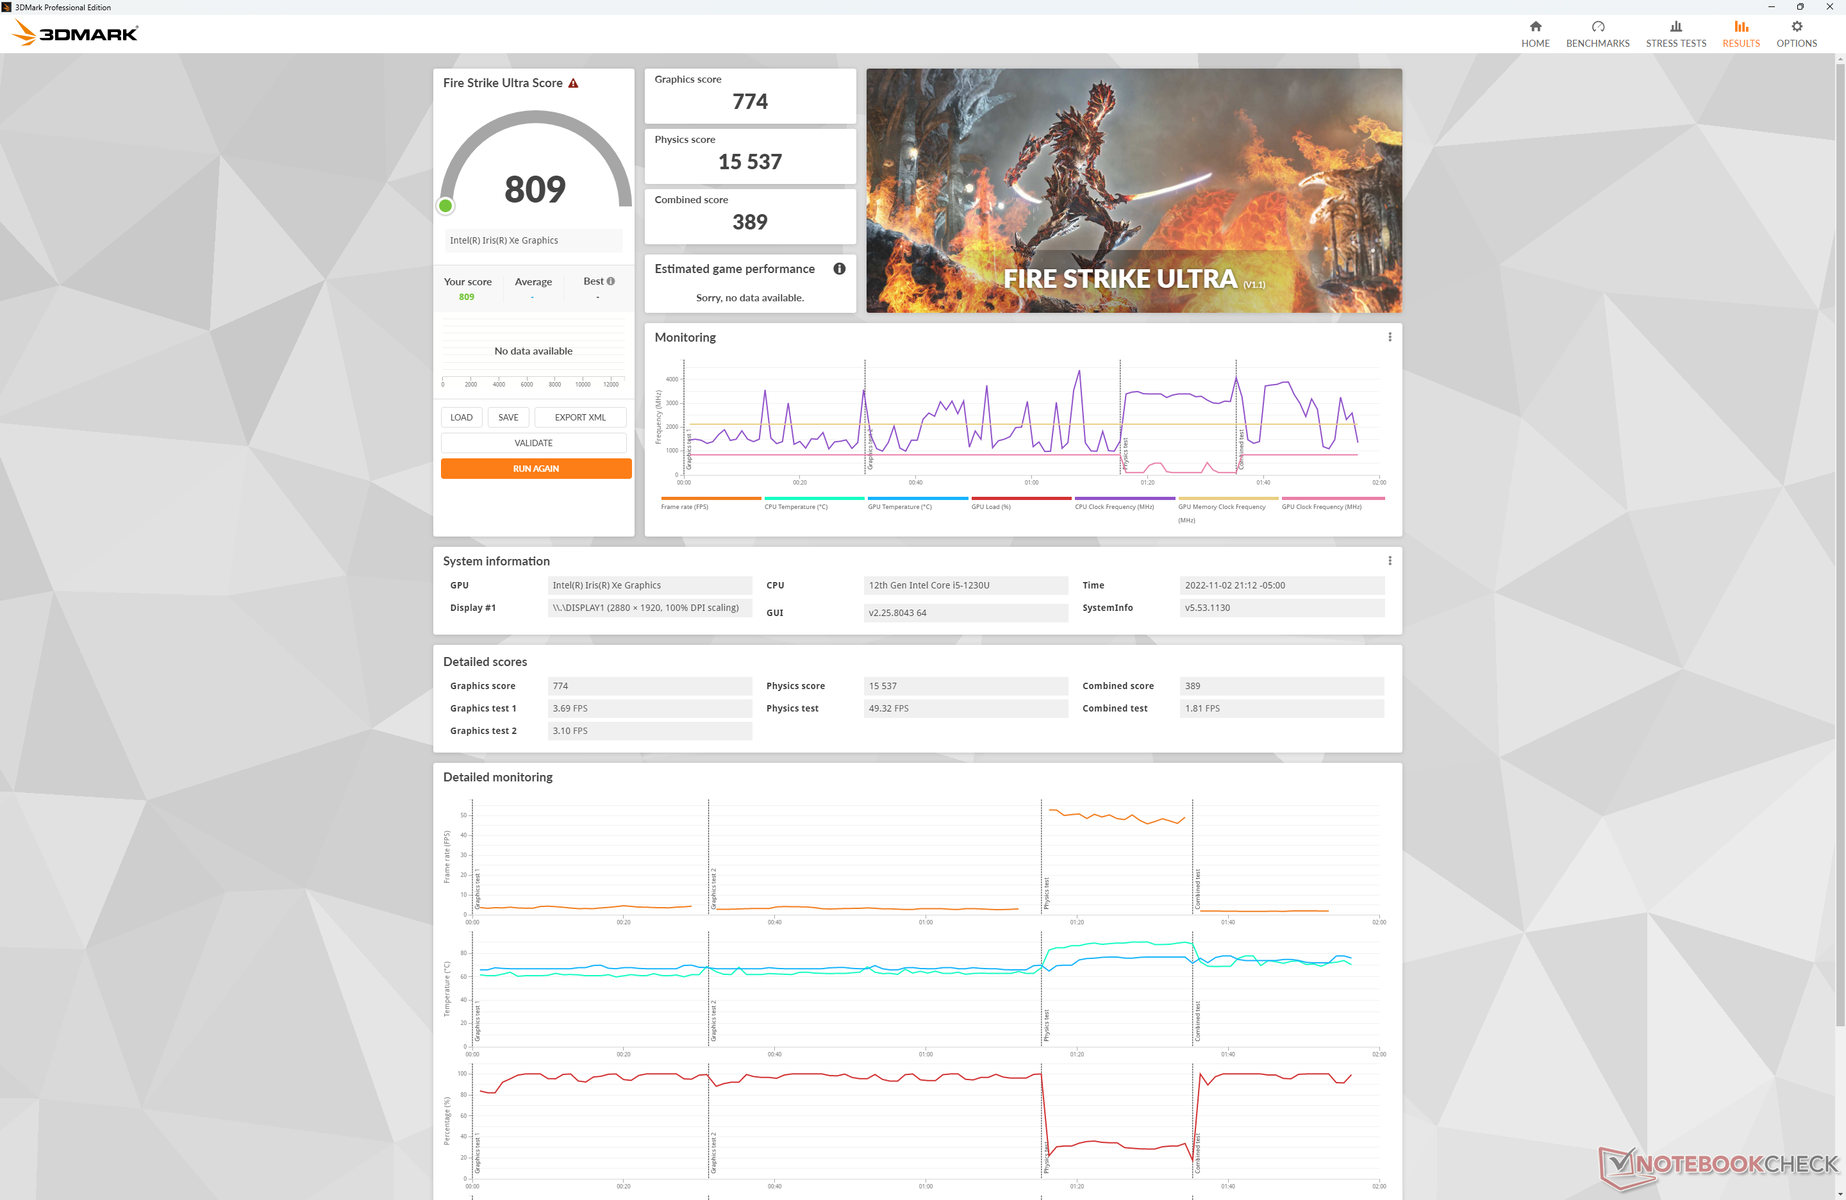
GPU-prestaties
Terwijl de CPU prestaties beter zijn dan verwacht, zijn de grafische prestaties minder goed. 3DMark resultaten zijn ongeveer 10 tot 20 procent langzamer dan de gemiddelde laptop in onze database met dezelfde geïntegreerde Iris Xe 80 EUsvergelijkbaar te zijn met deThinkBook Plus Gen 2gaming is nog steeds mogelijk, mits op de laagste instellingen alleen.
Upgraden naar de Core i7-1250U SKU met de Iris Xe 96 EUs zal naar verwachting de grafische prestaties met ongeveer 36 procent verbeteren op basis van onze ervaring met de HP Envy x360 13. Er zijn configuraties met slechts 8 GB RAM in plaats van 16 GB die we niet aanraden, anders zouden de grafische prestaties er nog meer onder lijden.
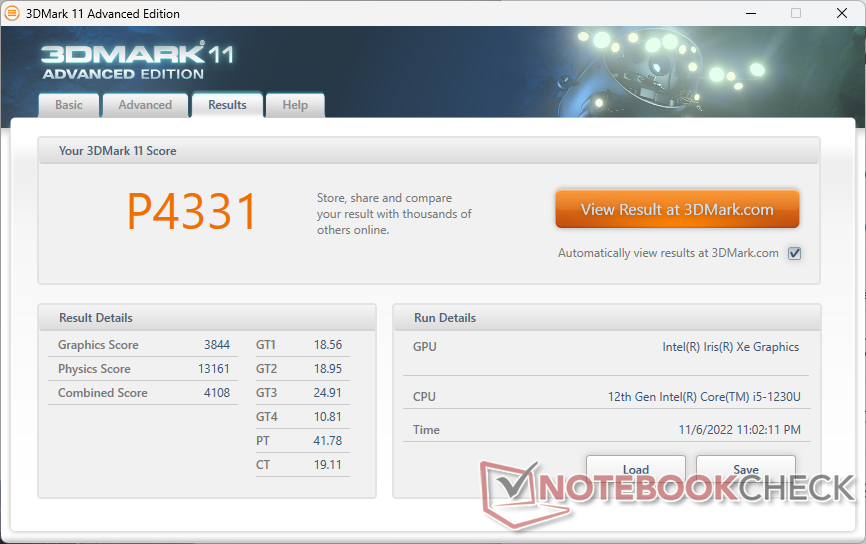
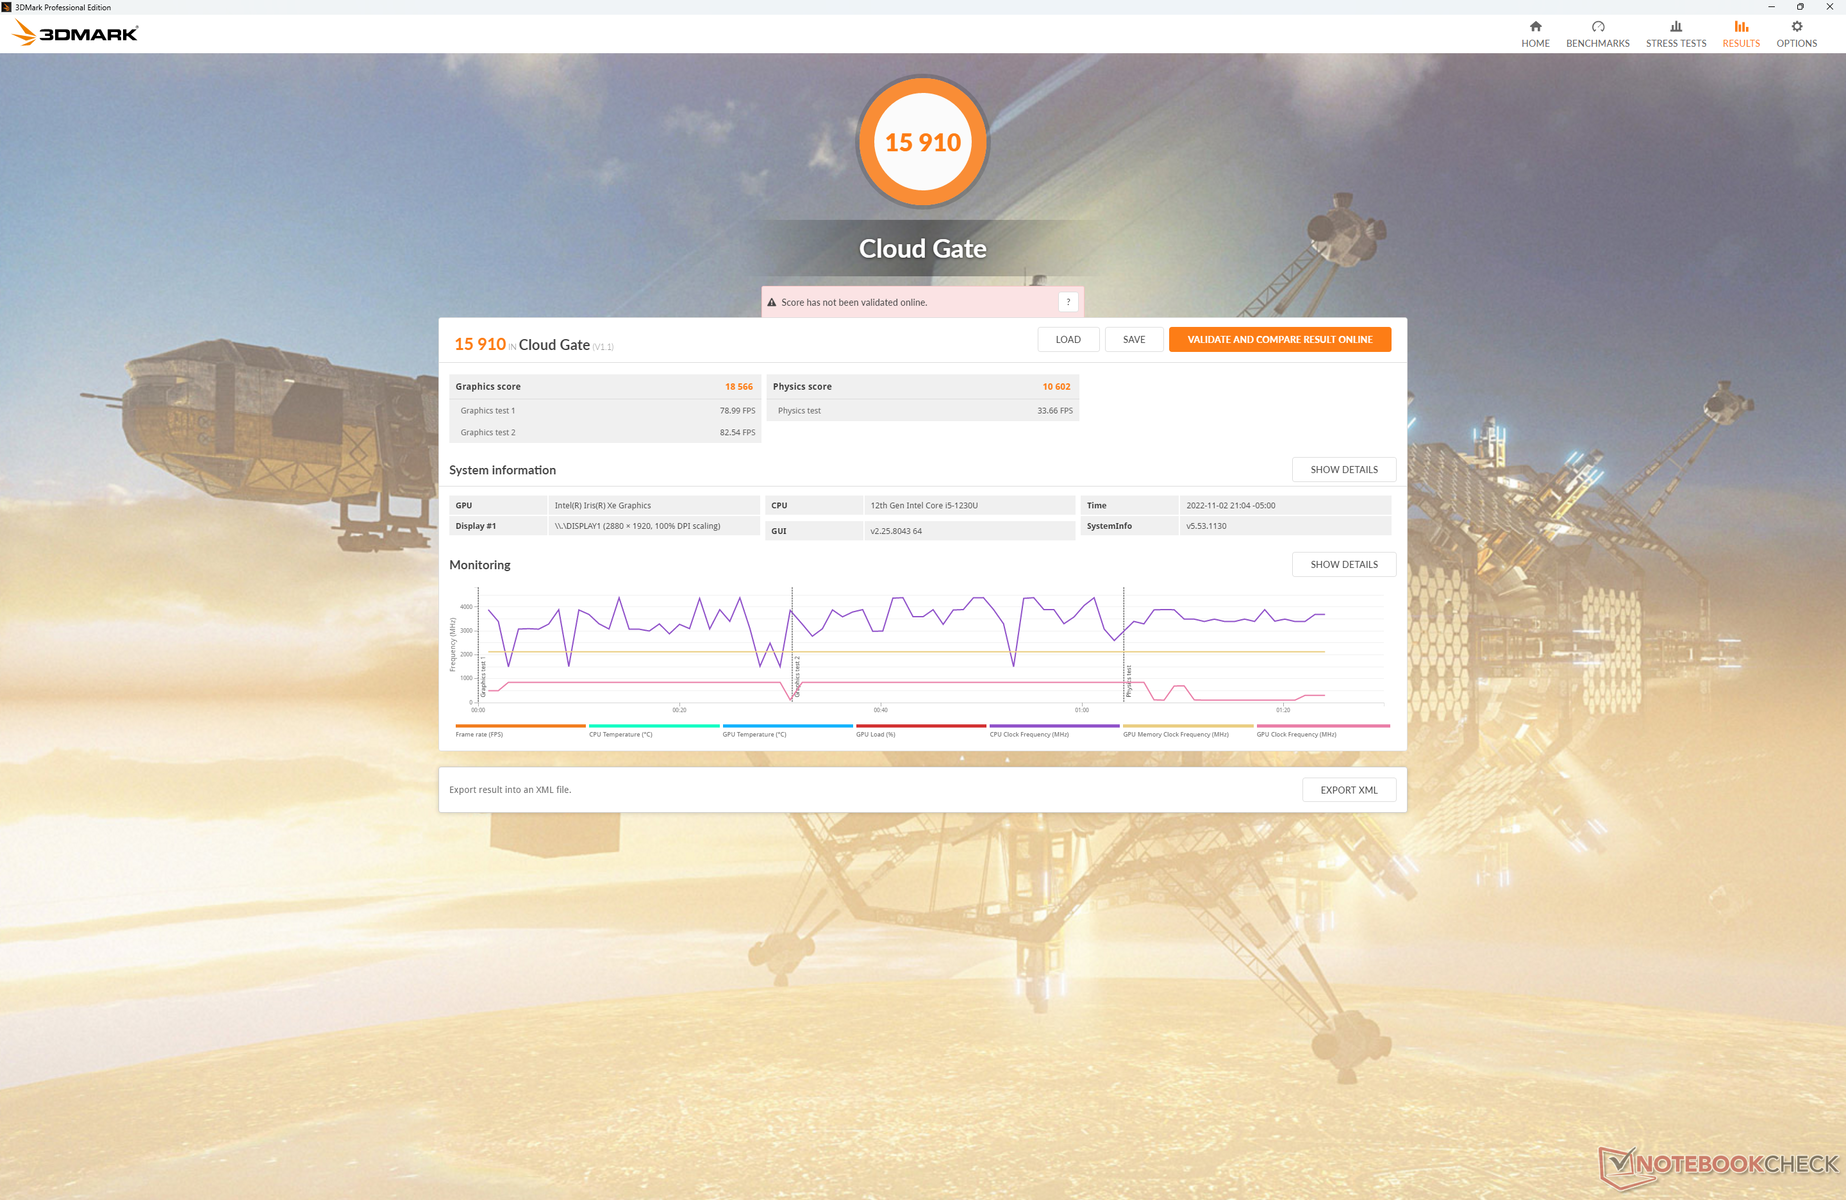
| 3DMark 11 Performance | 4331 punten | |
| 3DMark Cloud Gate Standard Score | 15910 punten | |
| 3DMark Fire Strike Score | 3077 punten | |
| 3DMark Time Spy Score | 1055 punten | |
Help | ||
* ... kleiner is beter
| Final Fantasy XV Benchmark - 1280x720 Lite Quality | |
| Microsoft Surface Pro 8, i7-1185G7 | |
| Dell XPS 13 Plus 9320 i7-1280P OLED | |
| HP Spectre x360 13.5 14t-ef000 | |
| Gemiddeld Intel Iris Xe Graphics G7 80EUs (8.32 - 45.6, n=107) | |
| Dell XPS 13 9315 2-in-1 Core i5-1230U | |
De framerates zijn stabiel bij stationair draaien op Witcher 3 geen grote onderbrekende activiteiten op de achtergrond. We hebben een enkel geval meegemaakt waarbij de prestaties terugvielen tot 36 FPS en daarna weer normaal werden, maar dit was gelukkig slechts een uitzondering en een patroon.
Witcher 3 FPS Chart
| lage | gem. | hoge | ultra | |
|---|---|---|---|---|
| GTA V (2015) | 60.9 | 38.4 | 11.7 | 6.06 |
| The Witcher 3 (2015) | 57.7 | 38.9 | 19.9 | 8.5 |
| Dota 2 Reborn (2015) | 101.2 | 75.8 | 37.6 | 34.2 |
| Final Fantasy XV Benchmark (2018) | 27 | |||
| X-Plane 11.11 (2018) | 31.2 | 25.1 | 22 |
Emissies - Geen ventilatoren!
Systeemgeluid
Terwijl de Surface Pro 8 een interne ventilator gebruikt om te koelen, wordt de XPS 13 9315 2-in-1 passief gekoeld voor alle configuraties, inclusief de Core i7 SKU. Er is helemaal geen ventilatorgeluid of spoelgejank voor een volledig stil systeem.
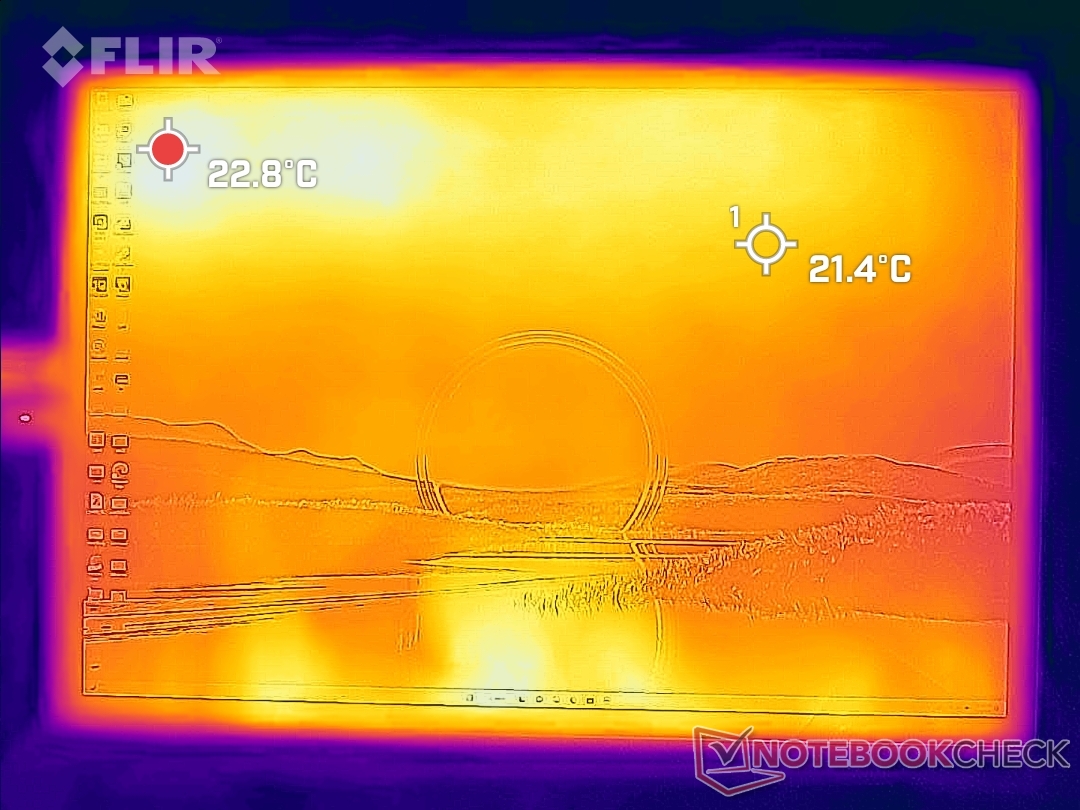
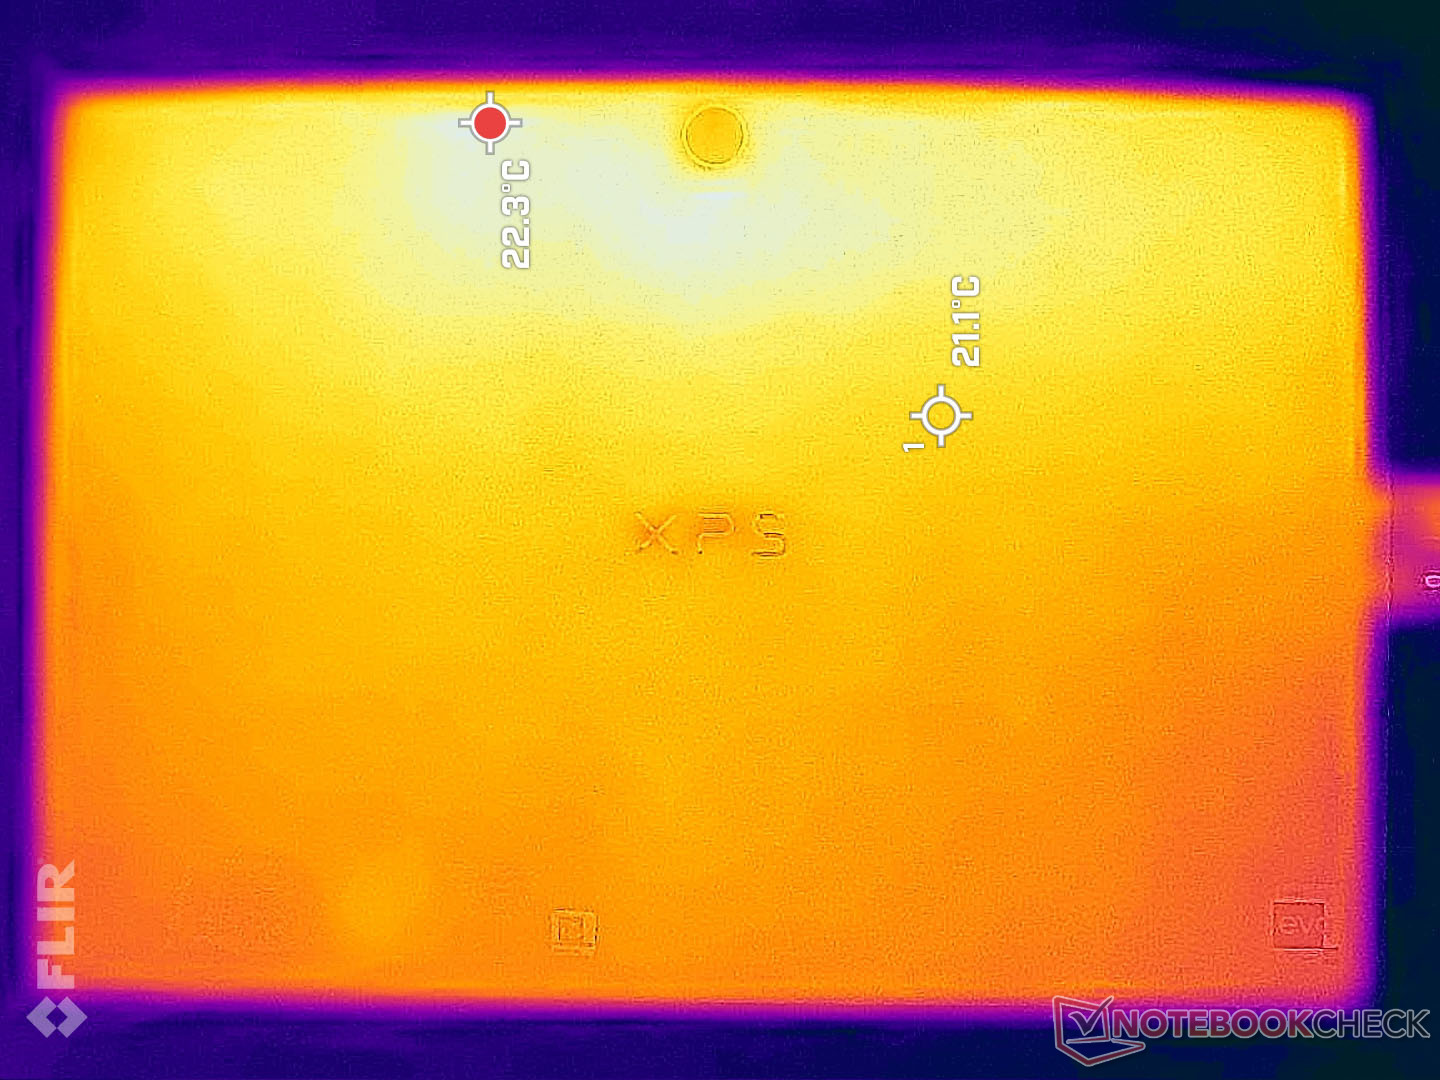
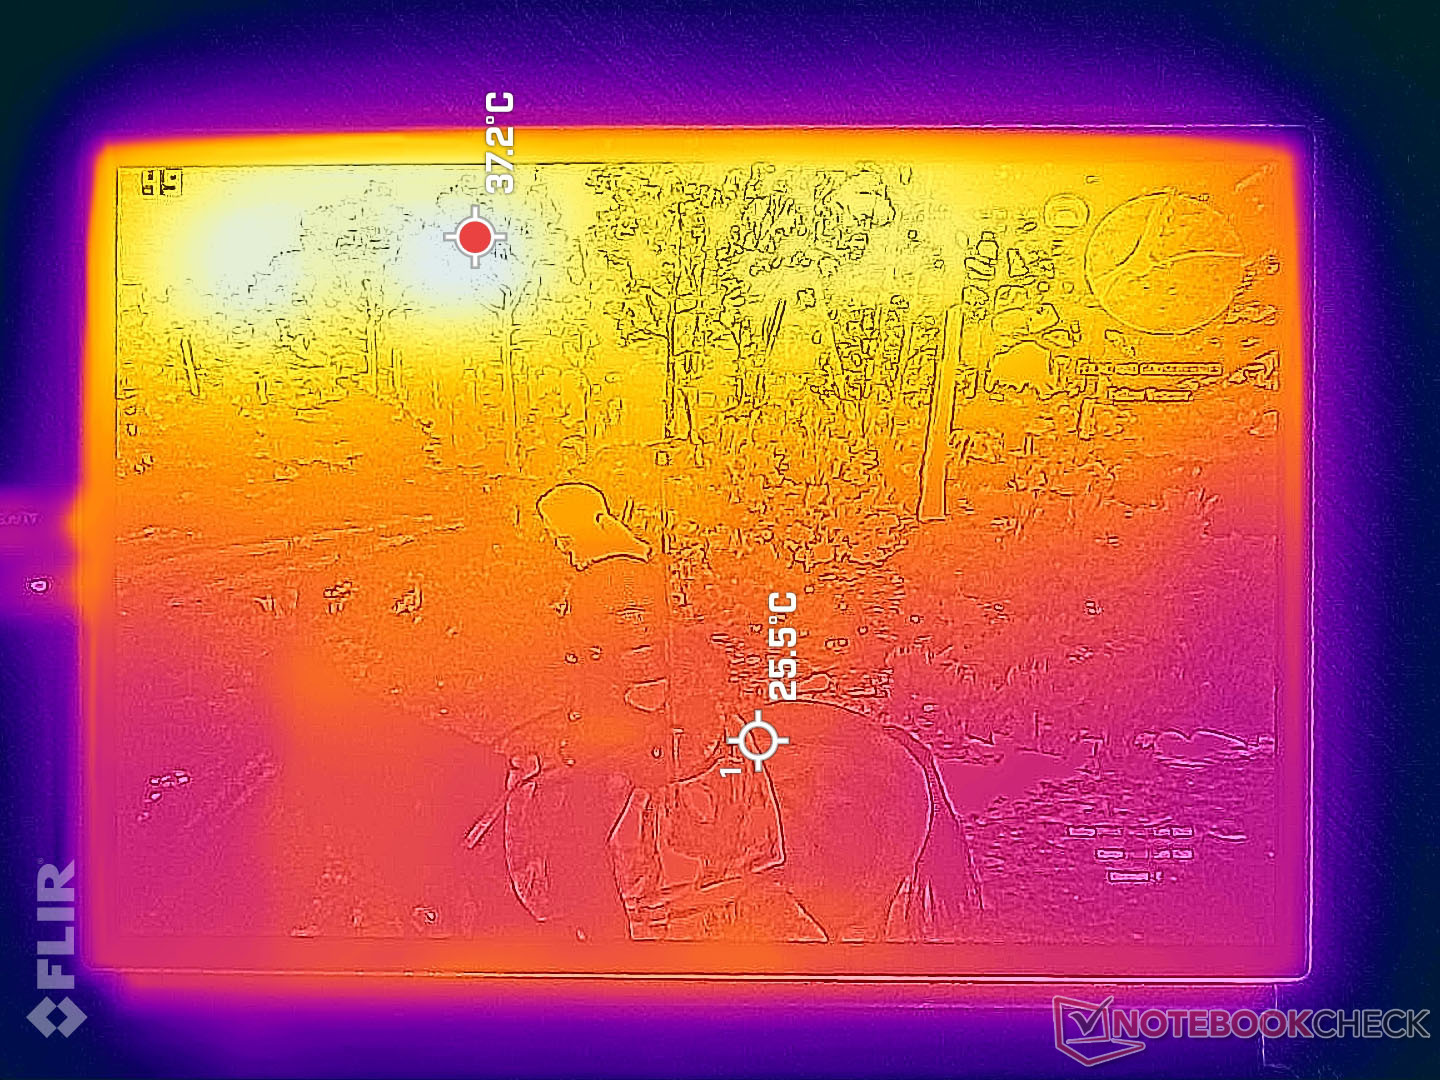
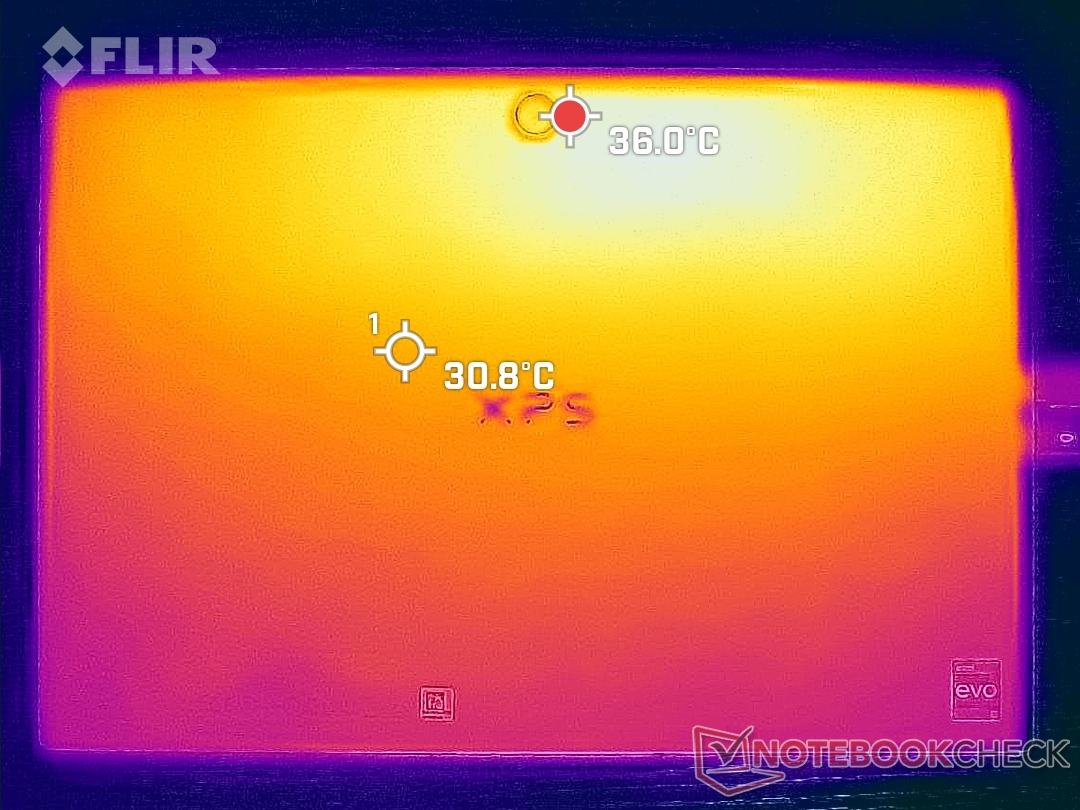
Temperatuur
De oppervlaktetemperaturen zijn over het algemeen warmer aan de bovenkant van het toestel, terwijl de onderste helft merkbaar koeler is. Hete plekken aan de voor- en achterzijde kunnen respectievelijk 42 C en 39 C bereiken, tegenover slechts 30 C op de koelere plekken. Het toestel wordt nooit oncomfortabel om vast te houden, ongeacht de oriëntatie of plaatsing. De algemene temperaturen zijn veel koeler dan wat we registreerden op de Surface Pro 8, waar de hele voor- en achterkant van het apparaat 43 C tot 48 C kan bereiken.
(±) De maximumtemperatuur aan de bovenzijde bedraagt 41.8 °C / 107 F, vergeleken met het gemiddelde van 35.4 °C / 96 F, variërend van 19.6 tot 60 °C voor de klasse Convertible.
(+) De bodem warmt op tot een maximum van 38.2 °C / 101 F, vergeleken met een gemiddelde van 36.9 °C / 98 F
(+) Bij onbelast gebruik bedraagt de gemiddelde temperatuur voor de bovenzijde 25.5 °C / 78 F, vergeleken met het apparaatgemiddelde van 30.3 °C / 87 F.
(+) De palmsteunen en het touchpad zijn met een maximum van ###max## °C / 85.6 F koeler dan de huidtemperatuur en voelen daarom koel aan.
(±) De gemiddelde temperatuur van de handpalmsteun van soortgelijke toestellen bedroeg 28 °C / 82.4 F (-1.8 °C / -3.2 F).
| Dell XPS 13 9315 2-in-1 Core i5-1230U Intel Core i5-1230U, Intel Iris Xe Graphics G7 80EUs | Microsoft Surface Pro 8, i7-1185G7 Intel Core i7-1185G7, Intel Iris Xe Graphics G7 96EUs | HP Spectre x360 13.5 14t-ef000 Intel Core i7-1255U, Intel Iris Xe Graphics G7 96EUs | Lenovo ThinkBook Plus Gen2 Core i5 Intel Core i5-1130G7, Intel Iris Xe Graphics G7 80EUs | Apple MacBook Air M2 Entry Apple M2, Apple M2 8-Core GPU | |
|---|---|---|---|---|---|
| Heat | -2% | 14% | -11% | 1% | |
| Maximum Upper Side * (°C) | 41.8 | 45 -8% | 36.4 13% | 42 -0% | 44.5 -6% |
| Maximum Bottom * (°C) | 38.2 | 47.2 -24% | 37 3% | 44.5 -16% | 44.4 -16% |
| Idle Upper Side * (°C) | 27.4 | 24.1 12% | 20.8 24% | 29.8 -9% | 23.9 13% |
| Idle Bottom * (°C) | 27.2 | 23.4 14% | 22.6 17% | 31.9 -17% | 23.6 13% |
* ... kleiner is beter
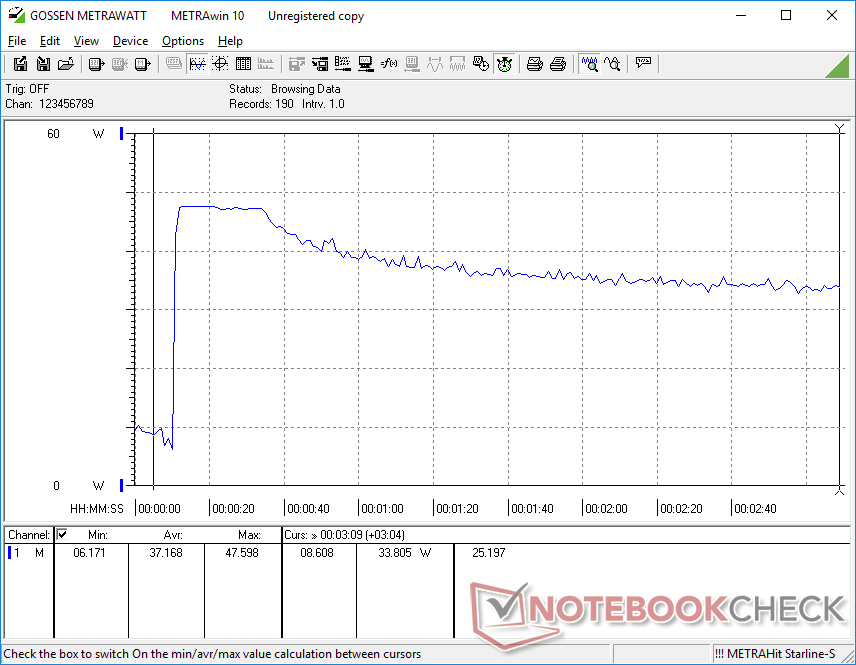
Stresstest
Onder Prime95 stress zou de CPU opvoeren tot 2,7 GHz en 29 W gedurende ongeveer 20 seconden of tot de kerntemperatuur 90 C bereikt. Daarna zouden de kloksnelheden en het opgenomen vermogen gestaag dalen om zich uiteindelijk te stabiliseren op respectievelijk 1,4 GHz en 12 W, om een veel koelere kerntemperatuur van 66 C te handhaven. De beperkte kloksnelheden zijn niet onverwacht gezien het ventilatorloze ontwerp en de tablet vormfactor. Bij herhaling van deze test op de ventilatorgekoelde Surface Pro 8 zou de CPU 26 W meer stroom verbruiken, maar met een vergelijkbare kerntemperatuur van 65 C.
De GPU kloksnelheid zou zich stabiliseren op 750 MHz bij gebruik Witcher 3 vergeleken met 1147 MHz op de veel snellere XPS 14 9320 Core i7 clamshell.
De CPU-prestaties worden niet kunstmatig afgeremd als er op de batterij wordt gewerkt. 3DMark 11 resultaten tussen batterij en lichtnet zijn vrijwel identiek.
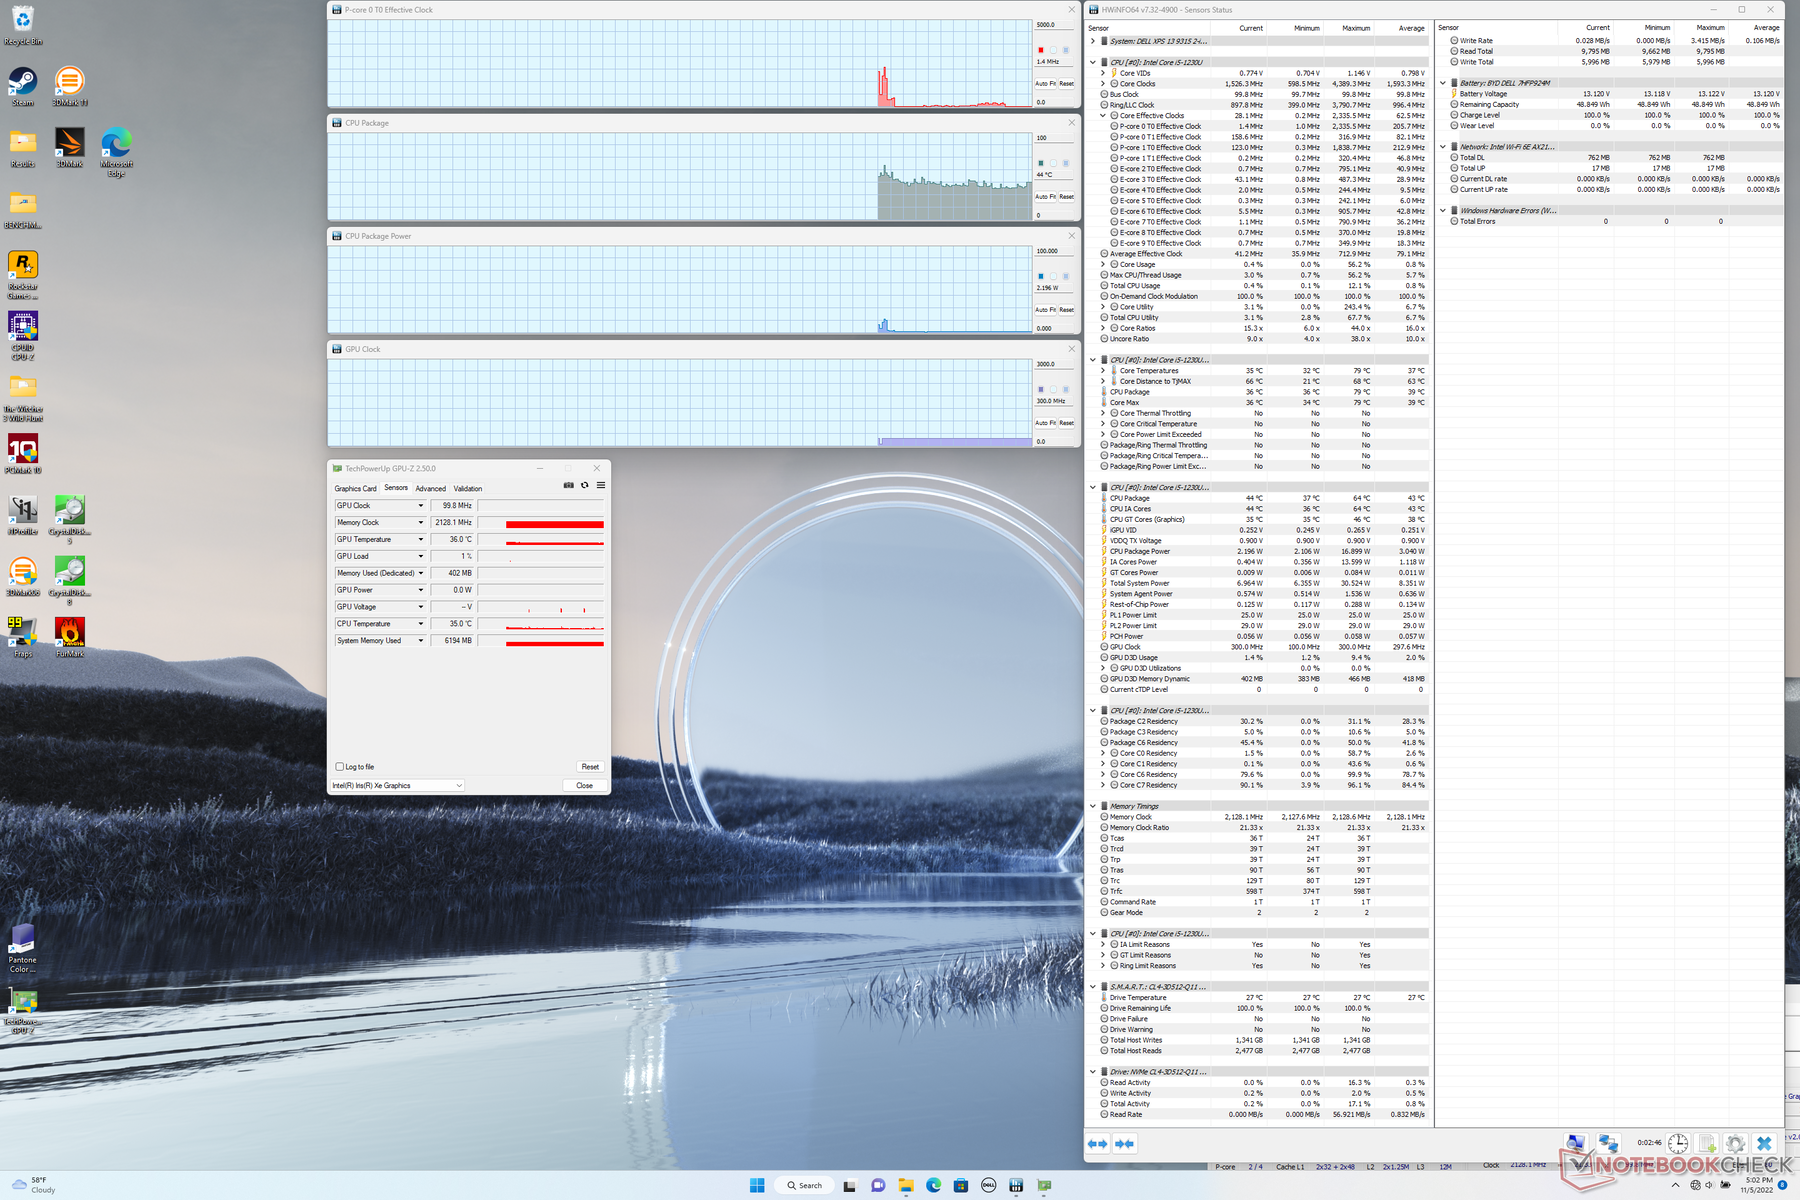
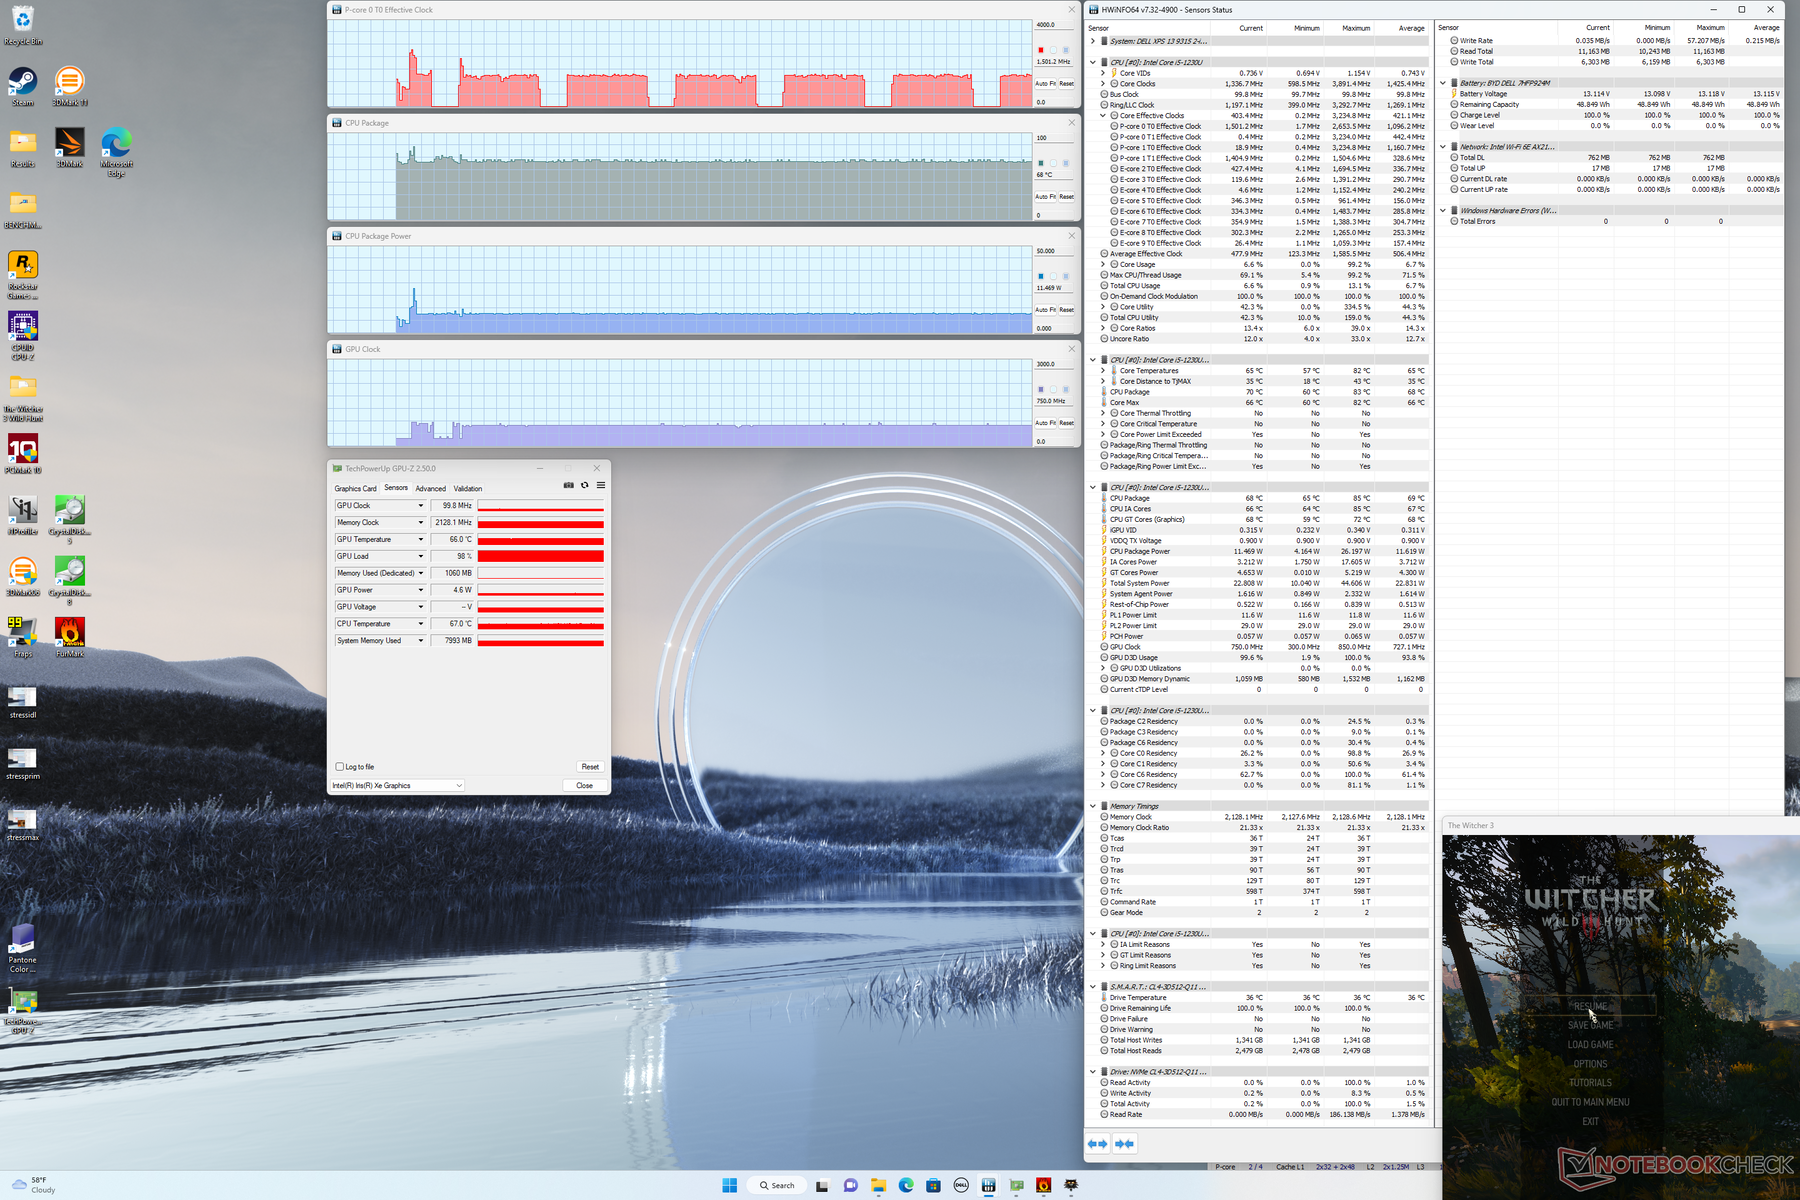

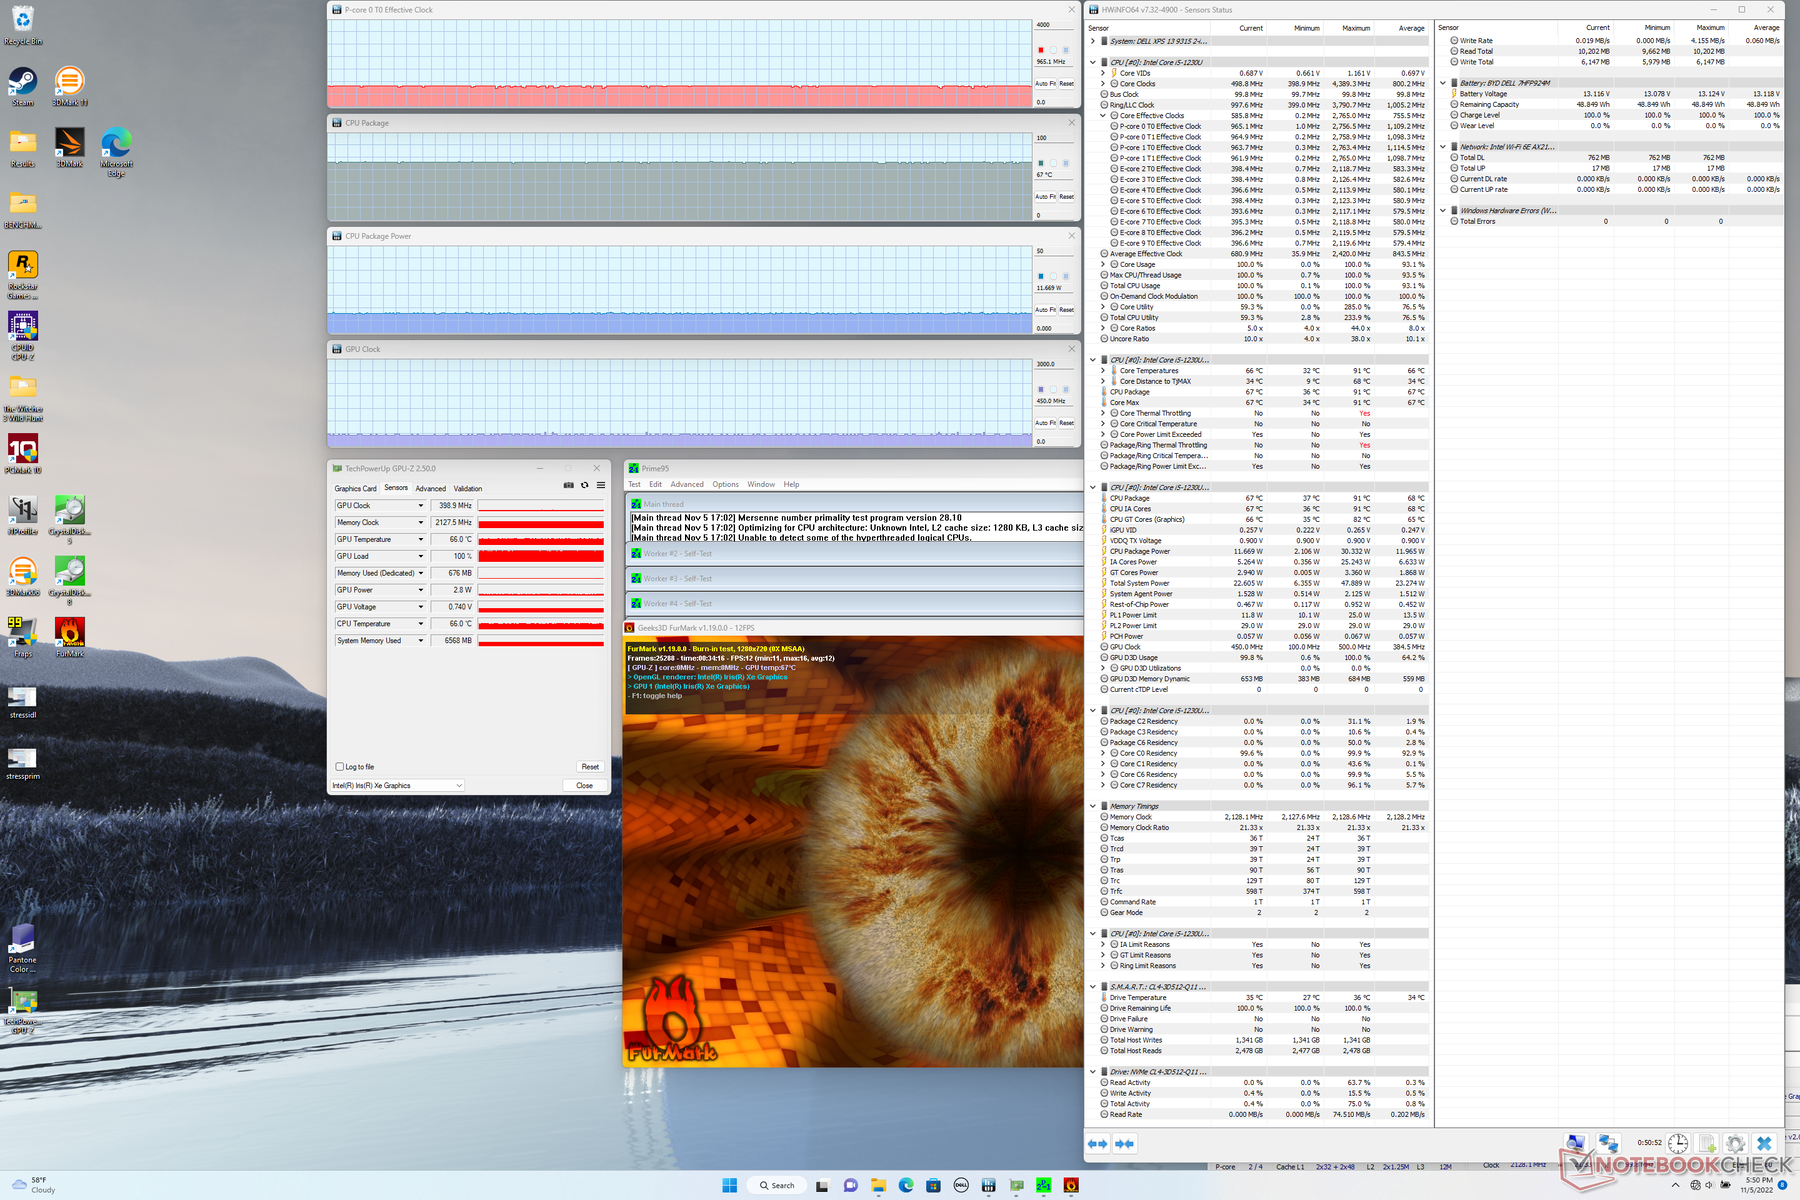
| CPU Klok (GHz) | GPU Klok (MHz) | Gemiddelde CPU Temperatuur (°C) | |
| Systeem Idle | -- | -- | 44 |
| Prime95 Stress | 1.4 | -- | 66 |
| Prime95 + FurMark Stress | 1.0 | 450 | 67 |
| Witcher 3 Stress | ~1.5 | 750 | 68 |
Luidsprekers
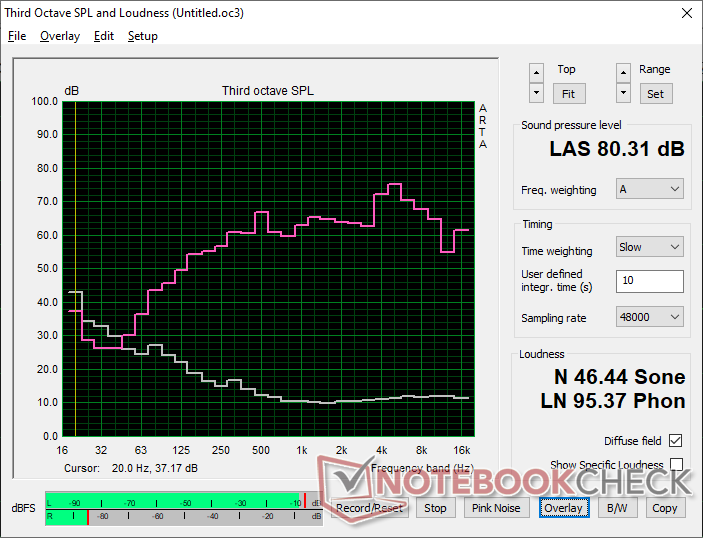
Dell XPS 13 9315 2-in-1 Core i5-1230U audioanalyse
(±) | luidspreker luidheid is gemiddeld maar goed (80.3 dB)
Bas 100 - 315 Hz
(±) | verminderde zeebaars - gemiddeld 8.9% lager dan de mediaan
(+) | de lage tonen zijn lineair (5.7% delta naar de vorige frequentie)
Midden 400 - 2000 Hz
(+) | evenwichtige middens - slechts 2.2% verwijderd van de mediaan
(+) | de middentonen zijn lineair (5.2% delta ten opzichte van de vorige frequentie)
Hoog 2 - 16 kHz
(±) | higher highs - on average 5.5% higher than median
(+) | de hoge tonen zijn lineair (6.8% delta naar de vorige frequentie)
Algemeen 100 - 16.000 Hz
(+) | het totale geluid is lineair (11.9% verschil met de mediaan)
Vergeleken met dezelfde klasse
» 11% van alle geteste apparaten in deze klasse waren beter, 3% vergelijkbaar, 85% slechter
» De beste had een delta van 6%, het gemiddelde was 20%, de slechtste was 57%
Vergeleken met alle geteste toestellen
» 9% van alle geteste apparaten waren beter, 2% gelijk, 89% slechter
» De beste had een delta van 4%, het gemiddelde was 23%, de slechtste was 134%
Apple MacBook Pro 16 2021 M1 Pro audioanalyse
(+) | luidsprekers kunnen relatief luid spelen (84.7 dB)
Bas 100 - 315 Hz
(+) | goede baars - slechts 3.8% verwijderd van de mediaan
(+) | de lage tonen zijn lineair (5.2% delta naar de vorige frequentie)
Midden 400 - 2000 Hz
(+) | evenwichtige middens - slechts 1.3% verwijderd van de mediaan
(+) | de middentonen zijn lineair (2.1% delta ten opzichte van de vorige frequentie)
Hoog 2 - 16 kHz
(+) | evenwichtige hoogtepunten - slechts 1.9% verwijderd van de mediaan
(+) | de hoge tonen zijn lineair (2.7% delta naar de vorige frequentie)
Algemeen 100 - 16.000 Hz
(+) | het totale geluid is lineair (4.6% verschil met de mediaan)
Vergeleken met dezelfde klasse
» 0% van alle geteste apparaten in deze klasse waren beter, 0% vergelijkbaar, 100% slechter
» De beste had een delta van 5%, het gemiddelde was 17%, de slechtste was 45%
Vergeleken met alle geteste toestellen
» 0% van alle geteste apparaten waren beter, 0% gelijk, 100% slechter
» De beste had een delta van 4%, het gemiddelde was 23%, de slechtste was 134%
Energiebeheer - zeer energie-efficiënt
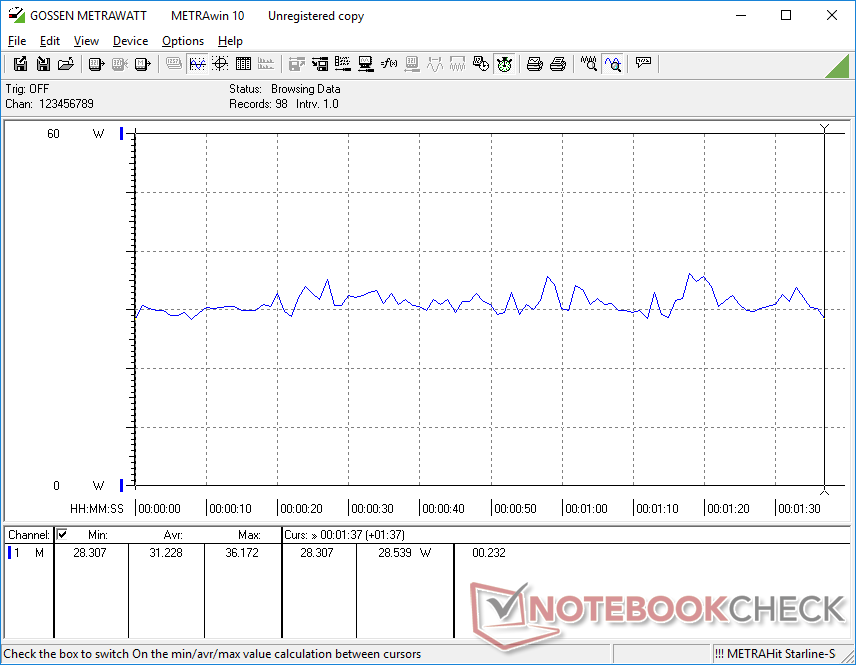
Stroomverbruik
Stationair draaien op de laagste helderheidsinstelling verbruikt slechts 5 W, terwijl de maximale helderheidsinstelling ongeveer 3 W meer zou vragen. De resultaten liggen zeer dicht bij wat we registreerden op de ThinkBook Plus Gen 2 uitgerust met dezelfde Core i5-1230U CPU bij vergelijkbare belasting. De Core i7 van de Surface Pro 8 verbruikt meer dan 50 procent meer stroom bij hoge belasting, omdat hij veel snellere grafische prestaties levert dan onze Core i5 SKU van Dell
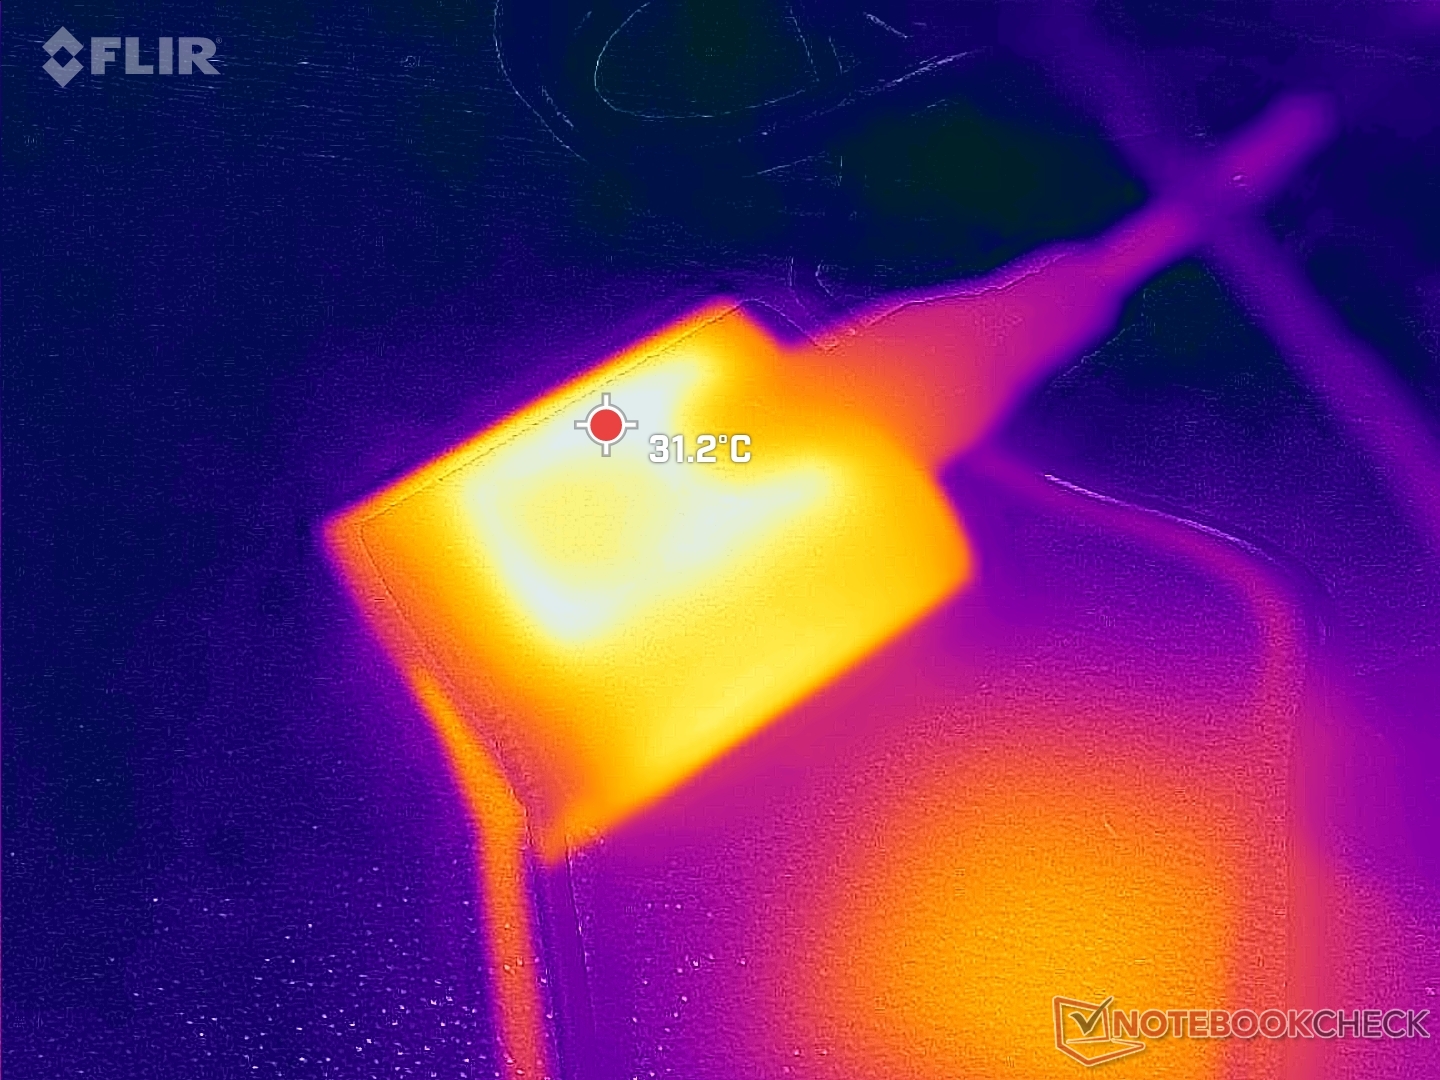
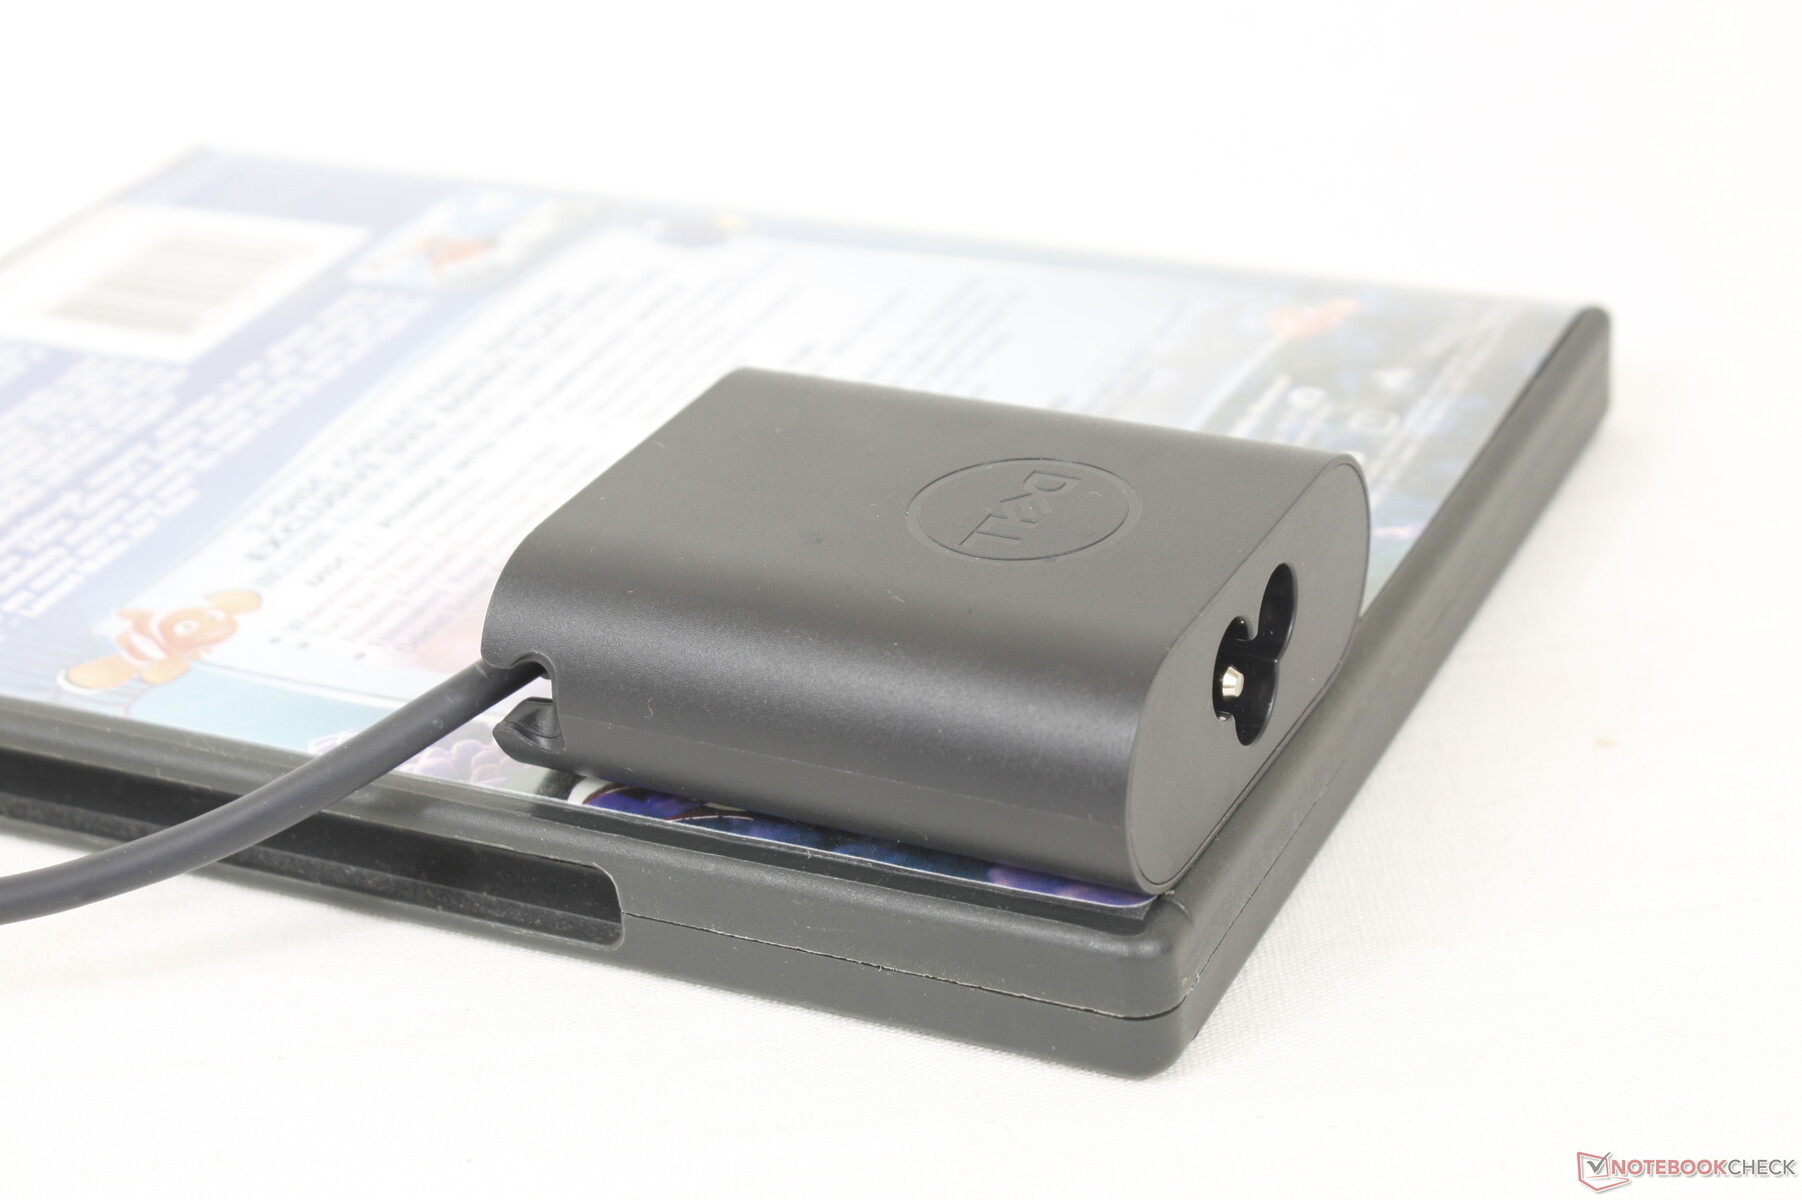
We zijn in staat om een maximale stroomopname van 48 W uit de kleine (~6 x 5,5 x 2,2 cm) 45 W USB-C AC-adapter op te nemen. Dit tempo is slechts tijdelijk, zoals blijkt uit onze onderstaande grafieken, aangezien CPU Turbo Boost beperkt is.

| Uit / Standby | |
| Inactief | |
| Belasting |
|
Key:
min: | |
| Dell XPS 13 9315 2-in-1 Core i5-1230U i5-1230U, Iris Xe G7 80EUs, , IPS, 2880x1920, 13" | Dell XPS 13 Plus 9320 i7-1280P OLED i7-1280P, Iris Xe G7 96EUs, WDC PC SN810 512GB, OLED, 3456x2160, 13.4" | Microsoft Surface Pro 8, i7-1185G7 i7-1185G7, Iris Xe G7 96EUs, Toshiba KBG40ZNS256G NVMe, IPS, 2880x1920, 13" | HP Spectre x360 13.5 14t-ef000 i7-1255U, Iris Xe G7 96EUs, Micron 3400 1TB MTFDKBA1T0TFH, OLED, 3000x2000, 13.5" | Lenovo ThinkBook Plus Gen2 Core i5 i5-1130G7, Iris Xe G7 80EUs, Samsung PM9A1 MZVL2512HCJQ, IPS, E-Ink, 2560x1600, 13.3" | Apple MacBook Air M2 Entry M2, M2 8-Core GPU, Apple SSD AP0256Z, IPS, 2560x1664, 13.6" | |
|---|---|---|---|---|---|---|
| Power Consumption | -46% | -23% | -19% | -5% | 13% | |
| Idle Minimum * (Watt) | 5.2 | 6.5 -25% | 3.9 25% | 4 23% | 5 4% | 1.87 64% |
| Idle Average * (Watt) | 7.9 | 7.8 1% | 8.5 -8% | 4.9 38% | 7.9 -0% | 9.2 -16% |
| Idle Maximum * (Watt) | 8 | 13 -63% | 9.8 -23% | 12.5 -56% | 8.3 -4% | 9.3 -16% |
| Load Average * (Watt) | 31.2 | 56.6 -81% | 48 -54% | 48.1 -54% | 30.9 1% | 28.5 9% |
| Witcher 3 ultra * (Watt) | 28.2 | 49.2 -74% | 41.5 -47% | 35.8 -27% | 25.2 11% | 27.4 3% |
| Load Maximum * (Watt) | 47.6 | 63 -32% | 63 -32% | 65.2 -37% | 66.8 -40% | 31 35% |
* ... kleiner is beter
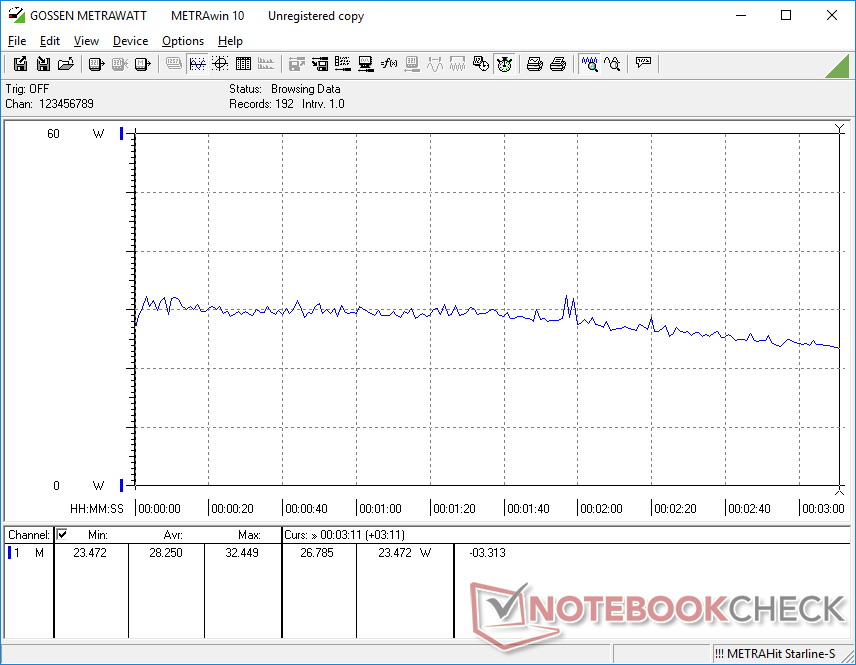
Power Consumption Witcher 3 / Stresstest
Power Consumption external Monitor
Levensduur van de batterij
De 49,5 Wh batterij is net iets kleiner dan de 51,5 Wh en 53 Wh batterijen in respectievelijk de Surface Pro 8 en ThinkBook Plus Gen 2. Runtimes zijn niettemin uitstekend met bijna 9 uur real-world WLAN gebruik in vergelijking met ~8 uur op de eerder genoemde Microsoft en Lenovo alternatieven.
Opladen van leeg naar vol duurt ongeveer 2 tot 2,5 uur.
| Dell XPS 13 9315 2-in-1 Core i5-1230U i5-1230U, Iris Xe G7 80EUs, 49.5 Wh | Dell XPS 13 Plus 9320 i7-1280P OLED i7-1280P, Iris Xe G7 96EUs, 55 Wh | Microsoft Surface Pro 8, i7-1185G7 i7-1185G7, Iris Xe G7 96EUs, 51.5 Wh | HP Spectre x360 13.5 14t-ef000 i7-1255U, Iris Xe G7 96EUs, 66 Wh | Lenovo ThinkBook Plus Gen2 Core i5 i5-1130G7, Iris Xe G7 80EUs, 53 Wh | Apple MacBook Air M2 Entry M2, M2 8-Core GPU, 52.6 Wh | |
|---|---|---|---|---|---|---|
| Batterijduur | -36% | -28% | 16% | -16% | 45% | |
| Reader / Idle (h) | 13.6 | 20.4 50% | ||||
| WiFi v1.3 (h) | 9 | 5.8 -36% | 7.6 -16% | 8 -11% | 7.6 -16% | 15.2 69% |
| Load (h) | 2 | 1.2 -40% | 2.2 10% | 2.4 20% | ||
| H.264 (h) | 10.1 | 16.5 |
Pro
Contra
Verdict - XPS of Surface Pro?
De XPS 13 9315 2-in-1 is de beste concurrent tot nu toe voor de Microsoft Surface Pro serie. Sommige aspecten zijn beter dan het Microsoft-model, terwijl andere slechter zijn. Met name de afneembare toetsenbordvoet biedt stevigere toetsen, een groter clickpad en betere bescherming tegen krassen. De tablet zelf is ook dunner en lichter dan de Surface Pro 8, zonder dat er drastisch bezuinigd hoeft te worden op de processorprestaties. De Core i5-1230U in de Dell presteert vergelijkbaar met de Core i7-1185G7 in de Surface Pro 8, ondanks het ventilatorloze ontwerp van de Dell. De fabrikant belooft ook 5G eSIM SKU's in de nabije toekomst, terwijl er op het moment van schrijven geen dergelijke opties bestaan voor de Surface Pro
Er zijn nog steeds een handvol redenen om het Microsoft-model te overwegen in plaats van de Dell. Ten eerste heeft de Surface Pro 8 een 3,5 mm audio-aansluiting, wat sommige gebruikers op prijs zullen stellen. De grafische prestaties zijn ook aanzienlijk sneller, aangezien de GPU in de Dell de neiging heeft om zelfs ten opzichte van andere laptops met vergelijkbare geïntegreerde graphics ondermaats te presteren. Het ontbreken van 120 Hz schermopties is misschien wel het meest opvallend, omdat de Dell tablet daardoor onhandiger en minder responsief aanvoelt. De 60 Hz beperking was in het verleden geen groot probleem, maar het wordt steeds meer een handicap nu laptops, monitoren en smartphones met een hoge verversingsfrequentie gemeengoed zijn geworden
Een Surface Pro zonder de naam Surface Pro. De XPS 13 9315 2-in-1 overtreft de Microsoft Surface Pro Type Cover qua comfort, maar het 60 Hz touchscreen voelt gedateerd aan naast de 120 Hz Surface Pro 8.
Als u van plan bent veel te typen en te e-mailen, dan is de XPS 13 9315 2-in-1 wellicht de betere optie vanwege het superieure toetsenborddock. Als u van plan bent het touchscreen vaker in tabletmodus te gebruiken, dan is de hogere vernieuwingsfrequentie en responsiviteit van het Surface Pro-scherm moeilijk te passeren. Als Dell in de toekomst extra schermopties kan bieden, dan kan zijn XPS 13 9315 2-in-1 serie een veel gemakkelijkere aanbeveling zijn voor meer gebruiksscenario's.
Prijs en beschikbaarheid
De XPS 13 9315 2-in-1 komt op 14 november op grote schaal beschikbaar. Retailers zoals Amazon hebben bepaalde SKU's al in de pre-order staan. De beste plaats om op dit moment te bestellen is via Dell waar prijzen beginnen bij $1000 USD zonder keyboard dock of pen.
Dell XPS 13 9315 2-in-1 Core i5-1230U
- 08-11-2022 v7 (old)
Allen Ngo
Price comparison

