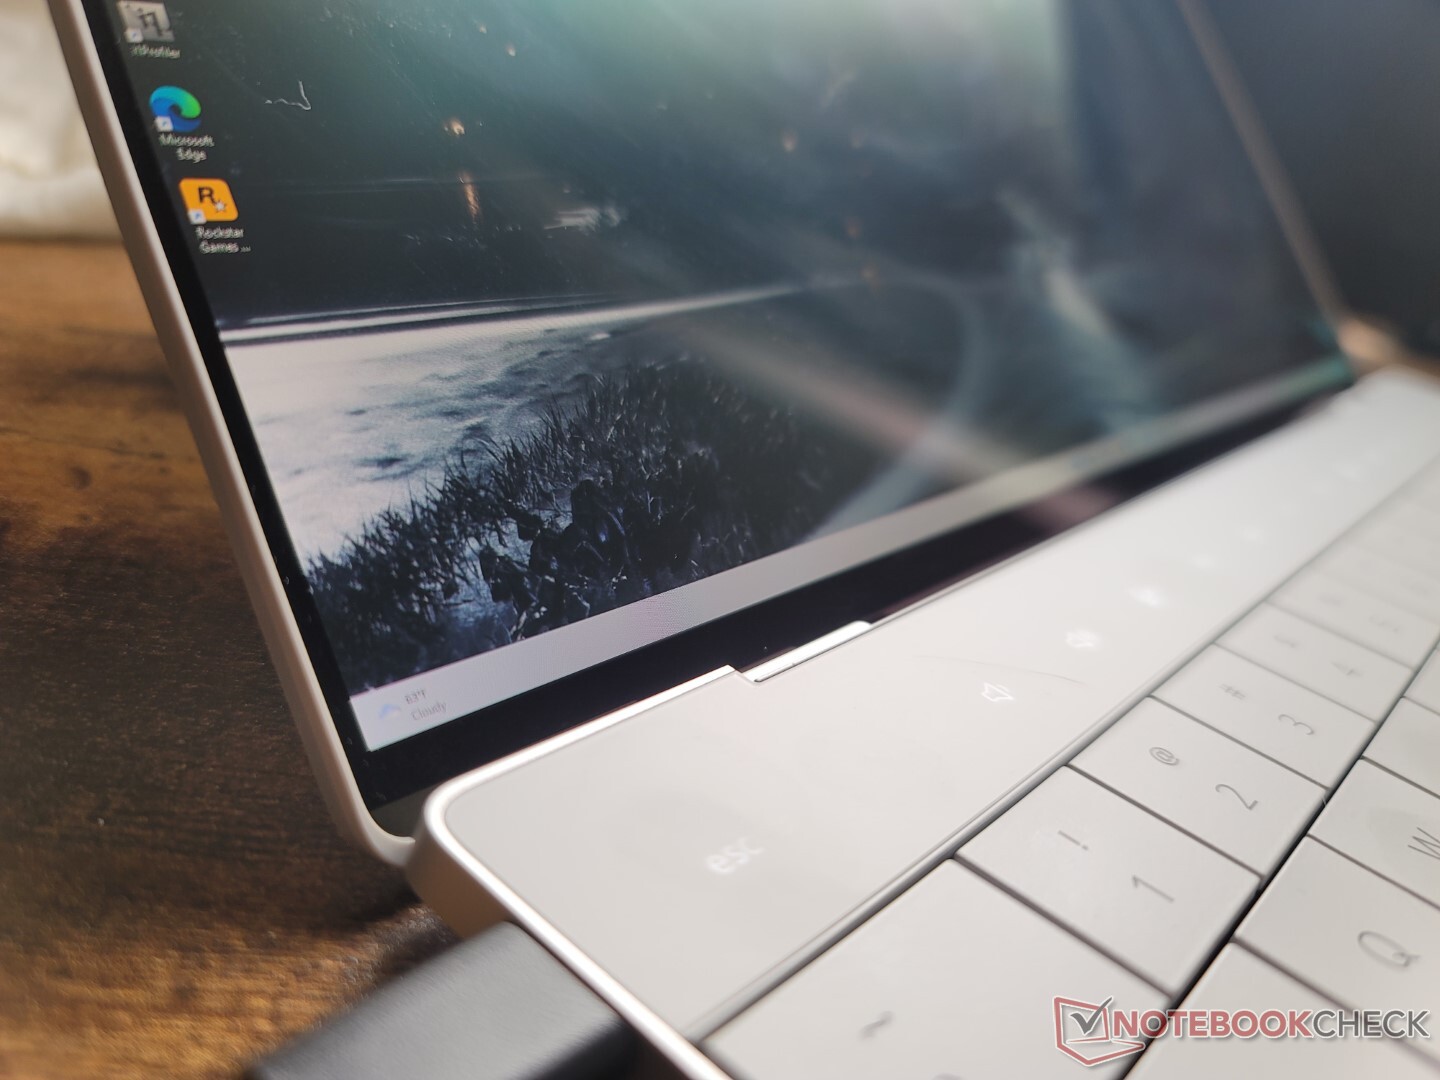
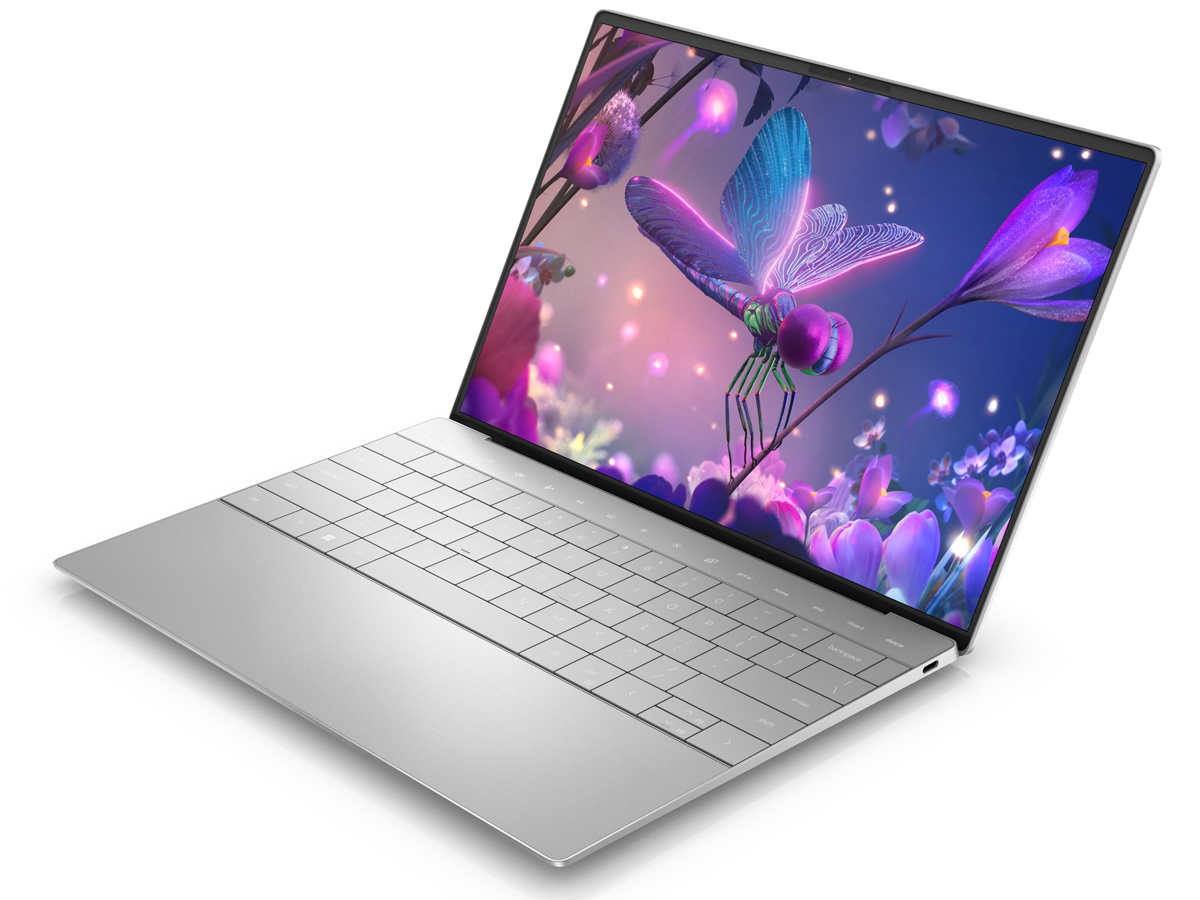
Alle drie de Dell XPS 13 Plus 9320 SKU's onder de loep: Core i5-1240P, i7-1260P, of i7-1280P OLED?
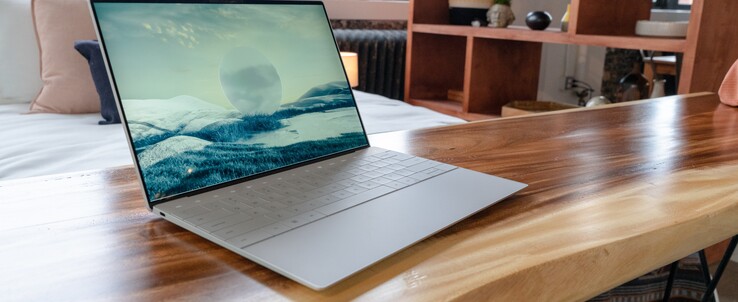
Na de eerste onthulling op CES 2022 wordt de 2022 XPS 13 Plus nu geleverd met drie processoropties om uit te kiezen (Core i5-1240P, Core i7-1260P en Core i7-1280P) naast drie verschillende beeldschermresoluties (1920 x 1200 IPS, 3456 x 2160 OLED en 3840 x 2400 IPS). We hebben de i5-1240P, i7-1260P, 1200p IPS, en 2400p IPS configuraties al getest, zodat alleen de i7-1280P 2160p OLED SKU overblijft
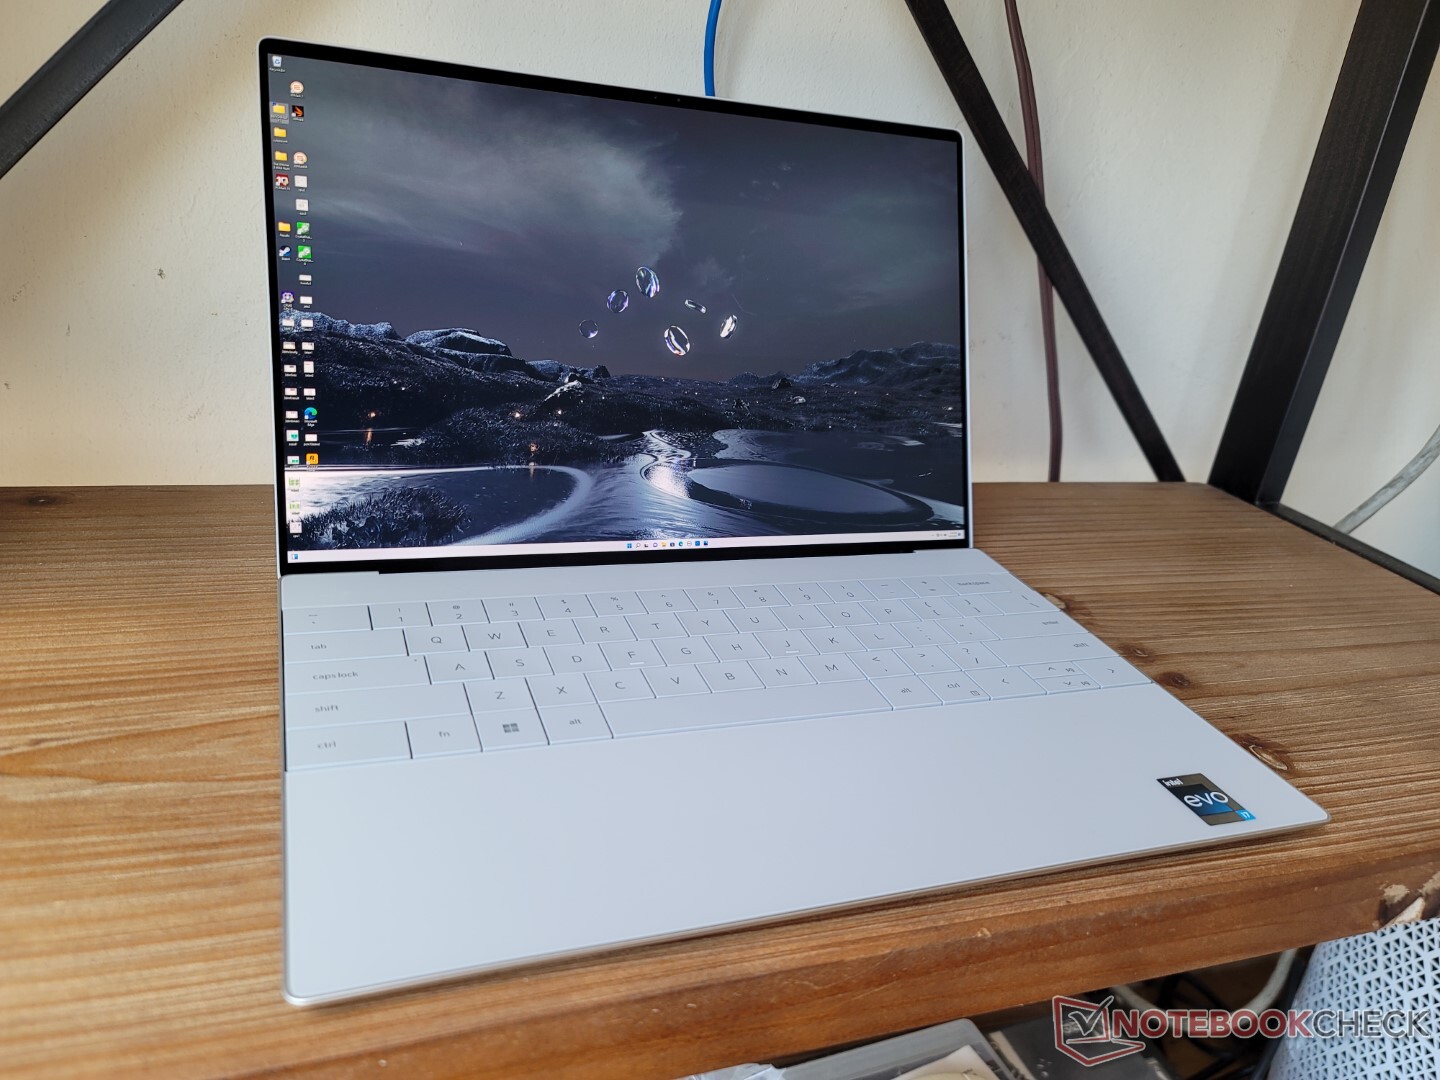
Deze review richt zich op de i7-1280P en 2160p OLED configuratie en de verschillen die gebruikers kunnen verwachten tussen deze en de andere XPS 13 Plus opties. In deze configuratie kost het apparaat momenteel 1750 dollar. We raden aan om onze bestaande twee beoordelingen over de XPS 13 Plus om meer te weten te komen over de fysieke kenmerken van het model
Meer Dell reviews
Potentiële concurrenten in vergelijking
Evaluatie | Datum | Model | Gewicht | Hoogte | Formaat | Resolutie | Beste prijs |
|---|---|---|---|---|---|---|---|
| 87.3 % v7 (old) | 09-2022 | Dell XPS 13 Plus 9320 i7-1280P OLED i7-1280P, Iris Xe G7 96EUs | 1.3 kg | 15.28 mm | 13.40" | 3456x2160 | |
| 86.1 % v7 (old) | 08-2022 | Dell XPS 13 Plus 9320 i5-1240p i5-1240P, Iris Xe G7 80EUs | 1.2 kg | 15.3 mm | 13.40" | 1920x1200 | |
| 88.2 % v7 (old) | 08-2022 | Dell XPS 13 9315, i5-1230U i5-1230U, Iris Xe G7 80EUs | 1.2 kg | 14 mm | 13.40" | 1920x1200 | |
| 86.9 % v7 (old) | 07-2022 | Dell XPS 13 Plus 9320 4K i7-1260P, Iris Xe G7 96EUs | 1.2 kg | 15.3 mm | 13.40" | 3840x2400 | |
| 86.7 % v7 (old) | 10-2021 | Dell XPS 13 9310 2-in-1 i7-1165G7, Iris Xe G7 96EUs | 1.3 kg | 14.35 mm | 13.40" | 1920x1200 | |
| 88.3 % v7 (old) | 06-2021 | Dell XPS 13 9310 OLED i7-1185G7, Iris Xe G7 96EUs | 1.2 kg | 14.8 mm | 13.40" | 3456x2160 |
Zaak
Weergave
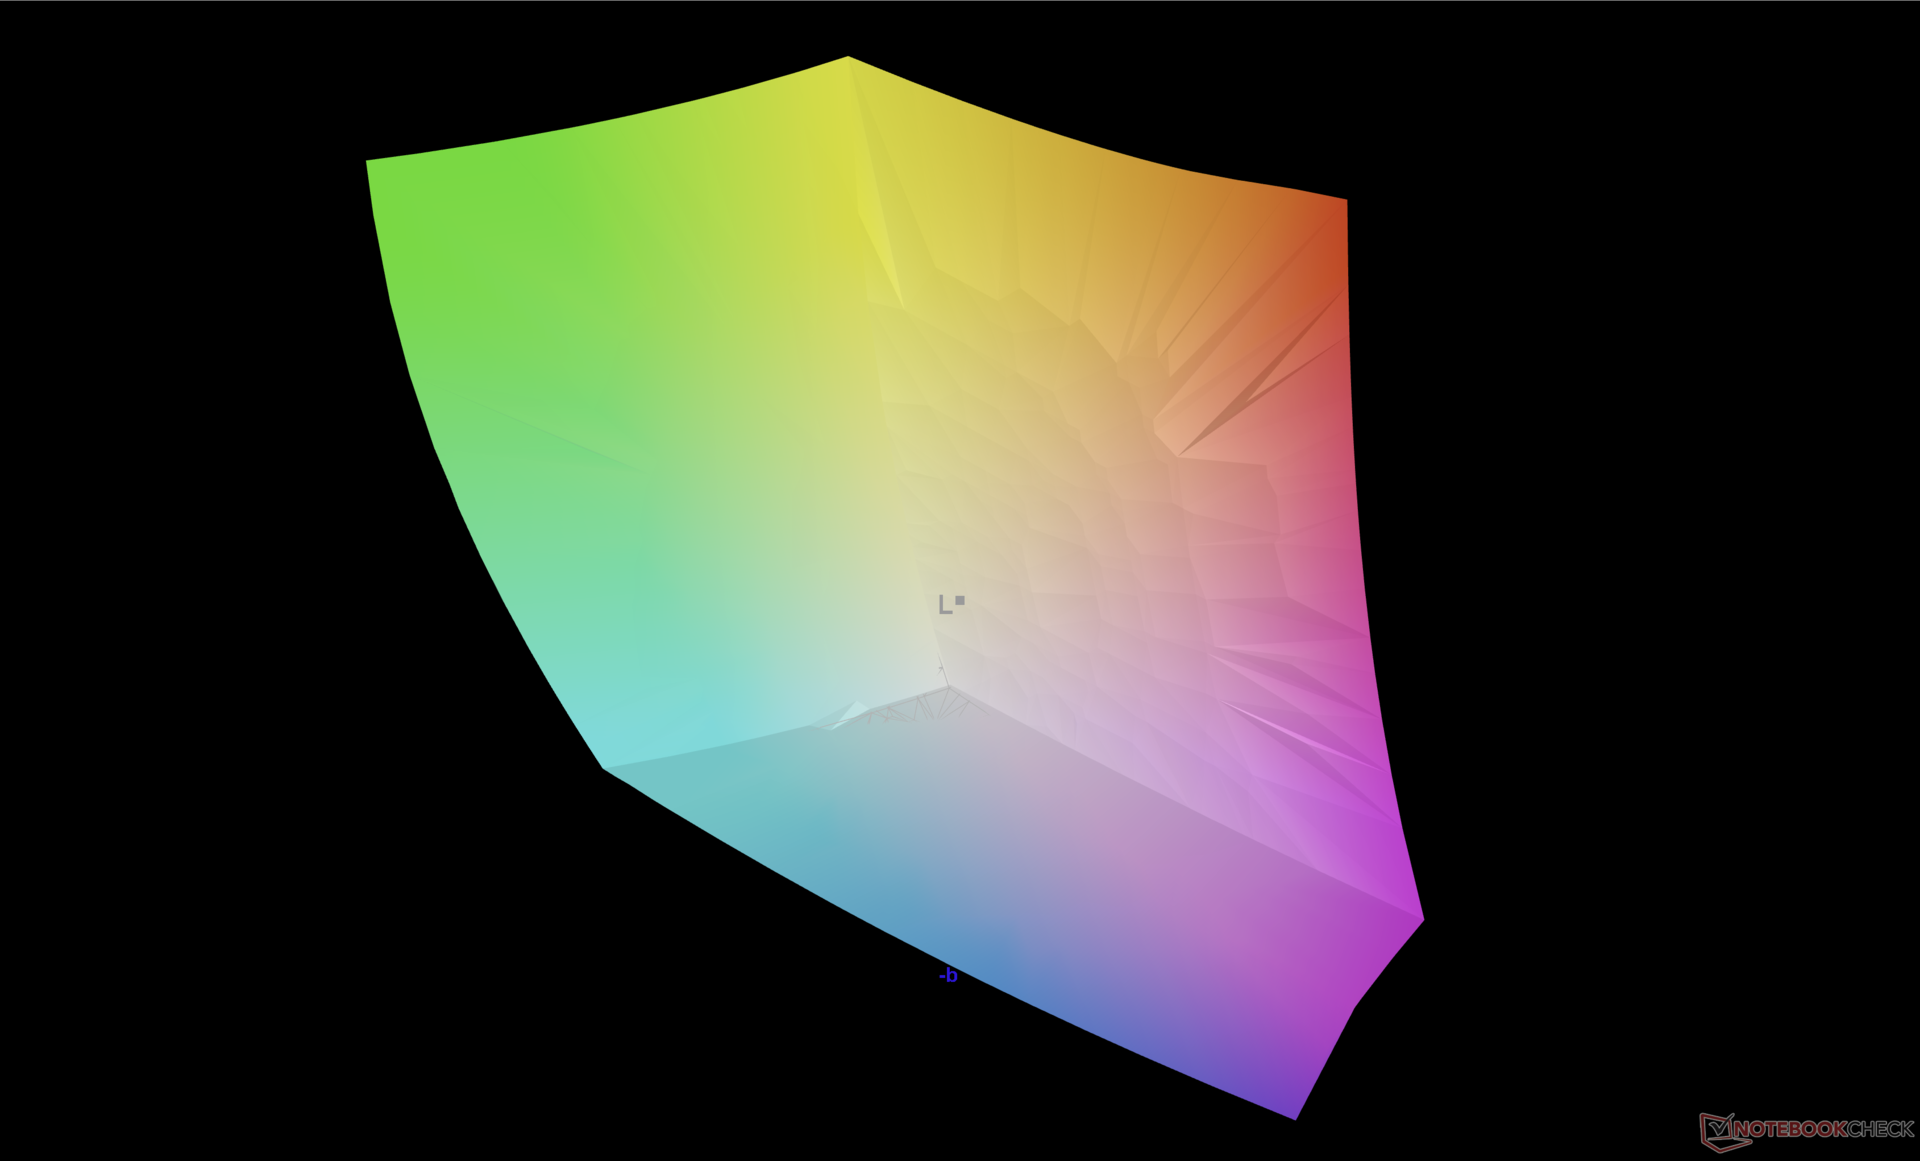
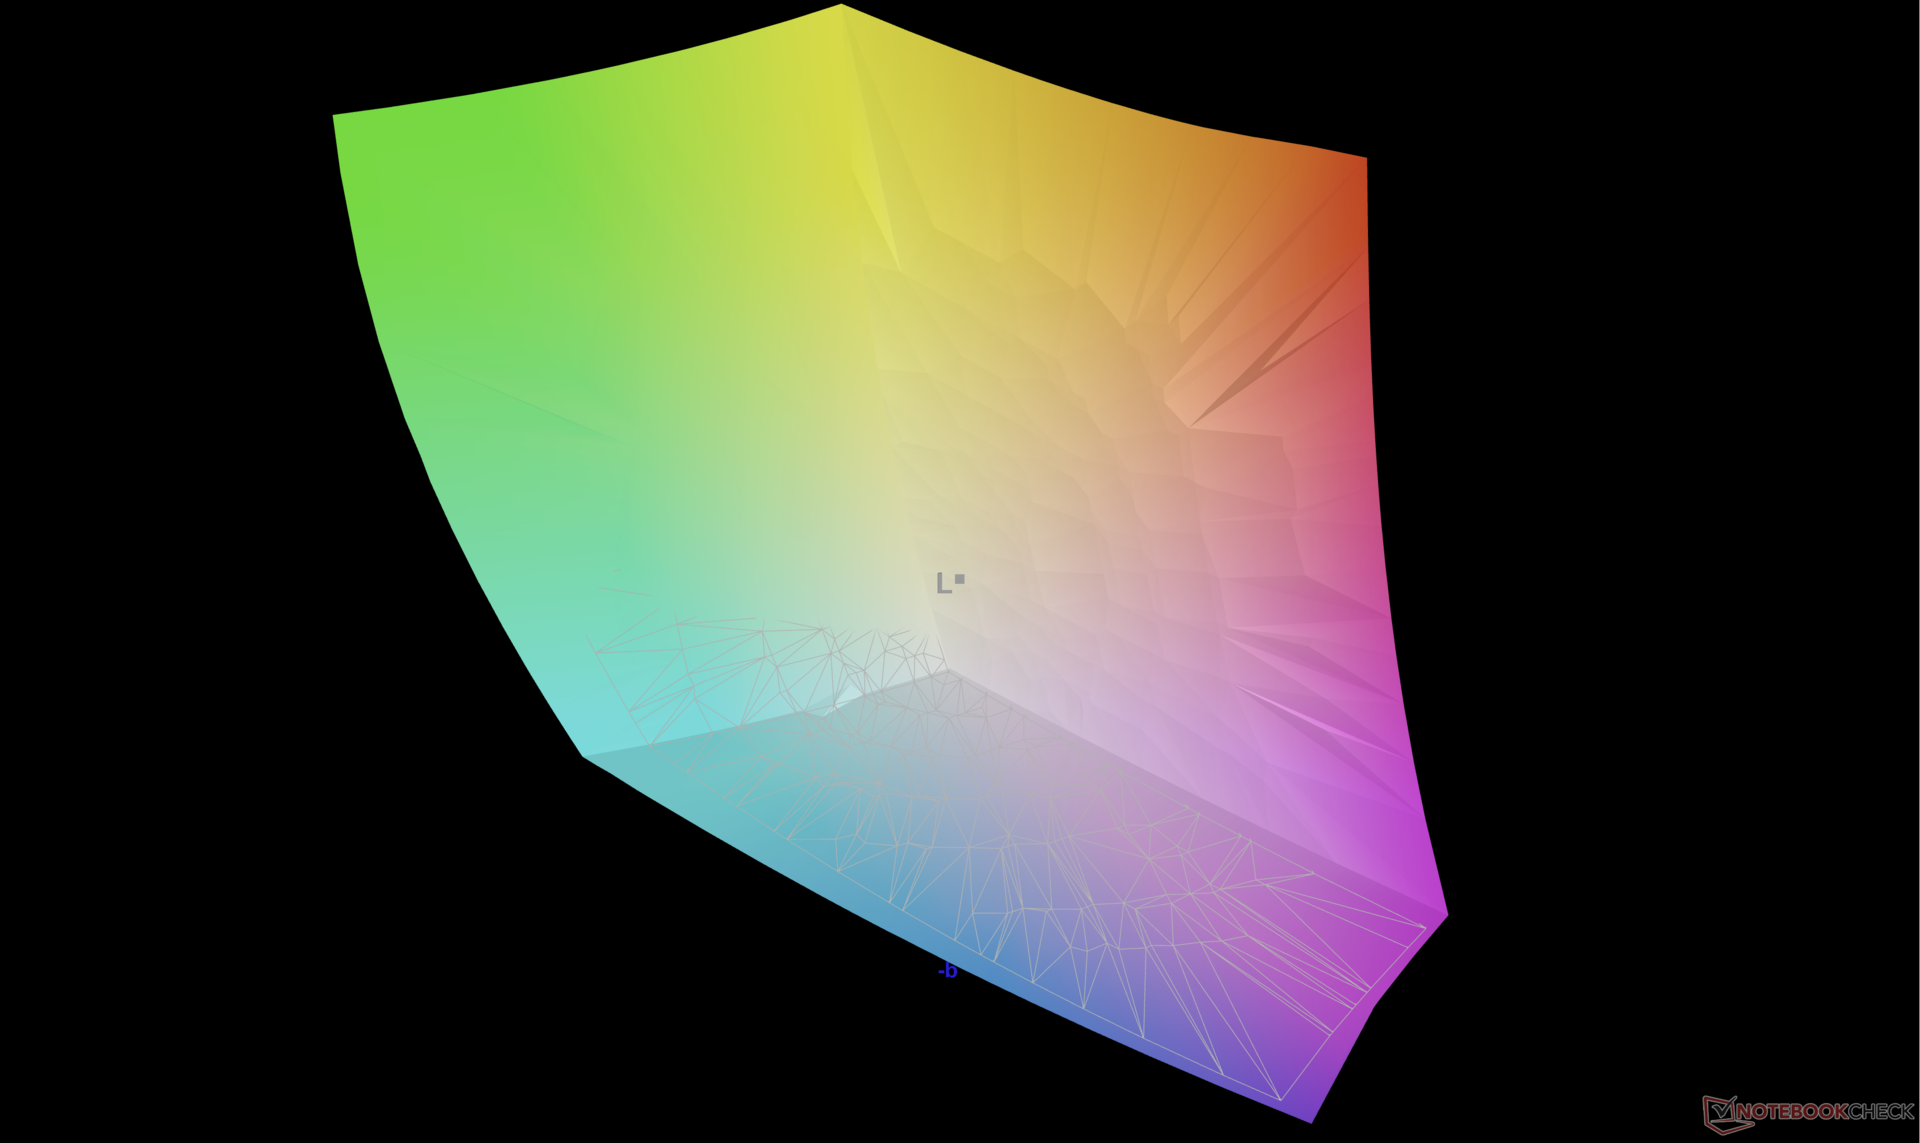
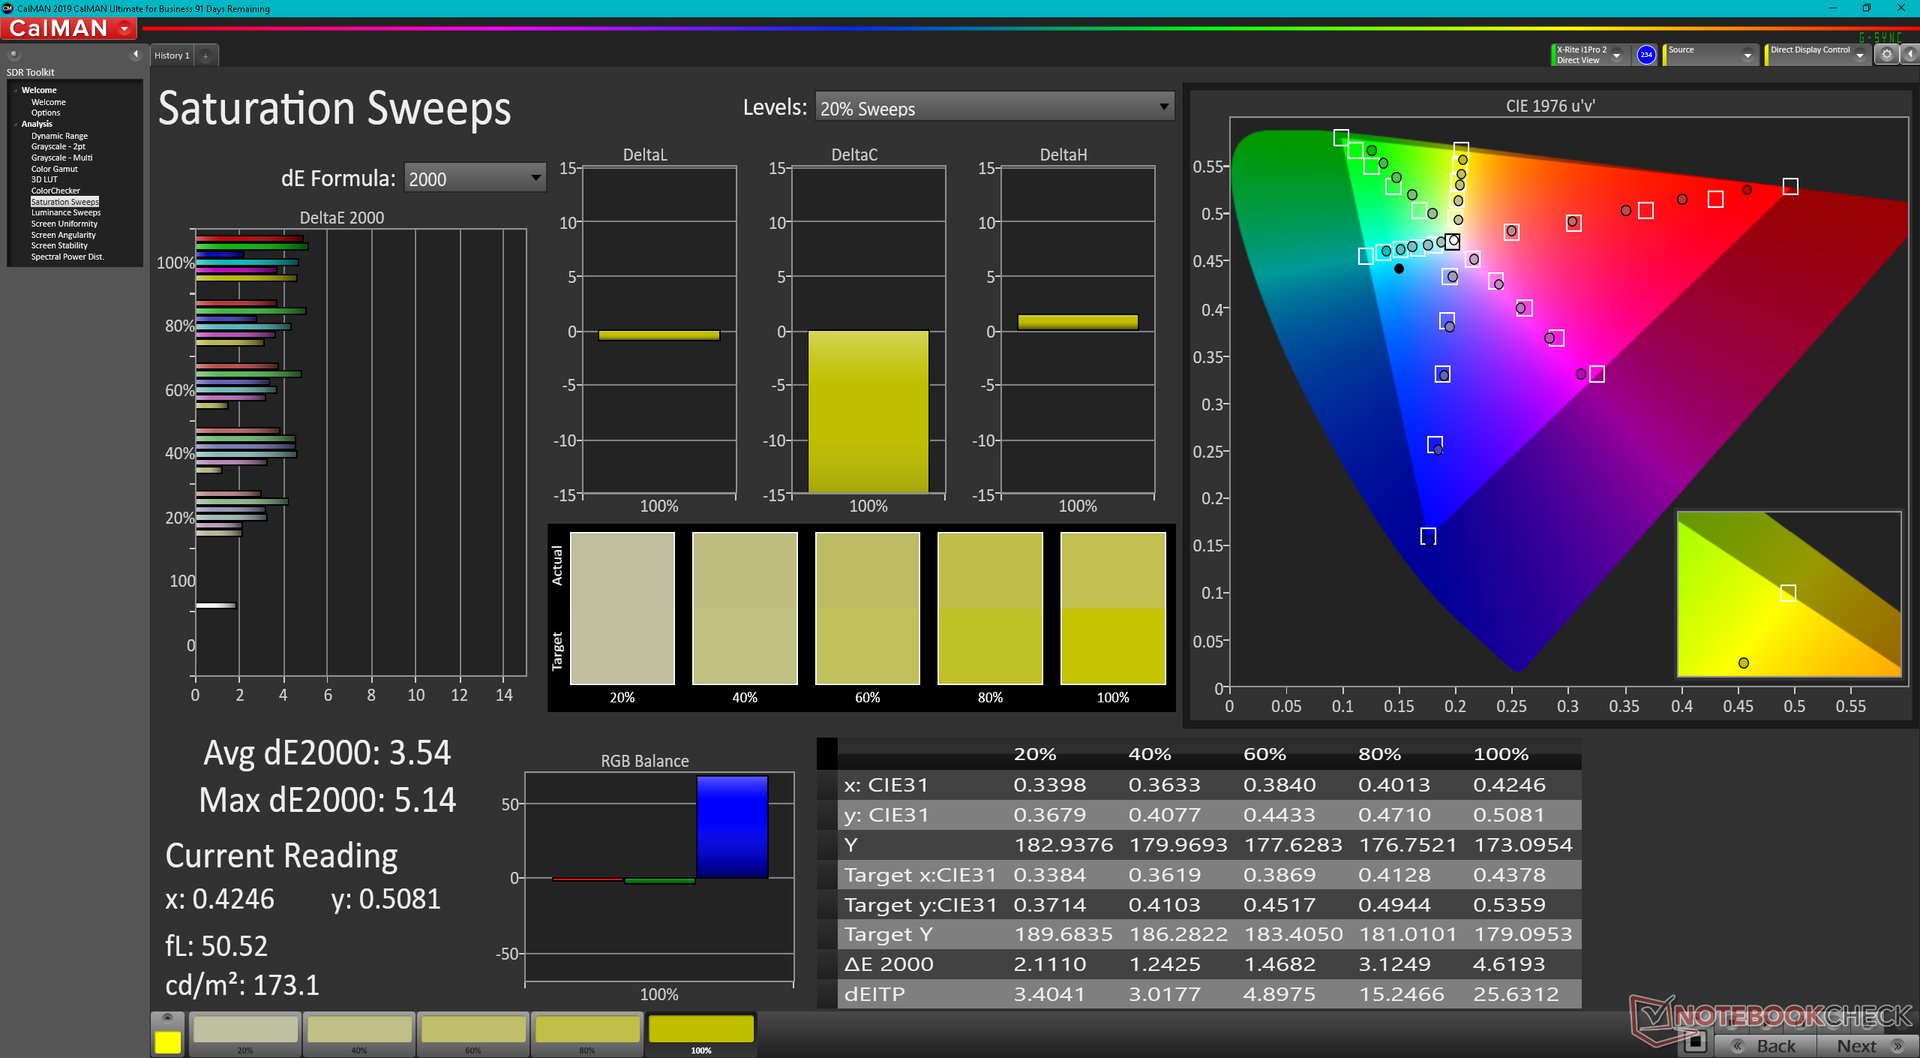
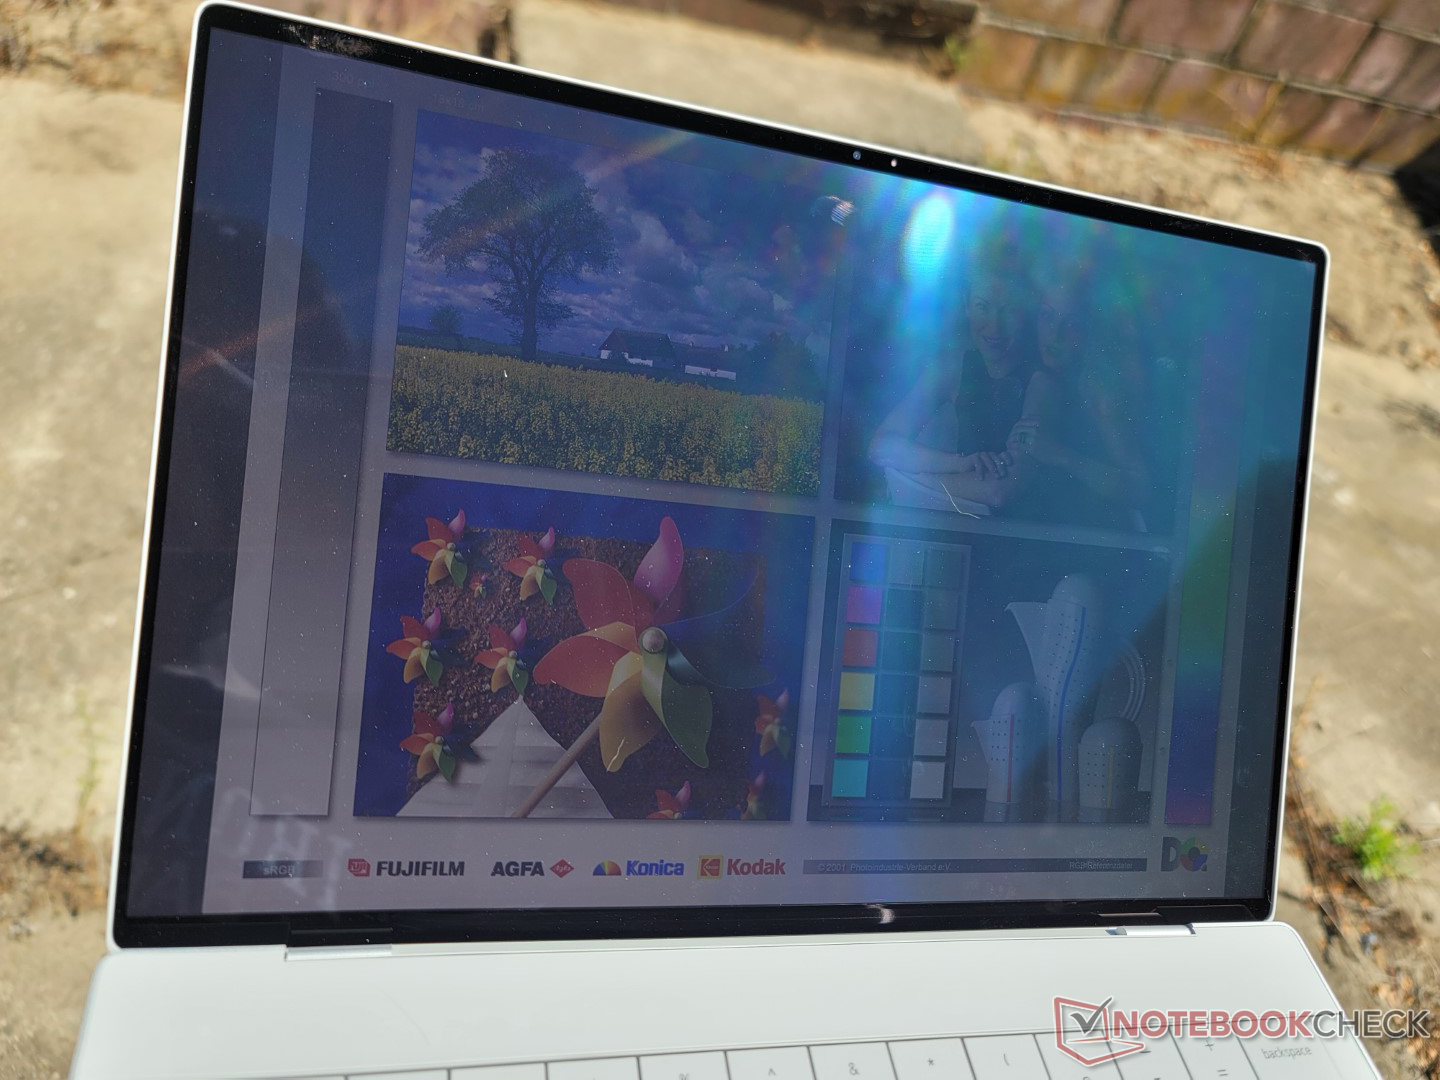
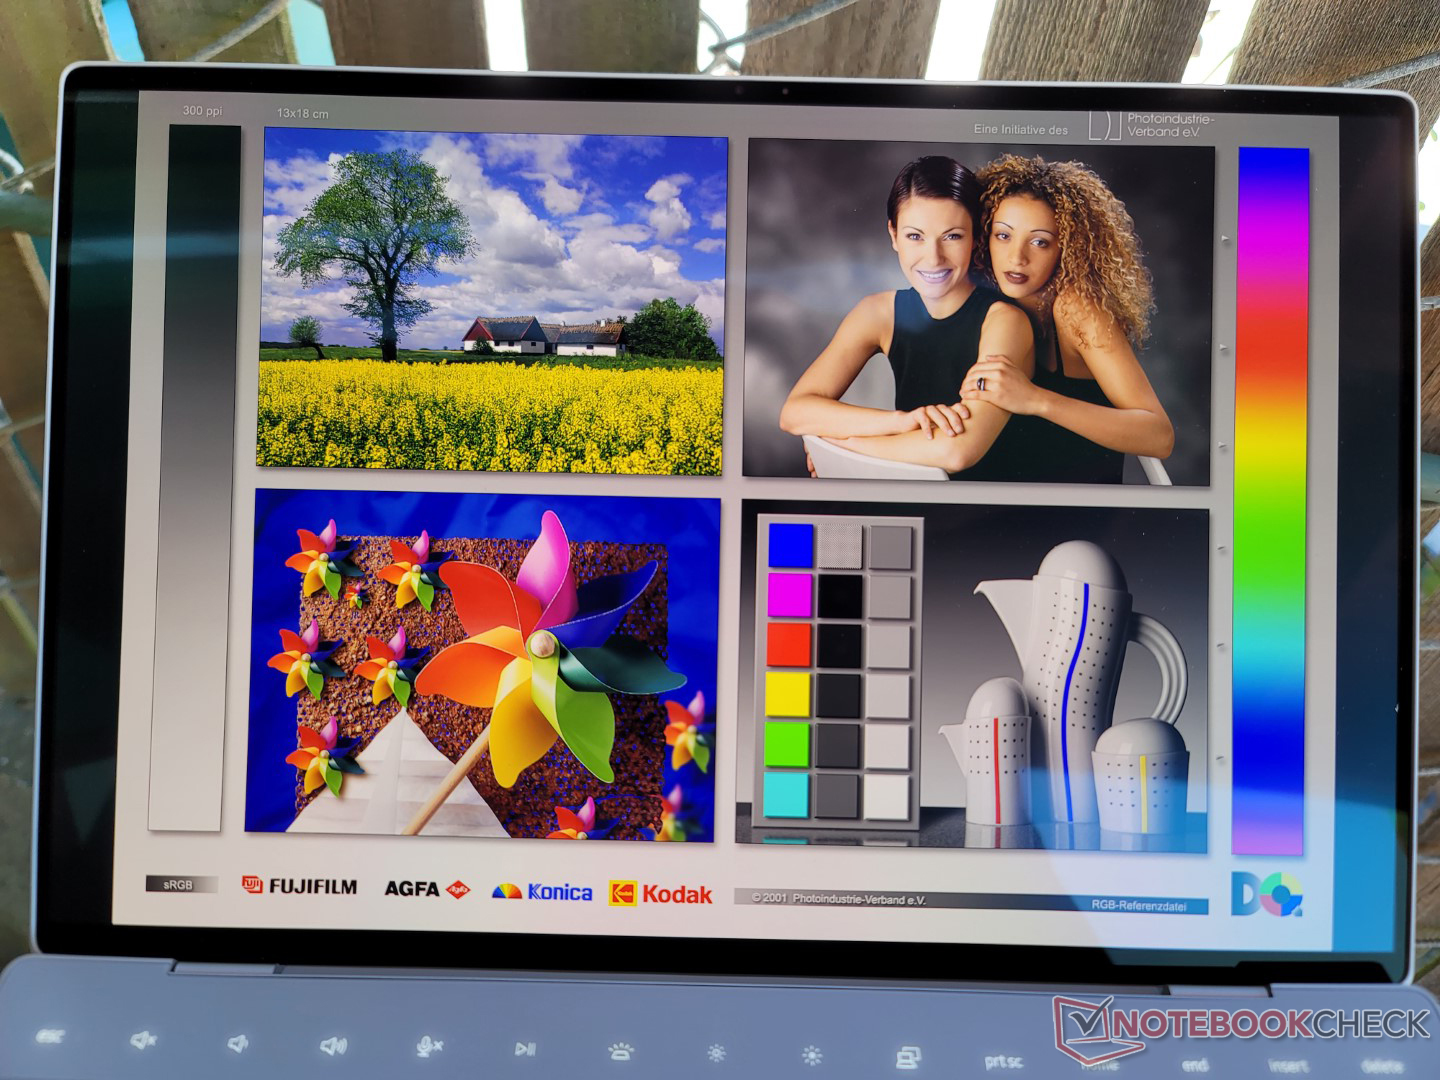
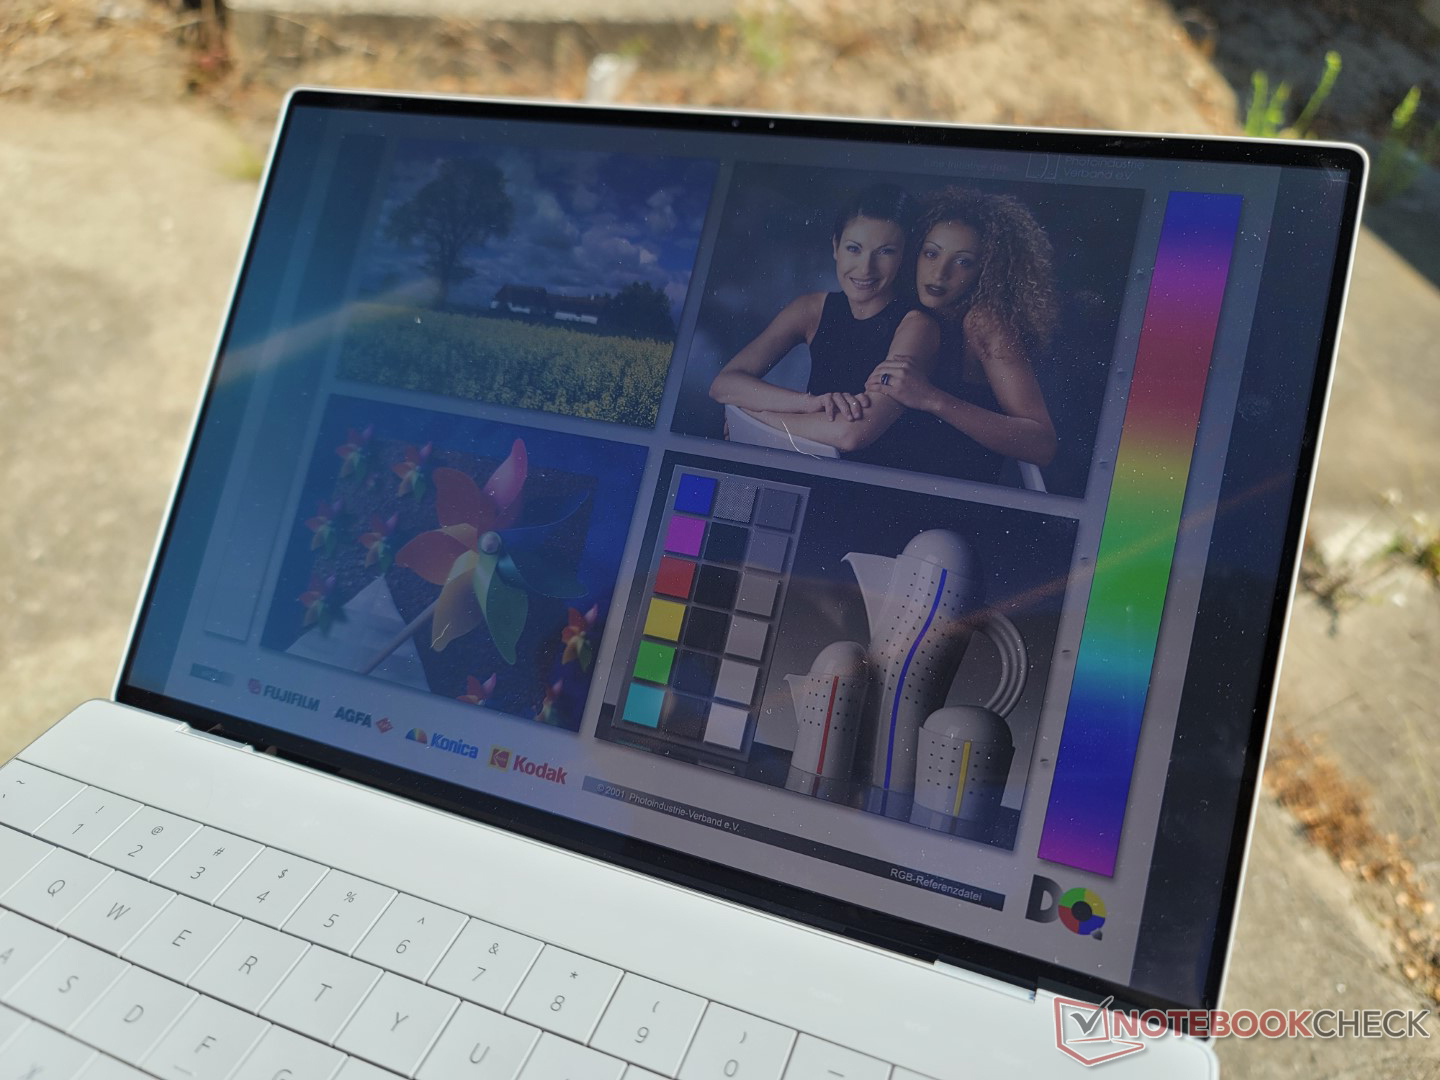
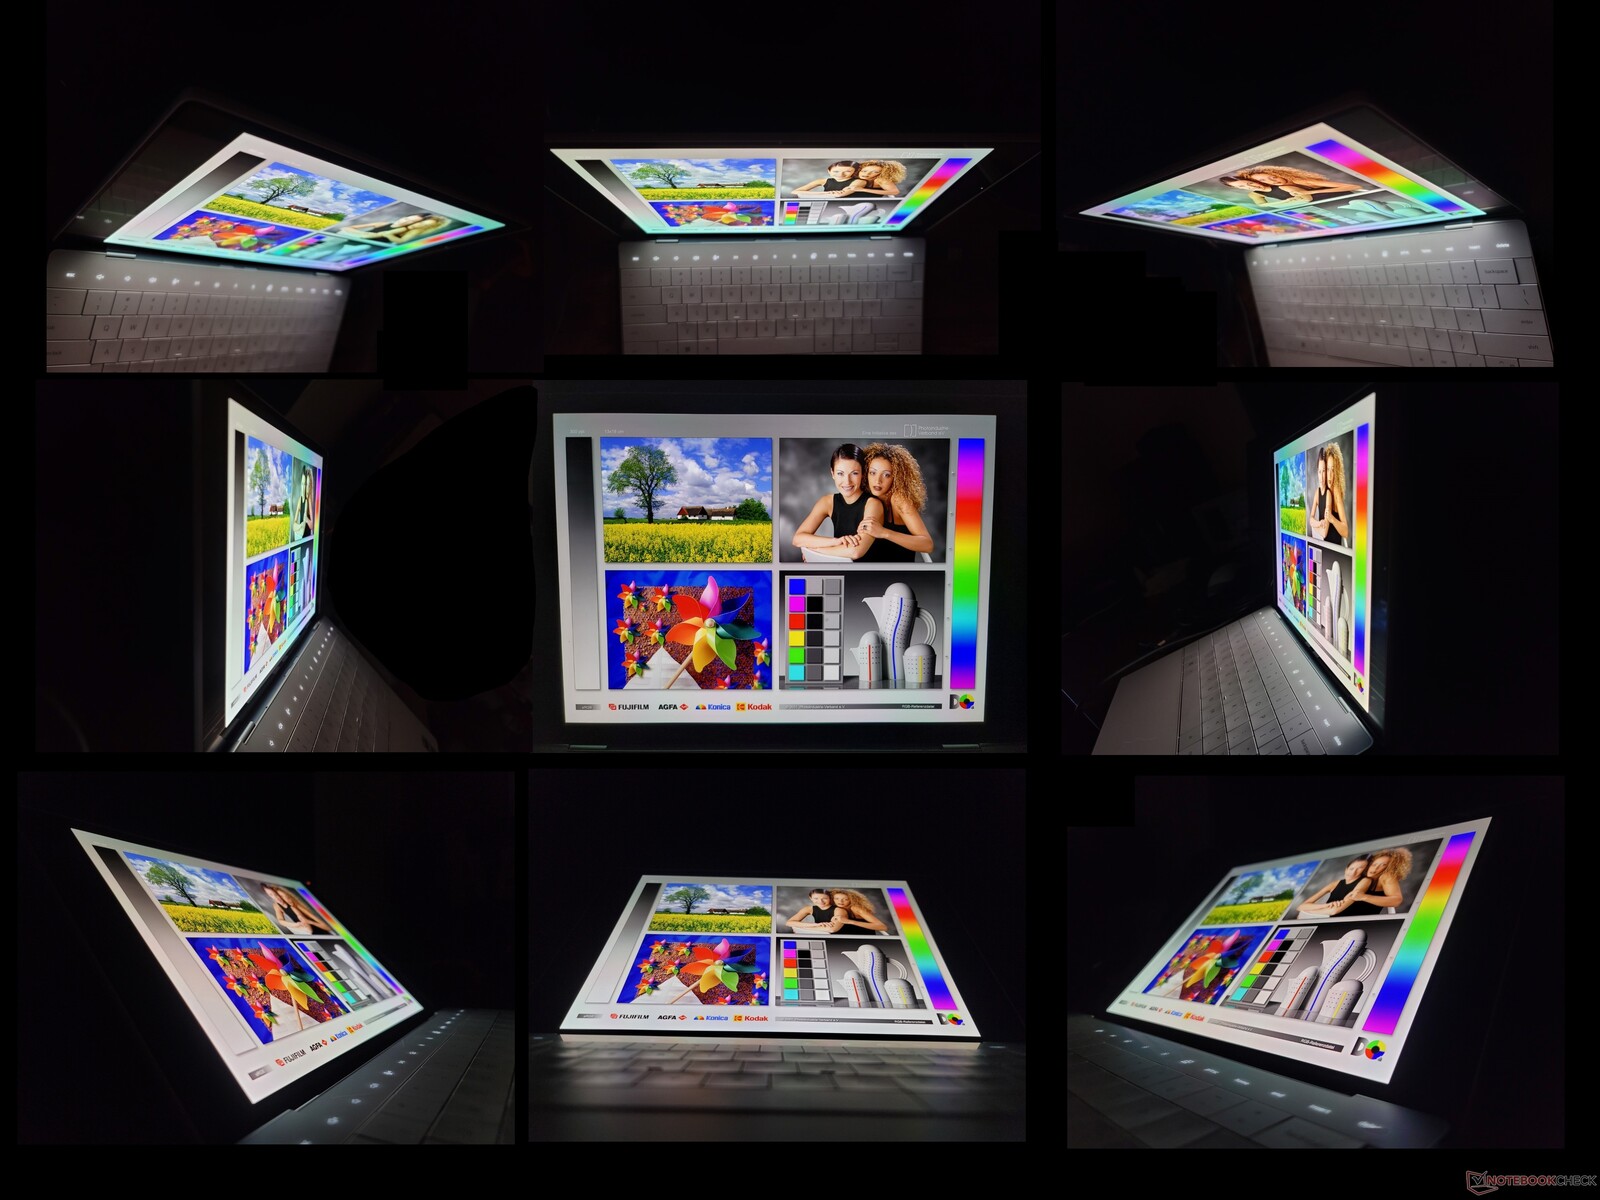
Het OLED-paneel is niet de enige optie, want het heeft zowel voor- als nadelen ten opzichte van IPS. Voordelen zijn een betere uniformiteit van de helderheid, diepere zwartniveaus, volledige P3-dekking en aanzienlijk snellere reactietijden voor zwart-wit en grijs-grijs. Nadelen zijn onder andere flikkerend scherm en een 100-nit lagere maximale helderheid. Het verschil in helderheid zou binnenshuis geen probleem moeten zijn, maar de IPS-panelen zijn iets minder schadelijk voor de ogen als u buitenshuis werkt.
Merk op dat het OLED paneel hier bijna exact hetzelfde is als het paneel dat gebruikt werd voor de laatste generatie XPS 13 9310 (Samsung 134XK04 vs. Samsung 134XK01). Als je de XPS 13 9310 OLED al eerder hebt gezien, dan weet je precies wat je kunt verwachten van de XPS 13 Plus 9320 OLED.
| |||||||||||||||||||||||||
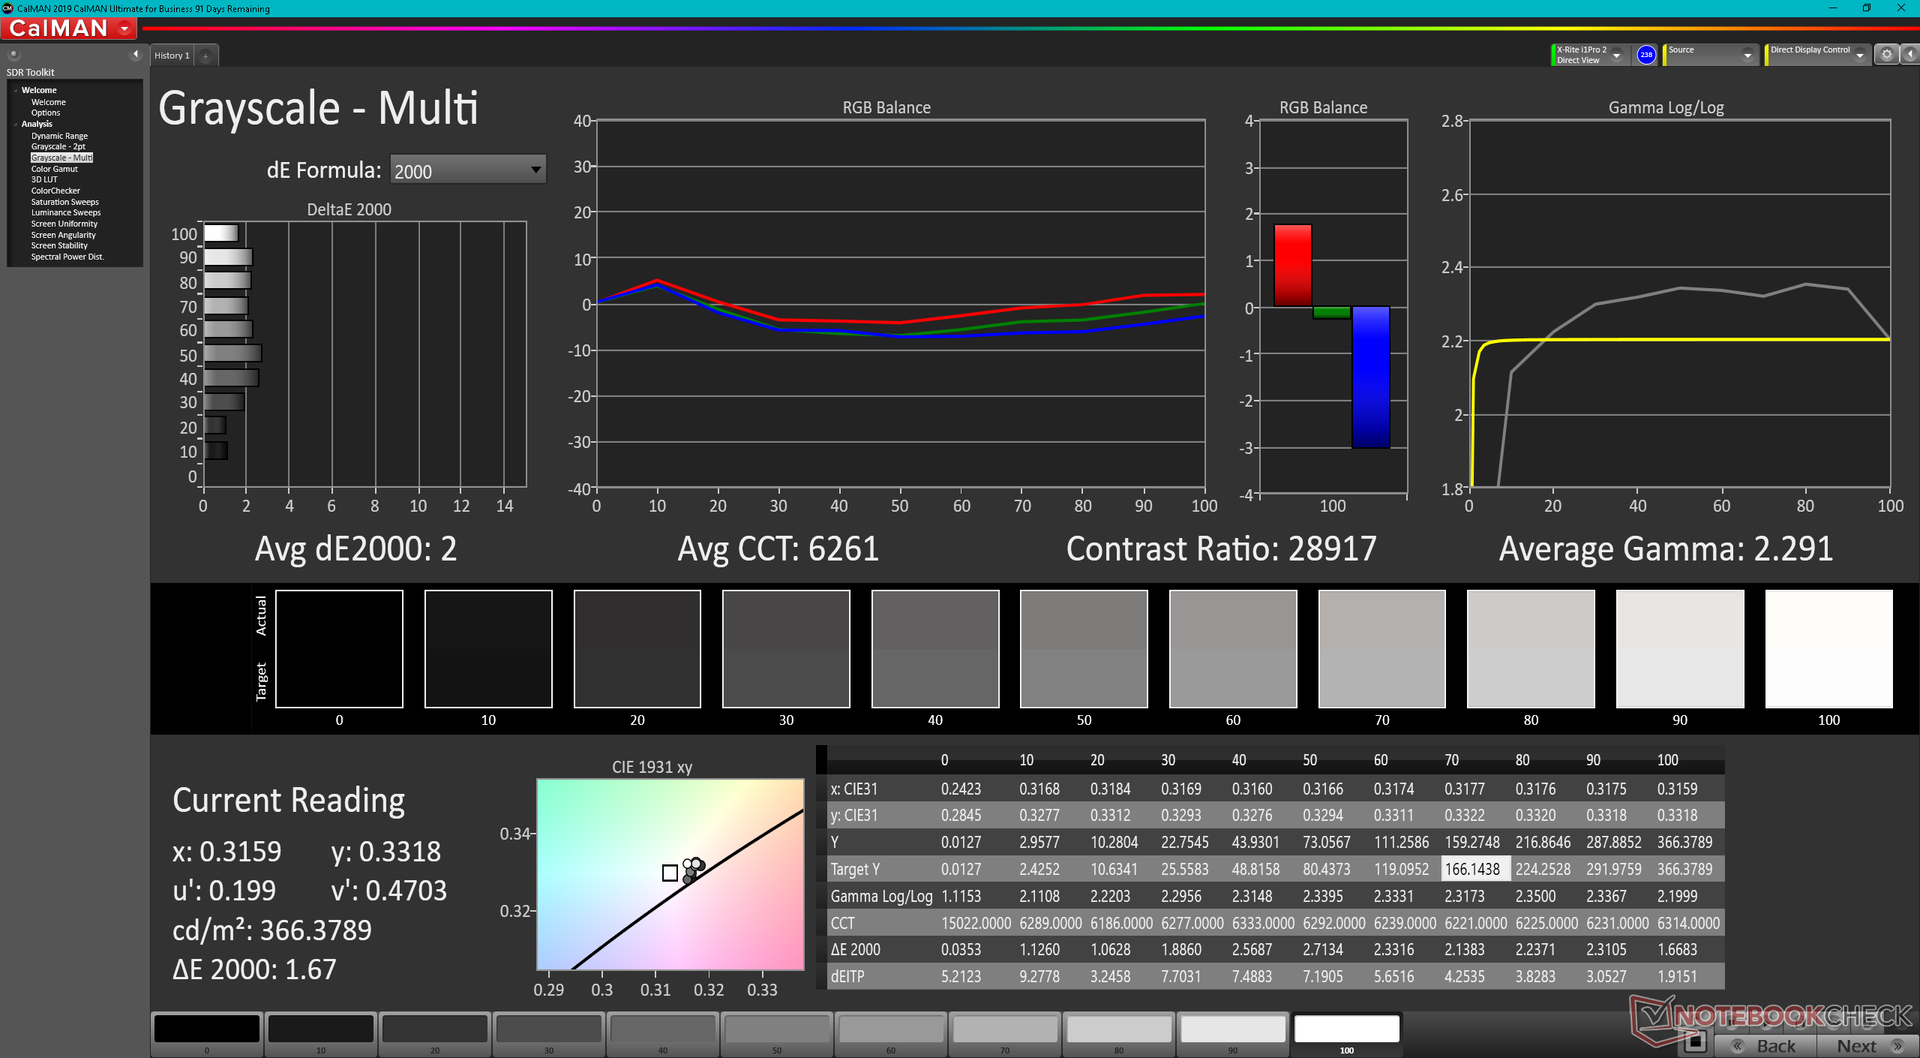
Helderheidsverdeling: 98 %
Helderheid in Batterij-modus: 371.8 cd/m²
Contrast: ∞:1 (Zwart: 0 cd/m²)
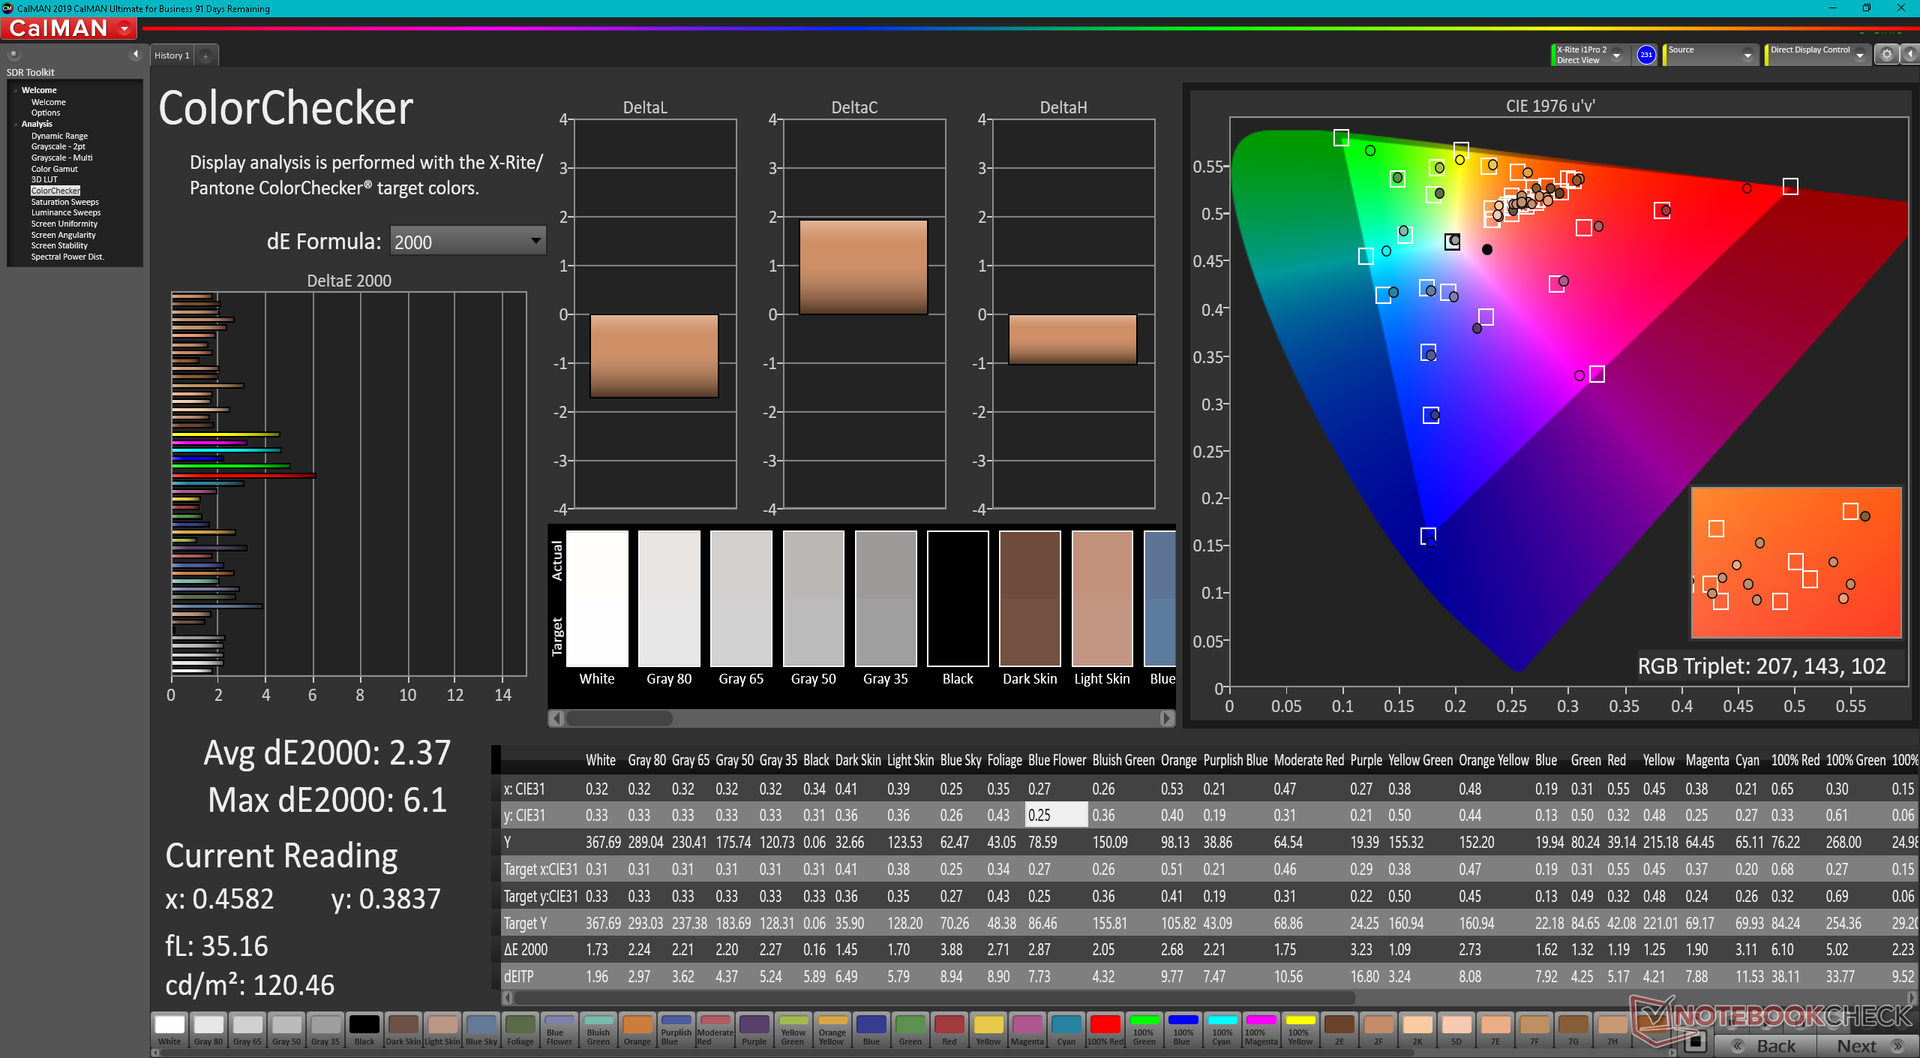
ΔE ColorChecker Calman: 2.37 | ∀{0.5-29.43 Ø4.71}
ΔE Greyscale Calman: 2 | ∀{0.09-98 Ø4.96}
98.4% AdobeRGB 1998 (Argyll 3D)
100% sRGB (Argyll 3D)
99.5% Display P3 (Argyll 3D)
Gamma: 2.29
CCT: 6261 K
| Dell XPS 13 Plus 9320 i7-1280P OLED Samsung 134XK04, OLED, 3456x2160, 13.4" | Dell XPS 13 Plus 9320 i5-1240p Sharp SHP1548 LQ134N1, IPS, 1920x1200, 13.4" | Dell XPS 13 9315, i5-1230U Sharp SHP1548 LQ134N1, IPS, 1920x1200, 13.4" | Dell XPS 13 Plus 9320 4K LQ134R1, IPS, 3840x2400, 13.4" | Dell XPS 13 9310 2-in-1 Sharp LQ134N1, IPS, 1920x1200, 13.4" | Dell XPS 13 9310 OLED Samsung 134XK01, OLED, 3456x2160, 13.4" | |
|---|---|---|---|---|---|---|
| Display | -20% | -20% | -15% | -19% | -0% | |
| Display P3 Coverage (%) | 99.5 | 69 -31% | 69 -31% | 76.5 -23% | 69.7 -30% | 99.7 0% |
| sRGB Coverage (%) | 100 | 99 -1% | 100 0% | 100 0% | 99 -1% | 100 0% |
| AdobeRGB 1998 Coverage (%) | 98.4 | 71 -28% | 71 -28% | 76 -23% | 71.7 -27% | 97.7 -1% |
| Response Times | -1266% | -1193% | -1170% | -1931% | 5% | |
| Response Time Grey 50% / Grey 80% * (ms) | 2.6 ? | 45 ? -1631% | 40 ? -1438% | 38.9 ? -1396% | 55.6 ? -2038% | 2.2 ? 15% |
| Response Time Black / White * (ms) | 2.1 ? | 21 ? -900% | 22 ? -948% | 21.9 ? -943% | 40.4 ? -1824% | 2.2 ? -5% |
| PWM Frequency (Hz) | 59.5 | 2500 ? | 240.4 ? | |||
| Screen | -23% | -10% | -2% | -44% | -14% | |
| Brightness middle (cd/m²) | 371.8 | 498 34% | 466 25% | 494 33% | 555.7 49% | 384 3% |
| Brightness (cd/m²) | 374 | 460 23% | 442 18% | 474 27% | 528 41% | 387 3% |
| Brightness Distribution (%) | 98 | 85 -13% | 89 -9% | 89 -9% | 90 -8% | 97 -1% |
| Black Level * (cd/m²) | 0.53 | 0.4 | 0.28 | 0.35 | ||
| Colorchecker dE 2000 * | 2.37 | 3.65 -54% | 3.03 -28% | 3.1 -31% | 4.83 -104% | 4.56 -92% |
| Colorchecker dE 2000 max. * | 6.1 | 7.11 -17% | 6.68 -10% | 4.2 31% | 8.46 -39% | 7.27 -19% |
| Greyscale dE 2000 * | 2 | 4.25 -113% | 3.12 -56% | 3.2 -60% | 6.1 -205% | 1.5 25% |
| Gamma | 2.29 96% | 2.45 90% | 2.41 91% | 2.41 91% | 1.98 111% | 2.26 97% |
| CCT | 6261 104% | 6690 97% | 6418 101% | 6189 105% | 6686 97% | 6219 105% |
| Contrast (:1) | 940 | 1165 | 1764 | 1588 | ||
| Colorchecker dE 2000 calibrated * | 2.16 | 2.34 | 1.5 | 0.76 | 4.52 | |
| Color Space (Percent of AdobeRGB 1998) (%) | 87.1 | |||||
| Color Space (Percent of sRGB) (%) | 100 | |||||
| Totaal Gemiddelde (Programma / Instellingen) | -436% /
-248% | -408% /
-228% | -396% /
-218% | -665% /
-381% | -3% /
-7% |
* ... kleiner is beter
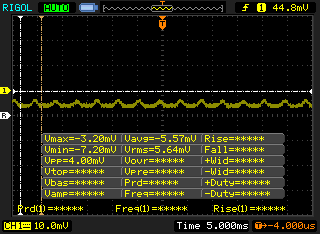
Responstijd Scherm
| ↔ Responstijd Zwart naar Wit | ||
|---|---|---|
| 2.1 ms ... stijging ↗ en daling ↘ gecombineerd | ↗ 0.8 ms stijging | 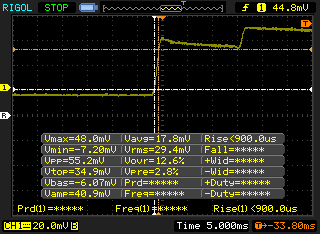 |
| ↘ 1.3 ms daling | ||
| Het scherm vertoonde erg snelle responstijden in onze tests en zou zeer geschikt moeten zijn voor snelle games. Ter vergelijking: alle testtoestellen variëren van 0.1 (minimum) tot 240 (maximum) ms. » 12 % van alle toestellen zijn beter. Dit betekent dat de gemeten responstijd beter is dan het gemiddelde (19.8 ms) van alle geteste toestellen. | ||
| ↔ Responstijd 50% Grijs naar 80% Grijs | ||
| 2.6 ms ... stijging ↗ en daling ↘ gecombineerd | ↗ 1.3 ms stijging | 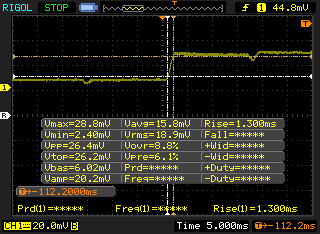 |
| ↘ 1.3 ms daling | ||
| Het scherm vertoonde erg snelle responstijden in onze tests en zou zeer geschikt moeten zijn voor snelle games. Ter vergelijking: alle testtoestellen variëren van 0.165 (minimum) tot 636 (maximum) ms. » 12 % van alle toestellen zijn beter. Dit betekent dat de gemeten responstijd beter is dan het gemiddelde (31 ms) van alle geteste toestellen. | ||
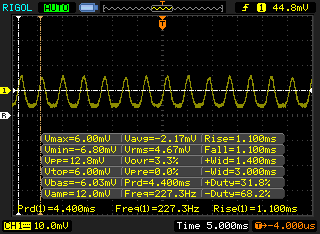
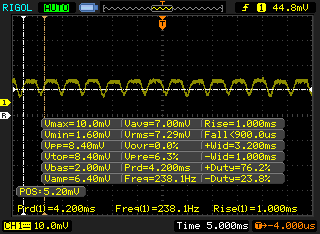
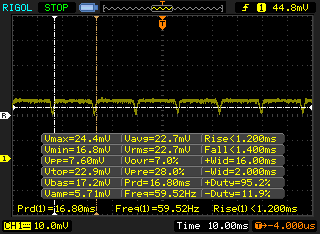
Screen Flickering / PWM (Pulse-Width Modulation)
| Screen flickering / PWM waargenomen | 59.5 Hz | 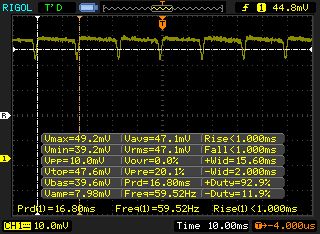 | |
De achtergrondverlichting van het scherm flikkert op 59.5 Hz (in het slechtste geval, bijvoorbeeld bij gebruik van PWM) . De frequentie van 59.5 Hz is erg laag en kan dus aanleiding geven tot geïrriteerde ogen en hoofdpijn bij langer gebruik. Ter vergelijking: 52 % van alle geteste toestellen maakten geen gebruik van PWM om de schermhelderheid te verlagen. Als het wel werd gebruikt, werd een gemiddelde van 7754 (minimum: 5 - maximum: 343500) Hz waargenomen. | |||
Net als bijna elke andere laptop met een OLED paneel, vertoont het paneel hier flikkering of pulse-width modulation. De frequentie is ingesteld op 227,3 Hz van 0 tot 52 procent helderheid om vervolgens te veranderen naar 59,5 Hz van 53 tot 100 procent helderheid. Als uw ogen gevoelig zijn voor flikkeren, dan kunt u wellicht beter de IPS SKU's overwegen.

Prestaties
Testomstandigheden
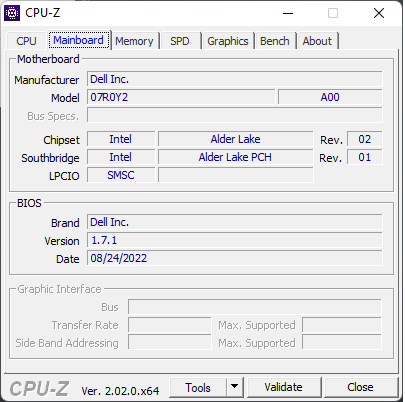
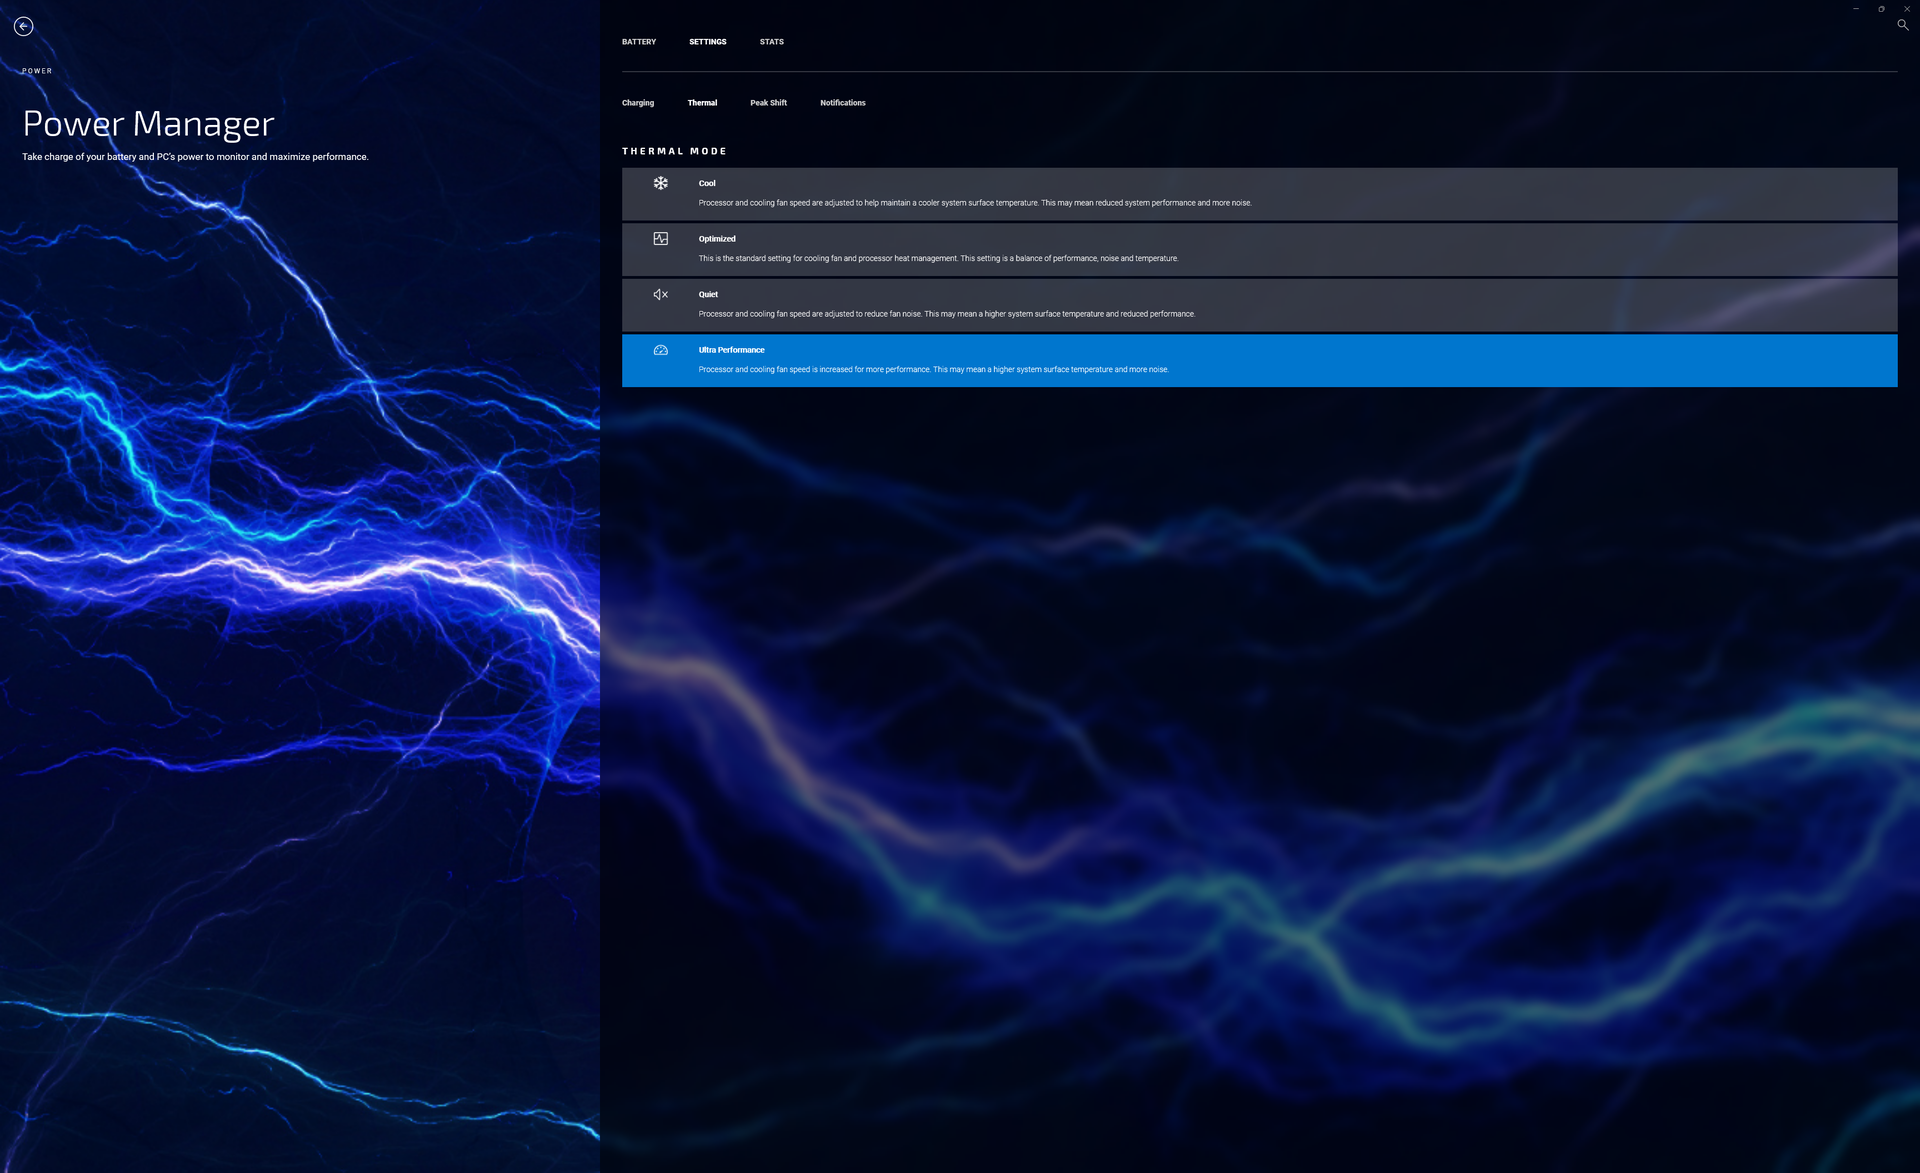
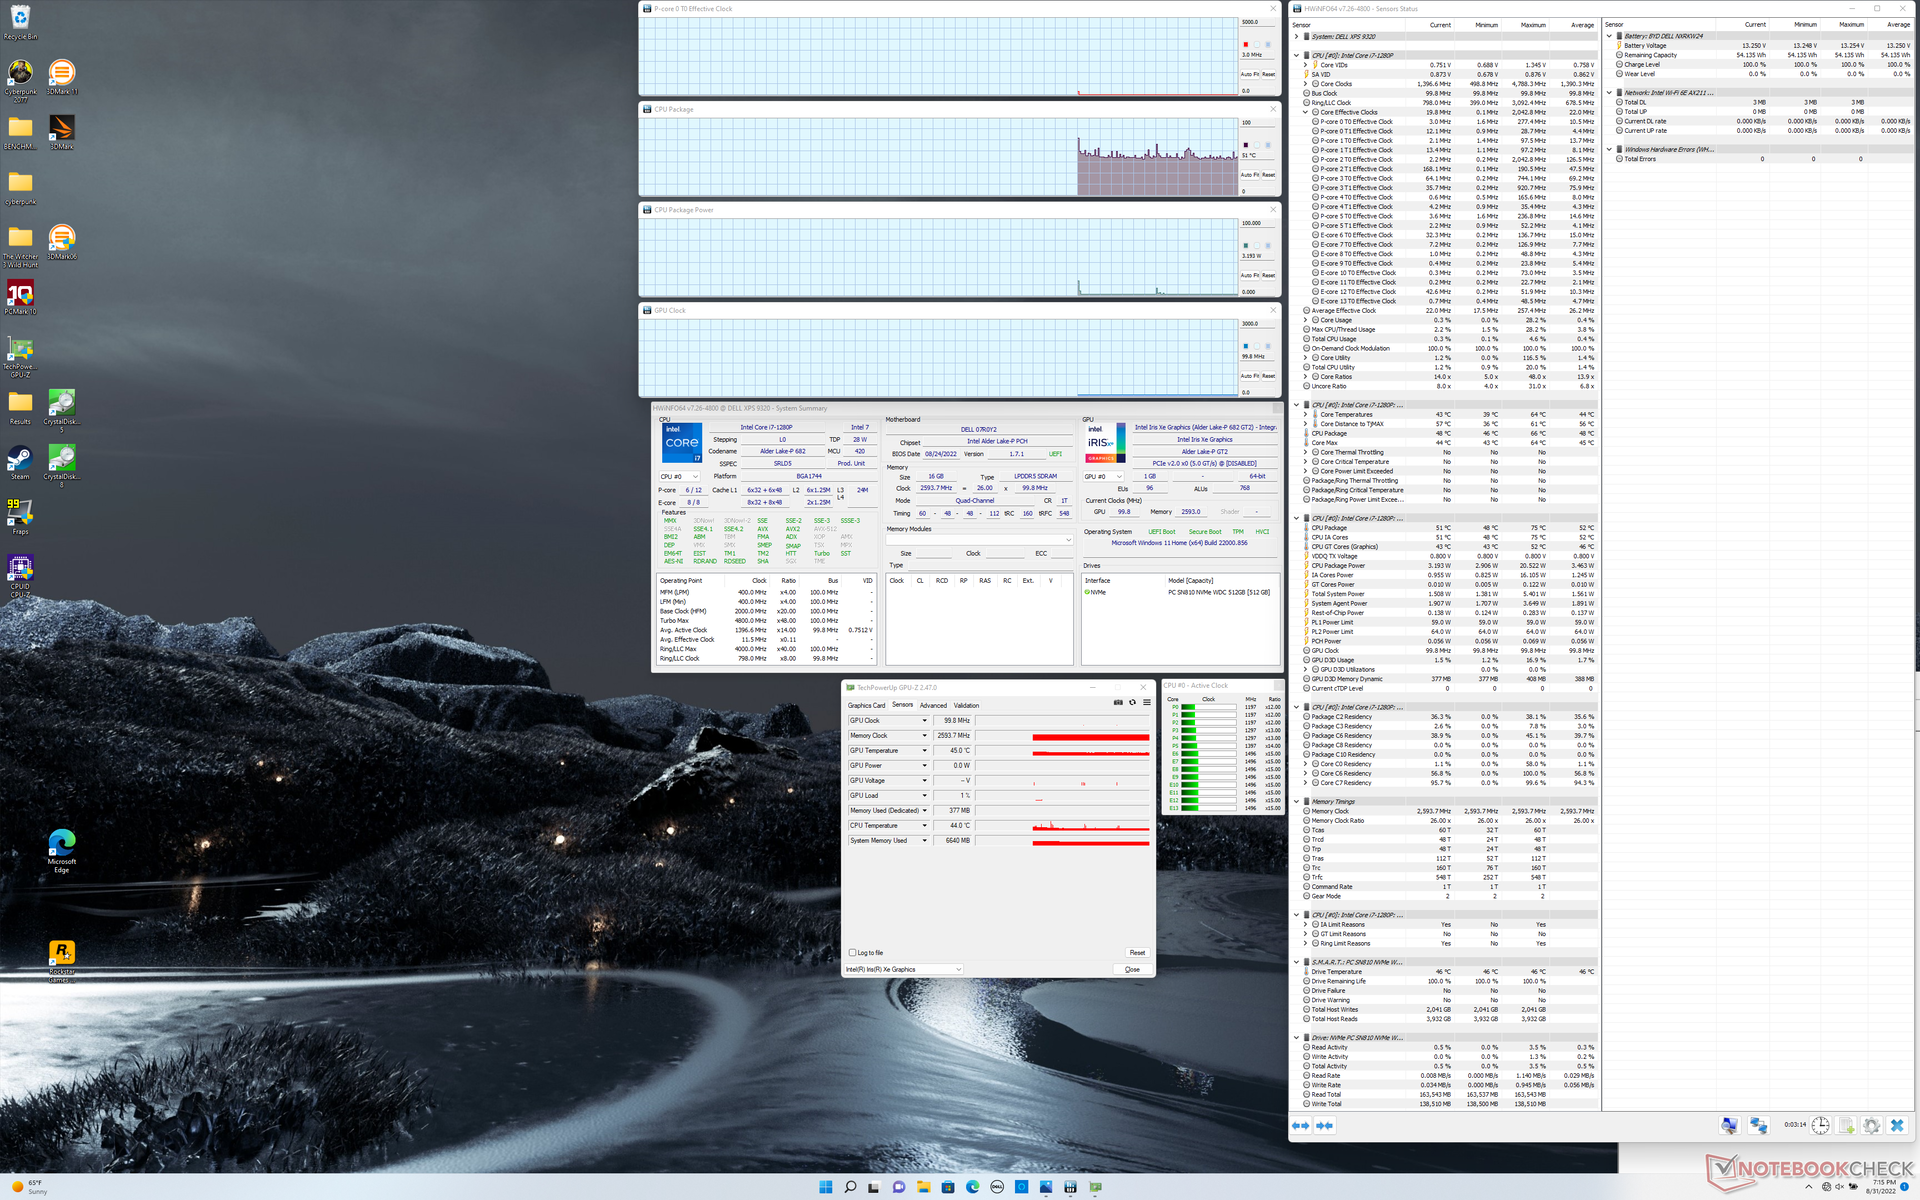
Wij hebben ons apparaat via Windows ingesteld op de modus Prestaties en via de My Dell software op de modus Ultraprestaties voordat wij onderstaande benchmarks uitvoerden. Het wordt aanbevolen dat gebruikers vertrouwd raken met Mijn Dell, aangezien dit het controlecentrum voor de laptop is.
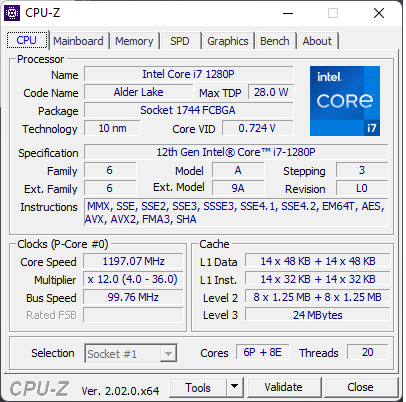
Processor
Multi-thread prestaties zijn ongeveer 15 procent sneller dan de Core i7-1260P configuratie of ongeveer 25 tot 30 procent sneller dan de Core i5-1240P configuratie. Het is echter interessant om op te merken dat onze Core i7-1280P onder de Core i7-1260P kan duiken wanneer hij aan langdurige stresstests wordt onderworpen. Onze CineBench R15 xT loop testresultaten hieronder laten zien dat de i7-1280P het de eerste paar keer beter doet dan de i7-1260P, voordat hij uiteindelijk bijna 8 procent langzamer wordt.
Cinebench R15 Multi Loop
Cinebench R23: Multi Core | Single Core
Cinebench R15: CPU Multi 64Bit | CPU Single 64Bit
Blender: v2.79 BMW27 CPU
7-Zip 18.03: 7z b 4 | 7z b 4 -mmt1
Geekbench 5.5: Multi-Core | Single-Core
HWBOT x265 Benchmark v2.2: 4k Preset
LibreOffice : 20 Documents To PDF
R Benchmark 2.5: Overall mean
| Cinebench R20 / CPU (Multi Core) | |
| Gemiddeld Intel Core i7-1280P (3283 - 5415, n=8) | |
| Dell XPS 13 Plus 9320 i7-1280P OLED | |
| Dell XPS 13 Plus 9320 4K | |
| Dell XPS 13 Plus 9320 i5-1240p | |
| Dell XPS 13 9310 OLED | |
| Dell XPS 13 9315, i5-1230U | |
| Dell XPS 13 9310 2-in-1 | |
| Cinebench R20 / CPU (Single Core) | |
| Dell XPS 13 Plus 9320 4K | |
| Gemiddeld Intel Core i7-1280P (615 - 701, n=8) | |
| Dell XPS 13 Plus 9320 i7-1280P OLED | |
| Dell XPS 13 Plus 9320 i5-1240p | |
| Dell XPS 13 9310 OLED | |
| Dell XPS 13 9310 2-in-1 | |
| Dell XPS 13 9315, i5-1230U | |
| Cinebench R23 / Multi Core | |
| Dell XPS 13 Plus 9320 i7-1280P OLED | |
| Gemiddeld Intel Core i7-1280P (8632 - 14803, n=8) | |
| Dell XPS 13 Plus 9320 4K | |
| Dell XPS 13 Plus 9320 i5-1240p | |
| Dell XPS 13 9310 OLED | |
| Dell XPS 13 9310 2-in-1 | |
| Dell XPS 13 9315, i5-1230U | |
| Cinebench R23 / Single Core | |
| Dell XPS 13 Plus 9320 4K | |
| Gemiddeld Intel Core i7-1280P (1609 - 1787, n=7) | |
| Dell XPS 13 Plus 9320 i5-1240p | |
| Dell XPS 13 Plus 9320 i7-1280P OLED | |
| Dell XPS 13 9310 OLED | |
| Dell XPS 13 9310 2-in-1 | |
| Dell XPS 13 9315, i5-1230U | |
| Cinebench R15 / CPU Multi 64Bit | |
| Gemiddeld Intel Core i7-1280P (1905 - 2332, n=7) | |
| Dell XPS 13 Plus 9320 i7-1280P OLED | |
| Dell XPS 13 Plus 9320 4K | |
| Dell XPS 13 Plus 9320 4K | |
| Dell XPS 13 Plus 9320 i5-1240p | |
| Dell XPS 13 9310 OLED | |
| Dell XPS 13 9310 2-in-1 | |
| Dell XPS 13 9315, i5-1230U | |
| Cinebench R15 / CPU Single 64Bit | |
| Dell XPS 13 Plus 9320 4K | |
| Gemiddeld Intel Core i7-1280P (203 - 258, n=7) | |
| Dell XPS 13 Plus 9320 i7-1280P OLED | |
| Dell XPS 13 Plus 9320 i5-1240p | |
| Dell XPS 13 9310 OLED | |
| Dell XPS 13 9315, i5-1230U | |
| Dell XPS 13 9310 2-in-1 | |
| Blender / v2.79 BMW27 CPU | |
| Dell XPS 13 9310 2-in-1 | |
| Dell XPS 13 9310 OLED | |
| Dell XPS 13 Plus 9320 i5-1240p | |
| Dell XPS 13 Plus 9320 4K | |
| Gemiddeld Intel Core i7-1280P (259 - 309, n=7) | |
| Dell XPS 13 Plus 9320 i7-1280P OLED | |
| 7-Zip 18.03 / 7z b 4 | |
| Gemiddeld Intel Core i7-1280P (45292 - 53710, n=7) | |
| Dell XPS 13 Plus 9320 i7-1280P OLED | |
| Dell XPS 13 Plus 9320 4K | |
| Dell XPS 13 Plus 9320 i5-1240p | |
| Dell XPS 13 9310 2-in-1 | |
| Dell XPS 13 9315, i5-1230U | |
| Dell XPS 13 9310 OLED | |
| 7-Zip 18.03 / 7z b 4 -mmt1 | |
| Gemiddeld Intel Core i7-1280P (4995 - 5874, n=7) | |
| Dell XPS 13 Plus 9320 4K | |
| Dell XPS 13 9310 2-in-1 | |
| Dell XPS 13 Plus 9320 i7-1280P OLED | |
| Dell XPS 13 Plus 9320 i5-1240p | |
| Dell XPS 13 9315, i5-1230U | |
| Dell XPS 13 9310 OLED | |
| Geekbench 5.5 / Multi-Core | |
| Dell XPS 13 Plus 9320 i7-1280P OLED | |
| Gemiddeld Intel Core i7-1280P (9623 - 11811, n=7) | |
| Dell XPS 13 Plus 9320 4K | |
| Dell XPS 13 9315, i5-1230U | |
| Dell XPS 13 9310 OLED | |
| Dell XPS 13 Plus 9320 i5-1240p | |
| Geekbench 5.5 / Single-Core | |
| Dell XPS 13 Plus 9320 i7-1280P OLED | |
| Dell XPS 13 Plus 9320 4K | |
| Gemiddeld Intel Core i7-1280P (1571 - 1802, n=7) | |
| Dell XPS 13 9315, i5-1230U | |
| Dell XPS 13 Plus 9320 i5-1240p | |
| Dell XPS 13 9310 OLED | |
| HWBOT x265 Benchmark v2.2 / 4k Preset | |
| Dell XPS 13 Plus 9320 i7-1280P OLED | |
| Gemiddeld Intel Core i7-1280P (9.62 - 14.5, n=5) | |
| Dell XPS 13 Plus 9320 4K | |
| Dell XPS 13 Plus 9320 i5-1240p | |
| Dell XPS 13 9310 OLED | |
| Dell XPS 13 9310 2-in-1 | |
| LibreOffice / 20 Documents To PDF | |
| Dell XPS 13 Plus 9320 i5-1240p | |
| Gemiddeld Intel Core i7-1280P (41 - 61.6, n=8) | |
| Dell XPS 13 Plus 9320 i7-1280P OLED | |
| Dell XPS 13 Plus 9320 4K | |
| Dell XPS 13 9310 OLED | |
| R Benchmark 2.5 / Overall mean | |
| Dell XPS 13 9310 2-in-1 | |
| Dell XPS 13 9310 OLED | |
| Dell XPS 13 Plus 9320 i5-1240p | |
| Dell XPS 13 Plus 9320 i7-1280P OLED | |
| Dell XPS 13 Plus 9320 4K | |
| Gemiddeld Intel Core i7-1280P (0.4505 - 0.512, n=7) | |
* ... kleiner is beter
AIDA64: FP32 Ray-Trace | FPU Julia | CPU SHA3 | CPU Queen | FPU SinJulia | FPU Mandel | CPU AES | CPU ZLib | FP64 Ray-Trace | CPU PhotoWorxx
| Performance rating | |
| Dell XPS 13 Plus 9320 i7-1280P OLED | |
| Gemiddeld Intel Core i7-1280P | |
| Dell XPS 13 Plus 9320 4K | |
| Dell XPS 13 Plus 9320 i5-1240p | |
| Dell XPS 13 9310 2-in-1 | |
| Dell XPS 13 9310 OLED | |
| Dell XPS 13 9315, i5-1230U | |
| AIDA64 / FP32 Ray-Trace | |
| Dell XPS 13 Plus 9320 i7-1280P OLED | |
| Gemiddeld Intel Core i7-1280P (7466 - 13068, n=6) | |
| Dell XPS 13 9310 2-in-1 | |
| Dell XPS 13 9310 OLED | |
| Dell XPS 13 Plus 9320 4K | |
| Dell XPS 13 Plus 9320 i5-1240p | |
| Dell XPS 13 9315, i5-1230U | |
| AIDA64 / FPU Julia | |
| Dell XPS 13 Plus 9320 i7-1280P OLED | |
| Gemiddeld Intel Core i7-1280P (38904 - 66081, n=6) | |
| Dell XPS 13 9310 2-in-1 | |
| Dell XPS 13 Plus 9320 4K | |
| Dell XPS 13 Plus 9320 i5-1240p | |
| Dell XPS 13 9310 OLED | |
| Dell XPS 13 9315, i5-1230U | |
| AIDA64 / CPU SHA3 | |
| Dell XPS 13 Plus 9320 i7-1280P OLED | |
| Gemiddeld Intel Core i7-1280P (1826 - 2992, n=6) | |
| Dell XPS 13 9310 2-in-1 | |
| Dell XPS 13 Plus 9320 4K | |
| Dell XPS 13 Plus 9320 i5-1240p | |
| Dell XPS 13 9310 OLED | |
| Dell XPS 13 9315, i5-1230U | |
| AIDA64 / CPU Queen | |
| Gemiddeld Intel Core i7-1280P (80180 - 100358, n=6) | |
| Dell XPS 13 Plus 9320 i7-1280P OLED | |
| Dell XPS 13 Plus 9320 4K | |
| Dell XPS 13 Plus 9320 i5-1240p | |
| Dell XPS 13 9315, i5-1230U | |
| Dell XPS 13 9310 2-in-1 | |
| Dell XPS 13 9310 OLED | |
| AIDA64 / FPU SinJulia | |
| Dell XPS 13 Plus 9320 i7-1280P OLED | |
| Gemiddeld Intel Core i7-1280P (5880 - 8571, n=6) | |
| Dell XPS 13 Plus 9320 4K | |
| Dell XPS 13 Plus 9320 i5-1240p | |
| Dell XPS 13 9310 2-in-1 | |
| Dell XPS 13 9310 OLED | |
| Dell XPS 13 9315, i5-1230U | |
| AIDA64 / FPU Mandel | |
| Dell XPS 13 Plus 9320 i7-1280P OLED | |
| Gemiddeld Intel Core i7-1280P (18907 - 32766, n=6) | |
| Dell XPS 13 9310 2-in-1 | |
| Dell XPS 13 Plus 9320 i5-1240p | |
| Dell XPS 13 Plus 9320 4K | |
| Dell XPS 13 9310 OLED | |
| Dell XPS 13 9315, i5-1230U | |
| AIDA64 / CPU AES | |
| Dell XPS 13 9310 2-in-1 | |
| Gemiddeld Intel Core i7-1280P (40691 - 99367, n=6) | |
| Dell XPS 13 Plus 9320 i7-1280P OLED | |
| Dell XPS 13 9310 OLED | |
| Dell XPS 13 Plus 9320 i5-1240p | |
| Dell XPS 13 Plus 9320 4K | |
| Dell XPS 13 9315, i5-1230U | |
| AIDA64 / CPU ZLib | |
| Gemiddeld Intel Core i7-1280P (540 - 880, n=6) | |
| Dell XPS 13 Plus 9320 i7-1280P OLED | |
| Dell XPS 13 Plus 9320 4K | |
| Dell XPS 13 Plus 9320 i5-1240p | |
| Dell XPS 13 9310 2-in-1 | |
| Dell XPS 13 9315, i5-1230U | |
| Dell XPS 13 9310 OLED | |
| AIDA64 / FP64 Ray-Trace | |
| Dell XPS 13 Plus 9320 i7-1280P OLED | |
| Gemiddeld Intel Core i7-1280P (4006 - 7184, n=6) | |
| Dell XPS 13 9310 2-in-1 | |
| Dell XPS 13 9310 OLED | |
| Dell XPS 13 Plus 9320 4K | |
| Dell XPS 13 Plus 9320 i5-1240p | |
| Dell XPS 13 9315, i5-1230U | |
| AIDA64 / CPU PhotoWorxx | |
| Dell XPS 13 Plus 9320 i7-1280P OLED | |
| Gemiddeld Intel Core i7-1280P (36663 - 48416, n=6) | |
| Dell XPS 13 Plus 9320 4K | |
| Dell XPS 13 9310 2-in-1 | |
| Dell XPS 13 Plus 9320 i5-1240p | |
| Dell XPS 13 9310 OLED | |
| Dell XPS 13 9315, i5-1230U | |
Systeemprestaties
CrossMark: Overall | Productivity | Creativity | Responsiveness
| PCMark 10 / Score | |
| Gemiddelde van klas Subnotebook (4920 - 9939, n=45, laatste 2 jaar) | |
| Dell XPS 13 Plus 9320 i7-1280P OLED | |
| Gemiddeld Intel Core i7-1280P, Intel Iris Xe Graphics G7 96EUs (5410 - 5994, n=4) | |
| Dell XPS 13 Plus 9320 4K | |
| Dell XPS 13 9310 OLED | |
| Dell XPS 13 9310 2-in-1 | |
| Dell XPS 13 Plus 9320 i5-1240p | |
| Dell XPS 13 9315, i5-1230U | |
| PCMark 10 / Essentials | |
| Dell XPS 13 9310 OLED | |
| Dell XPS 13 9310 2-in-1 | |
| Dell XPS 13 Plus 9320 i7-1280P OLED | |
| Gemiddelde van klas Subnotebook (8552 - 11646, n=45, laatste 2 jaar) | |
| Dell XPS 13 Plus 9320 4K | |
| Gemiddeld Intel Core i7-1280P, Intel Iris Xe Graphics G7 96EUs (9719 - 10920, n=4) | |
| Dell XPS 13 9315, i5-1230U | |
| Dell XPS 13 Plus 9320 i5-1240p | |
| PCMark 10 / Productivity | |
| Gemiddelde van klas Subnotebook (5435 - 16606, n=45, laatste 2 jaar) | |
| Dell XPS 13 9310 OLED | |
| Dell XPS 13 Plus 9320 4K | |
| Dell XPS 13 9310 2-in-1 | |
| Gemiddeld Intel Core i7-1280P, Intel Iris Xe Graphics G7 96EUs (6301 - 7453, n=4) | |
| Dell XPS 13 Plus 9320 i7-1280P OLED | |
| Dell XPS 13 Plus 9320 i5-1240p | |
| Dell XPS 13 9315, i5-1230U | |
| PCMark 10 / Digital Content Creation | |
| Gemiddelde van klas Subnotebook (5722 - 13779, n=45, laatste 2 jaar) | |
| Dell XPS 13 Plus 9320 i7-1280P OLED | |
| Gemiddeld Intel Core i7-1280P, Intel Iris Xe Graphics G7 96EUs (6450 - 7180, n=4) | |
| Dell XPS 13 Plus 9320 4K | |
| Dell XPS 13 Plus 9320 i5-1240p | |
| Dell XPS 13 9310 OLED | |
| Dell XPS 13 9310 2-in-1 | |
| Dell XPS 13 9315, i5-1230U | |
| CrossMark / Overall | |
| Dell XPS 13 Plus 9320 i7-1280P OLED | |
| Gemiddeld Intel Core i7-1280P, Intel Iris Xe Graphics G7 96EUs (1677 - 1773, n=4) | |
| Dell XPS 13 Plus 9320 4K | |
| Gemiddelde van klas Subnotebook (365 - 2356, n=59, laatste 2 jaar) | |
| Dell XPS 13 Plus 9320 i5-1240p | |
| Dell XPS 13 9315, i5-1230U | |
| CrossMark / Productivity | |
| Dell XPS 13 Plus 9320 i7-1280P OLED | |
| Gemiddeld Intel Core i7-1280P, Intel Iris Xe Graphics G7 96EUs (1585 - 1709, n=4) | |
| Gemiddelde van klas Subnotebook (364 - 2277, n=59, laatste 2 jaar) | |
| Dell XPS 13 Plus 9320 4K | |
| Dell XPS 13 Plus 9320 i5-1240p | |
| Dell XPS 13 9315, i5-1230U | |
| CrossMark / Creativity | |
| Dell XPS 13 Plus 9320 i7-1280P OLED | |
| Gemiddeld Intel Core i7-1280P, Intel Iris Xe Graphics G7 96EUs (1849 - 1928, n=4) | |
| Gemiddelde van klas Subnotebook (372 - 2743, n=59, laatste 2 jaar) | |
| Dell XPS 13 Plus 9320 4K | |
| Dell XPS 13 Plus 9320 i5-1240p | |
| Dell XPS 13 9315, i5-1230U | |
| CrossMark / Responsiveness | |
| Gemiddeld Intel Core i7-1280P, Intel Iris Xe Graphics G7 96EUs (1394 - 1746, n=4) | |
| Dell XPS 13 Plus 9320 i7-1280P OLED | |
| Dell XPS 13 Plus 9320 4K | |
| Gemiddelde van klas Subnotebook (312 - 1854, n=59, laatste 2 jaar) | |
| Dell XPS 13 Plus 9320 i5-1240p | |
| Dell XPS 13 9315, i5-1230U | |
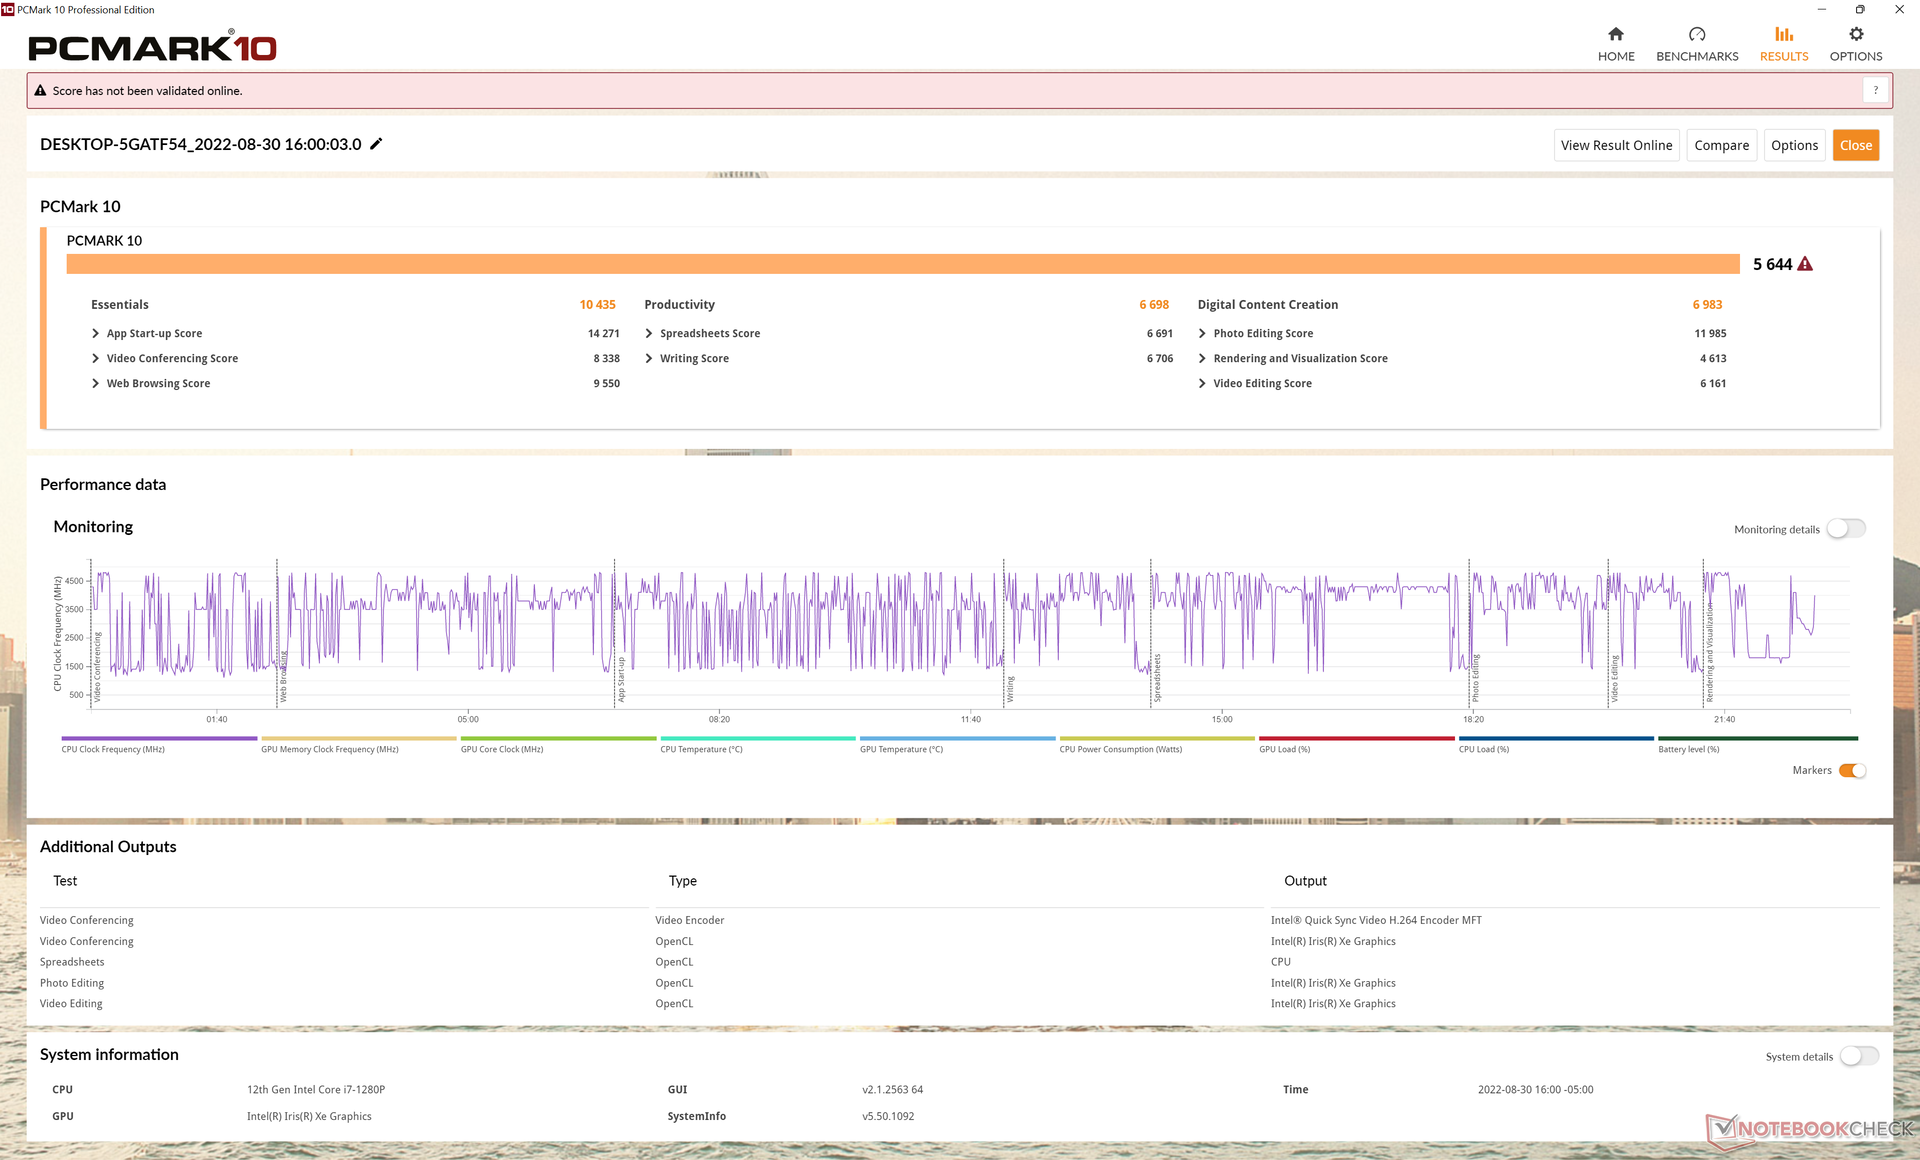
| PCMark 10 Score | 5644 punten | |
Help | ||
| AIDA64 / Memory Copy | |
| Dell XPS 13 Plus 9320 i7-1280P OLED | |
| Dell XPS 13 Plus 9320 4K | |
| Gemiddeld Intel Core i7-1280P (56337 - 73486, n=6) | |
| Dell XPS 13 Plus 9320 i5-1240p | |
| Dell XPS 13 9310 2-in-1 | |
| Dell XPS 13 9310 OLED | |
| Dell XPS 13 9315, i5-1230U | |
| AIDA64 / Memory Read | |
| Dell XPS 13 Plus 9320 i7-1280P OLED | |
| Dell XPS 13 Plus 9320 i5-1240p | |
| Gemiddeld Intel Core i7-1280P (63221 - 73719, n=6) | |
| Dell XPS 13 Plus 9320 4K | |
| Dell XPS 13 9315, i5-1230U | |
| Dell XPS 13 9310 2-in-1 | |
| Dell XPS 13 9310 OLED | |
| AIDA64 / Memory Write | |
| Dell XPS 13 9310 OLED | |
| Dell XPS 13 9310 2-in-1 | |
| Dell XPS 13 Plus 9320 i7-1280P OLED | |
| Gemiddeld Intel Core i7-1280P (58729 - 68247, n=6) | |
| Dell XPS 13 Plus 9320 4K | |
| Dell XPS 13 9315, i5-1230U | |
| Dell XPS 13 Plus 9320 i5-1240p | |
| AIDA64 / Memory Latency | |
| Dell XPS 13 9310 OLED | |
| Gemiddeld Intel Core i7-1280P (93.1 - 153.3, n=6) | |
| Dell XPS 13 Plus 9320 i7-1280P OLED | |
| Dell XPS 13 9310 2-in-1 | |
| Dell XPS 13 9315, i5-1230U | |
* ... kleiner is beter
DPC latentie
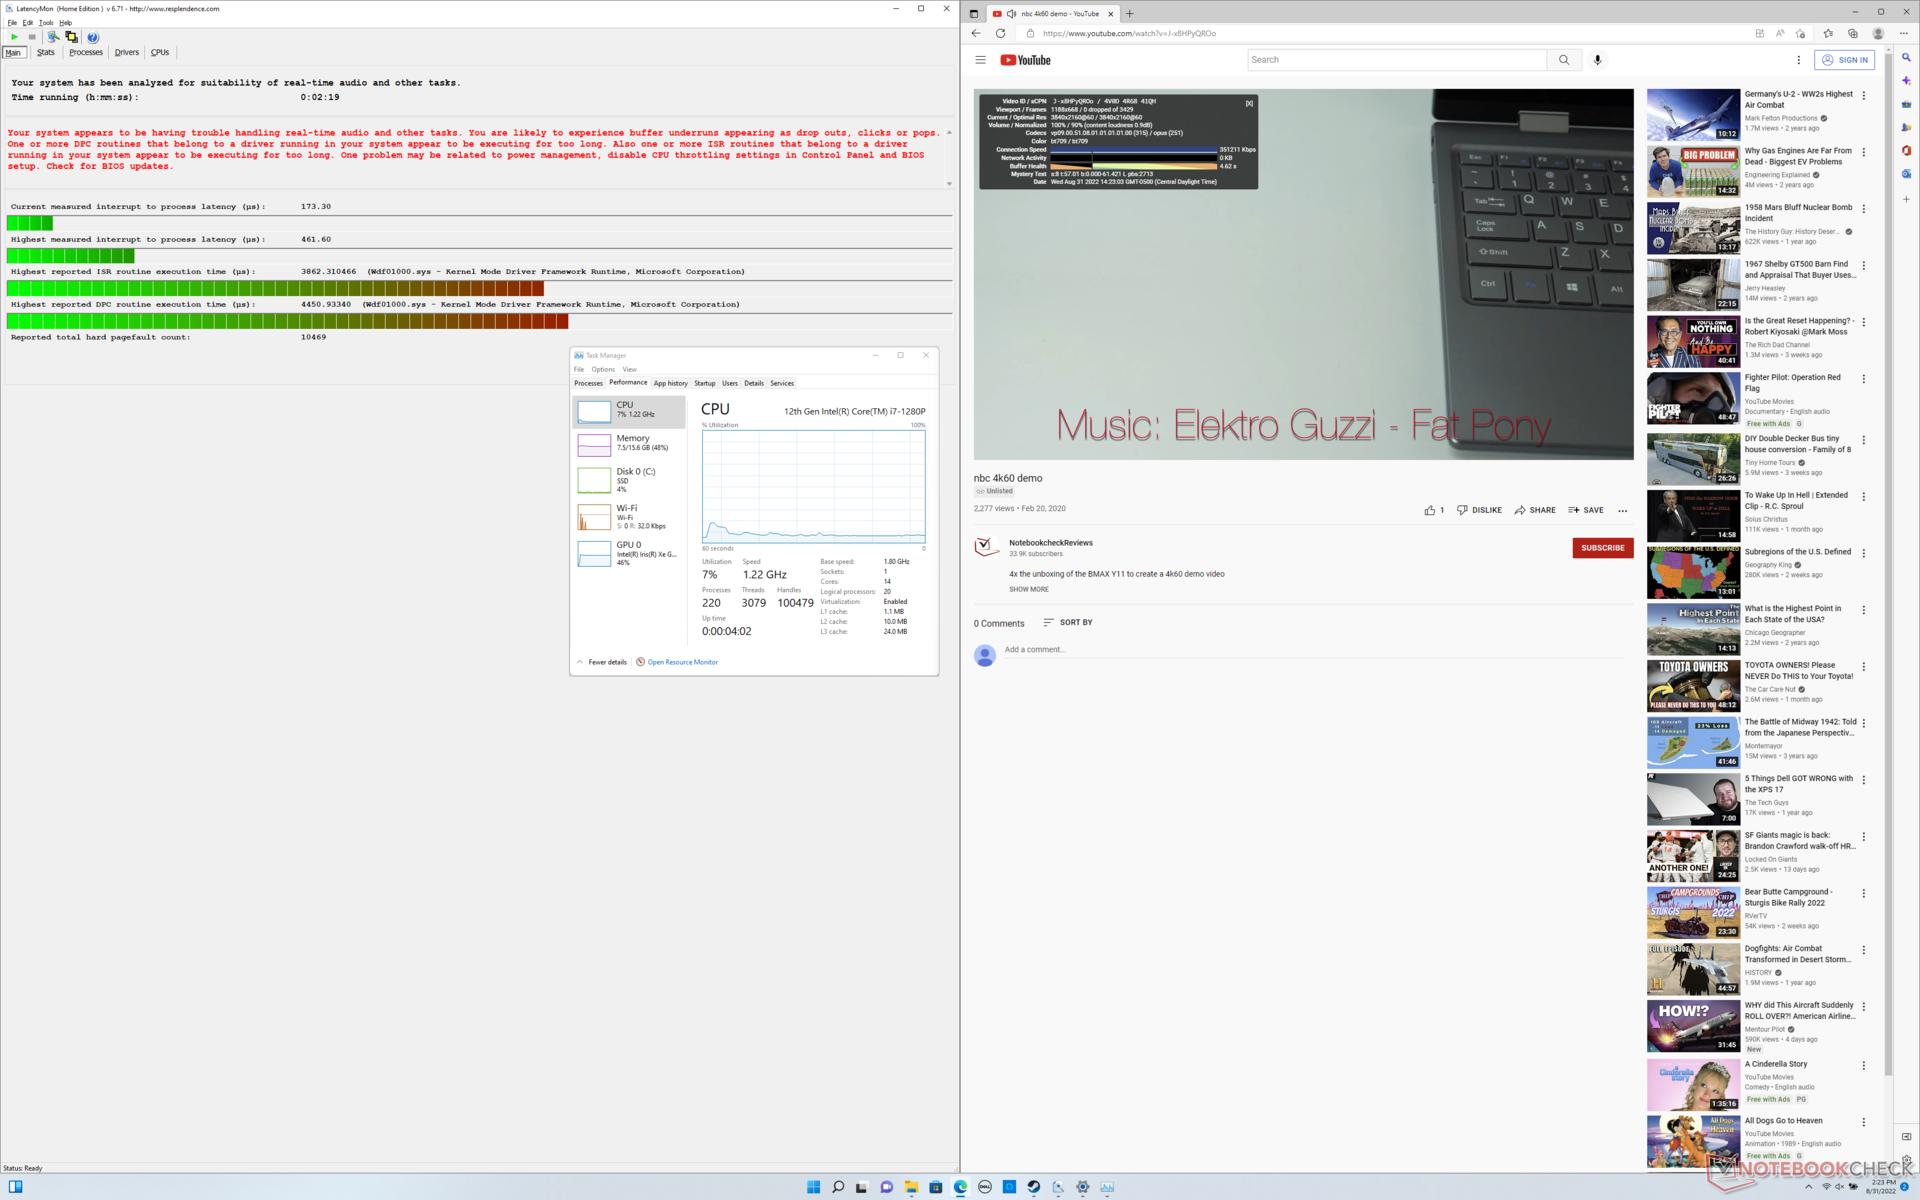
| DPC Latencies / LatencyMon - interrupt to process latency (max), Web, Youtube, Prime95 | |
| Dell XPS 13 9315, i5-1230U | |
| Dell XPS 13 Plus 9320 i5-1240p | |
| Dell XPS 13 9310 OLED | |
| Dell XPS 13 Plus 9320 4K | |
| Dell XPS 13 9310 2-in-1 | |
| Dell XPS 13 Plus 9320 i7-1280P OLED | |
* ... kleiner is beter
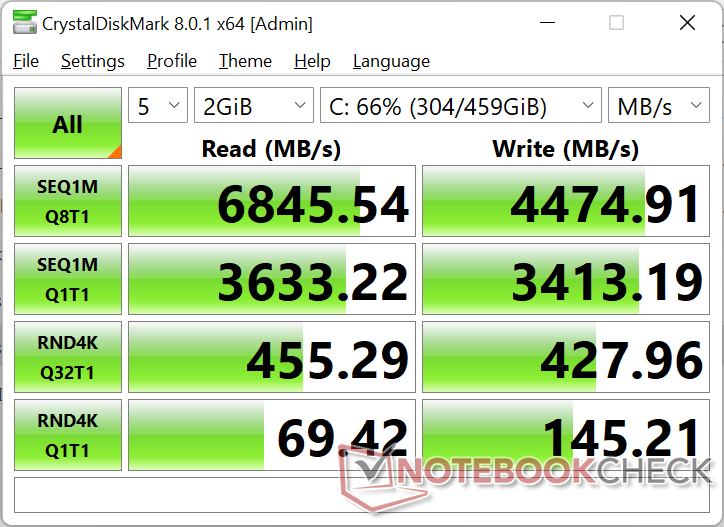
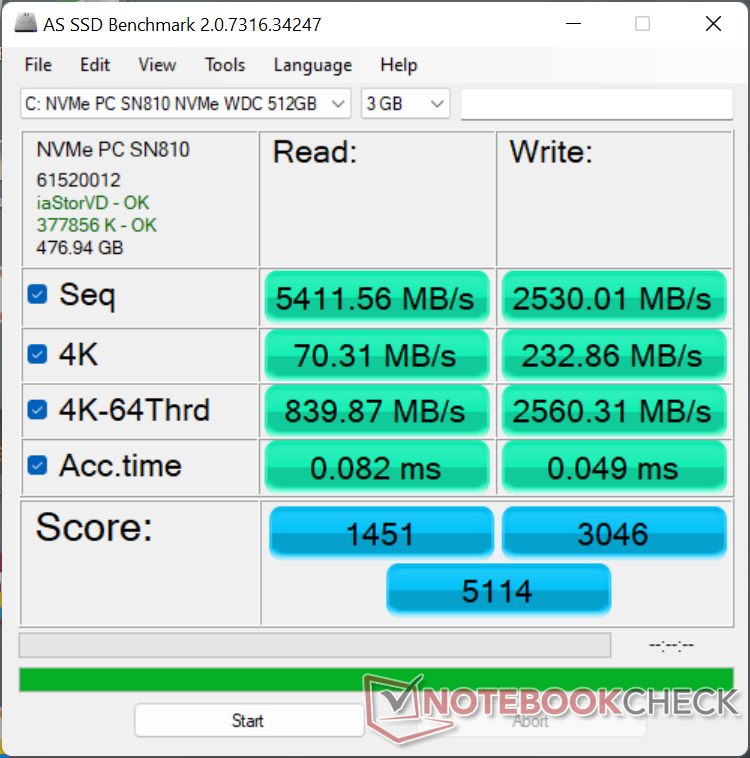
Opslagapparaten
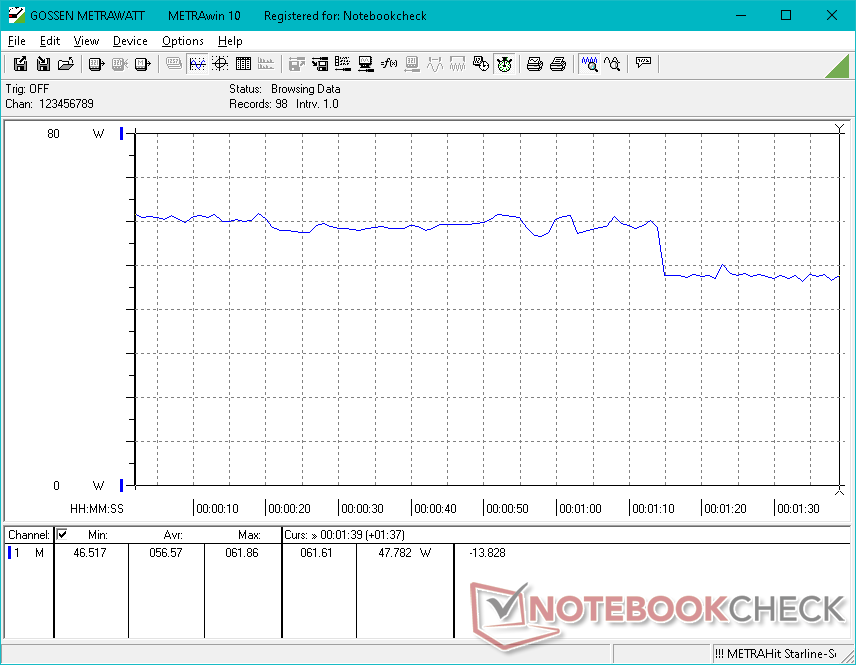
Dell lijkt zijn SSD's voor zijn XPS 13 Plus-serie van verschillende fabrikanten te betrekken. Terwijl onze twee eerdere testeenheden werden geleverd met Micron 3400 of Samsung PM9A1 PCIe4 x4 NVMe SSD's, werd onze i7-1280P testeenheid geleverd met de Western Digital SN810 geleverd. Helaas lijkt deze WD-schijf inferieur aan de Samsung of Micron, aangezien de prestaties afnemen tot slechts 3000 MB/s wanneer DiskSpd in een lus wordt uitgevoerd, zoals blijkt uit onze onderstaande grafiek. Ter vergelijking, de Samsung of Micron schijven vertoonden constante overdrachtssnelheden wanneer ze aan dezelfde stresstest werden onderworpen.

| Drive Performance rating - Percent | |
| Dell XPS 13 Plus 9320 i7-1280P OLED | |
| Dell XPS 13 Plus 9320 4K | |
| Dell XPS 13 9310 OLED | |
| Dell XPS 13 Plus 9320 i5-1240p | |
| Dell XPS 13 9315, i5-1230U | |
| Dell XPS 13 9310 2-in-1 | |
* ... kleiner is beter
Disk Throttling: DiskSpd Read Loop, Queue Depth 8
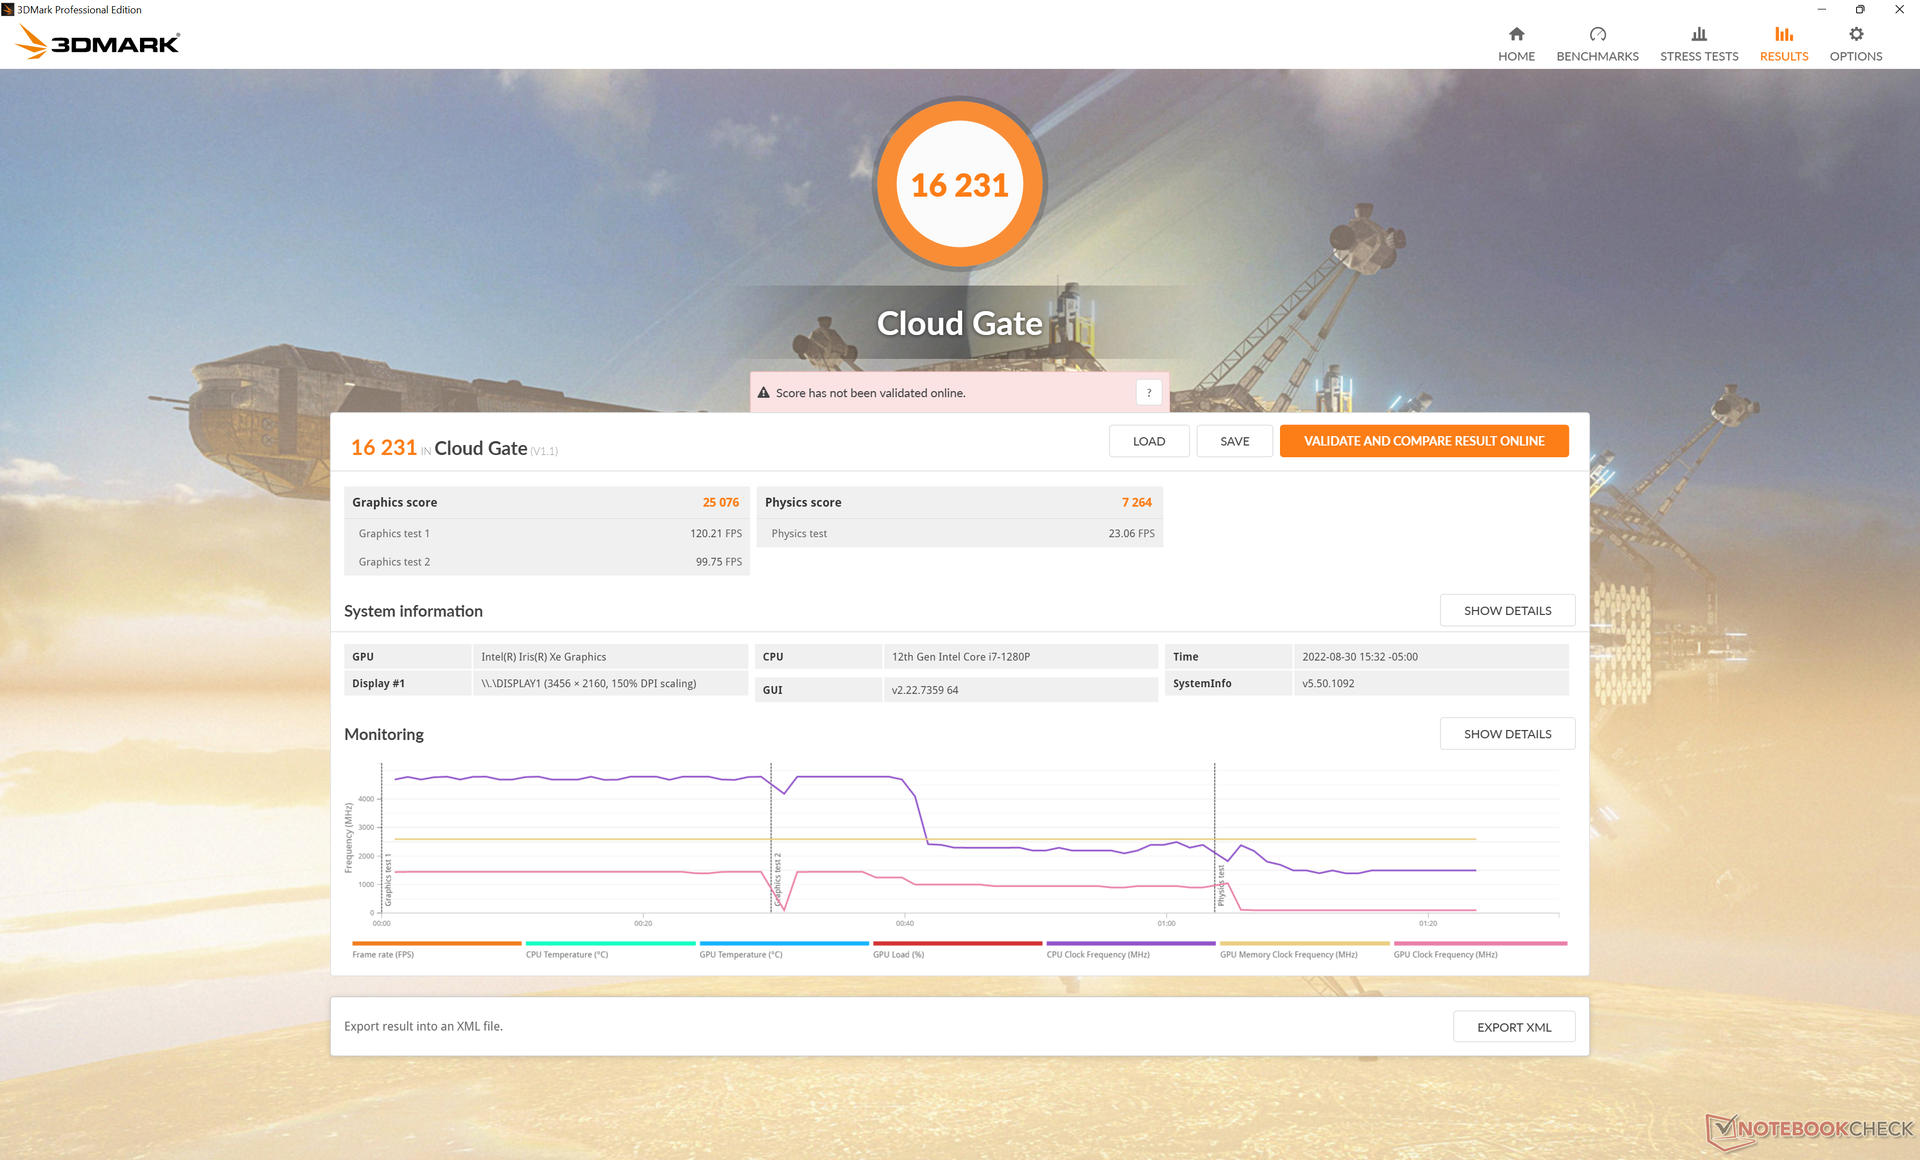
GPU prestatie
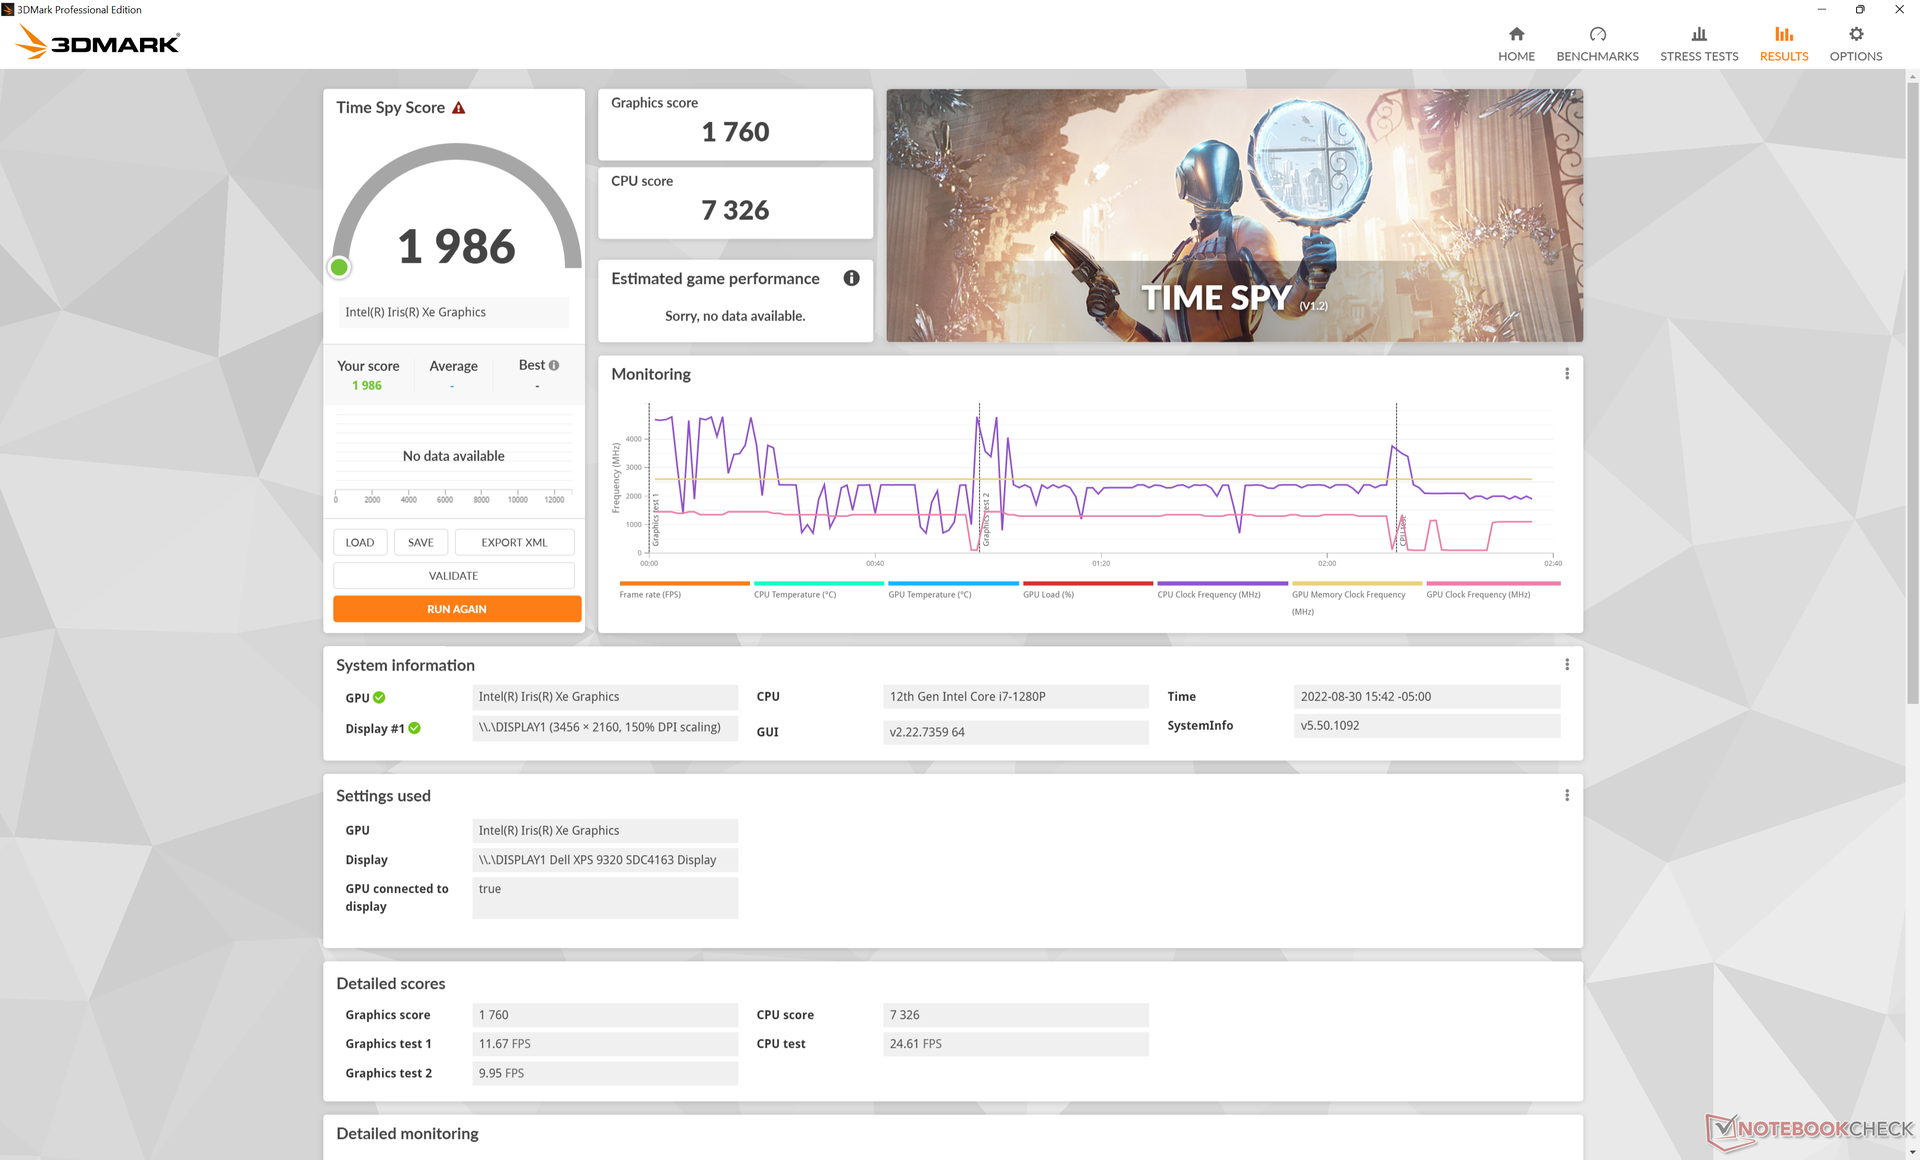
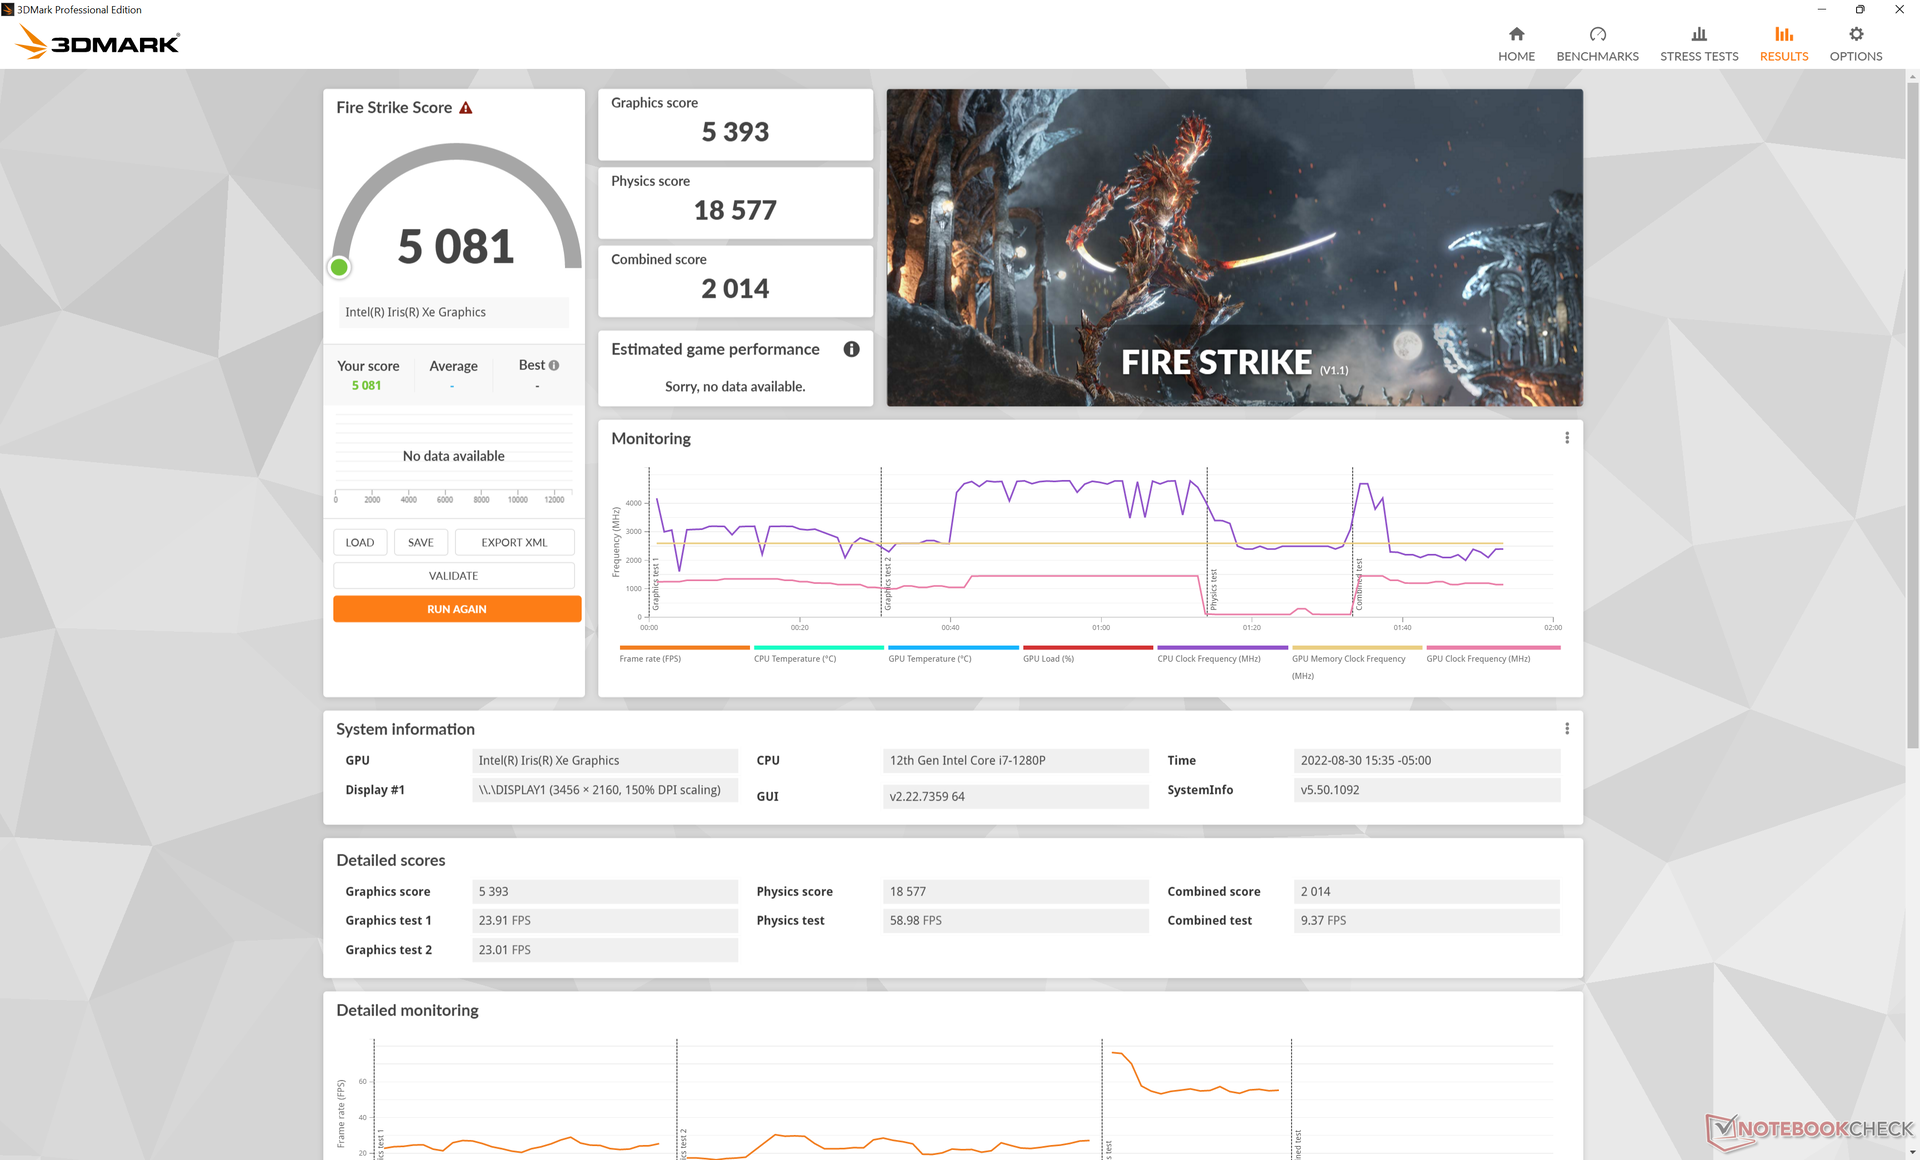
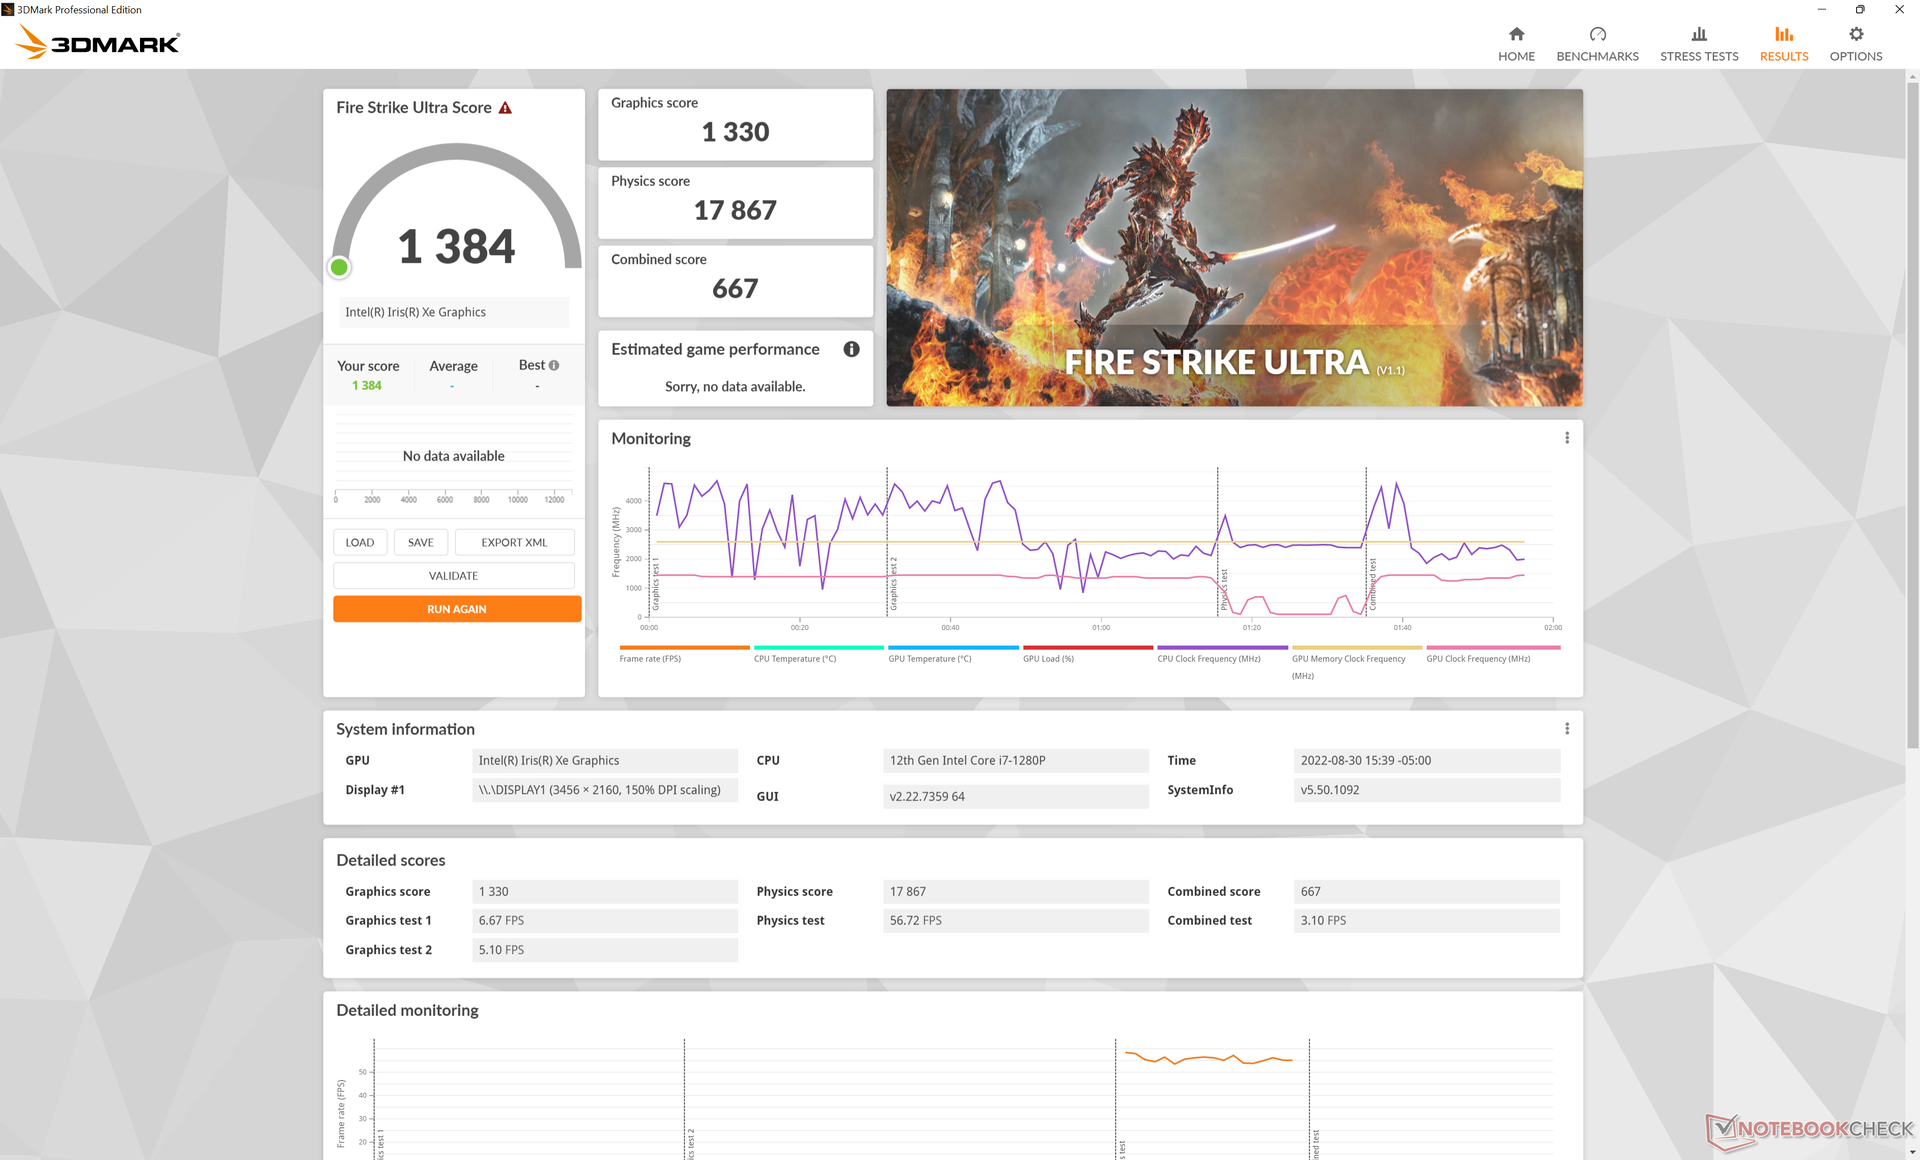
De grafische prestaties zijn in wezen identiek aan die van de Core i7-1260P configuratie. In vergelijking met de Core i5-1240P optie met 8 GB RAM en Iris Xe 80 EU'sechter, onze Iris Xe 96 EUs ongeveer 30 tot 65 procent sneller. U zult een configuratie met ten minste 16 GB RAM en een Core i7 CPU moeten kiezen als u de GPU-prestaties wilt maximaliseren.
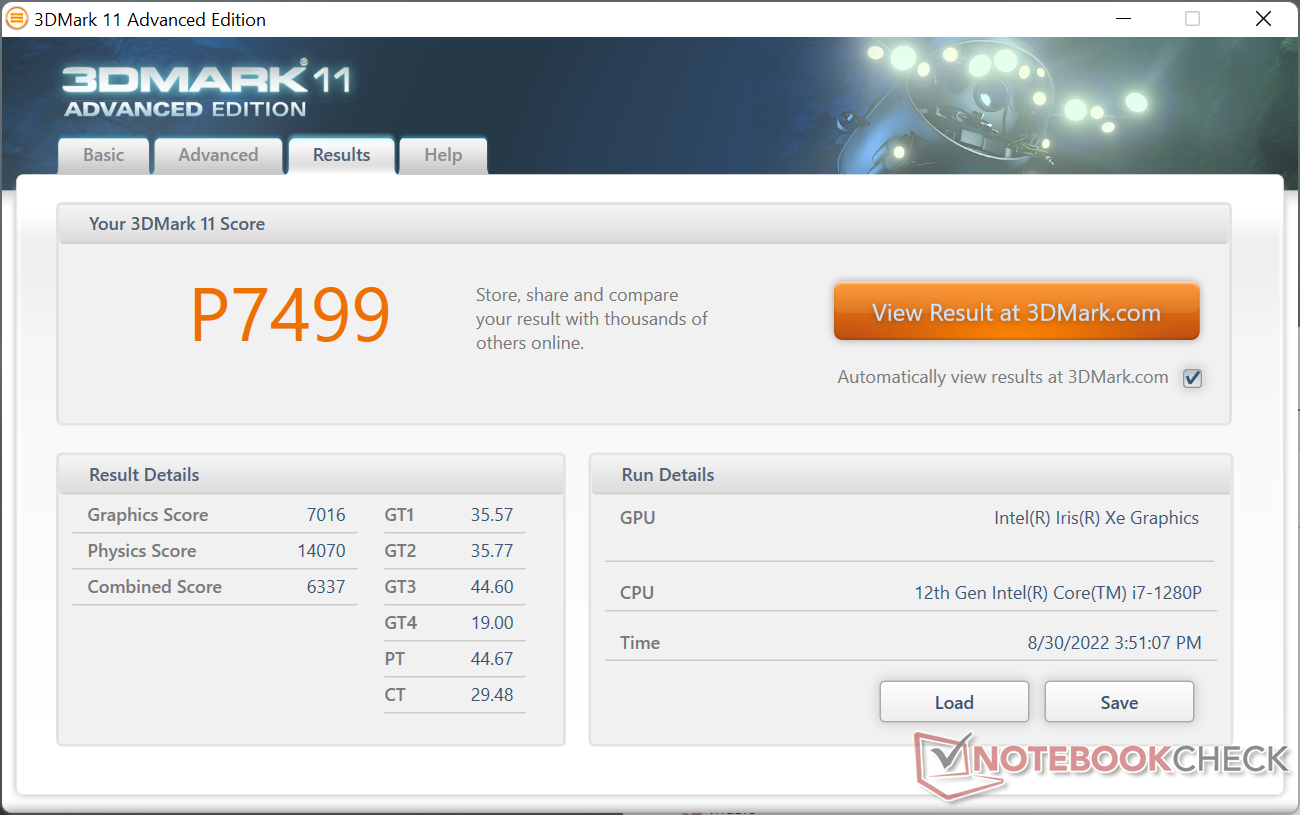
| 3DMark 11 Performance | 7499 punten | |
| 3DMark Cloud Gate Standard Score | 16231 punten | |
| 3DMark Fire Strike Score | 5081 punten | |
| 3DMark Time Spy Score | 1986 punten | |
Help | ||
| Cyberpunk 2077 1.6 | |
| 1920x1080 Low Preset | |
| Dell XPS 13 Plus 9320 i7-1280P OLED | |
| Gemiddeld Intel Iris Xe Graphics G7 96EUs (13 - 25.9, n=42) | |
| 1920x1080 Medium Preset | |
| Dell XPS 13 Plus 9320 i7-1280P OLED | |
| Gemiddeld Intel Iris Xe Graphics G7 96EUs (10.8 - 21.7, n=37) | |
| 1920x1080 High Preset | |
| Dell XPS 13 Plus 9320 i7-1280P OLED | |
| Gemiddeld Intel Iris Xe Graphics G7 96EUs (9.8 - 16.9, n=34) | |
| 1920x1080 Ultra Preset | |
| Dell XPS 13 Plus 9320 i7-1280P OLED | |
| Gemiddeld Intel Iris Xe Graphics G7 96EUs (7.4 - 16.8, n=32) | |
Witcher 3 FPS Chart
| lage | gem. | hoge | ultra | |
|---|---|---|---|---|
| GTA V (2015) | 123.7 | 108.7 | 27.6 | 11.5 |
| The Witcher 3 (2015) | 104.8 | 65.7 | 36.9 | 16.4 |
| Dota 2 Reborn (2015) | 110.3 | 86.8 | 68.1 | 58.7 |
| Final Fantasy XV Benchmark (2018) | 46.1 | 25.3 | 17.6 | |
| X-Plane 11.11 (2018) | 55.2 | 40.7 | 37.6 | |
| Strange Brigade (2018) | 100.2 | 45.4 | 36.5 | 29.6 |
| Cyberpunk 2077 1.6 (2022) | 20.9 | 17.9 | 13.9 | 11.2 |
Emissies
Systeemgeluid
De dubbele interne ventilatoren zijn uitstekend in staat om stil te blijven tijdens lage tot middelhoge belastingen, aangezien we slechts een geluid van slechts 25,4 dB(A) konden meten tijdens browsen of video streaming tegen een stille achtergrond van 23,4 dB(A). Hogere belastingen zoals games veroorzaken een ventilatorgeluid tussen de 35 en 42 dB(A). Vreemd genoeg kunnen we het plafond van 45,5 dB(A) dat we registreerden op de i7-1260P configuratie niet bereiken, zelfs niet wanneer deze is ingesteld op de Ultra Performance modus. De algehele resultaten liggen in plaats daarvan dichter bij wat we registreerden op de oudere XPS 13 9310 2-in-1.
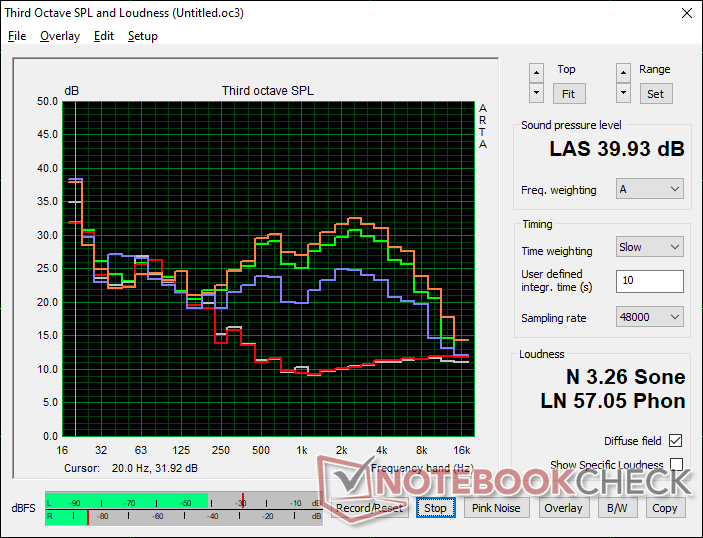
Geluidsniveau
| Onbelast |
| 23.4 / 23.4 / 23.4 dB (A) |
| Belasting |
| 35 / 39.9 dB (A) |
 | ||
30 dB stil 40 dB(A) hoorbaar 50 dB(A) luid |
||
min: | ||
| Dell XPS 13 Plus 9320 i7-1280P OLED Iris Xe G7 96EUs, i7-1280P, WDC PC SN810 512GB | Dell XPS 13 Plus 9320 i5-1240p Iris Xe G7 80EUs, i5-1240P, Micron 3400 MTFDKBA512TFH 512GB | Dell XPS 13 9315, i5-1230U Iris Xe G7 80EUs, i5-1230U, Micron 3460 256 GB Soldered | Dell XPS 13 Plus 9320 4K Iris Xe G7 96EUs, i7-1260P, Samsung PM9A1 MZVL21T0HCLR | Dell XPS 13 9310 2-in-1 Iris Xe G7 96EUs, i7-1165G7, Toshiba BG4 KBG40ZPZ512G | Dell XPS 13 9310 OLED Iris Xe G7 96EUs, i7-1185G7, Toshiba XG6 KXG60ZNV512G | |
|---|---|---|---|---|---|---|
| Noise | -13% | -8% | -8% | -4% | 4% | |
| uit / omgeving * (dB) | 23.4 | 26 -11% | 26 -11% | 24.4 -4% | 24.3 -4% | 24.8 -6% |
| Idle Minimum * (dB) | 23.4 | 26.2 -12% | 26 -11% | 24.4 -4% | 24.8 -6% | 25 -7% |
| Idle Average * (dB) | 23.4 | 26.2 -12% | 26 -11% | 24.4 -4% | 24.8 -6% | 25 -7% |
| Idle Maximum * (dB) | 23.4 | 26.2 -12% | 27.5 -18% | 25.5 -9% | 24.8 -6% | 25 -7% |
| Load Average * (dB) | 35 | 38.4 -10% | 39.5 -13% | 40.4 -15% | 38 -9% | 25.3 28% |
| Witcher 3 ultra * (dB) | 41.6 | 39.6 5% | 45.5 -9% | 38 9% | 35.8 14% | |
| Load Maximum * (dB) | 39.9 | 47.1 -18% | 39.6 1% | 45.5 -14% | 41.5 -4% | 35.8 10% |
* ... kleiner is beter
Stresstest
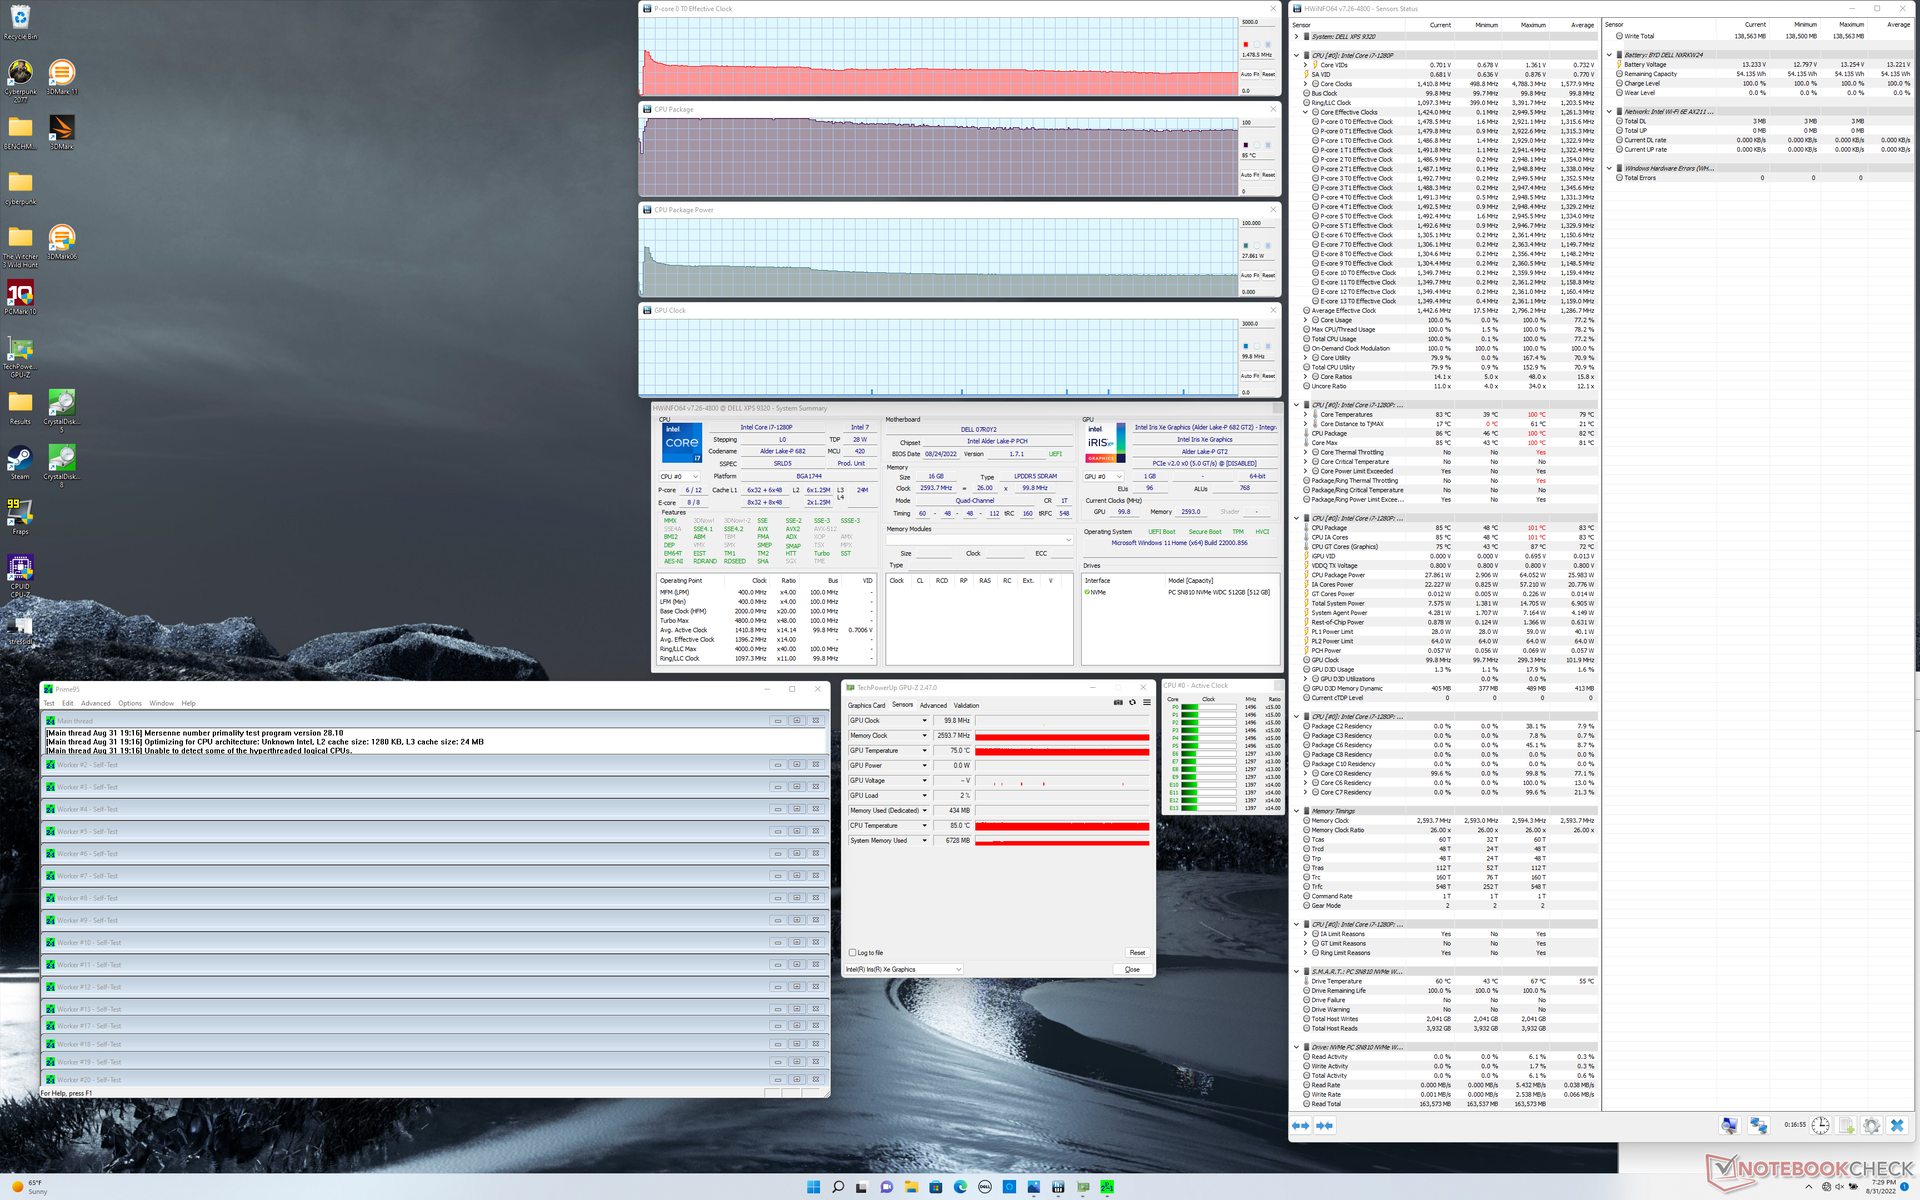
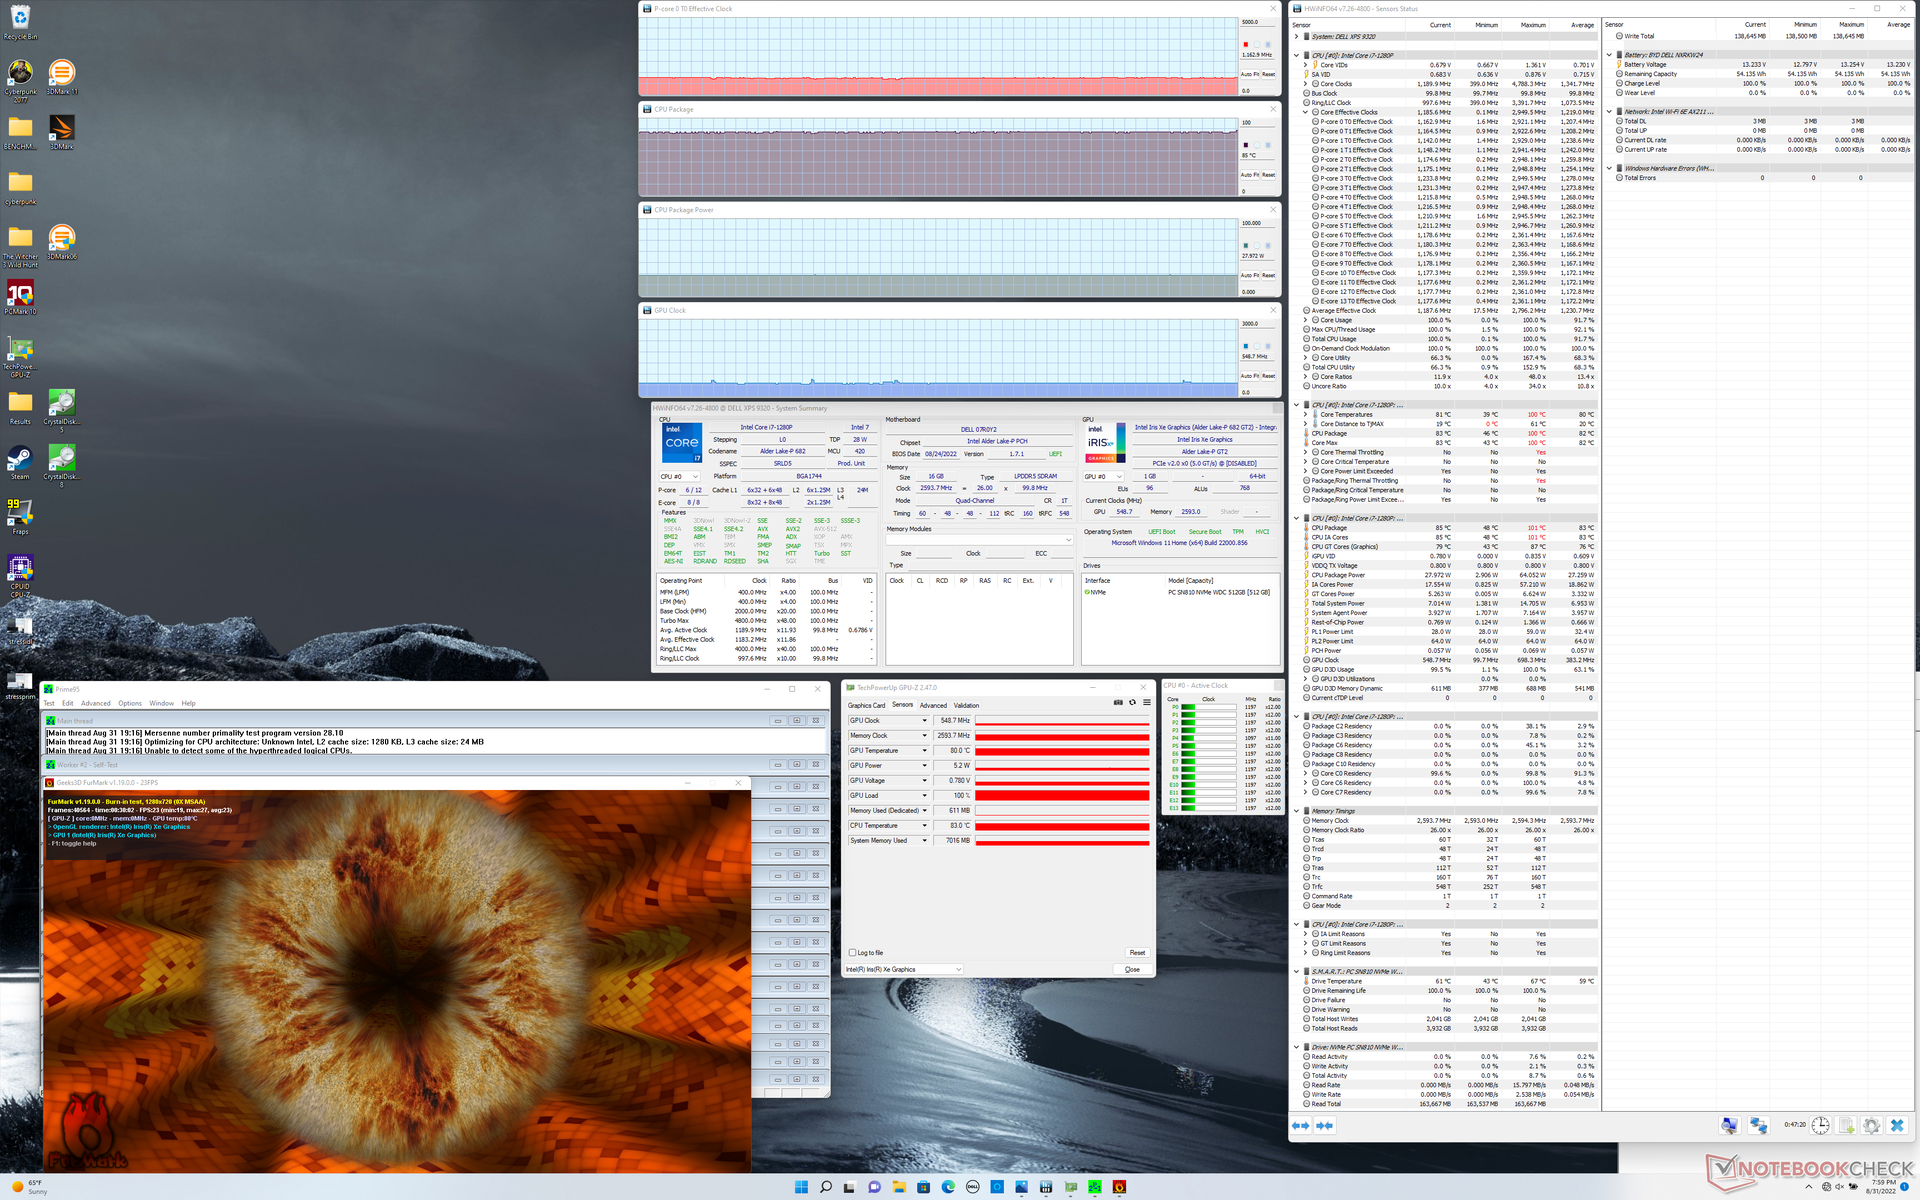
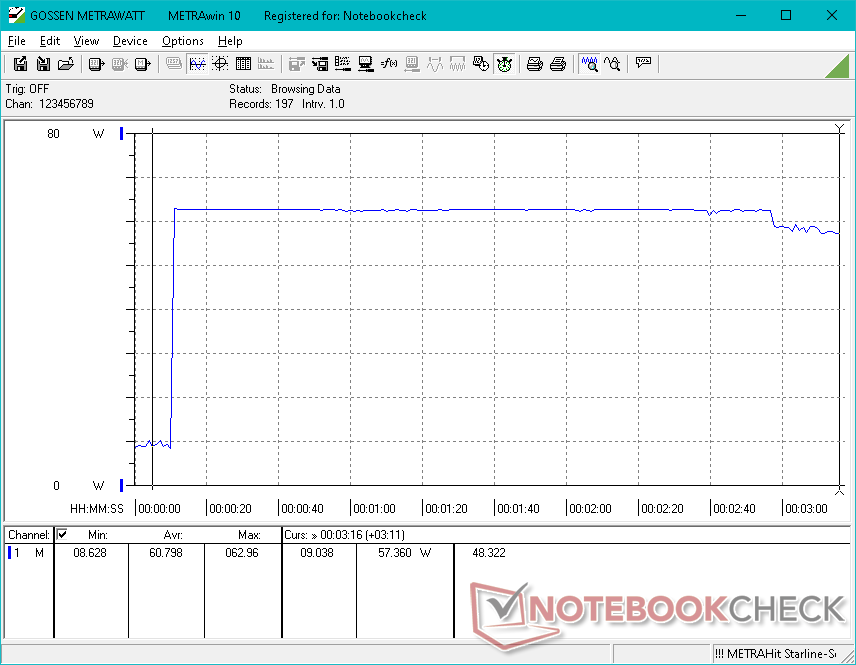
Het starten van de Prime95 stress zorgt ervoor dat de CPU kloksnelheden, temperatuur en het opgenomen vermogen pieken tot respectievelijk 2,9 GHz, 100 C en 64 W, en dit gedurende bijna 3 minuten. Daarna dalen de kloksnelheden, de temperatuur en het opgenomen vermogen naar respectievelijk 1,5 GHz, 85 C en 28 W, zoals te zien is in de schermafdruk hieronder. Deze resultaten komen overeen met de CineBench R15 xT stresstest hierboven, waar de aanvankelijk hoge score niet lang vol te houden was, vanwege de beperkte Turbo Boost van de laptop. Interessant is dat het stabiele 28 W-doel in feite lager is dan het stabiele 34 W-doel van de i7-1260P configuratie, wat de iets betere CineBench R15 xT resultaten van onze i7-1260P testeenheid kan verklaren.
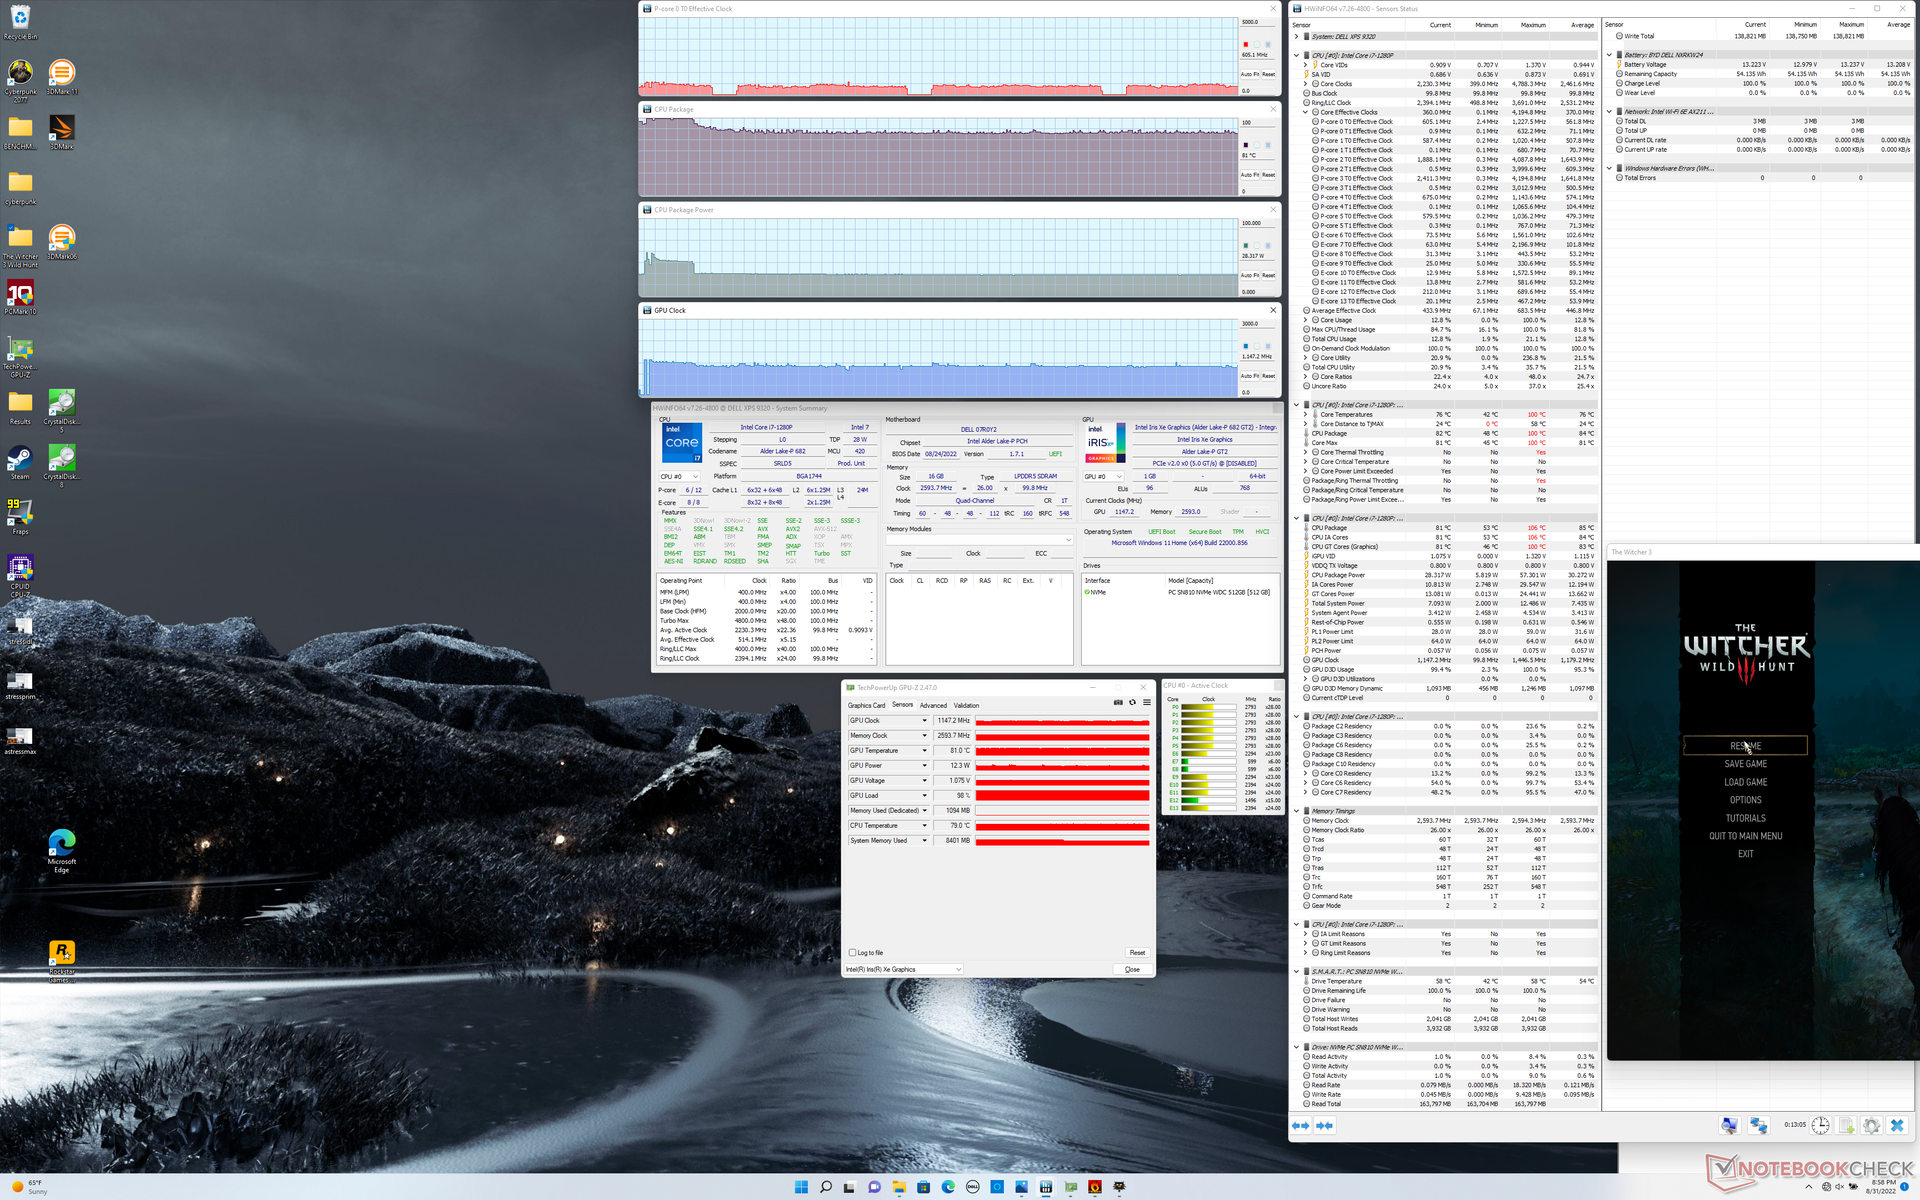
GPU kloksnelheid en temperatuur zouden stabiliseren op respectievelijk 1147 MHz en 81 C, wanneer Witcher 3 om veeleisende grafische belastingen weer te geven.
| CPU Klok (GHz) | GPU Klok (MHz) | Gemiddelde CPU Temperatuur (°C) | |
| Systeem in rusttoestand | -- | -- | 51 |
| Prime95 Stress | 1.5 | -- | 85 |
| Prime95 + FurMark Stress | 1.2 | 549 | 85 |
| Witcher 3 Stress | ~0.6 | 1147 | 81 |
Energiebeheer
Stroomverbruik
Het energieverbruik kan oplopen tot 6 W bij het weergeven van een pikzwart beeld of tot 13 W bij het weergeven van een volledig wit beeld op de maximale helderheidsinstelling. Ter vergelijking, de IPS panelen op de andere XPS 13 Plus SKU's zouden slechts met 2 tot 4 W toenemen tussen hun minimale en maximale helderheidsinstellingen. We hebben onderzocht hoe het stroomverbruik zich verhoudt tot OLED panelen in het verleden en de trend zet zich voort op deze XPS 13 Plus-configuraties. Kortom, de IPS-opties zullen in de meeste scenario's energiezuiniger zijn, vooral omdat websites, spreadsheets en tekstverwerkingsprogramma's meestal overwegend wit van kleur zijn.
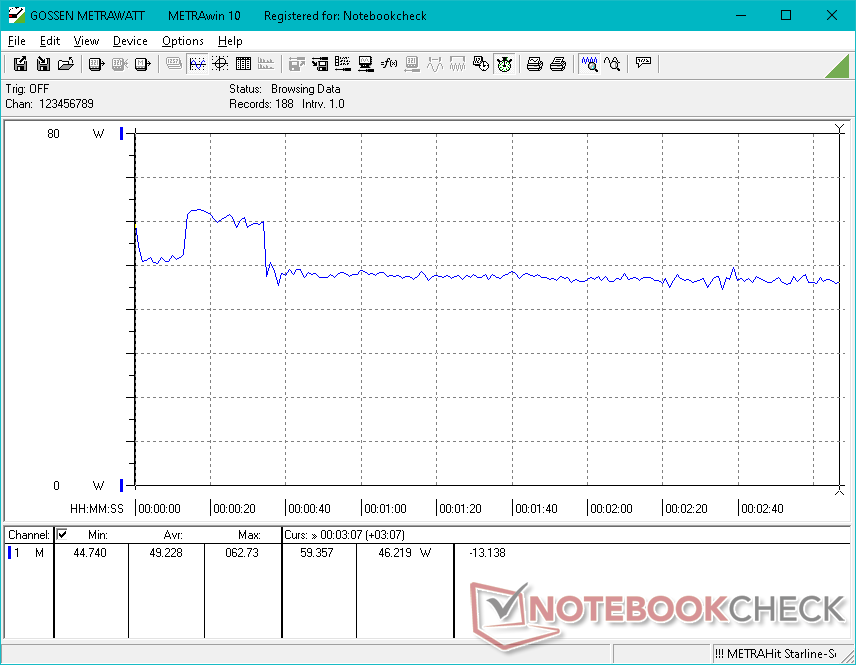
Het draaien van hogere belastingen zoals games laat een hoger energieverbruik zien dan de 8 GB Core i5-1240P configuratie met ongeveer 15 tot 55 procent, wat ruwweg overeenkomt met de hogere grafische prestaties van onze 16 GB i7-1280P configuratie. De resultaten liggen verder zeer dicht bij die van de Core i7-1260P configuratie, behalve wanneer CPU-intensieve belastingen zoals Prime95 worden uitgevoerd gedurende de eerste paar minuten, zoals blijkt uit onze onderstaande grafiek.
| Uit / Standby | |
| Inactief | |
| Belasting |
|
Key:
min: | |
| Dell XPS 13 Plus 9320 i7-1280P OLED i7-1280P, Iris Xe G7 96EUs, WDC PC SN810 512GB, OLED, 3456x2160, 13.4" | Dell XPS 13 Plus 9320 i5-1240p i5-1240P, Iris Xe G7 80EUs, Micron 3400 MTFDKBA512TFH 512GB, IPS, 1920x1200, 13.4" | Dell XPS 13 9315, i5-1230U i5-1230U, Iris Xe G7 80EUs, Micron 3460 256 GB Soldered, IPS, 1920x1200, 13.4" | Dell XPS 13 Plus 9320 4K i7-1260P, Iris Xe G7 96EUs, Samsung PM9A1 MZVL21T0HCLR, IPS, 3840x2400, 13.4" | Dell XPS 13 9310 2-in-1 i7-1165G7, Iris Xe G7 96EUs, Toshiba BG4 KBG40ZPZ512G, IPS, 1920x1200, 13.4" | Dell XPS 13 9310 OLED i7-1185G7, Iris Xe G7 96EUs, Toshiba XG6 KXG60ZNV512G, OLED, 3456x2160, 13.4" | |
|---|---|---|---|---|---|---|
| Power Consumption | -16% | 40% | -7% | 38% | 19% | |
| Idle Minimum * (Watt) | 6.5 | 10 -54% | 3.6 45% | 7 -8% | 2.6 60% | 5.7 12% |
| Idle Average * (Watt) | 7.8 | 12.3 -58% | 6.8 13% | 11 -41% | 6.4 18% | 6 23% |
| Idle Maximum * (Watt) | 13 | 15.5 -19% | 6.8 48% | 11.4 12% | 7.7 41% | 12.3 5% |
| Load Average * (Watt) | 56.6 | 43 24% | 24 58% | 59.7 -5% | 29.9 47% | 44.4 22% |
| Witcher 3 ultra * (Watt) | 49.2 | 43.1 12% | 23.6 52% | 49.4 -0% | 32.2 35% | 36.5 26% |
| Load Maximum * (Watt) | 63 | 62.8 -0% | 47 25% | 63 -0% | 47.5 25% | 47.8 24% |
* ... kleiner is beter
Power Consumption Witcher 3 / Stresstest
Power Consumption external Monitor
Levensduur batterij
Met slechts 5,5 uur werkelijk WLAN-gebruik bij het Balanced power profiel is de gebruiksduur korter dan elke andere XPS 13 Plus configuratie, wat grotendeels te danken is aan het OLED paneel. De andere IPS SKU's gaan ongeveer 1 tot 2 uur langer mee.
| Dell XPS 13 Plus 9320 i7-1280P OLED i7-1280P, Iris Xe G7 96EUs, 55 Wh | Dell XPS 13 Plus 9320 i5-1240p i5-1240P, Iris Xe G7 80EUs, 55 Wh | Dell XPS 13 9315, i5-1230U i5-1230U, Iris Xe G7 80EUs, 51 Wh | Dell XPS 13 Plus 9320 4K i7-1260P, Iris Xe G7 96EUs, 55 Wh | Dell XPS 13 9310 2-in-1 i7-1165G7, Iris Xe G7 96EUs, 51 Wh | Dell XPS 13 9310 OLED i7-1185G7, Iris Xe G7 96EUs, 52 Wh | |
|---|---|---|---|---|---|---|
| Batterijduur | 38% | 155% | 19% | 84% | 12% | |
| WiFi v1.3 (h) | 5.8 | 8 38% | 14.8 155% | 6.9 19% | 10.7 84% | 6.5 12% |
| Load (h) | 1.6 | 2.6 | 1.3 | 3.4 | ||
| H.264 (h) | 11 | |||||
| Reader / Idle (h) | 25.4 |
Pro
Contra
Verdict - Sneller, maar niet echt beter
De meest geavanceerde configuratie met de Core i7-1280P CPU en OLED-scherm is ontworpen voor een zeer specifieke subgroep van gebruikers. Als uw werklasten P3-kleuren en zware multitasking tussen toepassingen vereisen, kan de snellere initiële Turbo Boost van de CPU en het OLED-paneel de investering waard zijn in plaats van de minder dure Core i7-1260P en IPS opties. Anders wegen de nadelen die ze met zich meebrengen niet noodzakelijk op tegen de voordelen. OLED introduceert flikkeringen die anders niet aanwezig zijn op de IPS panelen, naast zowel een lagere maximale helderheid als een kortere batterijlevensduur. De i7-1280P CPU is ook niet gegarandeerd sneller dan de i7-1260P wanneer de aanvankelijke piek in Turbo Boost prestaties onvermijdelijk afneemt.
Een ander onverwacht resultaat heeft betrekking op de prestaties van de WD SN810 SSD, die op onze testunit onder spanning afsloeg. Als je in plaats daarvan SKU's met de Micron 3400 of Samsung PM9A1 kunt vinden, dan bieden die schijven wellicht stabielere prestaties.
Voor de meeste gebruikers biedt de Core i7-1260P en IPS configuratie een betere balans tussen prestaties en prijs dan de i7-1280P en OLED configuratie. Hij biedt zelfs een langere batterijlevensduur en een helderder scherm, ondanks het lagere prijspunt.
De verschillen tussen de i7-1260P en i7-1280P SKU's zijn kleiner dan de verschillen tussen de i5-1240P en i7-1260P SKU's als het gaat om geïntegreerde grafische prestaties. We raden aan ten minste 16 GB RAM te configureren, ongeacht de CPU-optie, omdat anders de grafische prestaties afnemen.
Prijs en beschikbaarheid
Configuraties met de Core i7-1280P zijn nog niet op grote schaal beschikbaar via resellers als Newegg, Amazon of Best Buy, aangezien SKU's met de i7-1260P aanzienlijk gangbaarder zijn. OLED-opties zijn echter op grote schaal beschikbaar, zij het met de i7-1260P in plaats daarvan. Gebruikers kunnen rechtstreeks bij Dell kopen voor onze exacte i7-1280P OLED-configuratie voor $1750 USD.
Dell XPS 13 Plus 9320 i7-1280P OLED
- 02-09-2022 v7 (old)
Allen Ngo
Price comparison

