Dell XPS 13 9310 2-in-1 Review: In één specifiek opzicht beter dan de XPS 13 7390 2-in-1
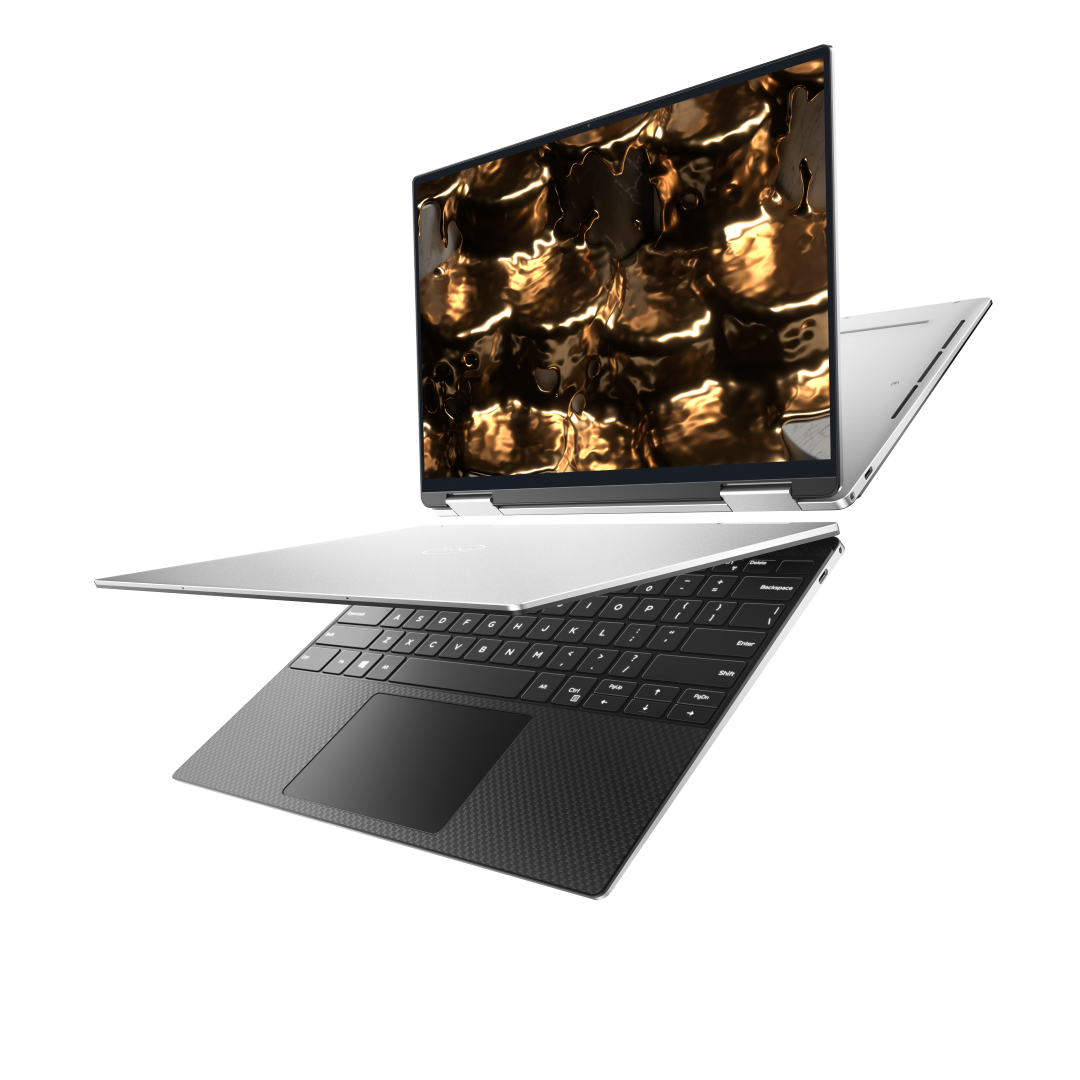
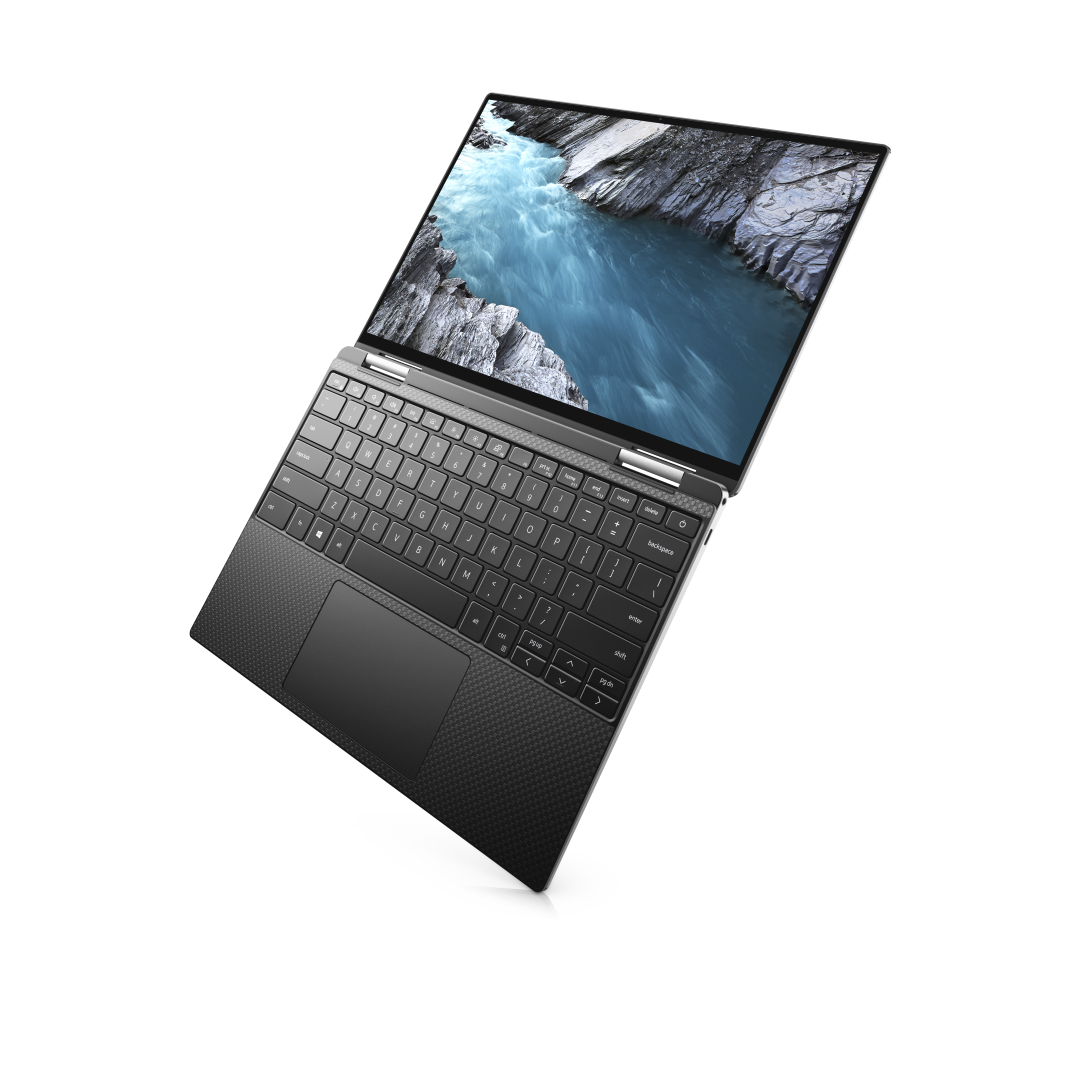
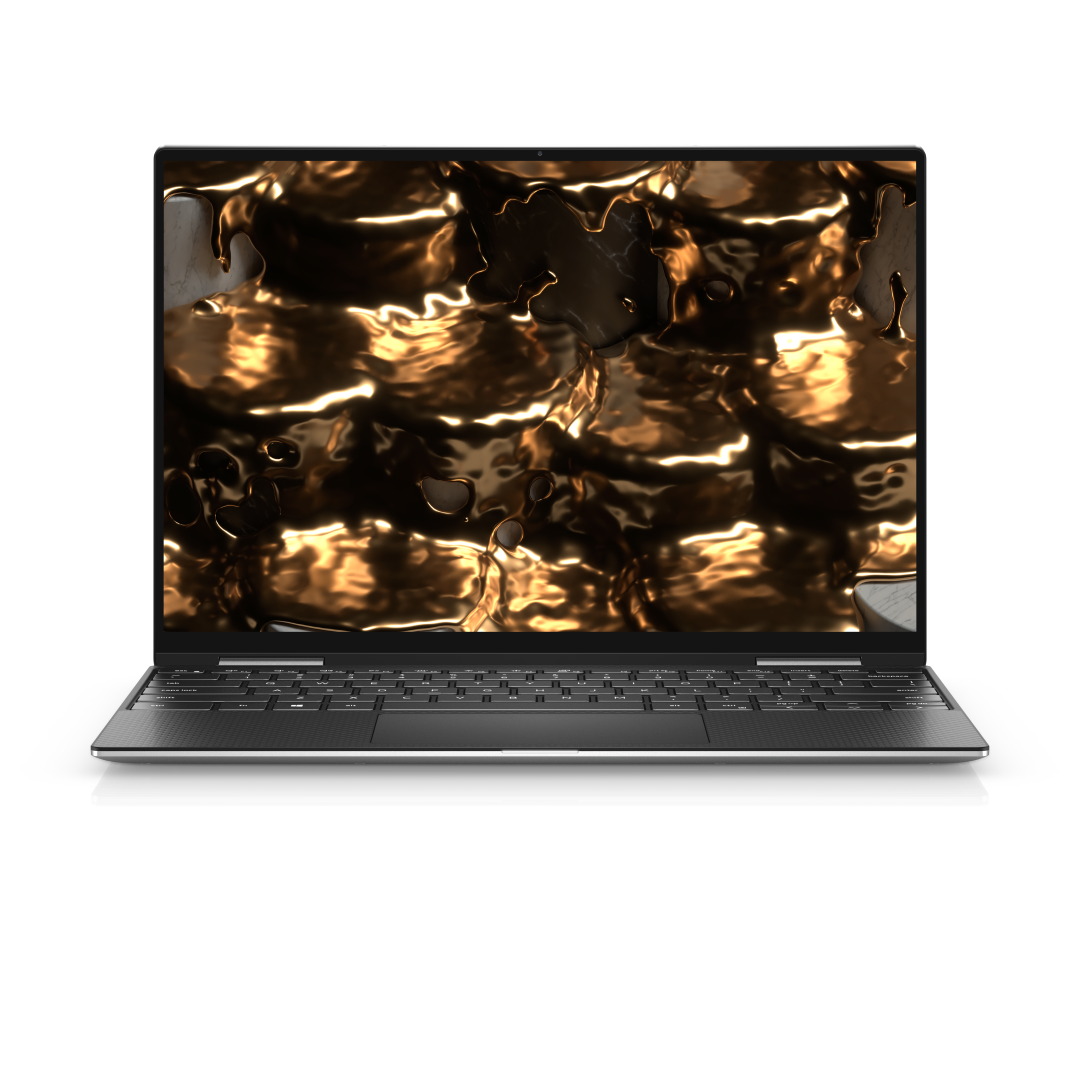
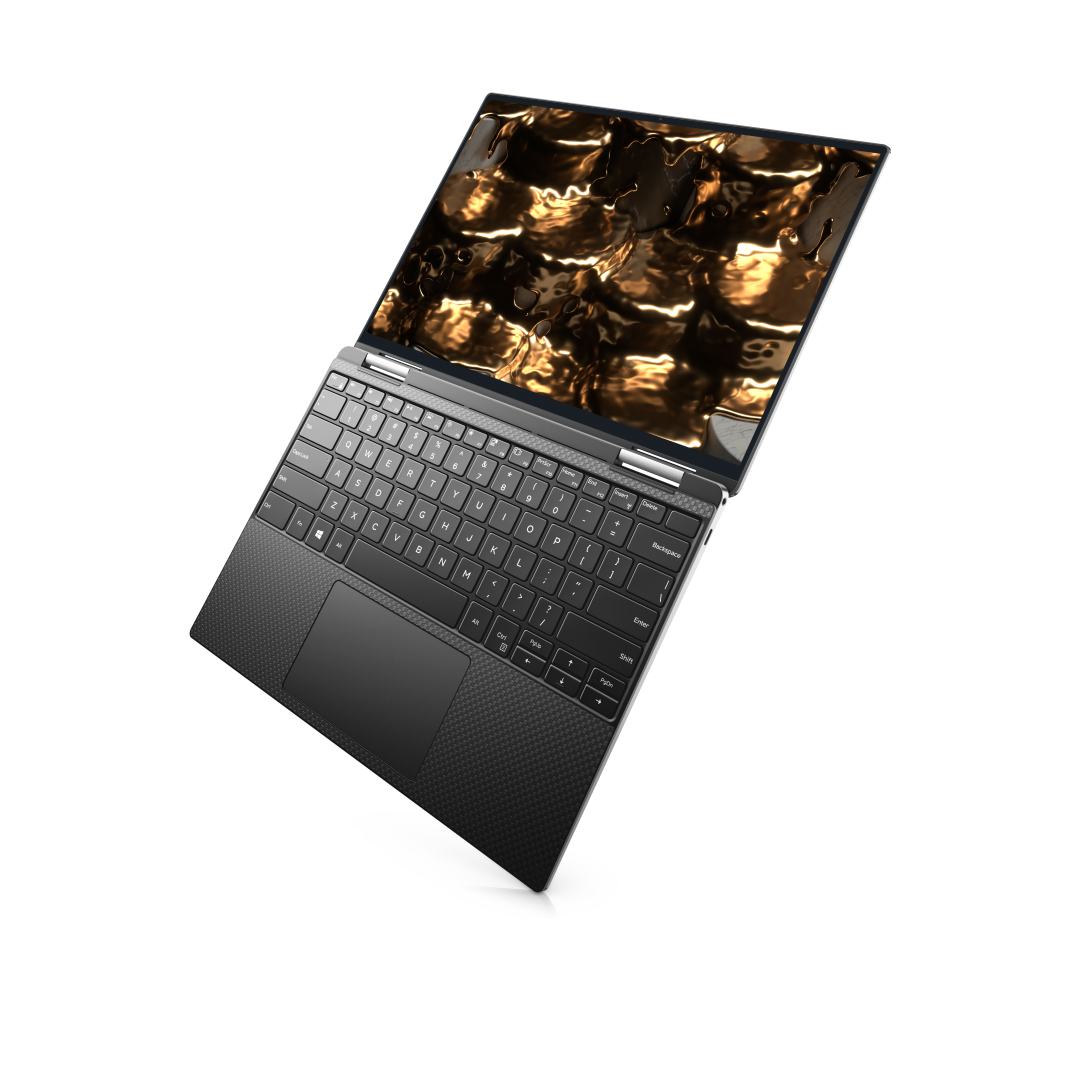
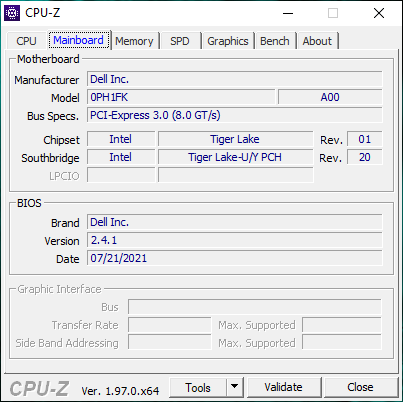
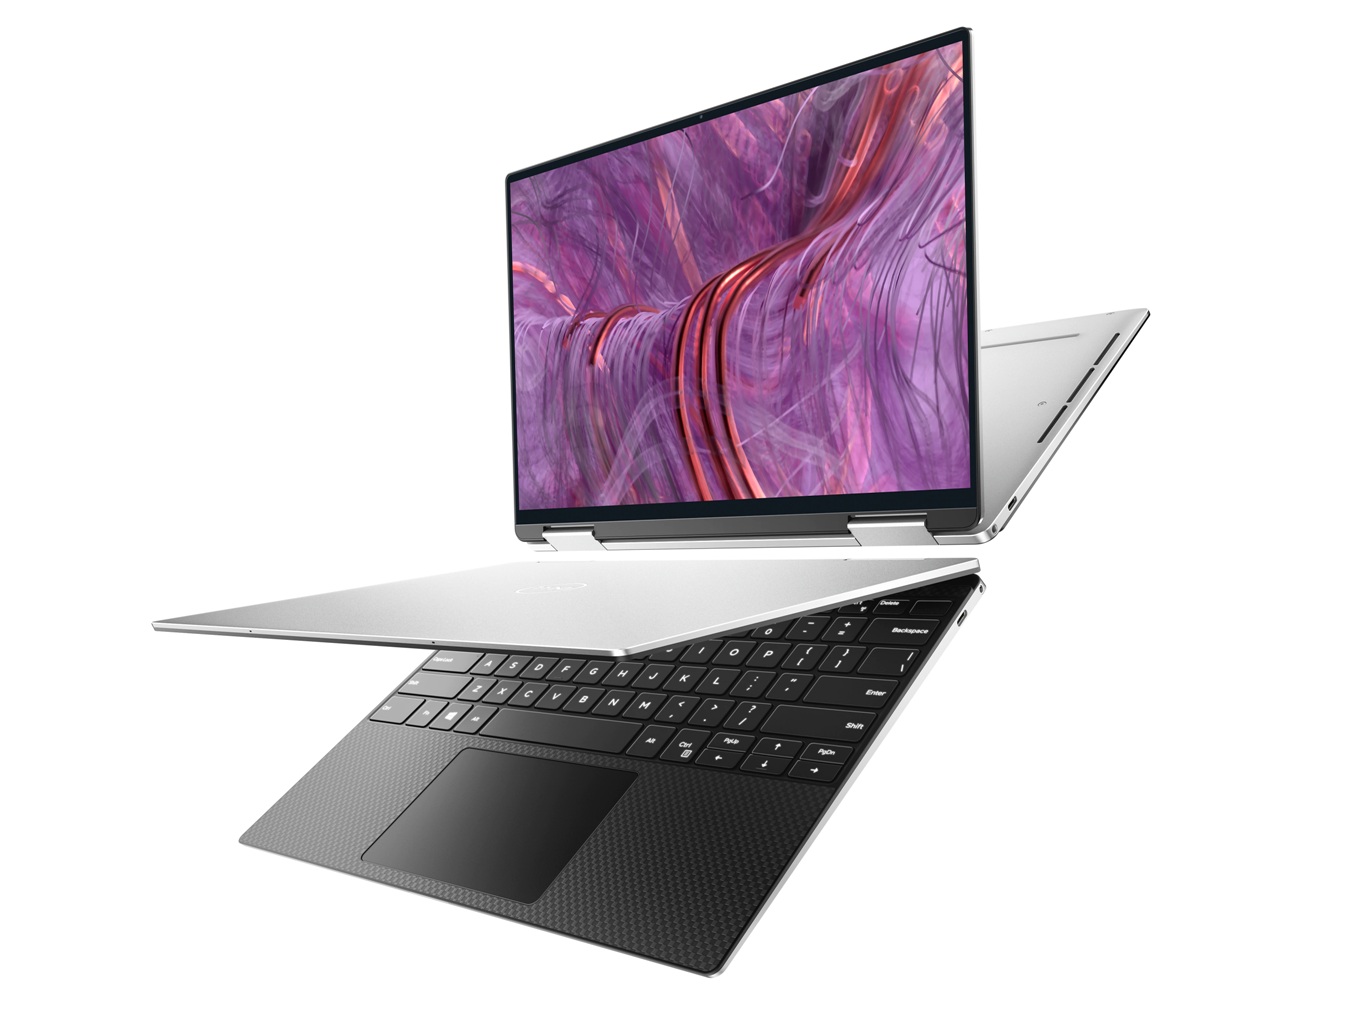
De Dell XPS 13 9310 2-in-1 deelt hetzelfde chassis als de 2019 XPS 13 7390 2-in-1, maar met nieuwere Tiger Lake-U 11e gen Intel-opties ter vervanging van de oudere Ice Lake 10e gen-opties. Zo blijven belangrijke functies op de 7390 2-in-1 allemaal onaangeroerd op de 9310 2-in-1, waaronder de MagLev-toetsenbordtoetsen, dampkamerkoeler, 13,4-inch 16:10 touchscreen en goed gepositioneerde webcam.
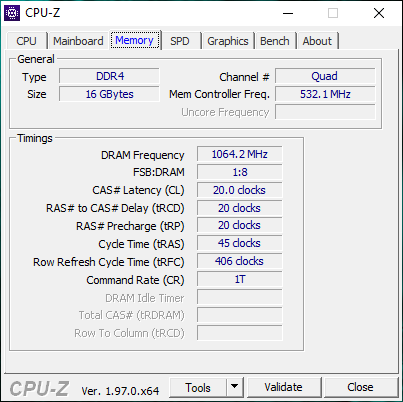
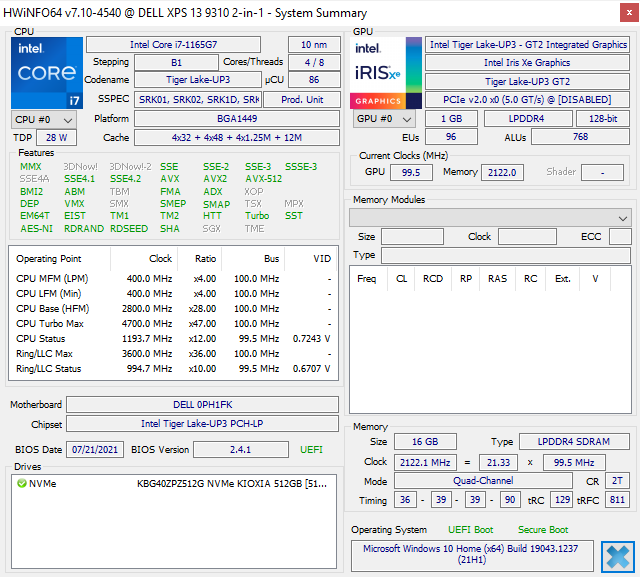
Onze testeenheid is geconfigureerd met de Core i7-1165G7 CPU, 16 GB LPDDR4x 4267 MHz RAM, en 1920 x 1200 touchscreen voor ongeveer $1600 USD. Andere opties zijn een Core i5-1135G7 CPU met half zoveel RAM of een 3840 x 2400 beeldscherm met hogere resolutie. Er zijn geen OLED-opties beschikbaar, in tegenstelling tot bij de XPS 13 9310 clamshell.
We raden aan om onze bestaande review van de XPS 13 7390 2-in-1 om meer te weten te komen over de fysieke kenmerken van het chassis, aangezien al onze opmerkingen ook gelden voor de 9310 2-in-1. Deze review zal zich richten op de prestaties van de XPS 13 9310 2-in-1 en wat gebruikers kunnen verwachten ten opzichte van de oudere maar visueel identieke 7390 2-in-1.
Concurrenten op dit gebied zijn andere 13-inch subnotebook convertibles zoals de Lenovo Yoga 6 13, Asus ZenBook Flip 13, Samsung Galaxy Book Pro 360 13of MSI Summit E13 Flip. Er is ook een clamshell-versie van de XPS 13 9310 2-in-1 verkrijgbaar, simpelweg de XPS 13 9310 genoemd.
Meer Dell reviews
potential competitors in comparison
Evaluatie | Datum | Model | Gewicht | Hoogte | Formaat | Resolutie | Beste prijs |
|---|---|---|---|---|---|---|---|
| 86.7 % v7 (old) | 10-2021 | Dell XPS 13 9310 2-in-1 i7-1165G7, Iris Xe G7 96EUs | 1.3 kg | 14.35 mm | 13.40" | 1920x1200 | |
| 88.1 % v7 (old) | 10-2020 | Dell XPS 13 9310 Core i7 FHD i7-1165G7, Iris Xe G7 96EUs | 1.3 kg | 14.8 mm | 13.40" | 1920x1200 | |
| 86.3 % v7 (old) | 11-2019 | Dell XPS 13 7390 2-in-1 Core i7 i7-1065G7, Iris Plus Graphics G7 (Ice Lake 64 EU) | 1.3 kg | 13 mm | 13.40" | 1920x1200 | |
| 84.7 % v7 (old) | 07-2021 | Lenovo Yoga 6 13 82ND0009US R5 5500U, Vega 7 | 1.3 kg | 18.2 mm | 13.30" | 1920x1080 | |
| 86.3 % v7 (old) | 07-2021 | Asus ZenBook Flip 13 UX363EA-HP069T i7-1165G7, Iris Xe G7 96EUs | 1.2 kg | 13 mm | 13.30" | 1920x1080 | |
| 85.4 % v7 (old) | 06-2021 | Samsung Galaxy Book Pro 360 13 i5-1135G7, Iris Xe G7 80EUs | 1.1 kg | 13 mm | 13.20" | 1920x1080 |
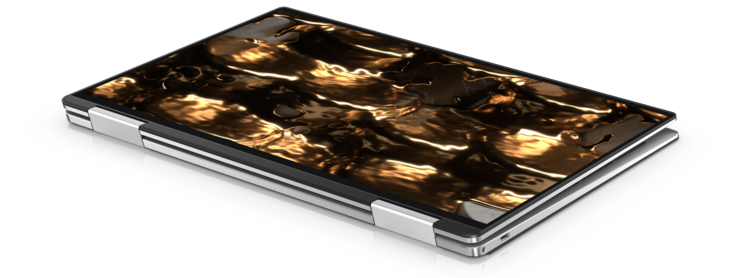
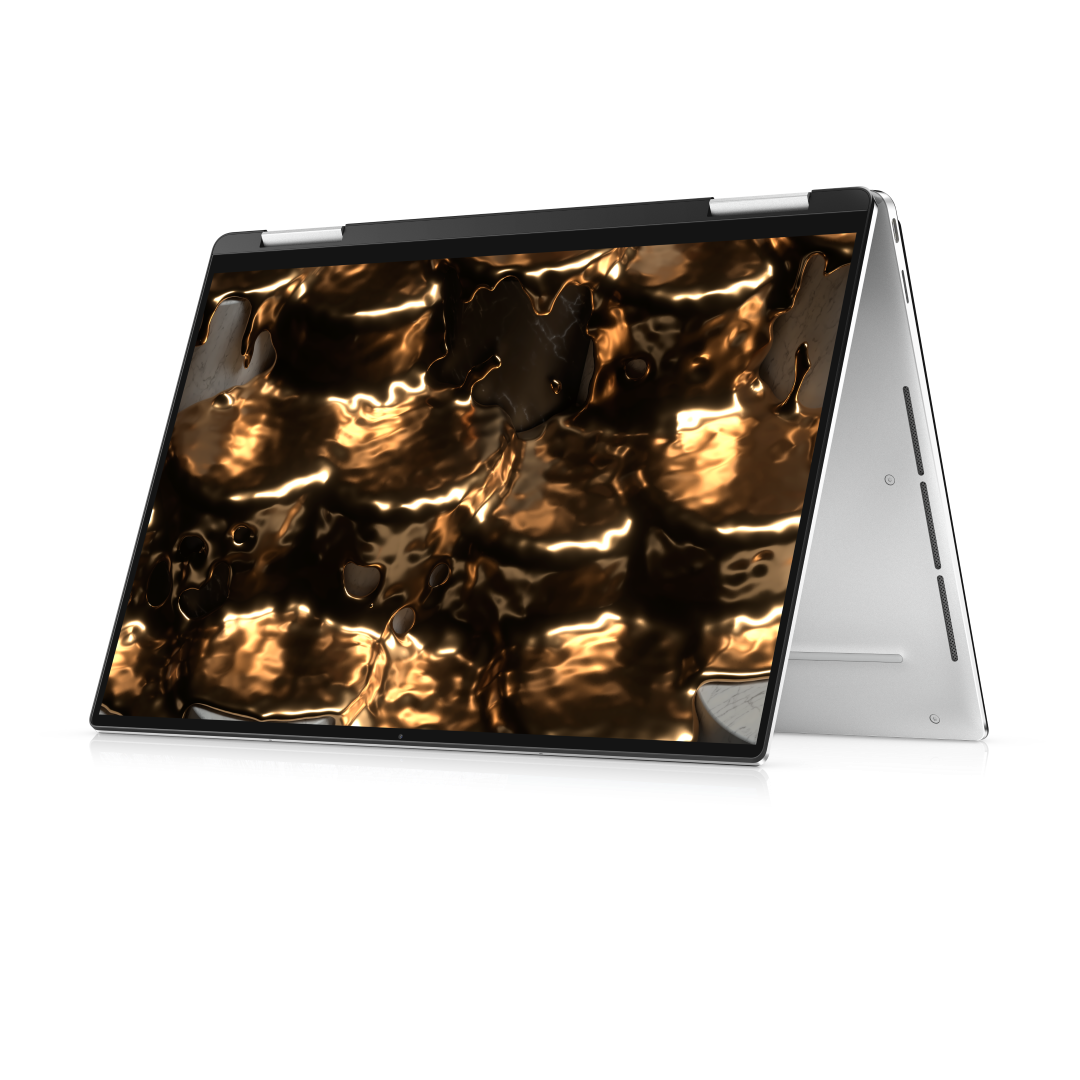
Case - Nog steeds de strakste cabriolet die er is
Het chassis blijft identiek aan dat van de XPS 13 7390 2-in-1. De manier waarop Dell afmetingen meet is sindsdien echter veranderd en dus zijn de officiële afmetingen nu 14,35 x 297 x 207 mm in plaats van 13 x 296 x 207 mm op de oudere 7390 2-in-1.


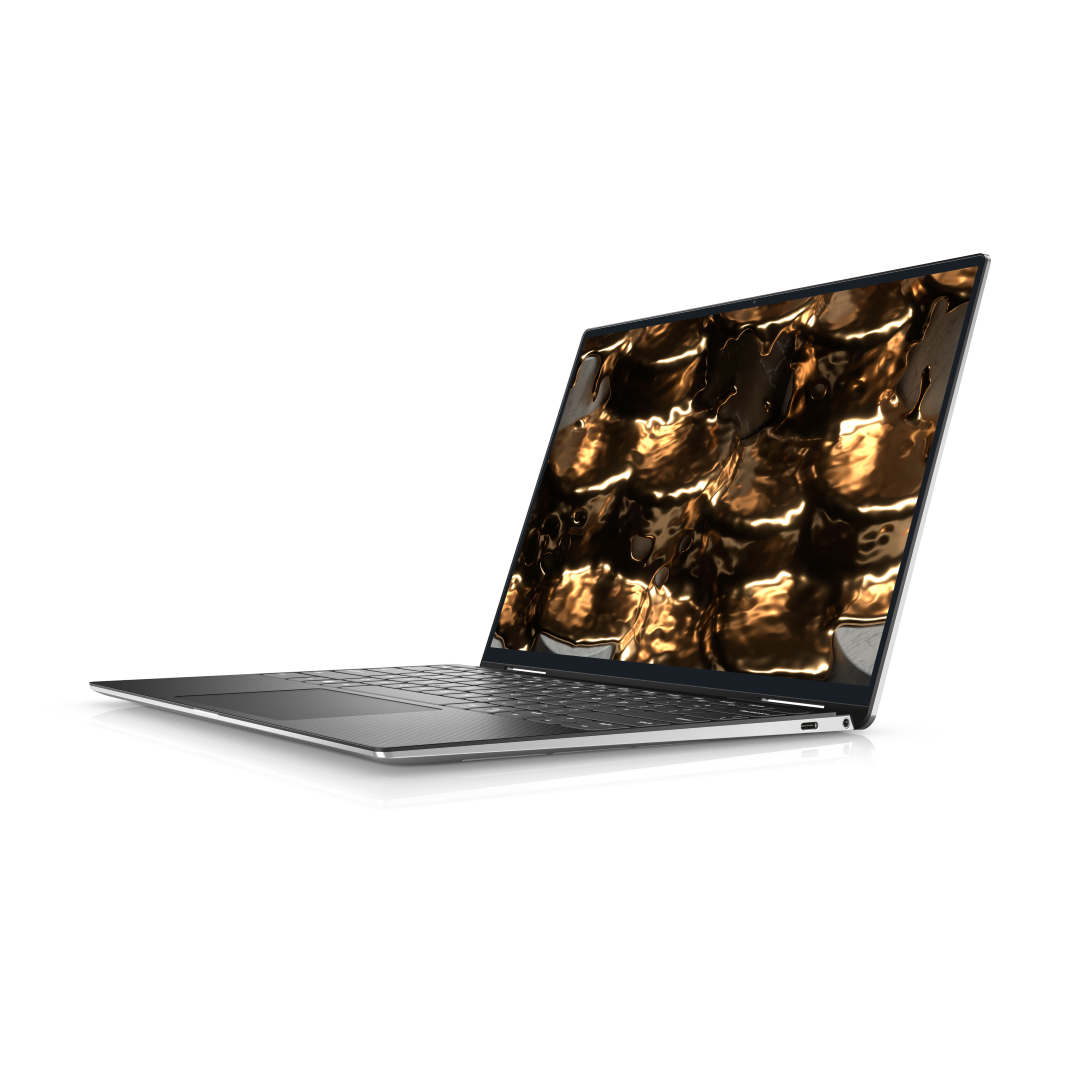

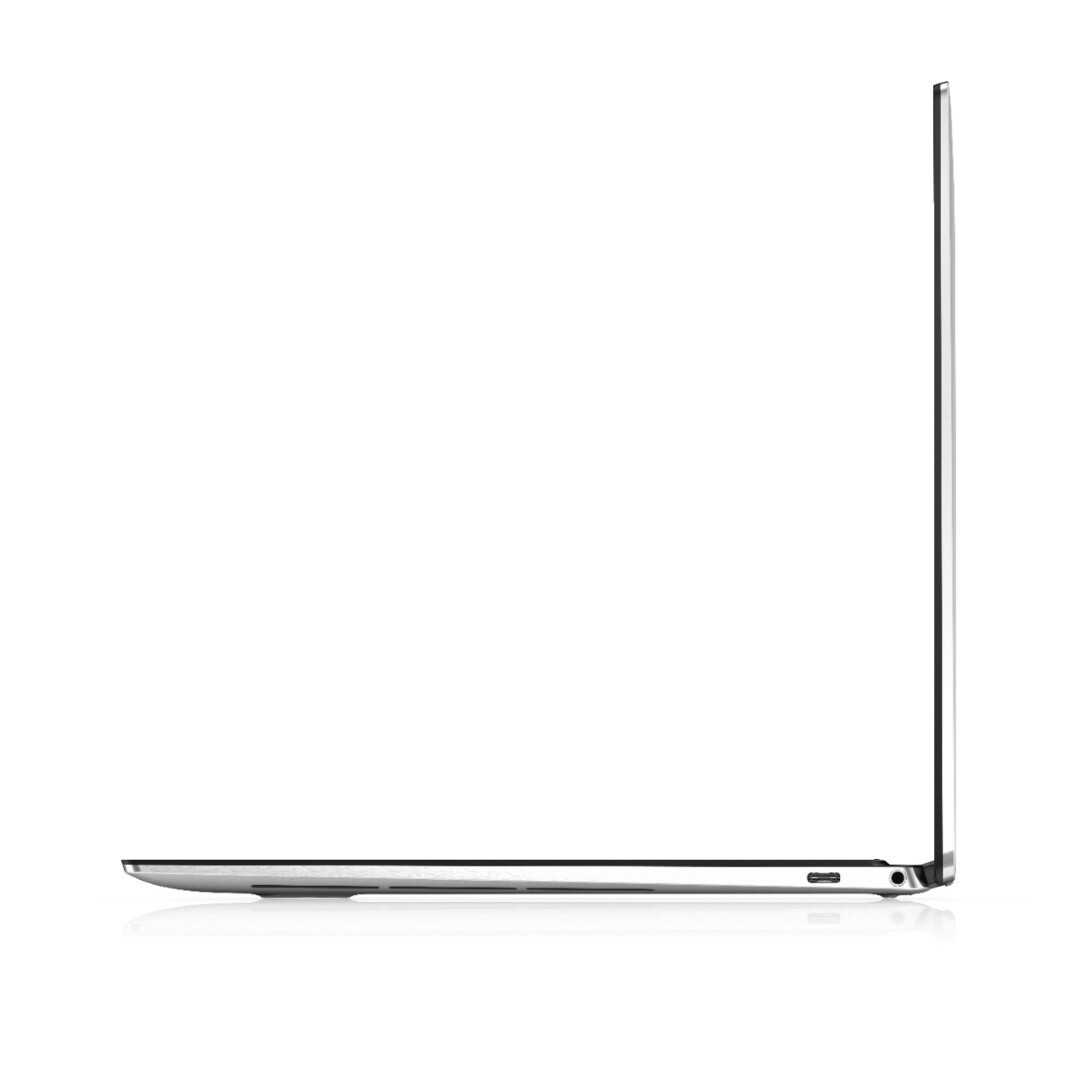
Connectiviteit - Nu met Thunderbolt 4
De twee Thunderbolt 3 poorten op het vorige generatie model zijn geüpdatet naar Thunderbolt 4. Dit zal voor de meeste gebruikers geen verschil maken, behalve voor degenen die van plan zijn externe grafische apparaten aan te sluiten.

SD-kaartlezer
| SD Card Reader | |
| average JPG Copy Test (av. of 3 runs) | |
| Dell XPS 13 9310 Core i7 FHD (Toshiba Exceria Pro M501 64 GB UHS-II) | |
| Dell XPS 13 9310 2-in-1 (AV Pro V60) | |
| Dell XPS 13 7390 2-in-1 Core i7 (Toshiba Exceria Pro M501 64 GB UHS-II) | |
| Samsung Galaxy Book Pro 360 13 | |
| maximum AS SSD Seq Read Test (1GB) | |
| Dell XPS 13 9310 Core i7 FHD (Toshiba Exceria Pro M501 64 GB UHS-II) | |
| Dell XPS 13 9310 2-in-1 (AV Pro V60) | |
| Dell XPS 13 7390 2-in-1 Core i7 (Toshiba Exceria Pro M501 64 GB UHS-II) | |
| Samsung Galaxy Book Pro 360 13 | |
Communicatie
Webcam
De lage resolutie 720p webcam blijft ongewijzigd, wat een echte domper is. De nieuwste Razer Blade laptop heeft zijn webcam geüpgraded van 720p naar 1080p zonder enige andere veranderingen aan het chassis en dus zou het geweldig zijn geweest om iets dergelijks te zien op deze XPS 13 refresh.


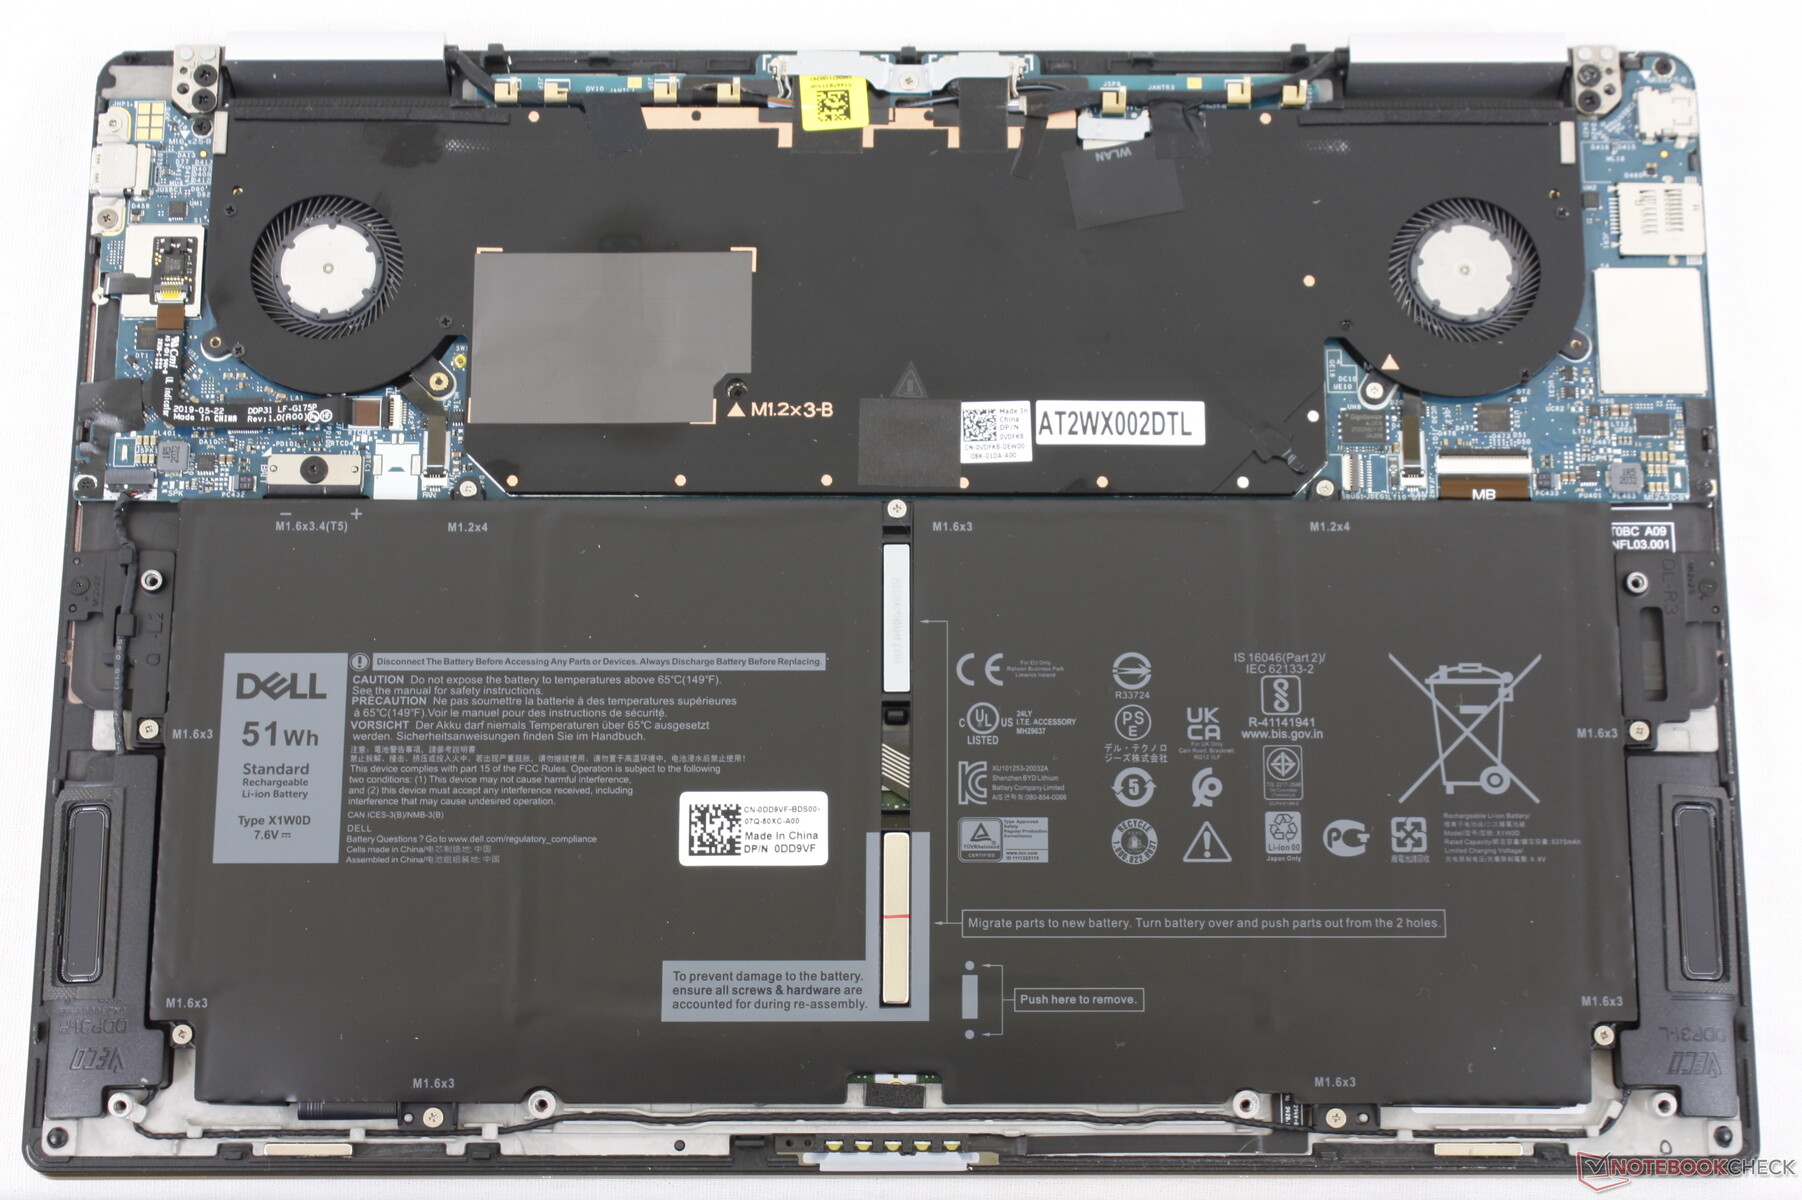
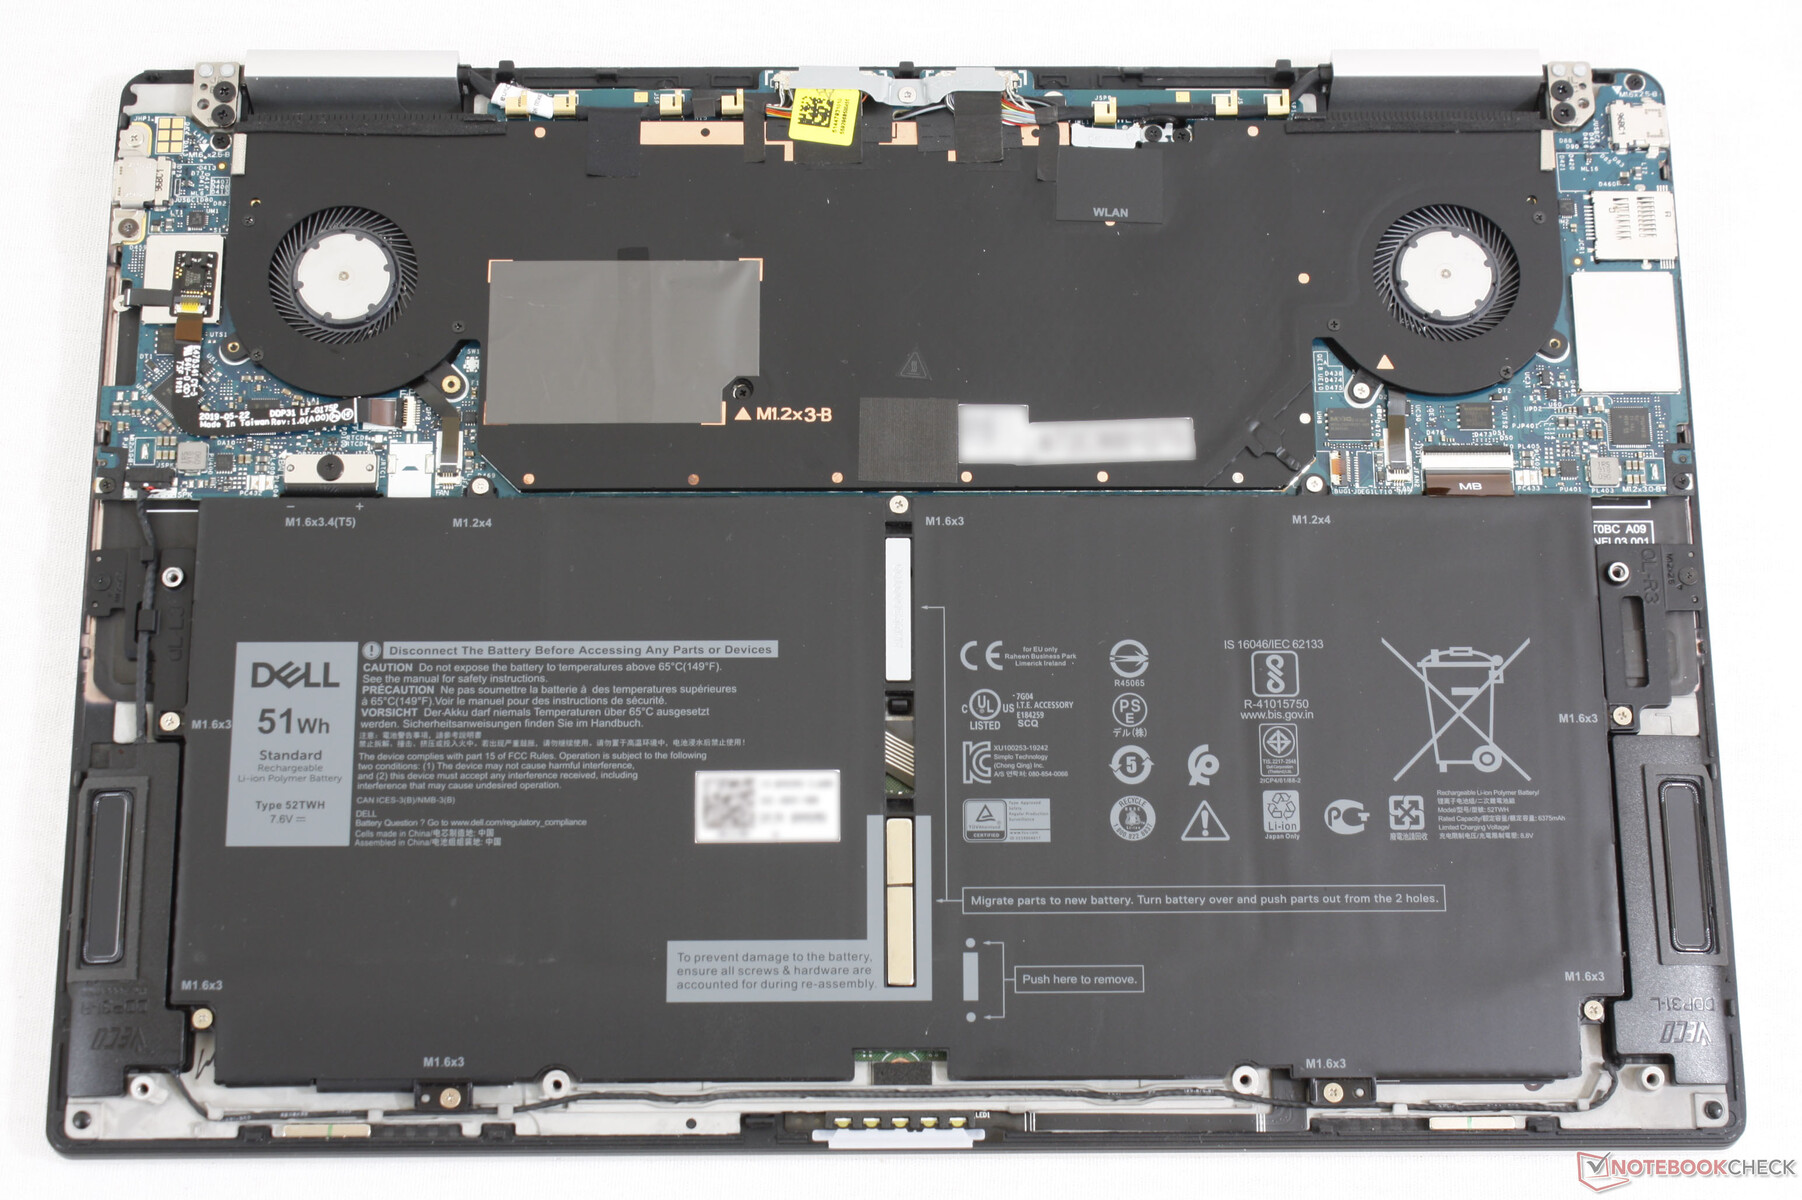
Onderhoud
Accessoires en garantie
Tot de extra's behoort een USB-C naar USB-A adapter, aangezien het systeem geen full-size USB-A poorten bevat. De verpakking is ook volledig gemaakt van gerecycled materiaal en 25 procent oceaangebonden plastic, wat een mooie milieuvriendelijke bijkomstigheid is
De standaard beperkte garantie van één jaar is van toepassing met vele uitbreidingsopties indien rechtstreeks bij Dell gekocht.
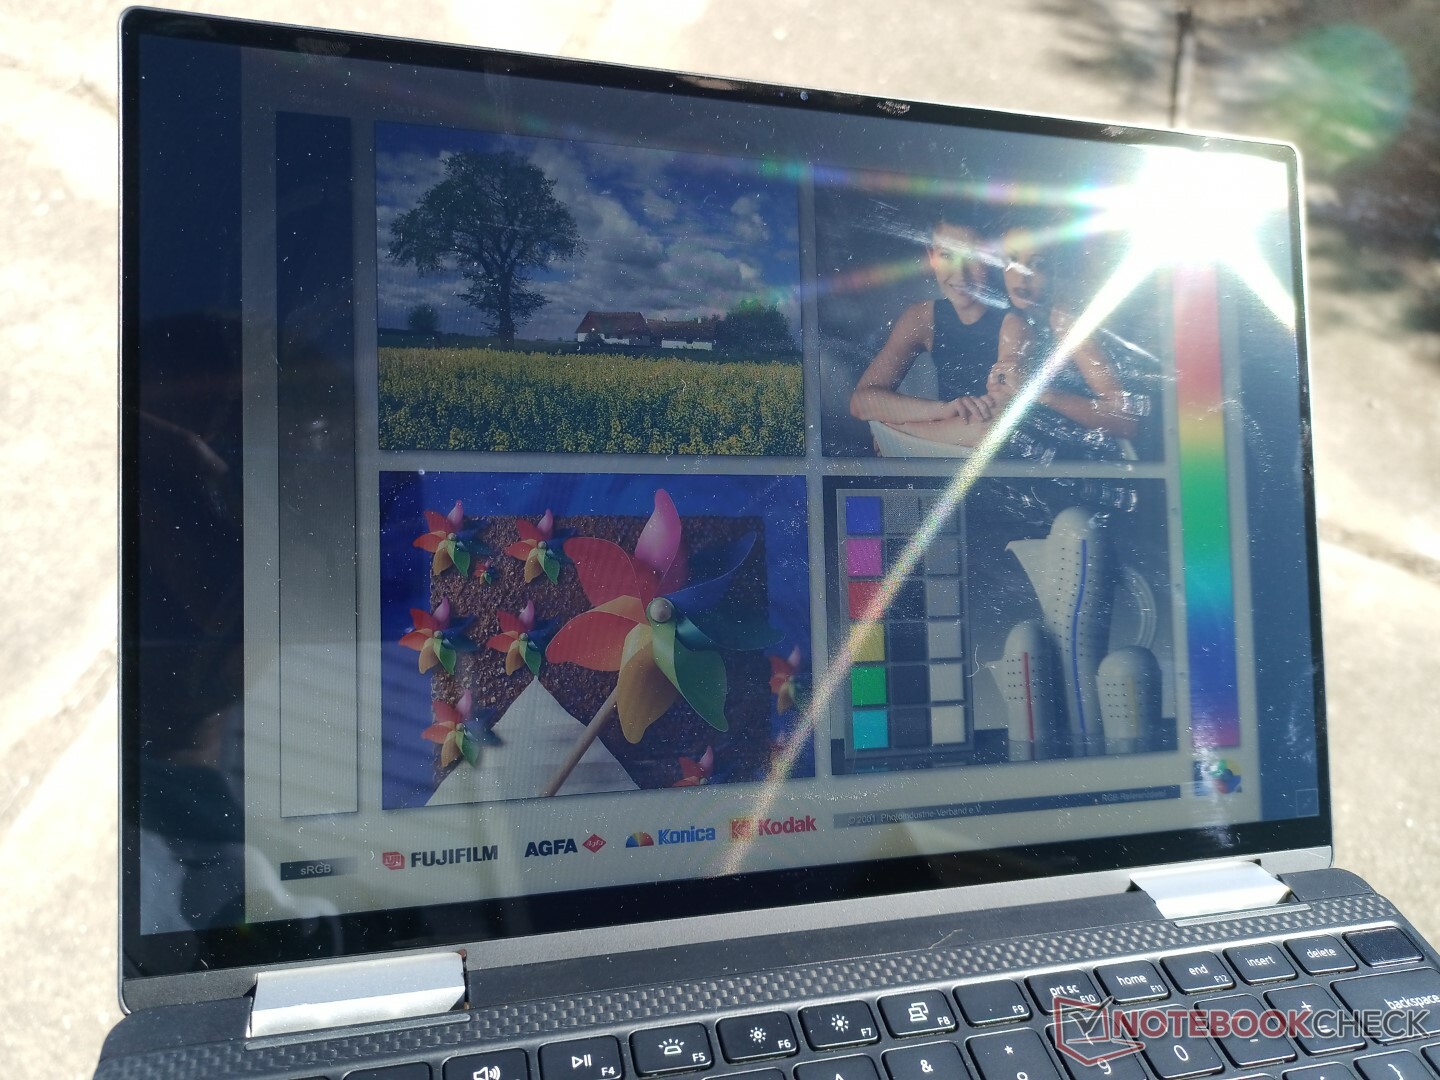
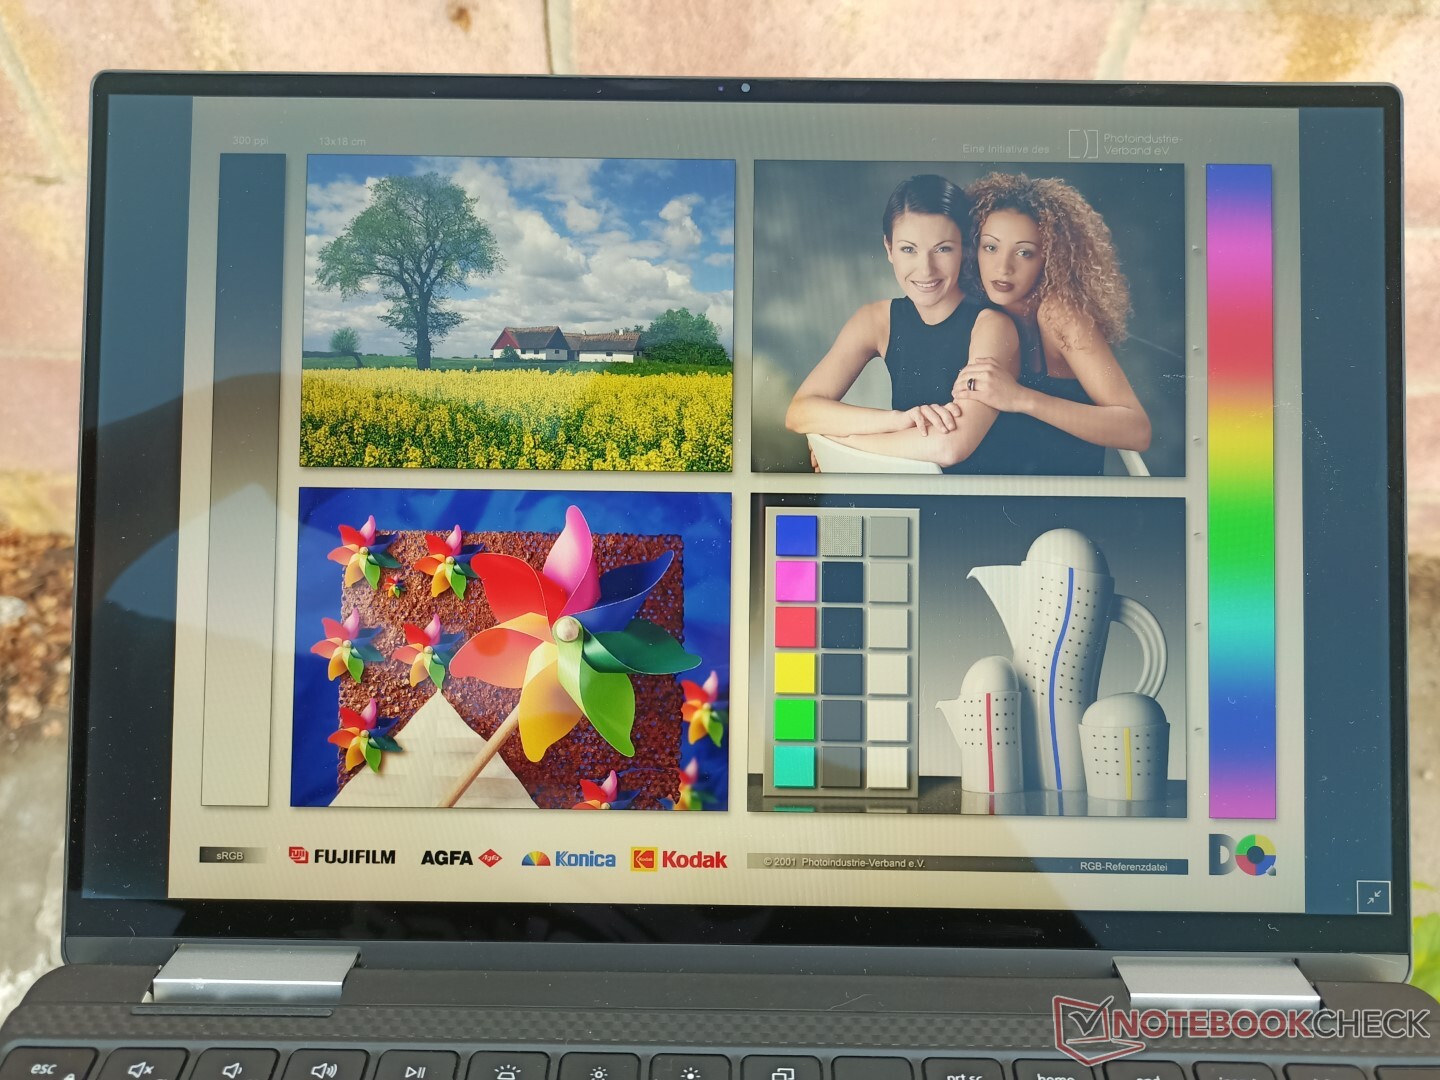
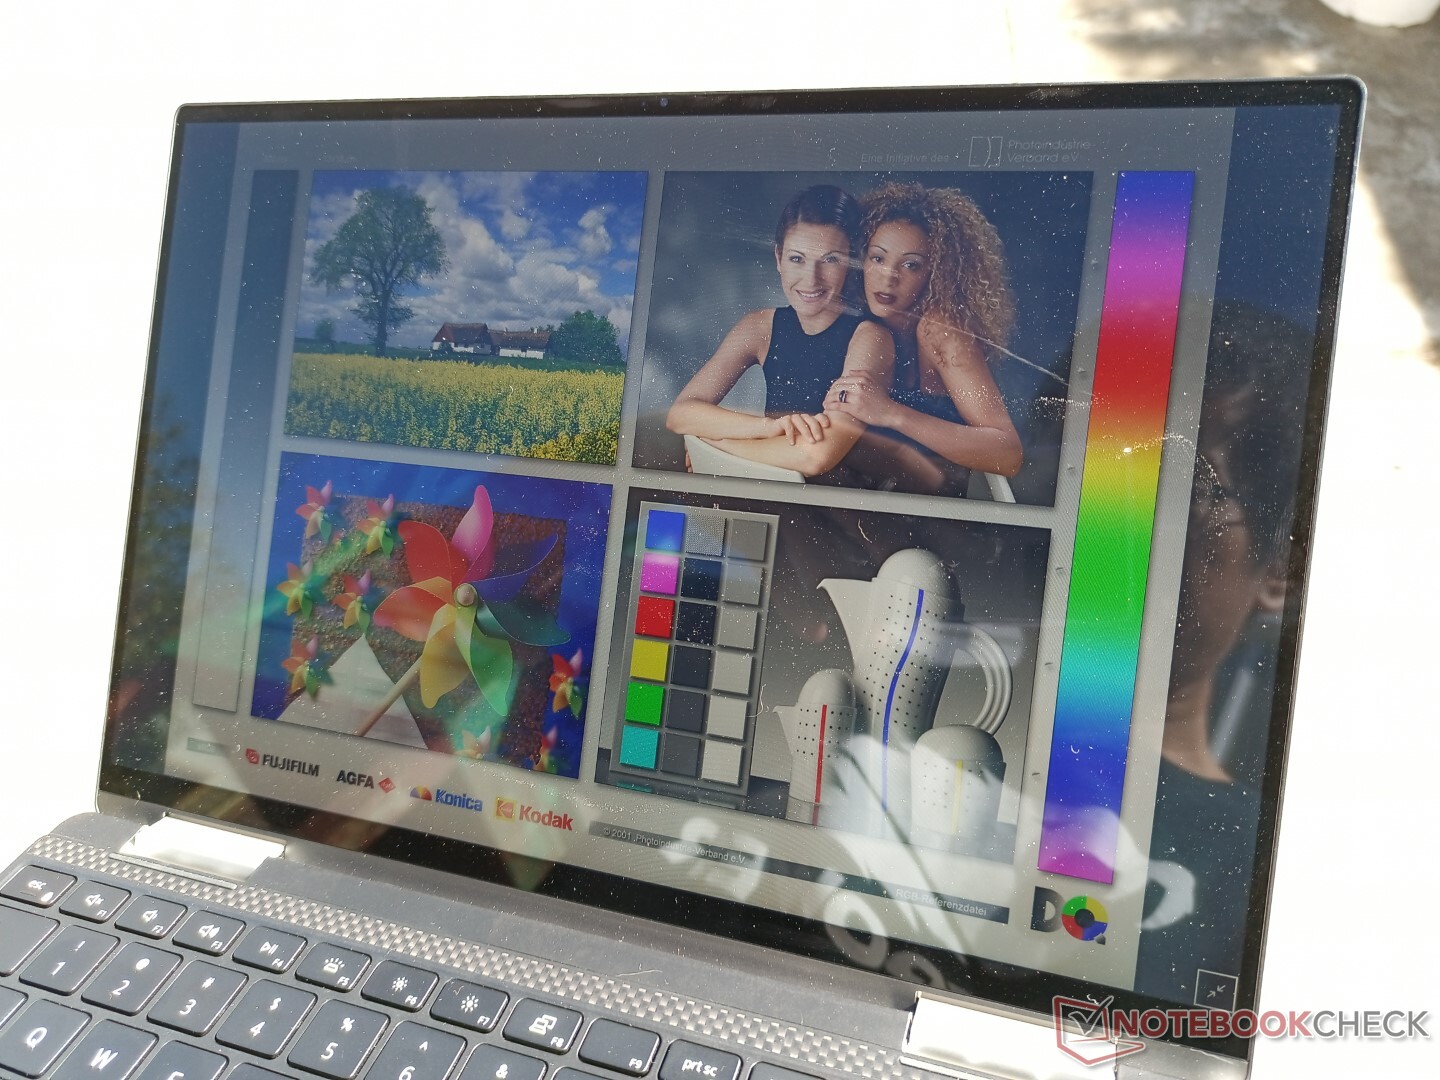
Display - We've Seen This Before
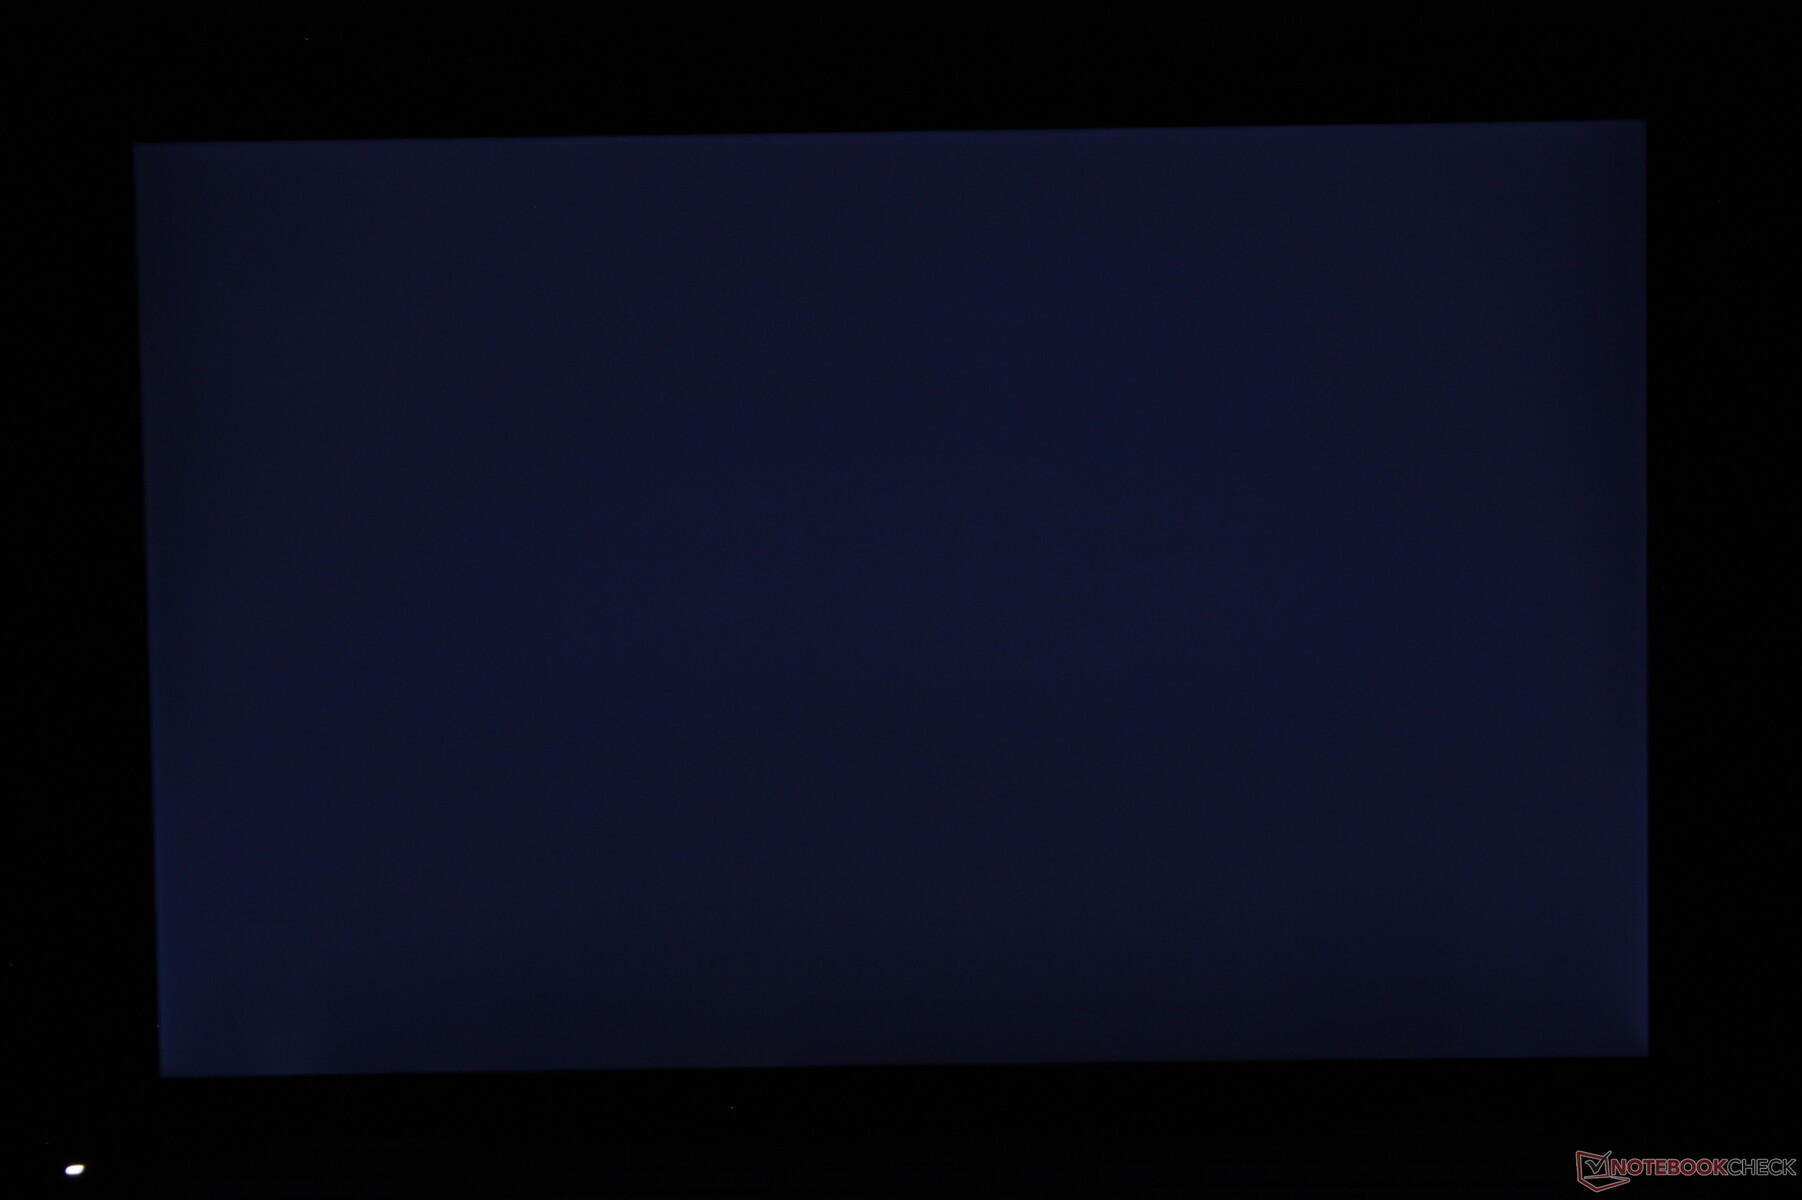
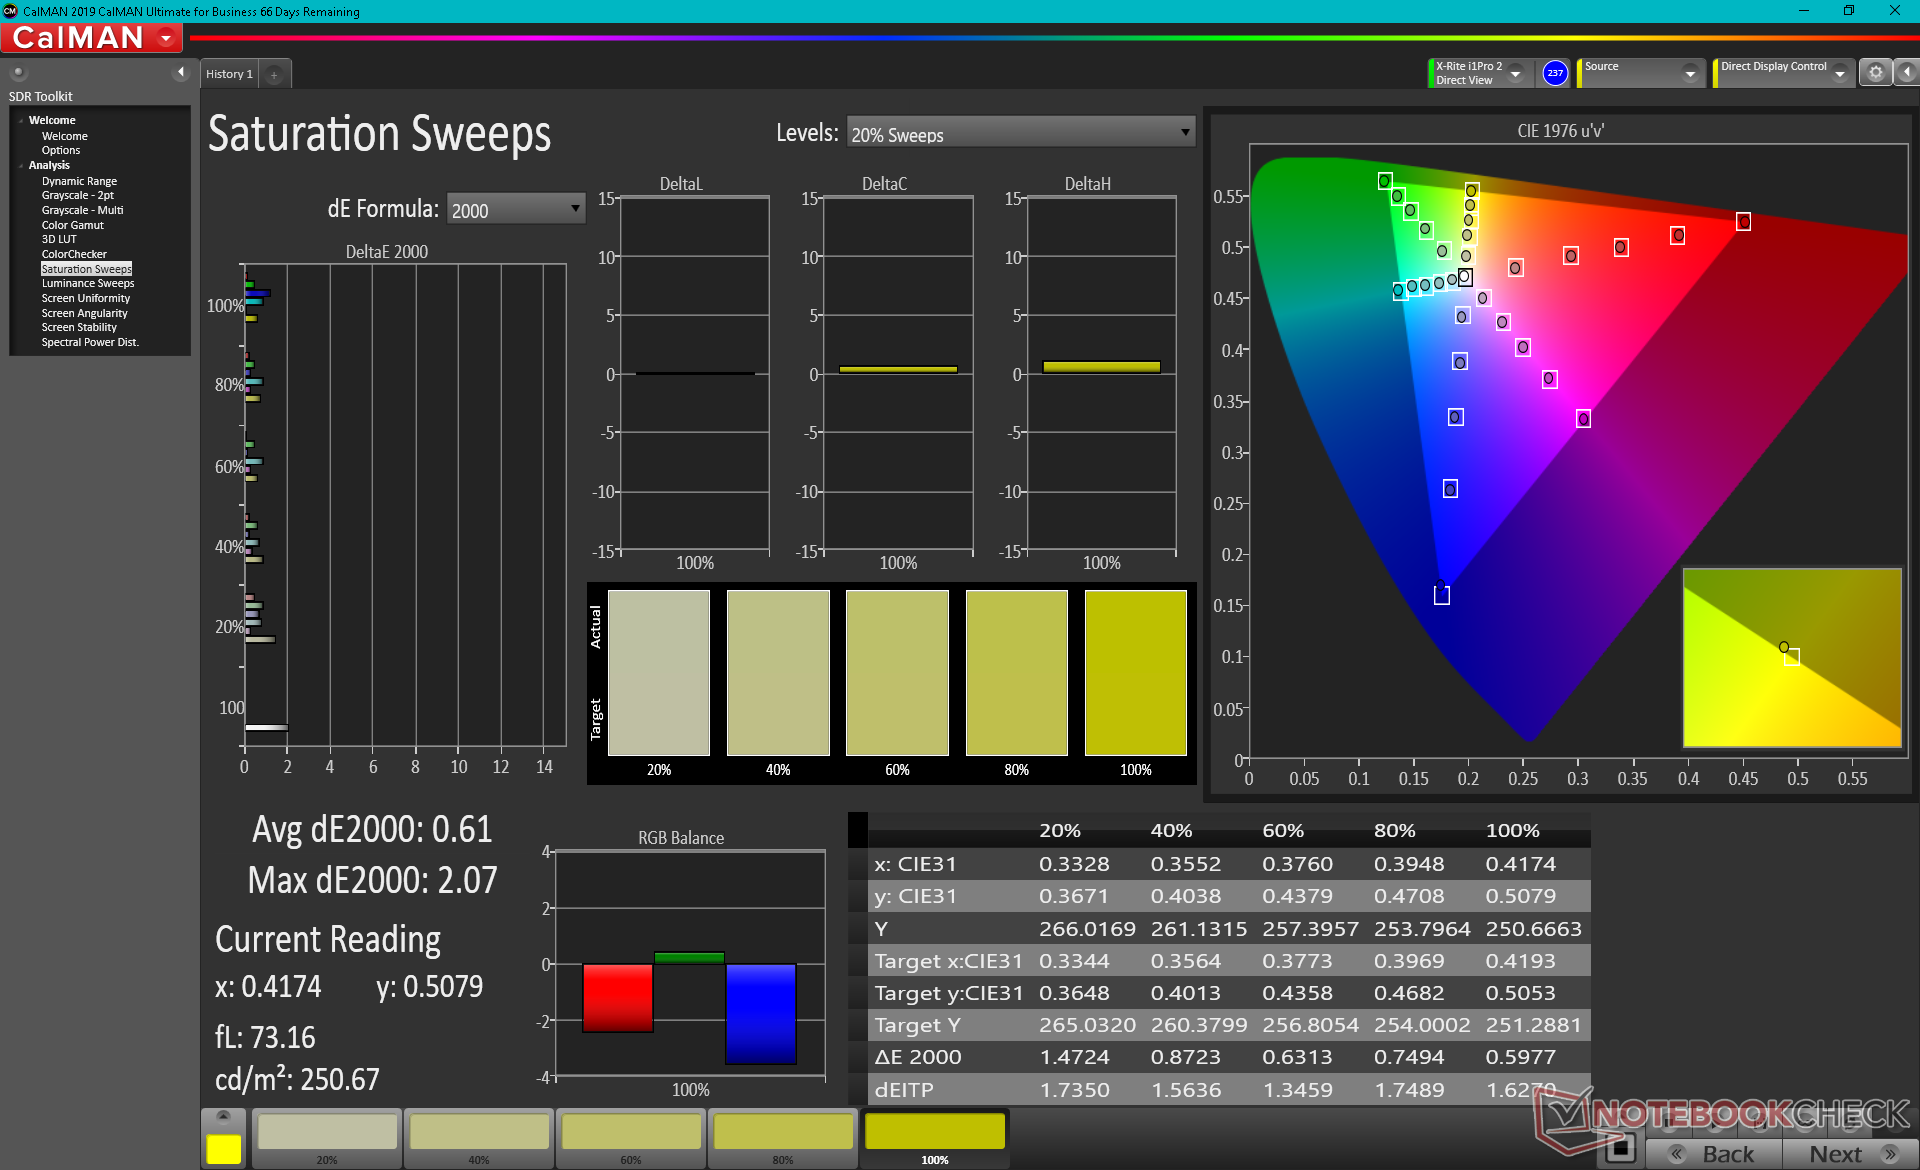
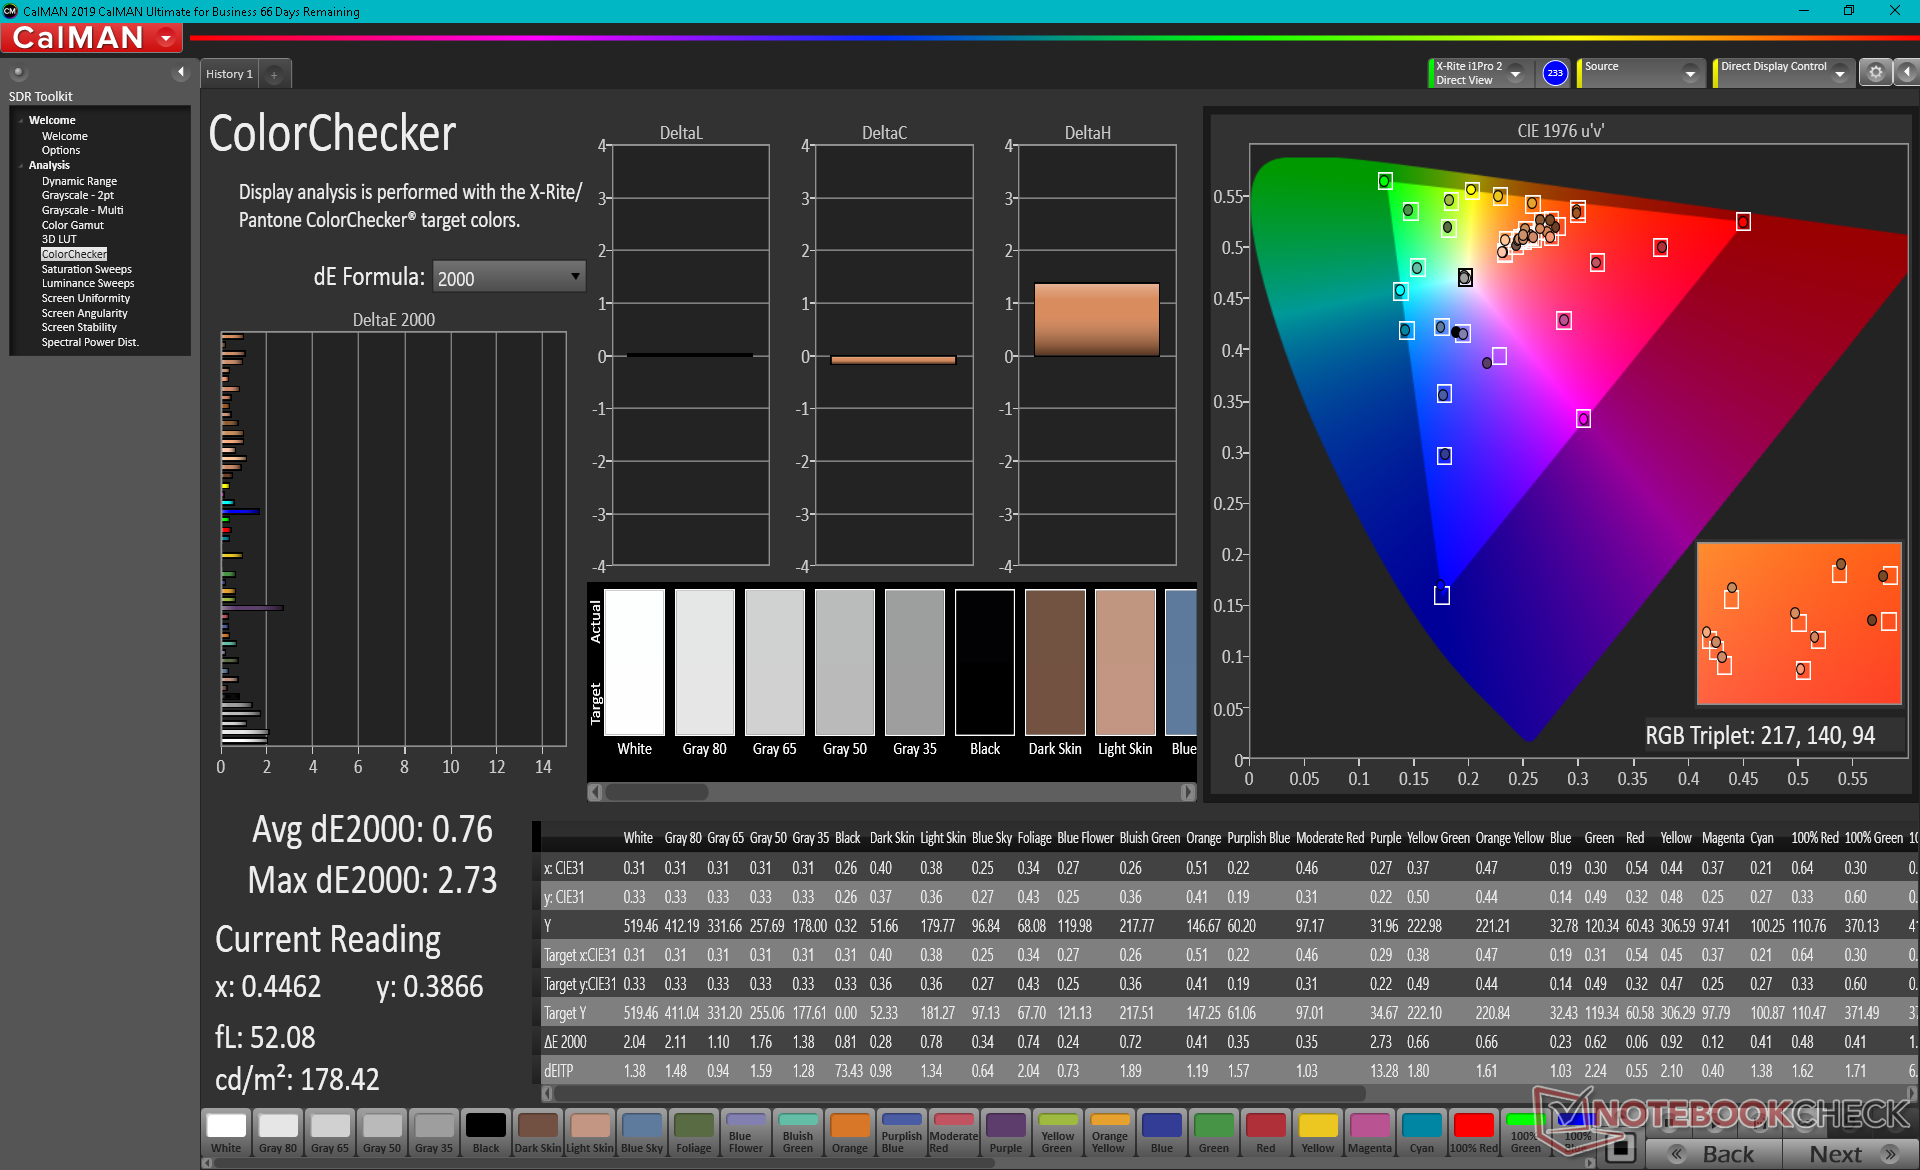
Dell gebruikt hetzelfde 1200p Sharp LQ134N1 IPS-paneel voor al haar 16:10 XPS 13 laptops, waaronder de XPS 13 7390 2-in-1, XPS 13 9300 clamshell, XPS 13 9310 clamshell en onze XPS 13 9310 2-in-1. Dit is niet per se een slechte zaak, want het blijft een helder, hoogwaardig 13,4-inch paneel met een uitstekende kleurdekking (>99 procent sRGB), hoog contrast en scherpe pixels zonder enige korreligheidsproblemen. De trage zwart-wit reactietijden zijn nog steeds een zwak punt, wat betekent dat ghosting zeer goed merkbaar is, vooral tijdens het gamen.
Een hogere resolutie UHD+ (3840 x 2400) optie is beschikbaar, waarvan we vermoeden dat het hetzelfde Sharp LQ134R1 IPS paneel is als gevonden op de XPS 13 9300.

| |||||||||||||||||||||||||
Helderheidsverdeling: 90 %
Helderheid in Batterij-modus: 555.7 cd/m²
Contrast: 1588:1 (Zwart: 0.35 cd/m²)
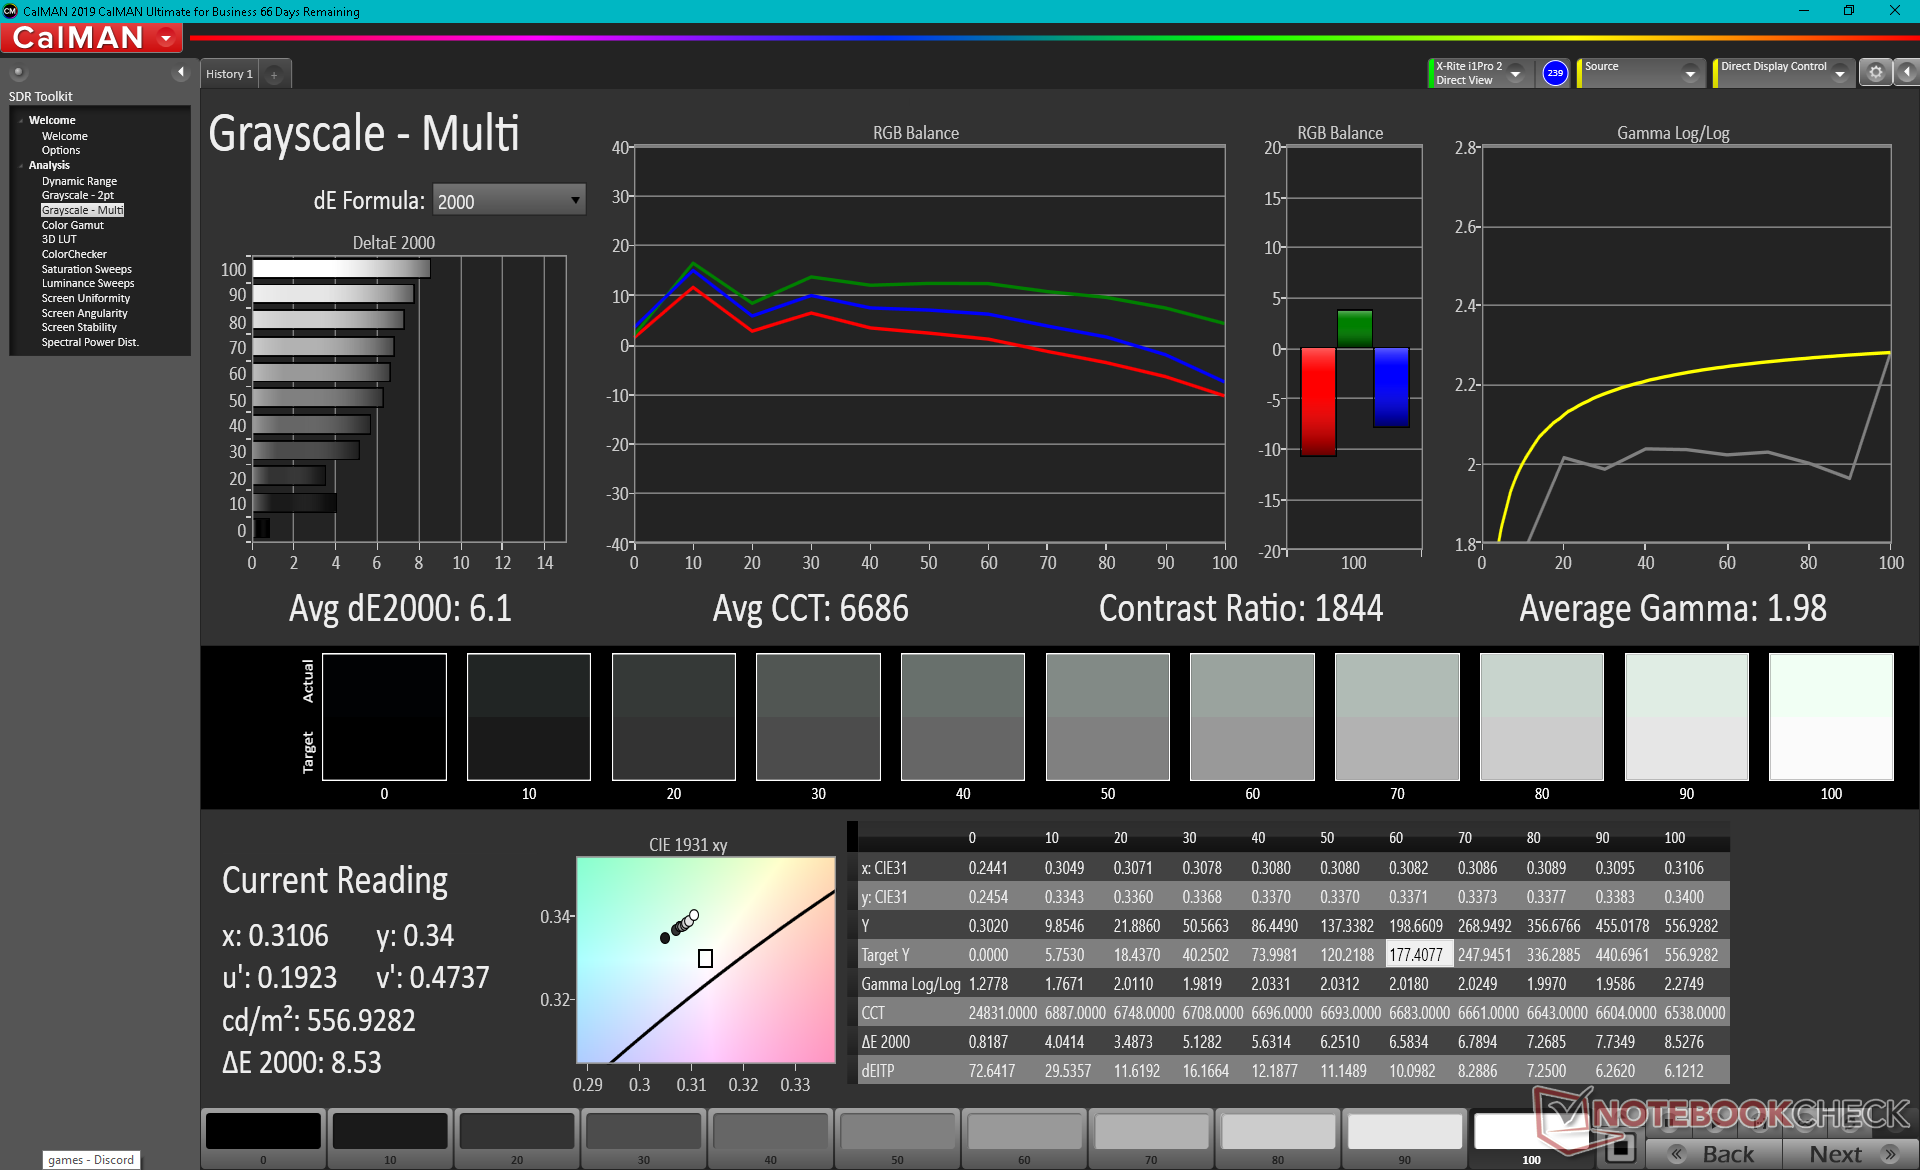
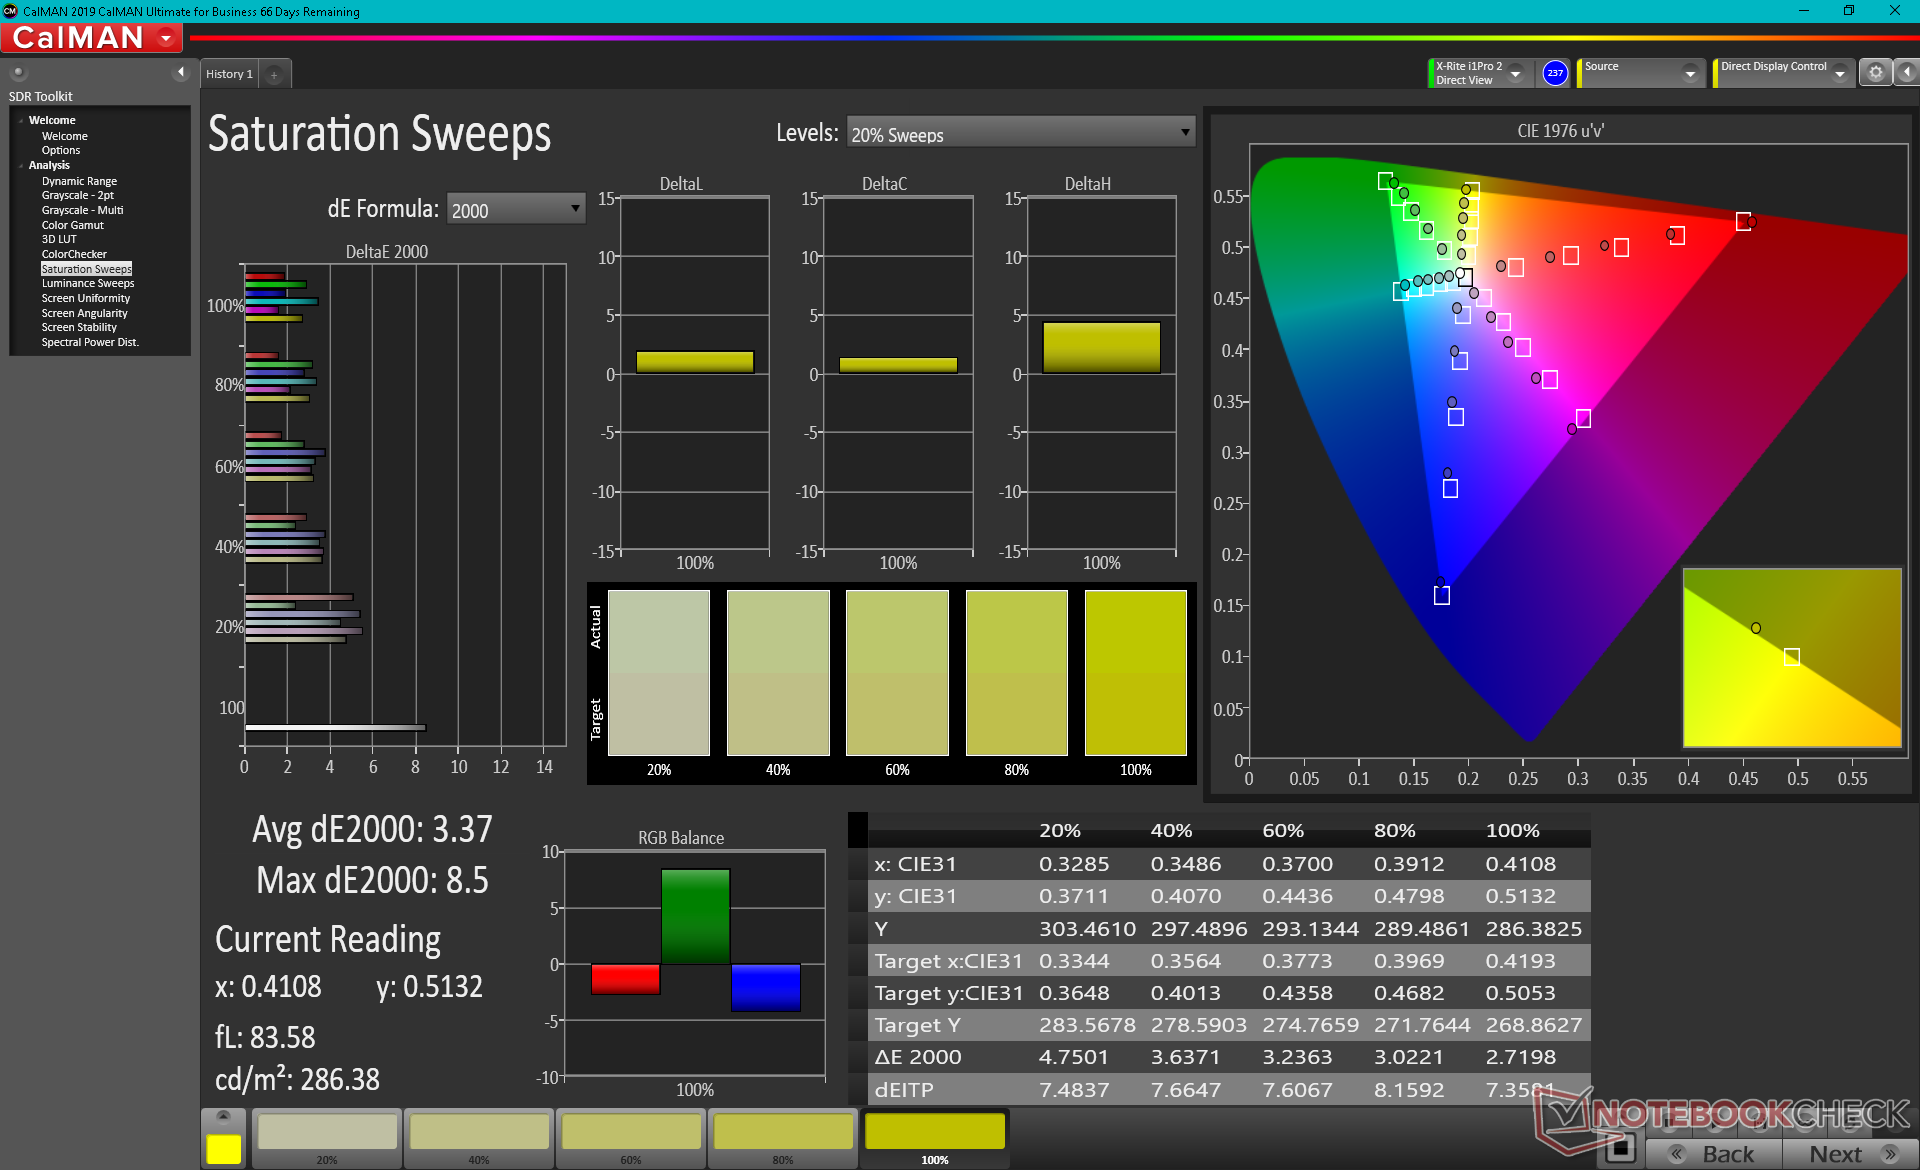
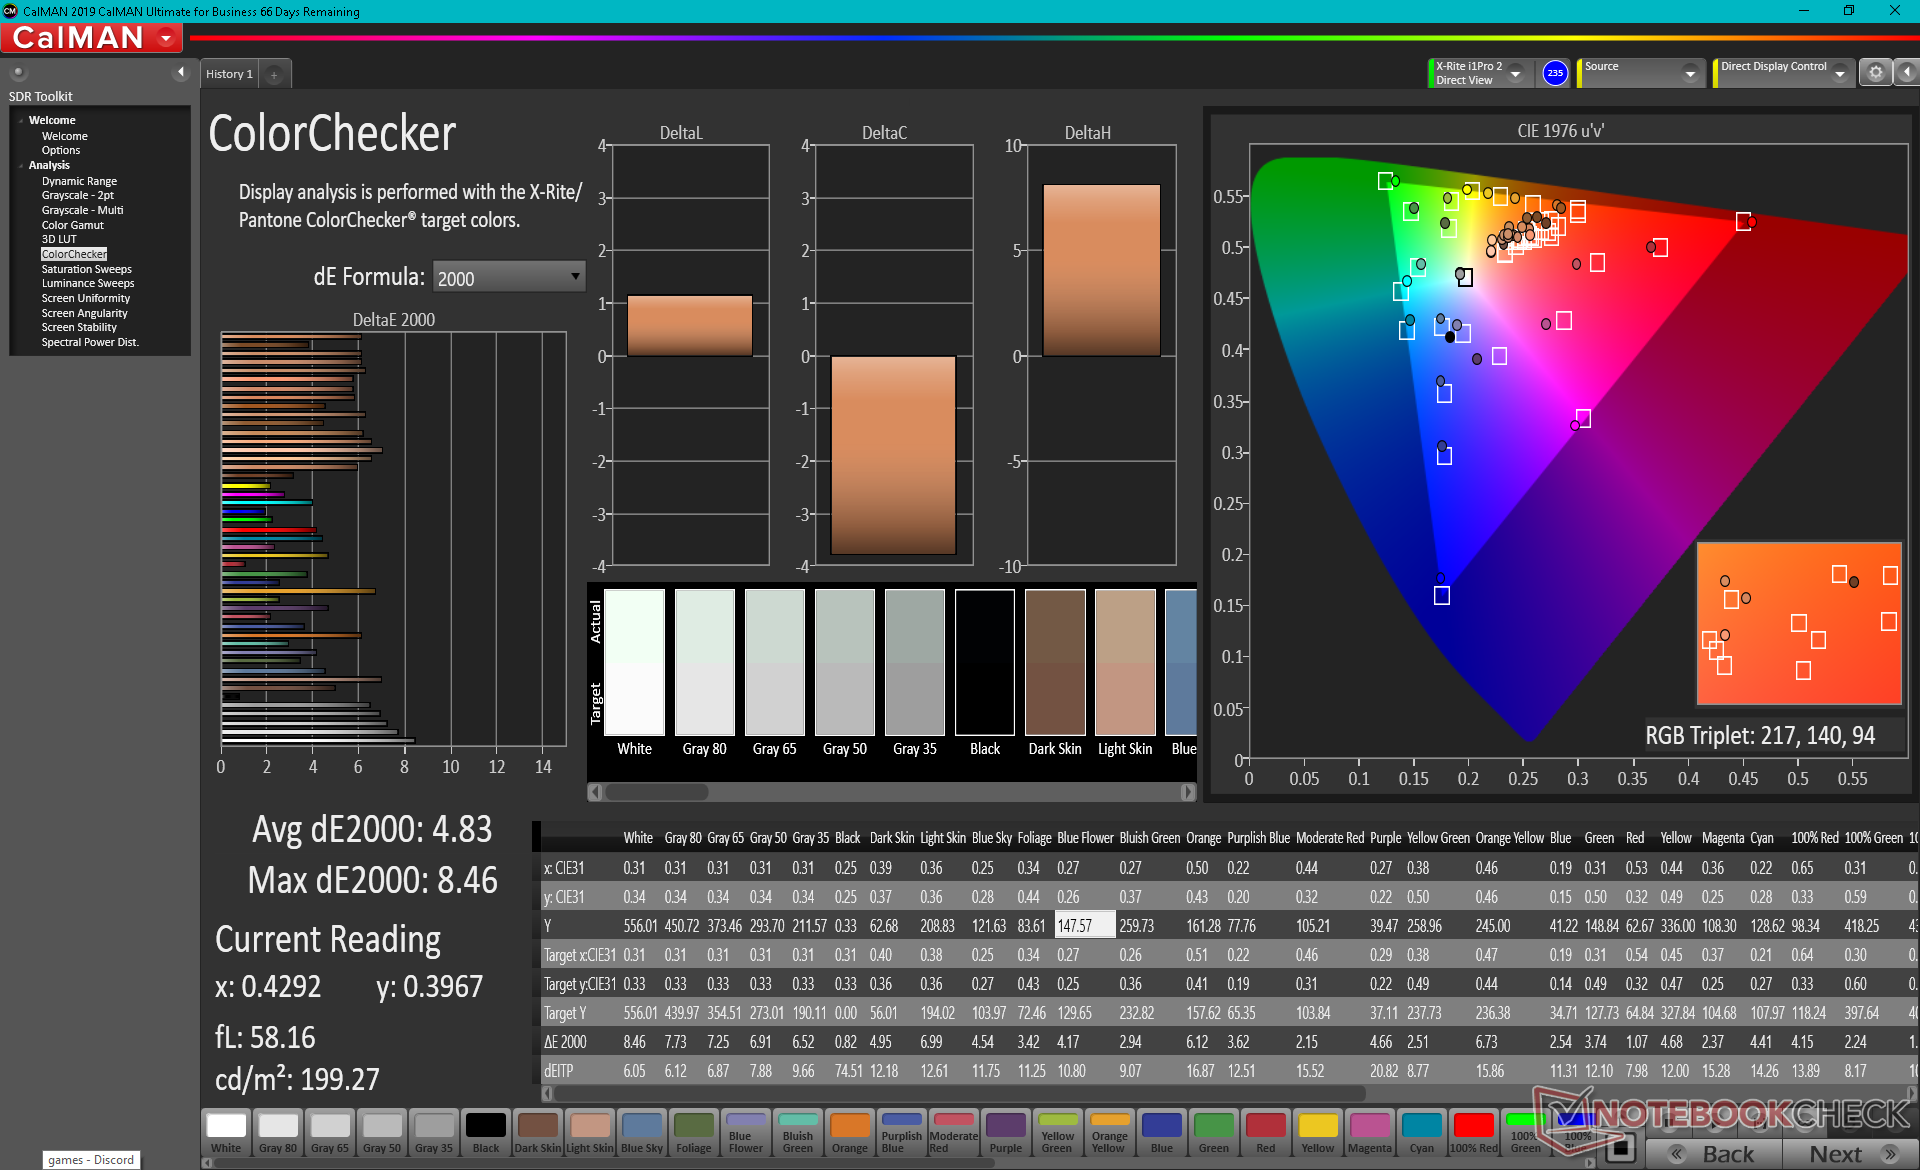
ΔE ColorChecker Calman: 4.83 | ∀{0.5-29.43 Ø4.73}
calibrated: 0.76
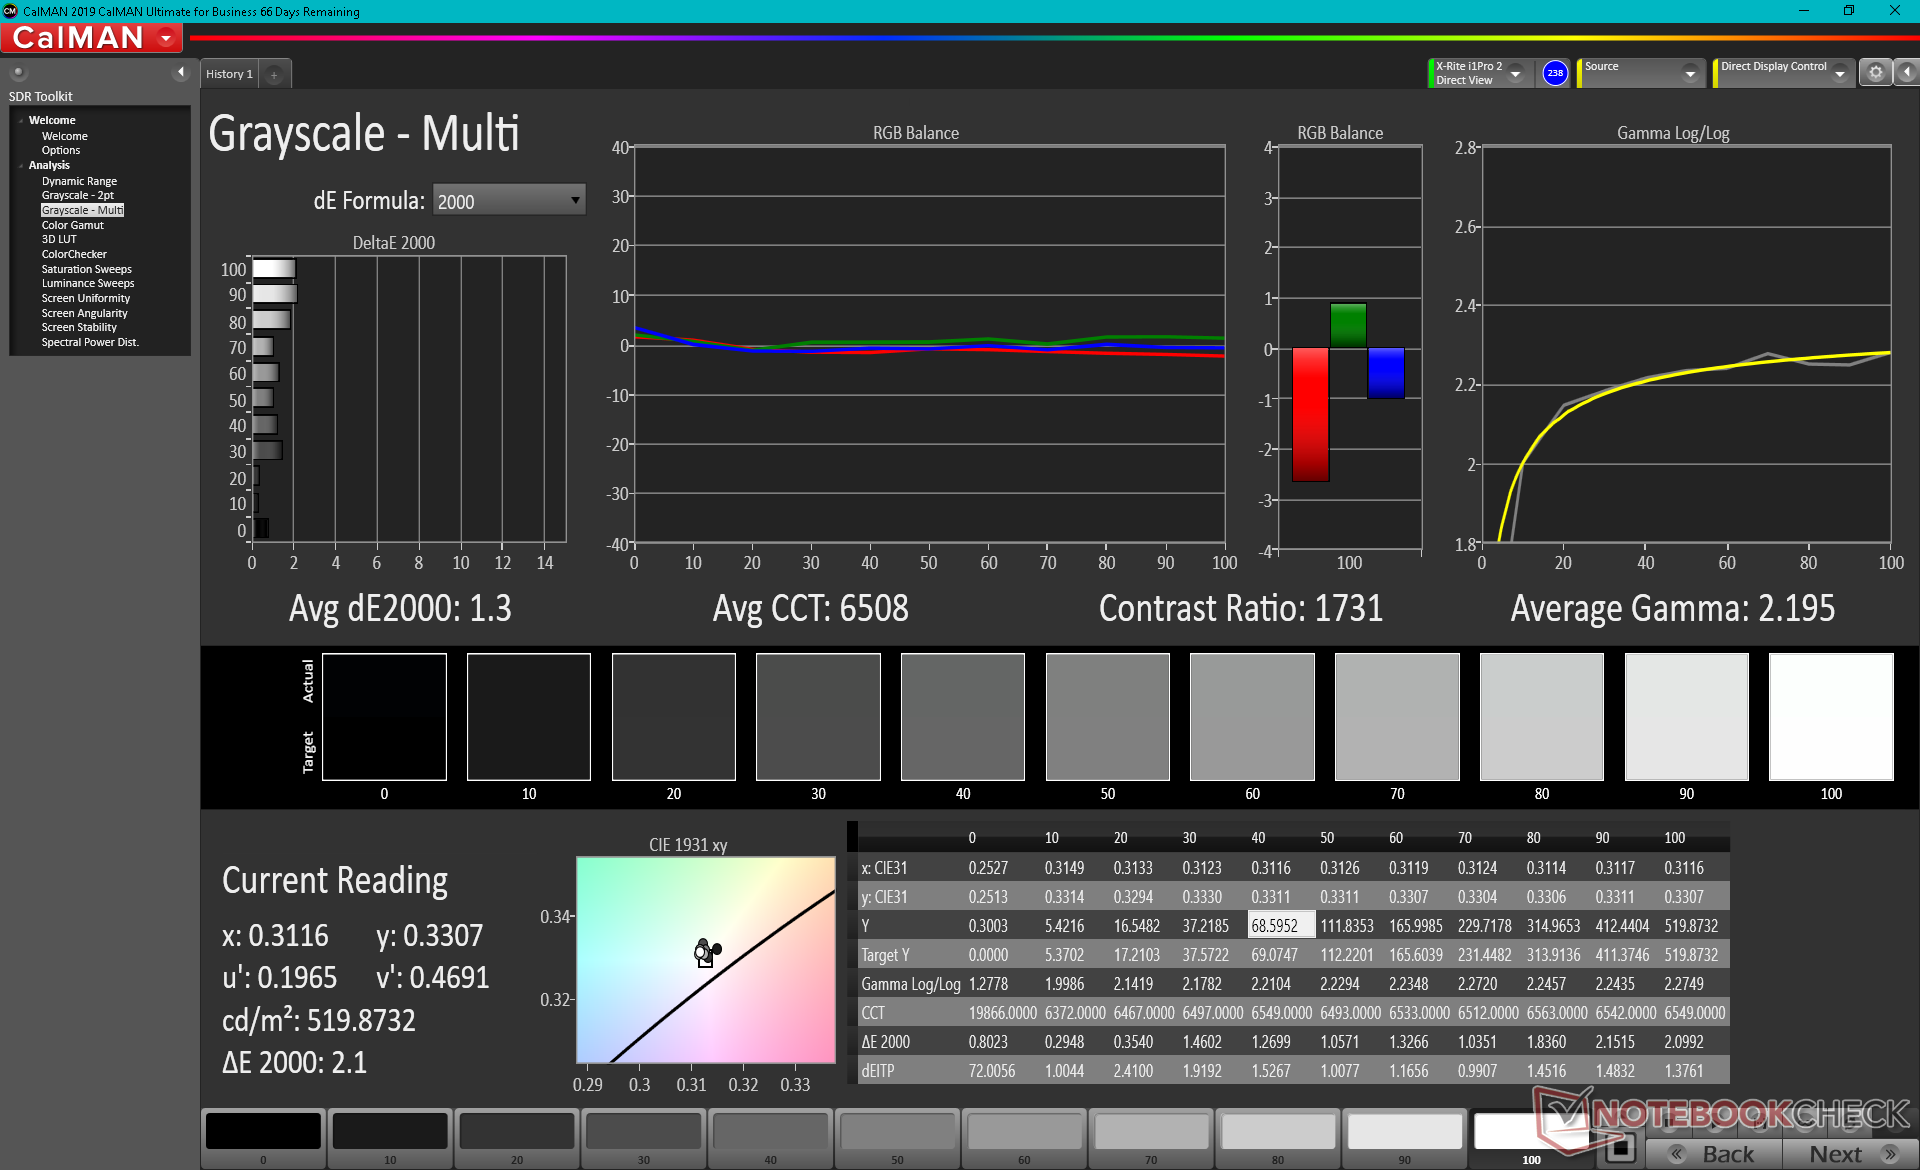
ΔE Greyscale Calman: 6.1 | ∀{0.09-98 Ø4.97}
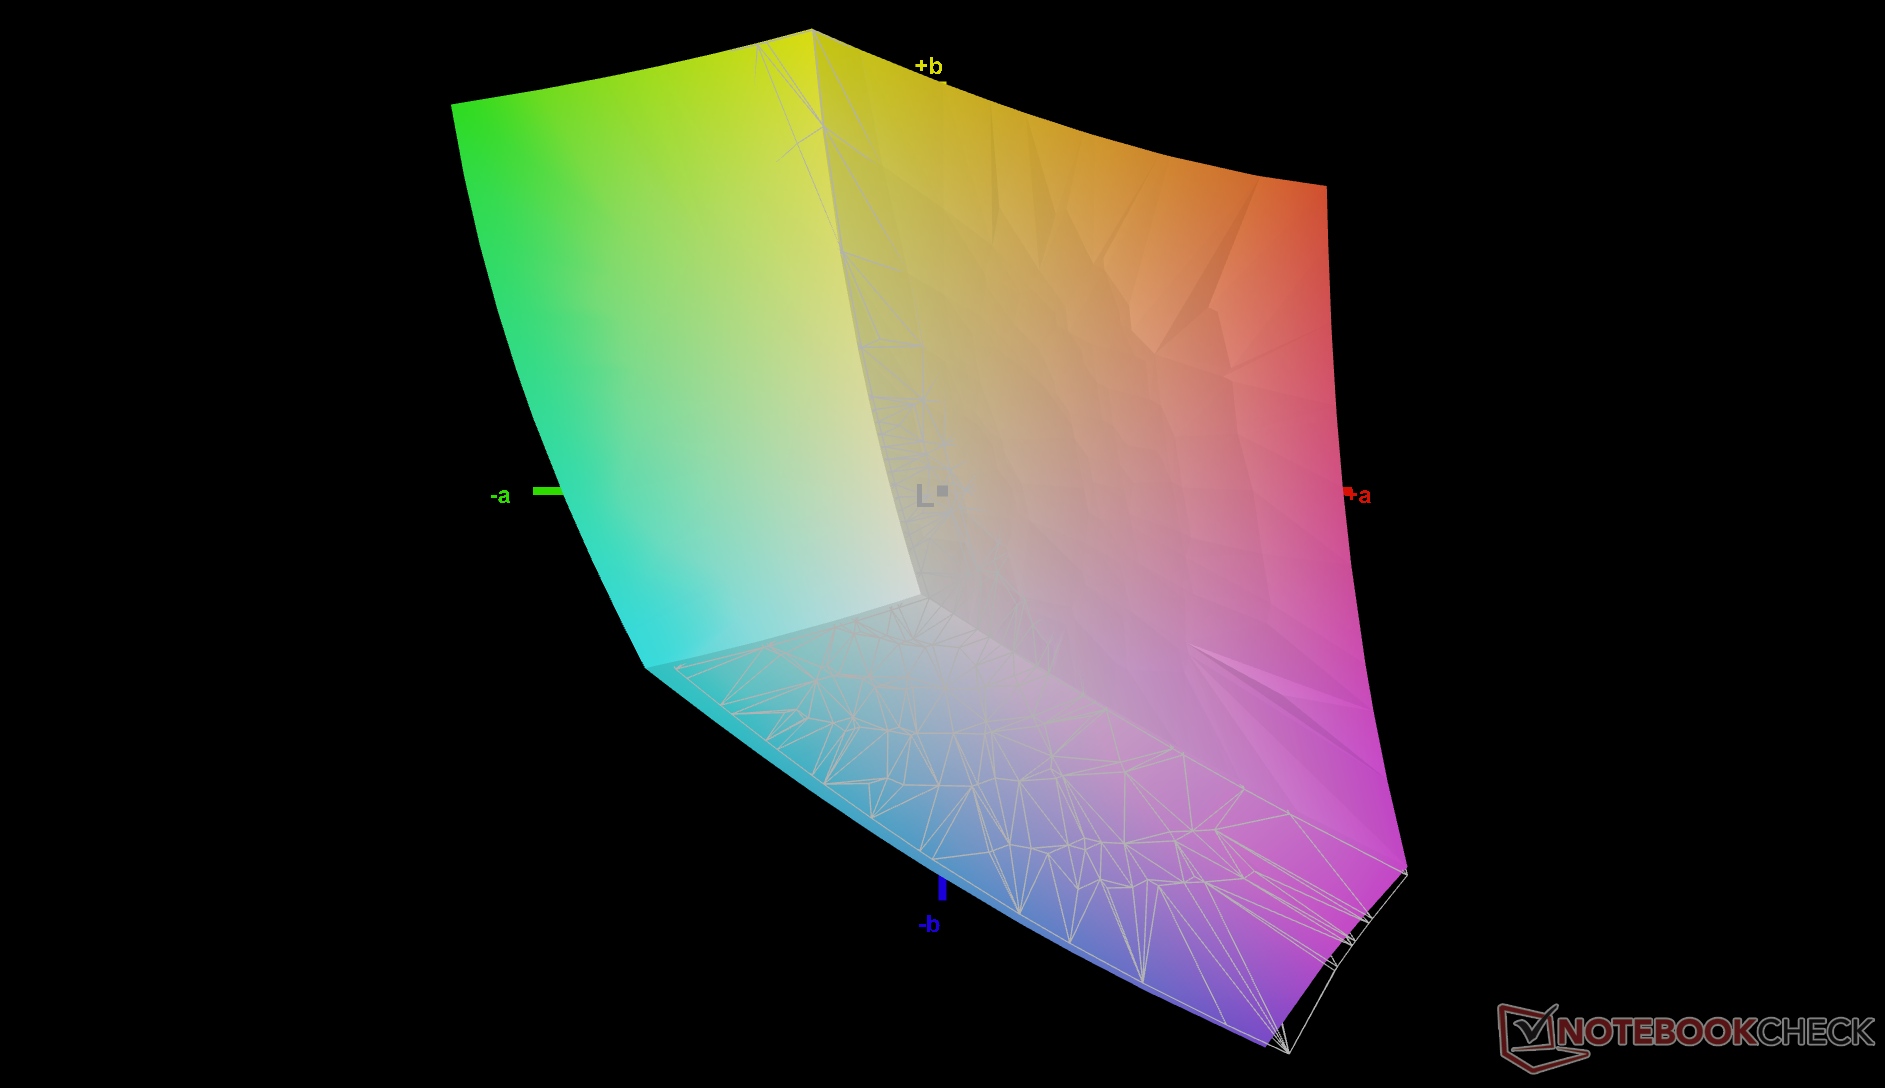
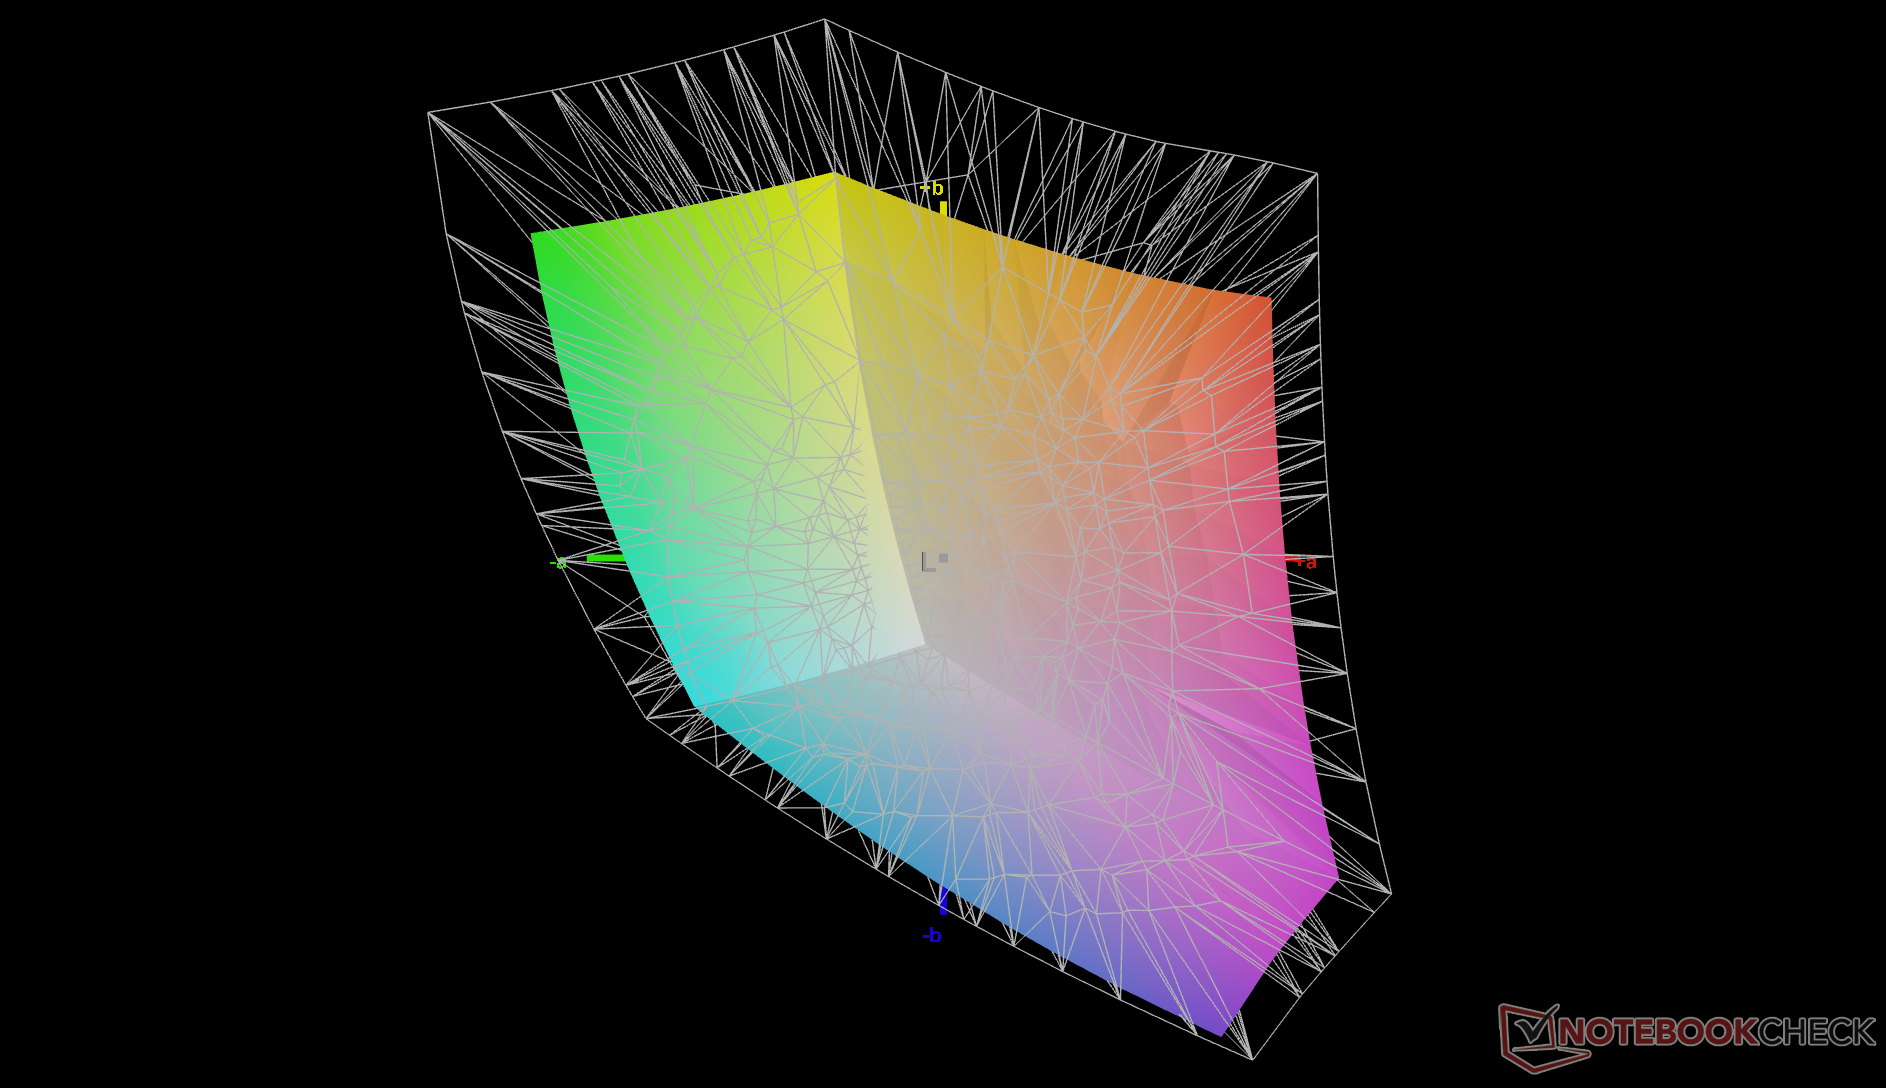
71.7% AdobeRGB 1998 (Argyll 3D)
99% sRGB (Argyll 3D)
69.7% Display P3 (Argyll 3D)
Gamma: 1.98
CCT: 6686 K
| Dell XPS 13 9310 2-in-1 Sharp LQ134N1, IPS, 13.4", 1920x1200 | Dell XPS 13 9310 Core i7 FHD Sharp LQ134N1, IPS, 13.4", 1920x1200 | Dell XPS 13 7390 2-in-1 Core i7 Sharp LQ134N1, IPS, 13.4", 1920x1200 | Lenovo Yoga 6 13 82ND0009US AU Optronics B133HAN05.F, IPS, 13.3", 1920x1080 | Asus ZenBook Flip 13 UX363EA-HP069T Samsung, SDC414A, OLED, 13.3", 1920x1080 | Samsung Galaxy Book Pro 360 13 AMOLED, 13.2", 1920x1080 | |
|---|---|---|---|---|---|---|
| Display | 1% | 0% | 0% | 26% | ||
| Display P3 Coverage (%) | 69.7 | 70.9 2% | 69.9 0% | 69.7 0% | 99.4 43% | |
| sRGB Coverage (%) | 99 | 99.1 0% | 99.2 0% | 99.2 0% | 100 1% | |
| AdobeRGB 1998 Coverage (%) | 71.7 | 72.9 2% | 71.5 0% | 71.4 0% | 96 34% | |
| Response Times | 12% | 21% | 23% | 96% | 96% | |
| Response Time Grey 50% / Grey 80% * (ms) | 55.6 ? | 52 ? 6% | 47.6 ? 14% | 46.8 ? 16% | 2 ? 96% | 2 ? 96% |
| Response Time Black / White * (ms) | 40.4 ? | 33.2 ? 18% | 29.2 ? 28% | 28.8 ? 29% | 2 ? 95% | 2 ? 95% |
| PWM Frequency (Hz) | 2500 ? | 2475 ? | 2500 ? | 60 | 60 ? | |
| Screen | -2% | 7% | -8% | -38% | 235% | |
| Brightness middle (cd/m²) | 555.7 | 543.3 -2% | 549.8 -1% | 291.5 -48% | 353 -36% | 287 -48% |
| Brightness (cd/m²) | 528 | 524 -1% | 520 -2% | 294 -44% | 359 -32% | 289 -45% |
| Brightness Distribution (%) | 90 | 92 2% | 86 -4% | 93 3% | 95 6% | 96 7% |
| Black Level * (cd/m²) | 0.35 | 0.38 -9% | 0.39 -11% | 0.19 46% | 0.1 71% | 0.01 97% |
| Contrast (:1) | 1588 | 1430 -10% | 1410 -11% | 1534 -3% | 3530 122% | 28700 1707% |
| Colorchecker dE 2000 * | 4.83 | 3.02 37% | 2.12 56% | 3.83 21% | 3.98 18% | 2.24 54% |
| Colorchecker dE 2000 max. * | 8.46 | 7.61 10% | 3.66 57% | 8.43 -0% | 53.07 -527% | 3.69 56% |
| Colorchecker dE 2000 calibrated * | 0.76 | 1.23 -62% | 1.37 -80% | 1.07 -41% | ||
| Greyscale dE 2000 * | 6.1 | 5 18% | 2.6 57% | 6.2 -2% | 1.41 77% | 2.73 55% |
| Gamma | 1.98 111% | 2.02 109% | 2.3 96% | 2.2 100% | 2.39 92% | 2.46 89% |
| CCT | 6686 97% | 6550 99% | 6884 94% | 6469 100% | 6346 102% | 6523 100% |
| Color Space (Percent of AdobeRGB 1998) (%) | 66.8 | 65.4 | ||||
| Color Space (Percent of sRGB) (%) | 99.6 | 99.7 | ||||
| Totaal Gemiddelde (Programma / Instellingen) | 4% /
1% | 9% /
7% | 5% /
-2% | 29% /
-11% | 119% /
166% |
* ... kleiner is beter
Responstijd Scherm
| ↔ Responstijd Zwart naar Wit | ||
|---|---|---|
| 40.4 ms ... stijging ↗ en daling ↘ gecombineerd | ↗ 22 ms stijging | 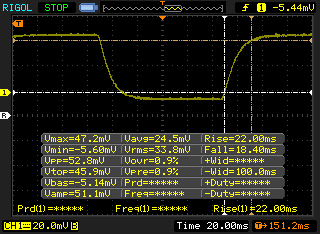 |
| ↘ 18.4 ms daling | ||
| Het scherm vertoonde trage responstijden in onze tests en is misschien te traag voor games. Ter vergelijking: alle testtoestellen variëren van 0.1 (minimum) tot 240 (maximum) ms. » 97 % van alle toestellen zijn beter. Dit betekent dat de gemeten responstijd slechter is dan het gemiddelde (19.9 ms) van alle geteste toestellen. | ||
| ↔ Responstijd 50% Grijs naar 80% Grijs | ||
| 55.6 ms ... stijging ↗ en daling ↘ gecombineerd | ↗ 27.6 ms stijging | 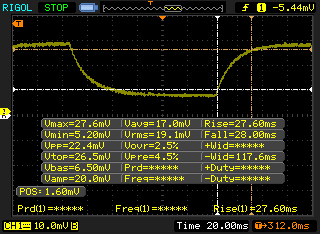 |
| ↘ 28 ms daling | ||
| Het scherm vertoonde trage responstijden in onze tests en is misschien te traag voor games. Ter vergelijking: alle testtoestellen variëren van 0.165 (minimum) tot 636 (maximum) ms. » 92 % van alle toestellen zijn beter. Dit betekent dat de gemeten responstijd slechter is dan het gemiddelde (31.1 ms) van alle geteste toestellen. | ||
Screen Flickering / PWM (Pulse-Width Modulation)
| Screen flickering / PWM waargenomen | 2500 Hz | ≤ 25 % helderheid instelling | 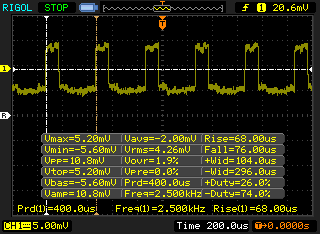 |
De achtergrondverlichting van het scherm flikkert op 2500 Hz (in het slechtste geval, bijvoorbeeld bij gebruik van PWM) aan een helderheid van 25 % en lager. Boven deze helderheid zou er geen flickering / PWM mogen optreden. De frequentie van 2500 Hz is redelijk hoog en de meeste mensen die gevoelig zijn aan flickering zouden dit dus niet mogen waarnemen of geïrriteerde ogen krijgen. Ter vergelijking: 52 % van alle geteste toestellen maakten geen gebruik van PWM om de schermhelderheid te verlagen. Als het wel werd gebruikt, werd een gemiddelde van 7798 (minimum: 5 - maximum: 343500) Hz waargenomen. | |||

Prestaties - Intel Tiger Lake-U to the Rescue
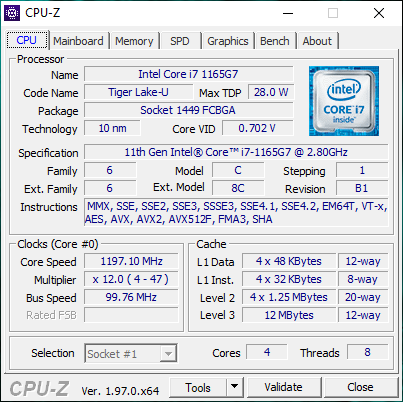
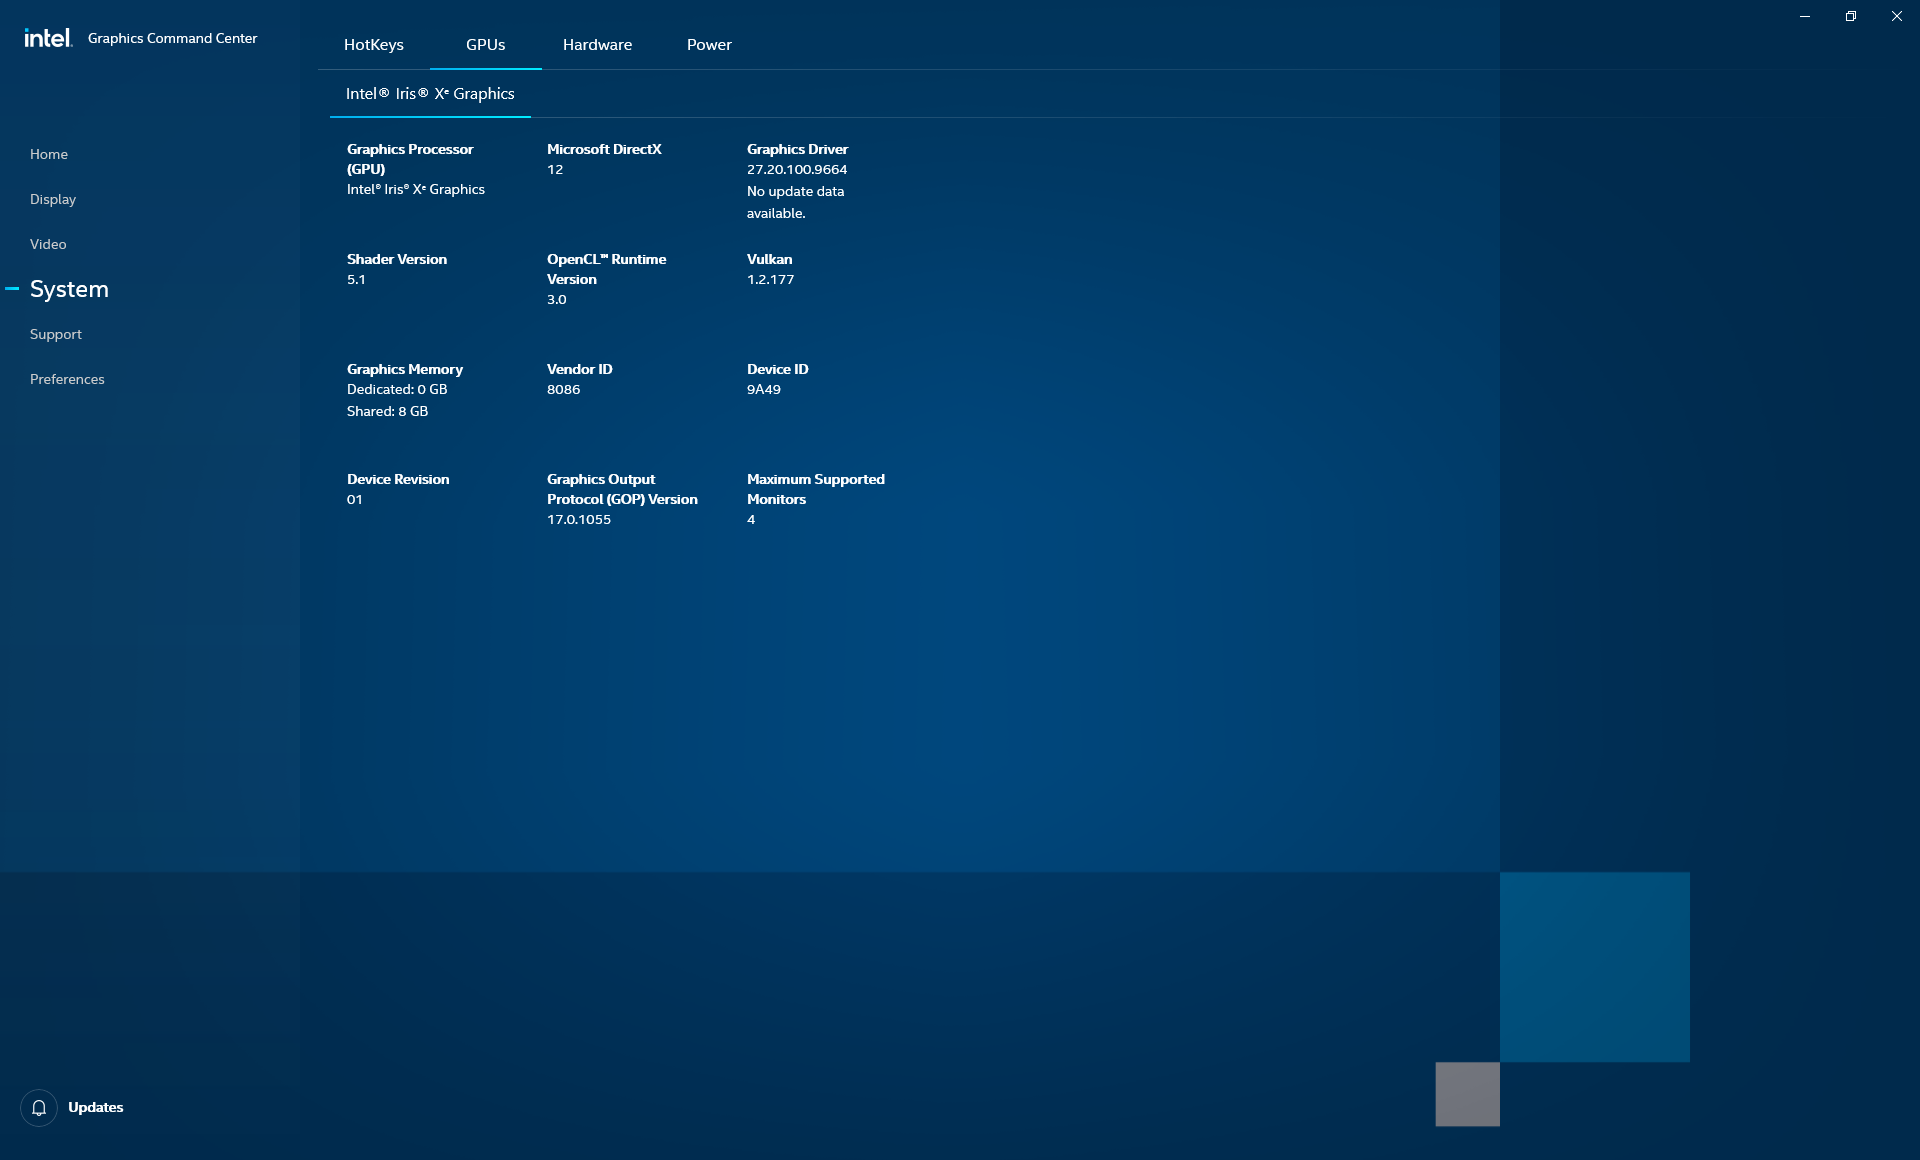
Processor - Underperformer
CPU prestaties fluctueren sterk, net als wat we zagen op de XPS 9310 clamshell uitgerust met dezelfde Core i7-1165G7 processor. CineBench R15 xT scores kunnen variëren van 480 tot 750 punten, respectievelijk, in vergelijking met de meer consistente kloksnelheden van de XPS 13 7390 2-in-1 of ZenBook Flip 13. Processorprestaties kunnen dus trager zijn dan de laatste generatie Core i7-1065G7 op sommige momenten.
Ons toestel werd ingesteld op de Ultra Performance modus via de Dell Power Manager software alvorens de benchmarks uit te voeren voor de hoogst mogelijke scores.
Cinebench R15 Multi Loop
Cinebench R23: Multi Core | Single Core
Cinebench R15: CPU Multi 64Bit | CPU Single 64Bit
Blender: v2.79 BMW27 CPU
7-Zip 18.03: 7z b 4 -mmt1 | 7z b 4
Geekbench 5.5: Single-Core | Multi-Core
HWBOT x265 Benchmark v2.2: 4k Preset
LibreOffice : 20 Documents To PDF
R Benchmark 2.5: Overall mean
| Cinebench R23 / Multi Core | |
| Lenovo Yoga Slim 7-14ARE | |
| Asus ZenBook 13 OLED UM325UA | |
| Lenovo Yoga 6 13 82ND0009US | |
| Gemiddeld Intel Core i7-1165G7 (2525 - 6862, n=64) | |
| Dell XPS 13 9310 OLED | |
| Dell XPS 13 9310 2-in-1 | |
| HP Spectre x360 13-aw2003dx | |
| Asus VivoBook S13 S333JA-DS51 | |
| Cinebench R23 / Single Core | |
| Dell XPS 13 9310 OLED | |
| Gemiddeld Intel Core i7-1165G7 (1110 - 1539, n=59) | |
| Dell XPS 13 9310 2-in-1 | |
| HP Spectre x360 13-aw2003dx | |
| Asus ZenBook 13 OLED UM325UA | |
| Lenovo Yoga Slim 7-14ARE | |
| Lenovo Yoga 6 13 82ND0009US | |
| Asus VivoBook S13 S333JA-DS51 | |
| Geekbench 5.5 / Single-Core | |
| Dell XPS 13 9310 OLED | |
| Gemiddeld Intel Core i7-1165G7 (1302 - 1595, n=77) | |
| HP Spectre x360 13-aw2003dx | |
| Asus Zenbook S UX393JA | |
| HP Envy 13-ba0001ng | |
| Asus ZenBook 13 OLED UM325UA | |
| Lenovo Yoga Slim 7-14ARE | |
| Lenovo Yoga Slim 7-14ARE | |
| Asus VivoBook S13 S333JA-DS51 | |
| Geekbench 5.5 / Multi-Core | |
| Lenovo Yoga Slim 7-14ARE | |
| Lenovo Yoga Slim 7-14ARE | |
| Asus ZenBook 13 OLED UM325UA | |
| Dell XPS 13 9310 OLED | |
| HP Spectre x360 13-aw2003dx | |
| Gemiddeld Intel Core i7-1165G7 (3078 - 5926, n=77) | |
| Asus Zenbook S UX393JA | |
| Asus VivoBook S13 S333JA-DS51 | |
| HP Envy 13-ba0001ng | |
| HWBOT x265 Benchmark v2.2 / 4k Preset | |
| Lenovo Yoga Slim 7-14ARE | |
| Asus ZenBook 13 OLED UM325UA | |
| Lenovo Yoga 6 13 82ND0009US | |
| Dell XPS 13 9310 OLED | |
| Dell XPS 13 9310 2-in-1 | |
| Gemiddeld Intel Core i7-1165G7 (1.39 - 8.47, n=80) | |
| HP Spectre x360 13-aw2003dx | |
| Dell XPS 13 7390 Core i7-10710U | |
| Asus VivoBook S13 S333JA-DS51 | |
| Asus Zenbook S UX393JA | |
| HP Envy 13-ba0001ng | |
| LibreOffice / 20 Documents To PDF | |
| Lenovo Yoga 6 13 82ND0009US | |
| Asus VivoBook S13 S333JA-DS51 | |
| Asus ZenBook 13 OLED UM325UA | |
| Lenovo Yoga Slim 7-14ARE | |
| HP Envy 13-ba0001ng | |
| HP Spectre x360 13-aw2003dx | |
| Gemiddeld Intel Core i7-1165G7 (21.5 - 88.1, n=78) | |
| Asus Zenbook S UX393JA | |
| Dell XPS 13 9310 OLED | |
| R Benchmark 2.5 / Overall mean | |
| Asus VivoBook S13 S333JA-DS51 | |
| Asus Zenbook S UX393JA | |
| HP Envy 13-ba0001ng | |
| HP Spectre x360 13-aw2003dx | |
| Lenovo Yoga 6 13 82ND0009US | |
| Lenovo Yoga Slim 7-14ARE | |
| Dell XPS 13 9310 2-in-1 | |
| Asus ZenBook 13 OLED UM325UA | |
| Dell XPS 13 9310 OLED | |
| Gemiddeld Intel Core i7-1165G7 (0.552 - 1.002, n=80) | |
* ... kleiner is beter
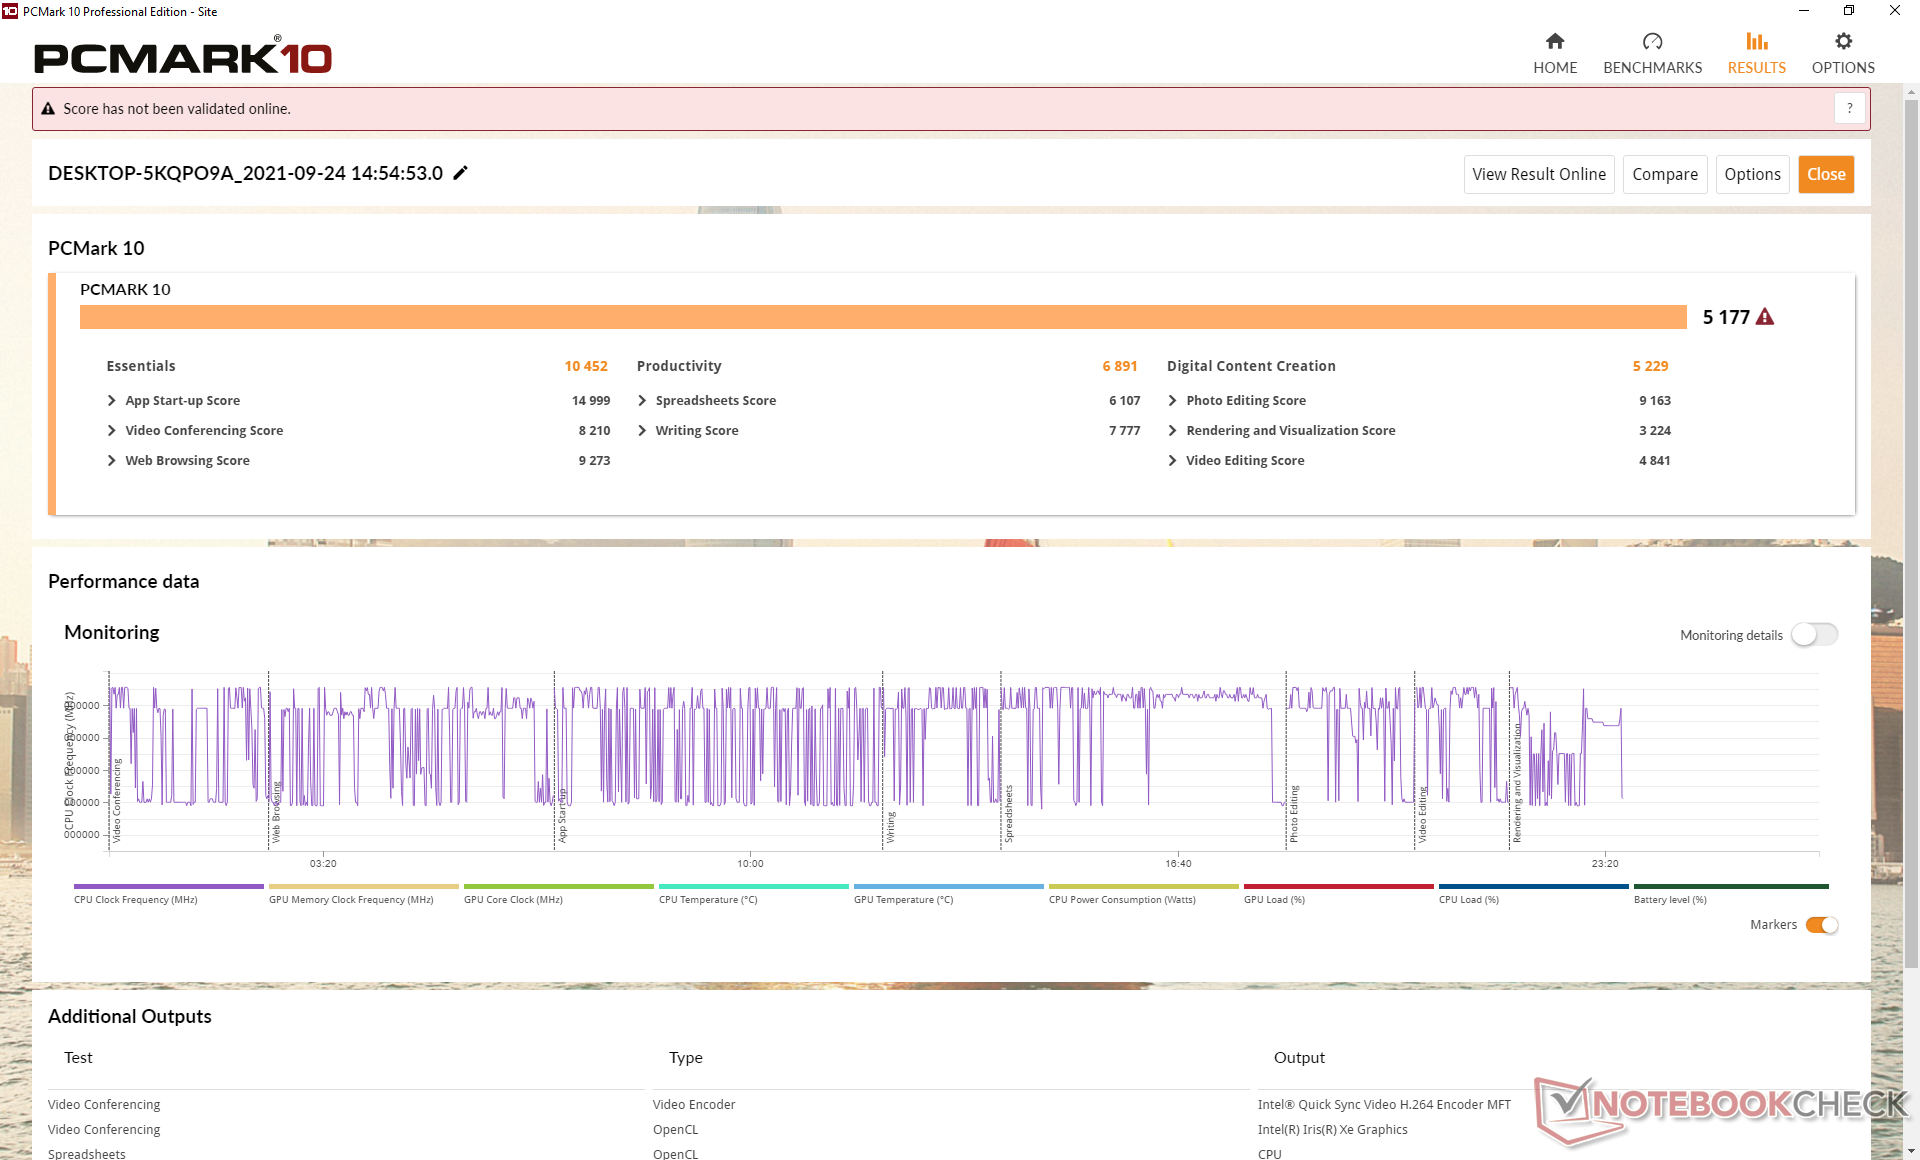
Systeemprestaties
De PCMark 10 scores zijn waar we ze verwachten ten opzichte van andere laptops die zijn uitgerust met dezelfde Core i7 CPU. De grootste winst ten opzichte van de oudere XPS 13 7390 2-in-1 is te behalen in de GPU-intensieve Digital Content Creation benchmark, waar onze Iris Xe het duidelijk beter doet dan de Iris Plus G7.
| PCMark 10 / Score | |
| Lenovo Yoga 6 13 82ND0009US | |
| Dell XPS 13 9310 2-in-1 | |
| Gemiddeld Intel Core i7-1165G7, Intel Iris Xe Graphics G7 96EUs (4531 - 5454, n=50) | |
| Dell XPS 13 9310 Core i7 FHD | |
| Asus ZenBook Flip 13 UX363EA-HP069T | |
| Dell XPS 13 7390 2-in-1 Core i7 | |
| Samsung Galaxy Book Pro 360 13 | |
| PCMark 10 / Essentials | |
| Dell XPS 13 9310 2-in-1 | |
| Asus ZenBook Flip 13 UX363EA-HP069T | |
| Gemiddeld Intel Core i7-1165G7, Intel Iris Xe Graphics G7 96EUs (8997 - 11505, n=50) | |
| Lenovo Yoga 6 13 82ND0009US | |
| Dell XPS 13 9310 Core i7 FHD | |
| Dell XPS 13 7390 2-in-1 Core i7 | |
| Samsung Galaxy Book Pro 360 13 | |
| PCMark 10 / Productivity | |
| Lenovo Yoga 6 13 82ND0009US | |
| Dell XPS 13 7390 2-in-1 Core i7 | |
| Asus ZenBook Flip 13 UX363EA-HP069T | |
| Dell XPS 13 9310 2-in-1 | |
| Dell XPS 13 9310 Core i7 FHD | |
| Gemiddeld Intel Core i7-1165G7, Intel Iris Xe Graphics G7 96EUs (5570 - 7136, n=50) | |
| Samsung Galaxy Book Pro 360 13 | |
| PCMark 10 / Digital Content Creation | |
| Lenovo Yoga 6 13 82ND0009US | |
| Dell XPS 13 9310 2-in-1 | |
| Gemiddeld Intel Core i7-1165G7, Intel Iris Xe Graphics G7 96EUs (4083 - 5550, n=50) | |
| Dell XPS 13 9310 Core i7 FHD | |
| Samsung Galaxy Book Pro 360 13 | |
| Asus ZenBook Flip 13 UX363EA-HP069T | |
| Dell XPS 13 7390 2-in-1 Core i7 | |
| PCMark 10 Score | 5177 punten | |
Help | ||
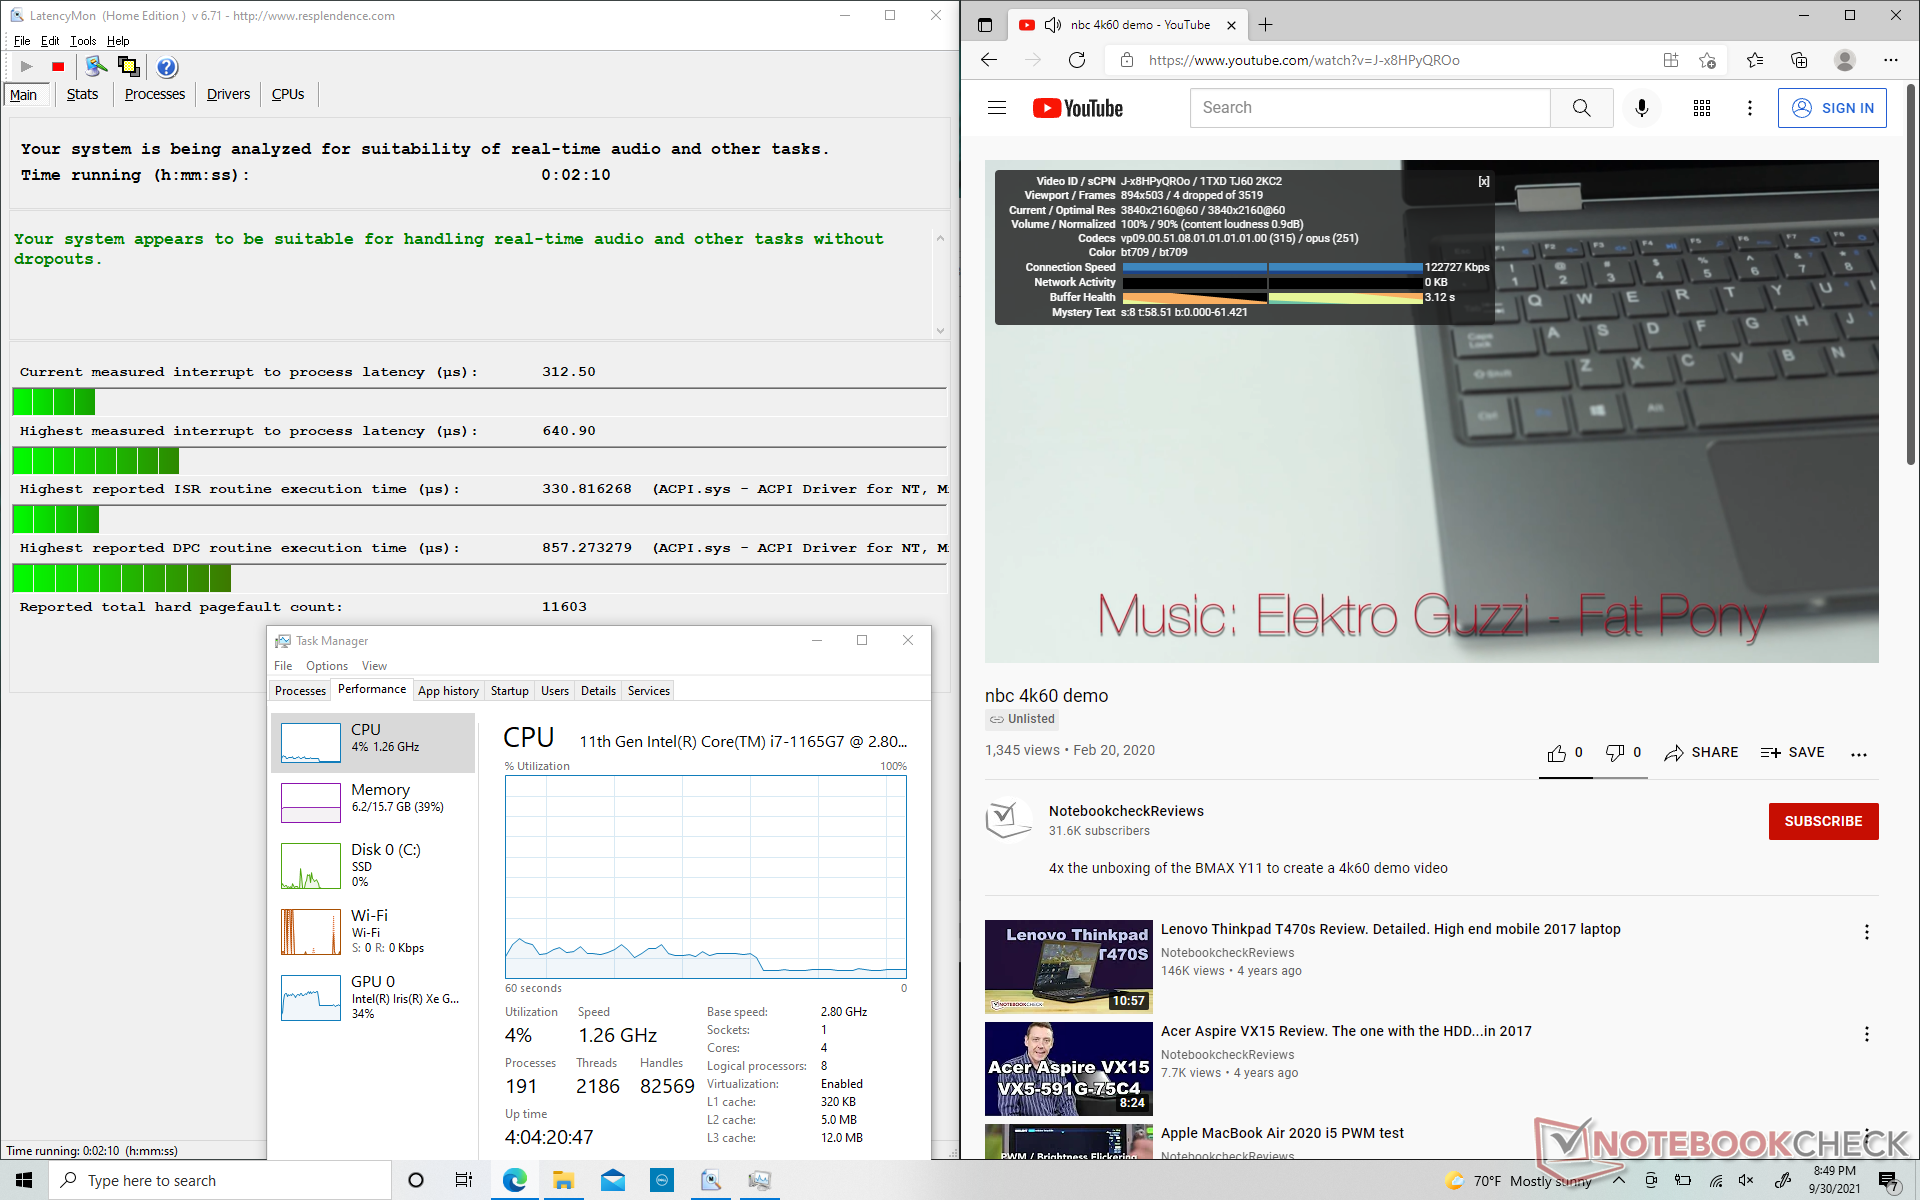
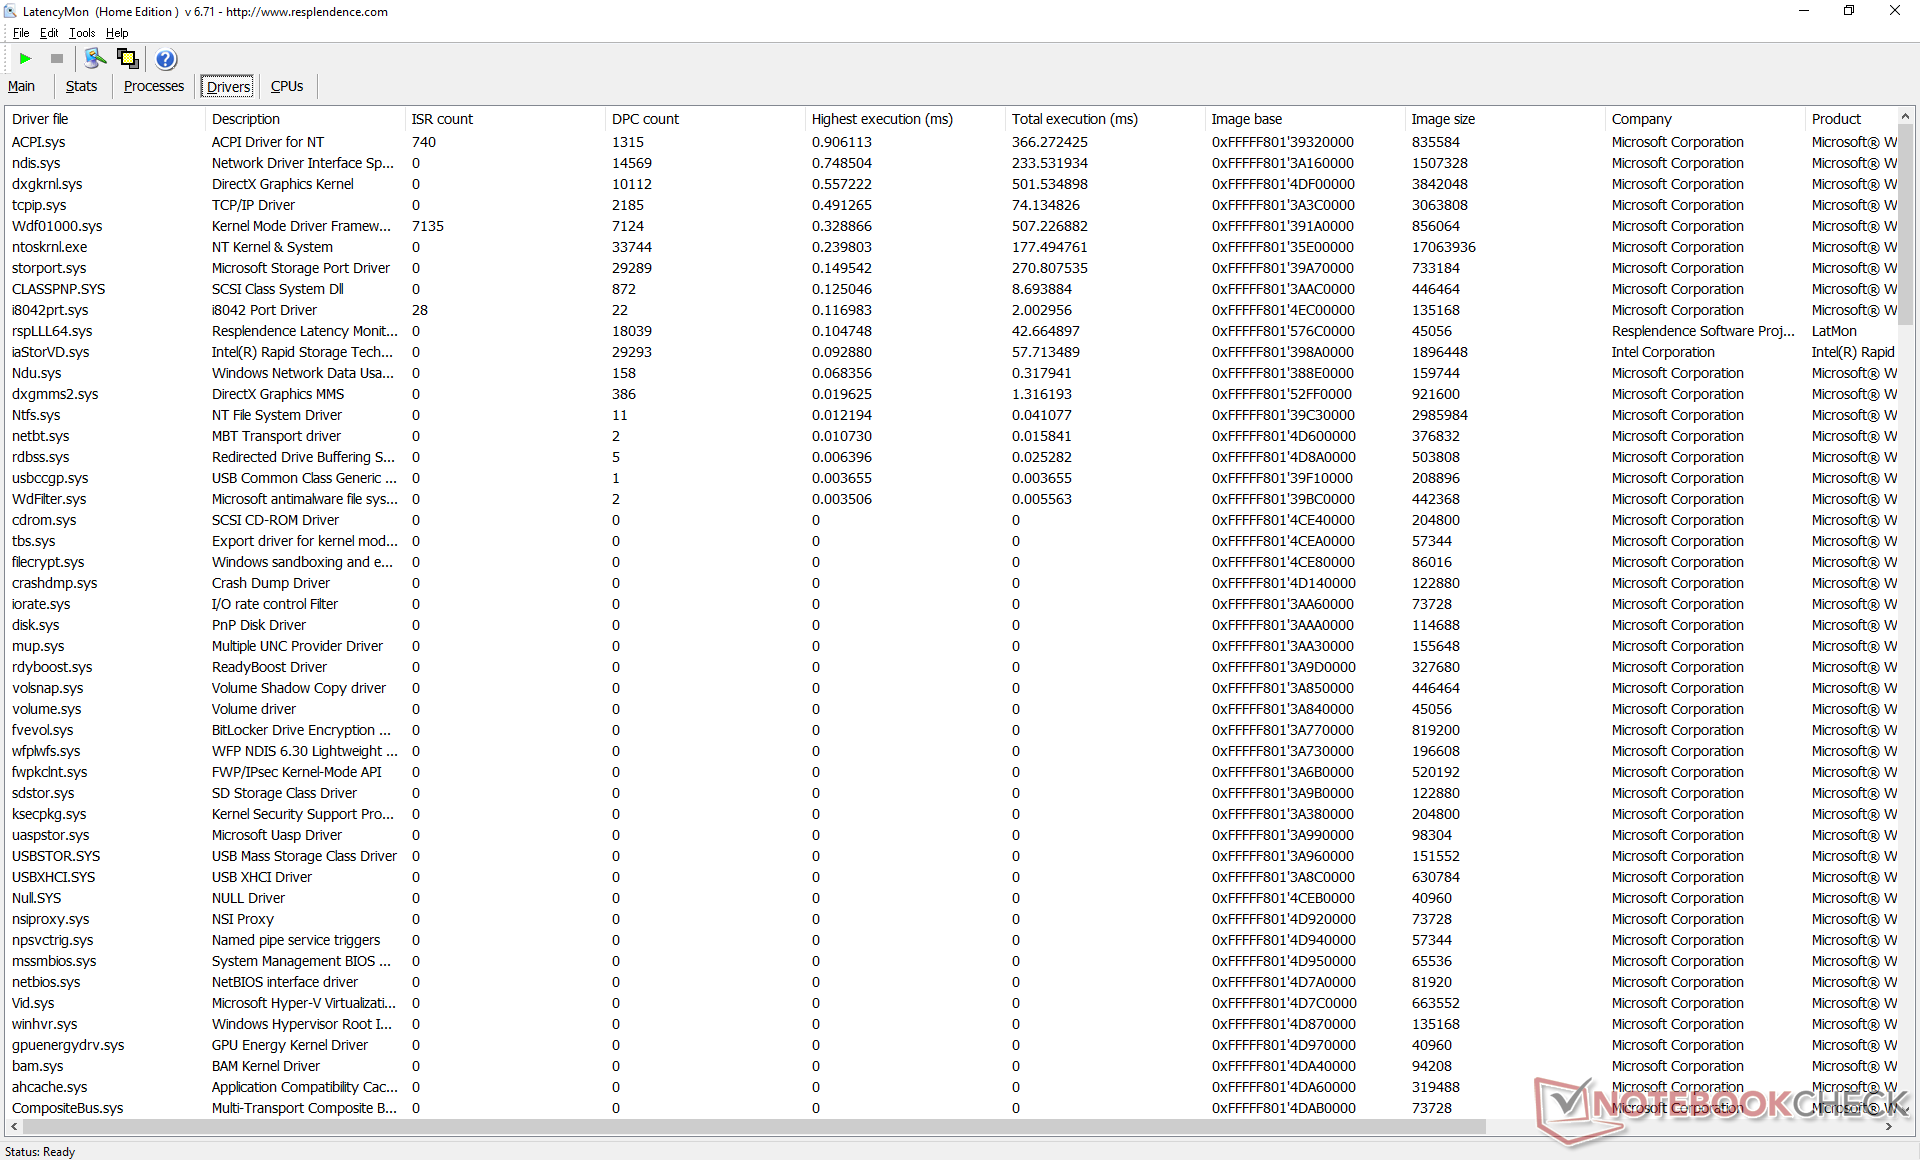
DPC latentie
LatencyMon toont geen latency problemen bij het openen van meerdere tabbladen op onze homepage of bij het uitvoeren van Prime95 stress. 4K UHD afspelen op 60 FPS verloopt ook vloeiend.
| DPC Latencies / LatencyMon - interrupt to process latency (max), Web, Youtube, Prime95 | |
| Samsung Galaxy Book Pro 360 13 | |
| Asus ZenBook Flip 13 UX363EA-HP069T | |
| Lenovo Yoga 6 13 82ND0009US | |
| Dell XPS 13 9310 Core i7 FHD | |
| Dell XPS 13 9310 2-in-1 | |
* ... kleiner is beter
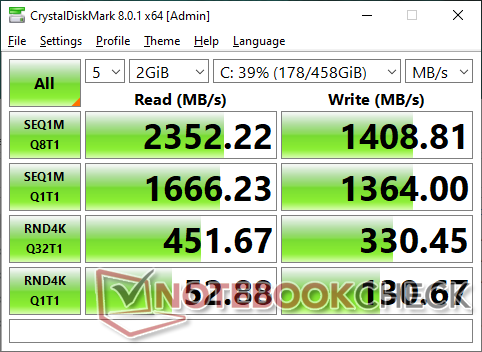
Opslagapparaten
Onze testeenheid wordt geleverd met dezelfdeToshiba BG4 PCIe3 NVMe SSD zoals gevonden op de oudere XPS 13 7390 2-in-1. Het zou ons echter niet verbazen als sommige apparaten in plaats daarvan met Micron SSD's worden geleverd. Er is geen ondersteuning voor PCIe4 snelheden, in tegenstelling tot de nieuwste Vaio Z.
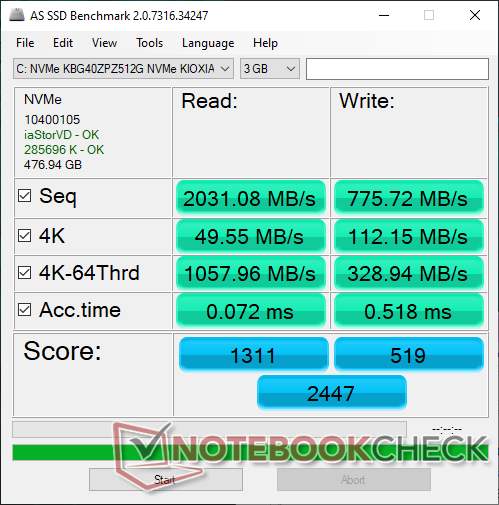
| Dell XPS 13 9310 2-in-1 Toshiba BG4 KBG40ZPZ512G | Dell XPS 13 9310 Core i7 FHD Micron 2300 512GB MTFDHBA512TDV | Dell XPS 13 7390 2-in-1 Core i7 Toshiba BG4 KBG40ZPZ512G | Lenovo Yoga 6 13 82ND0009US WDC PC SN530 SDBPMPZ-265G | Samsung Galaxy Book Pro 360 13 Samsung PM991 MZVLQ256HAJD | |
|---|---|---|---|---|---|
| AS SSD | 70% | 2% | -28% | 15% | |
| Seq Read (MB/s) | 2031 | 2091 3% | 1801 -11% | 1860 -8% | 1771 -13% |
| Seq Write (MB/s) | 776 | 1396 80% | 1125 45% | 500 -36% | 894 15% |
| 4K Read (MB/s) | 49.55 | 49.29 -1% | 39.7 -20% | 36.26 -27% | 53.5 8% |
| 4K Write (MB/s) | 112.2 | 104.2 -7% | 67 -40% | 118.6 6% | 157.8 41% |
| 4K-64 Read (MB/s) | 1058 | 827 -22% | 1253 18% | 419 -60% | 478.1 -55% |
| 4K-64 Write (MB/s) | 328.9 | 1636 397% | 209 -36% | 219 -33% | 741 125% |
| Access Time Read * (ms) | 0.072 | 0.066 8% | 0.069 4% | 0.102 -42% | 0.156 -117% |
| Access Time Write * (ms) | 0.518 | 0.365 30% | 0.625 -21% | 0.17 67% | 0.023 96% |
| Score Read (Points) | 1311 | 1086 -17% | 1472 12% | 641 -51% | 709 -46% |
| Score Write (Points) | 519 | 1880 262% | 388 -25% | 388 -25% | 988 90% |
| Score Total (Points) | 2447 | 3499 43% | 2583 6% | 1300 -47% | 2034 -17% |
| Copy ISO MB/s (MB/s) | 1103 | 1544 40% | 1293 17% | 880 -20% | 960 -13% |
| Copy Program MB/s (MB/s) | 331.7 | 613 85% | 560 69% | 185.3 -44% | 648 95% |
| Copy Game MB/s (MB/s) | 828 | 1451 75% | 927 12% | 212.7 -74% | 882 7% |
| CrystalDiskMark 5.2 / 6 | 24% | -3% | -20% | -12% | |
| Write 4K (MB/s) | 129.6 | 97.5 -25% | 106.7 -18% | 89.2 -31% | 170.6 32% |
| Read 4K (MB/s) | 52.2 | 50.9 -2% | 49.94 -4% | 33.09 -37% | 44.51 -15% |
| Write Seq (MB/s) | 1310 | 1811 38% | 1223 -7% | 988 -25% | 872 -33% |
| Read Seq (MB/s) | 1726 | 1836 6% | 1801 4% | 1322 -23% | 1188 -31% |
| Write 4K Q32T1 (MB/s) | 334.7 | 521 56% | 325.3 -3% | 332.6 -1% | 483.1 44% |
| Read 4K Q32T1 (MB/s) | 447.6 | 357.5 -20% | 551 23% | 389.3 -13% | 284.3 -36% |
| Write Seq Q32T1 (MB/s) | 1410 | 2879 104% | 1224 -13% | 984 -30% | 950 -33% |
| Read Seq Q32T1 (MB/s) | 2390 | 3204 34% | 2350 -2% | 2461 3% | 1872 -22% |
| Totaal Gemiddelde (Programma / Instellingen) | 47% /
53% | -1% /
0% | -24% /
-25% | 2% /
6% |
* ... kleiner is beter

Disk Throttling: DiskSpd Read Loop, Queue Depth 8
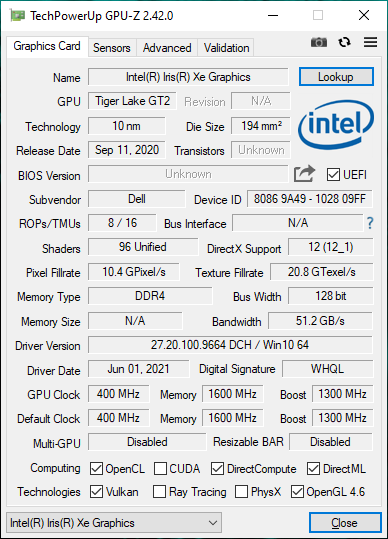
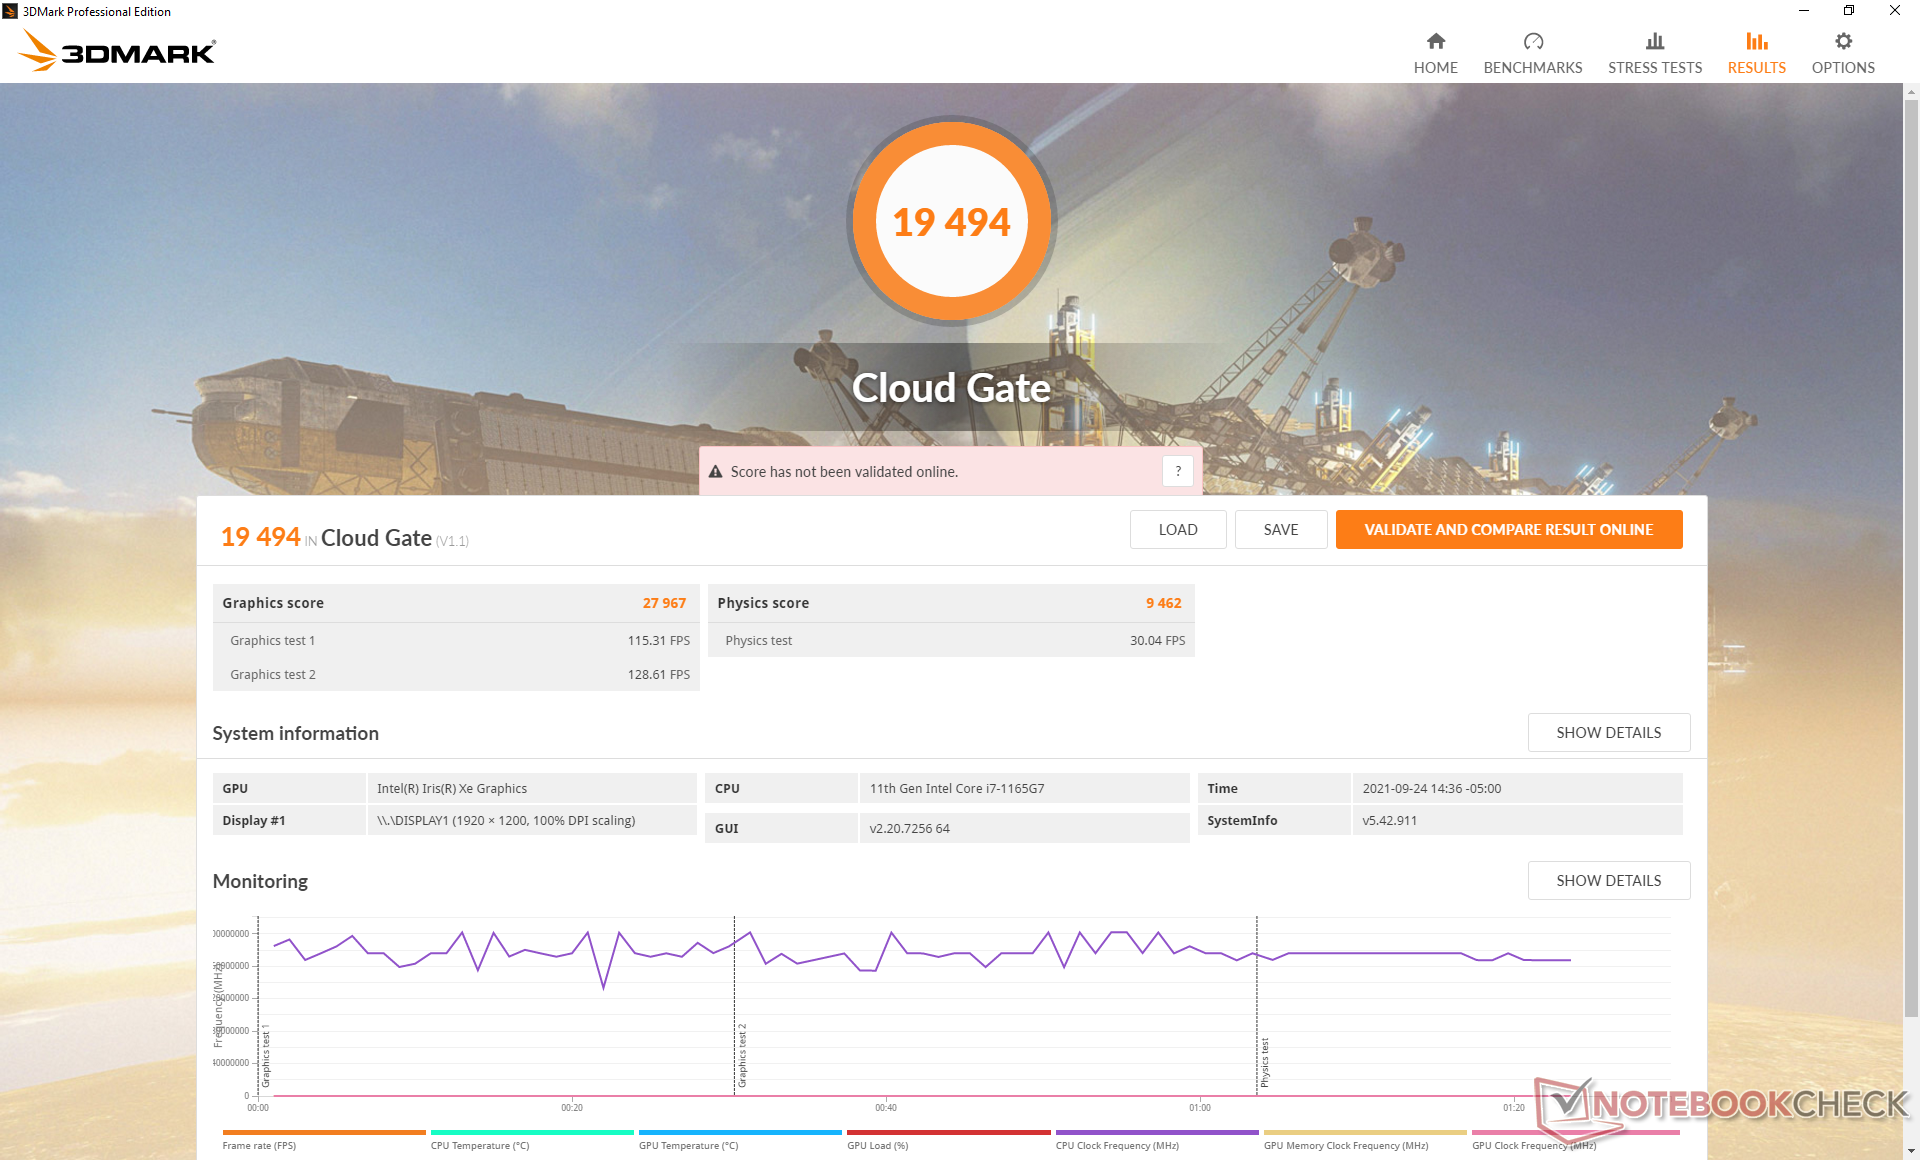
GPU-prestaties - Enorme winst ten opzichte van Iris Plus G7
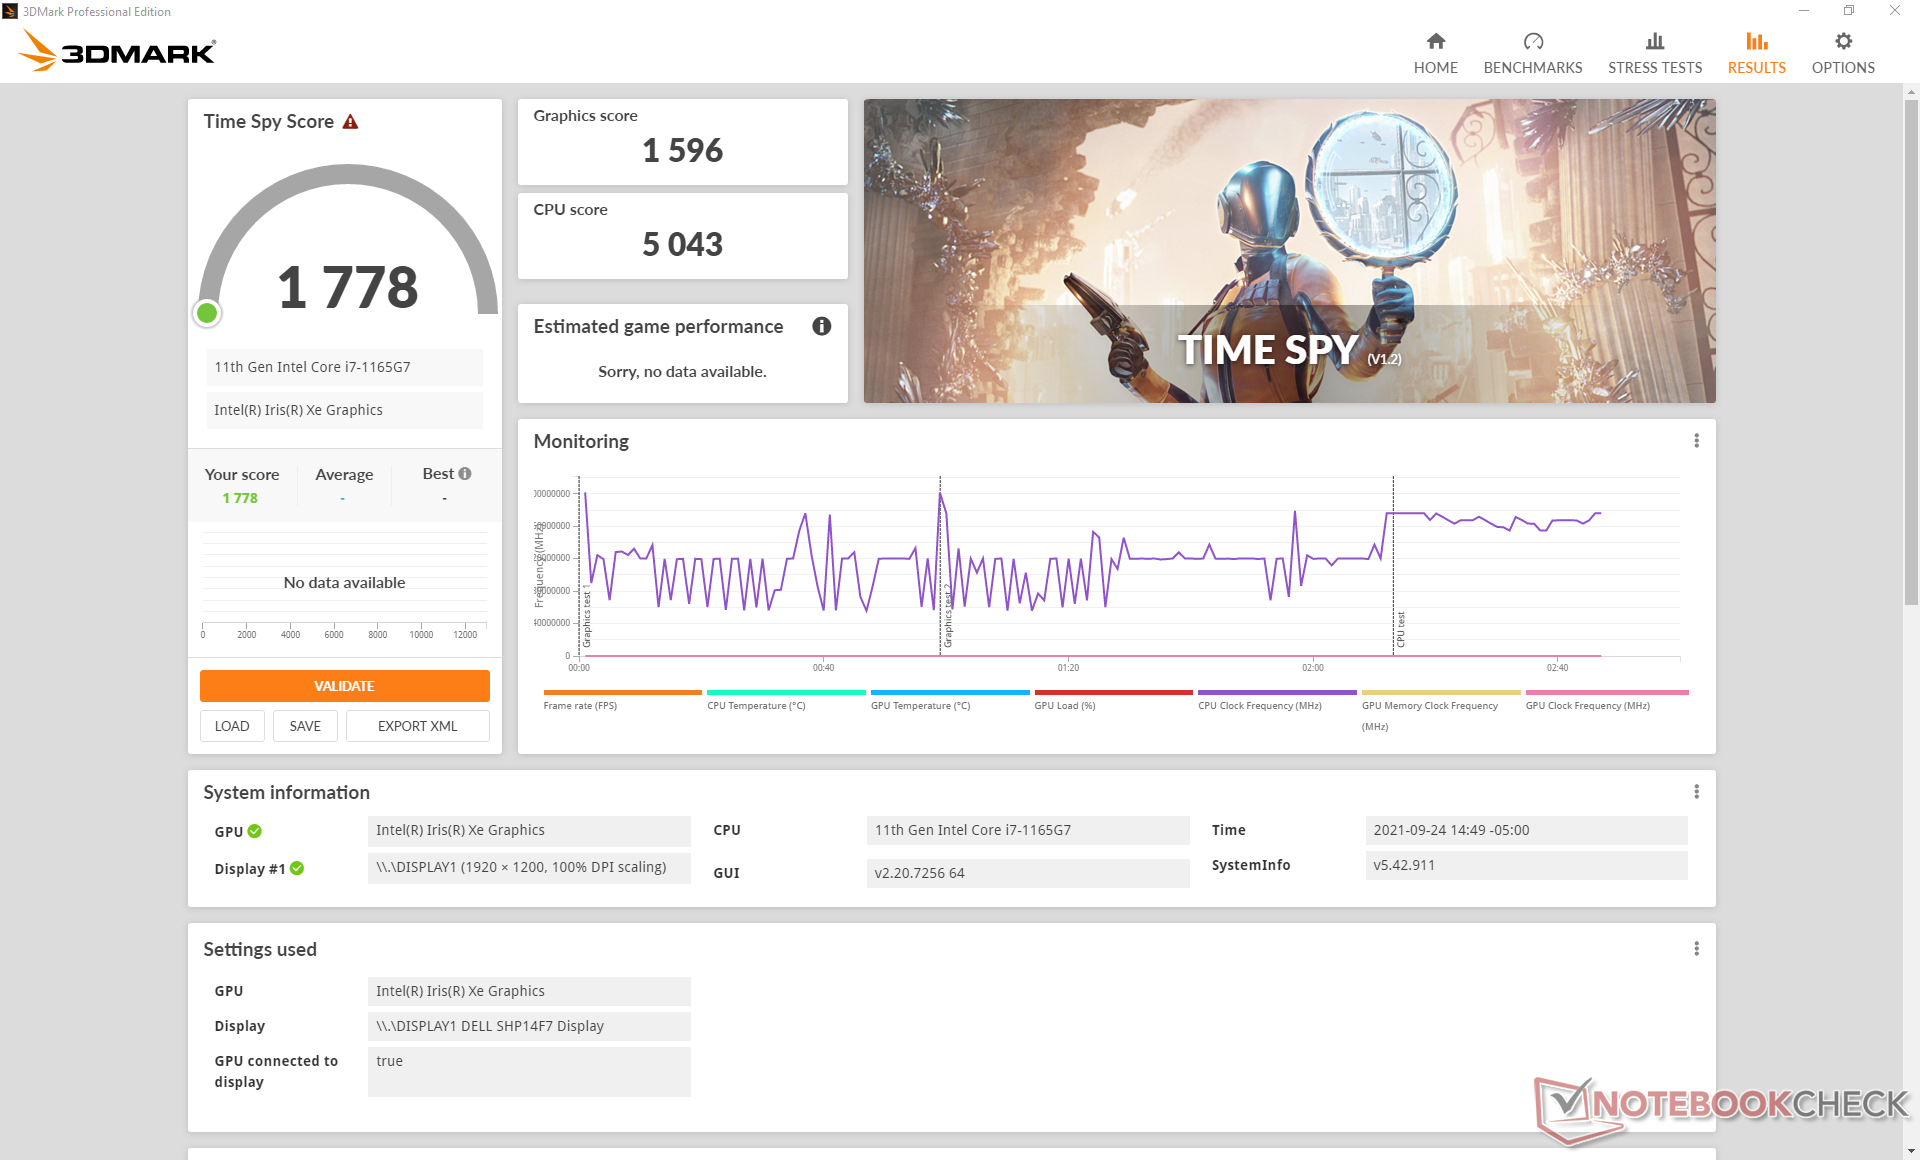
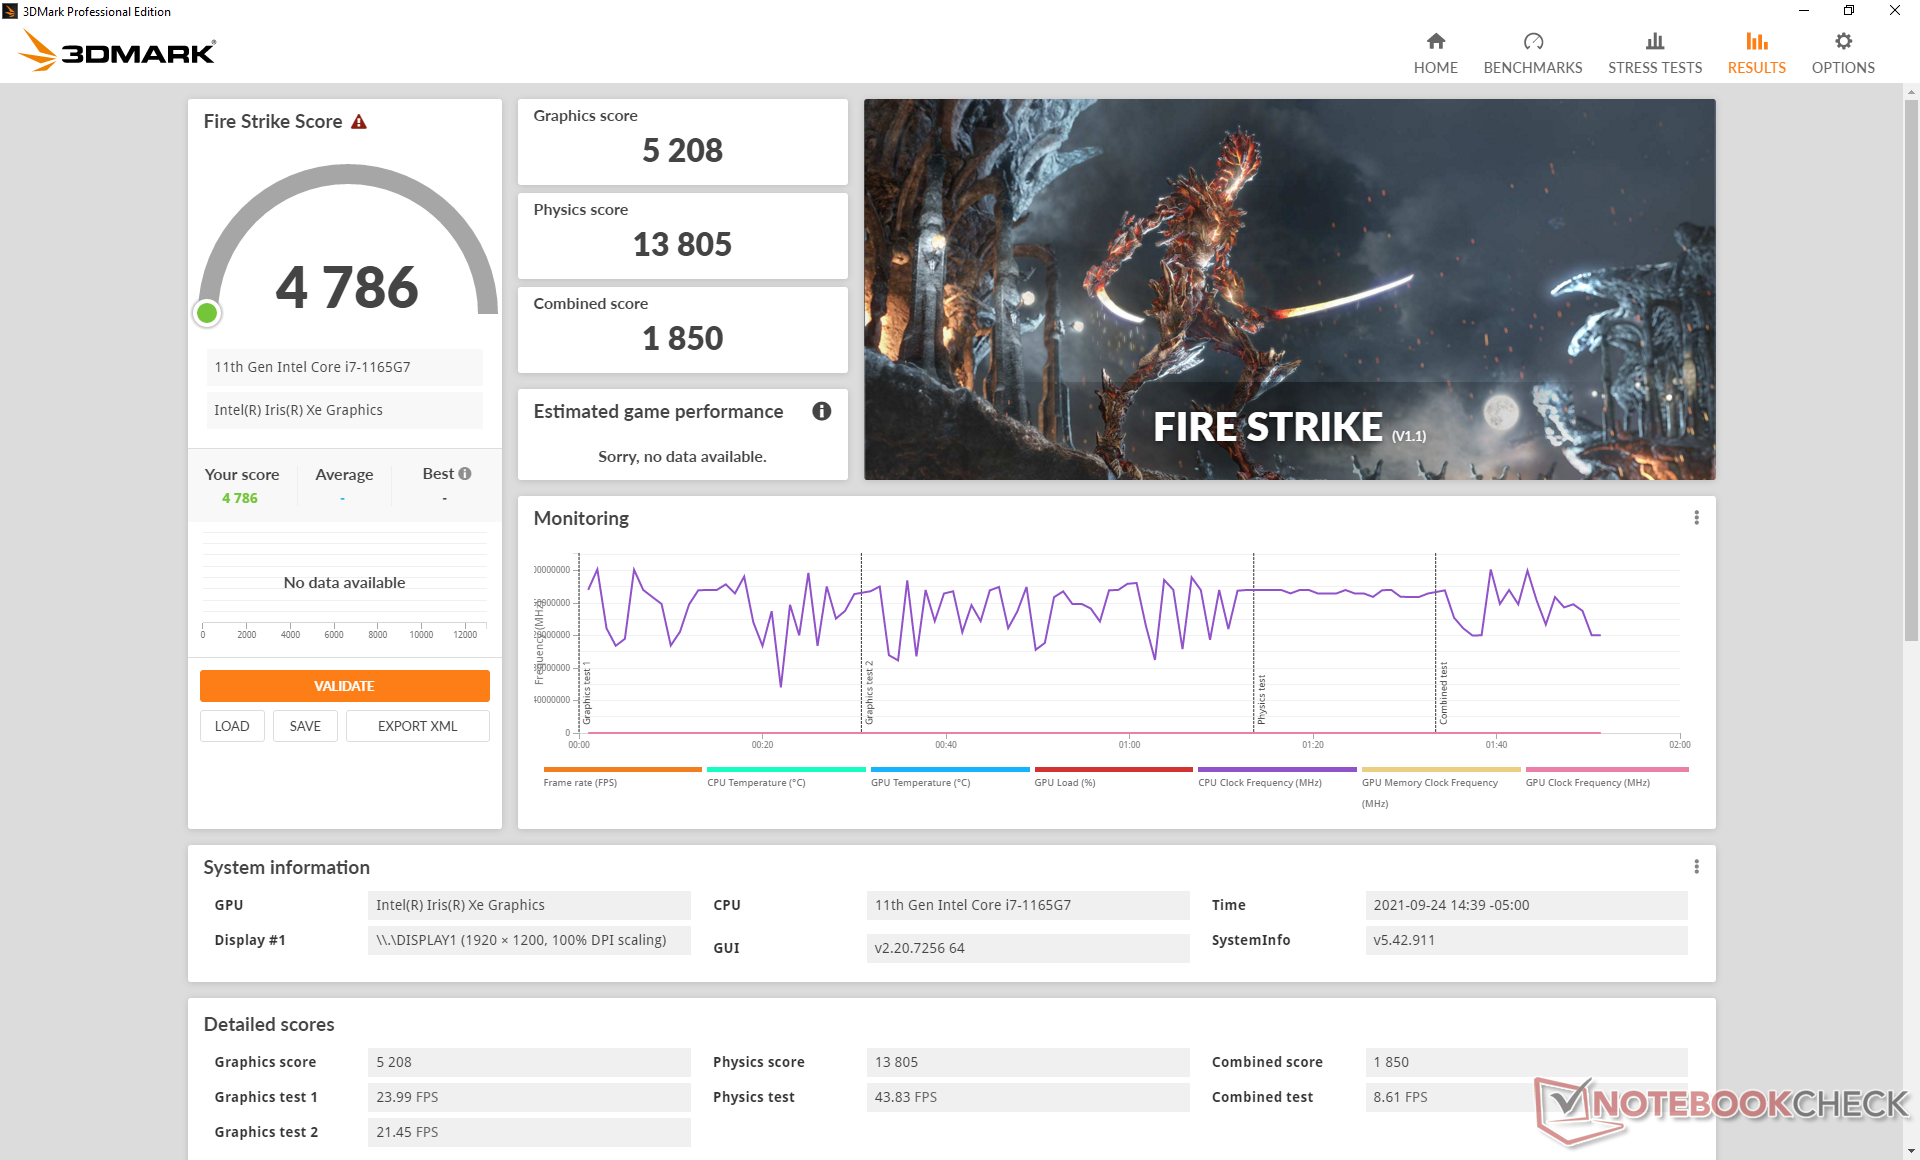
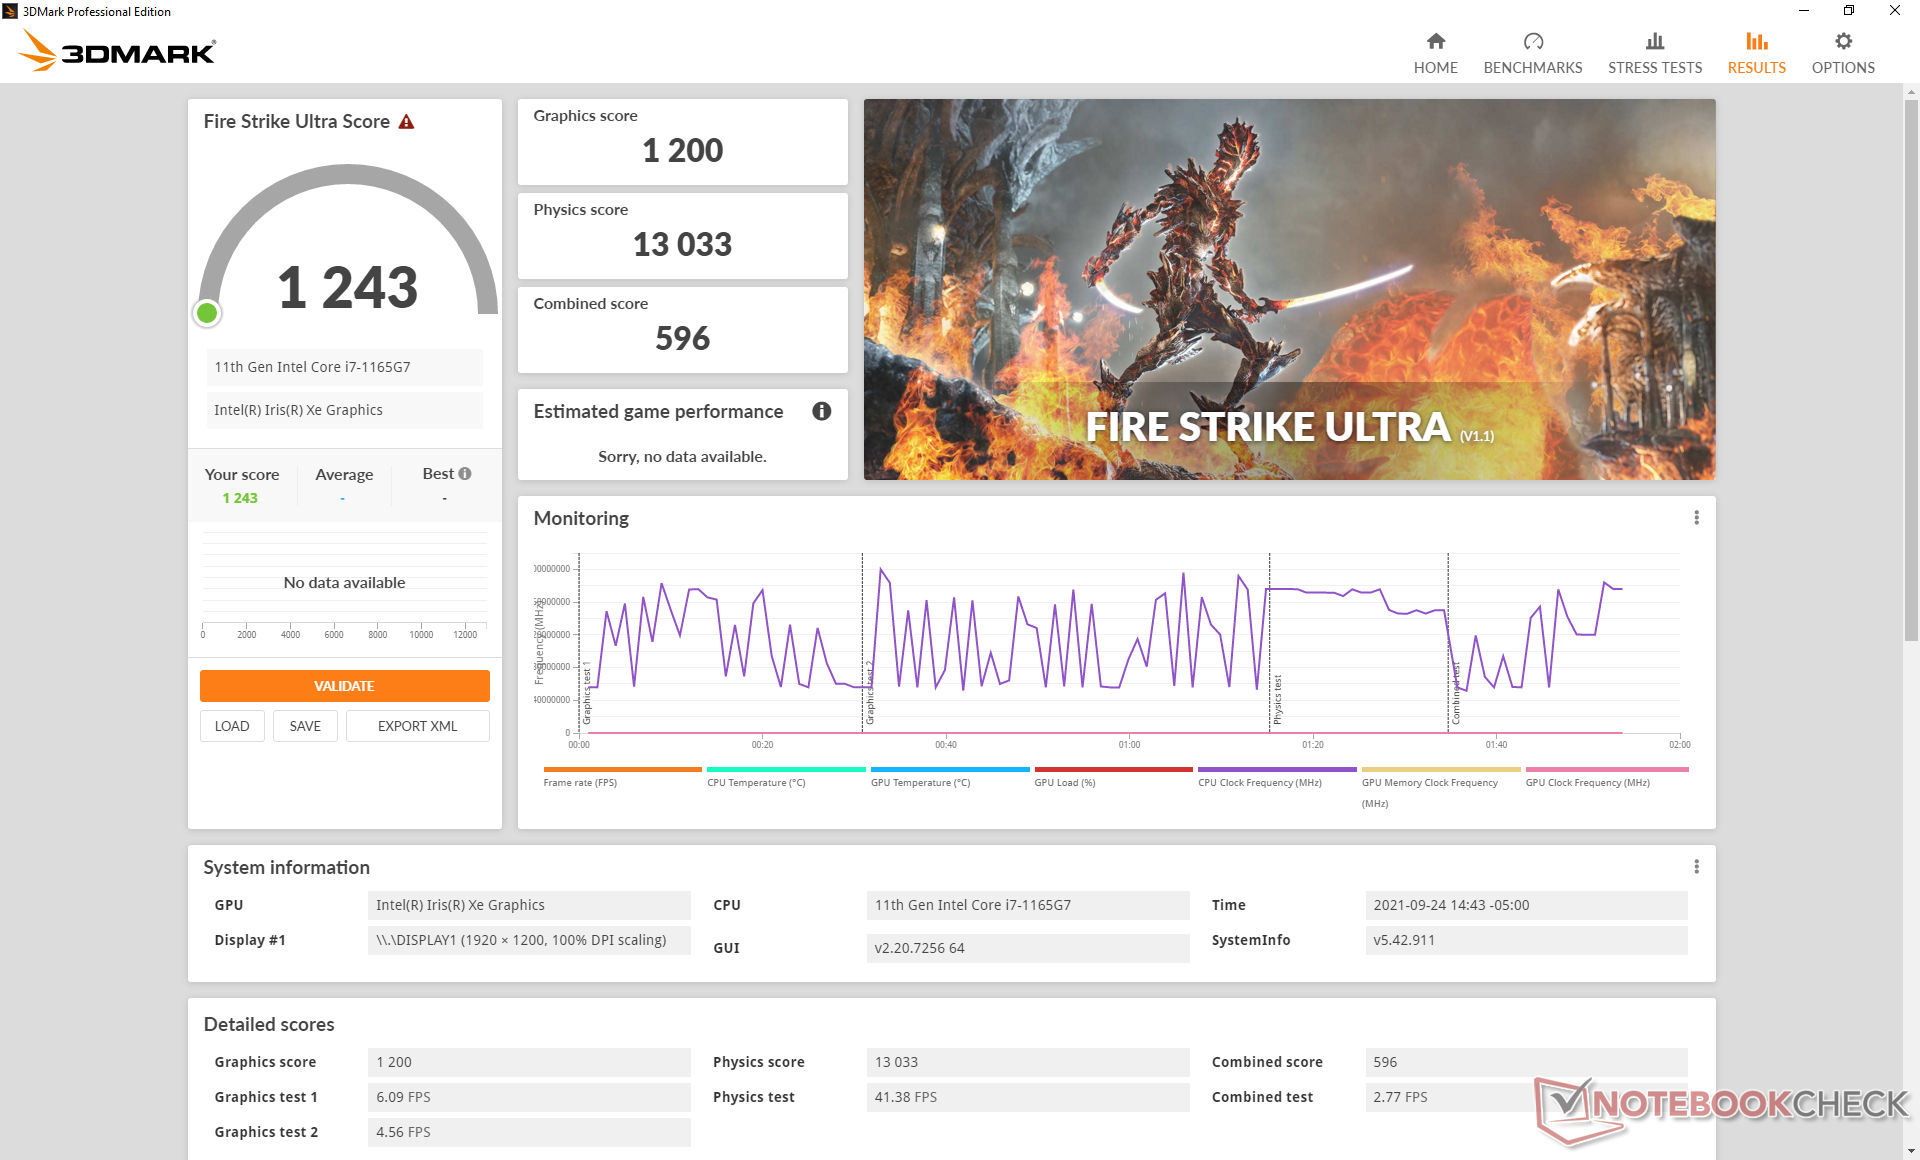
Iris Xe De grafische prestaties zijn een aanzienlijke verbetering ten opzichte van de Iris Plus G7 op de XPS 13 7390 2-in-1 van vorig jaar met maar liefst 60 tot 90 procent volgens 3DMark-benchmarks. Gebruikers zouden de grootste sprongen moeten zien voor titels die DX12 in plaats van DX11 ondersteunen.
De prestaties zijn echter niet altijd constant. Bijvoorbeeld, een uur lang stationair draaien op Witcher 3 op lage instellingen gedurende een uur zou resulteren in schommelende framerates tussen 70 en 98 FPS. Dus hoewel de prestaties gemiddeld goed zijn, kunnen ze af en toe behoorlijk vertragen. Dit gedrag hebben we ook waargenomen bij de vorige generatie XPS 13 modellen.
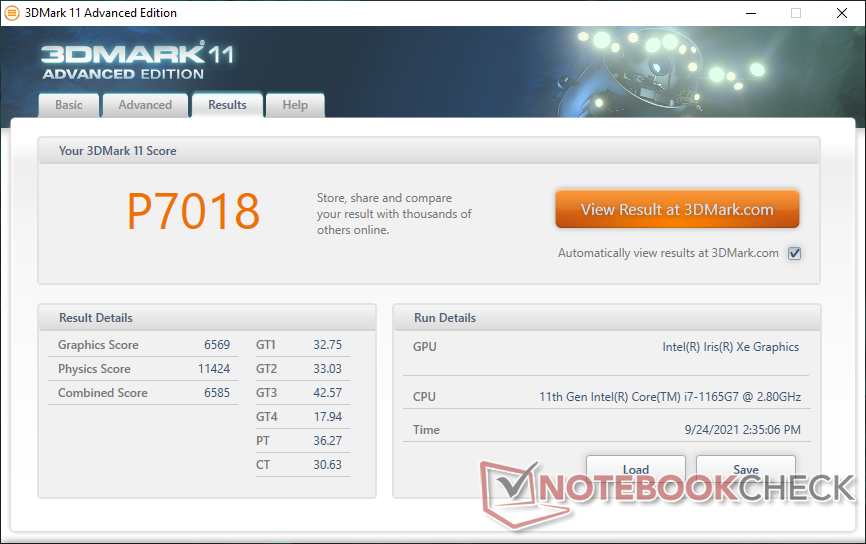
| 3DMark 11 Performance | 7018 punten | |
| 3DMark Cloud Gate Standard Score | 19494 punten | |
| 3DMark Fire Strike Score | 4786 punten | |
| 3DMark Time Spy Score | 1778 punten | |
Help | ||
| GTA V | |
| 1024x768 Lowest Settings possible | |
| Lenovo Yoga Slim 7-14ARE | |
| Gemiddeld Intel Iris Xe Graphics G7 96EUs (52 - 166.4, n=168) | |
| Dell XPS 13 9310 2-in-1 | |
| Lenovo Yoga 6 13 82ND0009US | |
| 1920x1080 Lowest Settings possible | |
| Dell XPS 13 9310 2-in-1 | |
| Gemiddeld Intel Iris Xe Graphics G7 96EUs (34.7 - 132.1, n=141) | |
| Lenovo Yoga Slim 7-14ARE | |
| Lenovo Yoga 6 13 82ND0009US | |
| 1366x768 Normal/Off AF:4x | |
| Gemiddeld Intel Iris Xe Graphics G7 96EUs (24.1 - 152.7, n=169) | |
| Dell XPS 13 9310 2-in-1 | |
| 1920x1080 Normal/Off AF:4x | |
| Dell XPS 13 9310 2-in-1 | |
| Lenovo Yoga Slim 7-14ARE | |
| Gemiddeld Intel Iris Xe Graphics G7 96EUs (20 - 119.3, n=142) | |
| Lenovo Yoga 6 13 82ND0009US | |
| 1920x1080 High/On (Advanced Graphics Off) AA:2xMSAA + FX AF:8x | |
| Lenovo Yoga Slim 7-14ARE | |
| Dell XPS 13 9310 2-in-1 | |
| Gemiddeld Intel Iris Xe Graphics G7 96EUs (9.39 - 51.6, n=162) | |
| Lenovo Yoga 6 13 82ND0009US | |
| 1920x1080 Highest AA:4xMSAA + FX AF:16x | |
| Lenovo Yoga Slim 7-14ARE | |
| Dell XPS 13 9310 2-in-1 | |
| Gemiddeld Intel Iris Xe Graphics G7 96EUs (4.13 - 22.9, n=156) | |
| Lenovo Yoga 6 13 82ND0009US | |
| Far Cry 5 | |
| 1280x720 Low Preset AA:T | |
| Dell XPS 13 9310 2-in-1 | |
| Gemiddeld Intel Iris Xe Graphics G7 96EUs (23 - 75, n=93) | |
| 1920x1080 Low Preset AA:T | |
| Gemiddeld Intel Iris Xe Graphics G7 96EUs (15 - 48, n=41) | |
| Dell XPS 13 9310 2-in-1 | |
| 1920x1080 Medium Preset AA:T | |
| Gemiddeld Intel Iris Xe Graphics G7 96EUs (14 - 39, n=91) | |
| Dell XPS 13 9310 2-in-1 | |
| 1920x1080 High Preset AA:T | |
| Gemiddeld Intel Iris Xe Graphics G7 96EUs (10 - 35, n=89) | |
| Dell XPS 13 9310 2-in-1 | |
| 1920x1080 Ultra Preset AA:T | |
| Gemiddeld Intel Iris Xe Graphics G7 96EUs (11 - 33, n=75) | |
| Dell XPS 13 9310 2-in-1 | |
Witcher 3 FPS Chart
| lage | gem. | hoge | ultra | |
|---|---|---|---|---|
| GTA V (2015) | 96.7 | 80.5 | 25.4 | 10 |
| The Witcher 3 (2015) | 86.2 | 54.3 | 29.9 | 14.7 |
| Dota 2 Reborn (2015) | 109 | 61.4 | 52.8 | 52.8 |
| Final Fantasy XV Benchmark (2018) | 36.8 | 21.8 | 15.9 | |
| X-Plane 11.11 (2018) | 23.5 | 31.9 | 31.3 | |
| Far Cry 5 (2018) | 49 | 23 | 22 | 22 |
| Strange Brigade (2018) | 78.1 | 36.8 | 29.4 | 24 |
Emissions
Systeemgeluid - Stil onder de meeste lage tot middelhoge belastingen
Het gedrag van de ventilator is bijna identiek aan wat we hebben waargenomen bij de XPS 13 7390 2-in-1. Het belangrijkste verschil is dat het ventilatorgeluid eerder kan toenemen bij het uitvoeren van hoge belastingen zoals 3DMark 06, mogelijk als gevolg van de hogere Turbo Boost en PL2 limieten van Tiger Lake-U in vergelijking met Ice Lake. Voor het overige kunnen gebruikers een ventilatorgeluid verwachten tussen 38 en 43 dB(A) bij het uitvoeren van veeleisende belastingen of tot 27,2 dB(A) bij video streaming of surfen op het web tegen een stille achtergrond van 24,3 dB(A). De nieuwe Galaxy Book Pro 360 13 zou soortgelijke resultaten laten zien.
| Dell XPS 13 9310 2-in-1 Iris Xe G7 96EUs, i7-1165G7, Toshiba BG4 KBG40ZPZ512G | Dell XPS 13 9310 Core i7 FHD Iris Xe G7 96EUs, i7-1165G7, Micron 2300 512GB MTFDHBA512TDV | Dell XPS 13 7390 2-in-1 Core i7 Iris Plus Graphics G7 (Ice Lake 64 EU), i7-1065G7, Toshiba BG4 KBG40ZPZ512G | Lenovo Yoga 6 13 82ND0009US Vega 7, R5 5500U, WDC PC SN530 SDBPMPZ-265G | Asus ZenBook Flip 13 UX363EA-HP069T Iris Xe G7 96EUs, i7-1165G7, WDC PC SN730 SDBPNTY-1T00 | Samsung Galaxy Book Pro 360 13 Iris Xe G7 80EUs, i5-1135G7, Samsung PM991 MZVLQ256HAJD | |
|---|---|---|---|---|---|---|
| Noise | 4% | -8% | -1% | -12% | -7% | |
| uit / omgeving * (dB) | 24.3 | 25.7 -6% | 28.1 -16% | 25.1 -3% | 27 -11% | 27 -11% |
| Idle Minimum * (dB) | 24.8 | 25.7 -4% | 28.1 -13% | 25.1 -1% | 27 -9% | 27 -9% |
| Idle Average * (dB) | 24.8 | 25.7 -4% | 28.1 -13% | 25.1 -1% | 27 -9% | 27 -9% |
| Idle Maximum * (dB) | 24.8 | 25.9 -4% | 28.1 -13% | 25.1 -1% | 27 -9% | 27 -9% |
| Load Average * (dB) | 38 | 26.2 31% | 31.7 17% | 41 -8% | 46 -21% | 40.7 -7% |
| Witcher 3 ultra * (dB) | 38 | 36.5 4% | 43.4 -14% | 38.6 -2% | ||
| Load Maximum * (dB) | 41.5 | 36.6 12% | 43.4 -5% | 38.7 7% | 46.6 -12% | 40.7 2% |
* ... kleiner is beter
Geluidsniveau
| Onbelast |
| 24.8 / 24.8 / 24.8 dB (A) |
| Belasting |
| 38 / 41.5 dB (A) |
 | ||
30 dB stil 40 dB(A) hoorbaar 50 dB(A) luid |
||
min: | ||
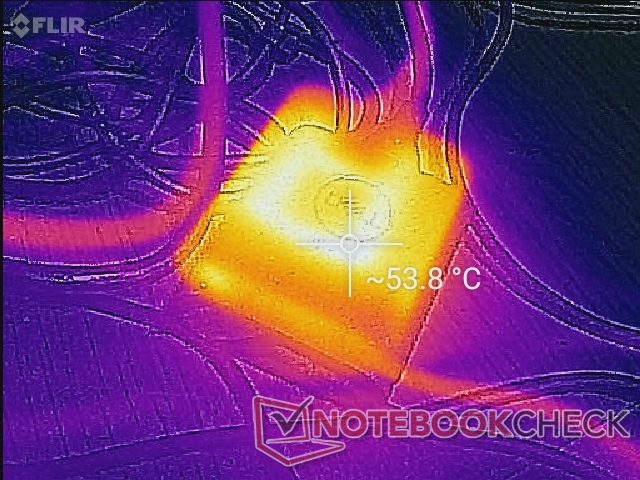
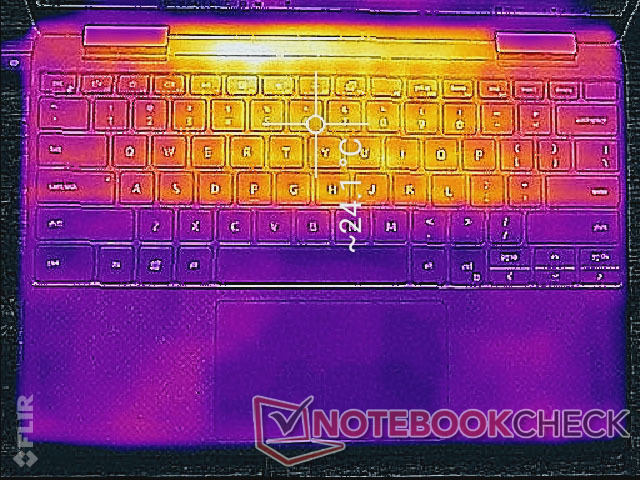
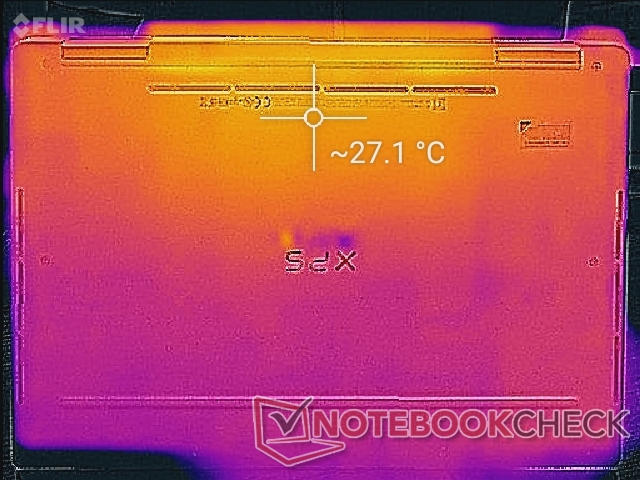
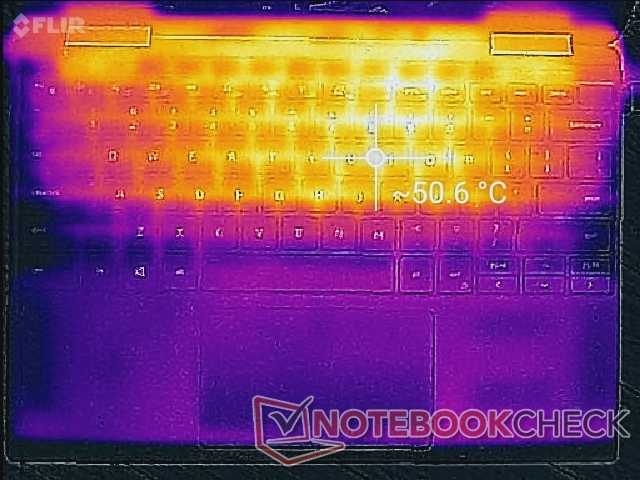
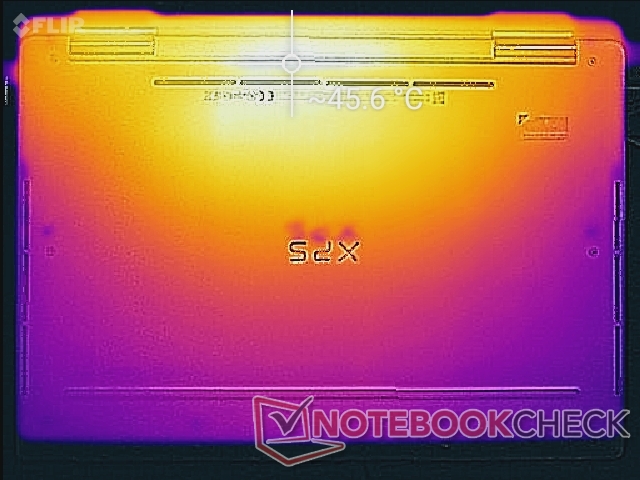
Temperatuur - Relatief koele palmsteunen
De oppervlaktetemperaturen zijn vrijwel identiek aan wat we waarnamen bij de Ice Lake-aangedreven XPS 13 7390 2-in-1 met respectievelijk ongeveer 50 C en 57 C op de bovenste en onderste hotspots. Het toetsenbord blijft merkbaar warmer dan op de meeste andere subnotebooks, inclusief de nieuweSamsung Galaxy Book Pro 360.
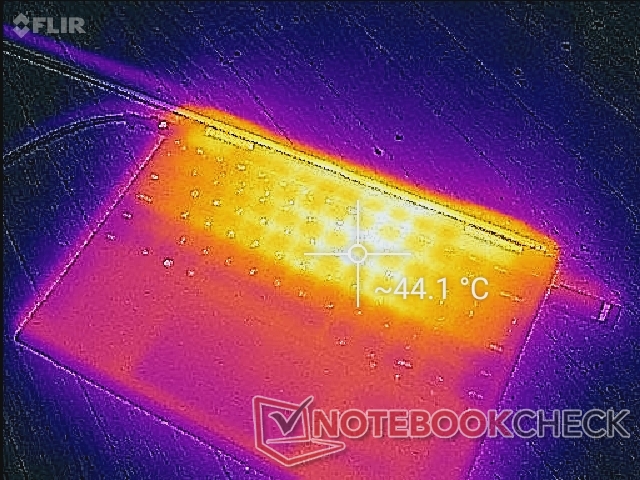
(-) De maximumtemperatuur aan de bovenzijde bedraagt 51 °C / 124 F, vergeleken met het gemiddelde van 35.4 °C / 96 F, variërend van 19.6 tot 60 °C voor de klasse Convertible.
(-) De bodem warmt op tot een maximum van 45.4 °C / 114 F, vergeleken met een gemiddelde van 36.9 °C / 98 F
(+) Bij onbelast gebruik bedraagt de gemiddelde temperatuur voor de bovenzijde 22.9 °C / 73 F, vergeleken met het apparaatgemiddelde van 30.3 °C / 87 F.
(+) De palmsteunen en het touchpad zijn met een maximum van ###max## °C / 87.1 F koeler dan de huidtemperatuur en voelen daarom koel aan.
(-) De gemiddelde temperatuur van de handpalmsteun van soortgelijke toestellen bedroeg 28 °C / 82.4 F (-2.6 °C / -4.7 F).
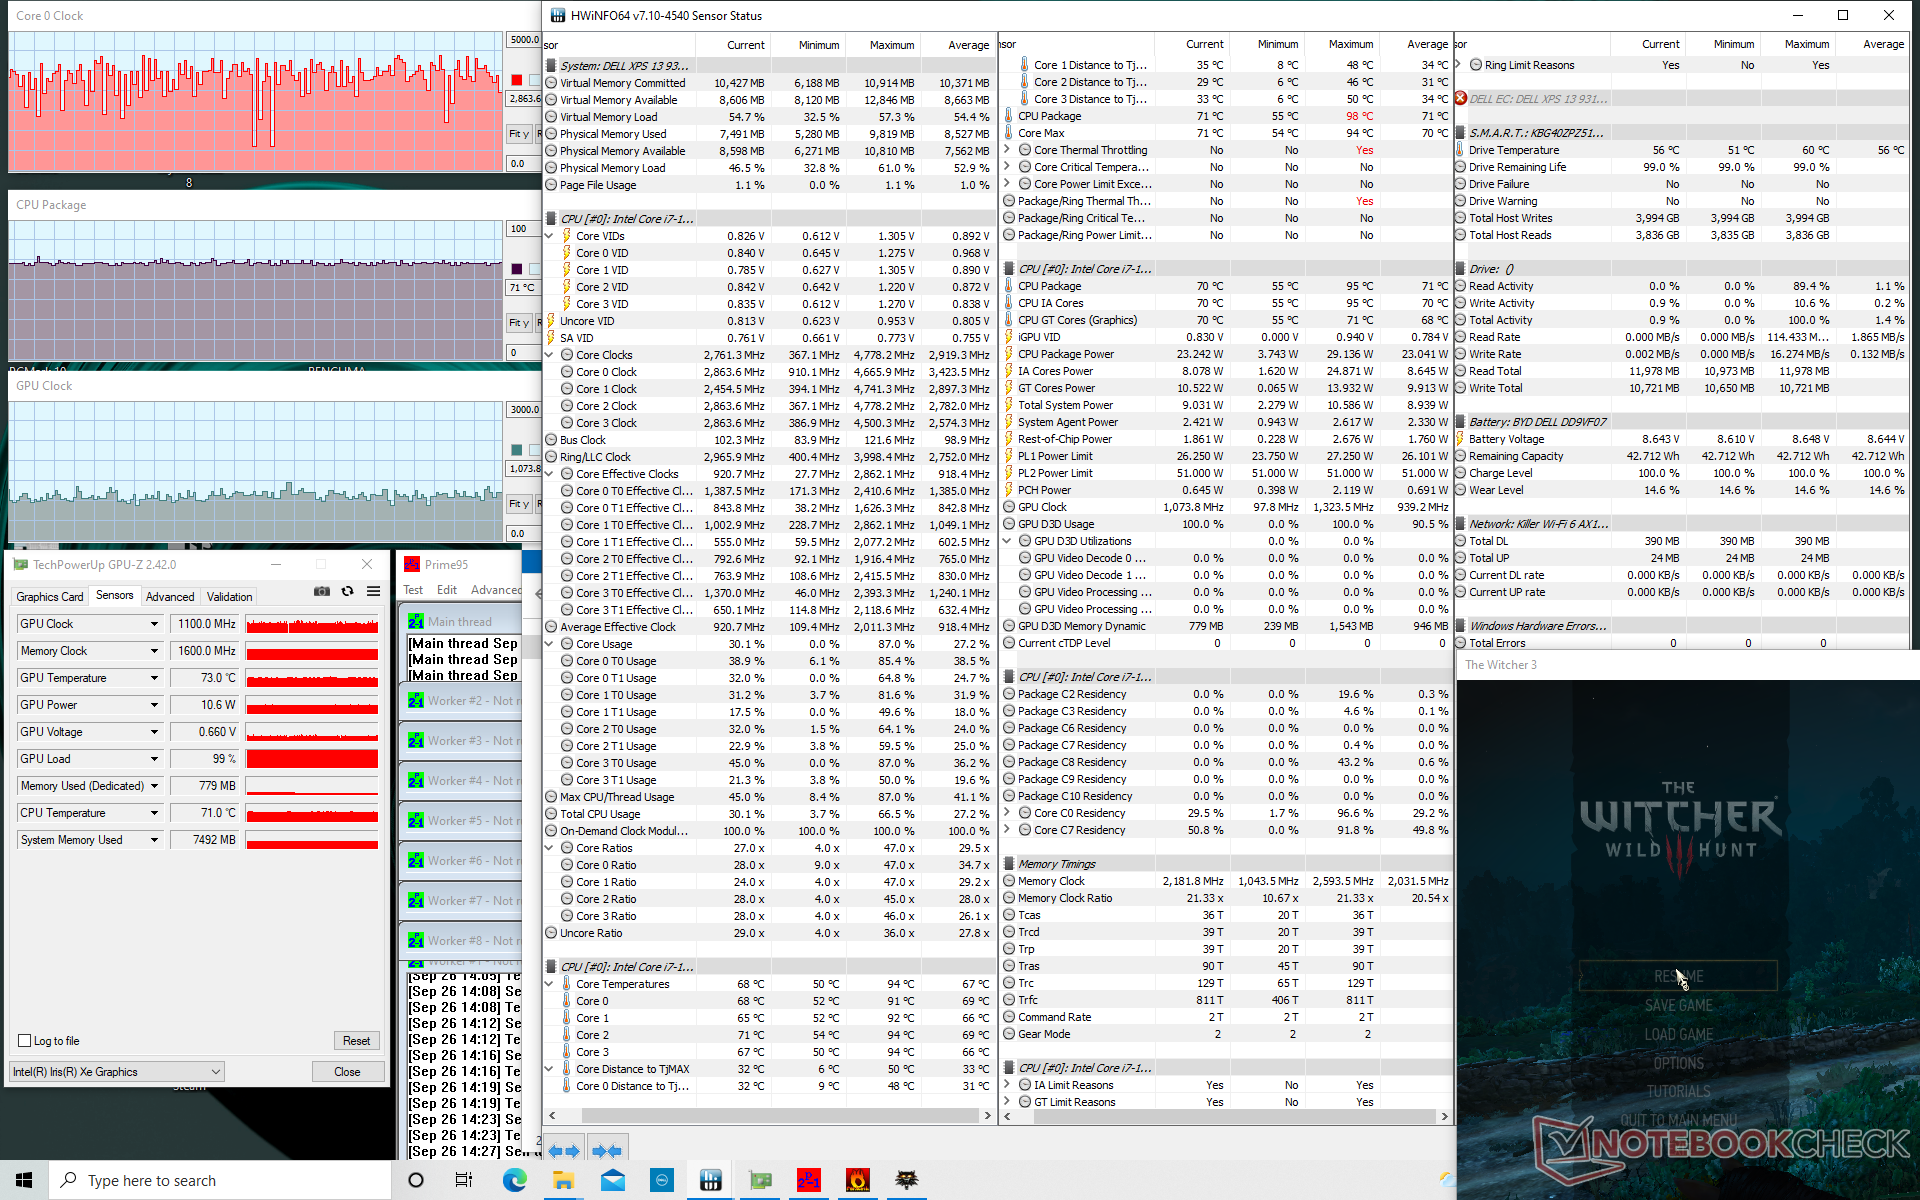
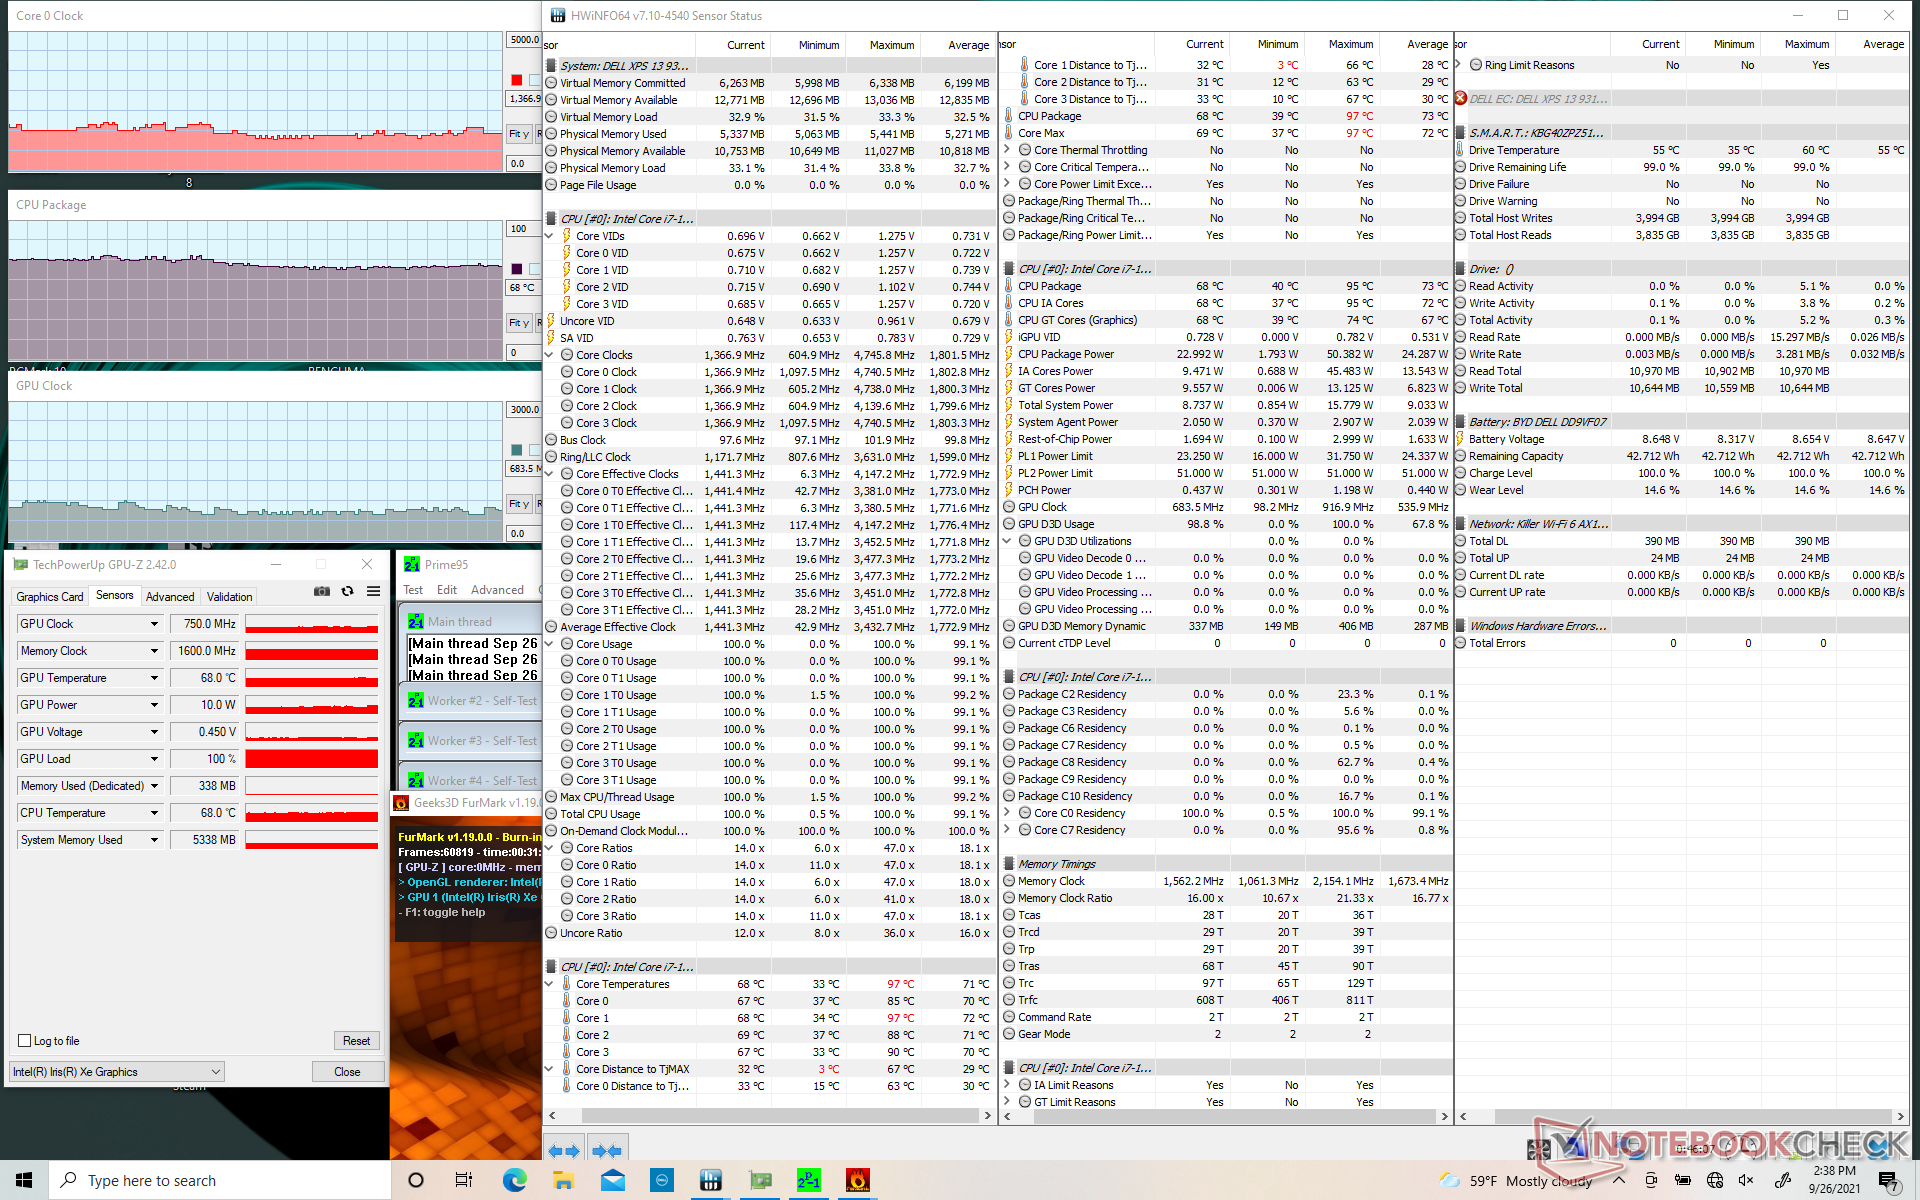
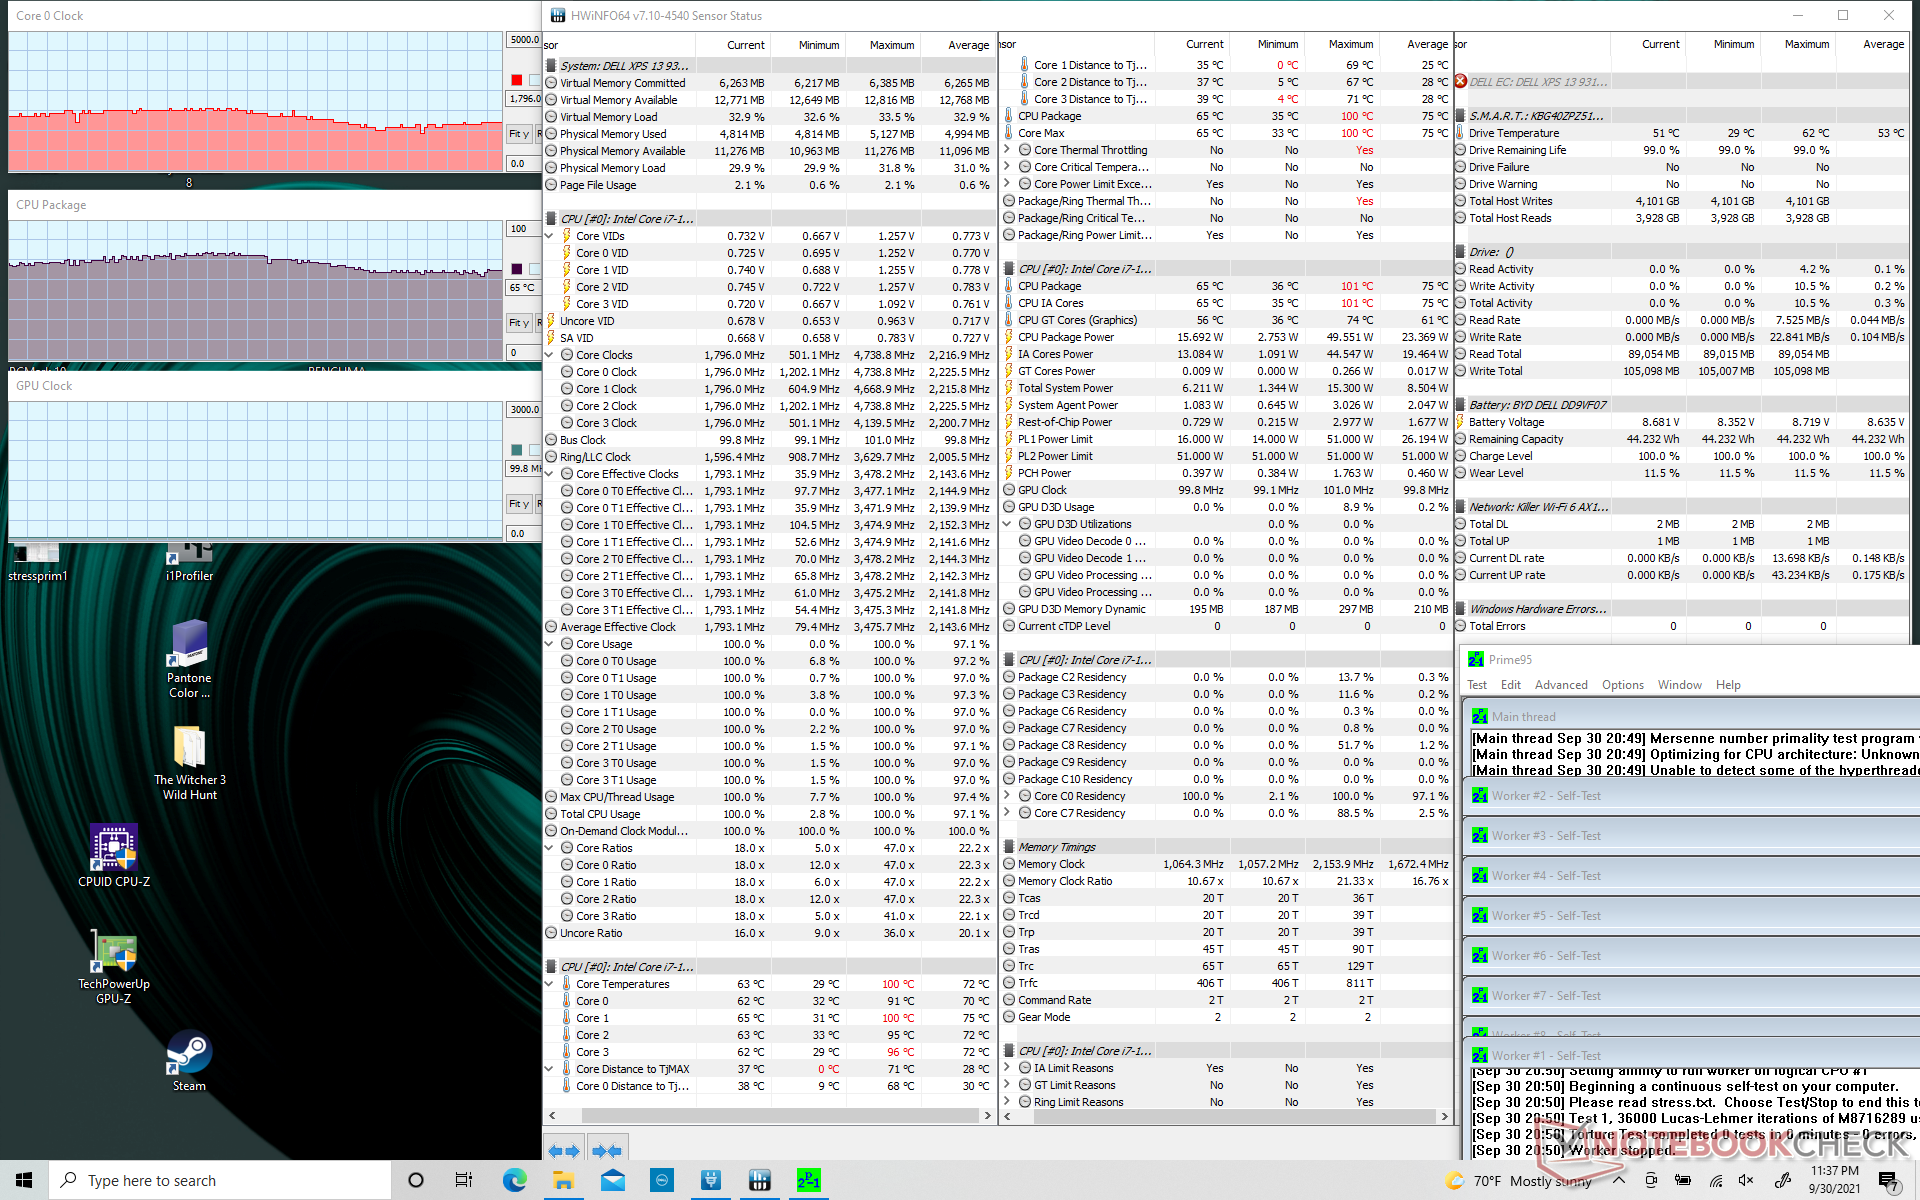
Stresstest - cyclische kloksnelheden en framesnelheden
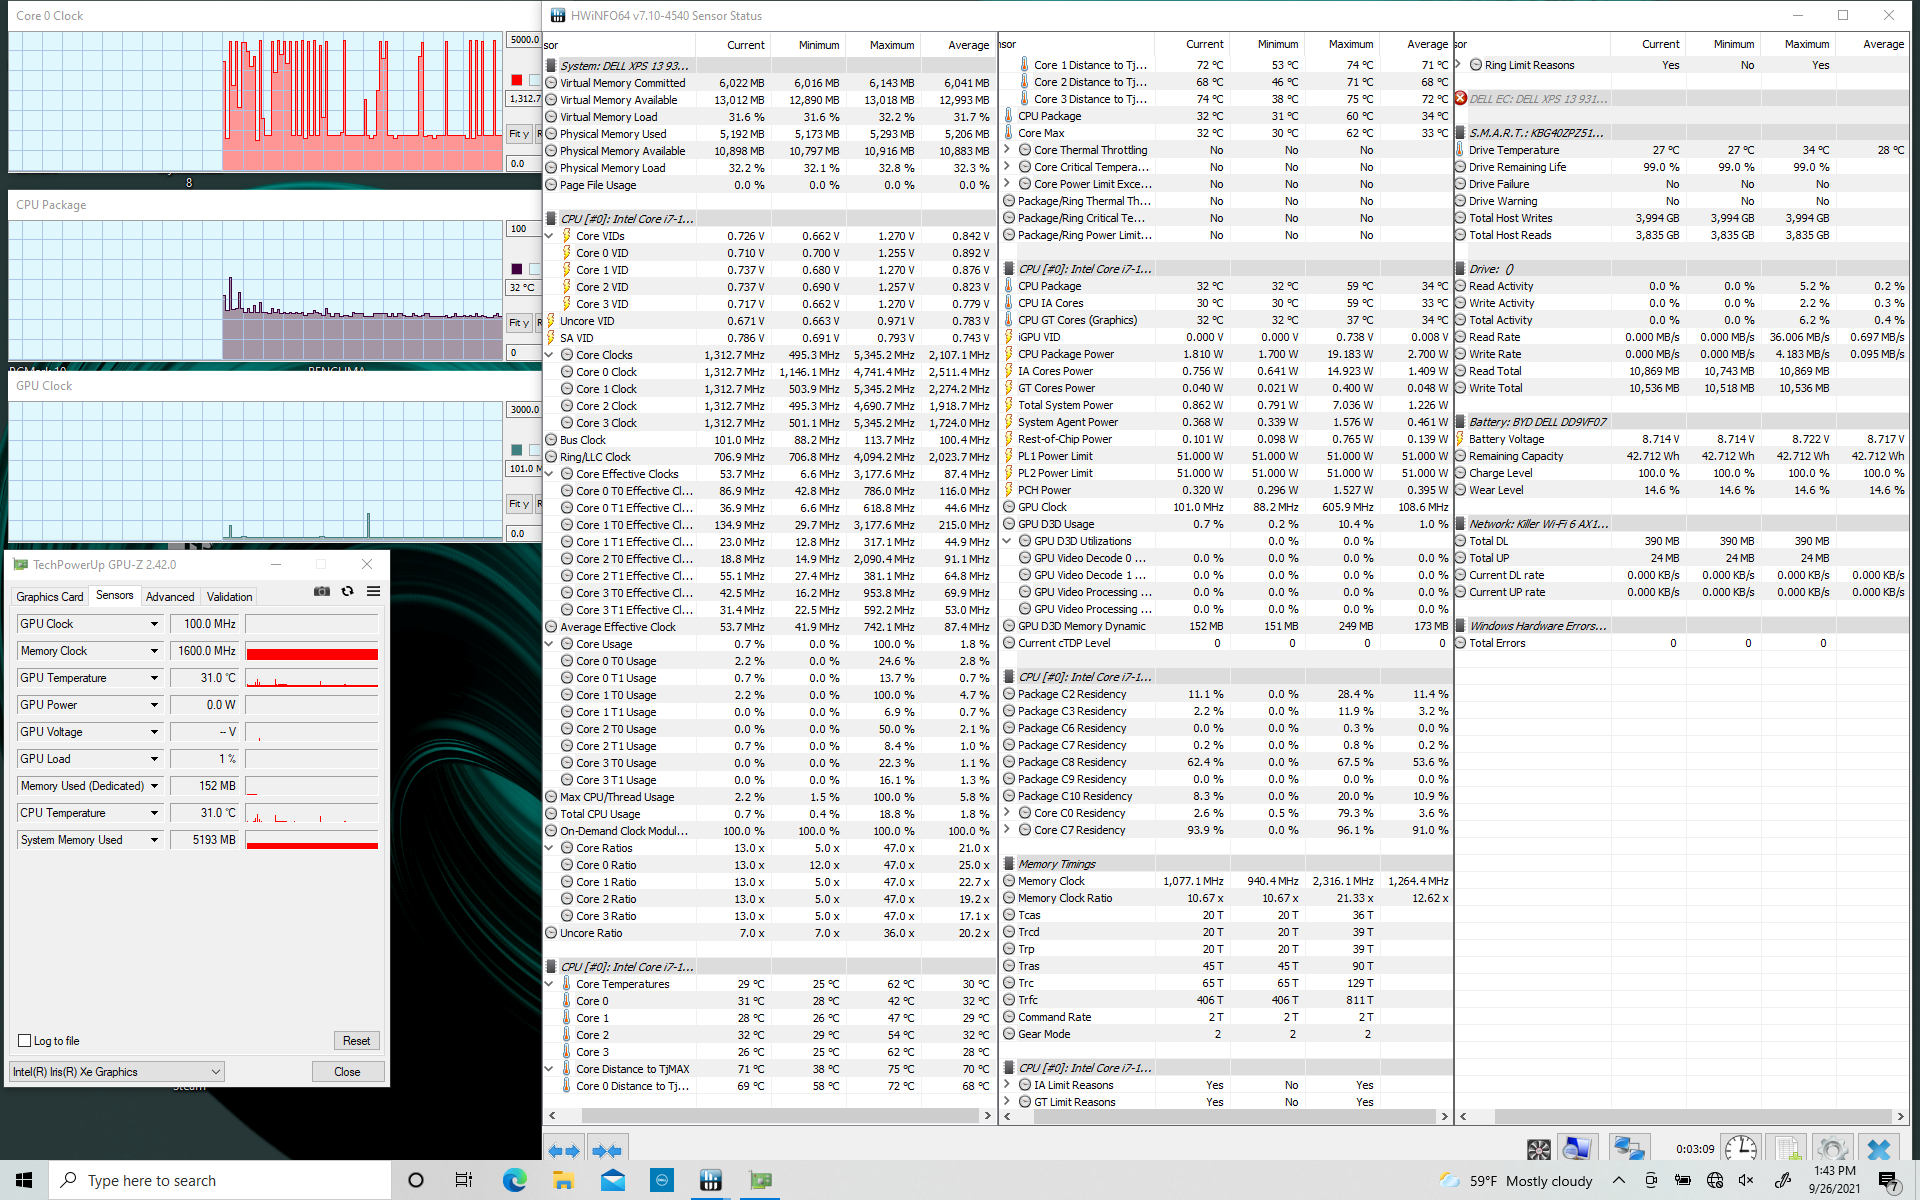
Wanneer de CPU werd belast met Prime95, piekten de kloksnelheden en de temperatuur en bleven deze de eerste paar minuten stabiel tot 2,9 GHz en 100 C. Daarna daalden de kloksnelheden en de temperatuur en stabiliseerden ze zich in het bereik van respectievelijk 1,8 tot 2,2 GHz en 66 tot 75 C, zelfs wanneer ze via de Dell Power Manager-software waren ingesteld op de Ultra Performance-modus. Ter vergelijking, de Ice Lake-aangedreven XPS 13 7390 2-in-1 stabiliseerde bij zowel hogere kernkloksnelheden als hogere temperaturen. Het lijkt er dus op dat de nieuwere XPS 13 9310 2-in-1 streeft naar lagere kerntemperaturen, zij het ten koste van hogere Turbo Boost prestaties. De cyclische kloksnelheden onder stress weerspiegelen onze cyclische CineBench R15 xT loop scores van hierboven
GPU kloksnelheden zouden ook cycli tussen 800 en 1280 MHz tijdens het uitvoeren van Witcher 3, die ook weerspiegelen onze fietsen framerates hierboven vermeld. Het is jammer dat er geen optie voor "constante prestaties" beschikbaar is op de XPS 13 voor gebruikers die dit liever hebben dan dit cyclische gedrag
Op de batterij werken zal de prestaties beperken. Een 3DMark 11 test op batterijen zou een Physics en Graphics score opleveren van respectievelijk 9805 en 5106 punten, vergeleken met 11424 en 6569 punten op netstroom.

| CPUklok (GHz) GPUklok (MHz) GemiddeldeCPU temperatuur (°C) |
| Systeem Idle |
| Prime95 Stress 1.8 - 2.2 66 - 75 |
| Prime95 + FurMark Stress 1.4 - 1.6 ~ 650 - 750 68 |
| Witcher 3 Stress |
Sprekers

Dell XPS 13 9310 2-in-1 audioanalyse
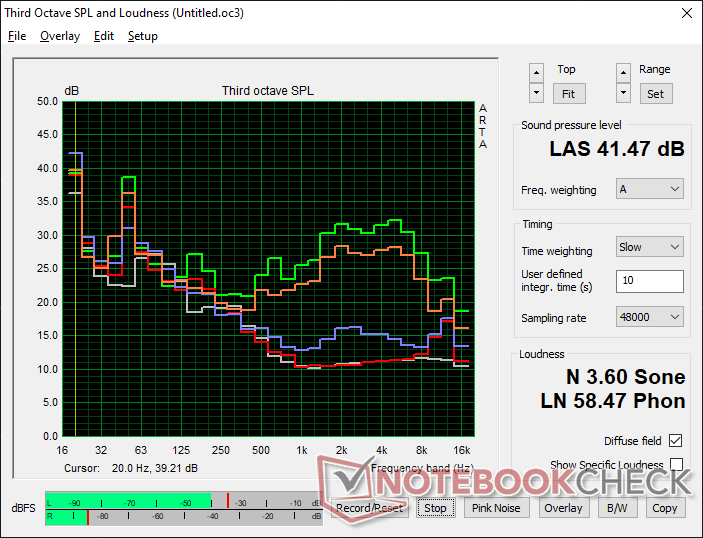
(±) | luidspreker luidheid is gemiddeld maar goed (80.7 dB)
Bas 100 - 315 Hz
(±) | verminderde zeebaars - gemiddeld 11.7% lager dan de mediaan
(±) | lineariteit van de lage tonen is gemiddeld (10.6% delta ten opzichte van de vorige frequentie)
Midden 400 - 2000 Hz
(±) | hogere middens - gemiddeld 6.1% hoger dan de mediaan
(+) | de middentonen zijn lineair (4.1% delta ten opzichte van de vorige frequentie)
Hoog 2 - 16 kHz
(+) | evenwichtige hoogtepunten - slechts 1.4% verwijderd van de mediaan
(+) | de hoge tonen zijn lineair (3.6% delta naar de vorige frequentie)
Algemeen 100 - 16.000 Hz
(+) | het totale geluid is lineair (12.7% verschil met de mediaan)
Vergeleken met dezelfde klasse
» 15% van alle geteste apparaten in deze klasse waren beter, 2% vergelijkbaar, 83% slechter
» De beste had een delta van 6%, het gemiddelde was 20%, de slechtste was 57%
Vergeleken met alle geteste toestellen
» 12% van alle geteste apparaten waren beter, 3% gelijk, 86% slechter
» De beste had een delta van 4%, het gemiddelde was 24%, de slechtste was 134%
Apple MacBook 12 (Early 2016) 1.1 GHz audioanalyse
(+) | luidsprekers kunnen relatief luid spelen (83.6 dB)
Bas 100 - 315 Hz
(±) | verminderde zeebaars - gemiddeld 11.3% lager dan de mediaan
(±) | lineariteit van de lage tonen is gemiddeld (14.2% delta ten opzichte van de vorige frequentie)
Midden 400 - 2000 Hz
(+) | evenwichtige middens - slechts 2.4% verwijderd van de mediaan
(+) | de middentonen zijn lineair (5.5% delta ten opzichte van de vorige frequentie)
Hoog 2 - 16 kHz
(+) | evenwichtige hoogtepunten - slechts 2% verwijderd van de mediaan
(+) | de hoge tonen zijn lineair (4.5% delta naar de vorige frequentie)
Algemeen 100 - 16.000 Hz
(+) | het totale geluid is lineair (10.2% verschil met de mediaan)
Vergeleken met dezelfde klasse
» 7% van alle geteste apparaten in deze klasse waren beter, 2% vergelijkbaar, 91% slechter
» De beste had een delta van 5%, het gemiddelde was 18%, de slechtste was 53%
Vergeleken met alle geteste toestellen
» 5% van alle geteste apparaten waren beter, 1% gelijk, 94% slechter
» De beste had een delta van 4%, het gemiddelde was 24%, de slechtste was 134%
Energy Management
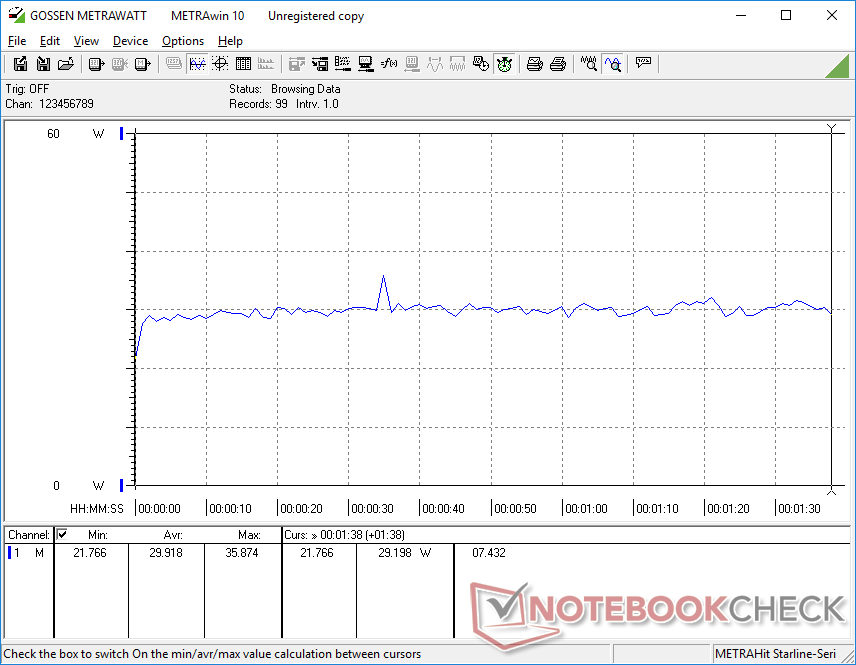
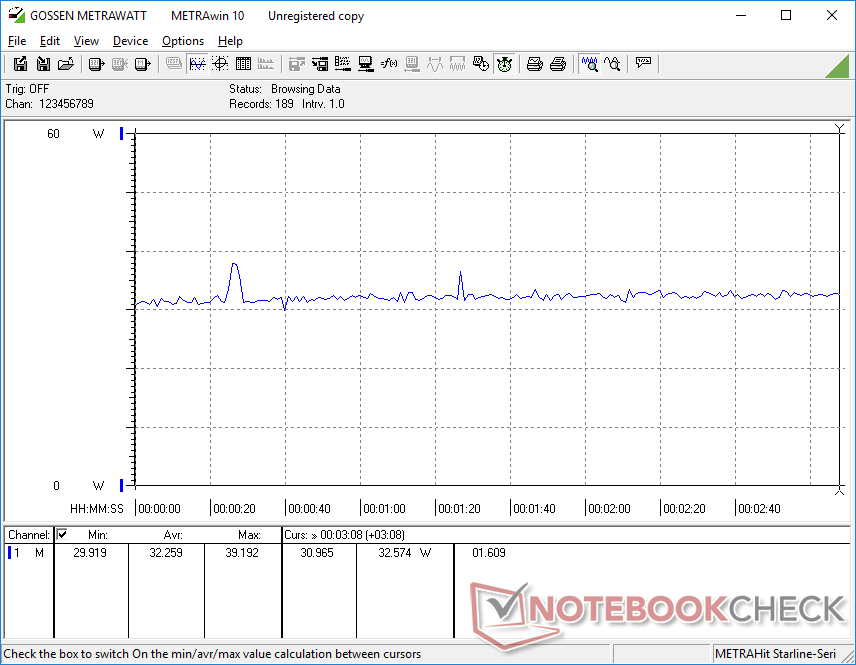
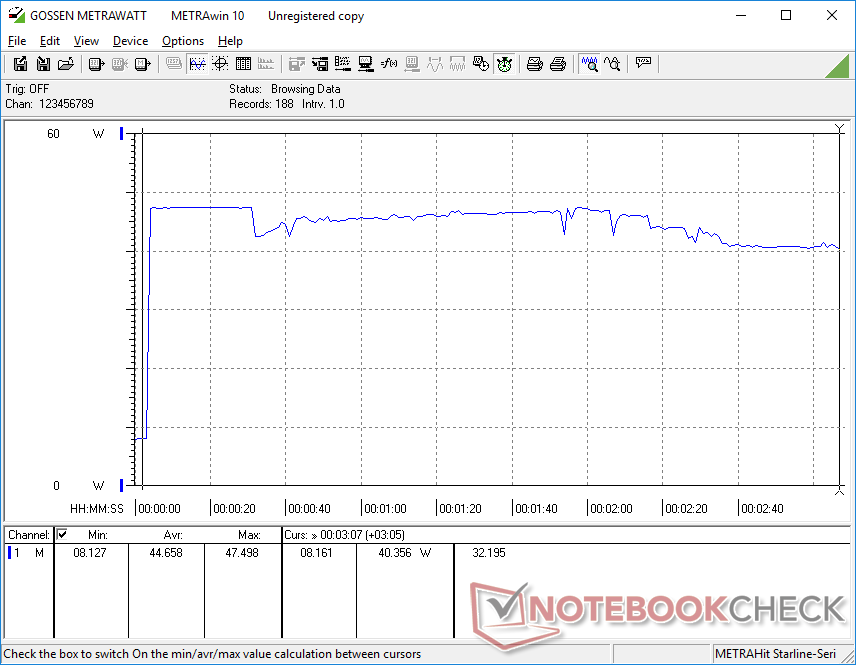
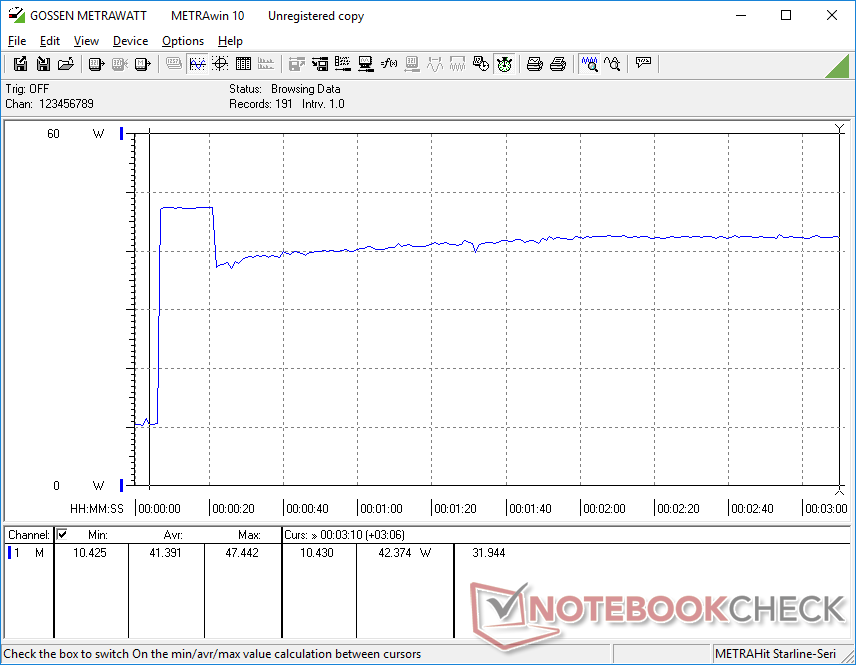
Energieverbruik - veel energiezuiniger
Het systeem verbruikt tijdens het gamen minder stroom dan op de oudere XPS 13 7390 2-in-1, ondanks de aanzienlijke toename in grafische prestaties. Dit laat zien hoe groot de sprong van Iris Xe ten opzichte van de Iris Plus G7 kan zijn, zowel wat betreft energiezuinigheid als prestaties.
| Uit / Standby | |
| Inactief | |
| Belasting |
|
Key:
min: | |
| Dell XPS 13 9310 2-in-1 i7-1165G7, Iris Xe G7 96EUs, Toshiba BG4 KBG40ZPZ512G, IPS, 1920x1200, 13.4" | Dell XPS 13 9310 Core i7 FHD i7-1165G7, Iris Xe G7 96EUs, Micron 2300 512GB MTFDHBA512TDV, IPS, 1920x1200, 13.4" | Dell XPS 13 7390 2-in-1 Core i7 i7-1065G7, Iris Plus Graphics G7 (Ice Lake 64 EU), Toshiba BG4 KBG40ZPZ512G, IPS, 1920x1200, 13.4" | Lenovo Yoga 6 13 82ND0009US R5 5500U, Vega 7, WDC PC SN530 SDBPMPZ-265G, IPS, 1920x1080, 13.3" | Asus ZenBook Flip 13 UX363EA-HP069T i7-1165G7, Iris Xe G7 96EUs, WDC PC SN730 SDBPNTY-1T00, OLED, 1920x1080, 13.3" | Samsung Galaxy Book Pro 360 13 i5-1135G7, Iris Xe G7 80EUs, Samsung PM991 MZVLQ256HAJD, AMOLED, 1920x1080, 13.2" | |
|---|---|---|---|---|---|---|
| Power Consumption | -11% | -9% | -20% | -11% | -22% | |
| Idle Minimum * (Watt) | 2.6 | 3.9 -50% | 2.6 -0% | 5 -92% | 4.4 -69% | 5 -92% |
| Idle Average * (Watt) | 6.4 | 5.9 8% | 5.3 17% | 6.3 2% | 7.4 -16% | 6 6% |
| Idle Maximum * (Watt) | 7.7 | 6.3 18% | 7 9% | 6.9 10% | 11.3 -47% | 11.7 -52% |
| Load Average * (Watt) | 29.9 | 39.7 -33% | 43.1 -44% | 41.5 -39% | 22 26% | 28 6% |
| Witcher 3 ultra * (Watt) | 32.2 | 34.8 -8% | 43.1 -34% | 33.2 -3% | 22.8 29% | 28.3 12% |
| Load Maximum * (Watt) | 47.5 | 47.5 -0% | 49 -3% | 46.5 2% | 42.5 11% | 53 -12% |
* ... kleiner is beter
Power Consumption Witcher 3 / Stresstest
Levensduur batterij - Runtimes met dubbele cijfers
De runtimes komen erg dicht in de buurt van wat we hebben geregistreerd op de XPS 13 9310 clamshell, terwijl ze bijna twee uur langer zijn dan op de oudere XPS 13 7390 2-in-1. Met 11 uur browsen via WLAN in de echte wereld zou de batterij voldoende moeten zijn voor een dag productief gebruik
Opladen van leeg naar volledig duurt nog steeds ongeveer 1,5 uur. De 45 W USB-C adapter kan ook worden gebruikt om andere apparaten op te laden.
| Dell XPS 13 9310 2-in-1 i7-1165G7, Iris Xe G7 96EUs, 51 Wh | Dell XPS 13 9310 Core i7 FHD i7-1165G7, Iris Xe G7 96EUs, 52 Wh | Dell XPS 13 7390 2-in-1 Core i7 i7-1065G7, Iris Plus Graphics G7 (Ice Lake 64 EU), 51 Wh | Lenovo Yoga 6 13 82ND0009US R5 5500U, Vega 7, 60 Wh | Asus ZenBook Flip 13 UX363EA-HP069T i7-1165G7, Iris Xe G7 96EUs, 67 Wh | Samsung Galaxy Book Pro 360 13 i5-1135G7, Iris Xe G7 80EUs, 63 Wh | |
|---|---|---|---|---|---|---|
| Batterijduur | 5% | -16% | -16% | -6% | 12% | |
| Reader / Idle (h) | 25.4 | 30 18% | 17.5 -31% | 20.5 -19% | 31.3 23% | |
| WiFi v1.3 (h) | 10.7 | 11 3% | 9 -16% | 13.2 23% | 10.7 0% | 12.1 13% |
| Load (h) | 3.4 | 3.2 -6% | 2 -41% | 3.4 0% | 3.4 0% |
Pro
Contra
Verdict - Sneller zonder extra kosten
De XPS 13 9310 2-in-1 biedt aanzienlijk snellere grafische prestaties dan de XPS 13 7390 2-in-1. Beter nog, het systeem bereikt dit met hetzelfde stroomverbruik, wat betekent dat gebruikers betere grafische prestaties krijgen zonder dat dit ten koste gaat van de batterijgebruiksduur, oppervlaktetemperaturen of ventilatorgeluid. Wie veel grafische bewerkingen uitvoert, zal ongetwijfeld veel baat hebben bij de overstap naar Iris Xe, in plaats van de oudere UHD Graphics of de Iris Plus G7 van vorig jaar.
Intel Iris Xe is een enorme aanwinst voor de XPS 13-serie, maar de onstabiele CPU en GPU kloksnelheden in vergelijking met de meeste andere Ultrabooks of subnotebooks kunnen voor sommige power-gebruikers vervelend zijn.
Helaas zijn de prestaties van de processor nauwelijks verbeterd ten opzichte van de Core i7 XPS 13 7390 2-in-1. Kloksnelheden hebben de neiging om veel sneller te fluctueren op onze Core i7 XPS 13 9310 2-in-1, terwijl het ontbreken van nieuwe schermopties een minder stimulans is om het nieuwere model te bezitten. Het resultaat is dat veel thuisgebruikers weinig voordeel zullen halen uit de XPS 13 9310 2-in-1 in vergelijking met de XPS 13 7390 2-in-1, vooral wanneer het oudere model goedkoper kan worden gevonden.
Prijs en beschikbaarheid
Dell XPS 13 9310 2-in-1
- 02-10-2021 v7 (old)
Allen Ngo
Price comparison

