Dell XPS 13 9310 Core i7 Laptop Review: De 11e Gen Tiger Lake Difference
De Dell XPS 13 9300 is nauwelijks een jaar oud en zijn opvolger is al beschikbaar. Het nieuwere model, de XPS 13 9310, vervangt de 10e generatie Intel Ice Lake CPU met 11e generatie Tiger Lake opties naast snellere geheugenkloksnelheden. Voor het overige is de XPS 13 9310 visueel identiek aan zijn directe voorganger.
Voor dit overzicht vergelijken we de prestaties van de 9310 met die van de 9300 om te zien hoeveel prestatiewinst gebruikers kunnen verwachten en hoe de temperaturen, runtimes, weergavekwaliteit of het stroomverbruik tussen hen kunnen verschillen - als ze dat überhaupt al doen. Meer informatie over het chassis en andere fysieke kenmerken vindt u hier op onze bestaande XPS 13 9300-review.
Meer Dell-recensies:
Evaluatie | Datum | Model | Gewicht | Hoogte | Formaat | Resolutie | Beste prijs |
|---|---|---|---|---|---|---|---|
| 88.1 % v7 (old) | 10-2020 | Dell XPS 13 9310 Core i7 FHD i7-1165G7, Iris Xe G7 96EUs | 1.3 kg | 14.8 mm | 13.40" | 1920x1200 | |
| 88.9 % v7 (old) | 04-2020 | Dell XPS 13 9300 Core i7-1065G7 i7-1065G7, Iris Plus Graphics G7 (Ice Lake 64 EU) | 1.2 kg | 14.8 mm | 13.40" | 1920x1200 | |
| 92.1 % v7 (old) | 06-2020 | Apple MacBook Pro 13 2020 2GHz i5 10th-Gen i5-1038NG7, Iris Plus Graphics G7 (Ice Lake 64 EU) | 1.4 kg | 15.6 mm | 13.30" | 2560x1600 | |
| 87.4 % v7 (old) | 06-2020 | Huawei MateBook X Pro 2020 i7 i7-10510U, GeForce MX250 | 1.3 kg | 14.6 mm | 13.90" | 3000x2000 | |
| 85.3 % v7 (old) | 08-2020 | Lenovo Yoga Slim 7-14ARE R7 4800U, Vega 8 | 1.4 kg | 14.9 mm | 14.00" | 1920x1080 | |
| 88.4 % v7 (old) | 12-2019 | HP Spectre x360 13-aw0013dx i7-1065G7, Iris Plus Graphics G7 (Ice Lake 64 EU) | 1.2 kg | 16.9 mm | 13.30" | 1920x1080 |
Zaak
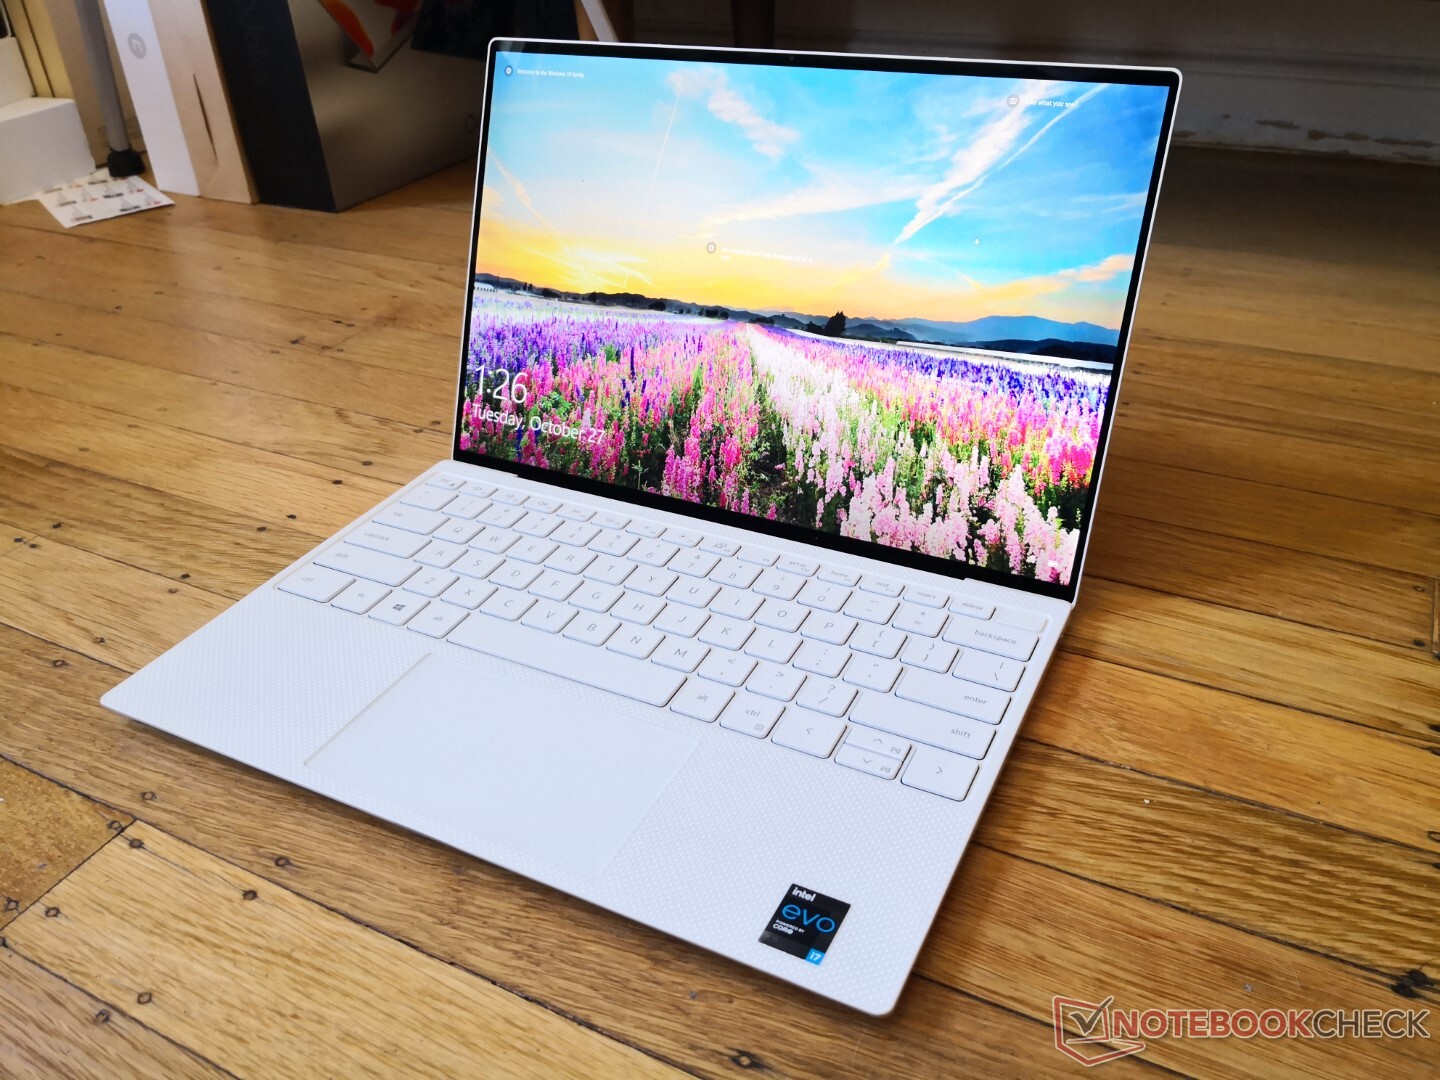
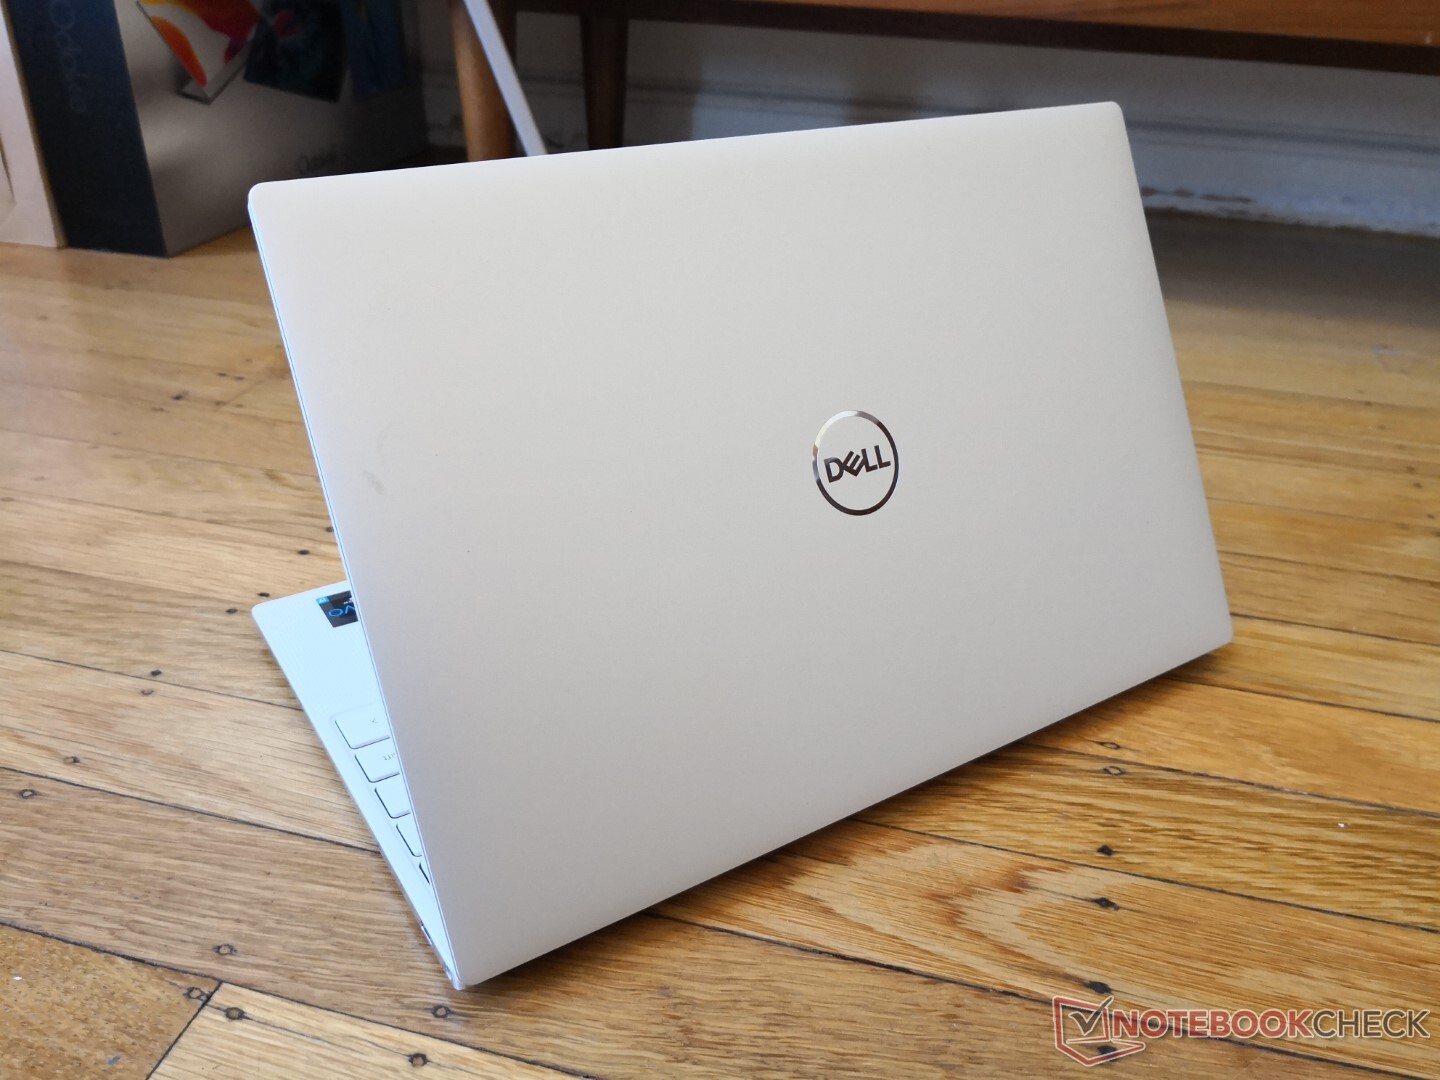
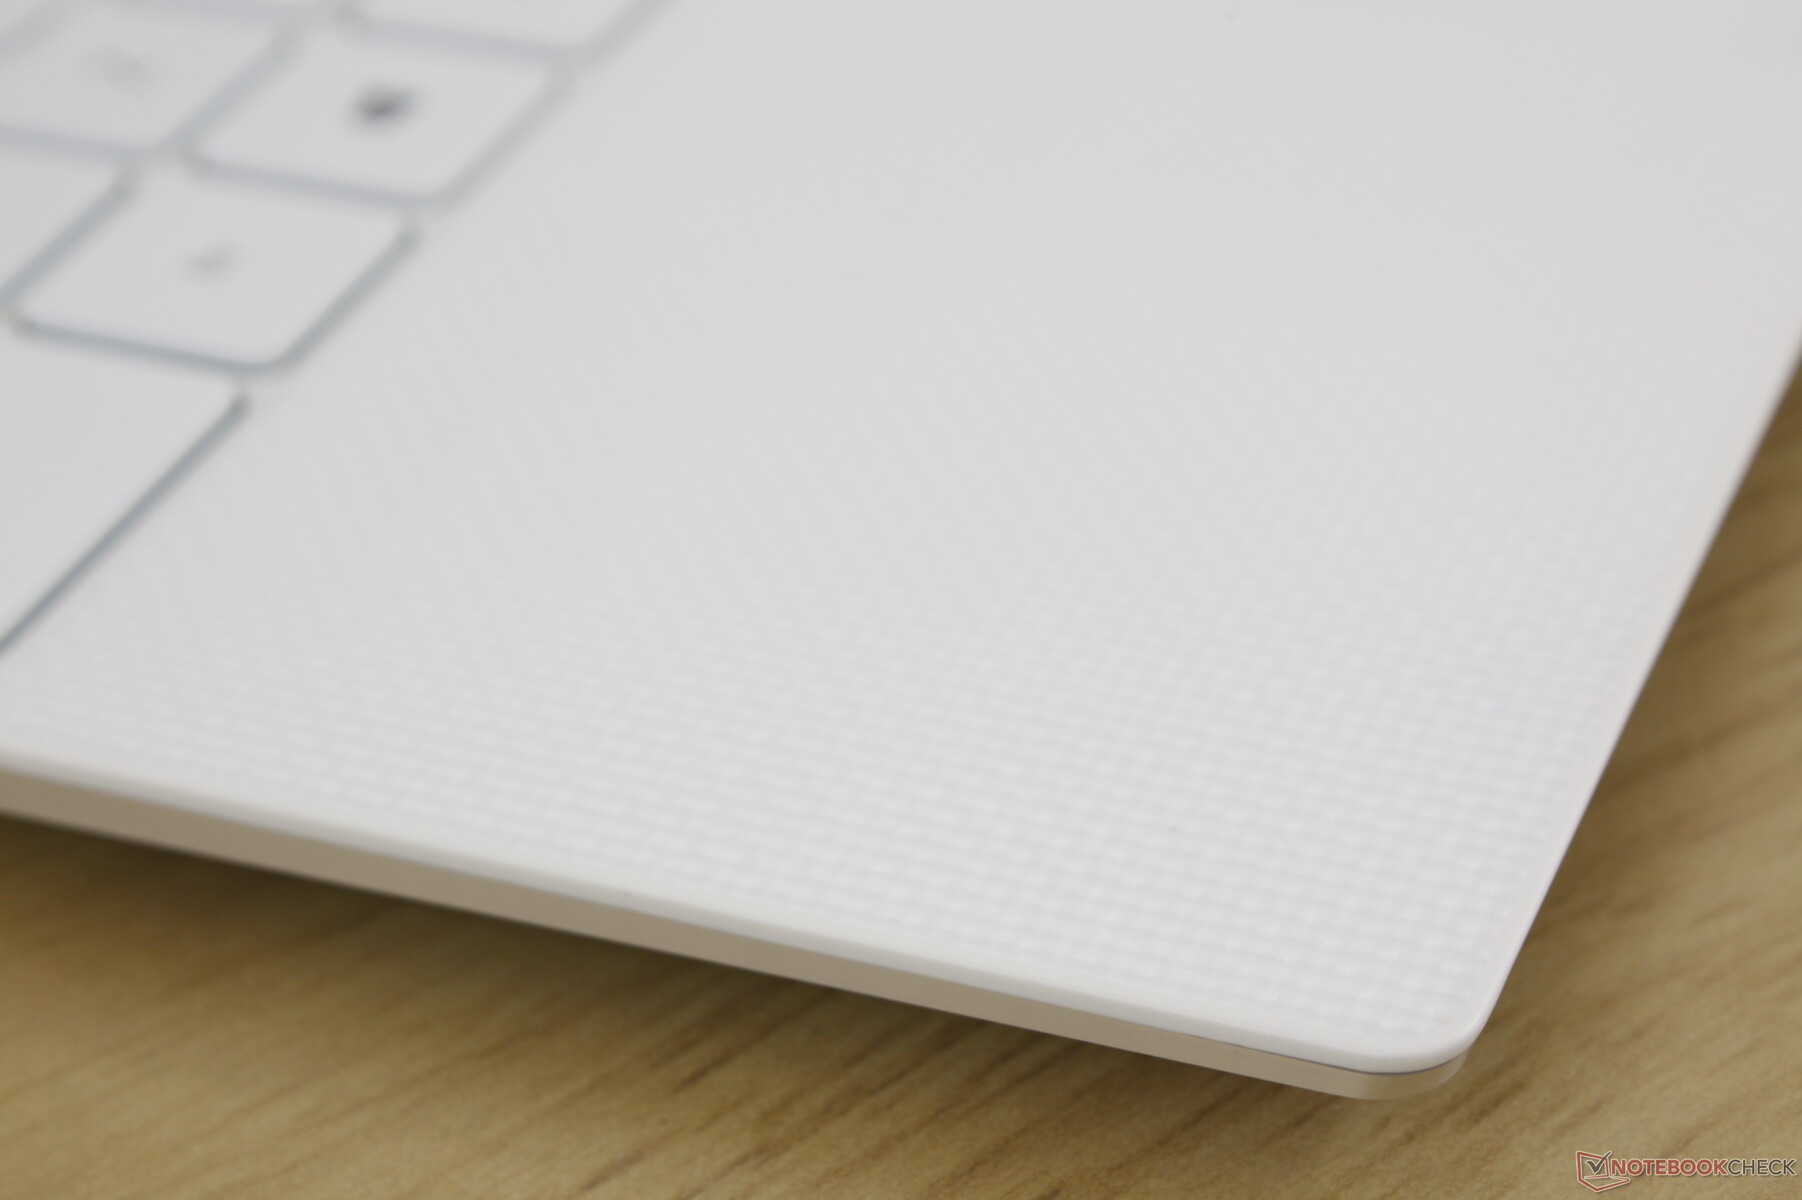
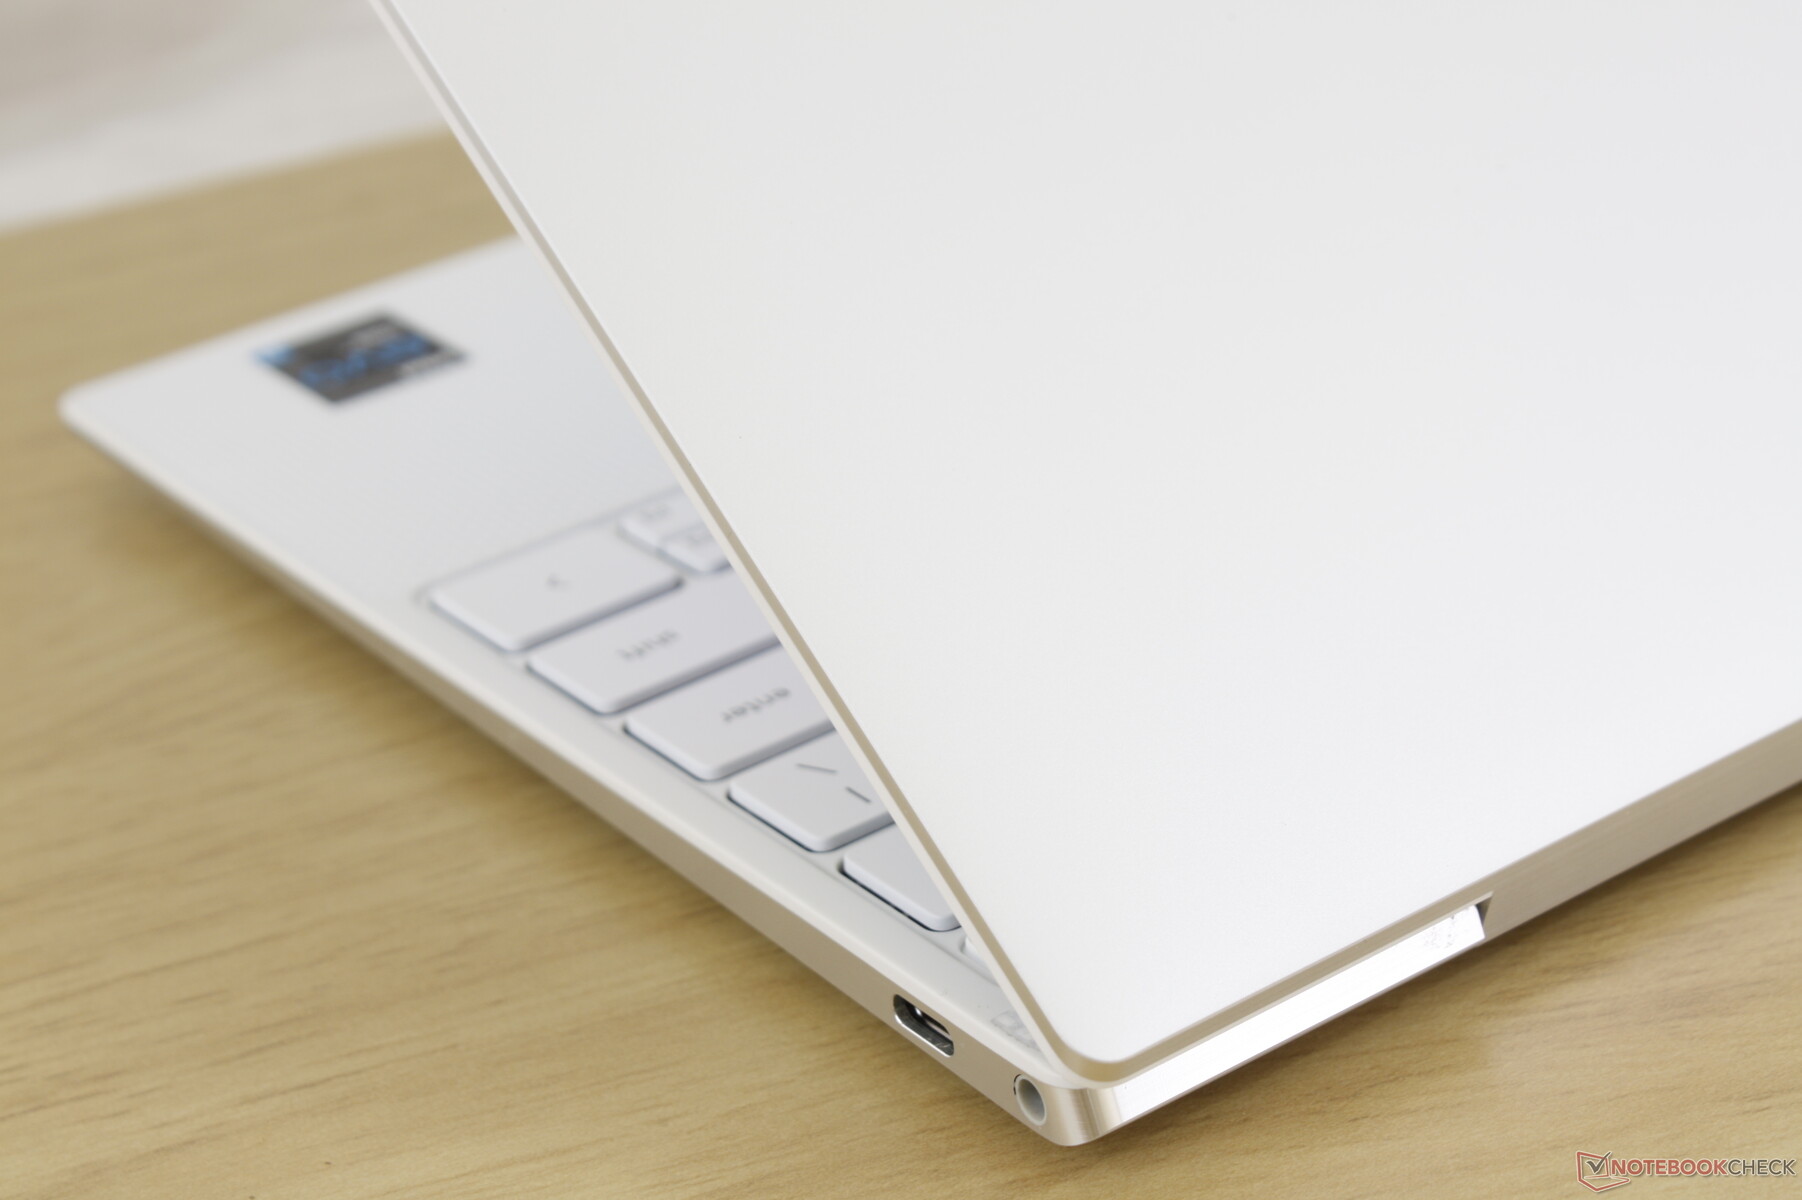
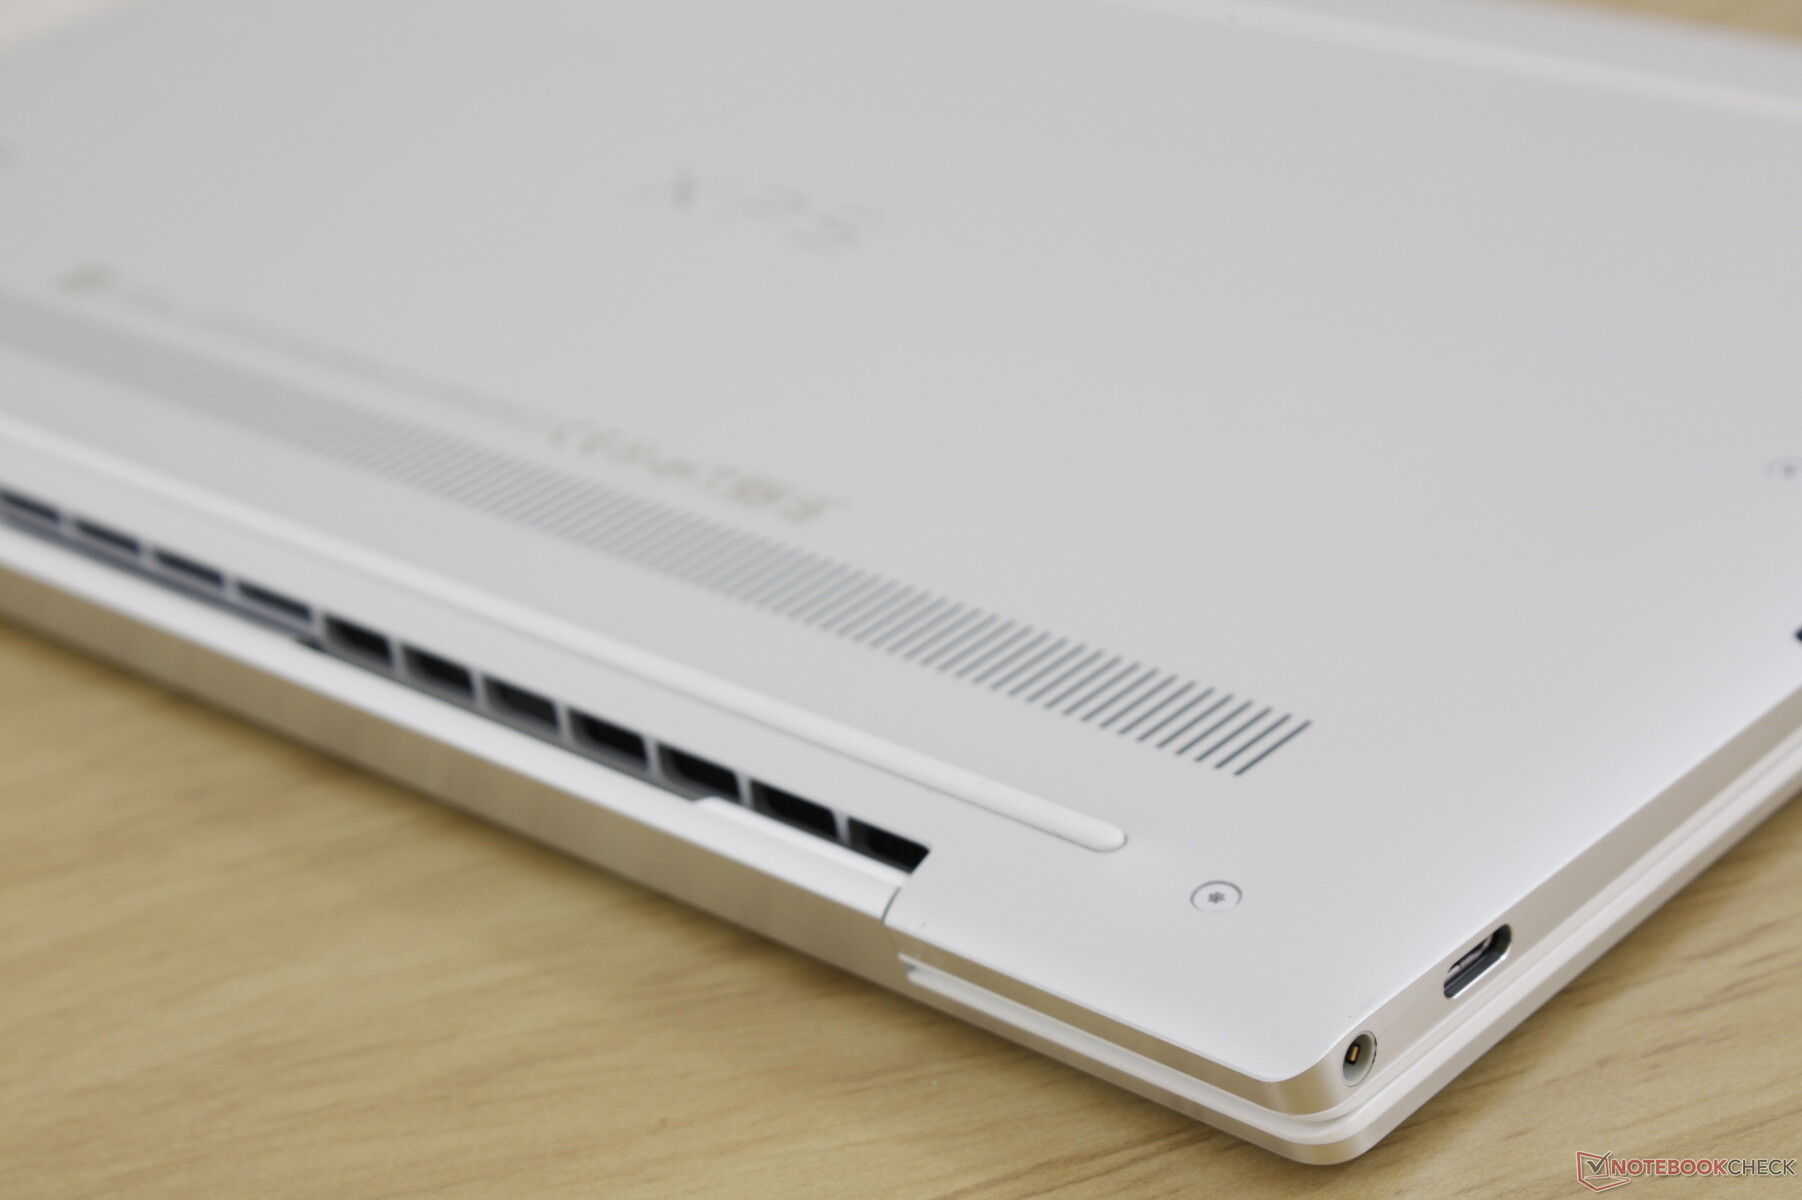
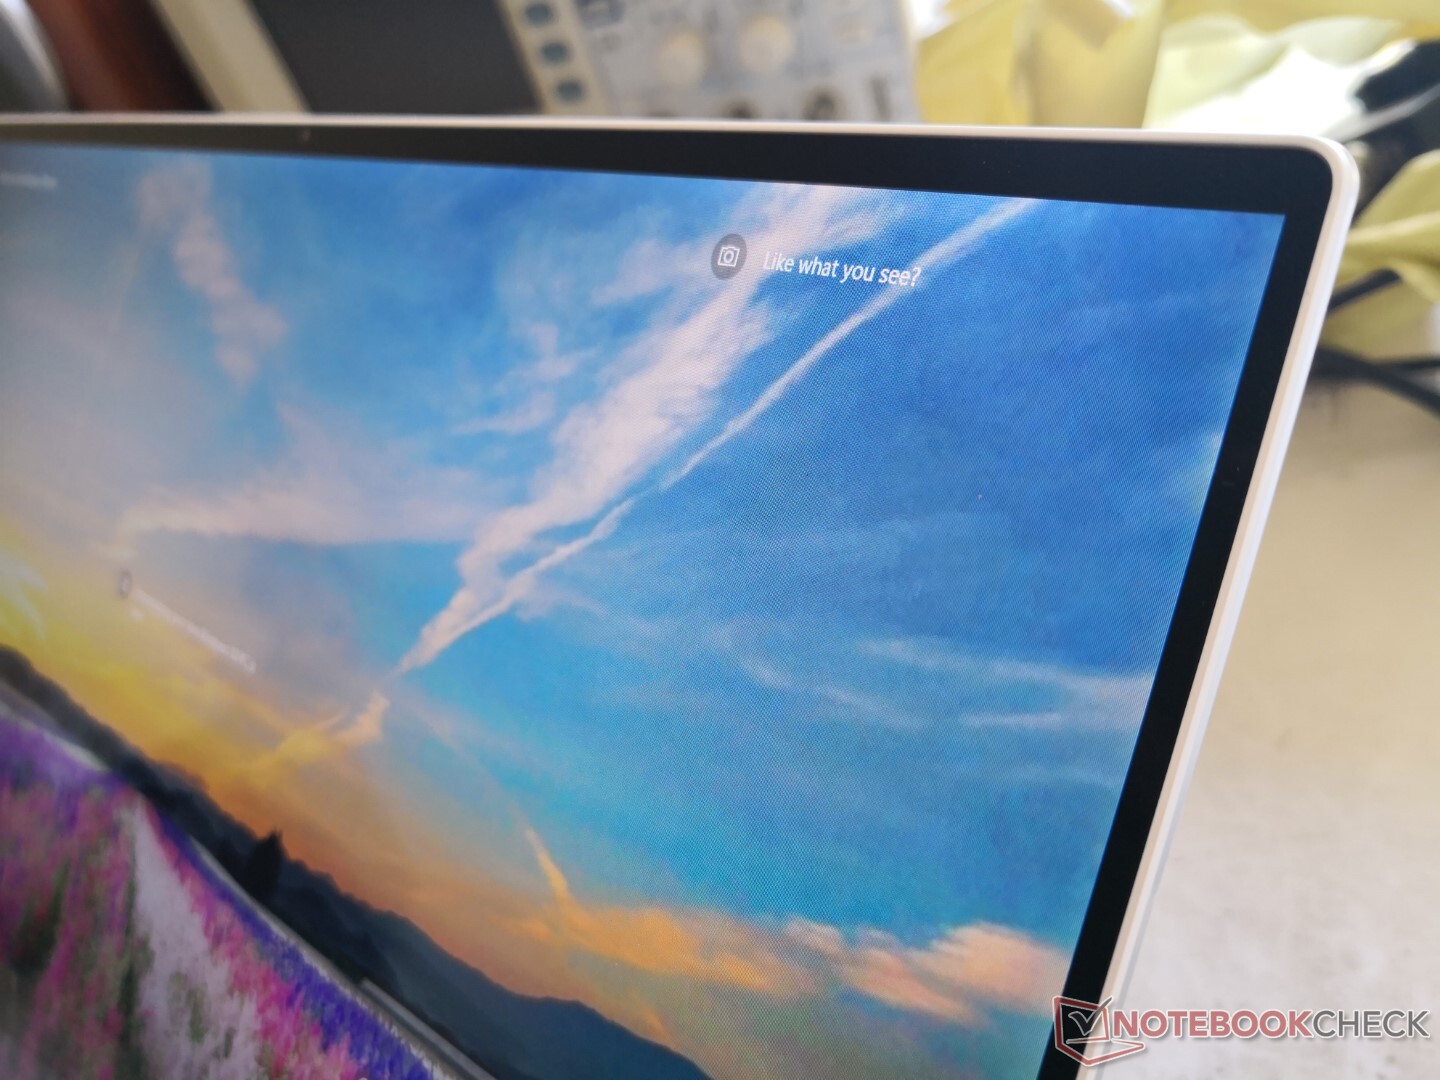
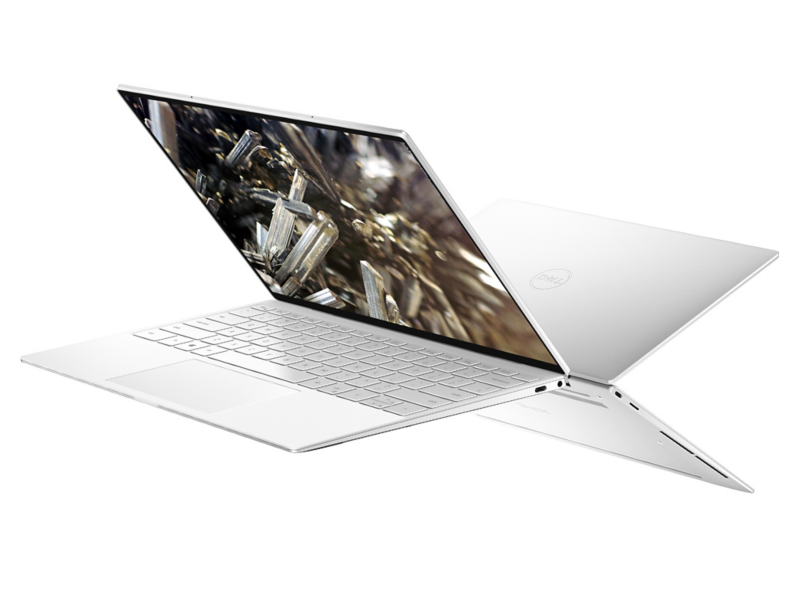
Dell heeft het huidige 16:10 XPS 13-ontwerp eerder dit jaar geïntroduceerd met de XPS 13 9300 en dus is de XPS 13 9310 nog relatief nieuw, ook al zijn er geen grote visuele updates. Misschien wel het meest in het oog springend is dat de witte glasweefselkleurige optie van de oudere 16:9 XPS 13-serie is teruggekeerd, terwijl de XPS 9300 alleen in het zwart verkrijgbaar was. De belangrijkste aantrekkingskracht van de witte optie is vooral esthetisch, want lelijke vingerafdrukopbouw zal niet zo vanzelfsprekend zijn.

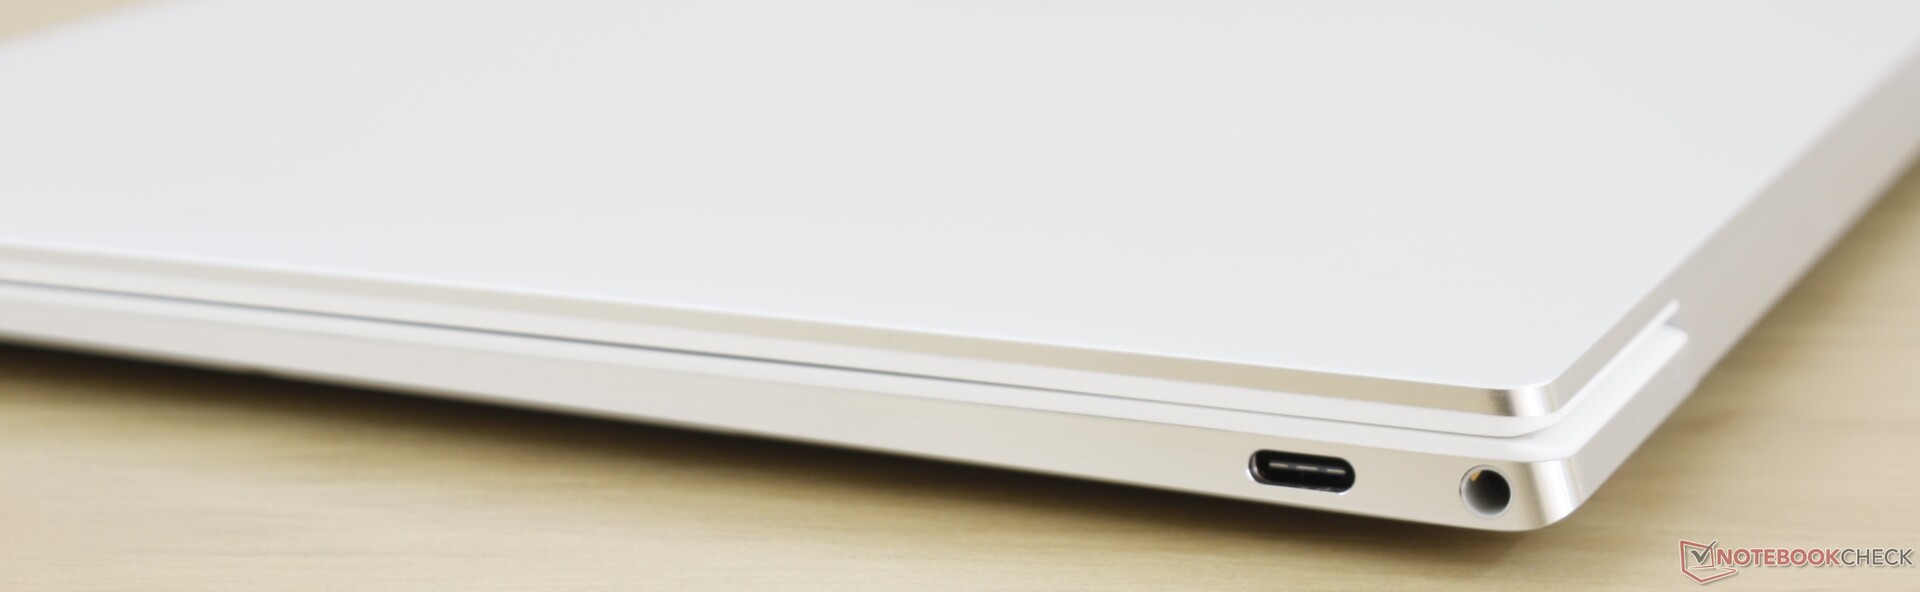
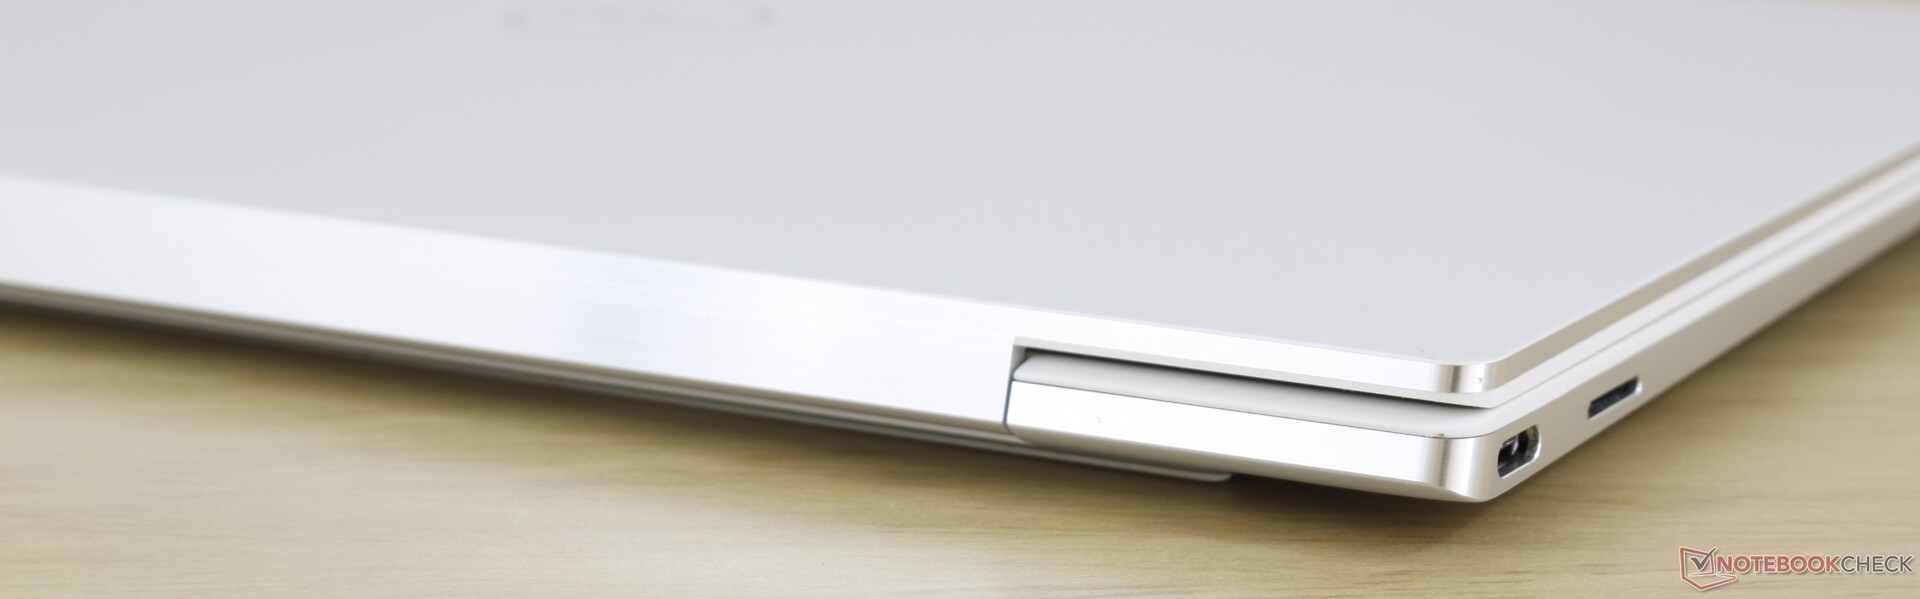
Connectiviteit

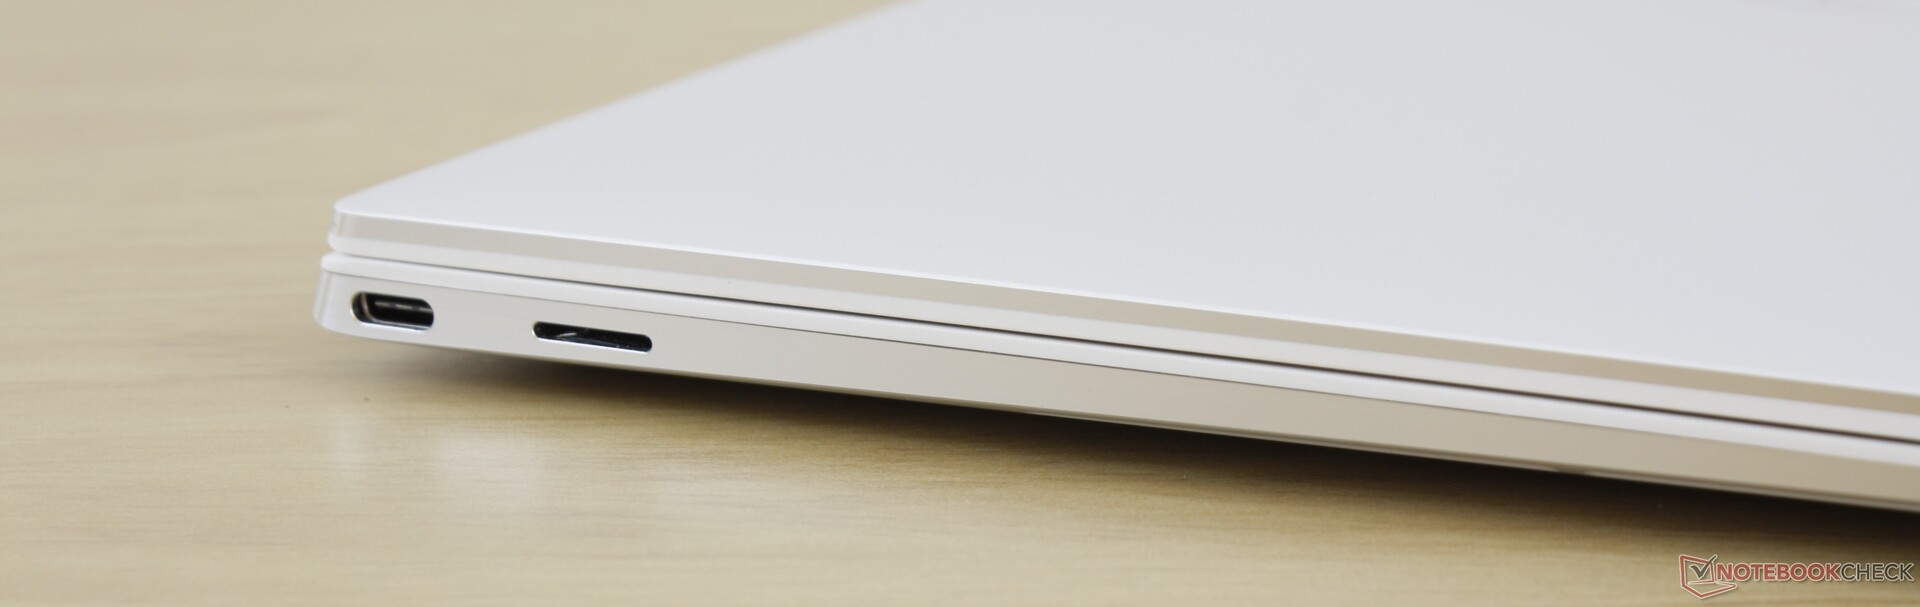
SD-kaartlezer
| SD Card Reader | |
| average JPG Copy Test (av. of 3 runs) | |
| Dell XPS 13 9310 Core i7 FHD (Toshiba Exceria Pro M501 64 GB UHS-II) | |
| HP Spectre x360 13-aw0013dx (Toshiba Exceria Pro M501 microSDXC 64GB) | |
| Dell XPS 13 9300 Core i7-1065G7 (Toshiba Exceria Pro M501 64 GB UHS-II) | |
| Lenovo Yoga Slim 7-14ARE (Toshiba Exceria Pro M501 64 GB UHS-II) | |
| maximum AS SSD Seq Read Test (1GB) | |
| Dell XPS 13 9310 Core i7 FHD (Toshiba Exceria Pro M501 64 GB UHS-II) | |
| Dell XPS 13 9300 Core i7-1065G7 (Toshiba Exceria Pro M501 64 GB UHS-II) | |
| HP Spectre x360 13-aw0013dx (Toshiba Exceria Pro M501 microSDXC 64GB) | |
| Lenovo Yoga Slim 7-14ARE (Toshiba Exceria Pro M501 64 GB UHS-II) | |
Communicatie
De Intel Killer AX1650s is weer standaard voor Wi-Fi 6 en Bluetooth 5.1 connectiviteit. Hoewel we geen connectiviteitsproblemen hebben ondervonden bij het koppelen met onze Netgear RAX200-router, zijn de transmissiesnelheden voor een tweede jaar op rij lang niet zo snel als de ontvangstsnelheden.
Webcam


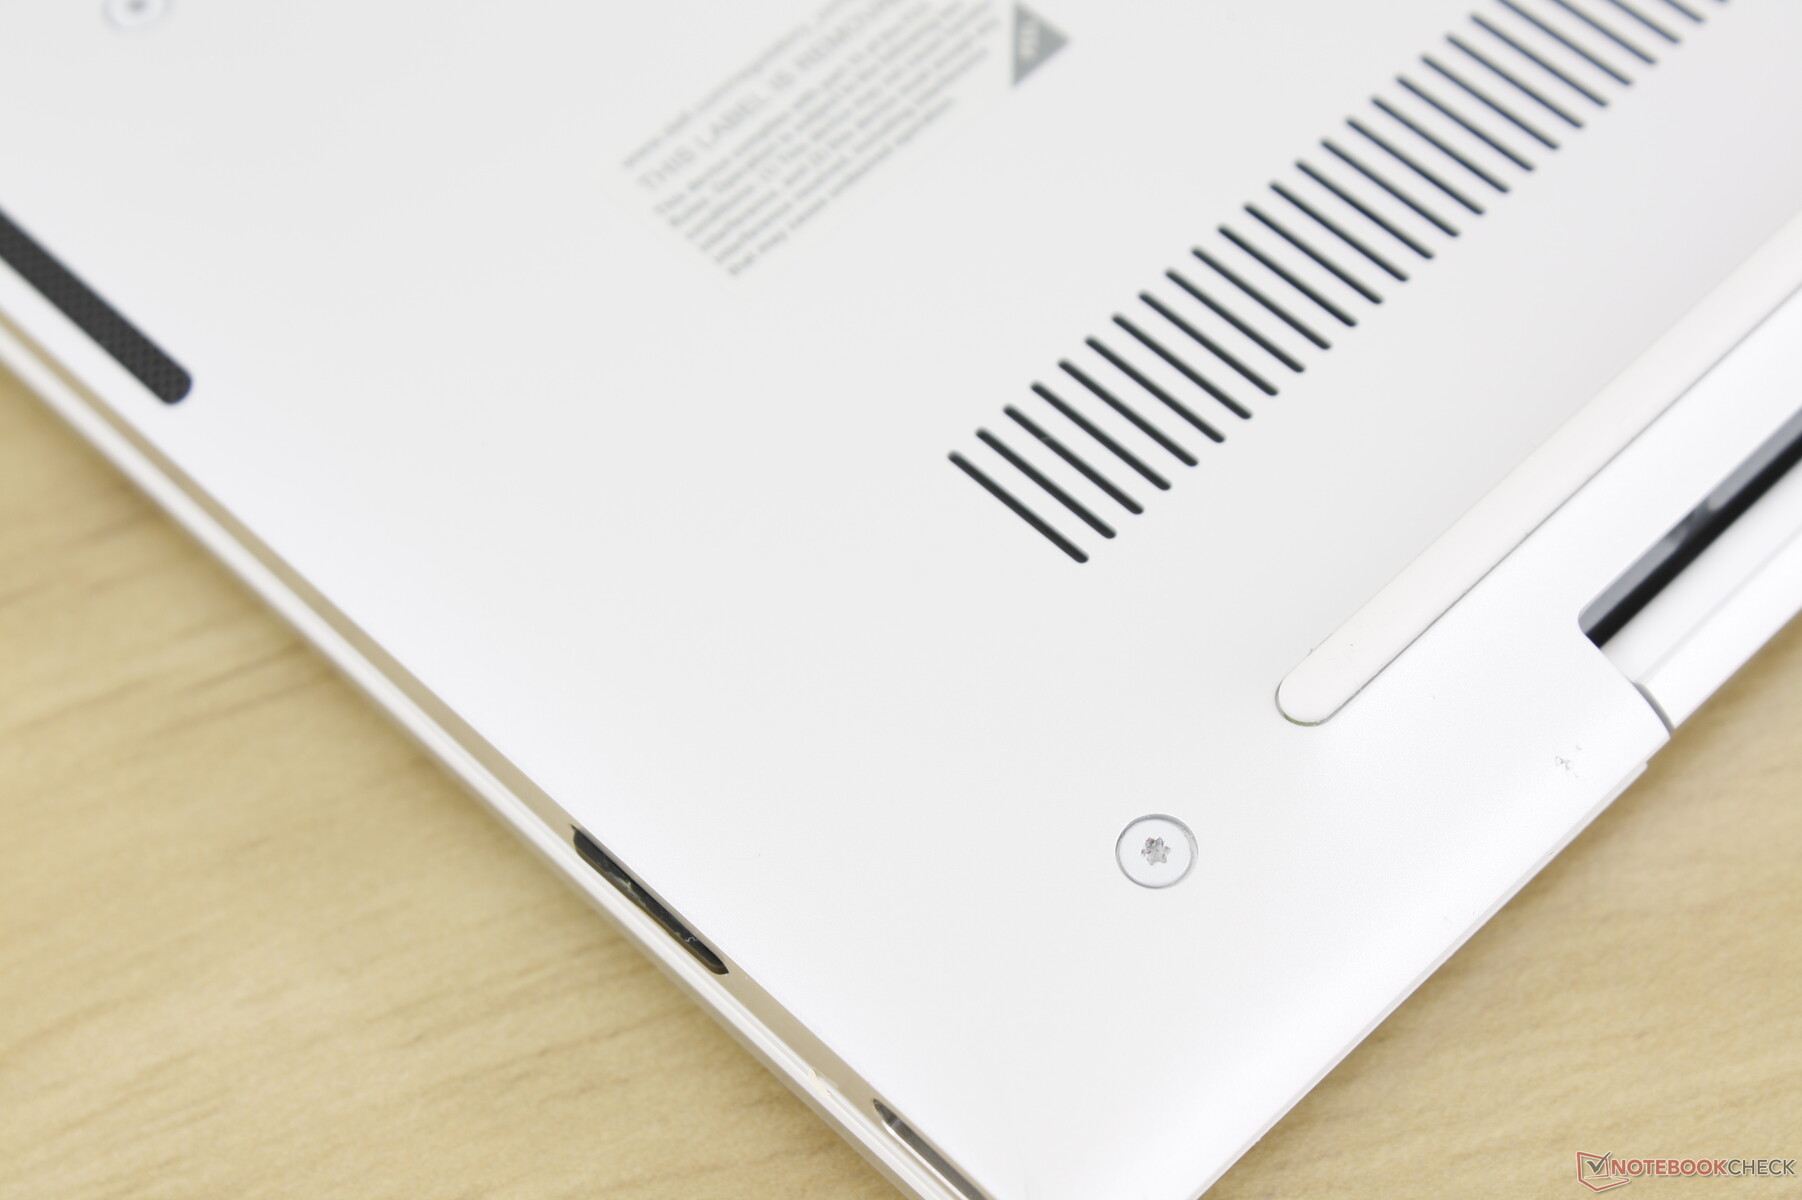
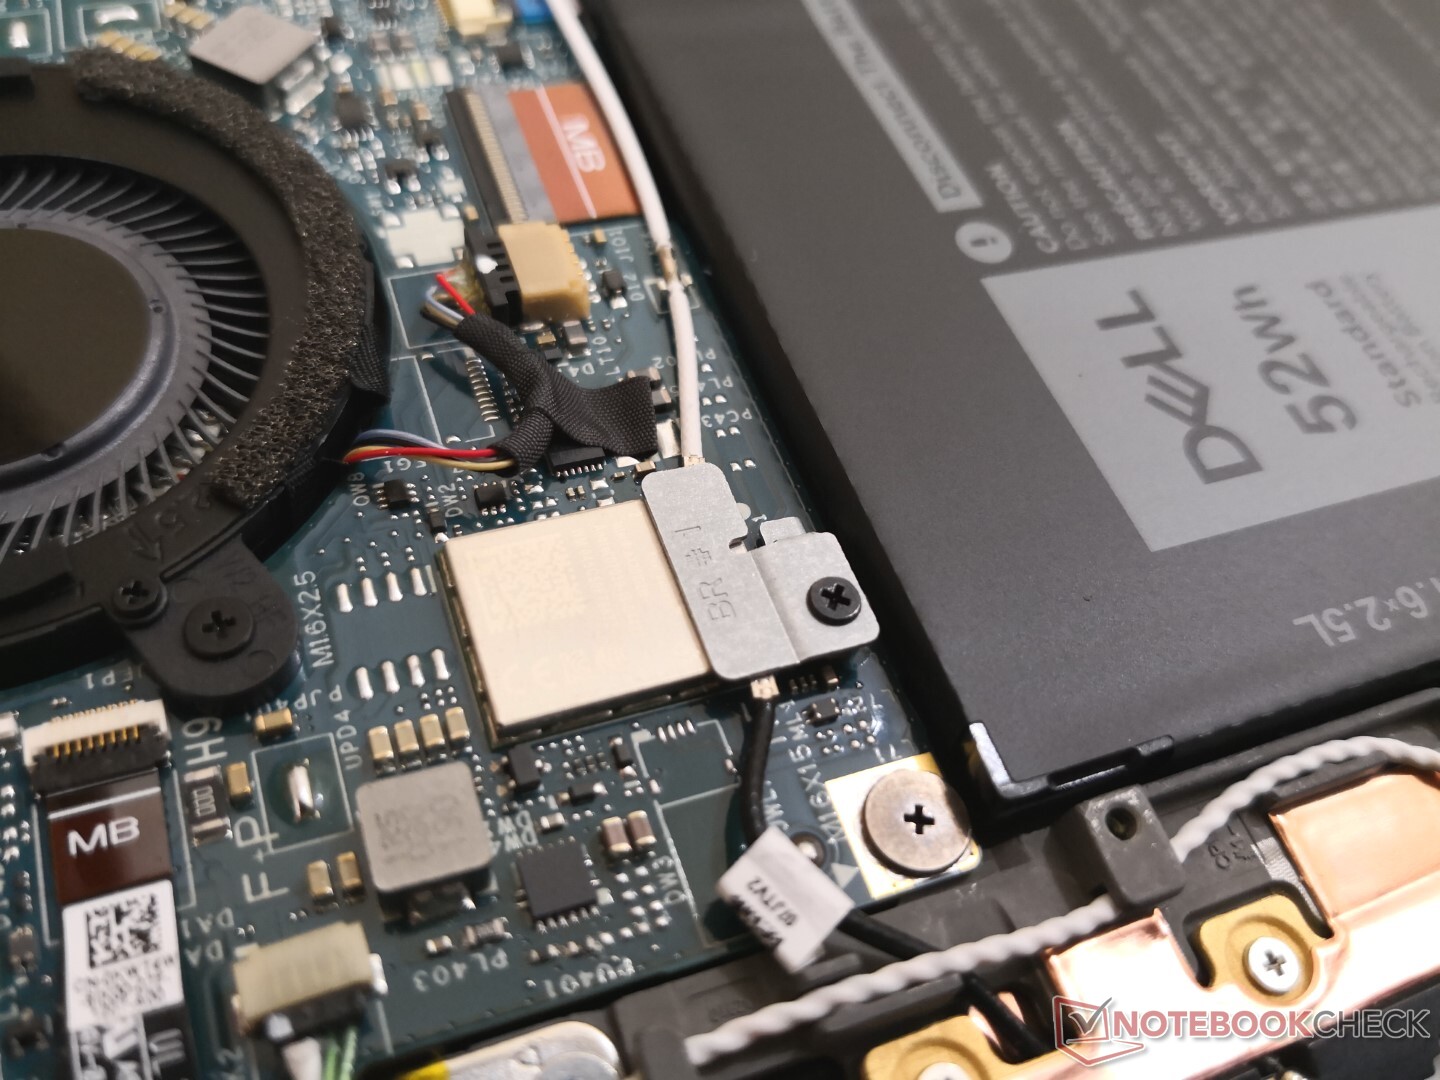
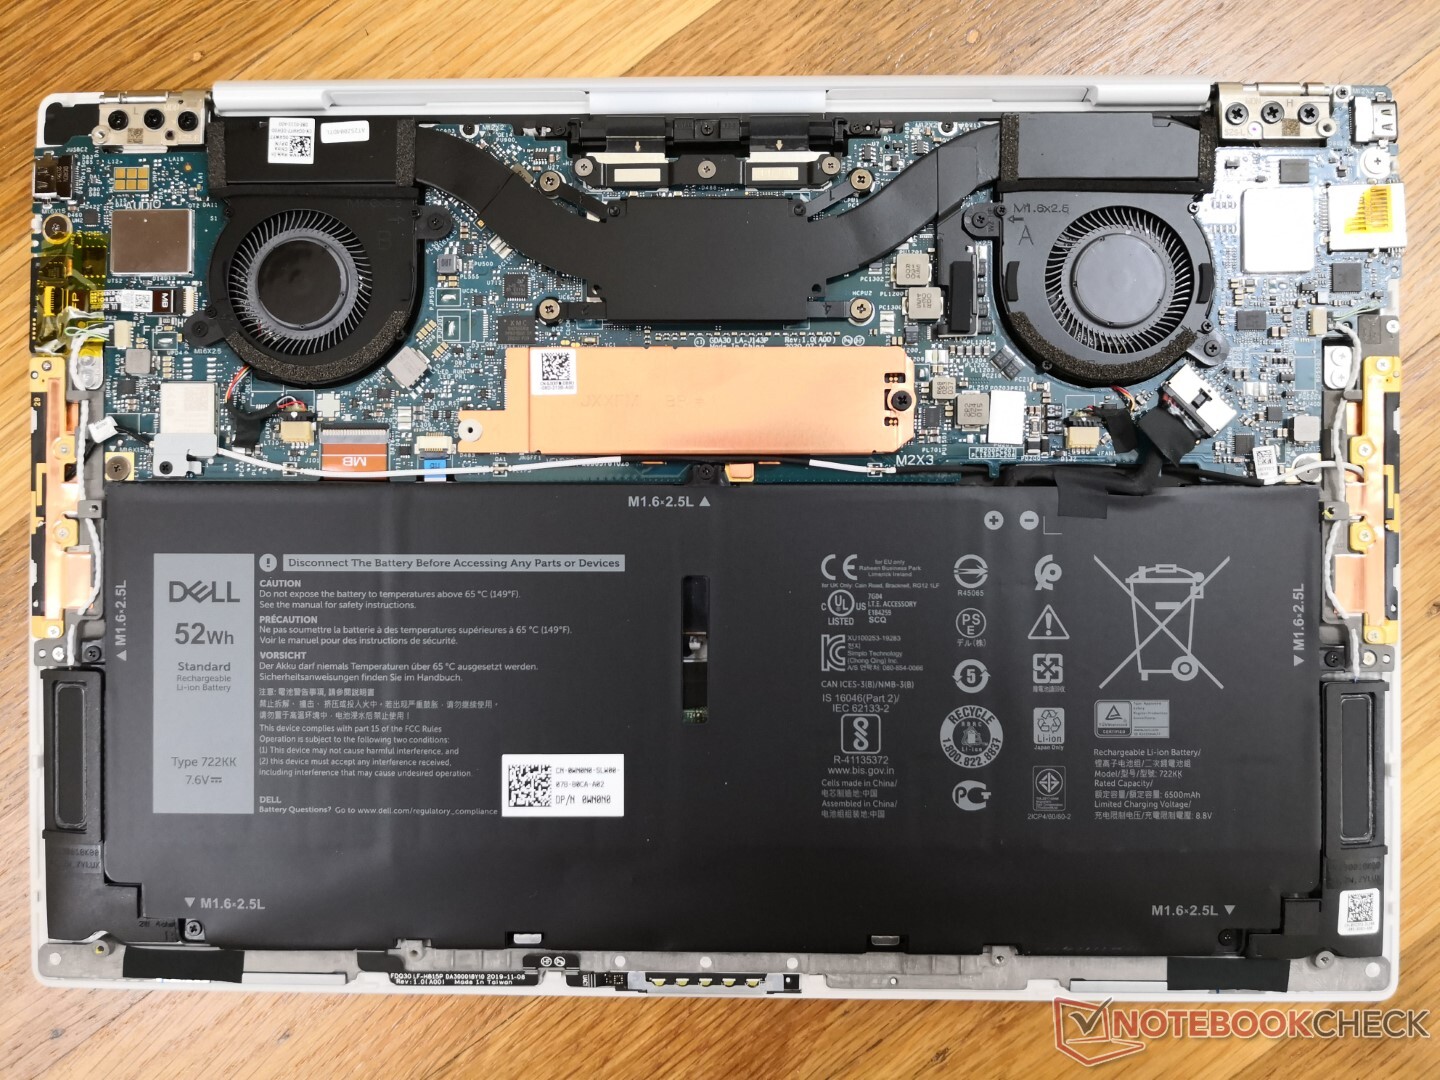
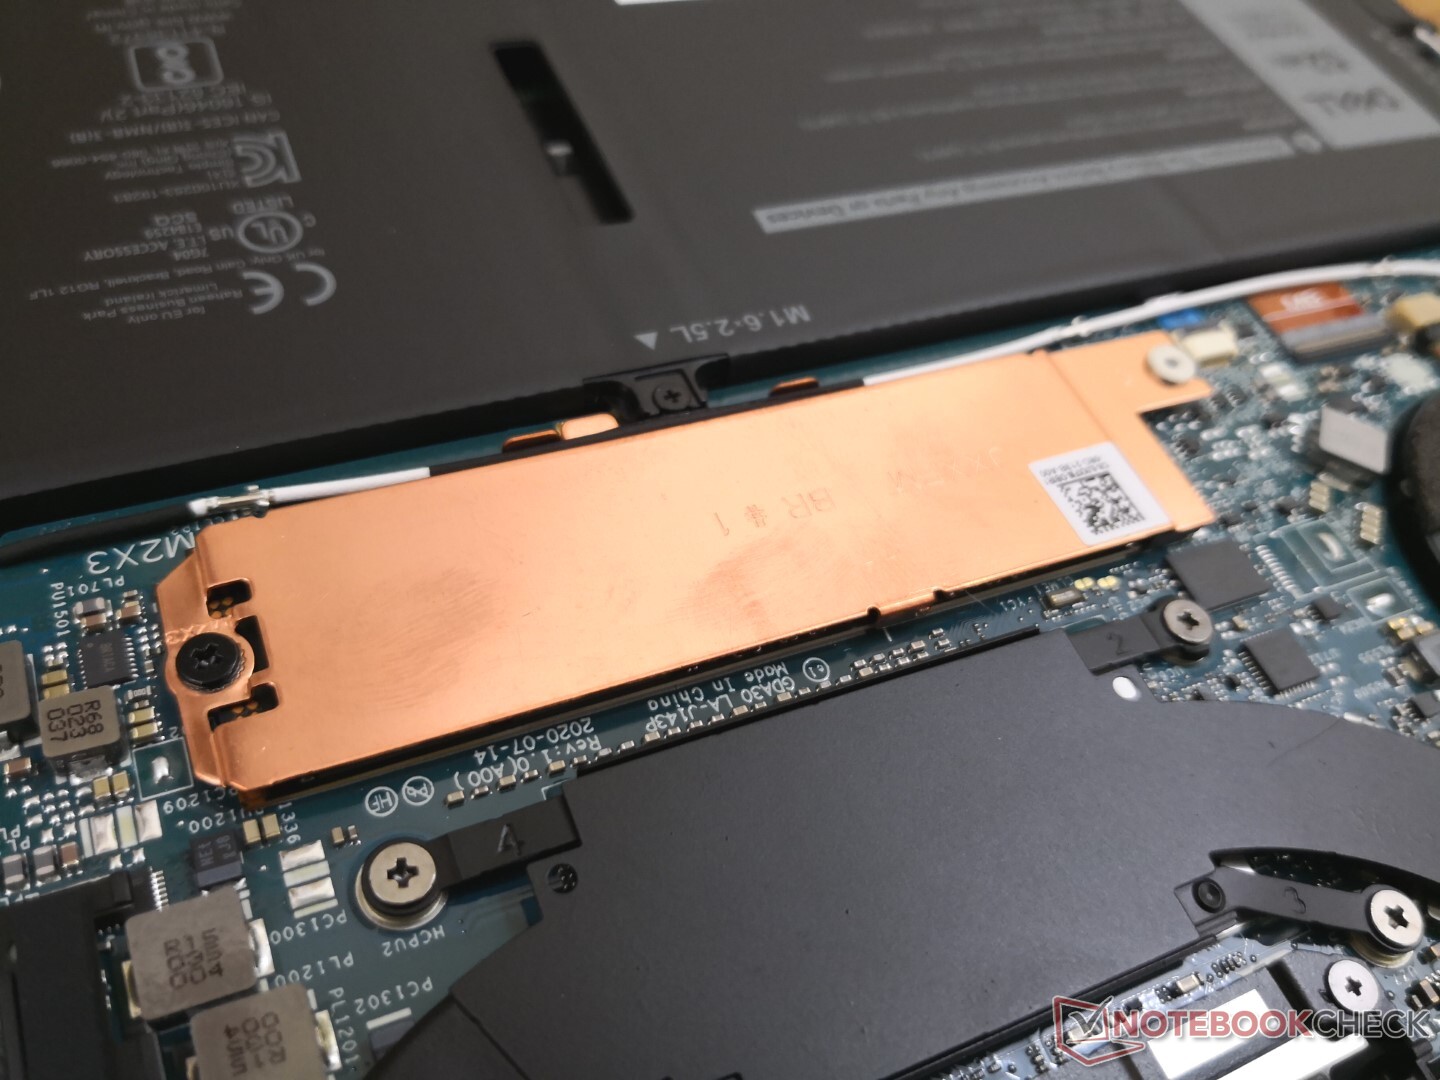
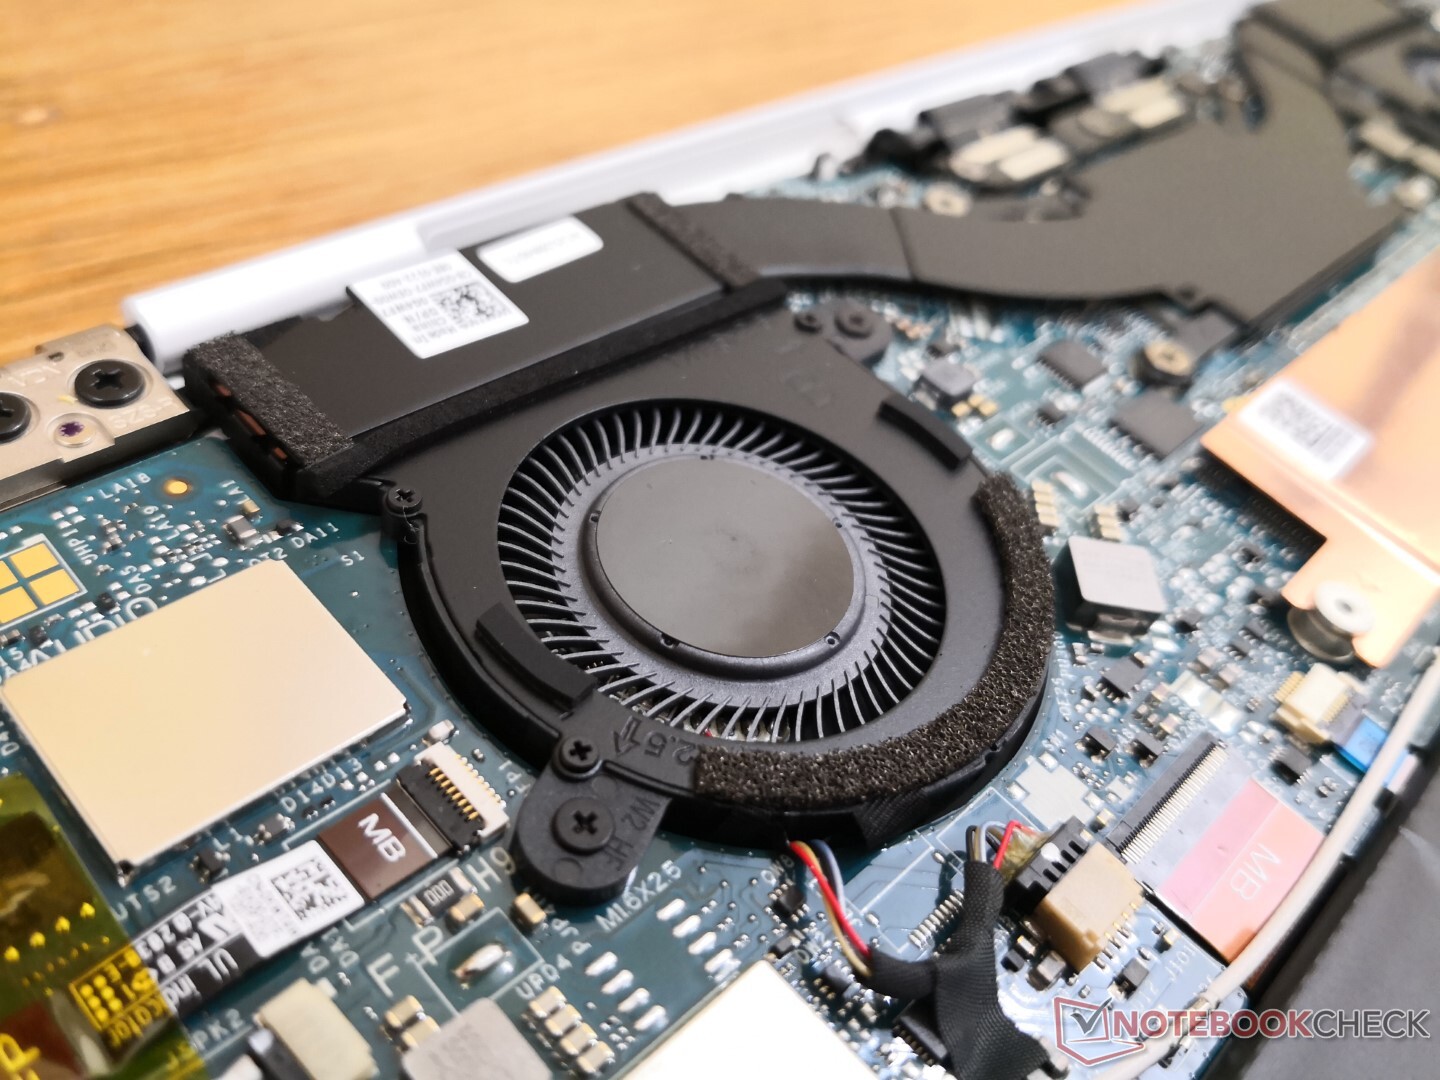
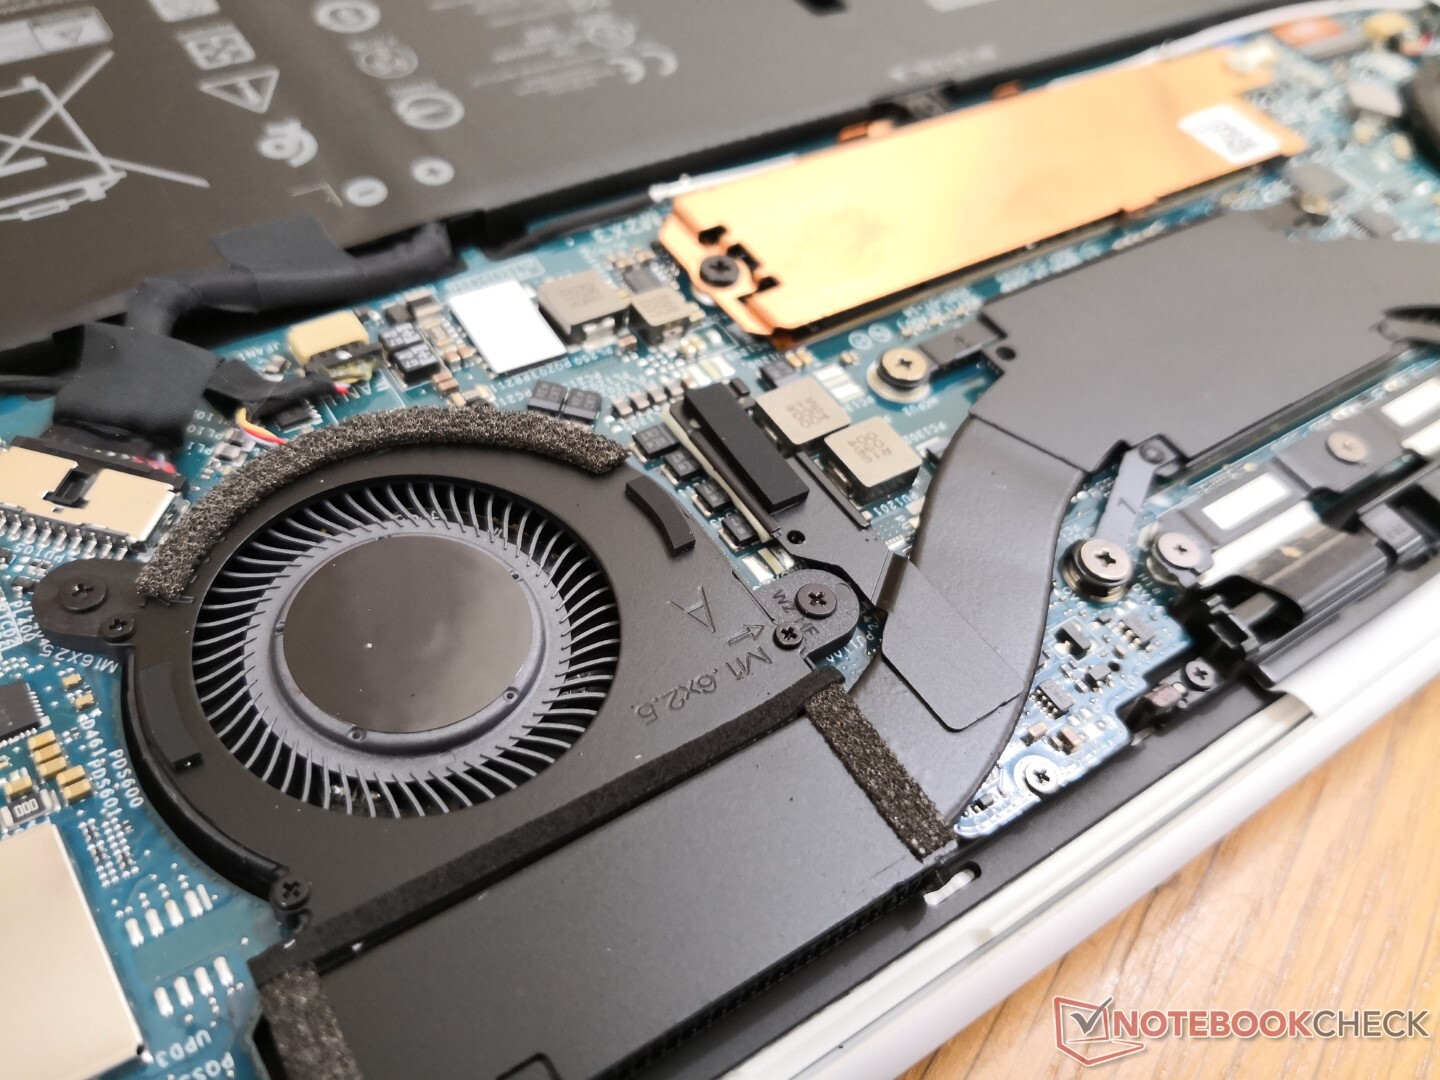
Onderhoud
Geen grote veranderingen in het inwendige van het systeem
Accessoires
De doos bevat een USB-C naar USB-A adapter en een handige voedingskabeladapter, zodat u niet overal een twee- of drievoudige voedingskabel mee naartoe hoeft te nemen.
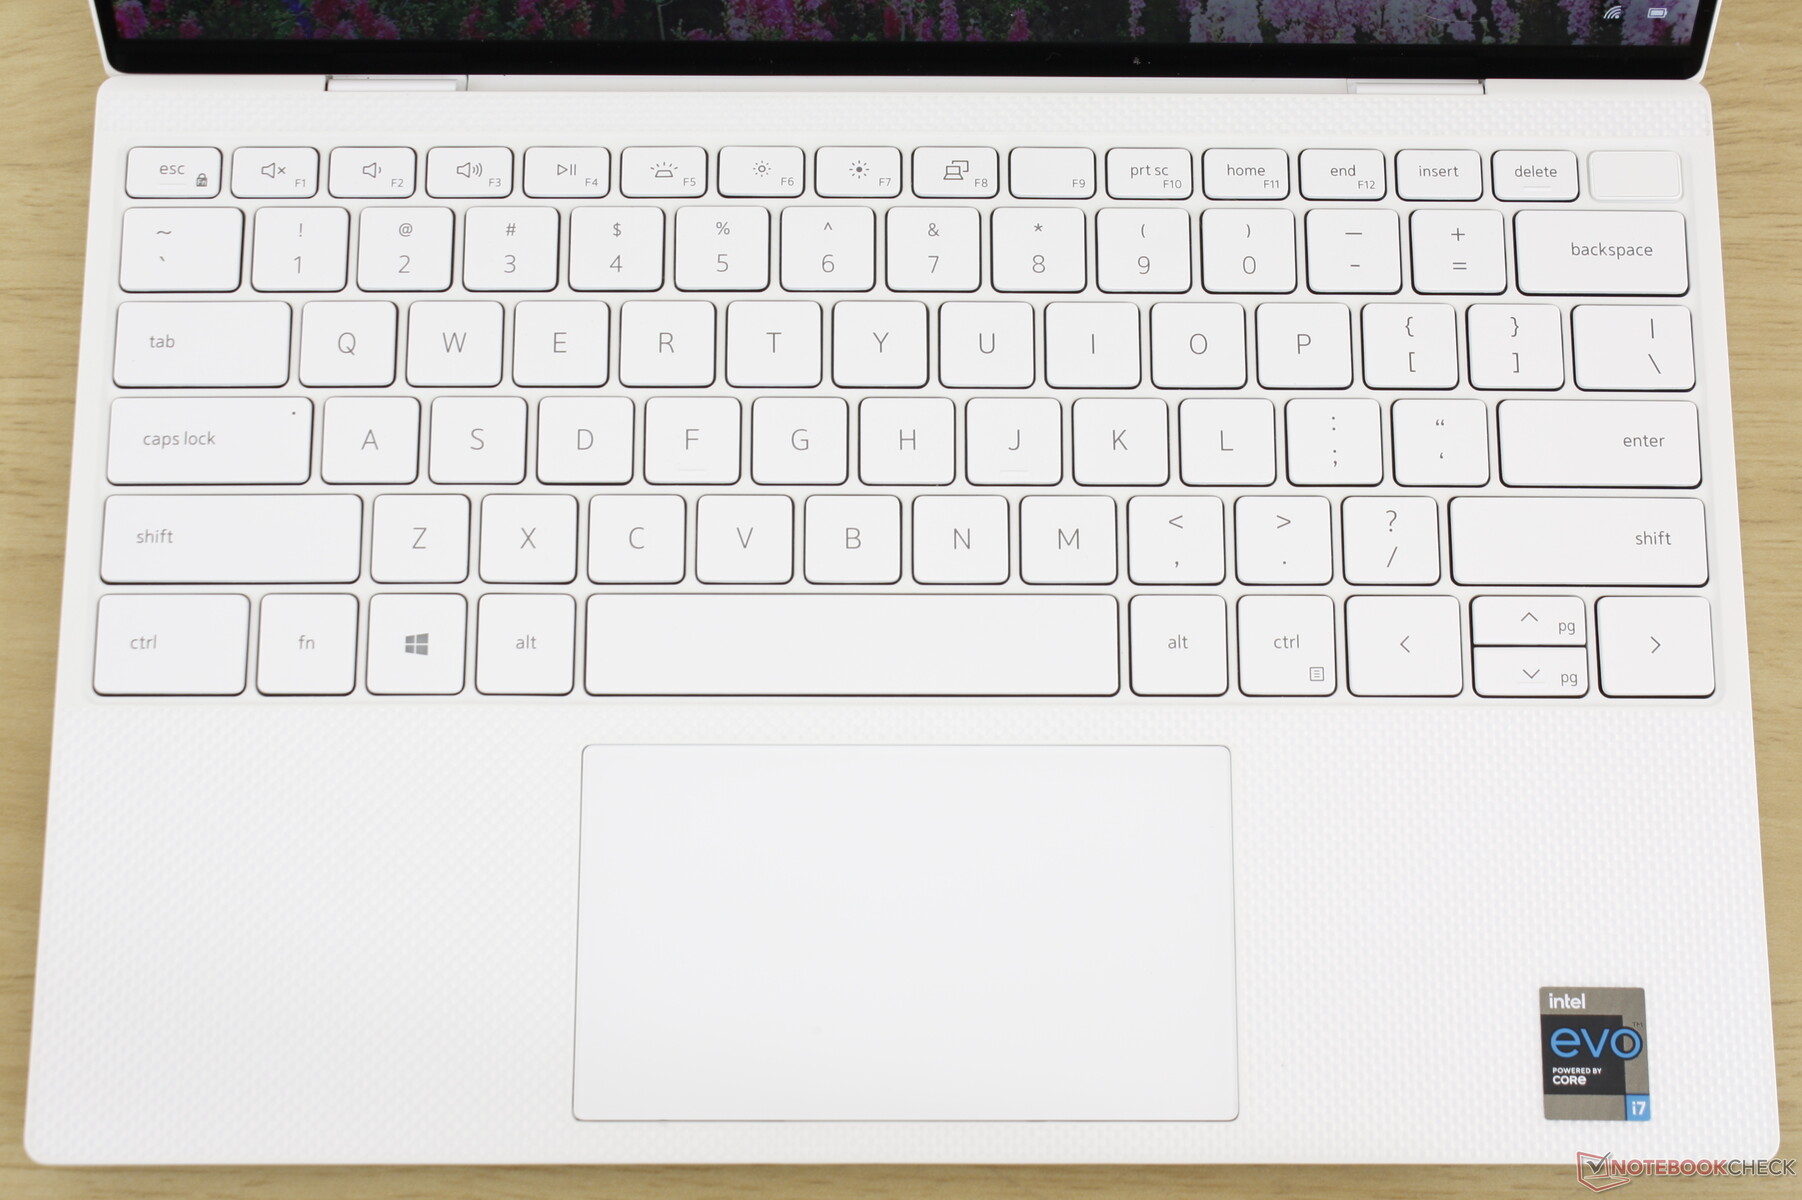
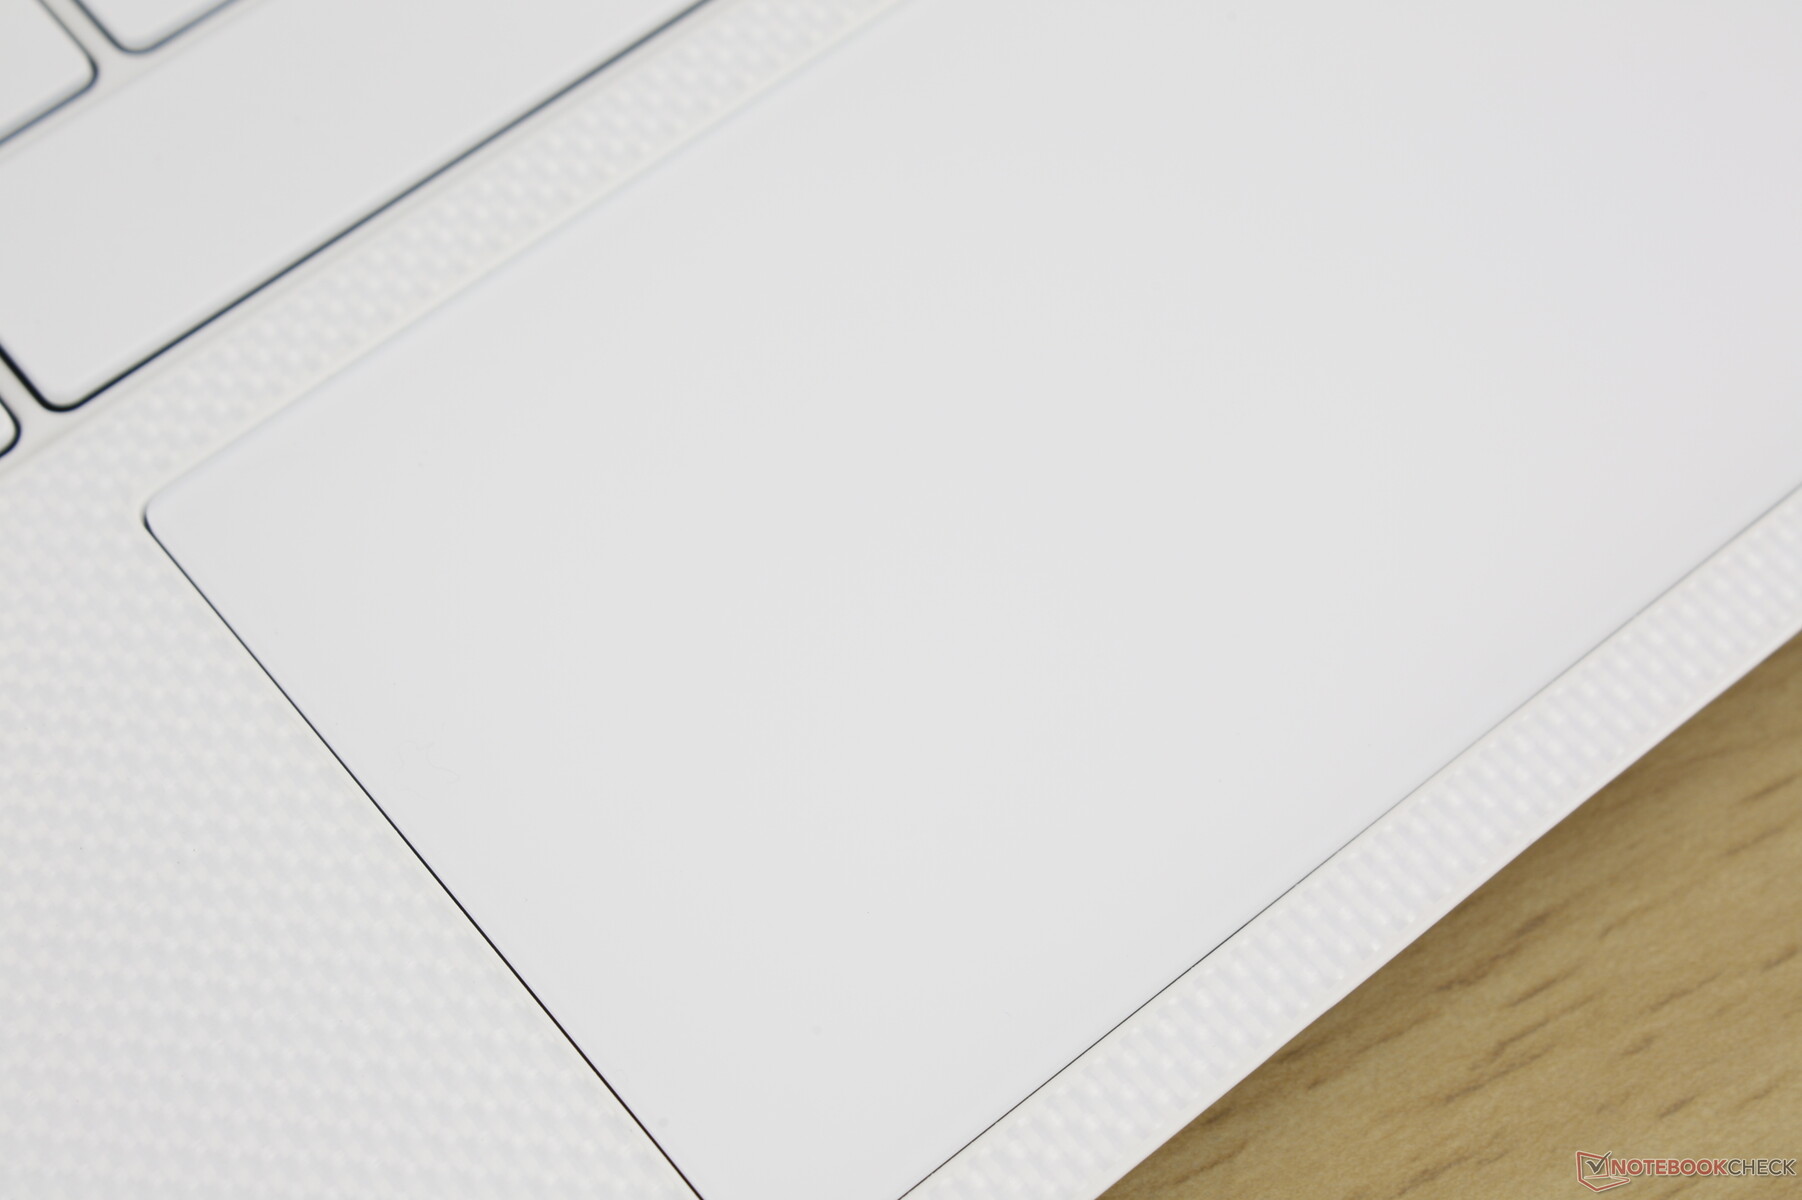
Invoerapparaten


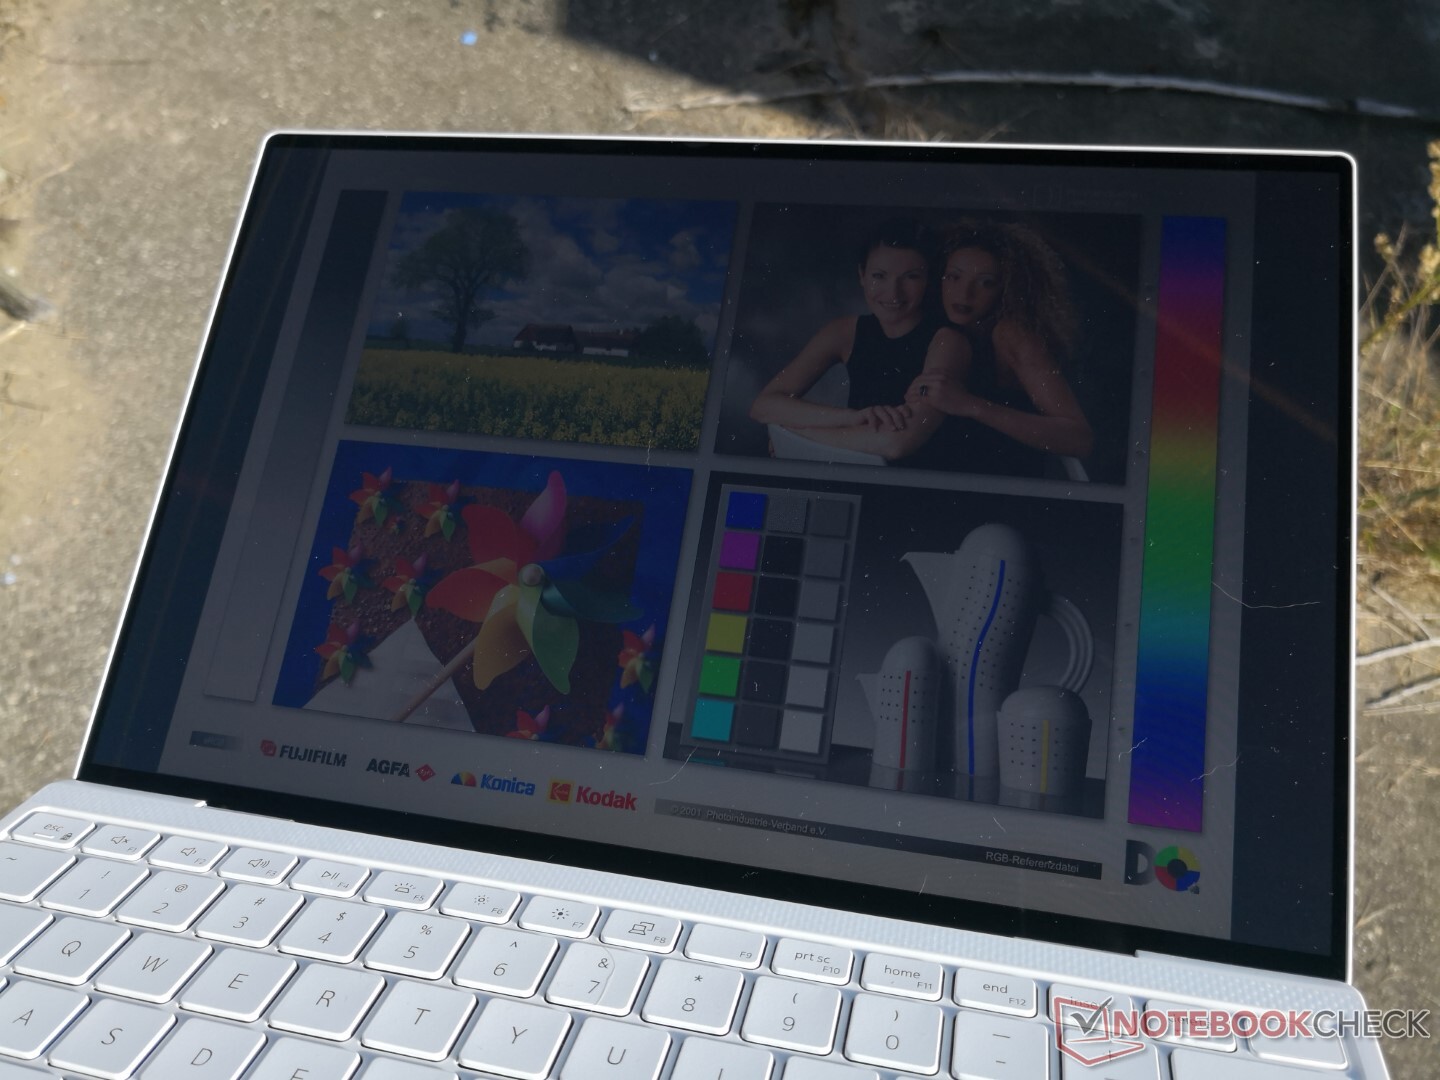
Toon
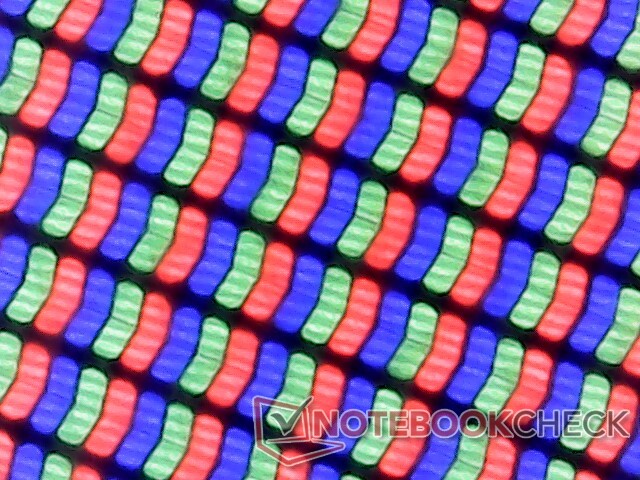
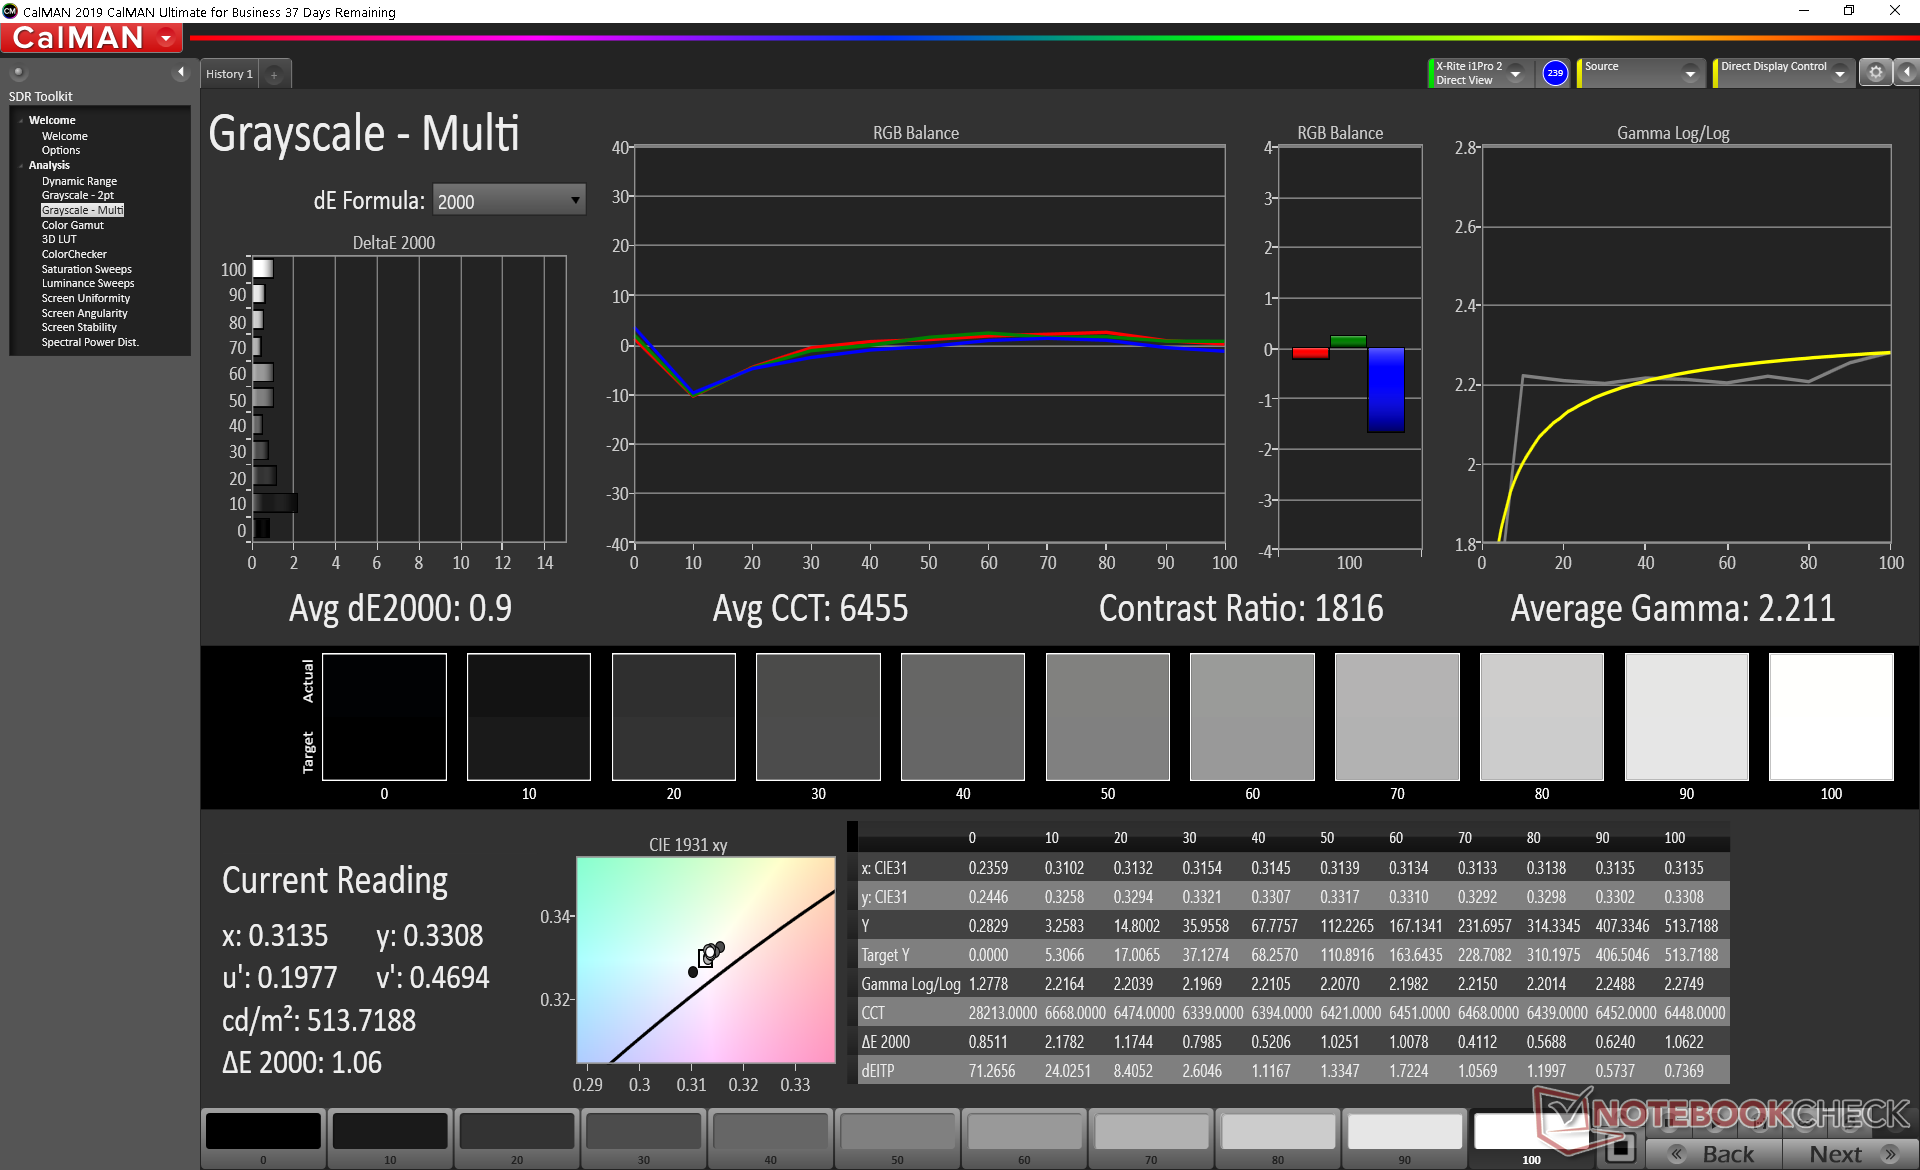
De 9310 gebruikt hetzelfde Sharp LQ134N1 IPS-paneel als op de XPS 13 9300, maar met iets andere helderheidsniveaus en PWM-waarden. Displays op XPS laptops zijn altijd een van de beste geweest in hun respectievelijke categorieën en dit blijft zo op de 9310. Grote nadelen blijven de relatief langzame reactietijden en het ontbreken van zowel adaptieve synchronisatie als OLED-opties. De AMD-aangedreven Lenovo Yoga Slim 7, bijvoorbeeld, wordt geleverd met adaptieve synchronisatie om het scheuren van het scherm te verminderen.

| |||||||||||||||||||||||||
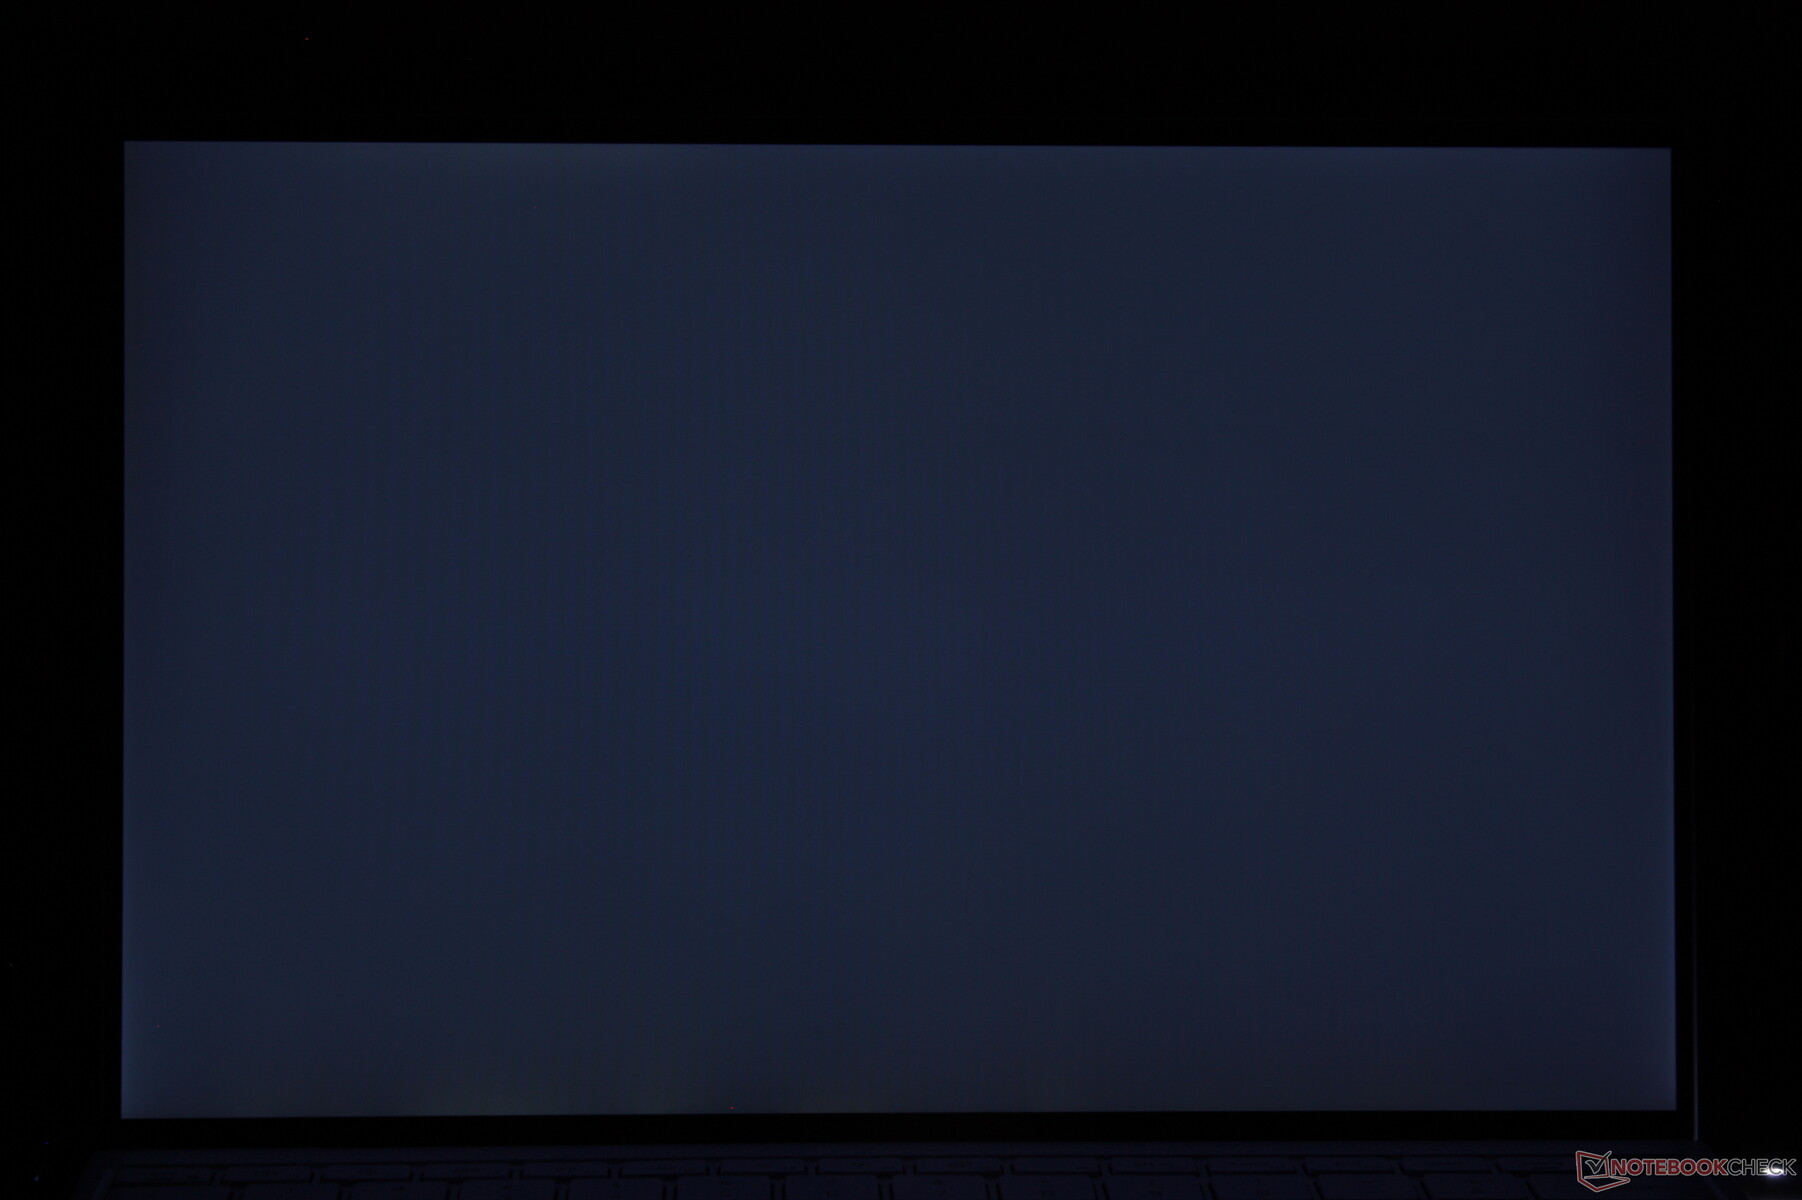
Helderheidsverdeling: 92 %
Helderheid in Batterij-modus: 543.3 cd/m²
Contrast: 1430:1 (Zwart: 0.38 cd/m²)
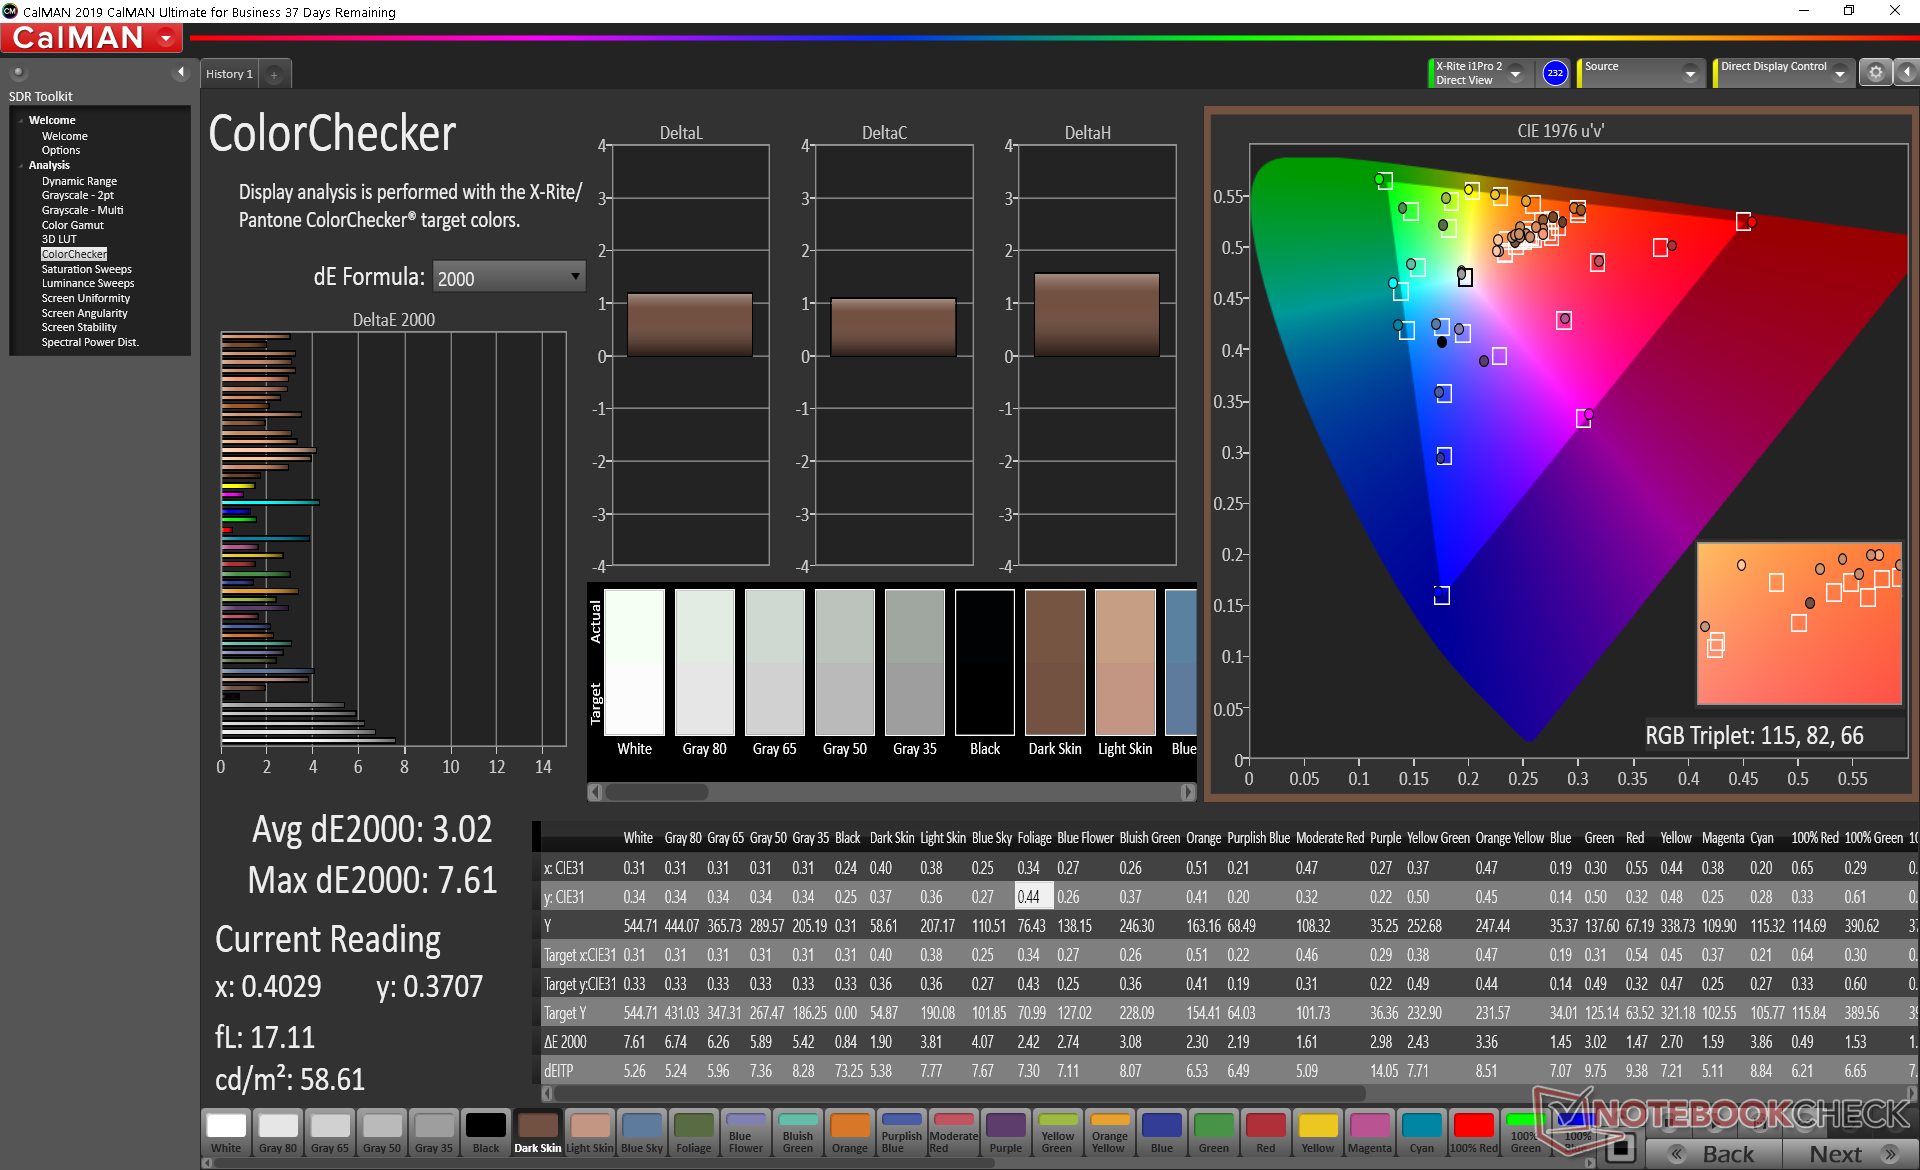
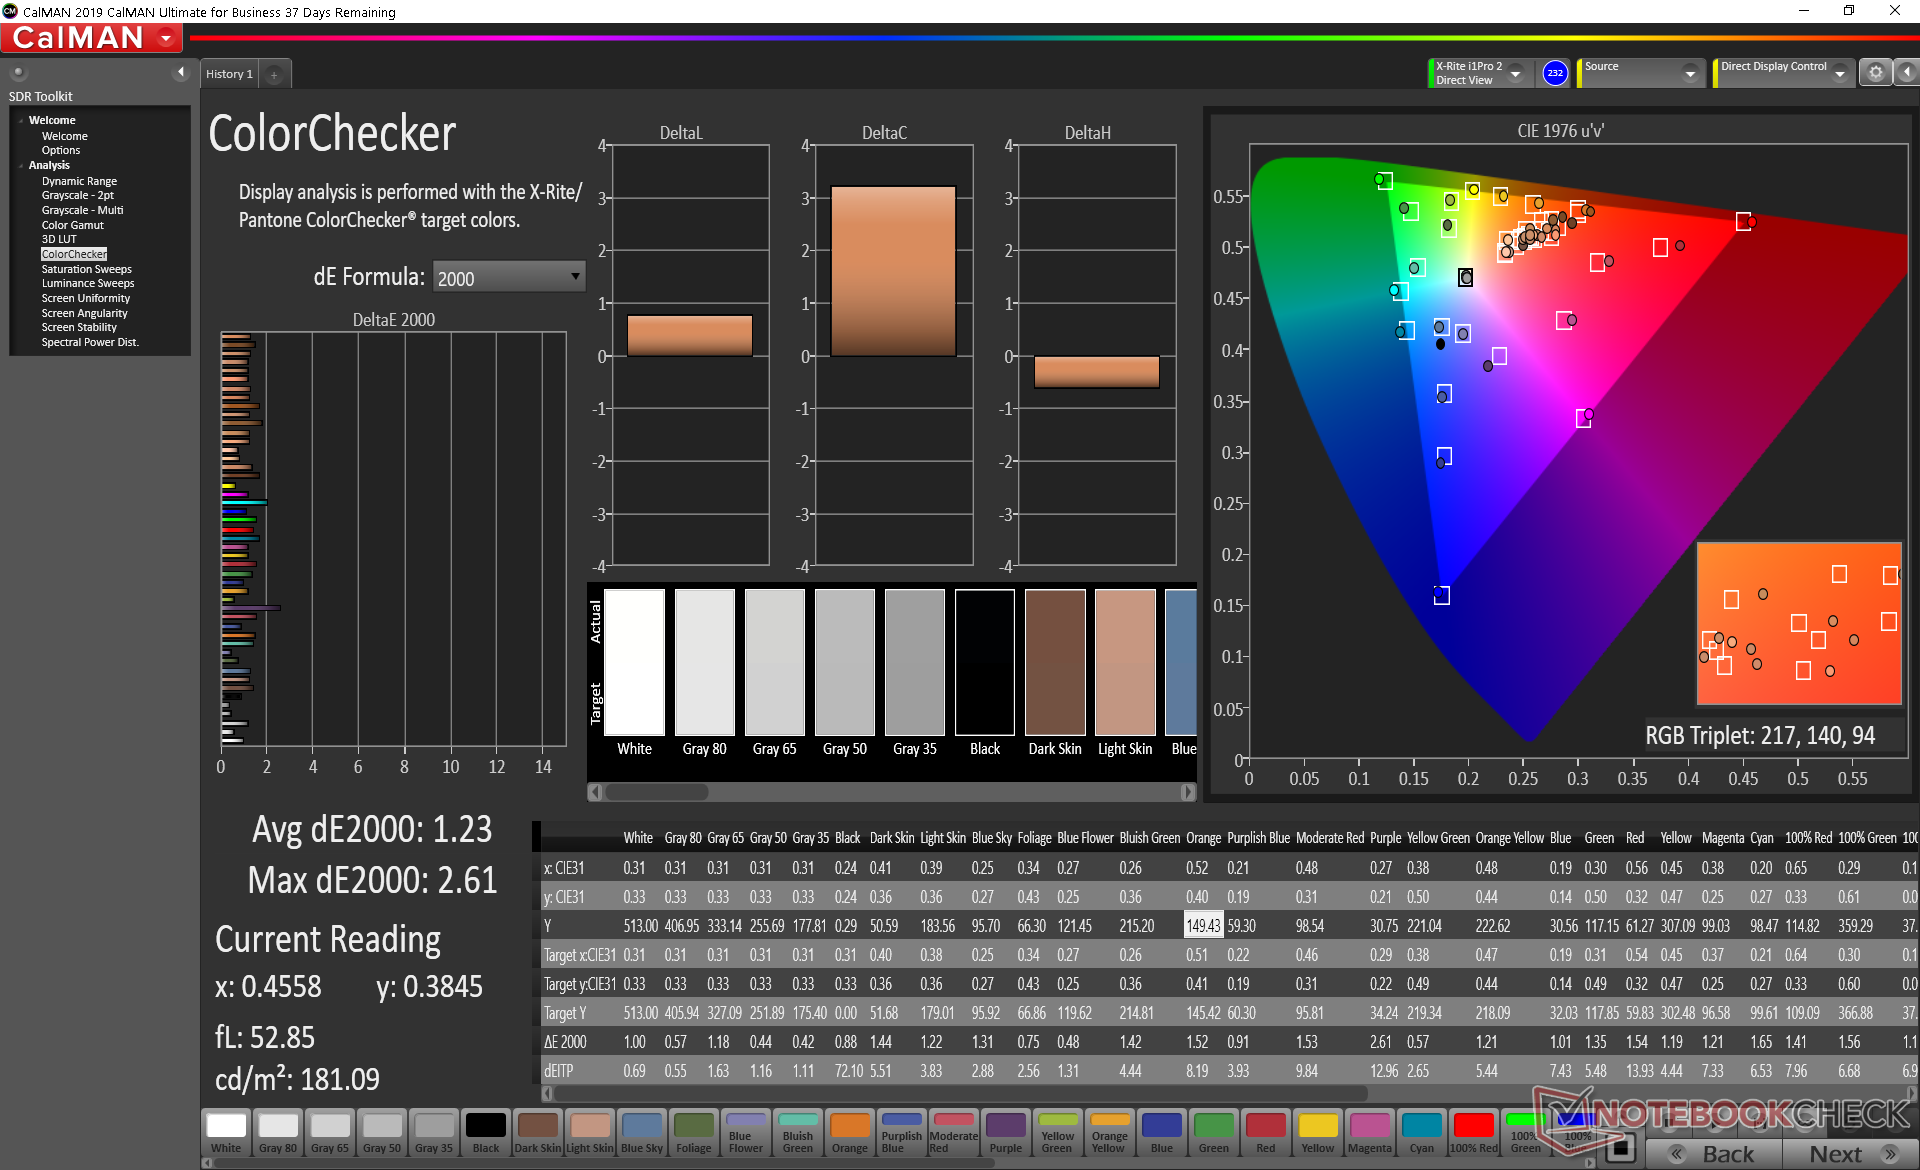
ΔE ColorChecker Calman: 3.02 | ∀{0.5-29.43 Ø4.72}
calibrated: 1.23
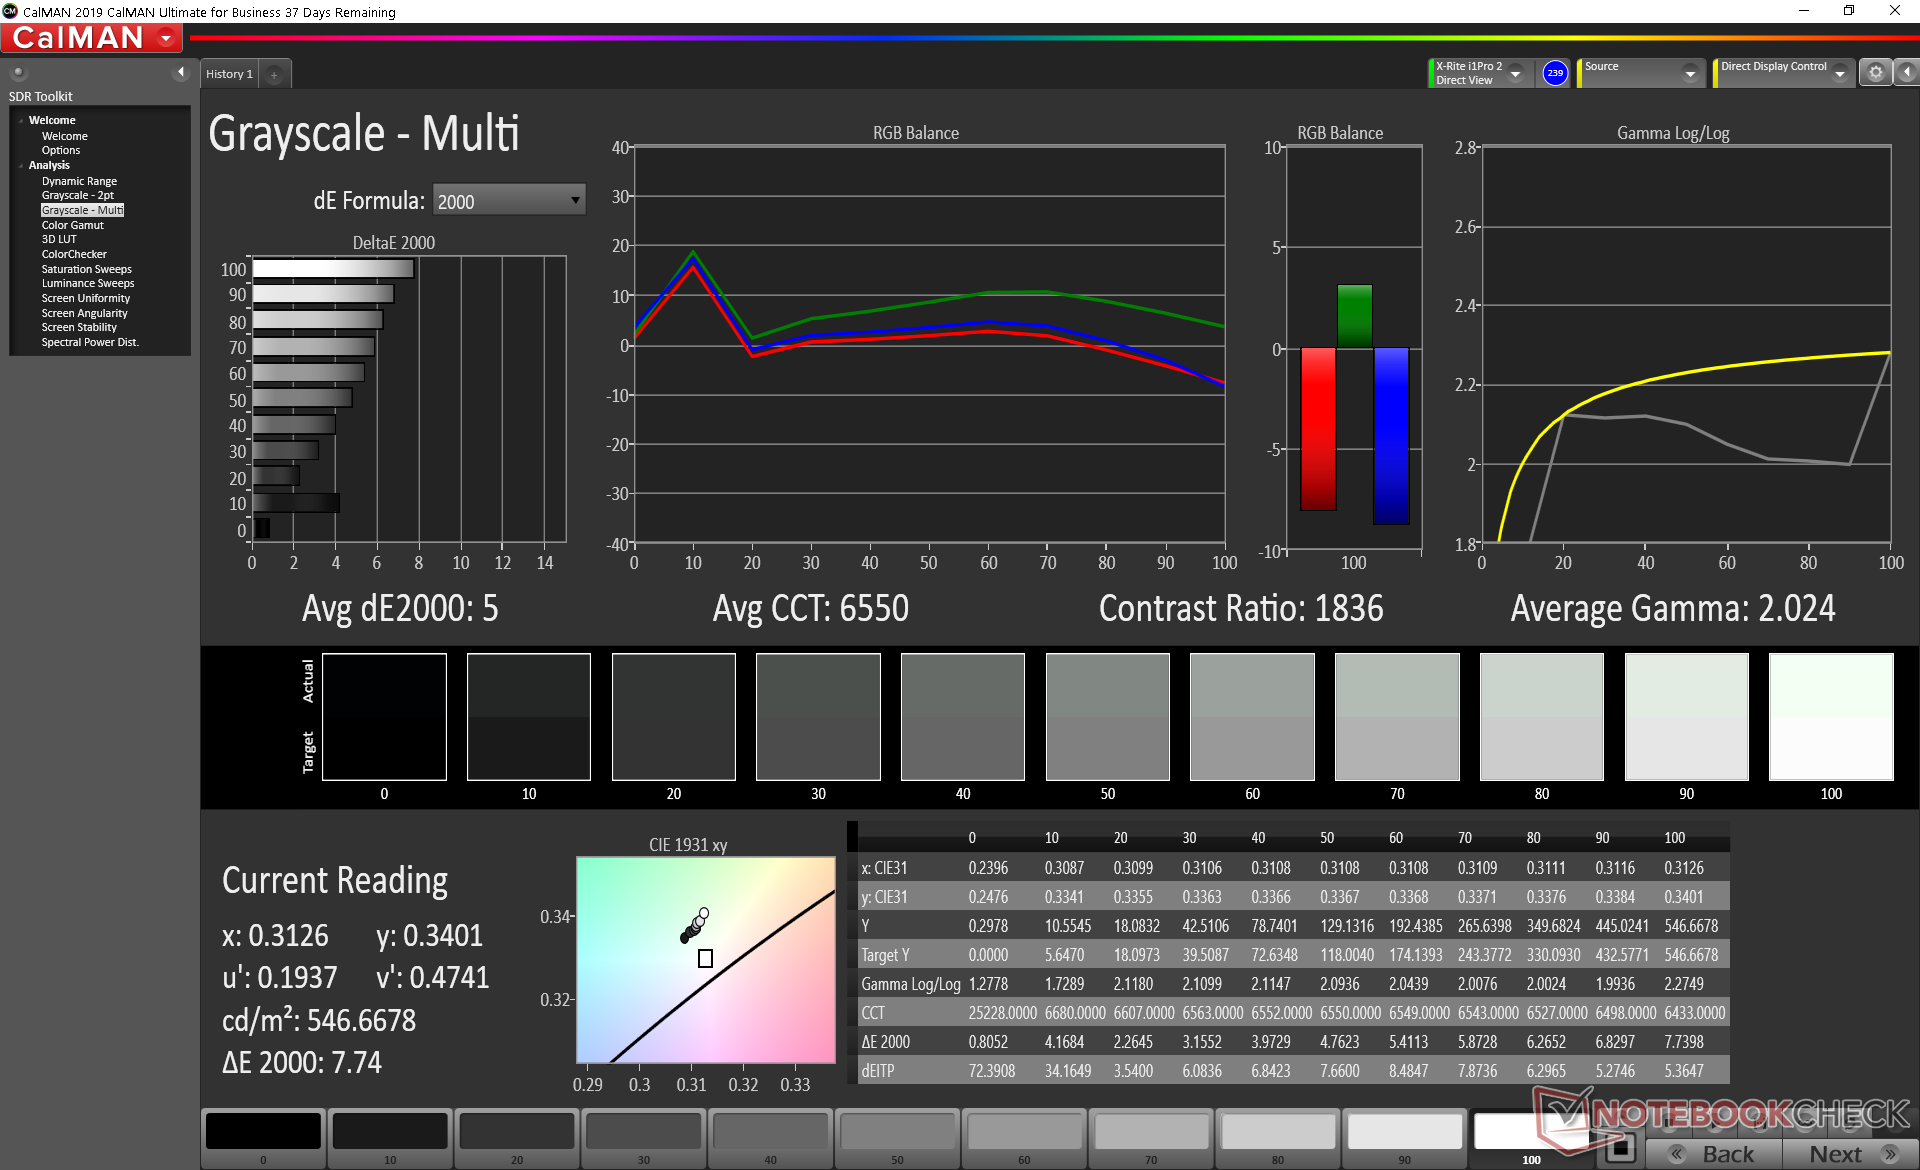
ΔE Greyscale Calman: 5 | ∀{0.09-98 Ø4.97}
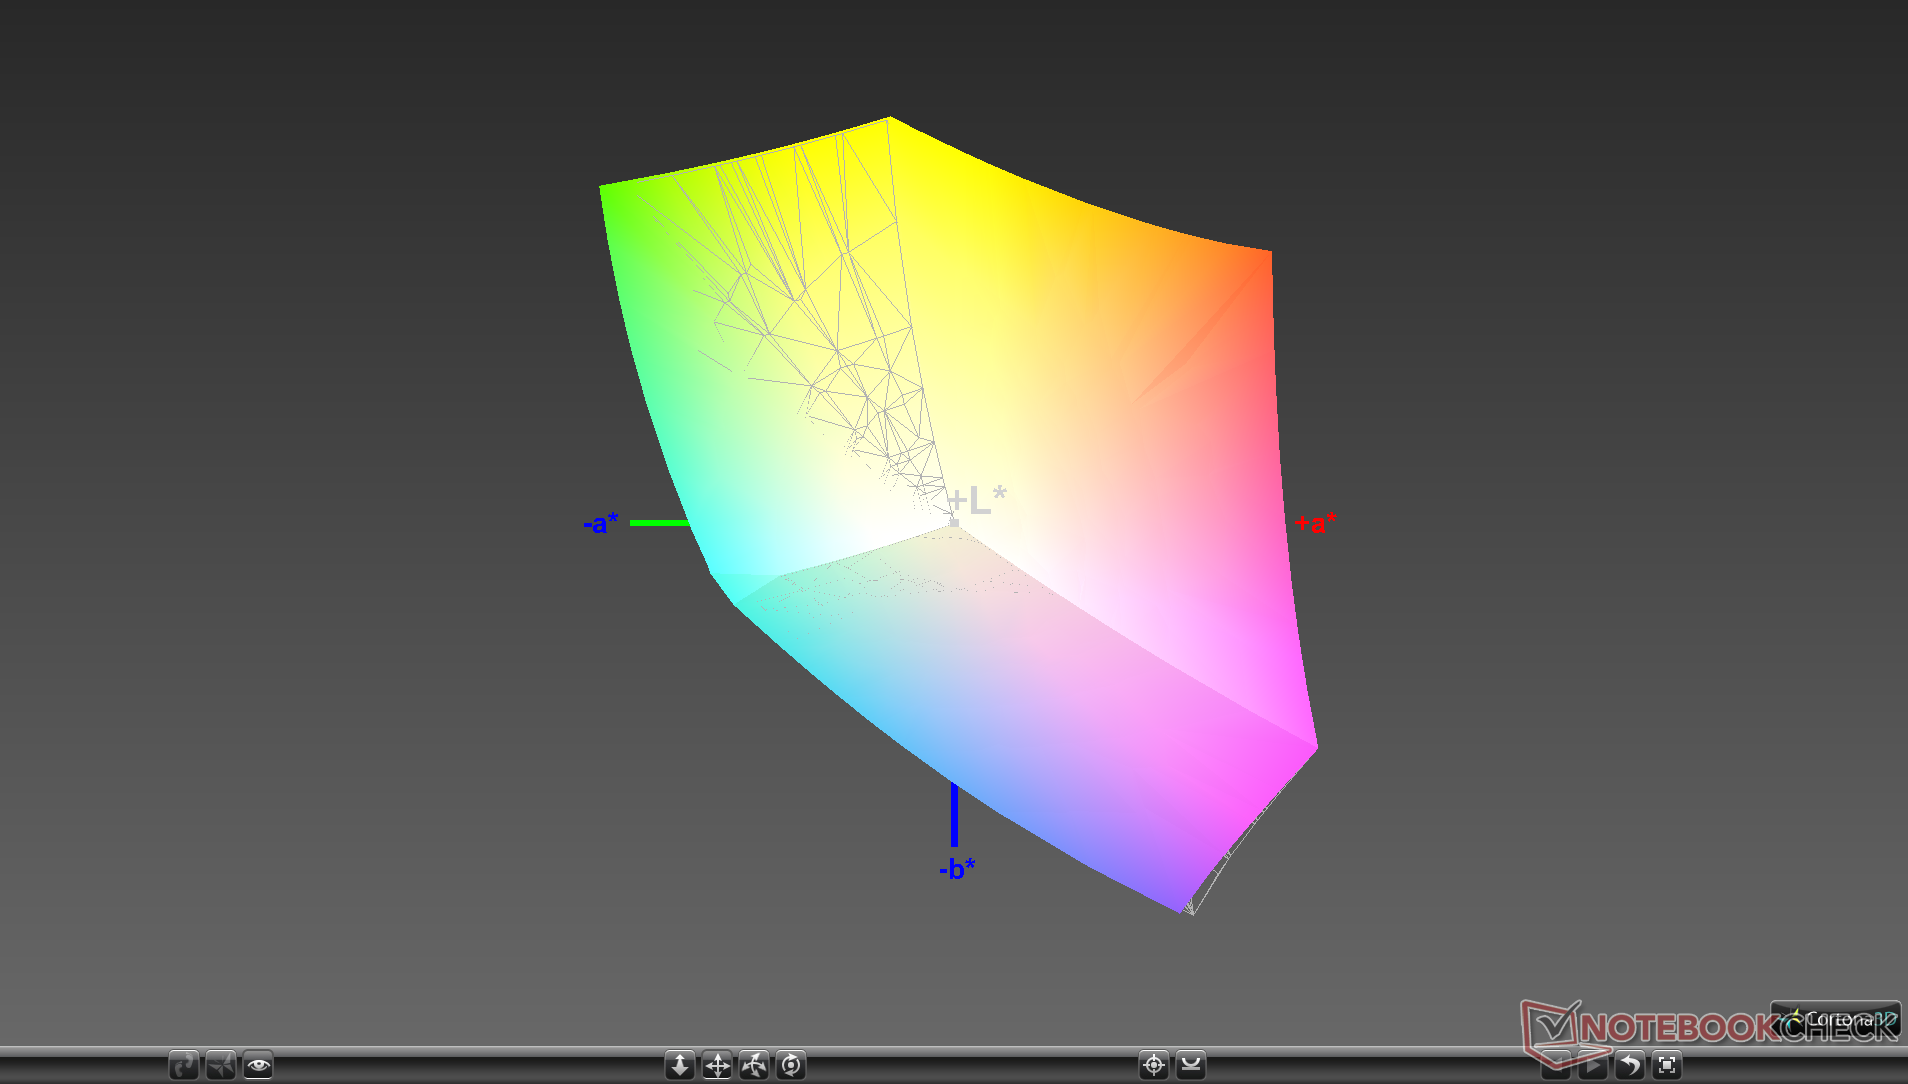
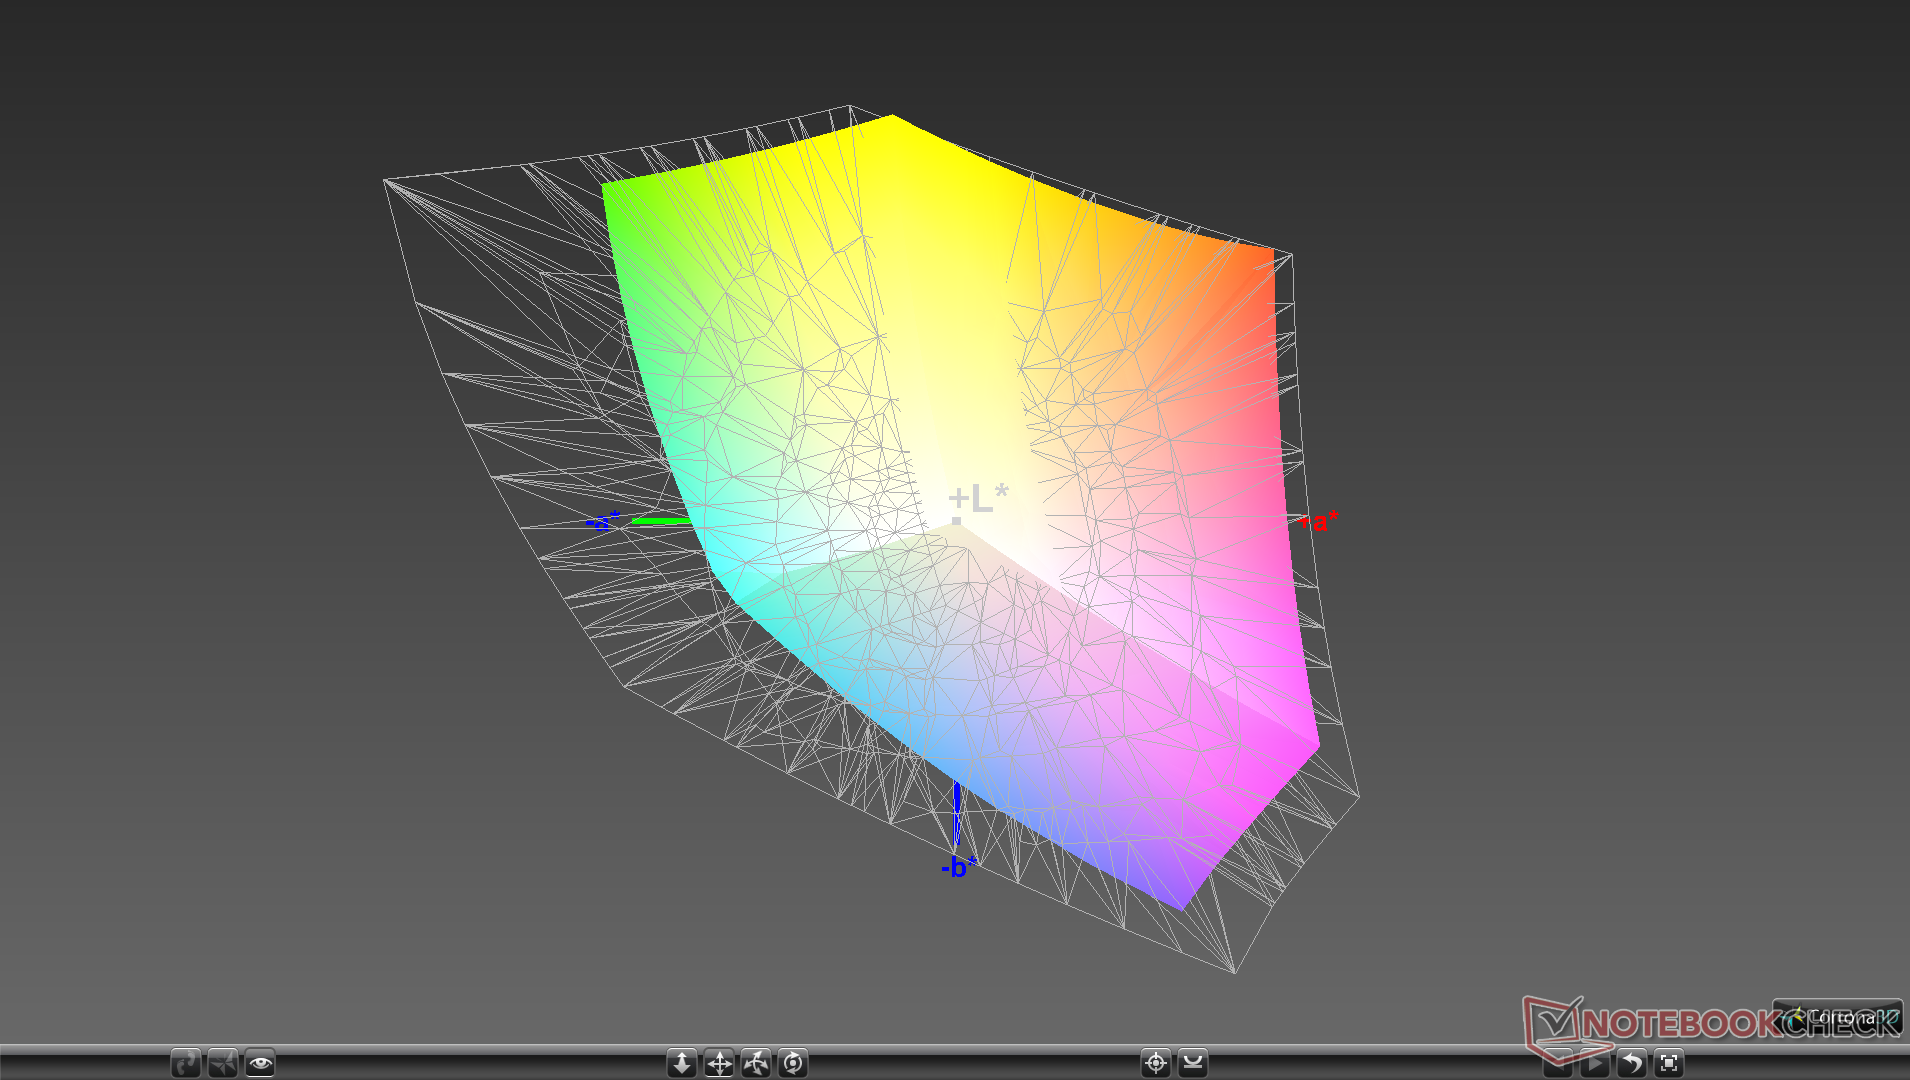
99.6% sRGB (Argyll 1.6.3 3D)
66.8% AdobeRGB 1998 (Argyll 1.6.3 3D)
72.9% AdobeRGB 1998 (Argyll 3D)
99.1% sRGB (Argyll 3D)
70.9% Display P3 (Argyll 3D)
Gamma: 2.02
CCT: 6550 K
| Dell XPS 13 9310 Core i7 FHD Sharp LQ134N1, IPS, 13.4", 1920x1200 | Dell XPS 13 9300 Core i7-1065G7 Sharp LQ134N1, IPS, 13.4", 1920x1200 | Apple MacBook Pro 13 2020 2GHz i5 10th-Gen APPA03D, IPS, 13.3", 2560x1600 | Huawei MateBook X Pro 2020 i7 JDI LPM139M422A, LTPS, 13.9", 3000x2000 | Lenovo Yoga Slim 7-14ARE AU Optronics B140HAN06.8, IPS, 14", 1920x1080 | HP Spectre x360 13-aw0013dx AU Optronics AUO5E2D, IPS, 13.3", 1920x1080 | |
|---|---|---|---|---|---|---|
| Display | -5% | 20% | -4% | 0% | -1% | |
| Display P3 Coverage (%) | 70.9 | 66.3 -6% | 98.8 39% | 66.6 -6% | 71.7 1% | 69.6 -2% |
| sRGB Coverage (%) | 99.1 | 97.3 -2% | 99.9 1% | 99.4 0% | 99.3 0% | 98.9 0% |
| AdobeRGB 1998 Coverage (%) | 72.9 | 68.5 -6% | 86.4 19% | 68.6 -6% | 72.9 0% | 71.5 -2% |
| Response Times | 2% | 7% | 6% | 12% | -14% | |
| Response Time Grey 50% / Grey 80% * (ms) | 52 ? | 50 ? 4% | 46 ? 12% | 49.6 ? 5% | 45.6 ? 12% | 60.8 ? -17% |
| Response Time Black / White * (ms) | 33.2 ? | 33.2 ? -0% | 32.4 ? 2% | 30.8 ? 7% | 29.6 ? 11% | 36.8 ? -11% |
| PWM Frequency (Hz) | 2475 ? | 2500 ? | 113600 ? | 29070 ? | ||
| Screen | 1% | 19% | 23% | -9% | -11% | |
| Brightness middle (cd/m²) | 543.3 | 607.6 12% | 512 -6% | 557 3% | 399.6 -26% | 447.4 -18% |
| Brightness (cd/m²) | 524 | 595 14% | 491 -6% | 532 2% | 385 -27% | 420 -20% |
| Brightness Distribution (%) | 92 | 96 4% | 91 -1% | 87 -5% | 89 -3% | 85 -8% |
| Black Level * (cd/m²) | 0.38 | 0.4 -5% | 0.32 16% | 0.33 13% | 0.37 3% | 0.31 18% |
| Contrast (:1) | 1430 | 1519 6% | 1600 12% | 1688 18% | 1080 -24% | 1443 1% |
| Colorchecker dE 2000 * | 3.02 | 3.23 -7% | 1.7 44% | 1.4 54% | 3.2 -6% | 4.23 -40% |
| Colorchecker dE 2000 max. * | 7.61 | 8.67 -14% | 3.4 55% | 2.5 67% | 6.44 15% | 9.34 -23% |
| Colorchecker dE 2000 calibrated * | 1.23 | 1.01 18% | 1 19% | 0.7 43% | 1.73 -41% | 1.32 -7% |
| Greyscale dE 2000 * | 5 | 5.5 -10% | 1.9 62% | 2 60% | 4.7 6% | 6.1 -22% |
| Gamma | 2.02 109% | 2.12 104% | 2.19 100% | 2.14 103% | 2.21 100% | 2.11 104% |
| CCT | 6550 99% | 6413 101% | 6817 95% | 6689 97% | 7184 90% | 6136 106% |
| Color Space (Percent of AdobeRGB 1998) (%) | 66.8 | 63 -6% | 77.4 16% | 62.5 -6% | 66.3 -1% | 64.8 -3% |
| Color Space (Percent of sRGB) (%) | 99.6 | 97.5 -2% | 99.9 0% | 99.5 0% | 99.5 0% | 98.9 -1% |
| Totaal Gemiddelde (Programma / Instellingen) | -1% /
0% | 15% /
18% | 8% /
16% | 1% /
-5% | -9% /
-10% |
* ... kleiner is beter
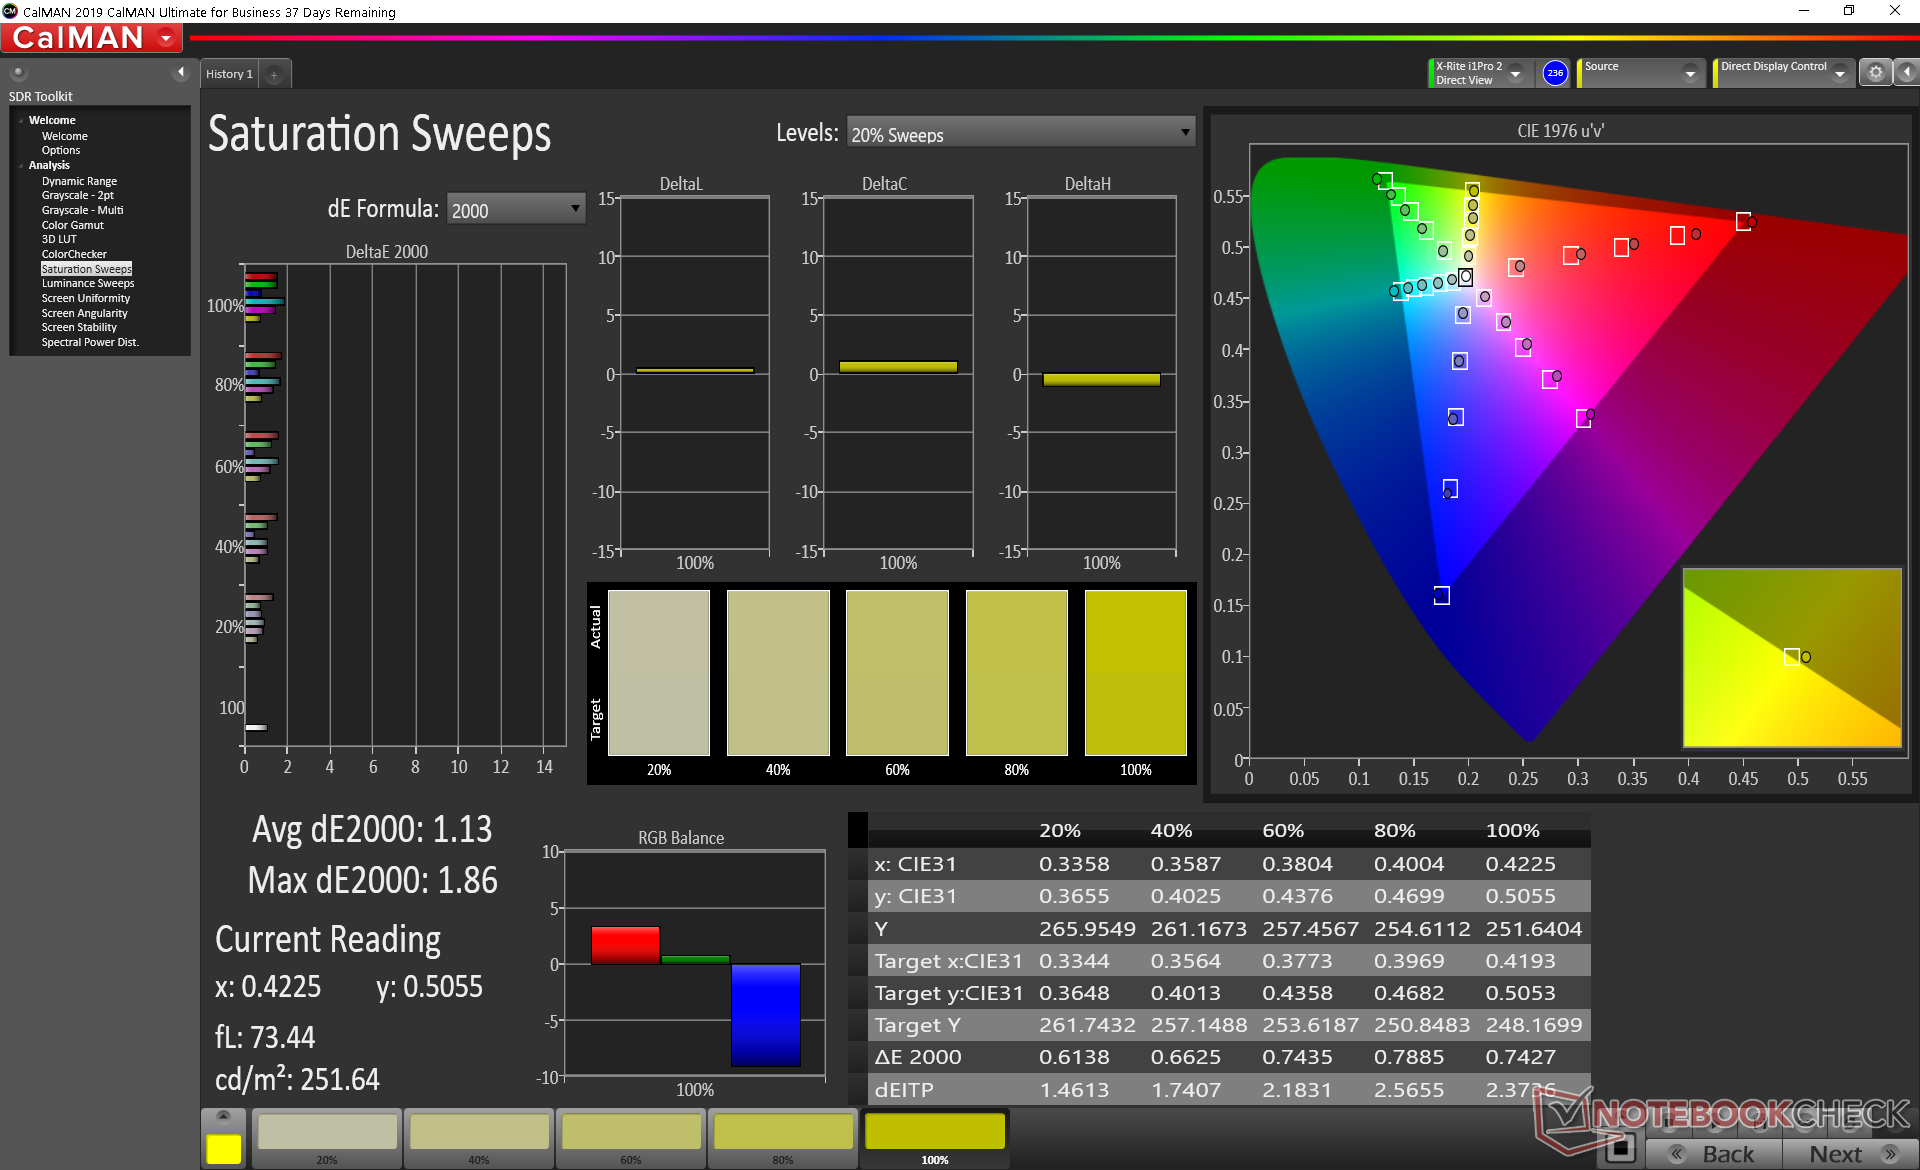
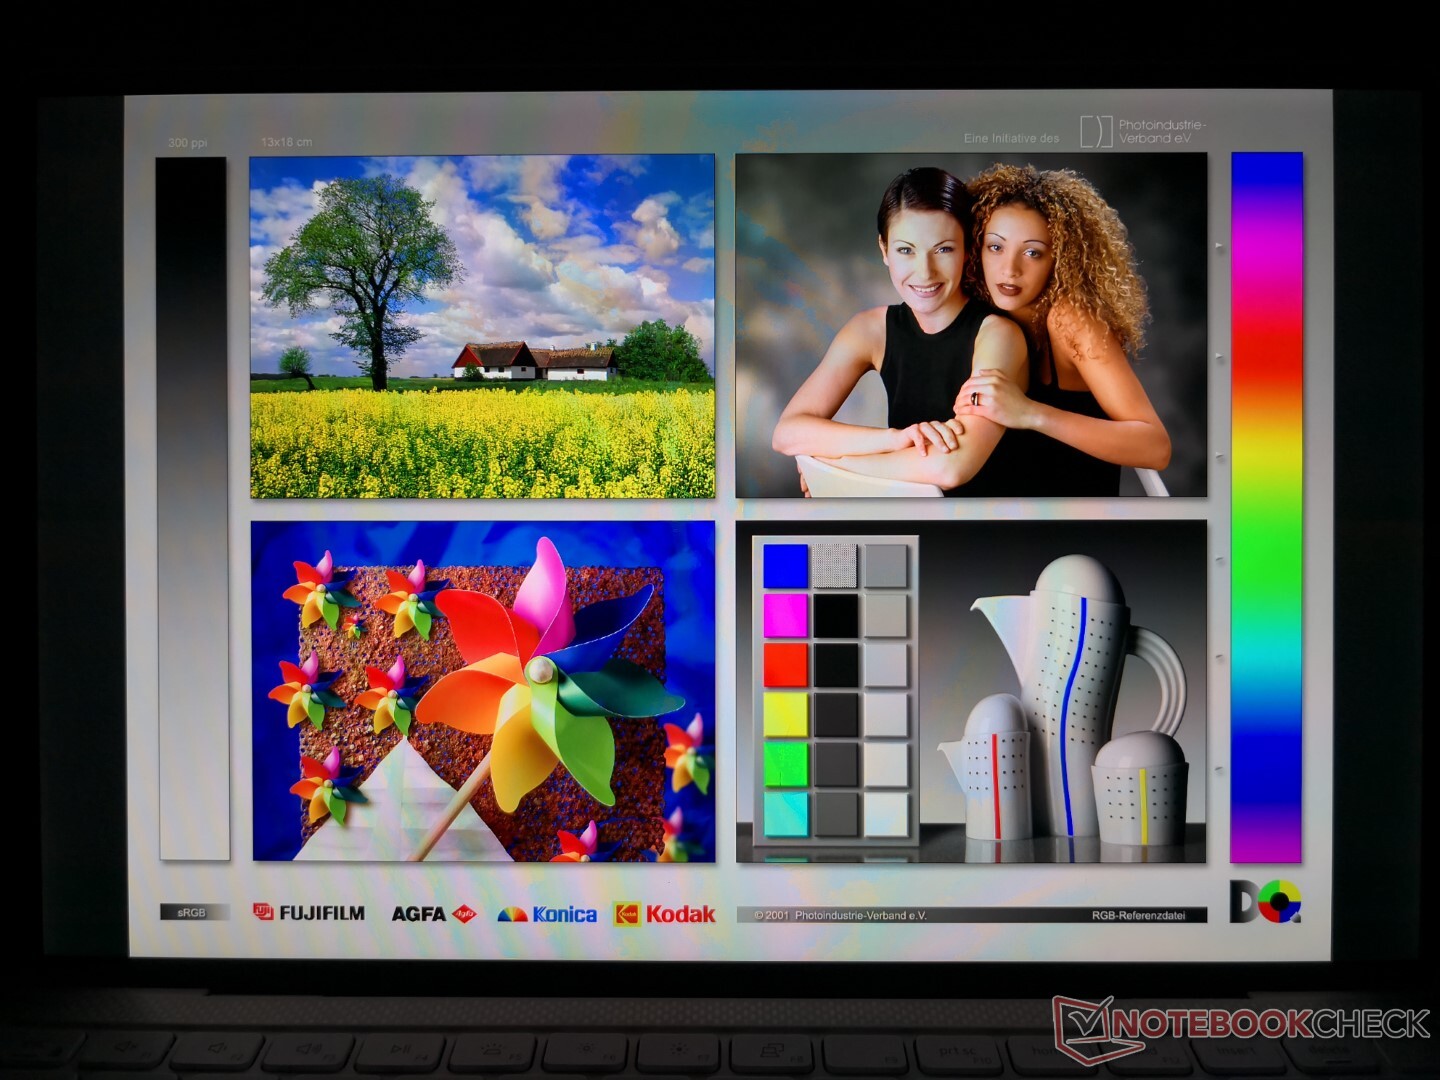
Alle XPS 13 9300/9310 SKU's hebben een 100% sRGB-dekking zonder opties voor AdobeRGB of DCI-P3, in tegenstelling tot de XPS 15-serie. Dit zou geen probleem moeten zijn voor iemand die geen professionele grafische editor is.
De out-of-the-box gammawaarde van 2,0 had beter kunnen zijn. Door de display zelf te kalibreren met een X-Rite colorimeter komt het gamma dichter bij het 2.2 doelwit met vervolgens een betere grijsschaal en kleuren over de hele linie.
Responstijd Scherm
| ↔ Responstijd Zwart naar Wit | ||
|---|---|---|
| 33.2 ms ... stijging ↗ en daling ↘ gecombineerd | ↗ 19.2 ms stijging | 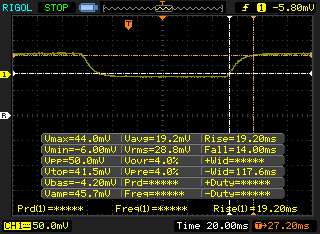 |
| ↘ 14 ms daling | ||
| Het scherm vertoonde trage responstijden in onze tests en is misschien te traag voor games. Ter vergelijking: alle testtoestellen variëren van 0.1 (minimum) tot 240 (maximum) ms. » 90 % van alle toestellen zijn beter. Dit betekent dat de gemeten responstijd slechter is dan het gemiddelde (19.8 ms) van alle geteste toestellen. | ||
| ↔ Responstijd 50% Grijs naar 80% Grijs | ||
| 52 ms ... stijging ↗ en daling ↘ gecombineerd | ↗ 27.6 ms stijging | 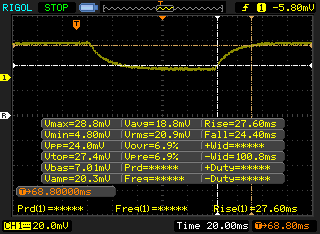 |
| ↘ 24.4 ms daling | ||
| Het scherm vertoonde trage responstijden in onze tests en is misschien te traag voor games. Ter vergelijking: alle testtoestellen variëren van 0.165 (minimum) tot 636 (maximum) ms. » 88 % van alle toestellen zijn beter. Dit betekent dat de gemeten responstijd slechter is dan het gemiddelde (31 ms) van alle geteste toestellen. | ||
Screen Flickering / PWM (Pulse-Width Modulation)
| Screen flickering / PWM waargenomen | 2475 Hz | ≤ 20 % helderheid instelling | 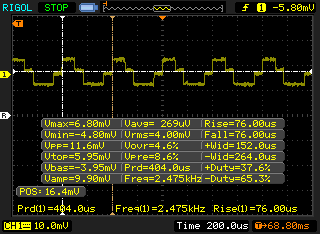 |
De achtergrondverlichting van het scherm flikkert op 2475 Hz (in het slechtste geval, bijvoorbeeld bij gebruik van PWM) aan een helderheid van 20 % en lager. Boven deze helderheid zou er geen flickering / PWM mogen optreden. De frequentie van 2475 Hz is redelijk hoog en de meeste mensen die gevoelig zijn aan flickering zouden dit dus niet mogen waarnemen of geïrriteerde ogen krijgen. Ter vergelijking: 52 % van alle geteste toestellen maakten geen gebruik van PWM om de schermhelderheid te verlagen. Als het wel werd gebruikt, werd een gemiddelde van 7772 (minimum: 5 - maximum: 343500) Hz waargenomen. | |||
Prestaties
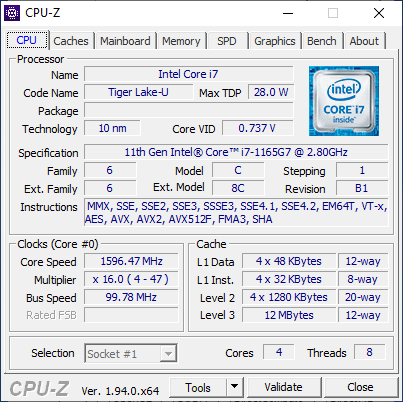
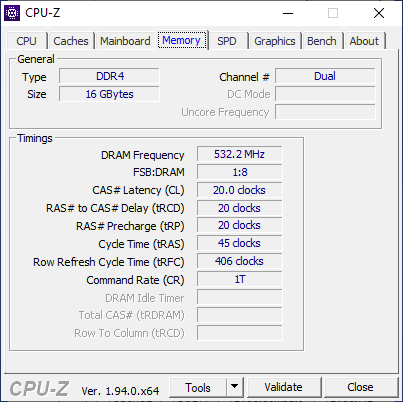
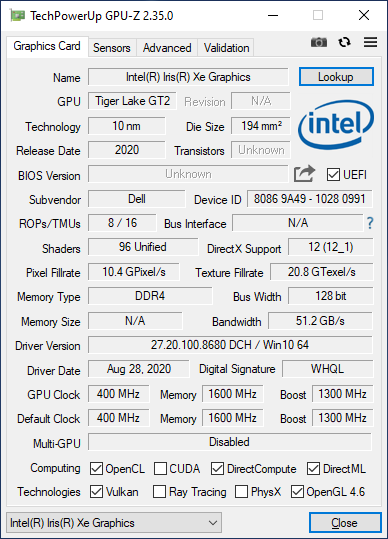
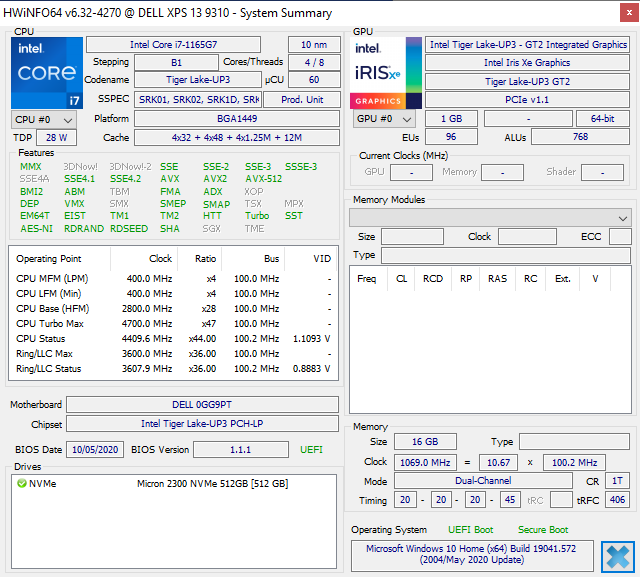
Alle XPS 13 9310 SKU's worden geleverd met de Core i3-1115G4, Core i5-1135G7 of Core i7-1165G7 CPU met 8 GB tot 32 GB van 4267 MHz RAM. Geïntegreerde Iris Xe-grafiek wordt standaard geleverd op alle configuraties, maar verwacht dat deze langzamer en met minder EU's werkt op de Core i3-1115G4-optie.
Tenzij anders vermeld, zijn onderstaande tests uitgevoerd in de Ultra Performance-modus voor de hoogst mogelijke scores van het systeem. De voedingsprofielen zijn allemaal terug te vinden in de vooraf geïnstalleerde Dell Power Manager software.

Verwerker
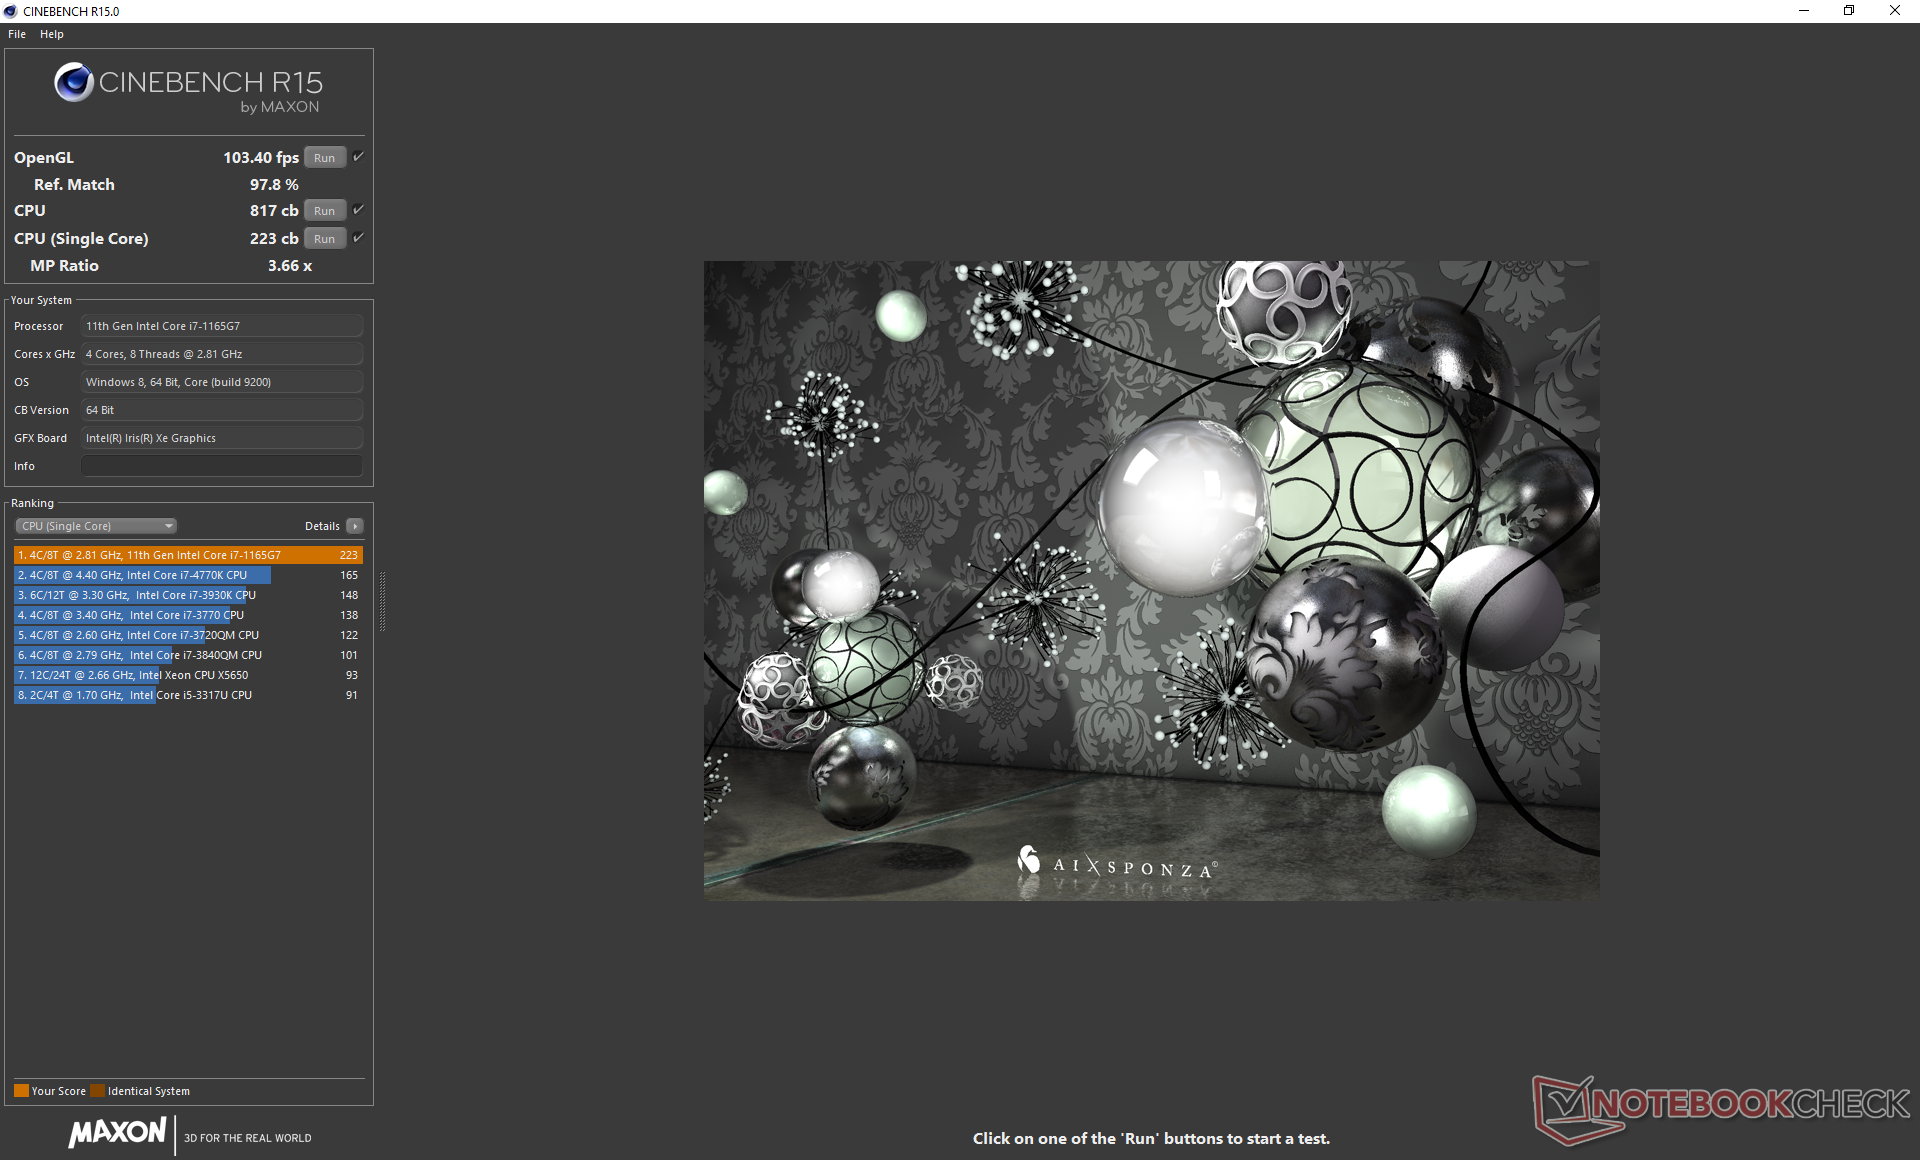
Als vierde laptop in onze database, uitgerust met de Core i7-1165G7, presteert de XPS 13 9310 waar we verwachten dat hij binnen enkele procenten van het gemiddelde ligt. Helaas betekent dit ook dat de eventuele onbewerkte prestatiewinst ten opzichte van de Core i7-1065G7 van vorig jaar relatief gering is
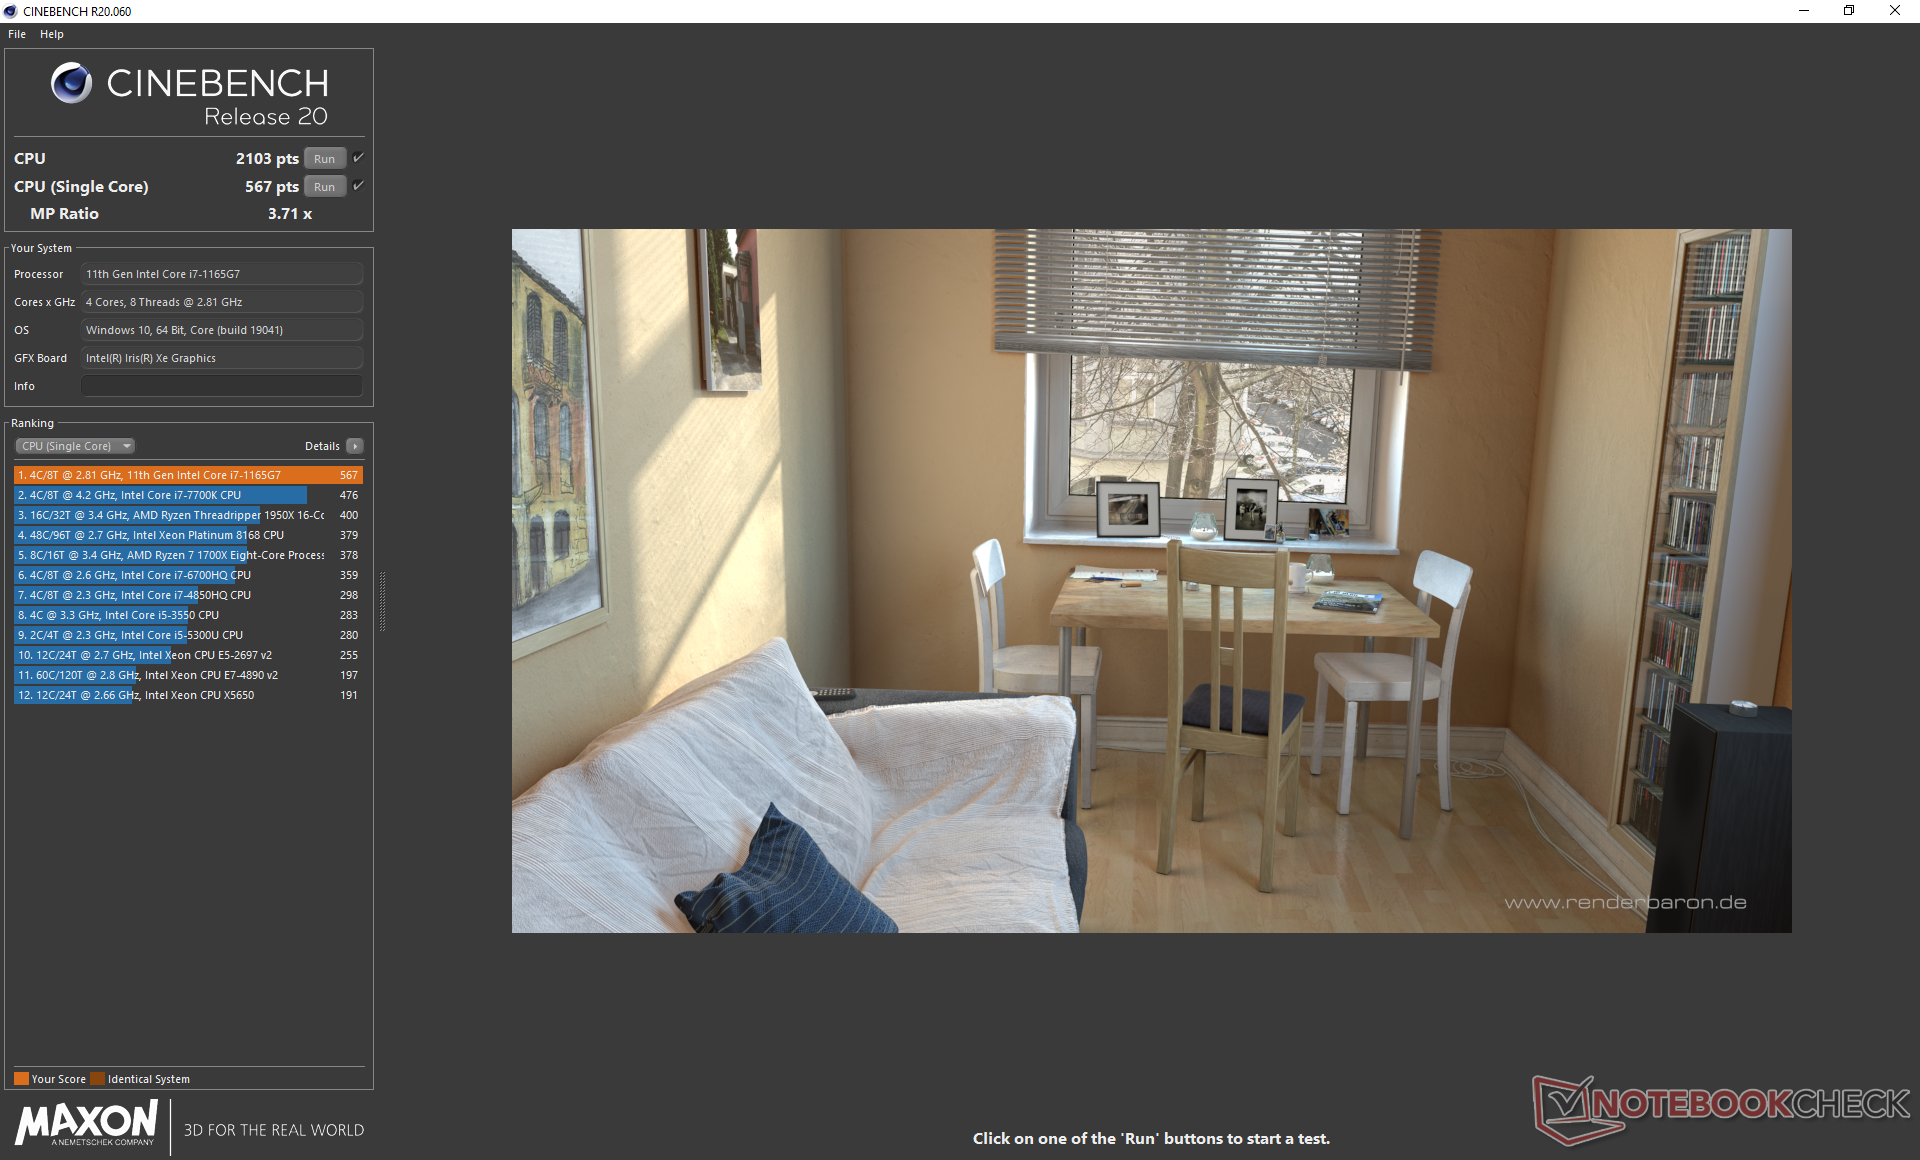
Dell blijft vertrouwen op Dynamic Tuning om zoveel mogelijk prestaties uit de processor te persen binnen de mogelijkheden van de onderliggende koeloplossing. Dit wordt geïllustreerd door de cycling CineBench R15 xT scores bij het uitvoeren van de benchmark in een loop zoals weergegeven in de onderstaande grafiek in vergelijking met de vlakkere scores van de Asus ZenBook 14 serie die op dezelfde CPU draait. CineBench R20 scoort op de Core i7 XPS 13 9300 en kan door de verschillende kloksnelheden variëren van 1396 punten tot 1883 punten. We gaan hier verder op in de Stress Test sectie hieronder.
Cinebench R15: CPU Multi 64Bit | CPU Single 64Bit
Blender: v2.79 BMW27 CPU
7-Zip 18.03: 7z b 4 -mmt1 | 7z b 4
Geekbench 5.5: Single-Core | Multi-Core
HWBOT x265 Benchmark v2.2: 4k Preset
LibreOffice : 20 Documents To PDF
R Benchmark 2.5: Overall mean
| Blender / v2.79 BMW27 CPU | |
| HP Elite Dragonfly-8MK79EA | |
| Huawei MateBook X Pro 2020 i7 | |
| Microsoft Surface Laptop Go Core i5 | |
| Acer Swift 3 SF314-42-R27B | |
| Asus ZenBook 14 UX434FL-DB77 | |
| Dell XPS 13 9300 4K UHD | |
| Dell XPS 13 9310 Core i7 FHD | |
| Gemiddeld Intel Core i7-1165G7 (468 - 1138, n=80) | |
| HP Envy x360 13-ay0010nr | |
| Dell XPS 15 9500 Core i5 | |
| Asus VivoBook Flip 14 TM420IA | |
| Lenovo Yoga Slim 7-14ARE | |
| Apple MacBook Pro 13 2020 2GHz i5 10th-Gen | |
| 7-Zip 18.03 / 7z b 4 -mmt1 | |
| Dell XPS 13 9310 Core i7 FHD | |
| Gemiddeld Intel Core i7-1165G7 (4478 - 5507, n=80) | |
| Dell XPS 15 9500 Core i5 | |
| Huawei MateBook X Pro 2020 i7 | |
| Dell XPS 13 9300 4K UHD | |
| Lenovo Yoga Slim 7-14ARE | |
| Asus VivoBook Flip 14 TM420IA | |
| HP Envy x360 13-ay0010nr | |
| Apple MacBook Pro 13 2020 2GHz i5 10th-Gen | |
| Acer Swift 3 SF314-42-R27B | |
| Microsoft Surface Laptop Go Core i5 | |
| HP Elite Dragonfly-8MK79EA | |
| Asus ZenBook 14 UX434FL-DB77 | |
| Geekbench 5.5 / Single-Core | |
| Dell XPS 13 9310 Core i7 FHD | |
| Gemiddeld Intel Core i7-1165G7 (1302 - 1595, n=77) | |
| Dell XPS 13 9300 4K UHD | |
| Apple MacBook Pro 13 2020 2GHz i5 10th-Gen | |
| Dell XPS 15 9500 Core i5 | |
| Asus ZenBook 14 UX434FL-DB77 | |
| Asus VivoBook Flip 14 TM420IA | |
| Lenovo Yoga Slim 7-14ARE | |
| Lenovo Yoga Slim 7-14ARE | |
| Microsoft Surface Laptop Go Core i5 | |
| HP Envy x360 13-ay0010nr | |
| Acer Swift 3 SF314-42-R27B | |
| Huawei MateBook X Pro 2020 i7 | |
| Geekbench 5.5 / Multi-Core | |
| Lenovo Yoga Slim 7-14ARE | |
| Lenovo Yoga Slim 7-14ARE | |
| Dell XPS 13 9310 Core i7 FHD | |
| Asus VivoBook Flip 14 TM420IA | |
| Gemiddeld Intel Core i7-1165G7 (3078 - 5926, n=77) | |
| Dell XPS 13 9300 4K UHD | |
| Apple MacBook Pro 13 2020 2GHz i5 10th-Gen | |
| HP Envy x360 13-ay0010nr | |
| Dell XPS 15 9500 Core i5 | |
| Microsoft Surface Laptop Go Core i5 | |
| Acer Swift 3 SF314-42-R27B | |
| Asus ZenBook 14 UX434FL-DB77 | |
| Huawei MateBook X Pro 2020 i7 | |
| HWBOT x265 Benchmark v2.2 / 4k Preset | |
| Lenovo Yoga Slim 7-14ARE | |
| Asus VivoBook Flip 14 TM420IA | |
| Dell XPS 15 9500 Core i5 | |
| HP Envy x360 13-ay0010nr | |
| Gemiddeld Intel Core i7-1165G7 (1.39 - 8.47, n=80) | |
| Dell XPS 13 9300 4K UHD | |
| Apple MacBook Pro 13 2020 2GHz i5 10th-Gen | |
| Dell XPS 13 9310 Core i7 FHD | |
| Asus ZenBook 14 UX434FL-DB77 | |
| Acer Swift 3 SF314-42-R27B | |
| Microsoft Surface Laptop Go Core i5 | |
| Huawei MateBook X Pro 2020 i7 | |
| HP Elite Dragonfly-8MK79EA | |
| LibreOffice / 20 Documents To PDF | |
| Apple MacBook Pro 13 2020 2GHz i5 10th-Gen | |
| Dell XPS 13 9300 4K UHD | |
| Asus ZenBook 14 UX434FL-DB77 | |
| Microsoft Surface Laptop Go Core i5 | |
| Dell XPS 15 9500 Core i5 | |
| Acer Swift 3 SF314-42-R27B | |
| HP Envy x360 13-ay0010nr | |
| Lenovo Yoga Slim 7-14ARE | |
| Asus VivoBook Flip 14 TM420IA | |
| Huawei MateBook X Pro 2020 i7 | |
| Gemiddeld Intel Core i7-1165G7 (21.5 - 88.1, n=78) | |
| Dell XPS 13 9310 Core i7 FHD | |
| R Benchmark 2.5 / Overall mean | |
| Asus ZenBook 14 UX434FL-DB77 | |
| Microsoft Surface Laptop Go Core i5 | |
| Apple MacBook Pro 13 2020 2GHz i5 10th-Gen | |
| Acer Swift 3 SF314-42-R27B | |
| Dell XPS 13 9300 4K UHD | |
| Dell XPS 15 9500 Core i5 | |
| Huawei MateBook X Pro 2020 i7 | |
| HP Envy x360 13-ay0010nr | |
| Lenovo Yoga Slim 7-14ARE | |
| Asus VivoBook Flip 14 TM420IA | |
| Gemiddeld Intel Core i7-1165G7 (0.552 - 1.002, n=80) | |
| Dell XPS 13 9310 Core i7 FHD | |
Cinebench R15: CPU Multi 64Bit | CPU Single 64Bit
Blender: v2.79 BMW27 CPU
7-Zip 18.03: 7z b 4 -mmt1 | 7z b 4
Geekbench 5.5: Single-Core | Multi-Core
HWBOT x265 Benchmark v2.2: 4k Preset
LibreOffice : 20 Documents To PDF
R Benchmark 2.5: Overall mean
* ... kleiner is beter
Prestaties van het systeem
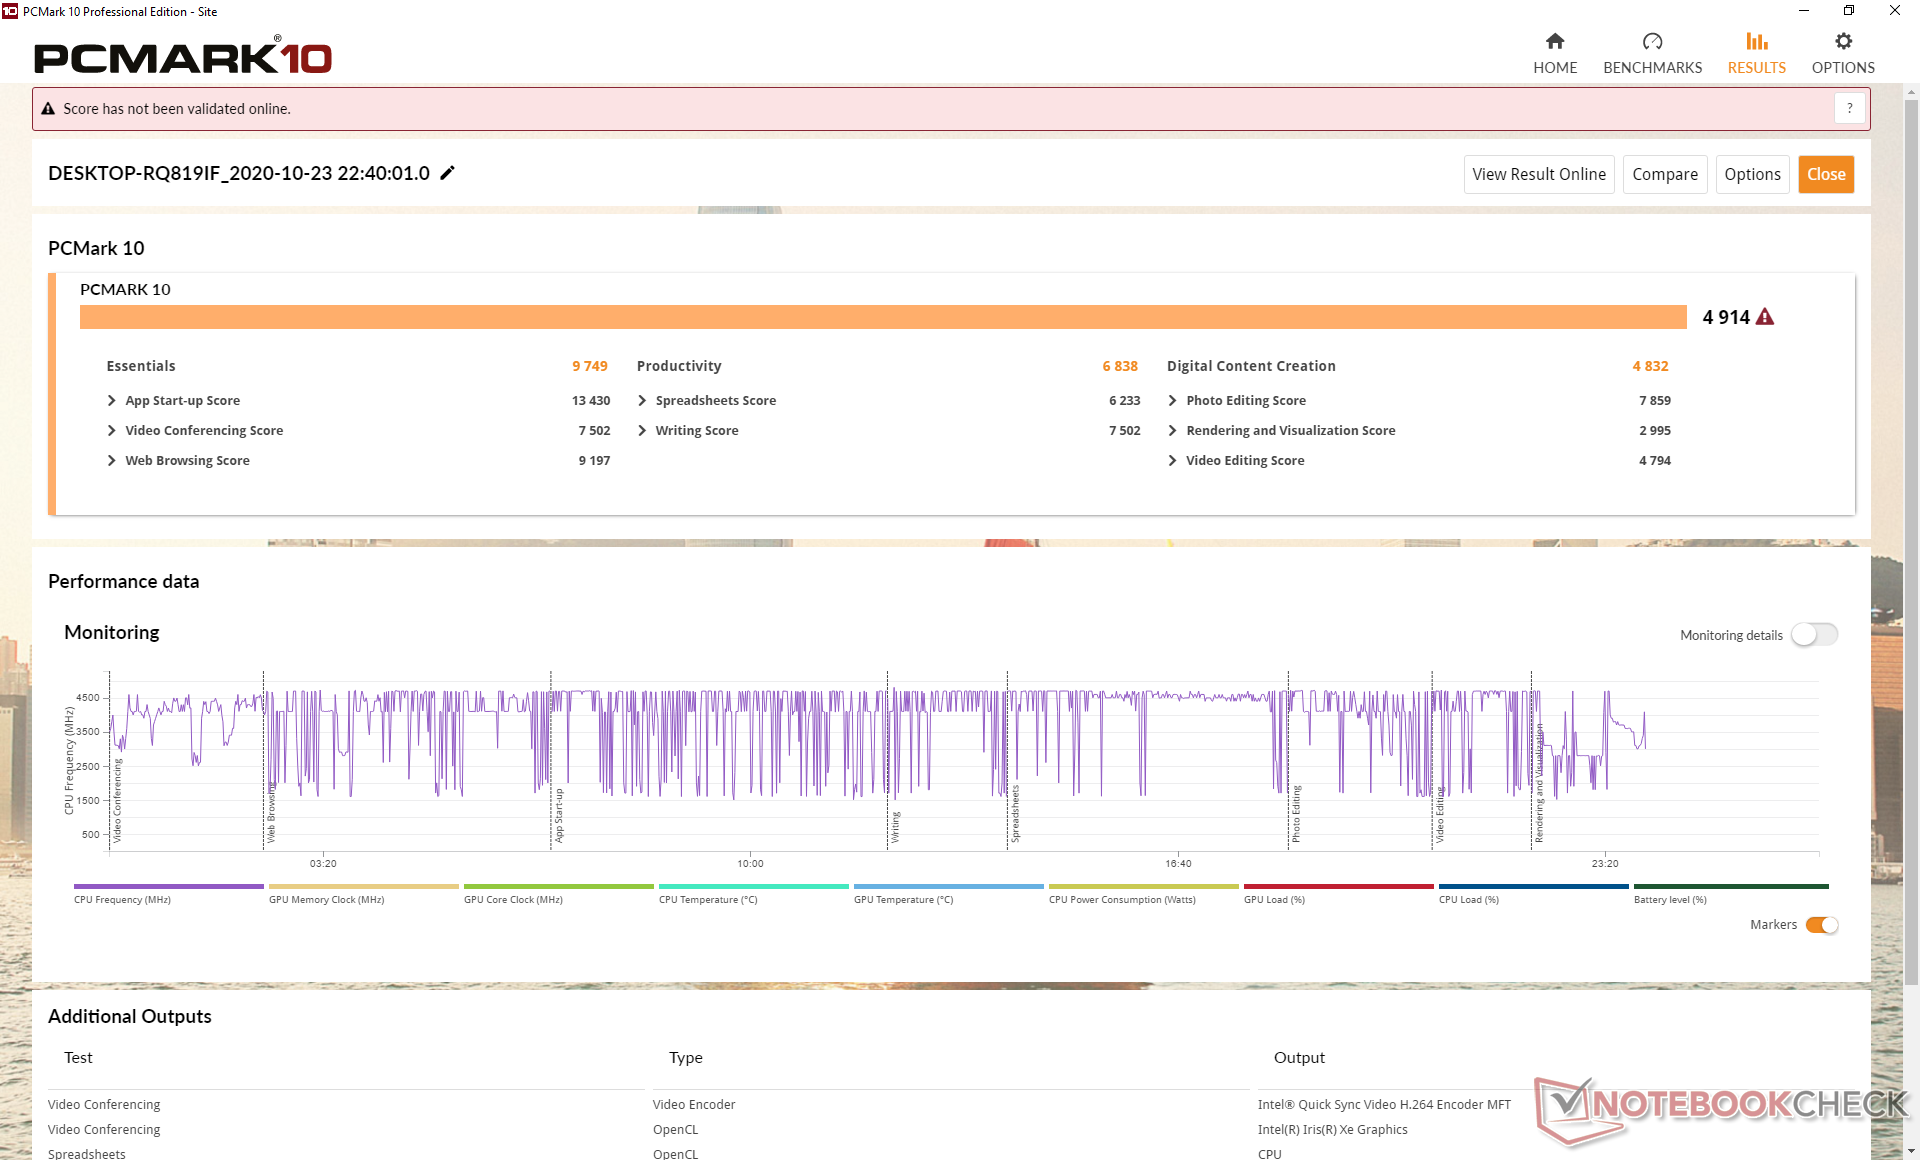
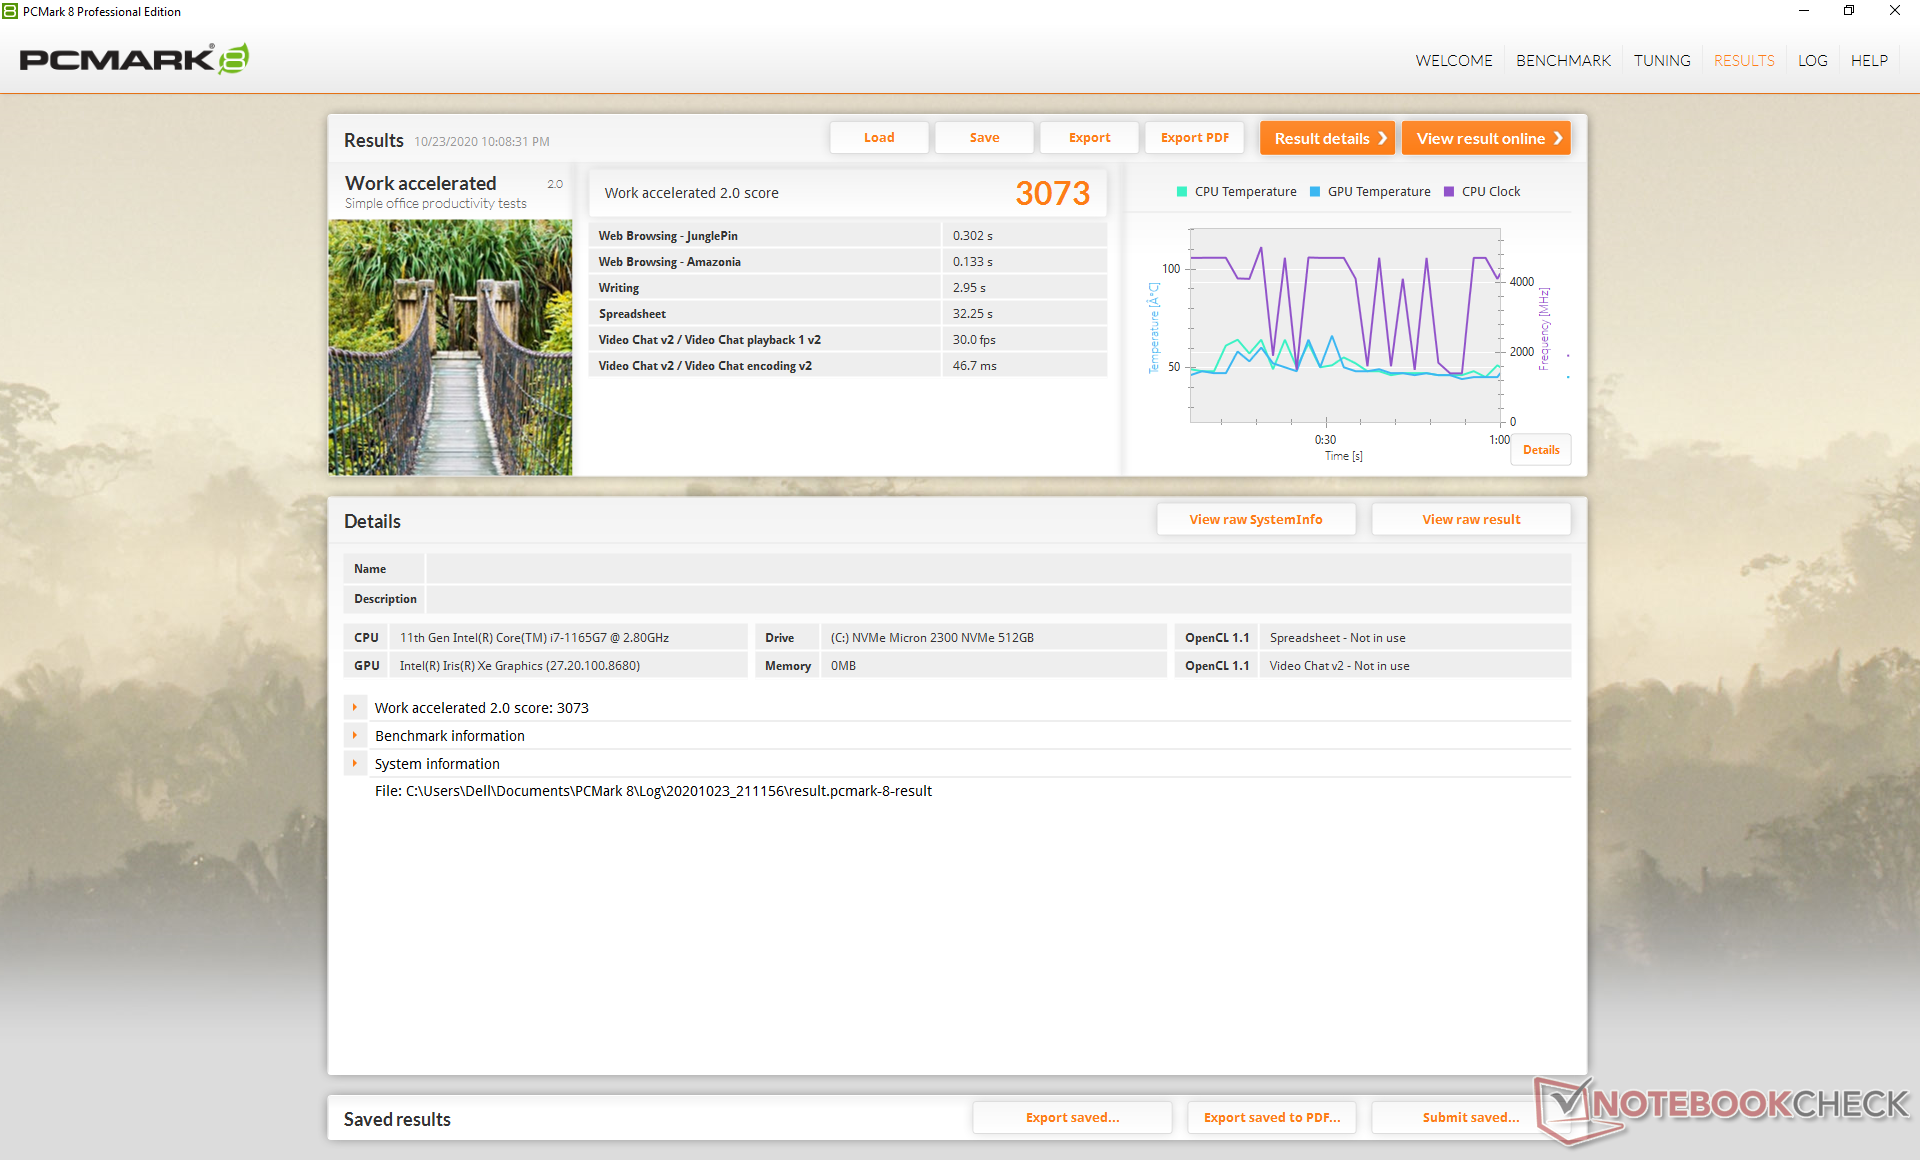
PCMark benchmarks zijn consistent hoger dan de Ice Lake-powered XPS 13 9300 van vorig jaar met ten minste dubbelcijferige procentpunten die waarschijnlijk te wijten zijn aan de snellere geïntegreerde GPU. De minder dure AMD-aangedreven Lenovo Yoga Slim 7 komt echter nog steeds als beste uit de bus.
Tijdens onze tijd met de testunit heeft het systeem zichzelf op een nacht willekeurig opnieuw opgestart om zijn BIOS te updaten. Het zou dan bijna 20 minuten vastzitten op het opstartscherm voordat het eindelijk in de veilige modus van Windows komt. Het systeem was weer normaal na het herstarten vanaf daar, maar het hele proces was zeker een ongewenste ervaring, vooral op een nieuwe vlaggenschip laptop.
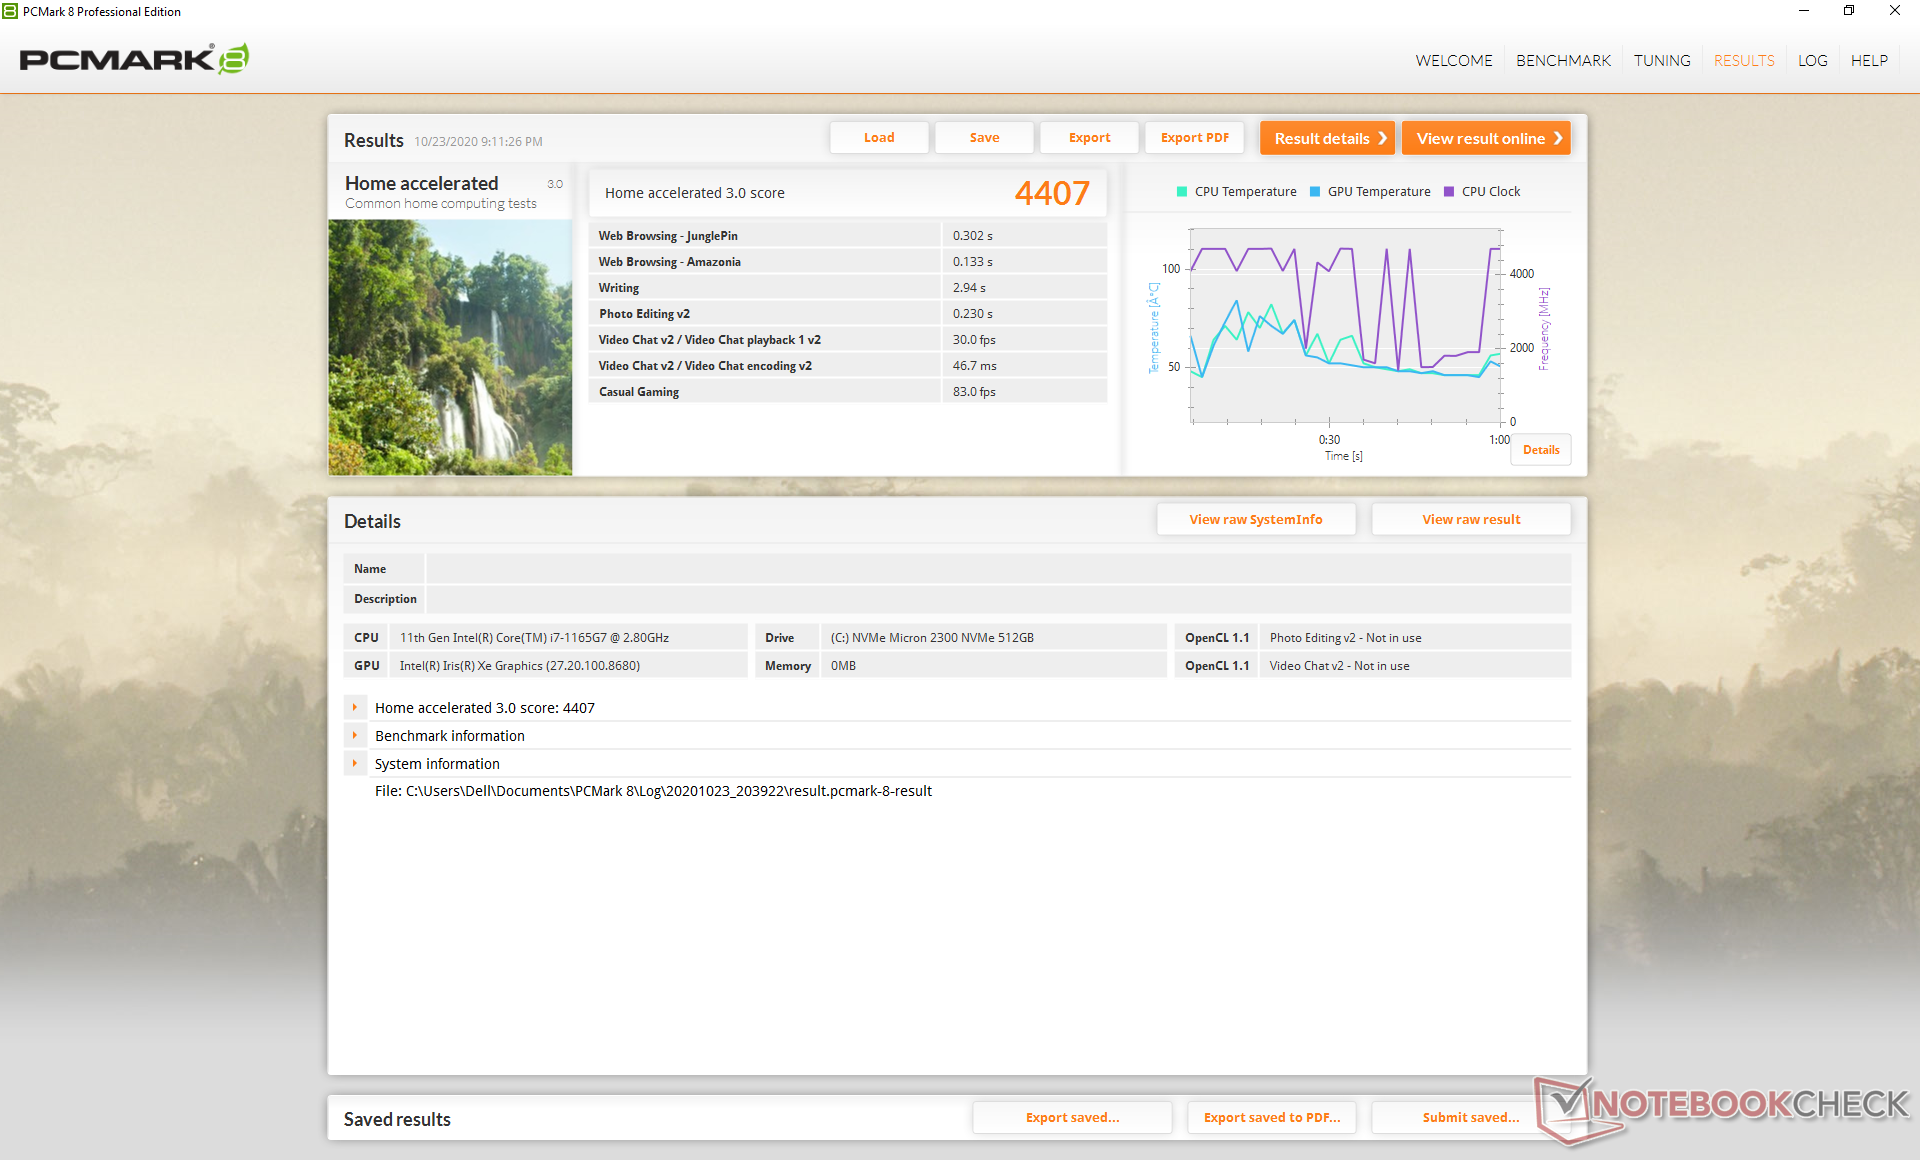
| PCMark 8 Home Score Accelerated v2 | 4407 punten | |
| PCMark 8 Work Score Accelerated v2 | 3073 punten | |
| PCMark 10 Score | 4914 punten | |
Help | ||
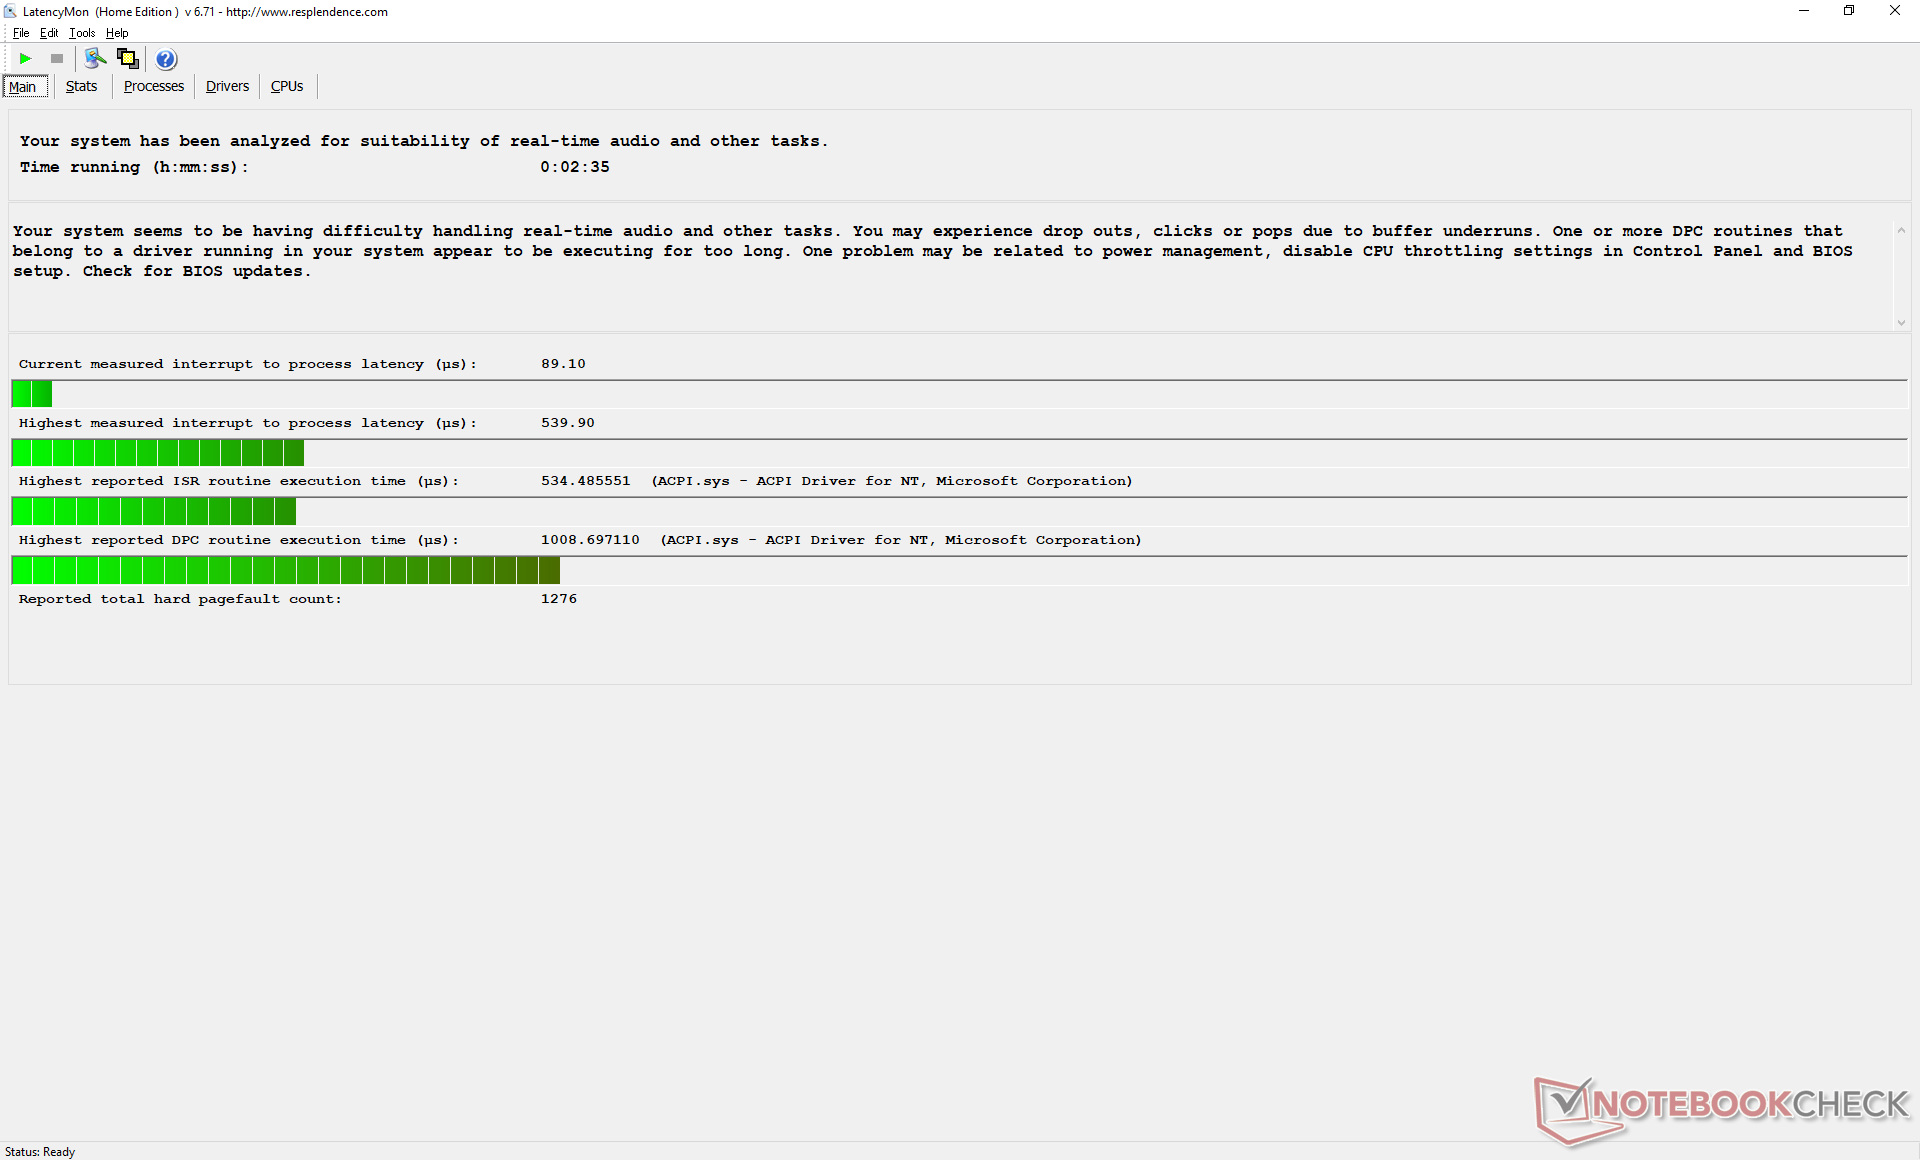
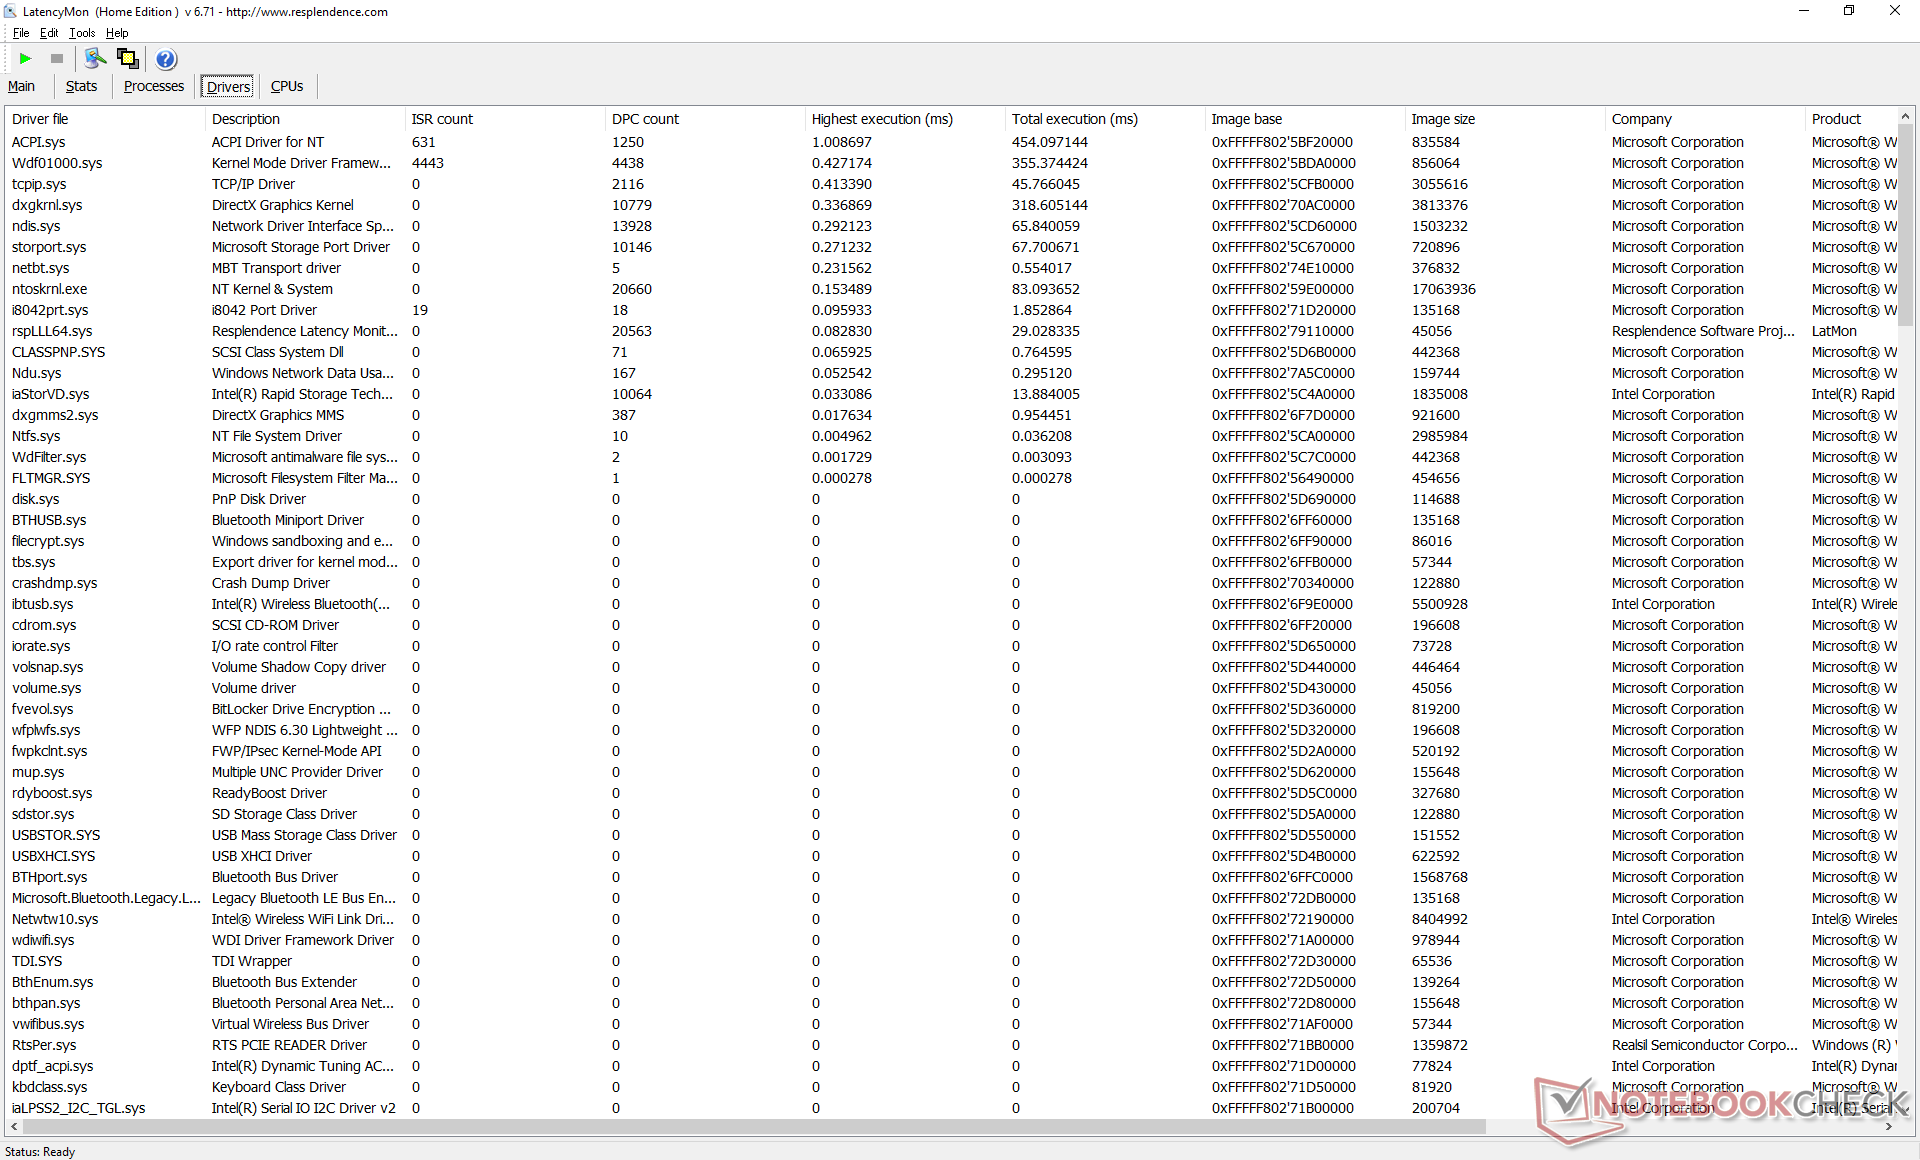
DPC vertraging
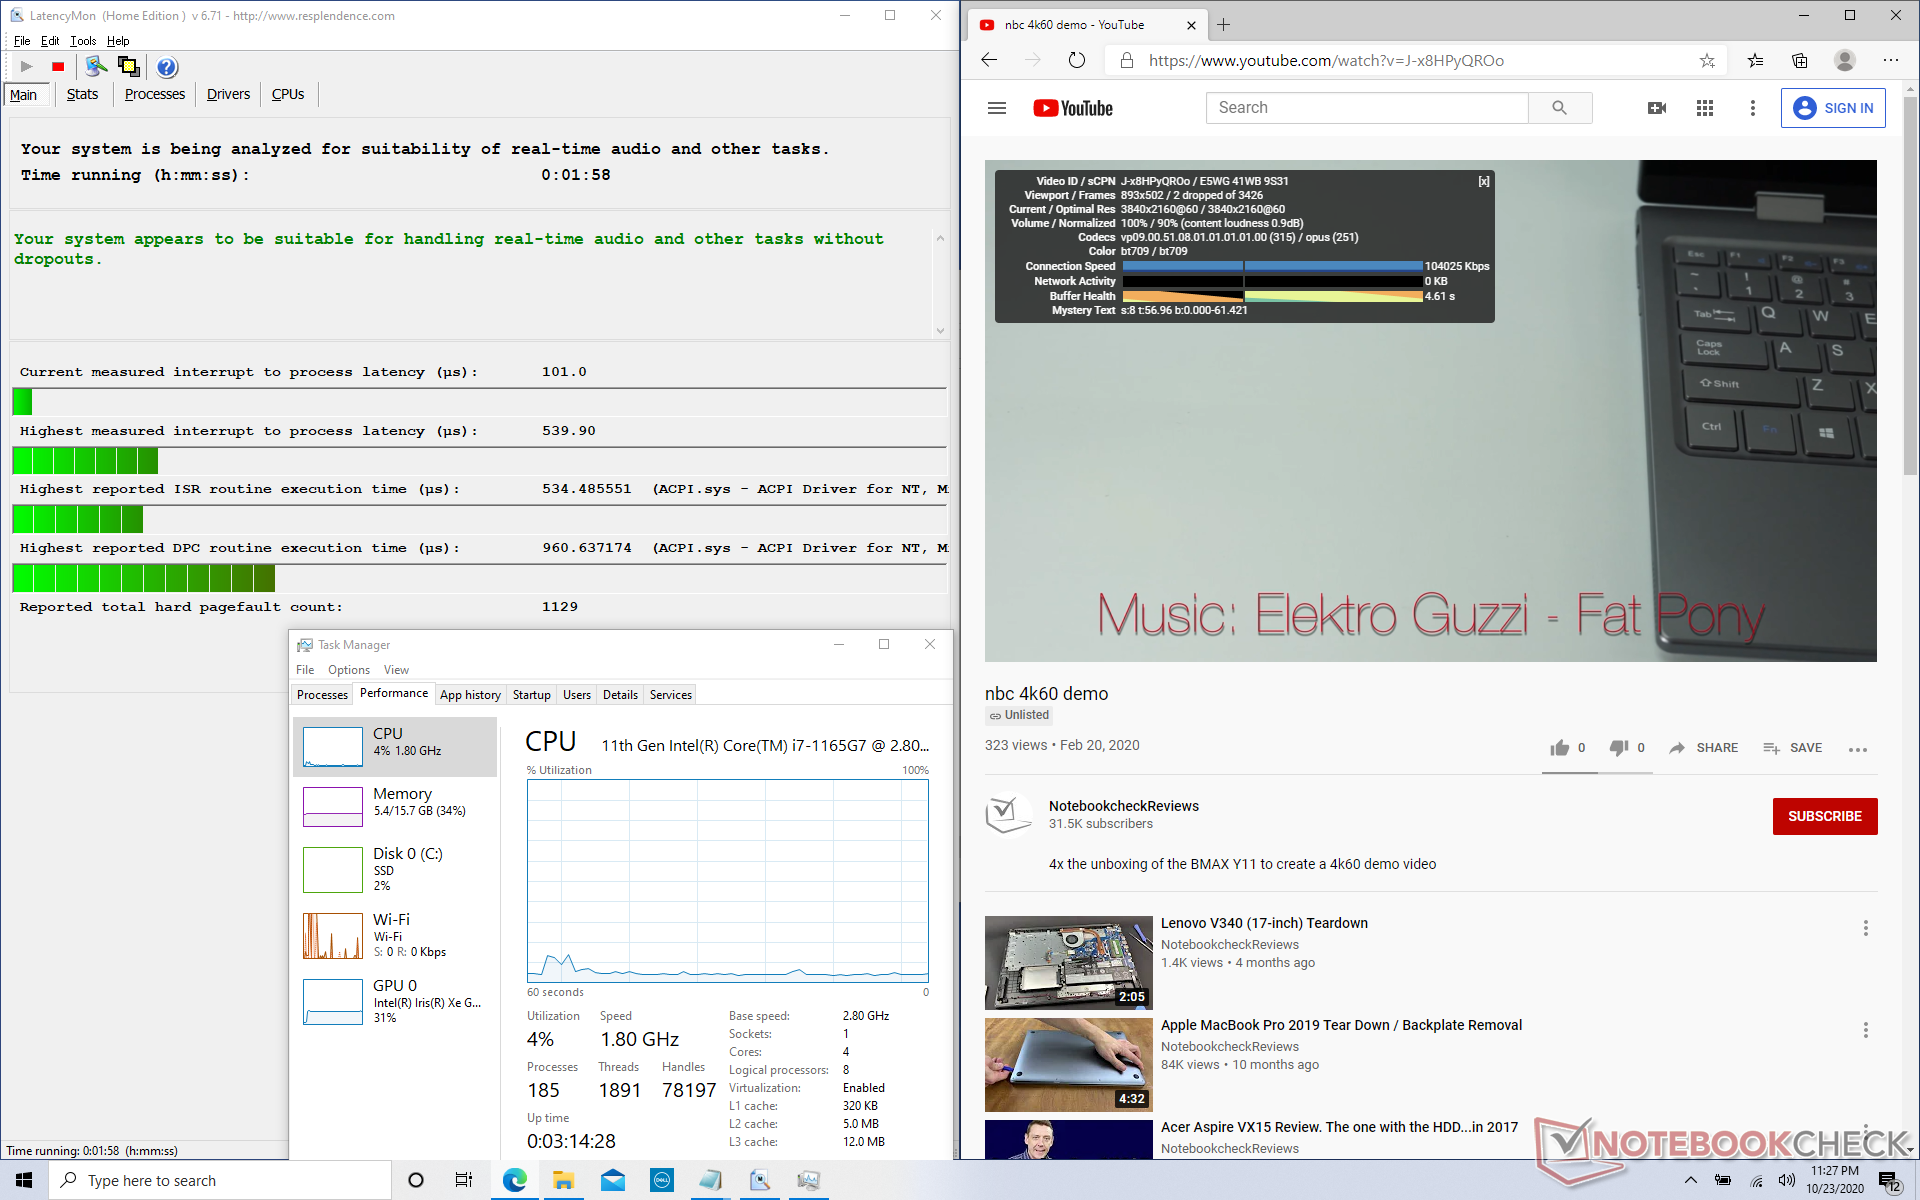
Het openen van meerdere browsertabbladen op onze homepage zou volgens LatencyMon geen DPC-latentieproblemen opleveren. Het initiëren van Prime95 zou echter wel lichte latency's veroorzaken. 4K60 afspelen gaat soepel met slechts twee gedropte frames tijdens onze minute-lange YouTube testvideo.
| DPC Latencies / LatencyMon - interrupt to process latency (max), Web, Youtube, Prime95 | |
| Dell XPS 13 9300 Core i7-1065G7 | |
| Lenovo Yoga Slim 7-14ARE | |
| Dell XPS 13 9310 Core i7 FHD | |
* ... kleiner is beter
Opslagapparaten
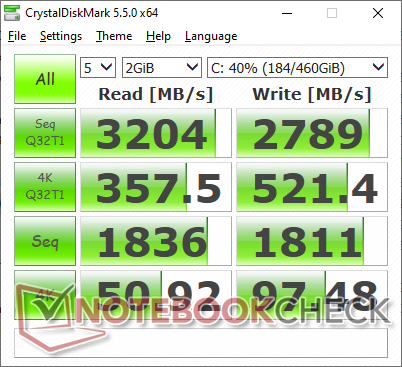
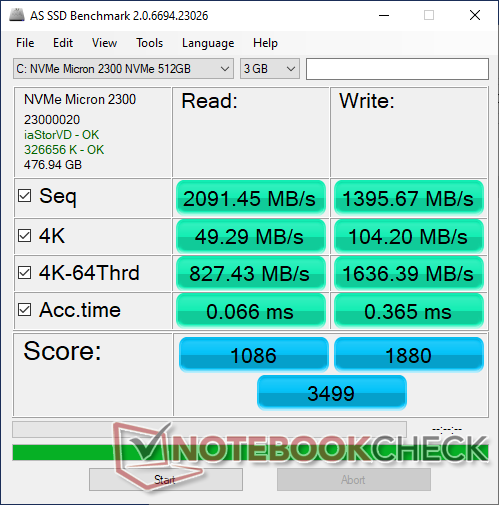
Terwijl de vorige XPS 13 modellen met M.2 NVMe SSD's van Samsung, SK Hynix, Intel of Toshiba zijn geleverd, komt ons nieuwste apparaat met een exemplaar van Micron. Het is zo'n beetje een roulette welke SSD je krijgt bij de aanschaf van een XPS 13 op een bepaald moment.
Gelukkig voor ons is de Micron 2200 een high-end NVMe-schijf met sequentiële lees- en schrijfsnelheden van respectievelijk 3300 MB/s en 2700 MB/s, om dicht bij de populaire Samsung PM981-serie te zijn. Toch zouden we niet verbaasd zijn als gebruikers volledig andere schijven krijgen als ze SKU's van verschillende SSD-groottes bestellen.
Meer opslagbenchmarks zijn hier te vinden op onze tabel met SSD's en HDD's.
| Dell XPS 13 9310 Core i7 FHD Micron 2300 512GB MTFDHBA512TDV | Dell XPS 13 9300 Core i7-1065G7 Intel SSDPEMKF512G8 NVMe SSD | Apple MacBook Pro 13 2020 2GHz i5 10th-Gen Apple SSD SM0512F | Huawei MateBook X Pro 2020 i7 Samsung PM981a MZVLB1T0HBLR | HP Spectre x360 13-aw0013dx Intel Optane Memory H10 with Solid State Storage 32GB + 512GB HBRPEKNX0202A(L/H) | |
|---|---|---|---|---|---|
| AS SSD | -16% | -49% | 48% | -30% | |
| Seq Read (MB/s) | 2091 | 1956 -6% | 1300 -38% | 2737 31% | 1039 -50% |
| Seq Write (MB/s) | 1396 | 1227 -12% | 1518 9% | 2530 81% | 310.1 -78% |
| 4K Read (MB/s) | 49.29 | 63 28% | 14.09 -71% | 54 10% | 76 54% |
| 4K Write (MB/s) | 104.2 | 156.6 50% | 24.25 -77% | 152.5 46% | 118 13% |
| 4K-64 Read (MB/s) | 827 | 475.6 -42% | 725 -12% | 2011 143% | 371.8 -55% |
| 4K-64 Write (MB/s) | 1636 | 539 -67% | 169.6 -90% | 1260 -23% | 469.5 -71% |
| Access Time Read * (ms) | 0.066 | 0.042 36% | 0.172 -161% | 0.066 -0% | 0.067 -2% |
| Access Time Write * (ms) | 0.365 | 0.105 71% | 0.155 58% | 0.024 93% | 0.138 62% |
| Score Read (Points) | 1086 | 734 -32% | 869 -20% | 2339 115% | 552 -49% |
| Score Write (Points) | 1880 | 818 -56% | 346 -82% | 1666 -11% | 618 -67% |
| Score Total (Points) | 3499 | 1915 -45% | 1667 -52% | 5191 48% | 1448 -59% |
| Copy ISO MB/s (MB/s) | 1544 | 1022 -34% | 764 -51% | ||
| Copy Program MB/s (MB/s) | 613 | 302.8 -51% | 465.8 -24% | ||
| Copy Game MB/s (MB/s) | 1451 | 491.4 -66% | 764 -47% | ||
| CrystalDiskMark 5.2 / 6 | 15% | -31% | 14% | -7% | |
| Write 4K (MB/s) | 97.5 | 186.8 92% | 28.16 -71% | 165.6 70% | 112.6 15% |
| Read 4K (MB/s) | 50.9 | 71.4 40% | 17.5 -66% | 50.2 -1% | 131 157% |
| Write Seq (MB/s) | 1811 | 1203 -34% | 1195 -34% | 1905 5% | 458.9 -75% |
| Read Seq (MB/s) | 1836 | 2600 42% | 1470 -20% | 1669 -9% | 1355 -26% |
| Write 4K Q32T1 (MB/s) | 521 | 514 -1% | 205 -61% | 474.6 -9% | 341.3 -34% |
| Read 4K Q32T1 (MB/s) | 357.5 | 570 59% | 692 94% | 508 42% | 320.6 -10% |
| Write Seq Q32T1 (MB/s) | 2879 | 786 -73% | 1475 -49% | 3007 4% | 1219 -58% |
| Read Seq Q32T1 (MB/s) | 3204 | 2947 -8% | 1920 -40% | 3556 11% | 2462 -23% |
| Totaal Gemiddelde (Programma / Instellingen) | -1% /
-5% | -40% /
-41% | 31% /
34% | -19% /
-22% |
* ... kleiner is beter

Disk Throttling: DiskSpd Read Loop, Queue Depth 8
GPU-prestaties
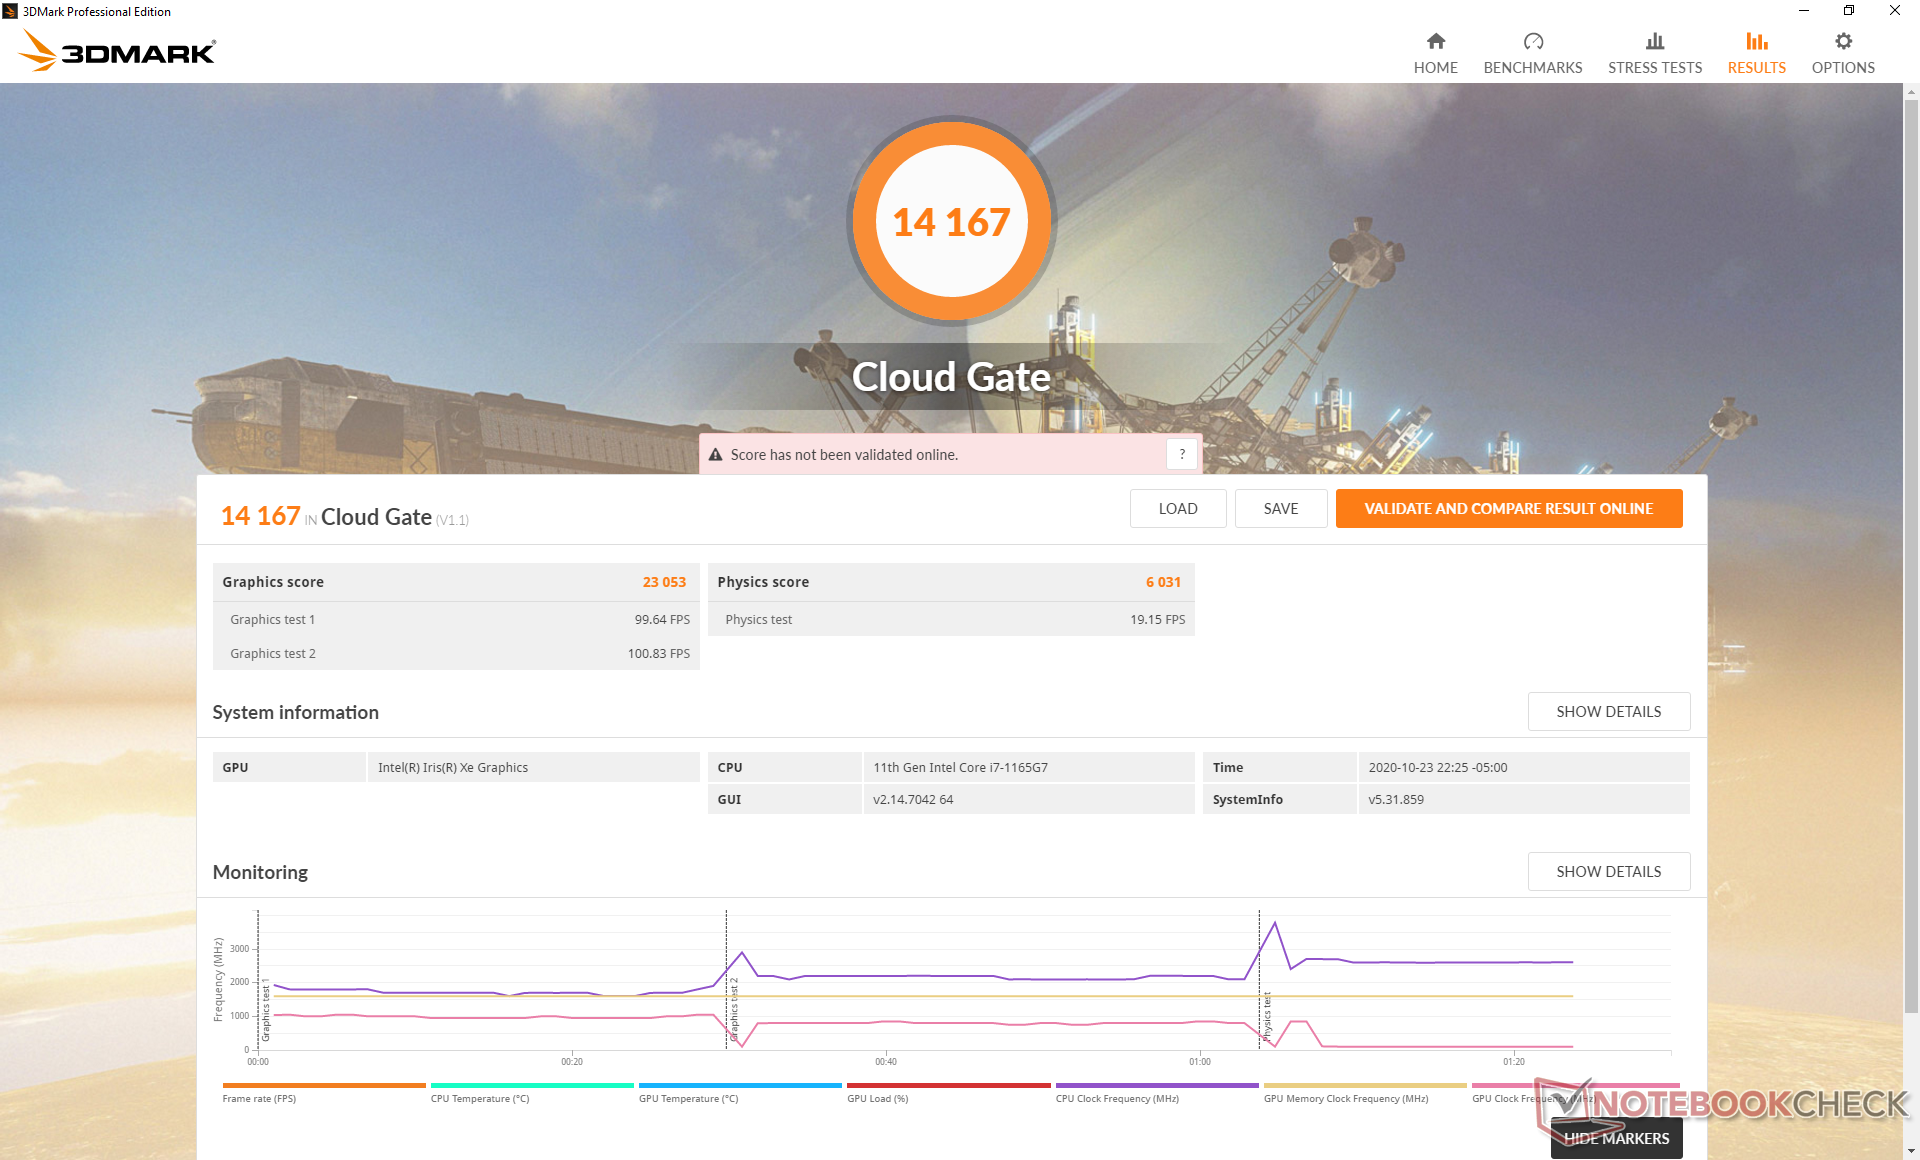
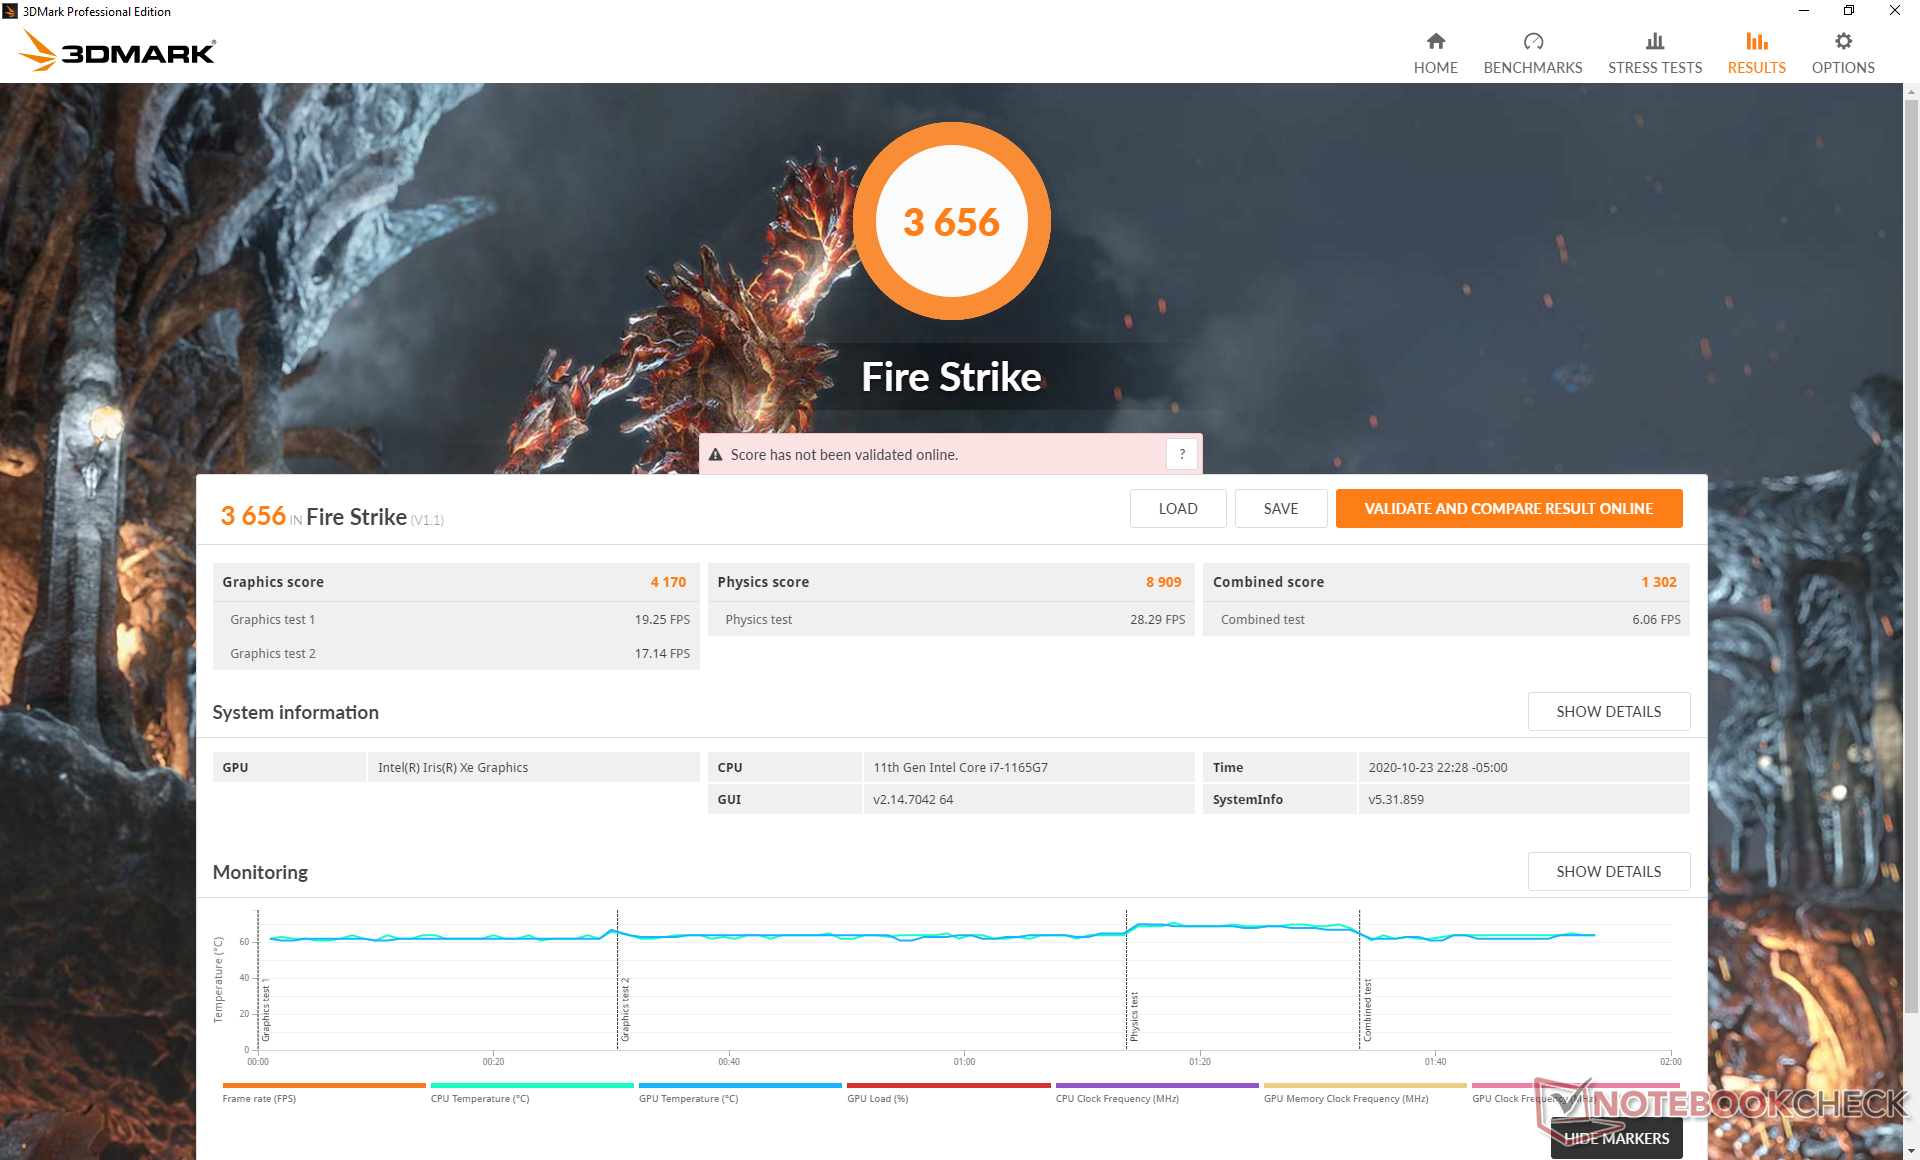
De resultaten van 3DMark zijn indrukwekkend voor een geïntegreerde GPU met scores die 30 tot 35 procent hoger zijn dan zelfs de discrete GeForce MX250 of bijna 50 procent hoger dan de Iris Plus G7 in de XPS 13 9300. Zoals we al hebben bewezen, vertalen deze synthetische resultaten zich echter niet goed naar de echte spelprestaties en dus moeten gebruikers niet verwachten dat de framerates over de hele linie 30 tot 35 procent sneller zijn dan die van een GeForce MX250-laptop. Final Fantasy 15, Strange Brigade, en Witcher 3Bijvoorbeeld, loop sneller op onze XPS 13 9310 dan op de MX250-gestuurde ZenBook 14, terwijl het tegenovergestelde geldt voor DOTA 2 Reborn, X-Plane 11.11, en GTA V.
Merk op dat Dell's Dynamic Tuning een negatief effect heeft op de framerates. Bij stationair draaien Witcher 3 bij de laagste instellingen zou bijvoorbeeld de framerate schommelen tussen 61 en 80 FPS, zoals blijkt uit onderstaande grafiek, terwijl de framerate constanter en stabieler zou zijn op de meeste andere laptops.
Zie onze pagina over de Intel Iris Xe voor meer technische informatie en vergelijkingen van benchmarks. We verwachten dat de algemene gameprestaties in de loop van de tijd zullen verbeteren met behulp van stuurprogramma-updates.
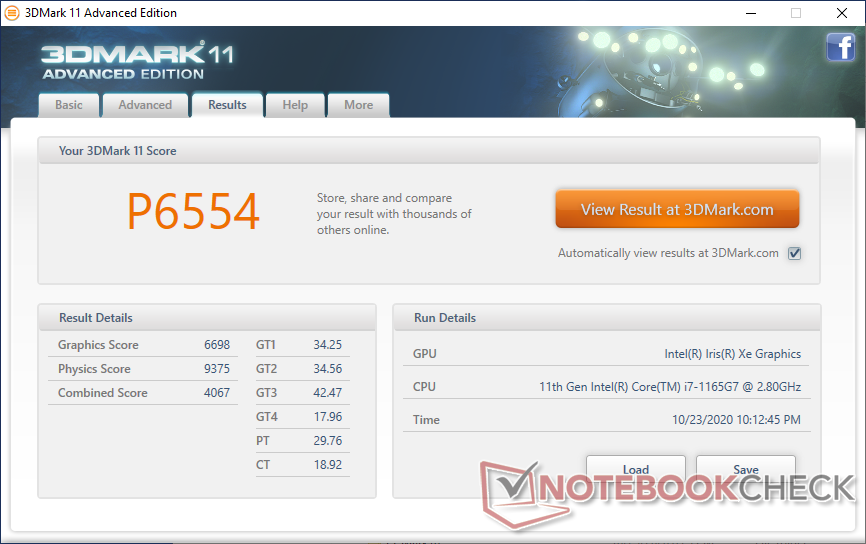
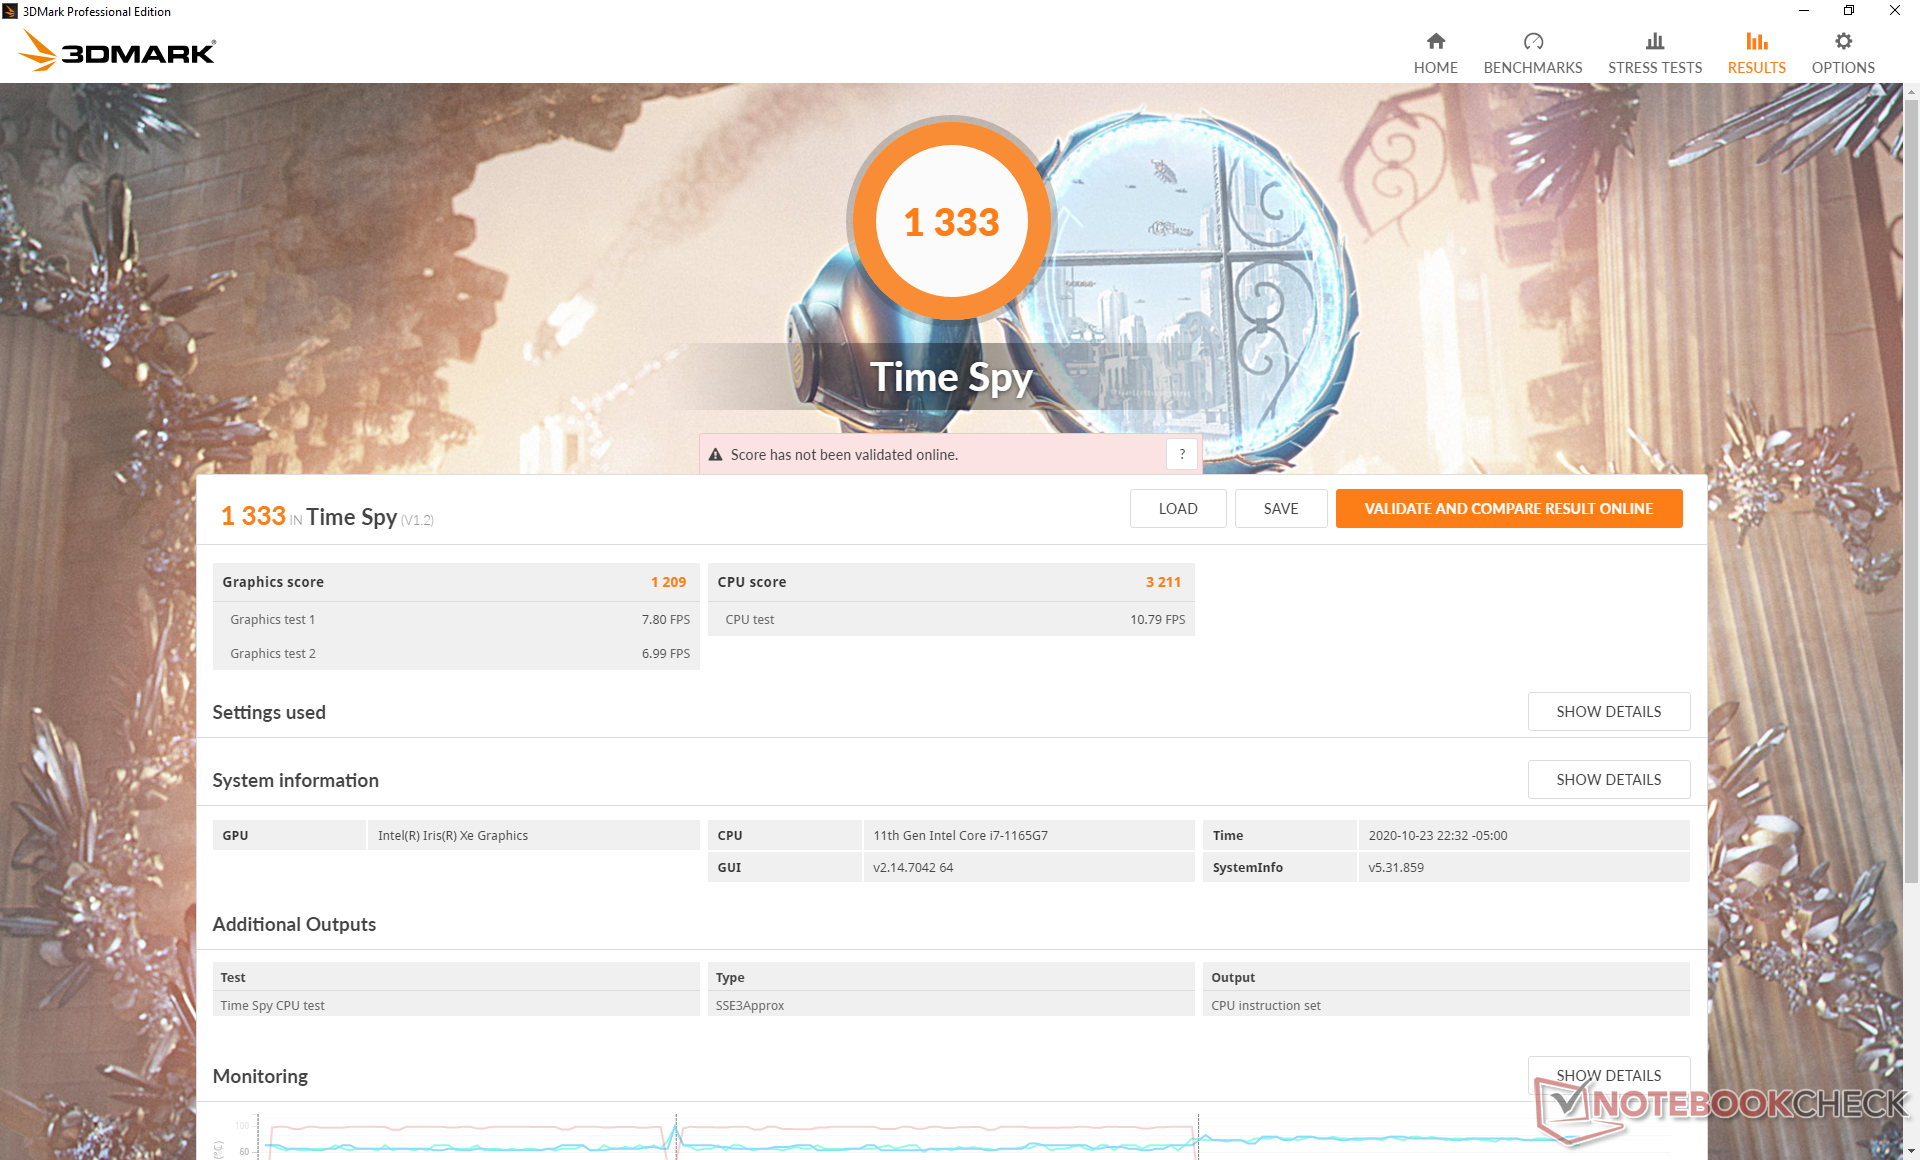
| 3DMark 11 Performance | 6554 punten | |
| 3DMark Cloud Gate Standard Score | 14167 punten | |
| 3DMark Fire Strike Score | 3656 punten | |
| 3DMark Time Spy Score | 1333 punten | |
Help | ||
| Final Fantasy XV Benchmark | |
| 1280x720 Lite Quality | |
| Gemiddeld Intel Iris Xe Graphics G7 96EUs (14.9 - 56.5, n=189) | |
| Lenovo Yoga Slim 7-14ARE | |
| Asus ZenBook 14 UX425EA | |
| Asus ZenBook 14 UX434FL-DB77 | |
| Dell XPS 13 9310 Core i7 FHD | |
| Asus VivoBook Flip 14 TM420IA | |
| Microsoft Surface Laptop Go Core i5 | |
| 1920x1080 Standard Quality | |
| Gemiddeld Intel Iris Xe Graphics G7 96EUs (10.5 - 31.2, n=185) | |
| Asus ZenBook 14 UX425EA | |
| Dell XPS 13 9310 Core i7 FHD | |
| Lenovo Yoga Slim 7-14ARE | |
| Asus ZenBook 14 UX434FL-DB77 | |
| Asus VivoBook Flip 14 TM420IA | |
| Microsoft Surface Laptop Go Core i5 | |
| 1920x1080 High Quality | |
| Gemiddeld Intel Iris Xe Graphics G7 96EUs (8.15 - 27.8, n=178) | |
| Asus ZenBook 14 UX425EA | |
| Dell XPS 13 9310 Core i7 FHD | |
| Lenovo Yoga Slim 7-14ARE | |
| Asus ZenBook 14 UX434FL-DB77 | |
| Asus VivoBook Flip 14 TM420IA | |
| Microsoft Surface Laptop Go Core i5 | |
| Strange Brigade | |
| 1280x720 lowest AF:1 | |
| Dell XPS 13 9310 Core i7 FHD | |
| Gemiddeld Intel Iris Xe Graphics G7 96EUs (48.5 - 115.1, n=172) | |
| Lenovo Yoga Slim 7-14ARE | |
| Asus ZenBook 14 UX425EA | |
| Asus ZenBook 14 UX434FL-DB77 | |
| 1920x1080 medium AA:medium AF:4 | |
| Dell XPS 13 9310 Core i7 FHD | |
| Gemiddeld Intel Iris Xe Graphics G7 96EUs (18.2 - 51.4, n=170) | |
| Asus ZenBook 14 UX425EA | |
| Lenovo Yoga Slim 7-14ARE | |
| Asus ZenBook 14 UX434FL-DB77 | |
| 1920x1080 high AA:high AF:8 | |
| Dell XPS 13 9310 Core i7 FHD | |
| Gemiddeld Intel Iris Xe Graphics G7 96EUs (15.4 - 39.8, n=169) | |
| Asus ZenBook 14 UX425EA | |
| Lenovo Yoga Slim 7-14ARE | |
| Asus ZenBook 14 UX434FL-DB77 | |
| lage | gem. | hoge | ultra | |
|---|---|---|---|---|
| GTA V (2015) | 84.3 | 76.8 | 24.7 | 10.5 |
| The Witcher 3 (2015) | 97.7 | 58.4 | 32.7 | 14.3 |
| Dota 2 Reborn (2015) | 77.5 | 54.3 | 40.5 | 42.5 |
| Final Fantasy XV Benchmark (2018) | 33.7 | 19.6 | 15.4 | |
| X-Plane 11.11 (2018) | 48 | 37.3 | 32.5 | |
| Strange Brigade (2018) | 94.4 | 38.5 | 30.4 | 24 |
Emissions
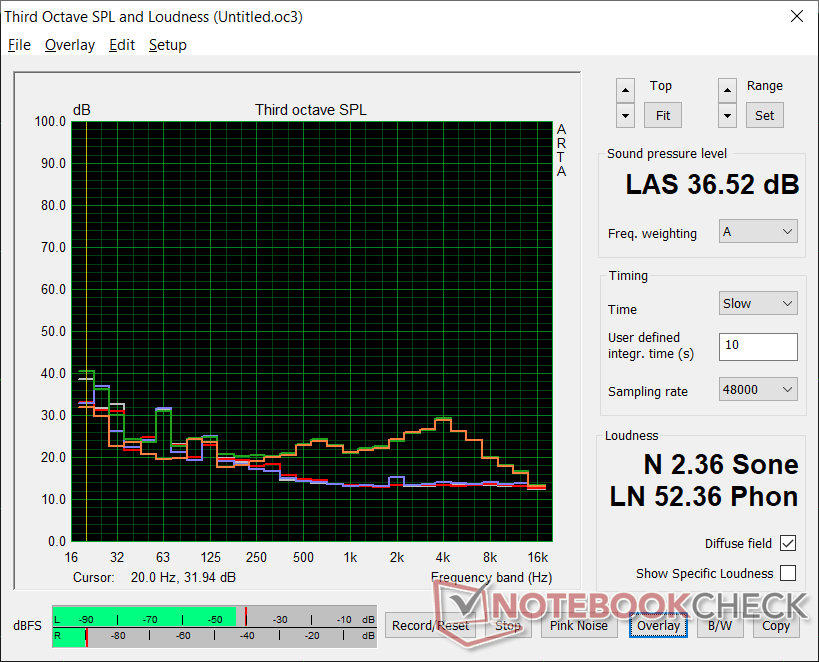
Systeemgeluid
De geluidskarakteristieken van de ventilator zijn grotendeels hetzelfde in vergelijking met de XPS 9300. Het belangrijkste is dat het toerental van de ventilator constant is, ondanks de steeds veranderende CPU-kloksnelheid bij hoge belasting. Het systeem is in staat om bijna volledig stil te blijven, zelfs gedurende de gehele eerste 90-seconden benchmark scene van 3DMark 06.
| Dell XPS 13 9310 Core i7 FHD Iris Xe G7 96EUs, i7-1165G7, Micron 2300 512GB MTFDHBA512TDV | Dell XPS 13 9300 Core i7-1065G7 Iris Plus Graphics G7 (Ice Lake 64 EU), i7-1065G7, Intel SSDPEMKF512G8 NVMe SSD | Apple MacBook Pro 13 2020 2GHz i5 10th-Gen Iris Plus Graphics G7 (Ice Lake 64 EU), i5-1038NG7, Apple SSD SM0512F | Huawei MateBook X Pro 2020 i7 GeForce MX250, i7-10510U, Samsung PM981a MZVLB1T0HBLR | Lenovo Yoga Slim 7-14ARE Vega 8, R7 4800U, Samsung SSD PM981a MZVLB512HBJQ | |
|---|---|---|---|---|---|
| Noise | -11% | -15% | -16% | -4% | |
| uit / omgeving * (dB) | 25.7 | 28.3 -10% | 29.6 -15% | 29.6 -15% | 26.3 -2% |
| Idle Minimum * (dB) | 25.7 | 28.3 -10% | 29.6 -15% | 29.6 -15% | 26.5 -3% |
| Idle Average * (dB) | 25.7 | 28.3 -10% | 29.6 -15% | 29.6 -15% | 26.5 -3% |
| Idle Maximum * (dB) | 25.9 | 28.3 -9% | 29.6 -14% | 30.3 -17% | 26.5 -2% |
| Load Average * (dB) | 26.2 | 32.5 -24% | 34.4 -31% | 38 -45% | 31.8 -21% |
| Witcher 3 ultra * (dB) | 36.5 | 39.3 -8% | 36.1 1% | 38 -4% | 35.9 2% |
| Load Maximum * (dB) | 36.6 | 39.3 -7% | 42.1 -15% | 38 -4% | 35.9 2% |
* ... kleiner is beter
Geluidsniveau
| Onbelast |
| 25.7 / 25.7 / 25.9 dB (A) |
| Belasting |
| 26.2 / 36.6 dB (A) |
 | ||
30 dB stil 40 dB(A) hoorbaar 50 dB(A) luid |
||
min: | ||
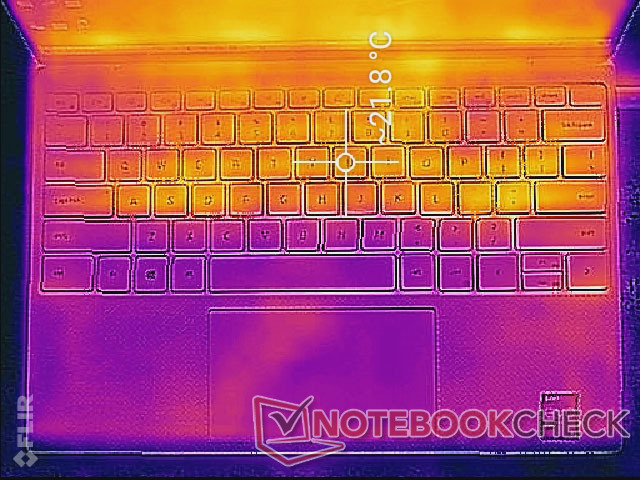
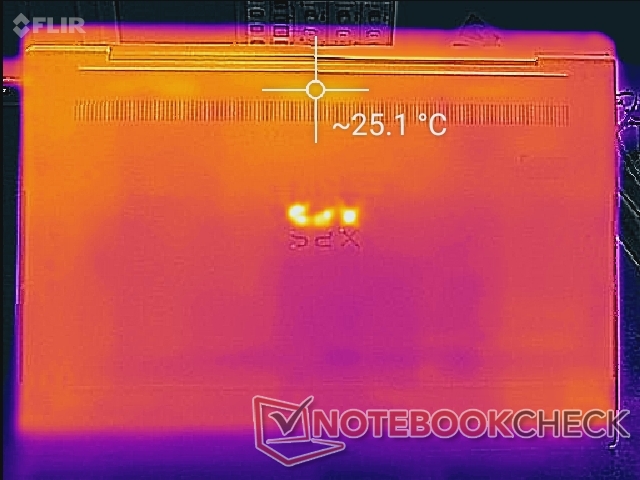
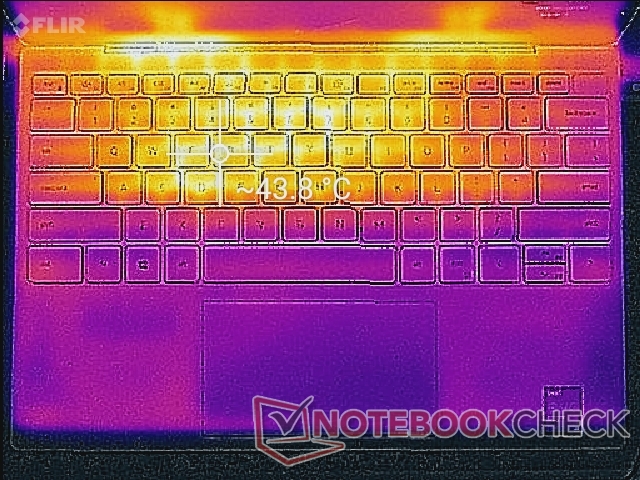
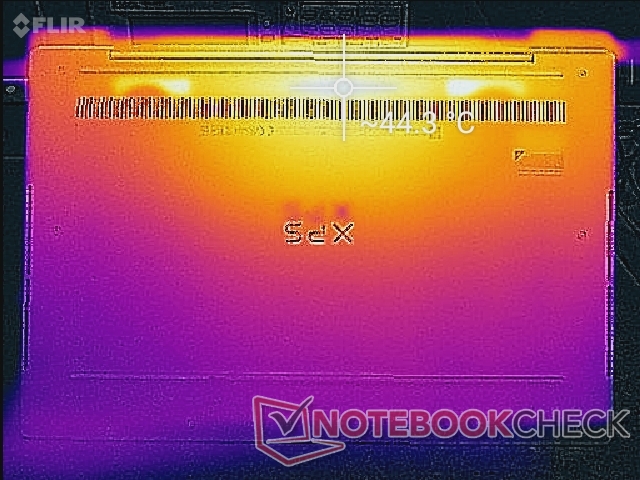
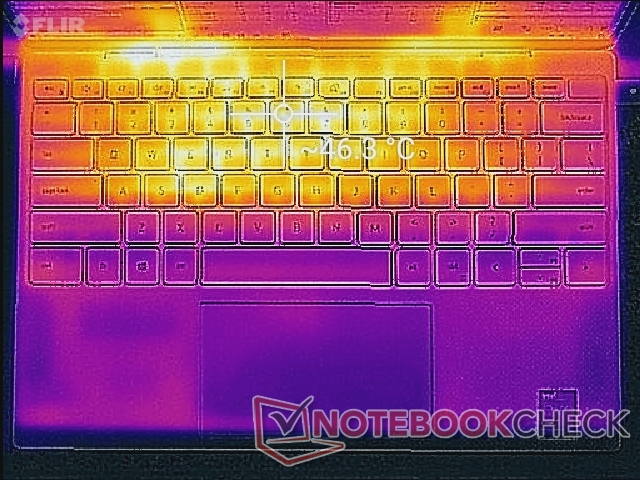
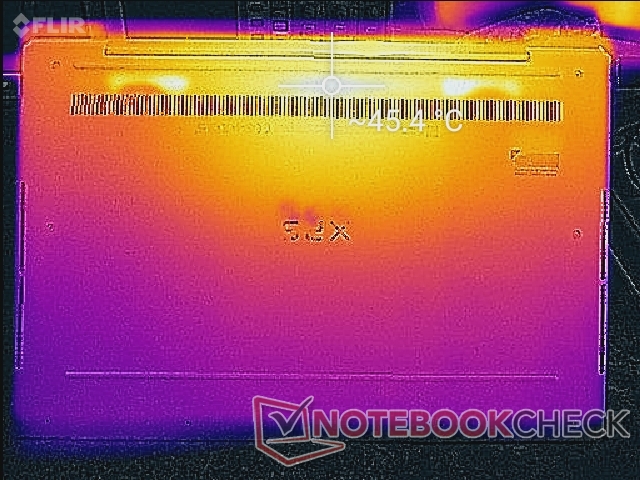
Temperatuur
De oppervlaktetemperaturen zijn bijna identiek aan de XPS 13 9300 van vorig jaar, ondanks de sprong naar een nieuwere generatie processor met snellere geïntegreerde graphics. In tegenstelling tot de meeste goedkopere Ultrabooks die slechts één interne ventilator hebben, integreert de Dell er twee voor een meer symmetrisch temperatuurprofiel.
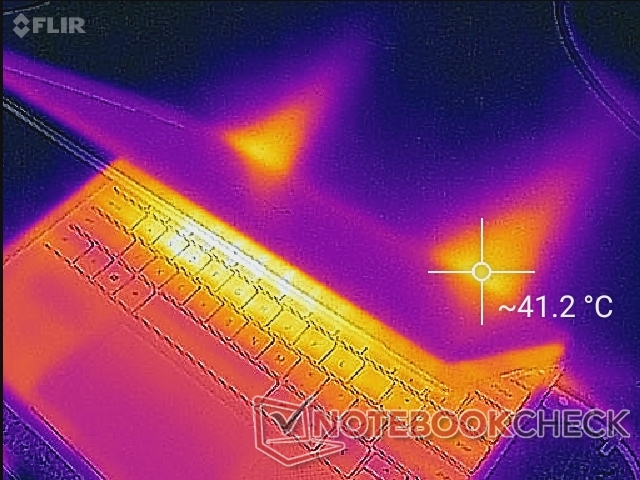
(-) De maximumtemperatuur aan de bovenzijde bedraagt 46.2 °C / 115 F, vergeleken met het gemiddelde van 35.9 °C / 97 F, variërend van 21.4 tot 59 °C voor de klasse Subnotebook.
(-) De bodem warmt op tot een maximum van 46 °C / 115 F, vergeleken met een gemiddelde van 39.2 °C / 103 F
(+) Bij onbelast gebruik bedraagt de gemiddelde temperatuur voor de bovenzijde 20.7 °C / 69 F, vergeleken met het apparaatgemiddelde van 30.8 °C / 87 F.
(±) Bij het spelen van The Witcher 3 is de gemiddelde temperatuur voor de bovenzijde 34.2 °C / 94 F, vergeleken met het apparaatgemiddelde van 30.8 °C / 87 F.
(+) De handpalmsteunen en het touchpad bereiken maximaal de huidtemperatuur (32 °C / 89.6 F) en zijn dus niet heet.
(-) De gemiddelde temperatuur van de handpalmsteun van soortgelijke toestellen bedroeg 28.2 °C / 82.8 F (-3.8 °C / -6.8 F).
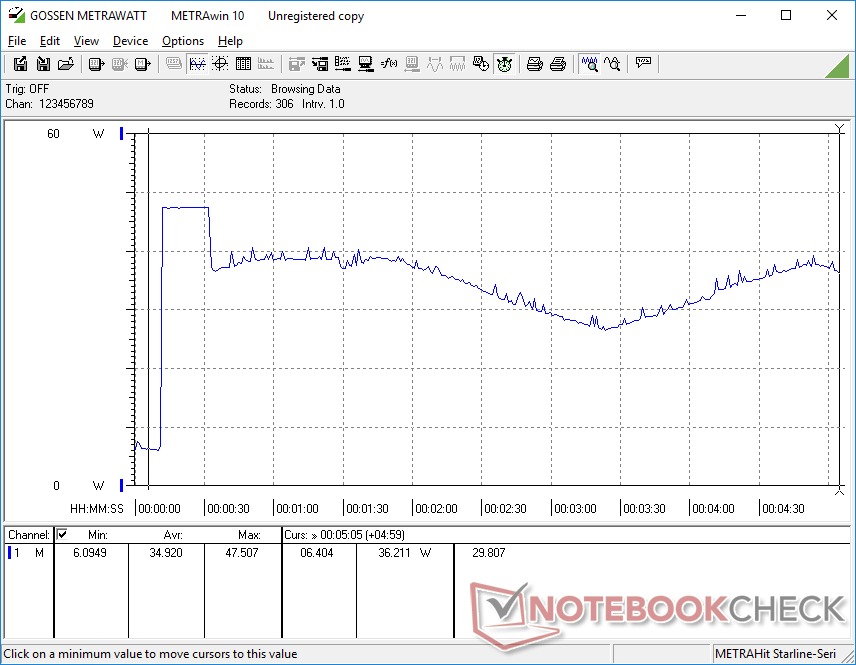
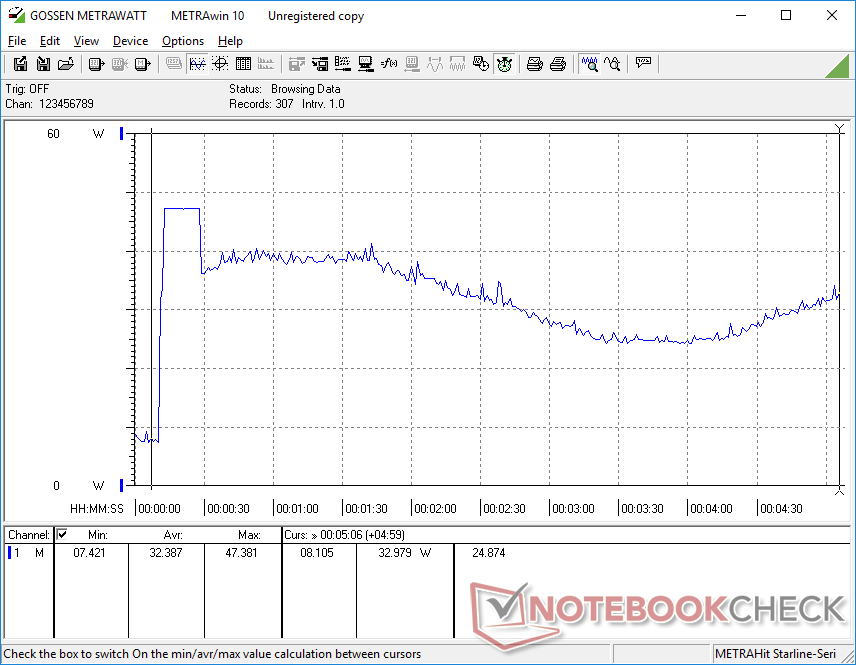
Stresstest
Running Prime95 onthult waarom onze opgenomen CineBench-scores en framerates hierboven onstandvastig zijn. De kloksnelheid zou tijdens de eerste paar seconden van het testen eerst stijgen tot 4,1 GHz, maar daarna zou hij beginnen te fietsen tussen 2,5 GHz en 3,1 GHz en 71 C tot 78 C, respectievelijk, vergeleken met een vlakke 2,3 GHz en 68 C op de Asus ZenBook 14 UX425 met dezelfde Core i7-1165G7-processor. Met andere woorden, de Dynamic Tuning van Dell zorgt voor snellere prestaties ten koste van consistente kloksnelheden en temperaturen. Deze aanpak kan nuttig zijn bij het uitvoeren van CPU-zware taken, maar het kan een nachtmerrie zijn voor games.
Als voorbeeld, draaien Witcher 3 bij lage instellingen zou dit resulteren in fietsende CPU- en GPU-kloksnelheden tussen 1,4 GHz tot 2,0 GHz en 850 MHz tot 1100 MHz, respectievelijk voor ongelijkmatige framerates. Het inschakelen van v-sync kan de ongelijkmatige framerates verlichten, afhankelijk van het spel en de instellingen.
Het draaien op batterijvoeding zal de grafische prestaties meer beïnvloeden dan de prestaties van de CPU. Een 3DMark 11-test op batterijen zou een score van respectievelijk 10904 en 6093 punten opleveren, vergeleken met 9375 en 6698 punten op het lichtnet.
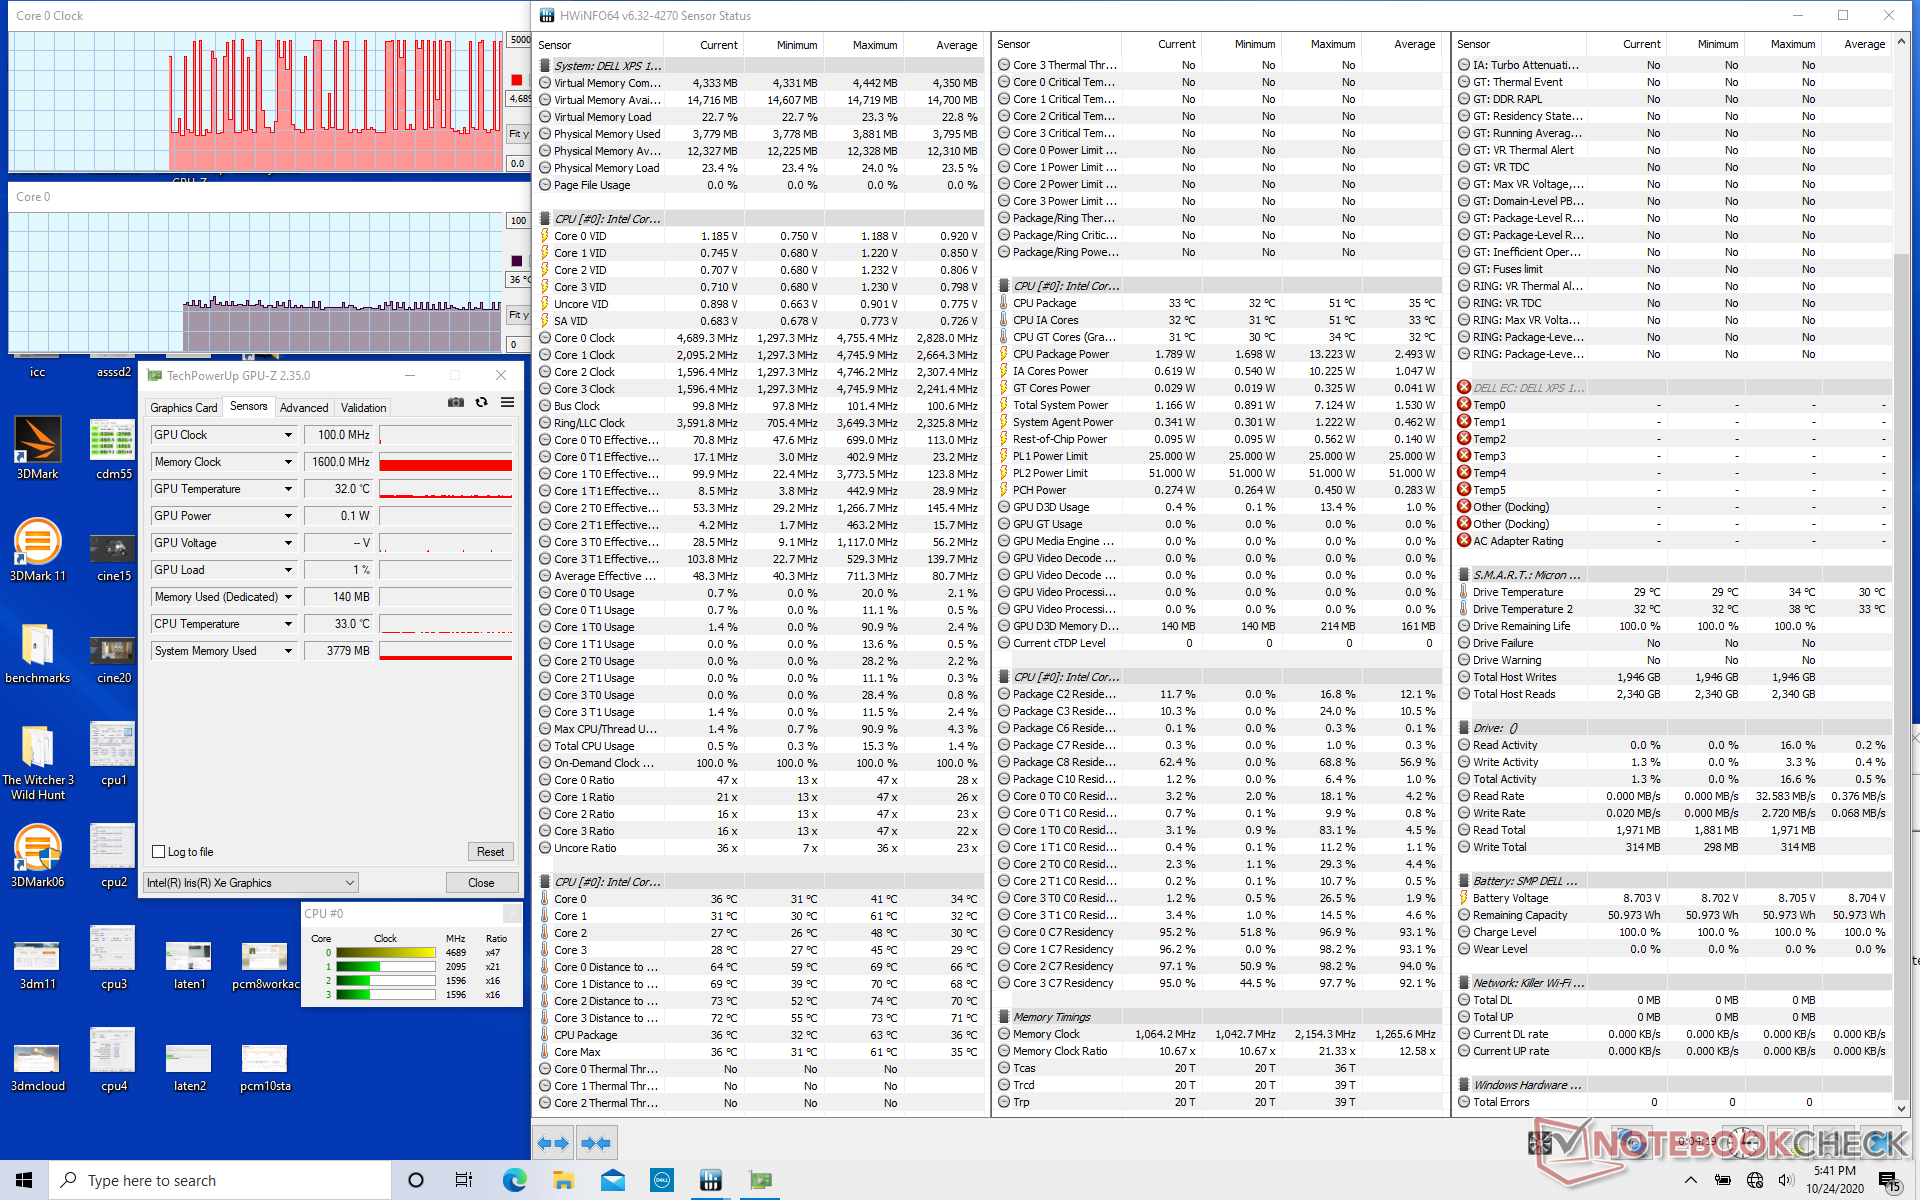
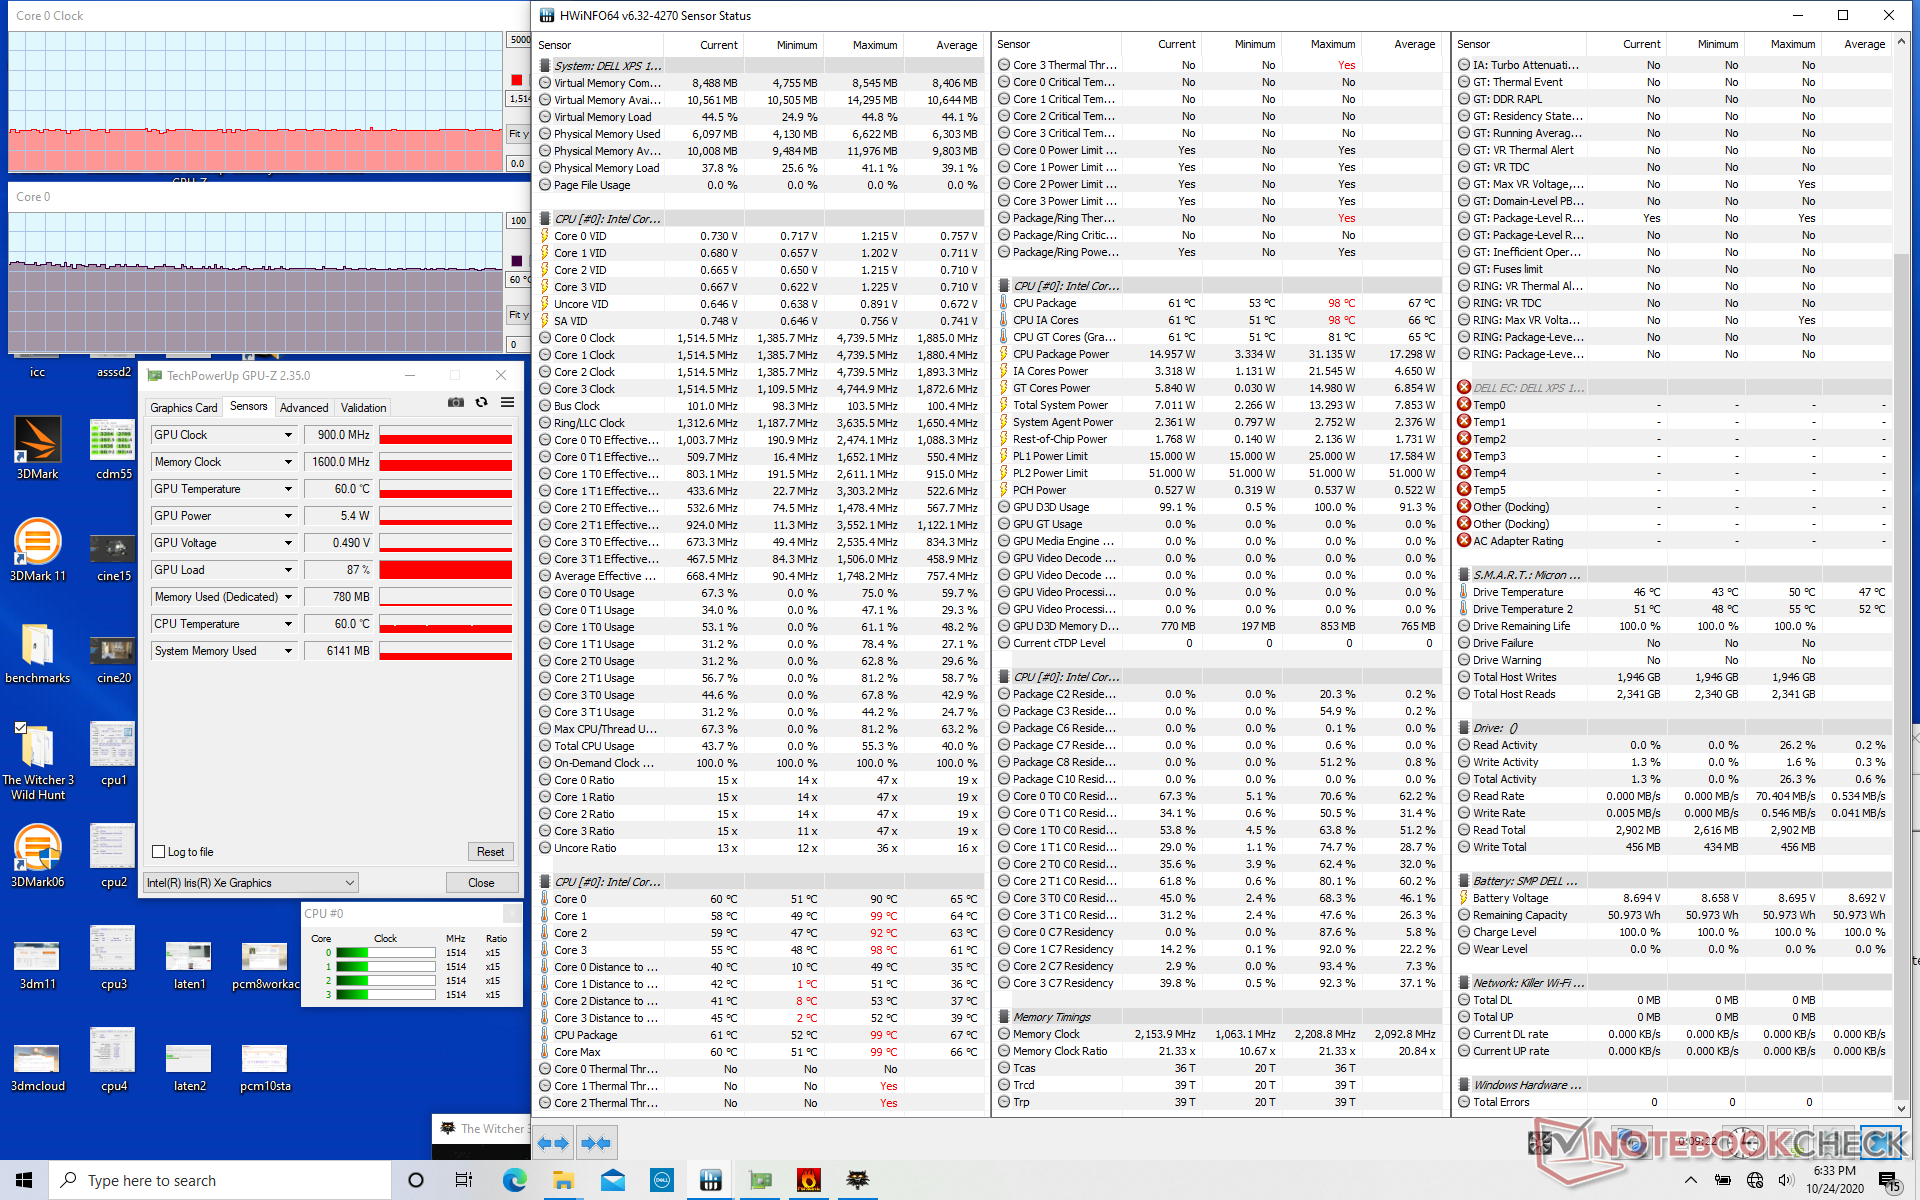
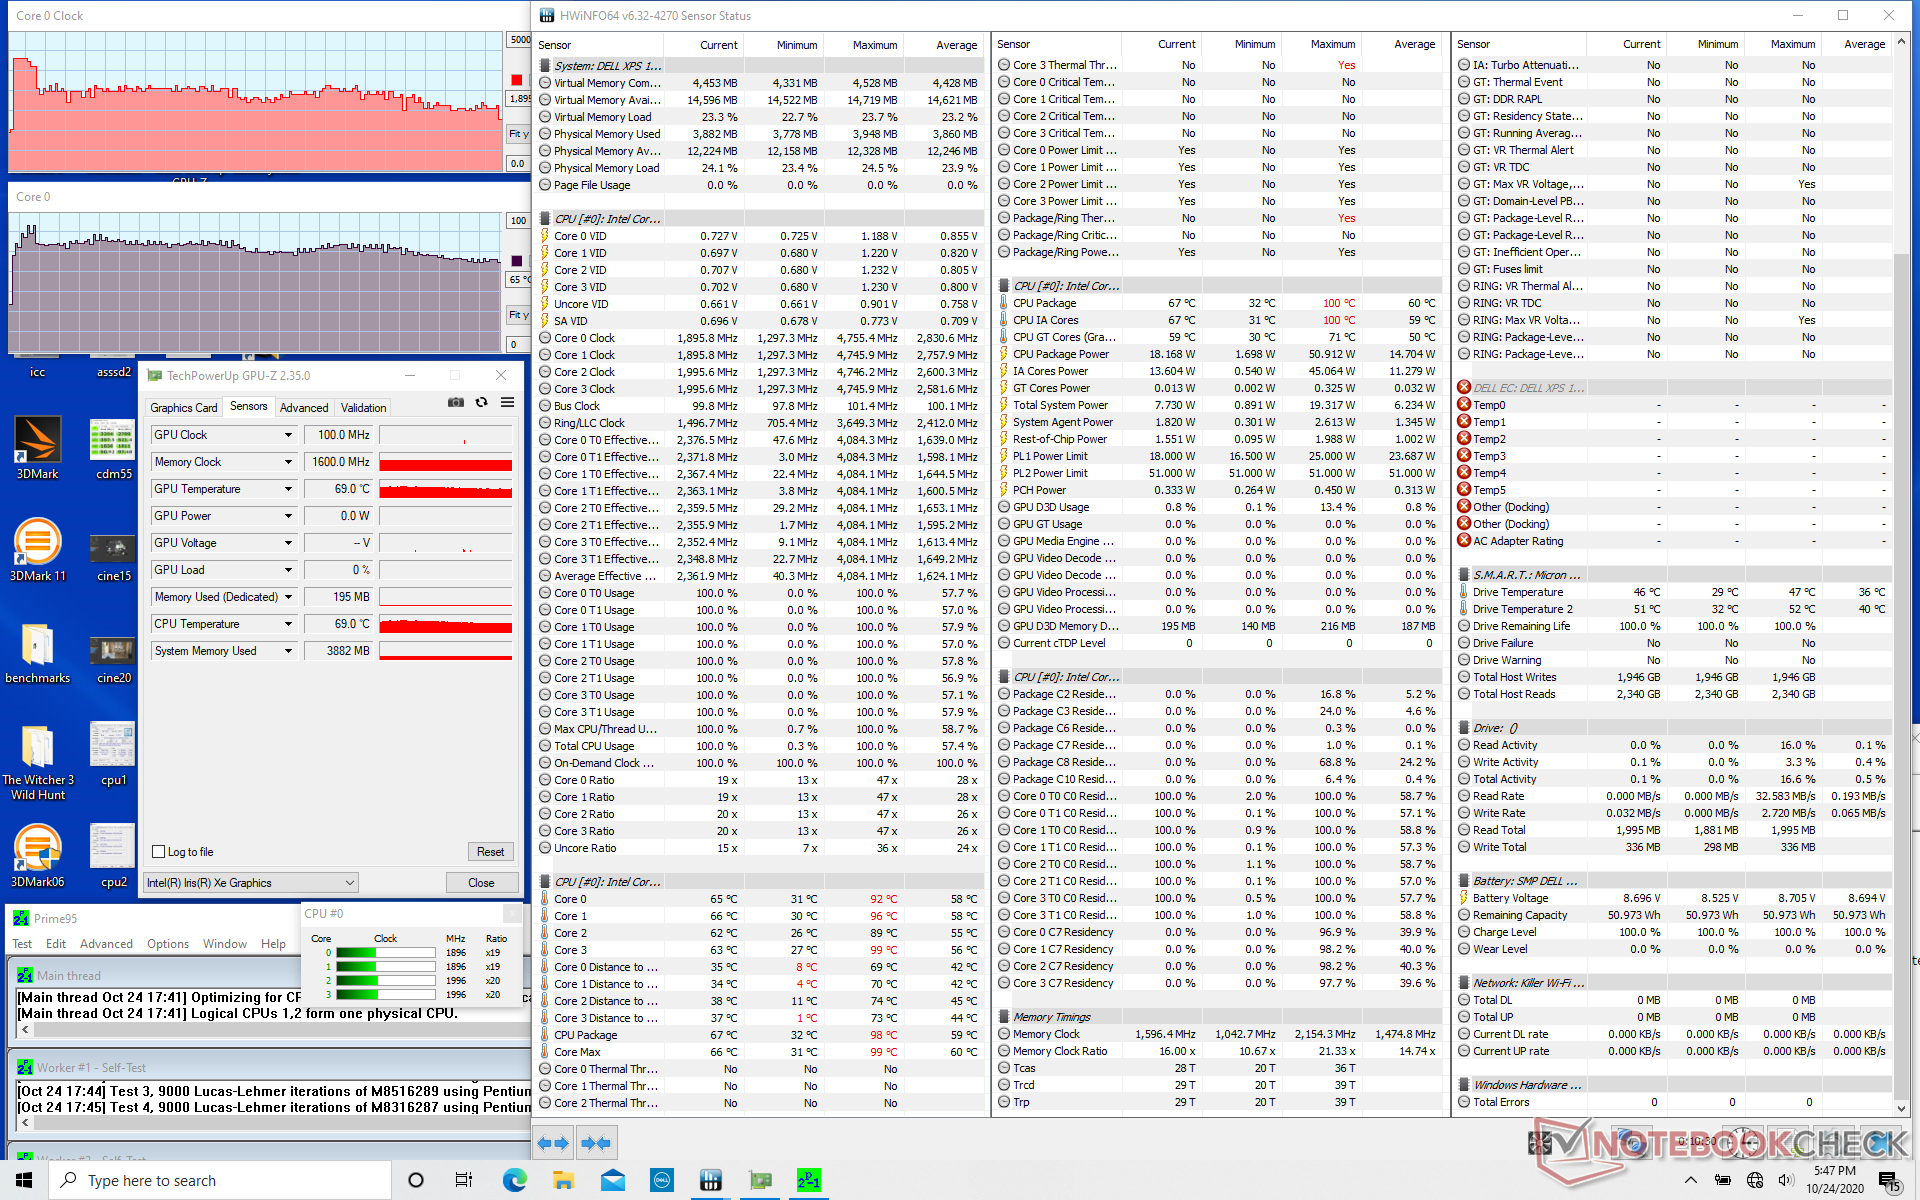
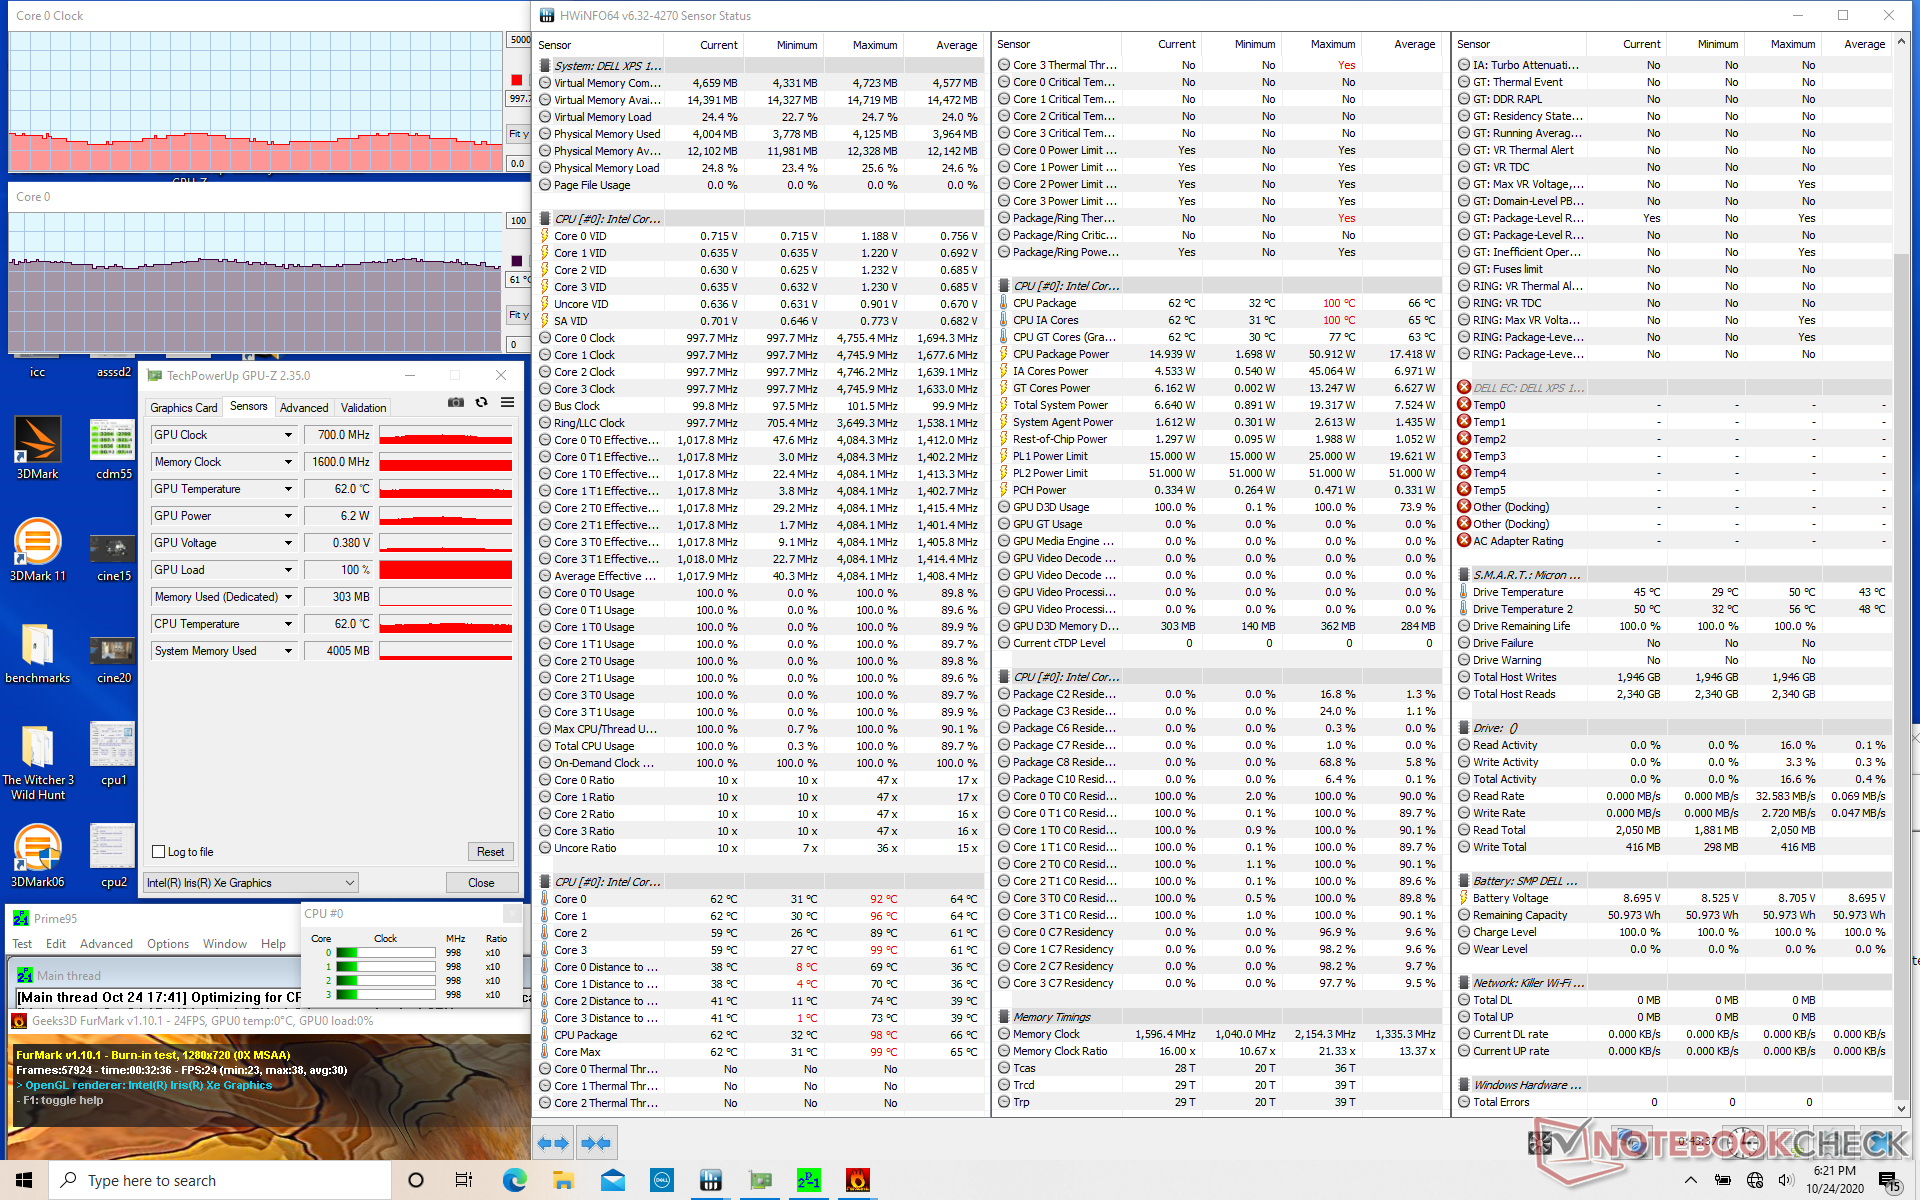
| CPUKlok (GHz) | GPUKlok (MHz) | GemiddeldeCPU-temperatuur (°C) | |
| System Idle | -- | --36 | |
| Prime95 Stress | 2.5 - 3.1 | --71 - 78 | |
| Prime95 + FurMark Stress | 1.2 - 1.6 | 700 - 850 | 61 - 69 |
| Witcher 3 Stress1.4 - 2.0 | 850 - 1100 | 61 - 65 |
Luidsprekers


Dell XPS 13 9310 Core i7 FHD audioanalyse
(+) | luidsprekers kunnen relatief luid spelen (84.6 dB)
Bas 100 - 315 Hz
(-) | bijna geen lage tonen - gemiddeld 16.1% lager dan de mediaan
(±) | lineariteit van de lage tonen is gemiddeld (13.1% delta ten opzichte van de vorige frequentie)
Midden 400 - 2000 Hz
(+) | evenwichtige middens - slechts 2.6% verwijderd van de mediaan
(+) | de middentonen zijn lineair (4.6% delta ten opzichte van de vorige frequentie)
Hoog 2 - 16 kHz
(+) | evenwichtige hoogtepunten - slechts 1.3% verwijderd van de mediaan
(+) | de hoge tonen zijn lineair (4% delta naar de vorige frequentie)
Algemeen 100 - 16.000 Hz
(+) | het totale geluid is lineair (10.7% verschil met de mediaan)
Vergeleken met dezelfde klasse
» 9% van alle geteste apparaten in deze klasse waren beter, 3% vergelijkbaar, 88% slechter
» De beste had een delta van 5%, het gemiddelde was 18%, de slechtste was 53%
Vergeleken met alle geteste toestellen
» 6% van alle geteste apparaten waren beter, 2% gelijk, 93% slechter
» De beste had een delta van 4%, het gemiddelde was 24%, de slechtste was 134%
Apple MacBook 12 (Early 2016) 1.1 GHz audioanalyse
(+) | luidsprekers kunnen relatief luid spelen (83.6 dB)
Bas 100 - 315 Hz
(±) | verminderde zeebaars - gemiddeld 11.3% lager dan de mediaan
(±) | lineariteit van de lage tonen is gemiddeld (14.2% delta ten opzichte van de vorige frequentie)
Midden 400 - 2000 Hz
(+) | evenwichtige middens - slechts 2.4% verwijderd van de mediaan
(+) | de middentonen zijn lineair (5.5% delta ten opzichte van de vorige frequentie)
Hoog 2 - 16 kHz
(+) | evenwichtige hoogtepunten - slechts 2% verwijderd van de mediaan
(+) | de hoge tonen zijn lineair (4.5% delta naar de vorige frequentie)
Algemeen 100 - 16.000 Hz
(+) | het totale geluid is lineair (10.2% verschil met de mediaan)
Vergeleken met dezelfde klasse
» 7% van alle geteste apparaten in deze klasse waren beter, 2% vergelijkbaar, 91% slechter
» De beste had een delta van 5%, het gemiddelde was 18%, de slechtste was 53%
Vergeleken met alle geteste toestellen
» 5% van alle geteste apparaten waren beter, 1% gelijk, 94% slechter
» De beste had een delta van 4%, het gemiddelde was 24%, de slechtste was 134%
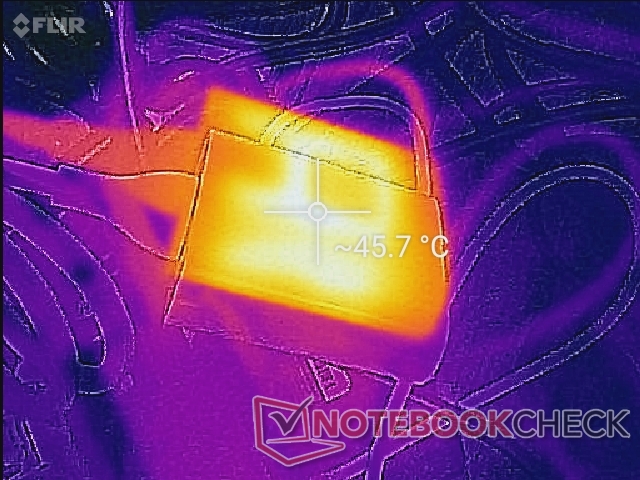
Energy Management
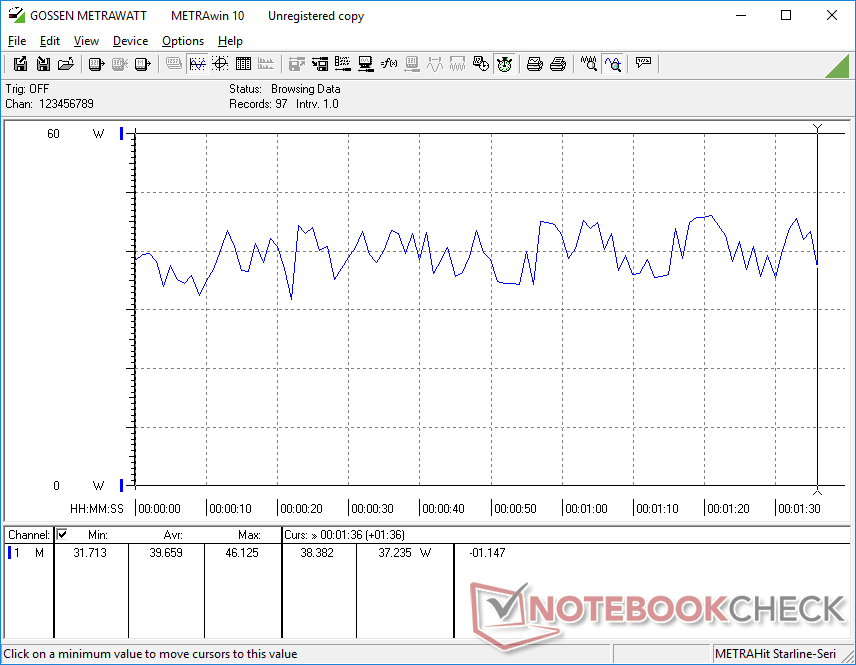
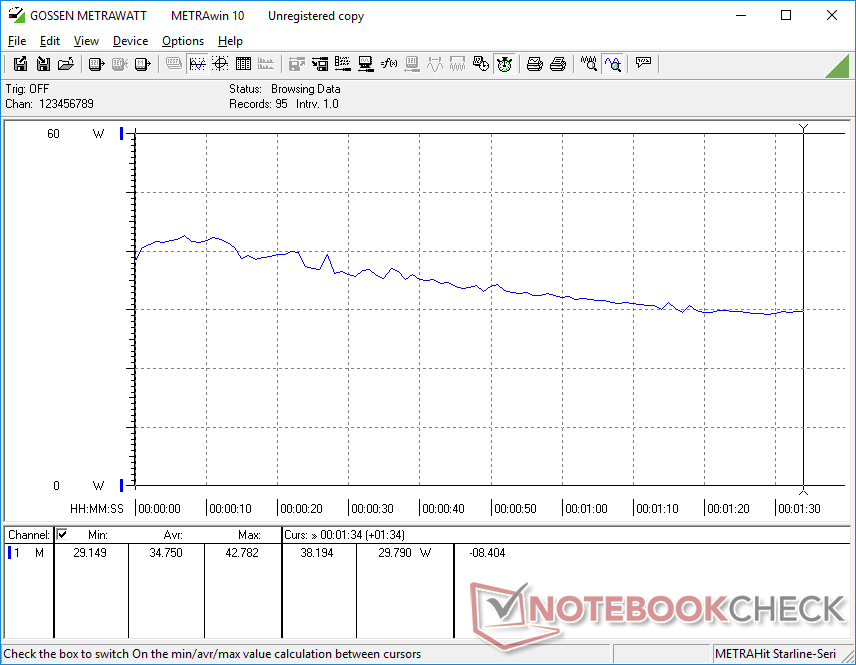
Stroomverbruik
Onze Tiger Lake unit vereist ongeveer evenveel kracht als de oudere Ice Lake unit, ondanks de gen-naar-generatie verbeteringen in de geïntegreerde graphics. Zo is de Iris Xe G7 in staat om extra grafische prestaties te leveren voor "gratis" zonder dat er meer uit het stopcontact hoeft te worden gehaald.
De prestaties per watt zijn uitstekend in vergelijking met concurrerende systemen met de GeForce MX250 of Radeon Vega 8 zoals de MateBook X Pro of Lenovo Yoga Slim 7, die elk ongeveer 10 W tot 15 W meer verbruiken wanneer ze aan vergelijkbare veeleisende belastingen worden onderworpen
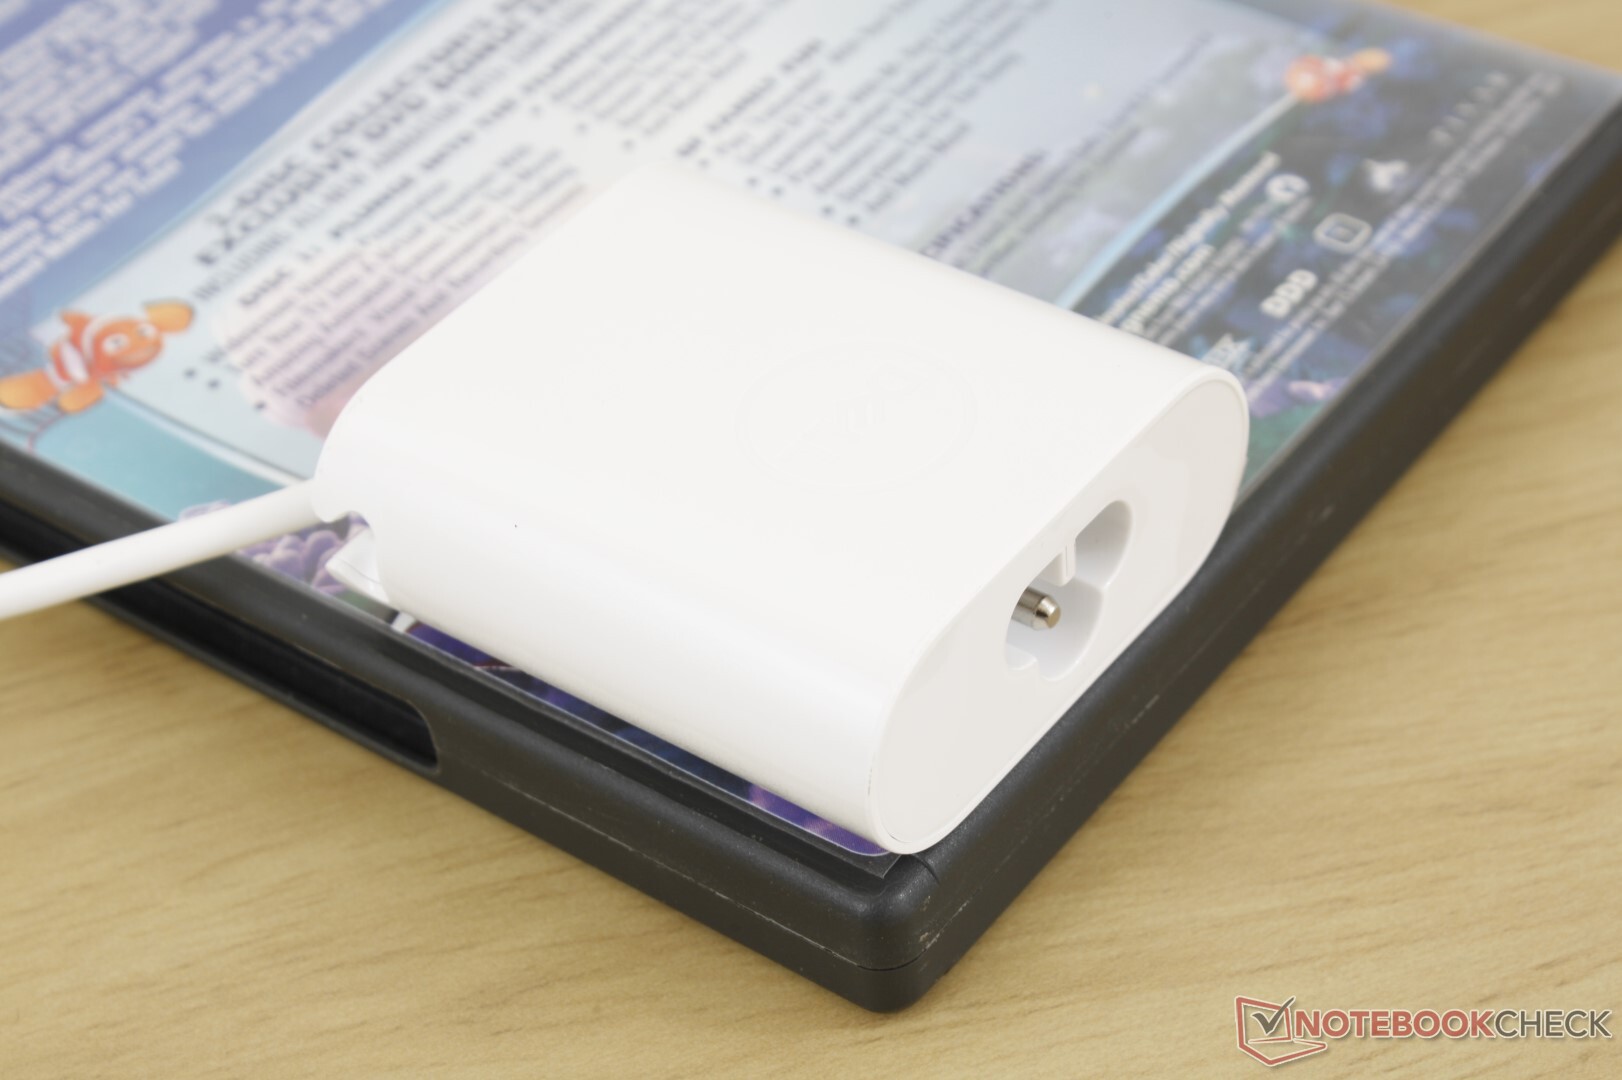
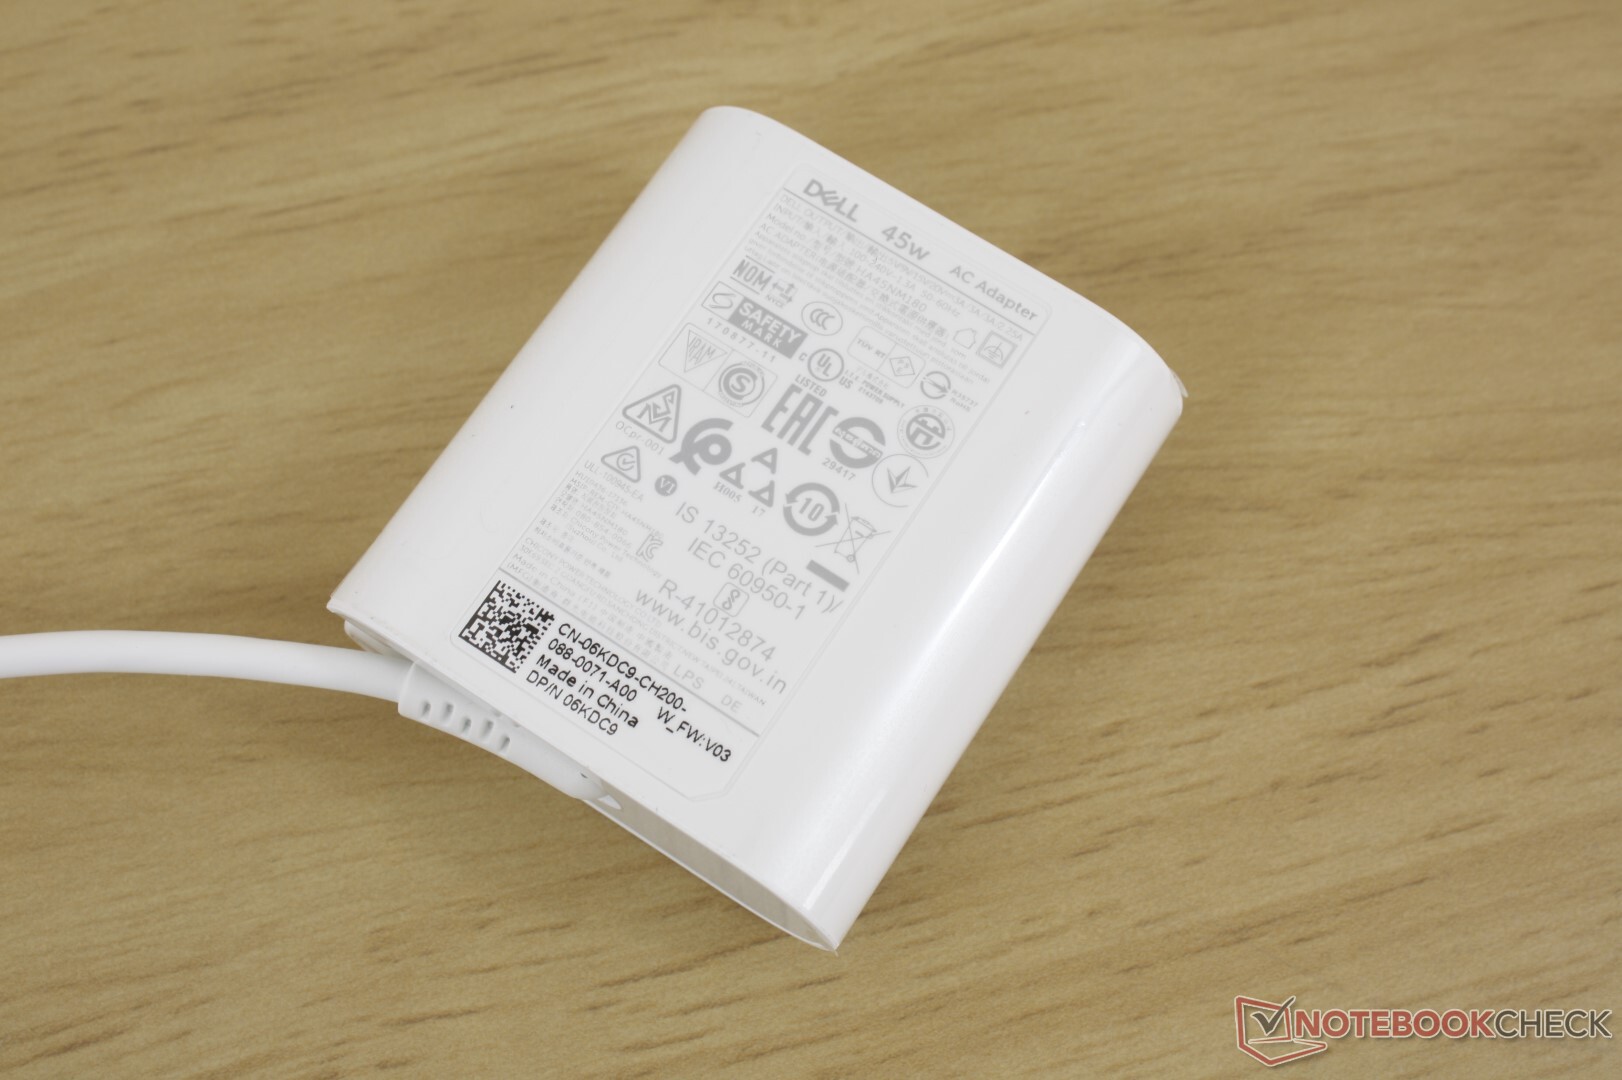
We kunnen een maximaal verbruik van 47,5 W meten van de kleine (~6,0 x 5,5 x 2,2 cm) 45 W AC-adapter. De systeembatterij wordt nog steeds opgeladen, aangezien dit maximumtarief niet stabiel is, zoals blijkt uit onze onderstaande grafieken.
| Uit / Standby | |
| Inactief | |
| Belasting |
|
Key:
min: | |
| Dell XPS 13 9310 Core i7 FHD i7-1165G7, Iris Xe G7 96EUs, Micron 2300 512GB MTFDHBA512TDV, IPS, 1920x1200, 13.4" | Dell XPS 13 9300 Core i7-1065G7 i7-1065G7, Iris Plus Graphics G7 (Ice Lake 64 EU), Intel SSDPEMKF512G8 NVMe SSD, IPS, 1920x1200, 13.4" | Apple MacBook Pro 13 2020 2GHz i5 10th-Gen i5-1038NG7, Iris Plus Graphics G7 (Ice Lake 64 EU), Apple SSD SM0512F, IPS, 2560x1600, 13.3" | Huawei MateBook X Pro 2020 i7 i7-10510U, GeForce MX250, Samsung PM981a MZVLB1T0HBLR, LTPS, 3000x2000, 13.9" | Lenovo Yoga Slim 7-14ARE R7 4800U, Vega 8, Samsung SSD PM981a MZVLB512HBJQ, IPS, 1920x1080, 14" | HP Spectre x360 13-aw0013dx i7-1065G7, Iris Plus Graphics G7 (Ice Lake 64 EU), Intel Optane Memory H10 with Solid State Storage 32GB + 512GB HBRPEKNX0202A(L/H), IPS, 1920x1080, 13.3" | |
|---|---|---|---|---|---|---|
| Power Consumption | -6% | -36% | -41% | -19% | 1% | |
| Idle Minimum * (Watt) | 3.9 | 4.2 -8% | 3.8 3% | 4.3 -10% | 4 -3% | 3.9 -0% |
| Idle Average * (Watt) | 5.9 | 6.9 -17% | 8.6 -46% | 8.5 -44% | 6.3 -7% | 6.3 -7% |
| Idle Maximum * (Watt) | 6.3 | 7.5 -19% | 10.3 -63% | 12 -90% | 7.7 -22% | 6.8 -8% |
| Load Average * (Watt) | 39.7 | 33.3 16% | 52.1 -31% | 54.8 -38% | 48.3 -22% | 32.6 18% |
| Witcher 3 ultra * (Watt) | 34.8 | 37.1 -7% | 48.2 -39% | 47.1 -35% | 49 -41% | 25.6 26% |
| Load Maximum * (Watt) | 47.5 | 48.4 -2% | 65.2 -37% | 61.5 -29% | 57.6 -21% | 59 -24% |
* ... kleiner is beter
Levensduur van de batterij
Runtimes zijn niet zo verschillend van de XPS 13 9300. Ze kunnen zelfs iets korter zijn volgens onze eigen tests. Desalniettemin zouden 11 uur real-world WLAN-gebruik meer dan genoeg moeten zijn voor de meeste gebruikers.
Het opladen van lege naar volle capaciteit duurt iets meer dan 2 uur, vergeleken met 1,5 uur op de meeste andere Ultrabooks.
| Dell XPS 13 9310 Core i7 FHD i7-1165G7, Iris Xe G7 96EUs, 52 Wh | Dell XPS 13 9300 Core i7-1065G7 i7-1065G7, Iris Plus Graphics G7 (Ice Lake 64 EU), 52 Wh | Apple MacBook Pro 13 2020 2GHz i5 10th-Gen i5-1038NG7, Iris Plus Graphics G7 (Ice Lake 64 EU), 58 Wh | Huawei MateBook X Pro 2020 i7 i7-10510U, GeForce MX250, 57.4 Wh | Lenovo Yoga Slim 7-14ARE R7 4800U, Vega 8, 61 Wh | HP Spectre x360 13-aw0013dx i7-1065G7, Iris Plus Graphics G7 (Ice Lake 64 EU), 60 Wh | |
|---|---|---|---|---|---|---|
| Batterijduur | 15% | 10% | -15% | -25% | -1% | |
| Reader / Idle (h) | 30 | 27.1 -10% | 37.1 24% | |||
| WiFi v1.3 (h) | 11 | 12.7 15% | 12.1 10% | 10.4 -5% | 10.3 -6% | 9.9 -10% |
| Load (h) | 3.2 | 2.4 -25% | 1.3 -59% | 2.7 -16% |
Pro
Contra
Uitspraak
Als je al in het bezit bent van een Ice Lake laptop, dan is er niet veel reden om te upgraden naar Tiger Lake. De algemene systeemprestaties zijn niet merkbaar beter dan die van de XPS 13 9300, die nog geen jaar oud is. De belangrijkste uitzondering heeft betrekking op de grafische prestaties, aangezien de geïntegreerde Iris Xe veel sneller is dan de Iris Plus G7, zonder dat er meer vermogen wordt gevraagd of dat er harder of heter moet worden gedraaid. Dit is vooral aantrekkelijk voor video- of grafische editors die weten dat ze de GPU kunnen benutten om het maximale uit de XPS 13 9310 en zijn nieuwe processor te halen.
Voor alle anderen zal de minder dure XPS 13 9300 meer dan genoeg zijn, vooral omdat het prestatiegat van de CPU tussen 10th gen Core i7 en 11th gen Core i7 marginaal is. Het sterkste voordeel van Tiger Lake, dat de nieuwe geïntegreerde GPU is, is niet erg nuttig voor gamers hier, behalve voor casual spelers, omdat de framerates minder stabiel en soms zelfs trager zijn dan de beproefde GeForce MX150/MX250-serie. Bovendien wordt dit feit alleen maar bevestigd door de gemiddelde weergavetijden en het gebrek aan adaptieve synchronisatie. Het zou mooi zijn om verbeteringen te zien op deze specifieke gebieden of in ieder geval een webcam-luik voor toekomstige modelrevisies. Een software-optie om dynamisch af te stemmen ten gunste van consistente kloksnelheden zou ook mooi zijn.
Kun je niet kiezen tussen de XPS 13 9300 of 9310? Voor tekstverwerking, videostreaming en casual gaming zal de XPS 13 9300 net zo snel aanvoelen als de 9310. Voor redacteuren en grafische intensieve toepassingen buiten de gokwereld zou het extra GPU-vermogen en de hoge prestaties per watt van Iris Xe nuttig moeten zijn.
Dell XPS 13 9310 Core i7 FHD
- 28-10-2020 v7 (old)
Allen Ngo
Price comparison

