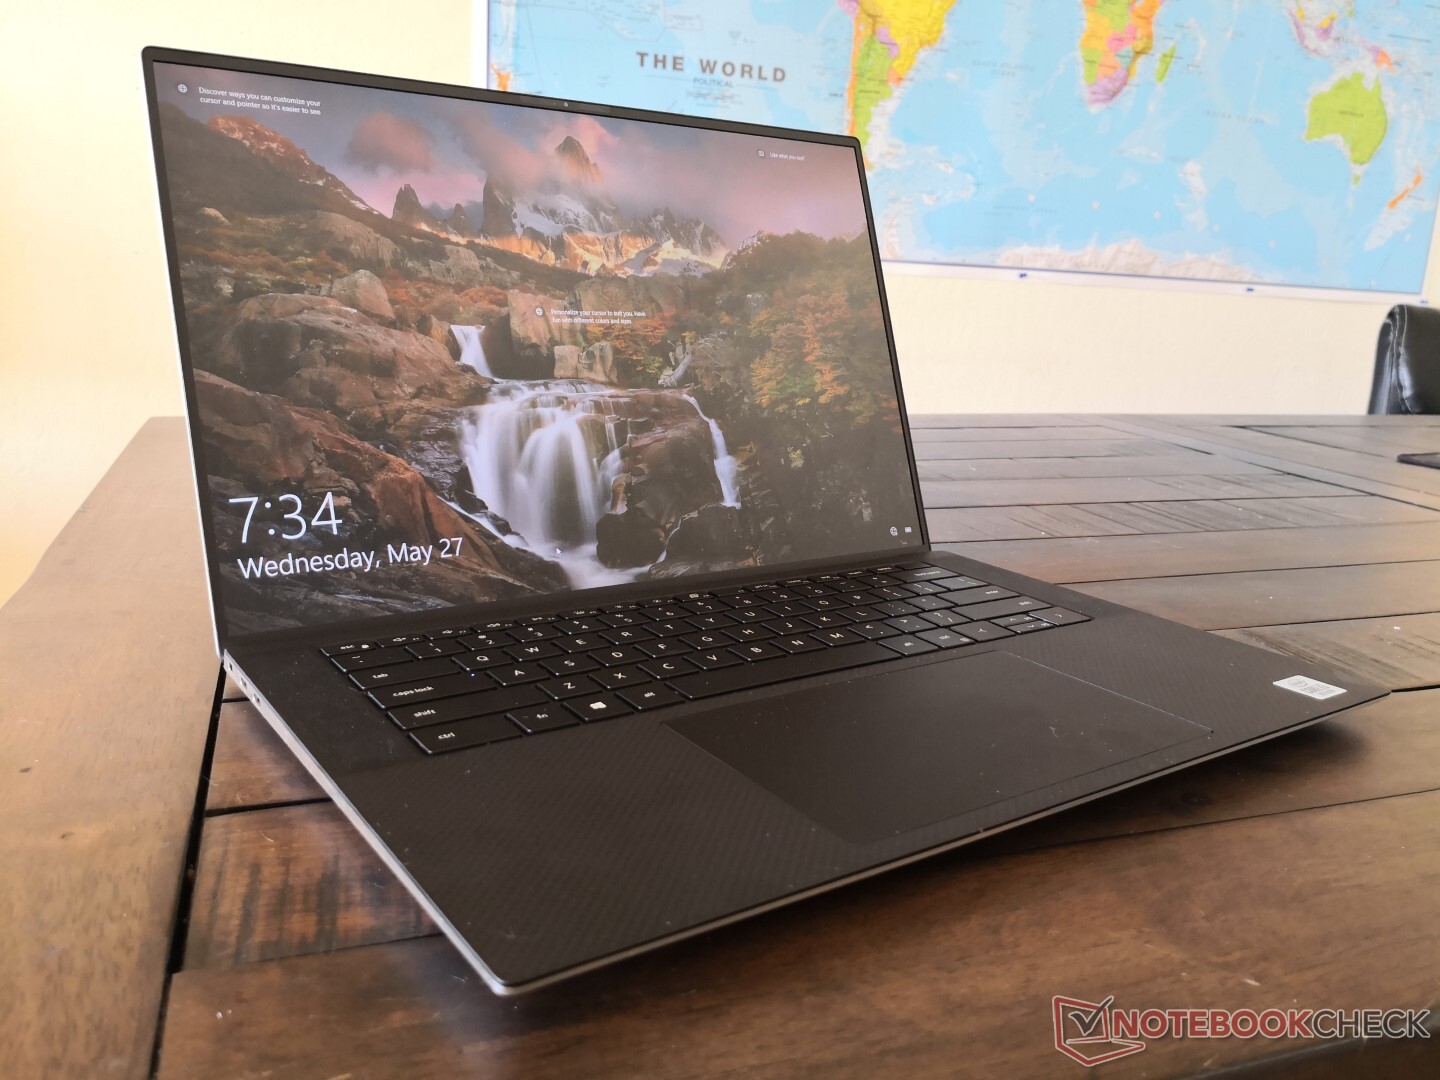
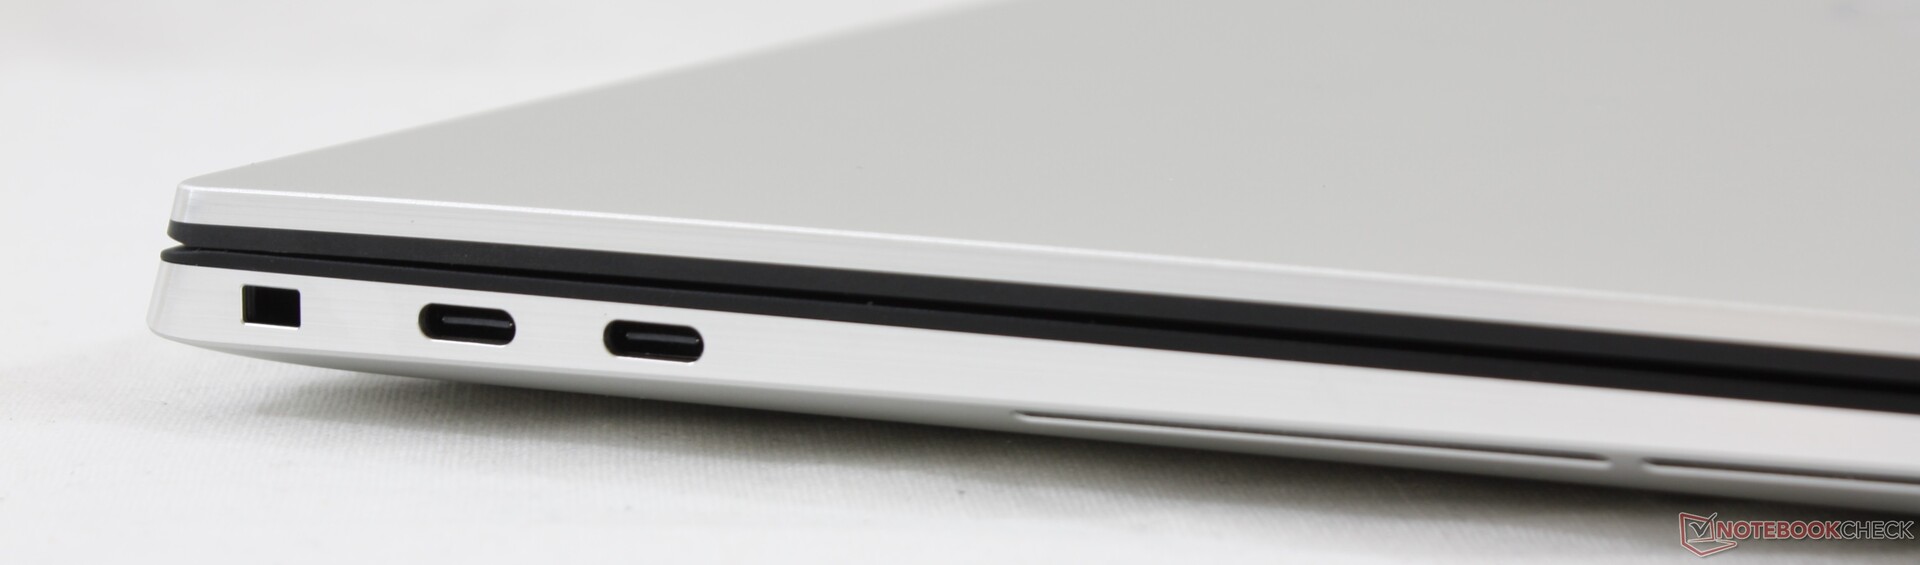
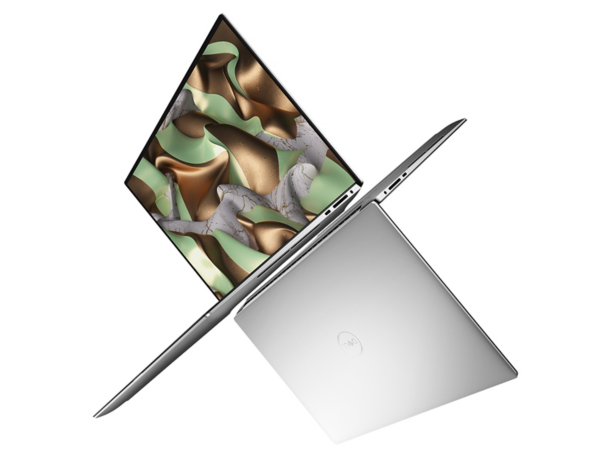
Kort testrapport Dell XPS 15 9500 Core i5: nu nog meer zoals een MacBook Pro
Evaluatie | Datum | Model | Gewicht | Hoogte | Formaat | Resolutie | Beste prijs |
|---|---|---|---|---|---|---|---|
| 86.8 % v7 (old) | 05-2020 | Dell XPS 15 9500 Core i5 i5-10300H, UHD Graphics 630 | 1.8 kg | 18 mm | 15.60" | 1920x1200 | |
| 85.2 % v7 (old) | 03-2020 | Asus ZenBook 15 UX534FTC-A8190T i7-10510U, GeForce GTX 1650 Max-Q | 1.6 kg | 18.9 mm | 15.60" | 1920x1080 | |
| 86 % v7 (old) | 12-2019 | Lenovo Yoga C940-15IRH i7-9750H, GeForce GTX 1650 Max-Q | 2 kg | 19.7 mm | 15.60" | 1920x1080 | |
| 85 % v7 (old) | 01-2020 | HP Spectre X360 15-5ZV31AV i7-10510U, GeForce MX250 | 2.1 kg | 19.3 mm | 15.60" | 3840x2160 | |
| 89.7 % v7 (old) | 12-2019 | Apple MacBook Pro 16 2019 i9 5500M i9-9880H, Radeon Pro 5500M | 2 kg | 16.2 mm | 16.00" | 3072x1920 |
| SD Card Reader | |
| average JPG Copy Test (av. of 3 runs) | |
| Dell XPS 15 9500 Core i5 (Toshiba Exceria Pro SDXC 64 GB UHS-II) | |
| Razer Blade Pro 17 4K UHD 120 Hz (Toshiba Exceria Pro SDXC 64 GB UHS-II) | |
| Dell XPS 15 7590 i5 iGPU FHD (Toshiba Exceria Pro SDXC 64 GB UHS-II) | |
| HP Spectre X360 15-5ZV31AV (Toshiba Exceria Pro M501 UHS-II) | |
| maximum AS SSD Seq Read Test (1GB) | |
| Dell XPS 15 9500 Core i5 (Toshiba Exceria Pro SDXC 64 GB UHS-II) | |
| Razer Blade Pro 17 4K UHD 120 Hz (Toshiba Exceria Pro SDXC 64 GB UHS-II) | |
| Dell XPS 15 7590 i5 iGPU FHD (Toshiba Exceria Pro SDXC 64 GB UHS-II) | |
| HP Spectre X360 15-5ZV31AV (Toshiba Exceria Pro M501 UHS-II) | |
| Networking | |
| iperf3 transmit AX12 | |
| MSI GS66 10SGS | |
| Dell XPS 13 9300 4K UHD | |
| Dell XPS 15 9500 Core i5 | |
| Acer Aspire 5 A515-54G | |
| Asus TUF A17 FA706IU-AS76 | |
| iperf3 receive AX12 | |
| Dell XPS 13 9300 4K UHD | |
| MSI GS66 10SGS | |
| Dell XPS 15 9500 Core i5 | |
| Acer Aspire 5 A515-54G | |
| Asus TUF A17 FA706IU-AS76 | |


| |||||||||||||||||||||||||
Helderheidsverdeling: 85 %
Helderheid in Batterij-modus: 592 cd/m²
Contrast: 1287:1 (Zwart: 0.46 cd/m²)
ΔE ColorChecker Calman: 3.19 | ∀{0.5-29.43 Ø4.72}
calibrated: 2.03
ΔE Greyscale Calman: 3.9 | ∀{0.09-98 Ø4.97}
100% sRGB (Argyll 1.6.3 3D)
71.6% AdobeRGB 1998 (Argyll 1.6.3 3D)
79.6% AdobeRGB 1998 (Argyll 3D)
100% sRGB (Argyll 3D)
81.5% Display P3 (Argyll 3D)
Gamma: 2.25
CCT: 6522 K
| Dell XPS 15 9500 Core i5 Sharp LQ156N1, IPS, 15.6", 1920x1200 | Dell XPS 15 7590 i5 iGPU FHD LQ156M1, IPS, 15.6", 1920x1080 | Asus ZenBook 15 UX534FTC-A8190T BOE CQ NV156FHM-N63, IPS, 15.6", 1920x1080 | Lenovo Yoga C940-15IRH LG Philips LP156WFC-SPU1, IPS, 15.6", 1920x1080 | HP Spectre X360 15-5ZV31AV AU Optronics AUO30EB, IPS, 15.6", 3840x2160 | Apple MacBook Pro 16 2019 i9 5500M APPA044, IPS, 16", 3072x1920 | |
|---|---|---|---|---|---|---|
| Display | -11% | -18% | -17% | -12% | ||
| Display P3 Coverage (%) | 81.5 | 66.5 -18% | 65 -20% | 61.5 -25% | 68.3 -16% | |
| sRGB Coverage (%) | 100 | 98 -2% | 86.2 -14% | 92.7 -7% | 94.3 -6% | |
| AdobeRGB 1998 Coverage (%) | 79.6 | 68.4 -14% | 62.9 -21% | 63.6 -20% | 68.4 -14% | |
| Response Times | -19% | -9% | -21% | -39% | -23% | |
| Response Time Grey 50% / Grey 80% * (ms) | 42 ? | 52.8 ? -26% | 45 ? -7% | 48.4 ? -15% | 56.8 ? -35% | 52.4 ? -25% |
| Response Time Black / White * (ms) | 28.8 ? | 32 ? -11% | 32 ? -11% | 36.4 ? -26% | 40.8 ? -42% | 34.9 ? -21% |
| PWM Frequency (Hz) | 1020 ? | 131700 | ||||
| Screen | 7% | -17% | -6% | -12% | 14% | |
| Brightness middle (cd/m²) | 592 | 588 -1% | 299 -49% | 484.8 -18% | 284.6 -52% | 519 -12% |
| Brightness (cd/m²) | 565 | 555 -2% | 280 -50% | 463 -18% | 285 -50% | 477 -16% |
| Brightness Distribution (%) | 85 | 89 5% | 89 5% | 82 -4% | 85 0% | 86 1% |
| Black Level * (cd/m²) | 0.46 | 0.4 13% | 0.21 54% | 0.26 43% | 0.25 46% | 0.39 15% |
| Contrast (:1) | 1287 | 1470 14% | 1424 11% | 1865 45% | 1138 -12% | 1331 3% |
| Colorchecker dE 2000 * | 3.19 | 2.5 22% | 4.76 -49% | 4.5 -41% | 3.52 -10% | 2.28 29% |
| Colorchecker dE 2000 max. * | 5.45 | 6.3 -16% | 9 -65% | 7.55 -39% | 5.56 -2% | 6.54 -20% |
| Colorchecker dE 2000 calibrated * | 2.03 | 0.6 70% | 1.19 41% | 3 -48% | 0.86 58% | |
| Greyscale dE 2000 * | 3.9 | 4.5 -15% | 3.53 9% | 5.7 -46% | 3.2 18% | 0.9 77% |
| Gamma | 2.25 98% | 2.2 100% | 2.3 96% | 2.45 90% | 2.28 96% | 2145 0% |
| CCT | 6522 100% | 6836 95% | 7228 90% | 6101 107% | 7070 92% | 6572 99% |
| Color Space (Percent of AdobeRGB 1998) (%) | 71.6 | 63.2 -12% | 56 -22% | 58.7 -18% | 61.1 -15% | 78 9% |
| Color Space (Percent of sRGB) (%) | 100 | 98 -2% | 86 -14% | 92.8 -7% | 93.8 -6% | |
| Totaal Gemiddelde (Programma / Instellingen) | -8% /
0% | -15% /
-16% | -15% /
-10% | -21% /
-15% | -5% /
8% |
* ... kleiner is beter
Responstijd Scherm
| ↔ Responstijd Zwart naar Wit | ||
|---|---|---|
| 28.8 ms ... stijging ↗ en daling ↘ gecombineerd | ↗ 15.2 ms stijging | 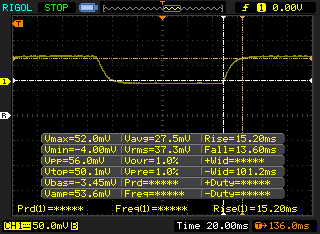 |
| ↘ 13.6 ms daling | ||
| Het scherm vertoonde relatief trage responstijden in onze tests en is misschien te traag voor games. Ter vergelijking: alle testtoestellen variëren van 0.1 (minimum) tot 240 (maximum) ms. » 76 % van alle toestellen zijn beter. Dit betekent dat de gemeten responstijd slechter is dan het gemiddelde (19.8 ms) van alle geteste toestellen. | ||
| ↔ Responstijd 50% Grijs naar 80% Grijs | ||
| 42 ms ... stijging ↗ en daling ↘ gecombineerd | ↗ 20 ms stijging | 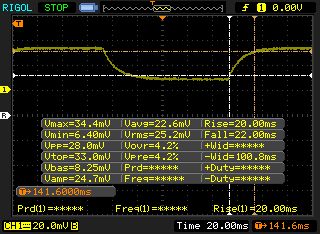 |
| ↘ 22 ms daling | ||
| Het scherm vertoonde trage responstijden in onze tests en is misschien te traag voor games. Ter vergelijking: alle testtoestellen variëren van 0.165 (minimum) tot 636 (maximum) ms. » 67 % van alle toestellen zijn beter. Dit betekent dat de gemeten responstijd slechter is dan het gemiddelde (31 ms) van alle geteste toestellen. | ||
Screen Flickering / PWM (Pulse-Width Modulation)
| Screen flickering / PWM niet waargenomen | 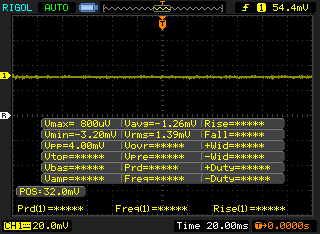 | ||
Ter vergelijking: 52 % van alle geteste toestellen maakten geen gebruik van PWM om de schermhelderheid te verlagen. Als het wel werd gebruikt, werd een gemiddelde van 7781 (minimum: 5 - maximum: 343500) Hz waargenomen. | |||
Cinebench R15: CPU Multi 64Bit | CPU Single 64Bit
Blender: v2.79 BMW27 CPU
7-Zip 18.03: 7z b 4 -mmt1 | 7z b 4
Geekbench 5.5: Single-Core | Multi-Core
HWBOT x265 Benchmark v2.2: 4k Preset
LibreOffice : 20 Documents To PDF
R Benchmark 2.5: Overall mean
| Cinebench R20 / CPU (Multi Core) | |
| Eluktronics RP-15 | |
| Gigabyte Aero 15 OLED XB-8DE51B0SP | |
| Dell XPS 15 7590 9980HK GTX 1650 | |
| Acer Predator Triton 500 PT515-52-70N3 | |
| Dell G5 15 5590 | |
| Lenovo IdeaPad S740-15IRH | |
| Gigabyte Aero 15-Y9 | |
| Dell XPS 15 9500 Core i5 | |
| Gemiddeld Intel Core i5-10300H (1397 - 2240, n=15) | |
| Dell G5 15 5590-PCNJJ | |
| Asus TUF FX505DT-EB73 | |
| HP Pavilion Gaming 15-ec0002ng | |
| Cinebench R20 / CPU (Single Core) | |
| Gigabyte Aero 15 OLED XB-8DE51B0SP | |
| Eluktronics RP-15 | |
| Acer Predator Triton 500 PT515-52-70N3 | |
| Lenovo IdeaPad S740-15IRH | |
| Dell XPS 15 7590 9980HK GTX 1650 | |
| Dell XPS 15 9500 Core i5 | |
| Gemiddeld Intel Core i5-10300H (312 - 470, n=15) | |
| Dell G5 15 5590-PCNJJ | |
| Dell G5 15 5590 | |
| Gigabyte Aero 15-Y9 | |
| Asus TUF FX505DT-EB73 | |
| HP Pavilion Gaming 15-ec0002ng | |
| Cinebench R15 / CPU Multi 64Bit | |
| Eluktronics RP-15 | |
| Gigabyte Aero 15 OLED XB-8DE51B0SP | |
| Dell XPS 15 7590 9980HK GTX 1650 | |
| Acer Predator Triton 500 PT515-52-70N3 | |
| Gigabyte Aero 15-Y9 | |
| Dell G5 15 5590 | |
| Lenovo IdeaPad S740-15IRH | |
| Dell XPS 15 9500 Core i5 | |
| Gemiddeld Intel Core i5-10300H (536 - 921, n=17) | |
| Dell G5 15 5590-PCNJJ | |
| Asus TUF FX505DT-EB73 | |
| HP Pavilion Gaming 15-ec0002ng | |
| Lenovo IdeaPad 330-15ICH | |
| Cinebench R15 / CPU Single 64Bit | |
| Gigabyte Aero 15 OLED XB-8DE51B0SP | |
| Dell XPS 15 7590 9980HK GTX 1650 | |
| Gigabyte Aero 15-Y9 | |
| Acer Predator Triton 500 PT515-52-70N3 | |
| Lenovo IdeaPad S740-15IRH | |
| Eluktronics RP-15 | |
| Dell XPS 15 9500 Core i5 | |
| Gemiddeld Intel Core i5-10300H (108 - 194, n=17) | |
| Lenovo IdeaPad 330-15ICH | |
| Dell G5 15 5590-PCNJJ | |
| Dell G5 15 5590 | |
| Asus TUF FX505DT-EB73 | |
| HP Pavilion Gaming 15-ec0002ng | |
| Blender / v2.79 BMW27 CPU | |
| Gemiddeld Intel Core i5-10300H (479 - 555, n=14) | |
| Dell XPS 15 9500 Core i5 | |
| Acer Predator Triton 500 PT515-52-70N3 | |
| Gigabyte Aero 15 OLED XB-8DE51B0SP | |
| Eluktronics RP-15 | |
| 7-Zip 18.03 / 7z b 4 -mmt1 | |
| Gigabyte Aero 15 OLED XB-8DE51B0SP | |
| Acer Predator Triton 500 PT515-52-70N3 | |
| Dell XPS 15 9500 Core i5 | |
| Eluktronics RP-15 | |
| Gemiddeld Intel Core i5-10300H (2945 - 4956, n=14) | |
| 7-Zip 18.03 / 7z b 4 | |
| Eluktronics RP-15 | |
| Gigabyte Aero 15 OLED XB-8DE51B0SP | |
| Acer Predator Triton 500 PT515-52-70N3 | |
| Dell XPS 15 9500 Core i5 | |
| Gemiddeld Intel Core i5-10300H (15146 - 24841, n=14) | |
| Geekbench 5.5 / Single-Core | |
| Gigabyte Aero 15 OLED XB-8DE51B0SP | |
| Acer Predator Triton 500 PT515-52-70N3 | |
| Eluktronics RP-15 | |
| Dell XPS 15 9500 Core i5 | |
| Gemiddeld Intel Core i5-10300H (703 - 1241, n=16) | |
| HP Pavilion Gaming 15-ec0002ng | |
| Geekbench 5.5 / Multi-Core | |
| Eluktronics RP-15 | |
| Gigabyte Aero 15 OLED XB-8DE51B0SP | |
| Acer Predator Triton 500 PT515-52-70N3 | |
| Dell XPS 15 9500 Core i5 | |
| Gemiddeld Intel Core i5-10300H (2783 - 4728, n=16) | |
| HP Pavilion Gaming 15-ec0002ng | |
| HWBOT x265 Benchmark v2.2 / 4k Preset | |
| Eluktronics RP-15 | |
| Gigabyte Aero 15 OLED XB-8DE51B0SP | |
| Acer Predator Triton 500 PT515-52-70N3 | |
| Dell XPS 15 9500 Core i5 | |
| Gemiddeld Intel Core i5-10300H (6.13 - 7.78, n=14) | |
| LibreOffice / 20 Documents To PDF | |
| Dell XPS 15 9500 Core i5 | |
| Eluktronics RP-15 | |
| Gemiddeld Intel Core i5-10300H (23.9 - 94, n=14) | |
| Gigabyte Aero 15 OLED XB-8DE51B0SP | |
| Acer Predator Triton 500 PT515-52-70N3 | |
| R Benchmark 2.5 / Overall mean | |
| Gemiddeld Intel Core i5-10300H (0.625 - 1.088, n=14) | |
| Dell XPS 15 9500 Core i5 | |
| Acer Predator Triton 500 PT515-52-70N3 | |
| Eluktronics RP-15 | |
| Gigabyte Aero 15 OLED XB-8DE51B0SP | |
Cinebench R15: CPU Multi 64Bit | CPU Single 64Bit
Blender: v2.79 BMW27 CPU
7-Zip 18.03: 7z b 4 -mmt1 | 7z b 4
Geekbench 5.5: Single-Core | Multi-Core
HWBOT x265 Benchmark v2.2: 4k Preset
LibreOffice : 20 Documents To PDF
R Benchmark 2.5: Overall mean
* ... kleiner is beter
| PCMark 8 Home Score Accelerated v2 | 3842 punten | |
| PCMark 8 Work Score Accelerated v2 | 5271 punten | |
| PCMark 10 Score | 4329 punten | |
Help | ||
| DPC Latencies / LatencyMon - interrupt to process latency (max), Web, Youtube, Prime95 | |
| HP ProBook 430 G7-8VU53EA | |
| Dell XPS 15 9500 Core i5 | |
| Razer Blade 15 RZ09-0328 | |
| Asus ZenBook Flip 14 UX463FA-AI039T | |
* ... kleiner is beter
| Dell XPS 15 9500 Core i5 Toshiba KBG40ZNS256G NVMe | Dell XPS 15 7590 i5 iGPU FHD Toshiba XG6 KXG60ZNV512G | Asus ZenBook 15 UX534FTC-A8190T Samsung SSD PM981 MZVLB1T0HALR | Lenovo Yoga C940-15IRH Intel Optane Memory H10 with Solid State Storage 32GB + 512GB HBRPEKNX0202A(L/H) | HP Spectre X360 15-5ZV31AV Intel SSD 660p 2TB SSDPEKNW020T8 | Apple MacBook Pro 16 2019 i9 5500M Apple SSD AP1024 7171 | |
|---|---|---|---|---|---|---|
| AS SSD | 109% | 112% | 38% | 62% | 122% | |
| Seq Read (MB/s) | 1423 | 2357 66% | 2643 86% | 769 -46% | 1220 -14% | 2531 78% |
| Seq Write (MB/s) | 766 | 1235 61% | 1533 100% | 351.1 -54% | 1152 50% | 2289 199% |
| 4K Read (MB/s) | 42.21 | 43.29 3% | 49.12 16% | 69.1 64% | 52.3 24% | 15.85 -62% |
| 4K Write (MB/s) | 74.8 | 99.7 33% | 134.7 80% | 100.9 35% | 146.6 96% | 39.88 -47% |
| 4K-64 Read (MB/s) | 973 | 1020 5% | 1028 6% | 472 -51% | 652 -33% | 1267 30% |
| 4K-64 Write (MB/s) | 218.8 | 1502 586% | 1353 518% | 948 333% | 847 287% | 1749 699% |
| Access Time Read * (ms) | 0.125 | 0.07 44% | 0.033 74% | 0.071 43% | 0.077 38% | 0.122 2% |
| Access Time Write * (ms) | 0.552 | 0.039 93% | 0.028 95% | 0.137 75% | 0.106 81% | 0.095 83% |
| Score Read (Points) | 1157 | 1299 12% | 1342 16% | 618 -47% | 826 -29% | 1536 33% |
| Score Write (Points) | 370 | 1726 366% | 1641 344% | 1084 193% | 1109 200% | 2018 445% |
| Score Total (Points) | 2094 | 3640 74% | 3622 73% | 2024 -3% | 2371 13% | 4317 106% |
| Copy ISO MB/s (MB/s) | 1151 | 2145 86% | 2226 93% | 839 -27% | 2070 80% | 1995 73% |
| Copy Program MB/s (MB/s) | 499.4 | 565 13% | 506 1% | 455.8 -9% | 571 14% | 584 17% |
| Copy Game MB/s (MB/s) | 733 | 1320 80% | 1230 68% | 969 32% | 1219 66% | 1135 55% |
| CrystalDiskMark 5.2 / 6 | 32% | 48% | 25% | 25% | 33% | |
| Write 4K (MB/s) | 93.3 | 93.6 0% | 138.1 48% | 102.2 10% | 151.5 62% | 55.5 -41% |
| Read 4K (MB/s) | 45.9 | 41.87 -9% | 45.89 0% | 114.3 149% | 59.3 29% | 16.21 -65% |
| Write Seq (MB/s) | 1211 | 1698 40% | 2147 77% | 468.3 -61% | 1424 18% | 1959 62% |
| Read Seq (MB/s) | 1633 | 1978 21% | 2188 34% | 1236 -24% | 1609 -1% | 1763 8% |
| Write 4K Q32T1 (MB/s) | 273.1 | 383.1 40% | 427.8 57% | 556 104% | 393.6 44% | 398.5 46% |
| Read 4K Q32T1 (MB/s) | 356 | 326.9 -8% | 404 13% | 421.6 18% | 369.4 4% | 648 82% |
| Write Seq Q32T1 (MB/s) | 1198 | 2778 132% | 2396 100% | 1264 6% | 1946 62% | 2727 128% |
| Read Seq Q32T1 (MB/s) | 2269 | 3119 37% | 3454 52% | 2239 -1% | 1934 -15% | 3242 43% |
| Totaal Gemiddelde (Programma / Instellingen) | 71% /
81% | 80% /
89% | 32% /
34% | 44% /
49% | 78% /
90% |
* ... kleiner is beter

Disk Throttling: DiskSpd Read Loop, Queue Depth 8
| 3DMark 11 | |
| 1280x720 Performance GPU | |
| Dell XPS 15 7590 9980HK GTX 1650 | |
| Dell XPS 15 9575 FY00N | |
| MSI Modern 15 A10RB | |
| Dell XPS 13 9300 Core i7-1065G7 | |
| Asus VivoBook S15 S530UN-BQ097T | |
| Microsoft Surface Laptop 3 13 Core i5-1035G7 | |
| Chuwi AeroBook Plus | |
| Dell XPS 15 9500 Core i5 | |
| Gemiddeld Intel UHD Graphics 630 (642 - 2025, n=12) | |
| Asus Vivobook 15 F512DA-SH31 | |
| Acer Extensa 15 EX215-51-56UX | |
| 1280x720 Performance Combined | |
| Dell XPS 15 7590 9980HK GTX 1650 | |
| Dell XPS 15 9575 FY00N | |
| MSI Modern 15 A10RB | |
| Asus VivoBook S15 S530UN-BQ097T | |
| Dell XPS 13 9300 Core i7-1065G7 | |
| Microsoft Surface Laptop 3 13 Core i5-1035G7 | |
| Chuwi AeroBook Plus | |
| Gemiddeld Intel UHD Graphics 630 (1647 - 2181, n=12) | |
| Dell XPS 15 9500 Core i5 | |
| Asus Vivobook 15 F512DA-SH31 | |
| Acer Extensa 15 EX215-51-56UX | |
| 3DMark 11 Performance | 1985 punten | |
| 3DMark Cloud Gate Standard Score | 9619 punten | |
| 3DMark Fire Strike Score | 1095 punten | |
| 3DMark Time Spy Score | 441 punten | |
Help | ||
| lage | gem. | hoge | ultra | |
|---|---|---|---|---|
| The Witcher 3 (2015) | 17.3 | 10.8 | ||
| Dota 2 Reborn (2015) | 79 | 50 | 19.7 | 17.4 |
| X-Plane 11.11 (2018) | 22.4 | 14.3 | 12.8 |
| Dell XPS 15 9500 Core i5 UHD Graphics 630, i5-10300H, Toshiba KBG40ZNS256G NVMe | Dell XPS 15 7590 i5 iGPU FHD UHD Graphics 630, i5-9300H, Toshiba XG6 KXG60ZNV512G | Asus ZenBook 15 UX534FTC-A8190T GeForce GTX 1650 Max-Q, i7-10510U, Samsung SSD PM981 MZVLB1T0HALR | Lenovo Yoga C940-15IRH GeForce GTX 1650 Max-Q, i7-9750H, Intel Optane Memory H10 with Solid State Storage 32GB + 512GB HBRPEKNX0202A(L/H) | HP Spectre X360 15-5ZV31AV GeForce MX250, i7-10510U, Intel SSD 660p 2TB SSDPEKNW020T8 | Apple MacBook Pro 16 2019 i9 5500M Radeon Pro 5500M, i9-9880H, Apple SSD AP1024 7171 | |
|---|---|---|---|---|---|---|
| Noise | -4% | -6% | -13% | -7% | -15% | |
| uit / omgeving * (dB) | 28 | 29.3 -5% | 30.3 -8% | 28.7 -2% | 30.1 -8% | 29.8 -6% |
| Idle Minimum * (dB) | 28 | 29.3 -5% | 30.3 -8% | 28.7 -2% | 30.1 -8% | 29.9 -7% |
| Idle Average * (dB) | 28 | 29.3 -5% | 30.3 -8% | 28.8 -3% | 30.1 -8% | 29.9 -7% |
| Idle Maximum * (dB) | 28 | 29.8 -6% | 30.9 -10% | 28.8 -3% | 30.1 -8% | 29.9 -7% |
| Load Average * (dB) | 28 | 32.4 -16% | 31.3 -12% | 45 -61% | 30.1 -8% | 43 -54% |
| Load Maximum * (dB) | 41.9 | 37.2 11% | 38.2 9% | 44.7 -7% | 42 -0% | 46.1 -10% |
| Witcher 3 ultra * (dB) | 38.1 | 44.7 | 39.7 | 45.4 |
* ... kleiner is beter
Geluidsniveau
| Onbelast |
| 28 / 28 / 28 dB (A) |
| Belasting |
| 28 / 41.9 dB (A) |
 | ||
30 dB stil 40 dB(A) hoorbaar 50 dB(A) luid |
||
min: | ||
(±) De maximumtemperatuur aan de bovenzijde bedraagt 42.4 °C / 108 F, vergeleken met het gemiddelde van 36.8 °C / 98 F, variërend van 21 tot 71 °C voor de klasse Multimedia.
(+) De bodem warmt op tot een maximum van 39.6 °C / 103 F, vergeleken met een gemiddelde van 39.1 °C / 102 F
(+) Bij onbelast gebruik bedraagt de gemiddelde temperatuur voor de bovenzijde 23.2 °C / 74 F, vergeleken met het apparaatgemiddelde van 31.3 °C / 88 F.
(+) De palmsteunen en het touchpad zijn met een maximum van ###max## °C / 83.1 F koeler dan de huidtemperatuur en voelen daarom koel aan.
(±) De gemiddelde temperatuur van de handpalmsteun van soortgelijke toestellen bedroeg 28.7 °C / 83.7 F (+0.3 °C / 0.6 F).
Dell XPS 15 9500 Core i5 audioanalyse
(+) | luidsprekers kunnen relatief luid spelen (84.2 dB)
Bas 100 - 315 Hz
(+) | goede baars - slechts 4.6% verwijderd van de mediaan
(±) | lineariteit van de lage tonen is gemiddeld (10% delta ten opzichte van de vorige frequentie)
Midden 400 - 2000 Hz
(+) | evenwichtige middens - slechts 3.3% verwijderd van de mediaan
(+) | de middentonen zijn lineair (4.5% delta ten opzichte van de vorige frequentie)
Hoog 2 - 16 kHz
(+) | evenwichtige hoogtepunten - slechts 2.4% verwijderd van de mediaan
(+) | de hoge tonen zijn lineair (4.3% delta naar de vorige frequentie)
Algemeen 100 - 16.000 Hz
(+) | het totale geluid is lineair (7.7% verschil met de mediaan)
Vergeleken met dezelfde klasse
» 6% van alle geteste apparaten in deze klasse waren beter, 2% vergelijkbaar, 91% slechter
» De beste had een delta van 5%, het gemiddelde was 17%, de slechtste was 45%
Vergeleken met alle geteste toestellen
» 1% van alle geteste apparaten waren beter, 0% gelijk, 98% slechter
» De beste had een delta van 4%, het gemiddelde was 24%, de slechtste was 134%
Apple MacBook 12 (Early 2016) 1.1 GHz audioanalyse
(+) | luidsprekers kunnen relatief luid spelen (83.6 dB)
Bas 100 - 315 Hz
(±) | verminderde zeebaars - gemiddeld 11.3% lager dan de mediaan
(±) | lineariteit van de lage tonen is gemiddeld (14.2% delta ten opzichte van de vorige frequentie)
Midden 400 - 2000 Hz
(+) | evenwichtige middens - slechts 2.4% verwijderd van de mediaan
(+) | de middentonen zijn lineair (5.5% delta ten opzichte van de vorige frequentie)
Hoog 2 - 16 kHz
(+) | evenwichtige hoogtepunten - slechts 2% verwijderd van de mediaan
(+) | de hoge tonen zijn lineair (4.5% delta naar de vorige frequentie)
Algemeen 100 - 16.000 Hz
(+) | het totale geluid is lineair (10.2% verschil met de mediaan)
Vergeleken met dezelfde klasse
» 7% van alle geteste apparaten in deze klasse waren beter, 2% vergelijkbaar, 91% slechter
» De beste had een delta van 5%, het gemiddelde was 18%, de slechtste was 53%
Vergeleken met alle geteste toestellen
» 5% van alle geteste apparaten waren beter, 1% gelijk, 94% slechter
» De beste had een delta van 4%, het gemiddelde was 24%, de slechtste was 134%
| Uit / Standby | |
| Inactief | |
| Belasting |
|
Key:
min: | |
| Dell XPS 15 9500 Core i5 i5-10300H, UHD Graphics 630, Toshiba KBG40ZNS256G NVMe, IPS, 1920x1200, 15.6" | Dell XPS 15 7590 i5 iGPU FHD i5-9300H, UHD Graphics 630, Toshiba XG6 KXG60ZNV512G, IPS, 1920x1080, 15.6" | Asus ZenBook 15 UX534FTC-A8190T i7-10510U, GeForce GTX 1650 Max-Q, Samsung SSD PM981 MZVLB1T0HALR, IPS, 1920x1080, 15.6" | Lenovo Yoga C940-15IRH i7-9750H, GeForce GTX 1650 Max-Q, Intel Optane Memory H10 with Solid State Storage 32GB + 512GB HBRPEKNX0202A(L/H), IPS, 1920x1080, 15.6" | HP Spectre X360 15-5ZV31AV i7-10510U, GeForce MX250, Intel SSD 660p 2TB SSDPEKNW020T8, IPS, 3840x2160, 15.6" | Apple MacBook Pro 16 2019 i9 5500M i9-9880H, Radeon Pro 5500M, Apple SSD AP1024 7171, IPS, 3072x1920, 16" | |
|---|---|---|---|---|---|---|
| Power Consumption | -20% | -15% | -95% | -31% | -65% | |
| Idle Minimum * (Watt) | 2.9 | 3.79 -31% | 2.8 3% | 5.2 -79% | 5.2 -79% | 3.7 -28% |
| Idle Average * (Watt) | 7.6 | 6.9 9% | 7.7 -1% | 10.7 -41% | 8.5 -12% | 12.1 -59% |
| Idle Maximum * (Watt) | 8 | 9.2 -15% | 9.4 -18% | 24.3 -204% | 8.7 -9% | 17 -113% |
| Load Average * (Watt) | 41.7 | 62 -49% | 57 -37% | 84.4 -102% | 65.6 -57% | 91.5 -119% |
| Load Maximum * (Watt) | 94.8 | 108 -14% | 116 -22% | 142.8 -51% | 92.4 3% | 102.3 -8% |
| Witcher 3 ultra * (Watt) | 62 | 83.9 | 56.5 | 103 |
* ... kleiner is beter
| Dell XPS 15 9500 Core i5 i5-10300H, UHD Graphics 630, 56 Wh | Dell XPS 15 7590 i5 iGPU FHD i5-9300H, UHD Graphics 630, 97 Wh | Asus ZenBook 15 UX534FTC-A8190T i7-10510U, GeForce GTX 1650 Max-Q, 71 Wh | Lenovo Yoga C940-15IRH i7-9750H, GeForce GTX 1650 Max-Q, 69 Wh | HP Spectre X360 15-5ZV31AV i7-10510U, GeForce MX250, 84 Wh | Apple MacBook Pro 16 2019 i9 5500M i9-9880H, Radeon Pro 5500M, 99.8 Wh | |
|---|---|---|---|---|---|---|
| Batterijduur | 29% | 29% | -21% | 28% | -4% | |
| Reader / Idle (h) | 26.4 | 27.2 3% | 18.2 -31% | 22.6 -14% | ||
| WiFi v1.3 (h) | 9.3 | 14.1 52% | 12.4 33% | 9.7 4% | 10.8 16% | 12 29% |
| Load (h) | 1.6 | 1.7 6% | 2.4 50% | 1 -37% | 2.9 81% | 1 -37% |
| Witcher 3 ultra (h) | 0.9 |
Pro
Contra
Dit is de verkorte versie van het originele artikel. Het volledige, Engelse testrapport vind je hier.
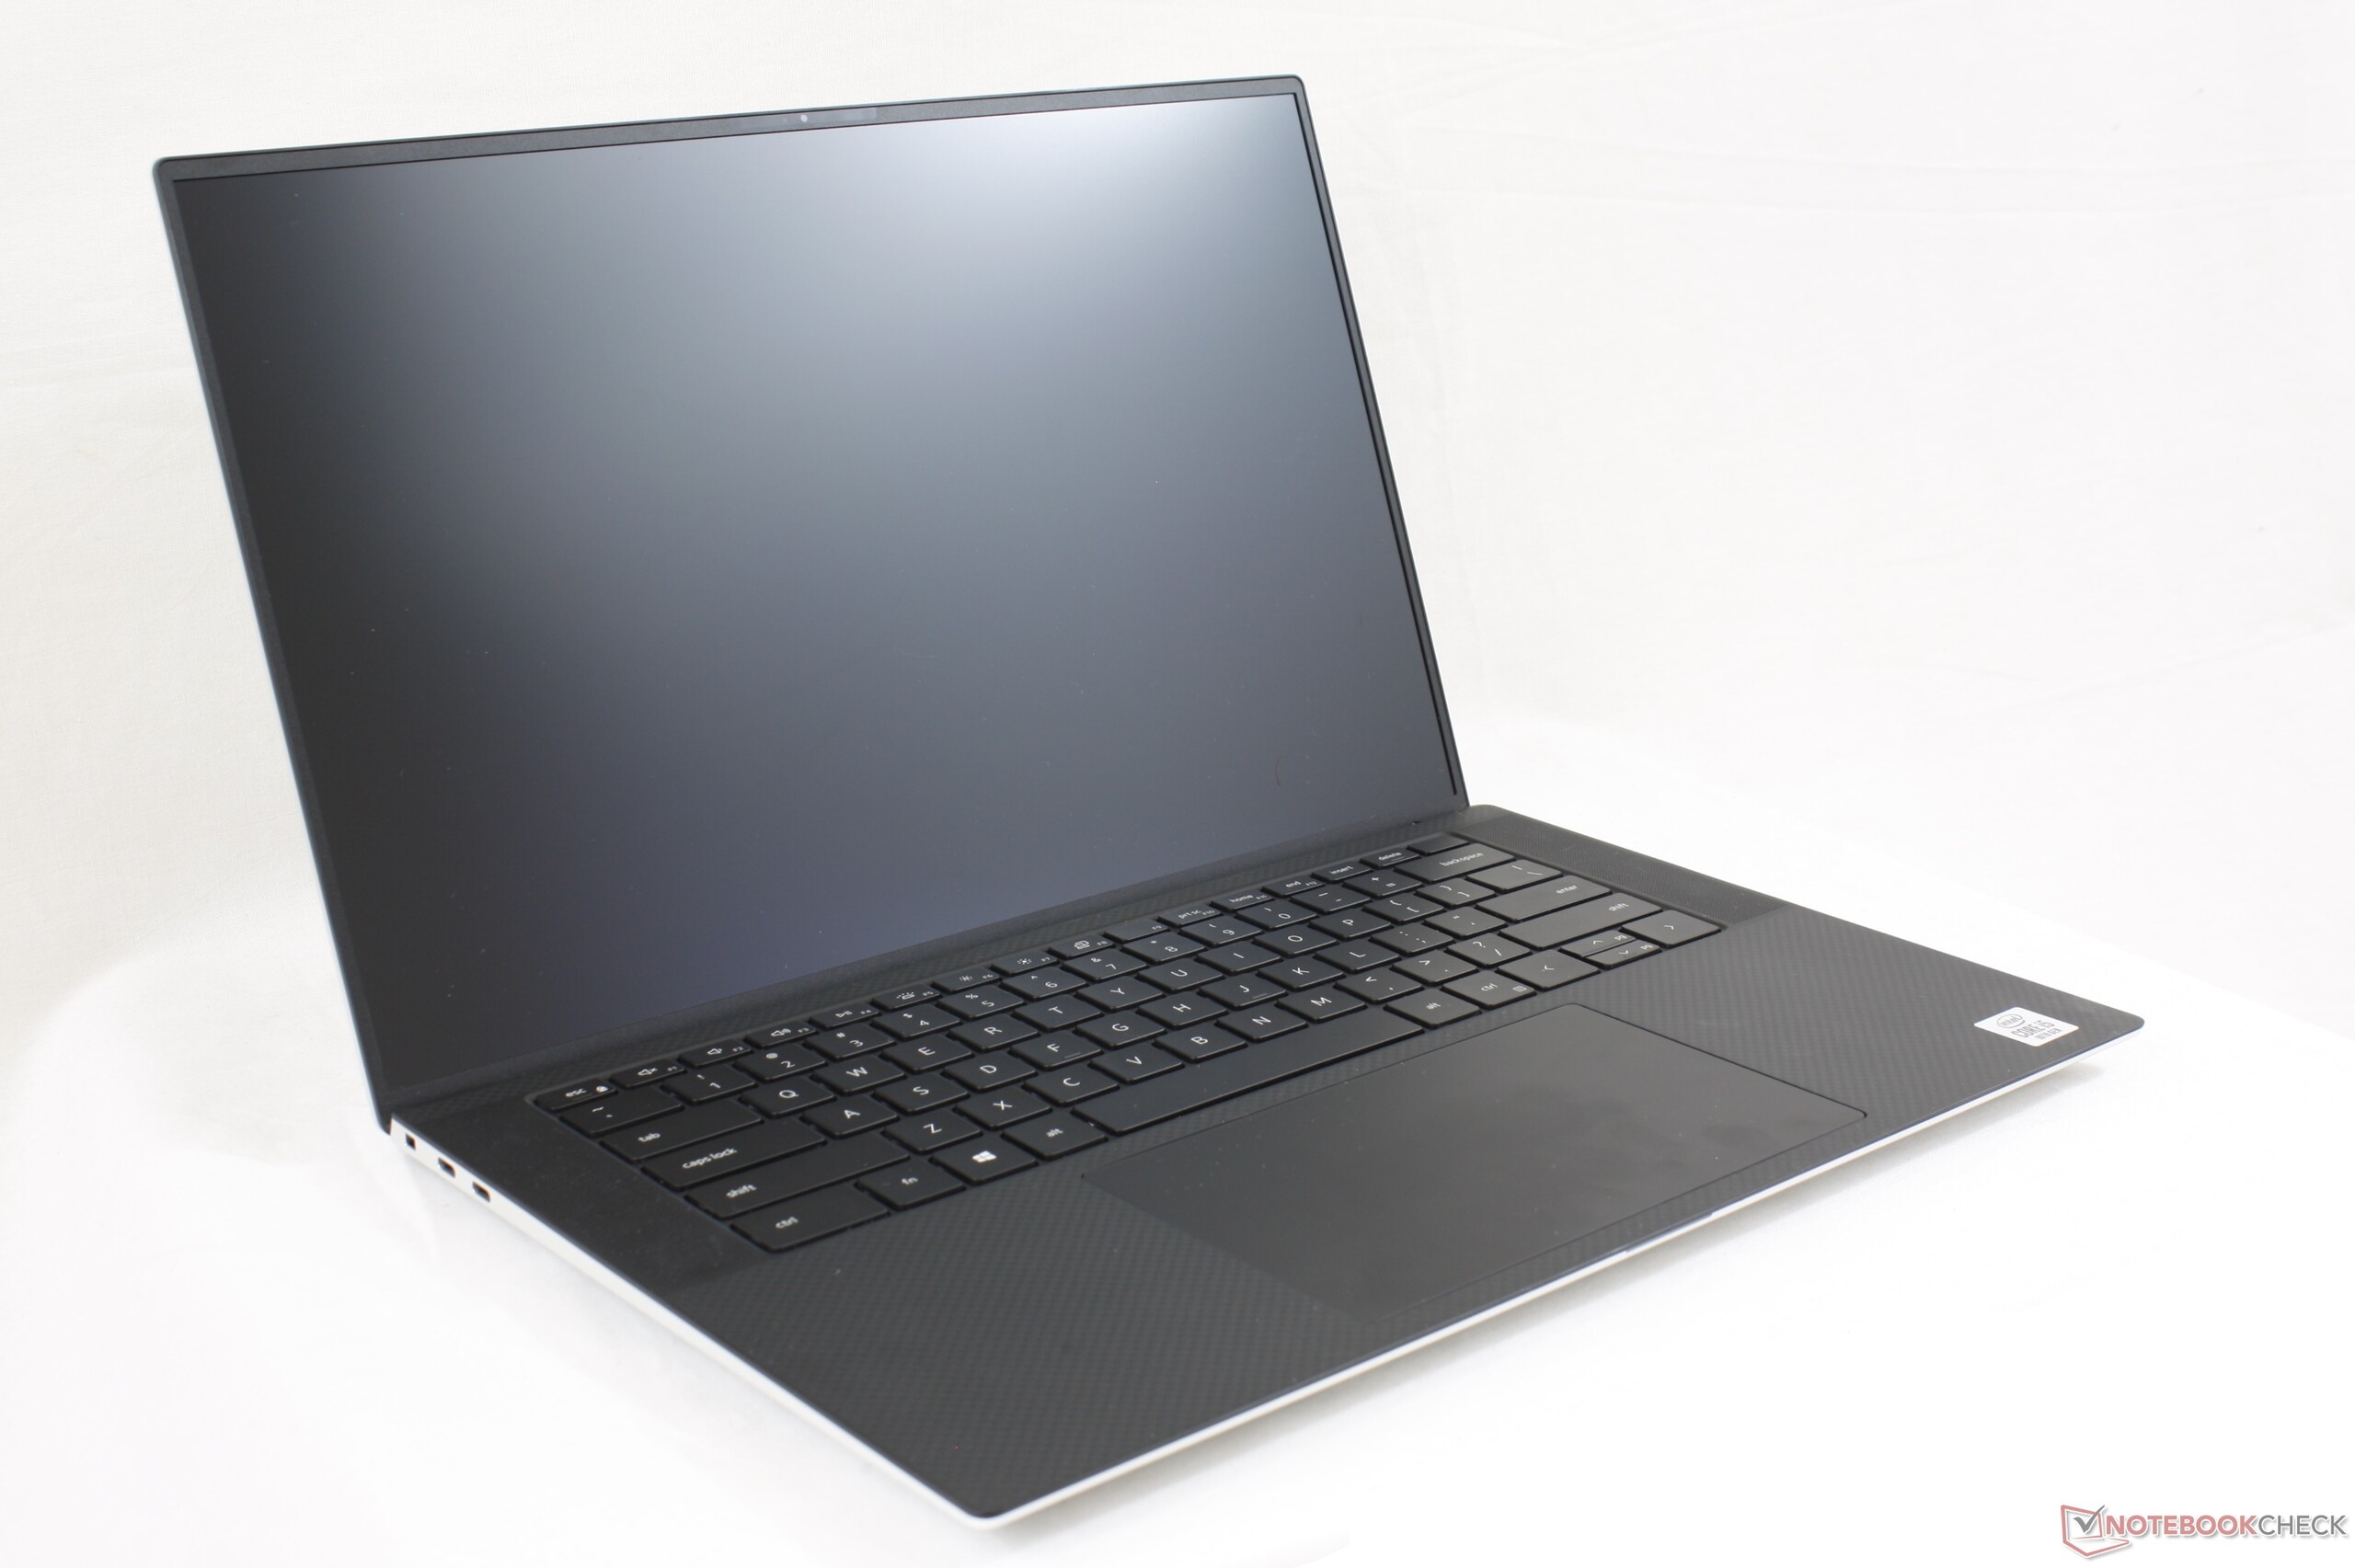
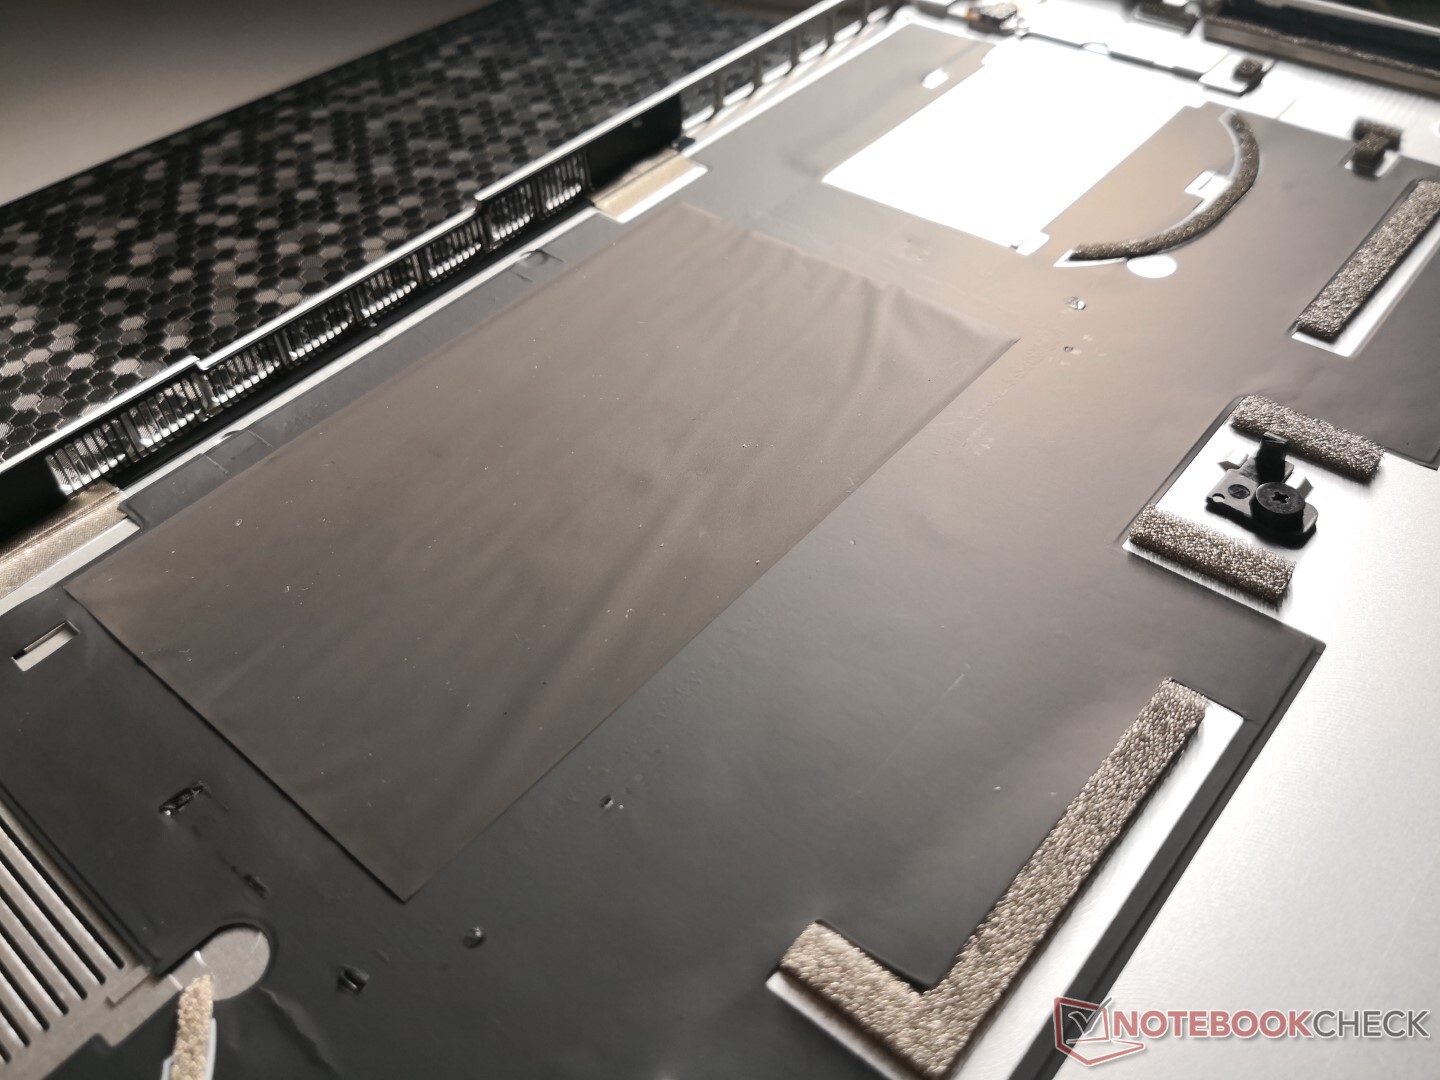
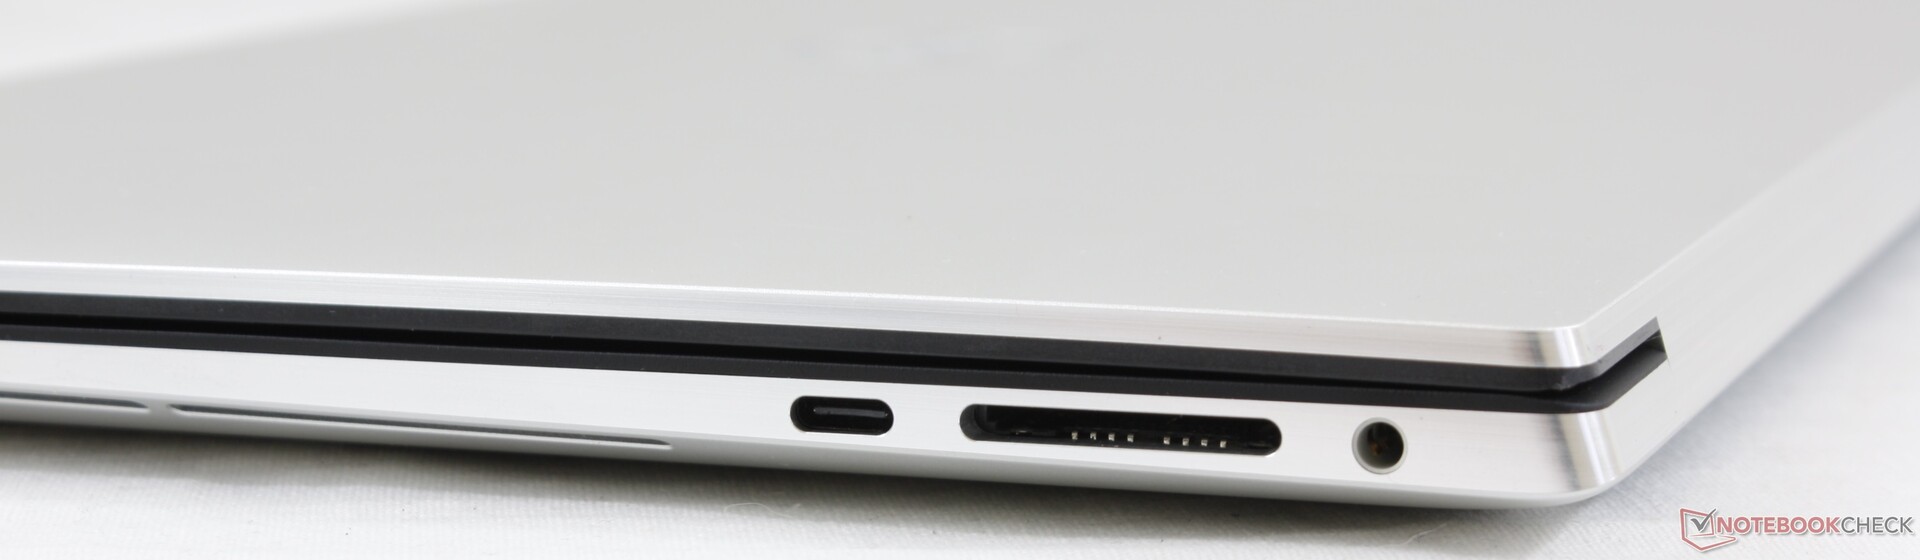
Vanuit het oogpunt van een gemiddelde consument kan de vernieuwde XPS 15 bijna alle juiste vakjes afvinken. Het heldere 16:10-scherm, verbeterde toetsenbordfeedback, ruime clickpad, uitgebreide audiosysteem, lange batterijduur, stille ventilatoren, uitbreidbare RAM en nieuwe secundaire M.2-sleuf dragen allemaal bij tot het gebruiksgemak van het systeem. Als je voorlopig nog hebt gewacht om te upgraden naar een XPS 15, dan is het nu het moment om in te stappen, aangezien deze nieuwste revisie het oudere ontwerp op aanzienlijke manieren verbetert. Het weglaten van zowel HDMI als USB Type-A zal onvermijdelijk een ergernis zijn, maar op zijn minst zijn er enkele adapters inbegrepen in de doos.
Vanuit het oogpunt van een veeleisende gebruiker lijkt het er echter op dat de koeloplossing niet zo veel is verbeterd. Core-temperaturen lopen op tot meer dan 90 °C bij onze hexa-core Core i5-basisconfiguratie, wat betekent dat de duurdere configuratie met octa-core Core i7 en GeForce GTX waarschijnlijk nog warmer en luider zal zijn. Als je geen fan was van de uitzonderlijke koeloplossing in het model van de vorige generatie, dan zal dit nieuwste model je waarschijnlijk niet van mening doen veranderen. Bovendien zijn de WLAN-module en het toetsenbord nu moeilijker te onderhouden dan voorheen, omdat hun componenten sterker op het moederbord zijn geïntegreerd.
We zullen de XPS 15 9500 binnenkort opnieuw bekijken met verschillende configuraties om een beter beeld te krijgen van het algehele model. Maar voor de basisprijs van ongeveer 1300 euro, brengt het vlaggenschipsysteem van Dell op bijna alle juiste plaatsen de juiste wijzigingen aan voor een bewonderenswaardige eerste indruk.
Dell XPS 15 9500 Core i5
- 09-06-2020 v7 (old)
Allen Ngo
Price comparison
