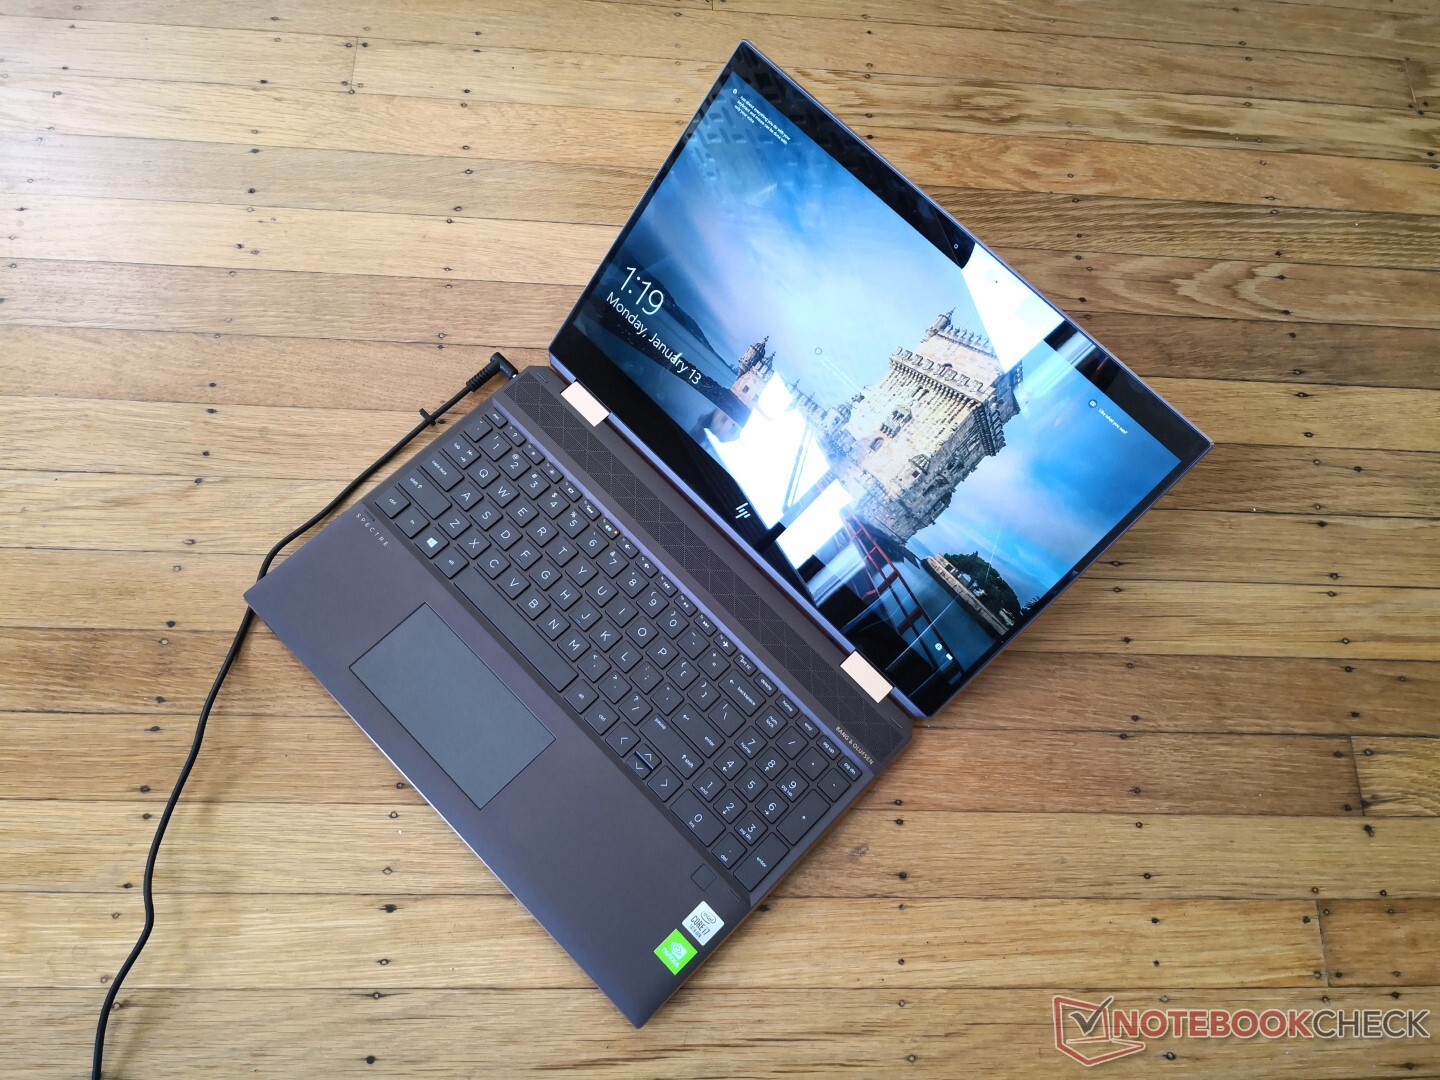
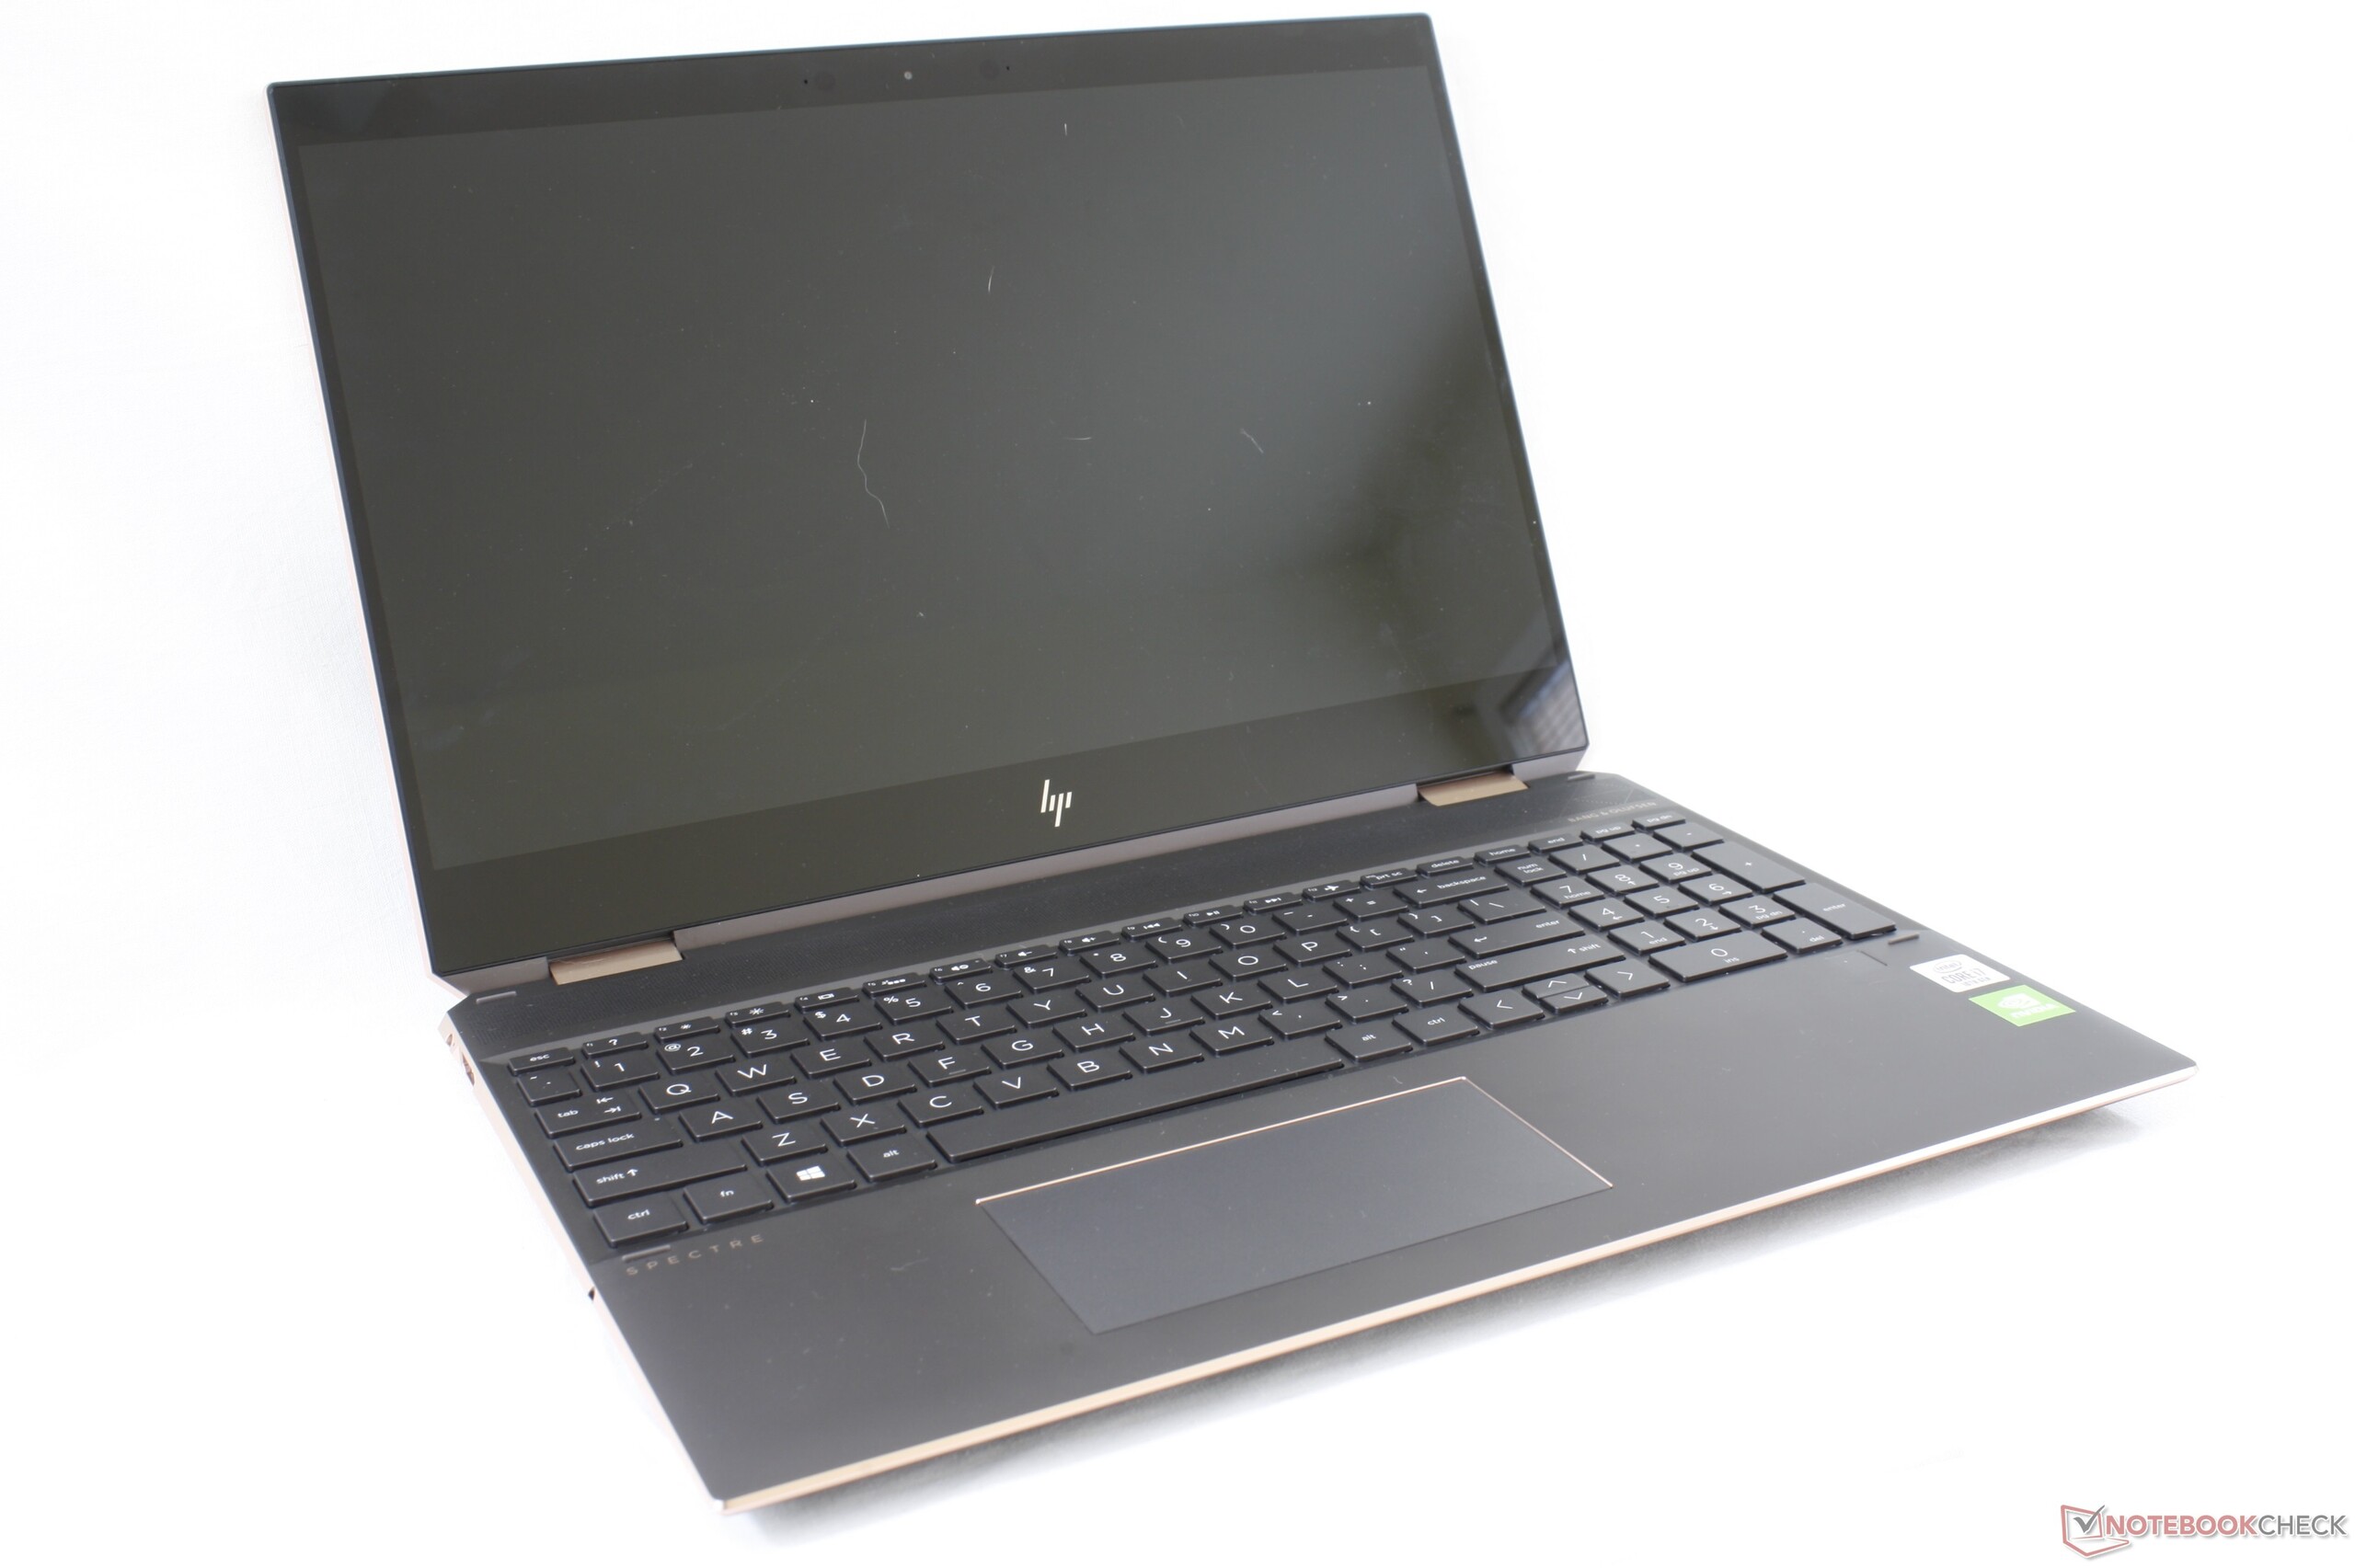
Kort testrapport HP Spectre X360 15 Late 2019 Convertible: Comet Lake Core i7 met GeForce MX Graphics
Evaluatie | Datum | Model | Gewicht | Hoogte | Formaat | Resolutie | Beste prijs |
|---|---|---|---|---|---|---|---|
| 85 % v7 (old) | 01-2020 | HP Spectre X360 15-5ZV31AV i7-10510U, GeForce MX250 | 2.1 kg | 19.3 mm | 15.60" | 3840x2160 | |
| 86 % v7 (old) | 12-2019 | Lenovo Yoga C940-15IRH i7-9750H, GeForce GTX 1650 Max-Q | 2 kg | 19.7 mm | 15.60" | 1920x1080 | |
| 83.1 % v7 (old) | 10-2019 | Asus ZenBook 15 UX534FT-DB77 i7-8565U, GeForce GTX 1650 Max-Q | 1.7 kg | 18.9 mm | 15.60" | 1920x1080 | |
| 86.5 % v6 (old) | 07-2018 | HP Spectre x360 15-ch011nr i5-8550U, GeForce MX150 | 2.1 kg | 19.3 mm | 15.60" | 3840x2160 | |
| 85.2 % v7 (old) | 11-2019 | MSI Prestige 15 A10SC i7-10710U, GeForce GTX 1650 Max-Q | 1.7 kg | 16 mm | 15.60" | 3840x2160 |

| SD Card Reader | |
| average JPG Copy Test (av. of 3 runs) | |
| Dell XPS 15 7590 9980HK GTX 1650 (Toshiba Exceria Pro SDXC 64 GB UHS-II) | |
| HP Spectre X360 15-5ZV31AV (Toshiba Exceria Pro M501 UHS-II) | |
| MSI Prestige 15 A10SC (Toshiba Exceria Pro M501 UHS-II) | |
| Asus ZenBook 15 UX534FT-DB77 (Toshiba Exceria Pro SDXC 64 GB UHS-II) | |
| HP Pavilion Gaming 15-ec0017ng (Toshiba Exceria Pro SDXC 64 GB UHS-II) | |
| maximum AS SSD Seq Read Test (1GB) | |
| MSI Prestige 15 A10SC (Toshiba Exceria Pro M501 UHS-II) | |
| Dell XPS 15 7590 9980HK GTX 1650 (Toshiba Exceria Pro SDXC 64 GB UHS-II) | |
| HP Spectre X360 15-5ZV31AV (Toshiba Exceria Pro M501 UHS-II) | |
| Asus ZenBook 15 UX534FT-DB77 (Toshiba Exceria Pro SDXC 64 GB UHS-II) | |
| HP Pavilion Gaming 15-ec0017ng (Toshiba Exceria Pro SDXC 64 GB UHS-II) | |
| Networking | |
| iperf3 transmit AX12 | |
| MSI Prestige 15 A10SC | |
| HP Pavilion Gaming 15-ec0017ng | |
| iperf3 receive AX12 | |
| MSI Prestige 15 A10SC | |
| HP Pavilion Gaming 15-ec0017ng | |
| |||||||||||||||||||||||||
Helderheidsverdeling: 85 %
Helderheid in Batterij-modus: 284.6 cd/m²
Contrast: 1138:1 (Zwart: 0.25 cd/m²)
ΔE ColorChecker Calman: 3.52 | ∀{0.5-29.43 Ø4.73}
calibrated: 3
ΔE Greyscale Calman: 3.2 | ∀{0.09-98 Ø4.97}
93.8% sRGB (Argyll 1.6.3 3D)
61.1% AdobeRGB 1998 (Argyll 1.6.3 3D)
68.4% AdobeRGB 1998 (Argyll 3D)
94.3% sRGB (Argyll 3D)
68.3% Display P3 (Argyll 3D)
Gamma: 2.28
CCT: 7070 K
| HP Spectre X360 15-5ZV31AV AU Optronics AUO30EB, IPS, 15.6", 3840x2160 | HP Spectre x360 15-ch011nr BOE0730, IPS, 15.6", 3840x2160 | Dell XPS 15 7590 9980HK GTX 1650 Samsung 156WR04, SDCA029, OLED, 15.6", 3840x2160 | Lenovo Yoga C940-15IRH LG Philips LP156WFC-SPU1, IPS, 15.6", 1920x1080 | MSI Prestige 15 A10SC Sharp LQ156D1JW42, IPS, 15.6", 3840x2160 | HP Spectre x360 15-df0126ng AU Optronics AUO30EB, IPS, 15.6", 3840x2160 | |
|---|---|---|---|---|---|---|
| Display | -2% | 23% | -6% | 22% | 0% | |
| Display P3 Coverage (%) | 68.3 | 68.5 0% | 88.1 29% | 61.5 -10% | 82 20% | 68.1 0% |
| sRGB Coverage (%) | 94.3 | 90.7 -4% | 99.6 6% | 92.7 -2% | 98.3 4% | 94.2 0% |
| AdobeRGB 1998 Coverage (%) | 68.4 | 66.3 -3% | 91.8 34% | 63.6 -7% | 96.2 41% | 68.4 0% |
| Response Times | 33% | 95% | 13% | -4% | 12% | |
| Response Time Grey 50% / Grey 80% * (ms) | 56.8 ? | 38 ? 33% | 2.3 ? 96% | 48.4 ? 15% | 60 ? -6% | 57 ? -0% |
| Response Time Black / White * (ms) | 40.8 ? | 27.6 ? 32% | 2.4 ? 94% | 36.4 ? 11% | 41.2 ? -1% | 31 ? 24% |
| PWM Frequency (Hz) | 943 ? | 59.5 ? | 26040 ? | |||
| Screen | -29% | -4% | 9% | 7% | -8% | |
| Brightness middle (cd/m²) | 284.6 | 329.3 16% | 421.2 48% | 484.8 70% | 464.5 63% | 330 16% |
| Brightness (cd/m²) | 285 | 316 11% | 417 46% | 463 62% | 451 58% | 310 9% |
| Brightness Distribution (%) | 85 | 84 -1% | 94 11% | 82 -4% | 92 8% | 87 2% |
| Black Level * (cd/m²) | 0.25 | 0.31 -24% | 0.26 -4% | 0.5 -100% | 0.37 -48% | |
| Contrast (:1) | 1138 | 1062 -7% | 1865 64% | 929 -18% | 892 -22% | |
| Colorchecker dE 2000 * | 3.52 | 4.78 -36% | 6.06 -72% | 4.5 -28% | 3.36 5% | 4.03 -14% |
| Colorchecker dE 2000 max. * | 5.56 | 11.75 -111% | 11.89 -114% | 7.55 -36% | 7.06 -27% | 6.74 -21% |
| Colorchecker dE 2000 calibrated * | 3 | 3.51 -17% | 1.19 60% | 3.42 -14% | 1.96 35% | |
| Greyscale dE 2000 * | 3.2 | 7.9 -147% | 2.8 13% | 5.7 -78% | 1.3 59% | 4.49 -40% |
| Gamma | 2.28 96% | 2.24 98% | 2.15 102% | 2.45 90% | 2.14 103% | 2.57 86% |
| CCT | 7070 92% | 8323 78% | 6235 104% | 6101 107% | 6596 99% | 6744 96% |
| Color Space (Percent of AdobeRGB 1998) (%) | 61.1 | 58.8 -4% | 81 33% | 58.7 -4% | 84.8 39% | 61 0% |
| Color Space (Percent of sRGB) (%) | 93.8 | 90.4 -4% | 99.6 6% | 92.8 -1% | 98.3 5% | 94 0% |
| Totaal Gemiddelde (Programma / Instellingen) | 1% /
-17% | 38% /
18% | 5% /
7% | 8% /
9% | 1% /
-4% |
* ... kleiner is beter
Responstijd Scherm
| ↔ Responstijd Zwart naar Wit | ||
|---|---|---|
| 40.8 ms ... stijging ↗ en daling ↘ gecombineerd | ↗ 20.4 ms stijging | 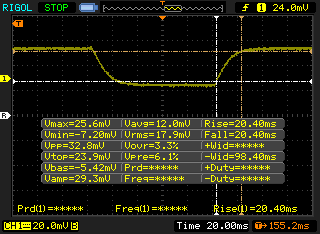 |
| ↘ 20.4 ms daling | ||
| Het scherm vertoonde trage responstijden in onze tests en is misschien te traag voor games. Ter vergelijking: alle testtoestellen variëren van 0.1 (minimum) tot 240 (maximum) ms. » 98 % van alle toestellen zijn beter. Dit betekent dat de gemeten responstijd slechter is dan het gemiddelde (19.9 ms) van alle geteste toestellen. | ||
| ↔ Responstijd 50% Grijs naar 80% Grijs | ||
| 56.8 ms ... stijging ↗ en daling ↘ gecombineerd | ↗ 26 ms stijging | 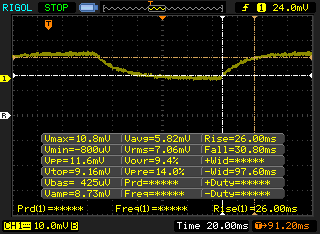 |
| ↘ 30.8 ms daling | ||
| Het scherm vertoonde trage responstijden in onze tests en is misschien te traag voor games. Ter vergelijking: alle testtoestellen variëren van 0.165 (minimum) tot 636 (maximum) ms. » 94 % van alle toestellen zijn beter. Dit betekent dat de gemeten responstijd slechter is dan het gemiddelde (31.1 ms) van alle geteste toestellen. | ||
Screen Flickering / PWM (Pulse-Width Modulation)
| Screen flickering / PWM niet waargenomen |  | ||
Ter vergelijking: 52 % van alle geteste toestellen maakten geen gebruik van PWM om de schermhelderheid te verlagen. Als het wel werd gebruikt, werd een gemiddelde van 7784 (minimum: 5 - maximum: 343500) Hz waargenomen. | |||
| Cinebench R20 | |
| CPU (Single Core) | |
| Dell XPS 13 7390 Core i7-10710U | |
| Microsoft Surface Laptop 3 15 i7-1065G7 | |
| Gemiddeld Intel Core i7-10510U (362 - 497, n=37) | |
| Asus ROG Zephyrus S GX701GXR | |
| Dynabook Portege A30-E-174 | |
| Lenovo ThinkPad P43s-20RH001FGE | |
| HP Spectre X360 15-5ZV31AV | |
| Walmart Motile M142 | |
| Microsoft Surface Laptop 3 15 Ryzen 5 3580U | |
| Dell Latitude 13 3390 | |
| Dell Inspiron 15 5000 5585 | |
| CPU (Multi Core) | |
| Dell XPS 13 7390 Core i7-10710U | |
| Asus ROG Zephyrus S GX701GXR | |
| Microsoft Surface Laptop 3 15 i7-1065G7 | |
| Microsoft Surface Laptop 3 15 Ryzen 5 3580U | |
| Dell Inspiron 15 5000 5585 | |
| Gemiddeld Intel Core i7-10510U (1015 - 1897, n=38) | |
| Walmart Motile M142 | |
| HP Spectre X360 15-5ZV31AV | |
| Dynabook Portege A30-E-174 | |
| Dell Latitude 13 3390 | |
| Lenovo ThinkPad P43s-20RH001FGE | |
| Cinebench R15 | |
| CPU Single 64Bit | |
| Microsoft Surface Laptop 3 15 i7-1065G7 | |
| Dell XPS 13 7390 Core i7-10710U | |
| Gemiddeld Intel Core i7-10510U (113 - 202, n=42) | |
| Asus ROG Zephyrus S GX701GXR | |
| HP Spectre X360 15-5ZV31AV | |
| Dynabook Portege A30-E-174 | |
| Lenovo ThinkPad P43s-20RH001FGE | |
| Walmart Motile M142 | |
| Dell Latitude 13 3390 | |
| Microsoft Surface Laptop 3 15 Ryzen 5 3580U | |
| Dell Inspiron 15 5000 5585 | |
| CPU Multi 64Bit | |
| Asus ROG Zephyrus S GX701GXR | |
| Dell XPS 13 7390 Core i7-10710U | |
| Microsoft Surface Laptop 3 15 i7-1065G7 | |
| Microsoft Surface Laptop 3 15 Ryzen 5 3580U | |
| Dell Inspiron 15 5000 5585 | |
| Gemiddeld Intel Core i7-10510U (482 - 856, n=45) | |
| Walmart Motile M142 | |
| Dell Latitude 13 3390 | |
| HP Spectre X360 15-5ZV31AV | |
| Dynabook Portege A30-E-174 | |
| Lenovo ThinkPad P43s-20RH001FGE | |
| PCMark 8 Home Score Accelerated v2 | 3365 punten | |
| PCMark 8 Work Score Accelerated v2 | 4633 punten | |
| PCMark 10 Score | 4101 punten | |
Help | ||
| HP Spectre X360 15-5ZV31AV Intel SSD 660p 2TB SSDPEKNW020T8 | Dell XPS 15 7590 9980HK GTX 1650 Toshiba XG6 KXG60ZNV1T02 | Lenovo Yoga C940-15IRH Intel Optane Memory H10 with Solid State Storage 32GB + 512GB HBRPEKNX0202A(L/H) | Asus ZenBook 15 UX534FT-DB77 Samsung SSD PM981 MZVLB1T0HALR | HP Spectre x360 15-ch011nr SK hynix PC401 NVMe 500 GB | |
|---|---|---|---|---|---|
| AS SSD | 42% | -20% | 27% | -4% | |
| Seq Read (MB/s) | 1220 | 1723 41% | 769 -37% | 1887 55% | 1739 43% |
| Seq Write (MB/s) | 1152 | 1386 20% | 351.1 -70% | 1432 24% | 1189 3% |
| 4K Read (MB/s) | 52.3 | 43.25 -17% | 69.1 32% | 52.3 0% | 38.76 -26% |
| 4K Write (MB/s) | 146.6 | 98.3 -33% | 100.9 -31% | 146 0% | 93.2 -36% |
| 4K-64 Read (MB/s) | 652 | 1078 65% | 472 -28% | 969 49% | 646 -1% |
| 4K-64 Write (MB/s) | 847 | 1456 72% | 948 12% | 1375 62% | 545 -36% |
| Access Time Read * (ms) | 0.077 | 0.05 35% | 0.071 8% | 0.034 56% | 0.054 30% |
| Access Time Write * (ms) | 0.106 | 0.039 63% | 0.137 -29% | 0.075 29% | 0.051 52% |
| Score Read (Points) | 826 | 1294 57% | 618 -25% | 1210 46% | 859 4% |
| Score Write (Points) | 1109 | 1693 53% | 1084 -2% | 1664 50% | 757 -32% |
| Score Total (Points) | 2371 | 3638 53% | 2024 -15% | 3483 47% | 2037 -14% |
| Copy ISO MB/s (MB/s) | 2070 | 3182 54% | 839 -59% | 1375 -34% | 1668 -19% |
| Copy Program MB/s (MB/s) | 571 | 984 72% | 455.8 -20% | 468 -18% | 486.8 -15% |
| Copy Game MB/s (MB/s) | 1219 | 1824 50% | 969 -21% | 1287 6% | 1042 -15% |
* ... kleiner is beter

| 3DMark 11 Performance | 4929 punten | |
| 3DMark Cloud Gate Standard Score | 12540 punten | |
| 3DMark Fire Strike Score | 3206 punten | |
| 3DMark Time Spy Score | 1218 punten | |
Help | ||
| The Witcher 3 | |
| 1366x768 Medium Graphics & Postprocessing | |
| Lenovo Yoga C940-15IRH | |
| Dell G3 3590 | |
| HP Spectre x360 15-df0126ng | |
| HP Spectre X360 15-5ZV31AV | |
| Xiaomi Mi Notebook Pro i7 | |
| Gemiddeld NVIDIA GeForce MX250 (30 - 40, n=27) | |
| 1920x1080 High Graphics & Postprocessing (Nvidia HairWorks Off) | |
| Asus TUF FX705GM | |
| Dell G3 3590 | |
| Lenovo Yoga C940-15IRH | |
| HP Spectre x360 15-df0126ng | |
| HP Spectre X360 15-5ZV31AV | |
| Gemiddeld NVIDIA GeForce MX250 (16.3 - 23.1, n=27) | |
| Xiaomi Mi Notebook Pro i7 | |
| Dell Inspiron 15 5000 5585 | |
| 1920x1080 Ultra Graphics & Postprocessing (HBAO+) | |
| Asus TUF FX705GM | |
| Lenovo Yoga C940-15IRH | |
| Dell G3 3590 | |
| HP Spectre x360 15-df0126ng | |
| HP Spectre X360 15-5ZV31AV | |
| Gemiddeld NVIDIA GeForce MX250 (9 - 16, n=24) | |
| Xiaomi Mi Notebook Pro i7 | |
| Dell Inspiron 15 5000 5585 | |
| lage | gem. | hoge | ultra | |
|---|---|---|---|---|
| BioShock Infinite (2013) | 203 | 112.2 | 94.2 | 35.3 |
| The Witcher 3 (2015) | 38.7 | 21.9 | 12.2 | |
| Shadow of the Tomb Raider (2018) | 53 | 18 | 13 | 9 |
| HP Spectre X360 15-5ZV31AV GeForce MX250, i7-10510U, Intel SSD 660p 2TB SSDPEKNW020T8 | Dell XPS 15 7590 9980HK GTX 1650 GeForce GTX 1650 Mobile, i9-9980HK, Toshiba XG6 KXG60ZNV1T02 | Lenovo Yoga C940-15IRH GeForce GTX 1650 Max-Q, i7-9750H, Intel Optane Memory H10 with Solid State Storage 32GB + 512GB HBRPEKNX0202A(L/H) | Asus ZenBook 15 UX534FT-DB77 GeForce GTX 1650 Max-Q, i7-8565U, Samsung SSD PM981 MZVLB1T0HALR | MSI Prestige 15 A10SC GeForce GTX 1650 Max-Q, i7-10710U, Samsung SSD PM981 MZVLB1T0HALR | HP Spectre x360 15-ch011nr GeForce MX150, i5-8550U, SK hynix PC401 NVMe 500 GB | |
|---|---|---|---|---|---|---|
| Noise | -9% | -7% | 2% | -1% | 2% | |
| uit / omgeving * (dB) | 30.1 | 28.2 6% | 28.7 5% | 28.4 6% | 29.3 3% | 28.6 5% |
| Idle Minimum * (dB) | 30.1 | 28.2 6% | 28.7 5% | 28.4 6% | 30.1 -0% | 29.2 3% |
| Idle Average * (dB) | 30.1 | 28.2 6% | 28.8 4% | 28.4 6% | 30.2 -0% | 29.2 3% |
| Idle Maximum * (dB) | 30.1 | 30.4 -1% | 28.8 4% | 28.4 6% | 30.2 -0% | 29.2 3% |
| Load Average * (dB) | 30.1 | 43.8 -46% | 45 -50% | 33.9 -13% | 31.5 -5% | 29.2 3% |
| Witcher 3 ultra * (dB) | 39.7 | 47.2 -19% | 44.7 -13% | 39.8 -0% | 37 7% | 38.4 3% |
| Load Maximum * (dB) | 42 | 47.2 -12% | 44.7 -6% | 40.2 4% | 47 -12% | 45.7 -9% |
* ... kleiner is beter
Geluidsniveau
| Onbelast |
| 30.1 / 30.1 / 30.1 dB (A) |
| Belasting |
| 30.1 / 42 dB (A) |
 | ||
30 dB stil 40 dB(A) hoorbaar 50 dB(A) luid |
||
min: | ||
(-) De maximumtemperatuur aan de bovenzijde bedraagt 47 °C / 117 F, vergeleken met het gemiddelde van 36.8 °C / 98 F, variërend van 21 tot 71 °C voor de klasse Multimedia.
(-) De bodem warmt op tot een maximum van 47.4 °C / 117 F, vergeleken met een gemiddelde van 39.1 °C / 102 F
(+) Bij onbelast gebruik bedraagt de gemiddelde temperatuur voor de bovenzijde 21.4 °C / 71 F, vergeleken met het apparaatgemiddelde van 31.3 °C / 88 F.
(±) Bij het spelen van The Witcher 3 is de gemiddelde temperatuur voor de bovenzijde 33.6 °C / 92 F, vergeleken met het apparaatgemiddelde van 31.3 °C / 88 F.
(+) De palmsteunen en het touchpad zijn met een maximum van ###max## °C / 85.6 F koeler dan de huidtemperatuur en voelen daarom koel aan.
(±) De gemiddelde temperatuur van de handpalmsteun van soortgelijke toestellen bedroeg 28.7 °C / 83.7 F (-1.1 °C / -1.9 F).
HP Spectre X360 15-5ZV31AV audioanalyse
(+) | luidsprekers kunnen relatief luid spelen (82.7 dB)
Bas 100 - 315 Hz
(±) | verminderde zeebaars - gemiddeld 13.6% lager dan de mediaan
(±) | lineariteit van de lage tonen is gemiddeld (11.8% delta ten opzichte van de vorige frequentie)
Midden 400 - 2000 Hz
(+) | evenwichtige middens - slechts 2.5% verwijderd van de mediaan
(+) | de middentonen zijn lineair (6.7% delta ten opzichte van de vorige frequentie)
Hoog 2 - 16 kHz
(+) | evenwichtige hoogtepunten - slechts 2.5% verwijderd van de mediaan
(±) | lineariteit van de hoogtepunten is gemiddeld (7% delta ten opzichte van de vorige frequentie)
Algemeen 100 - 16.000 Hz
(±) | lineariteit van het totale geluid is gemiddeld (15.4% verschil met de mediaan)
Vergeleken met dezelfde klasse
» 39% van alle geteste apparaten in deze klasse waren beter, 3% vergelijkbaar, 59% slechter
» De beste had een delta van 5%, het gemiddelde was 17%, de slechtste was 45%
Vergeleken met alle geteste toestellen
» 22% van alle geteste apparaten waren beter, 4% gelijk, 73% slechter
» De beste had een delta van 4%, het gemiddelde was 24%, de slechtste was 134%
Apple MacBook 12 (Early 2016) 1.1 GHz audioanalyse
(+) | luidsprekers kunnen relatief luid spelen (83.6 dB)
Bas 100 - 315 Hz
(±) | verminderde zeebaars - gemiddeld 11.3% lager dan de mediaan
(±) | lineariteit van de lage tonen is gemiddeld (14.2% delta ten opzichte van de vorige frequentie)
Midden 400 - 2000 Hz
(+) | evenwichtige middens - slechts 2.4% verwijderd van de mediaan
(+) | de middentonen zijn lineair (5.5% delta ten opzichte van de vorige frequentie)
Hoog 2 - 16 kHz
(+) | evenwichtige hoogtepunten - slechts 2% verwijderd van de mediaan
(+) | de hoge tonen zijn lineair (4.5% delta naar de vorige frequentie)
Algemeen 100 - 16.000 Hz
(+) | het totale geluid is lineair (10.2% verschil met de mediaan)
Vergeleken met dezelfde klasse
» 7% van alle geteste apparaten in deze klasse waren beter, 2% vergelijkbaar, 91% slechter
» De beste had een delta van 5%, het gemiddelde was 18%, de slechtste was 53%
Vergeleken met alle geteste toestellen
» 5% van alle geteste apparaten waren beter, 1% gelijk, 94% slechter
» De beste had een delta van 4%, het gemiddelde was 24%, de slechtste was 134%
| Uit / Standby | |
| Inactief | |
| Belasting |
|
Key:
min: | |
| HP Spectre X360 15-5ZV31AV i7-10510U, GeForce MX250, Intel SSD 660p 2TB SSDPEKNW020T8, IPS, 3840x2160, 15.6" | HP Spectre x360 15-ch011nr i5-8550U, GeForce MX150, SK hynix PC401 NVMe 500 GB, IPS, 3840x2160, 15.6" | Dell XPS 15 7590 9980HK GTX 1650 i9-9980HK, GeForce GTX 1650 Mobile, Toshiba XG6 KXG60ZNV1T02, OLED, 3840x2160, 15.6" | Lenovo Yoga C940-15IRH i7-9750H, GeForce GTX 1650 Max-Q, Intel Optane Memory H10 with Solid State Storage 32GB + 512GB HBRPEKNX0202A(L/H), IPS, 1920x1080, 15.6" | Asus ZenBook 15 UX534FT-DB77 i7-8565U, GeForce GTX 1650 Max-Q, Samsung SSD PM981 MZVLB1T0HALR, IPS, 1920x1080, 15.6" | MSI Prestige 15 A10SC i7-10710U, GeForce GTX 1650 Max-Q, Samsung SSD PM981 MZVLB1T0HALR, IPS, 3840x2160, 15.6" | |
|---|---|---|---|---|---|---|
| Power Consumption | -13% | -57% | -56% | -45% | -39% | |
| Idle Minimum * (Watt) | 5.2 | 5.3 -2% | 6.2 -19% | 5.2 -0% | 5 4% | 6.1 -17% |
| Idle Average * (Watt) | 8.5 | 9.8 -15% | 9.6 -13% | 10.7 -26% | 13.2 -55% | 13.2 -55% |
| Idle Maximum * (Watt) | 8.7 | 12.6 -45% | 21.2 -144% | 24.3 -179% | 24 -176% | 19.2 -121% |
| Load Average * (Watt) | 65.6 | 73 -11% | 104.3 -59% | 84.4 -29% | 70 -7% | 75 -14% |
| Witcher 3 ultra * (Watt) | 56.5 | 67.6 -20% | 91.7 -62% | 83.9 -48% | 63.3 -12% | 74 -31% |
| Load Maximum * (Watt) | 92.4 | 80 13% | 135.3 -46% | 142.8 -55% | 114 -23% | 89.7 3% |
* ... kleiner is beter
| HP Spectre X360 15-5ZV31AV i7-10510U, GeForce MX250, 84 Wh | Dell XPS 15 7590 9980HK GTX 1650 i9-9980HK, GeForce GTX 1650 Mobile, 97 Wh | Lenovo Yoga C940-15IRH i7-9750H, GeForce GTX 1650 Max-Q, 69 Wh | Asus ZenBook 15 UX534FT-DB77 i7-8565U, GeForce GTX 1650 Max-Q, 71 Wh | MSI Prestige 15 A10SC i7-10710U, GeForce GTX 1650 Max-Q, 82 Wh | HP Spectre x360 15-ch011nr i5-8550U, GeForce MX150, 84 Wh | |
|---|---|---|---|---|---|---|
| Batterijduur | -16% | -32% | -9% | -24% | -19% | |
| Reader / Idle (h) | 22.6 | 15.2 -33% | 18.2 -19% | 21.5 -5% | 19.1 -15% | 15.5 -31% |
| WiFi v1.3 (h) | 10.8 | 7.8 -28% | 9.7 -10% | 8.4 -22% | 7.6 -30% | 10.4 -4% |
| Load (h) | 2.9 | 3.3 14% | 1 -66% | 2.9 0% | 2.1 -28% | 2.3 -21% |
Pro
Contra

Dit is de verkorte versie van het originele artikel. Het volledige, Engelse testrapport vind je hier.
In ons testrapport van de Ice Lake Spectre x360 13 en Kaby Lake-G Spectre x360 15-modellen ontdekten we dat de kloksnelheden, frame-rates en ventilatoractiviteit sterk fluctueerden onder zware belasting, wat de gaming-ervaring niet ten goede kwam. Deze Comet Lake-U Spectre x360 15 vertoont gelijkaardig gedrag tijdens het gamen. Veeleisende gebruikers die op zoek zijn naar meer consistent prestaties kunnen deze specifieke configuratie van de Spectre dus maar beter vermijden.
De Comet Lake-U Core i7-10510U en GeForce MX250 zijn nauwelijks sneller dan de Whiskey Lake-U Core i7-8565U en GeForce MX150. Combineer dat met het feit dat het Comet Lake-U 2019-model hetzelfde toetsenbord, scherm en dezelfde batterijduur en behuizing heeft als het goedkopere Whiskey Lake-U-model en je krijgt een systeem dan de upgrade niet waard is als je reeds over een Spectre beschikt. Buitenstaanders die de convertible van HP overwegen, kunnen beter voor het model met Whiskey Lake-U kiezen omwille van de superieure prestaties per euro.
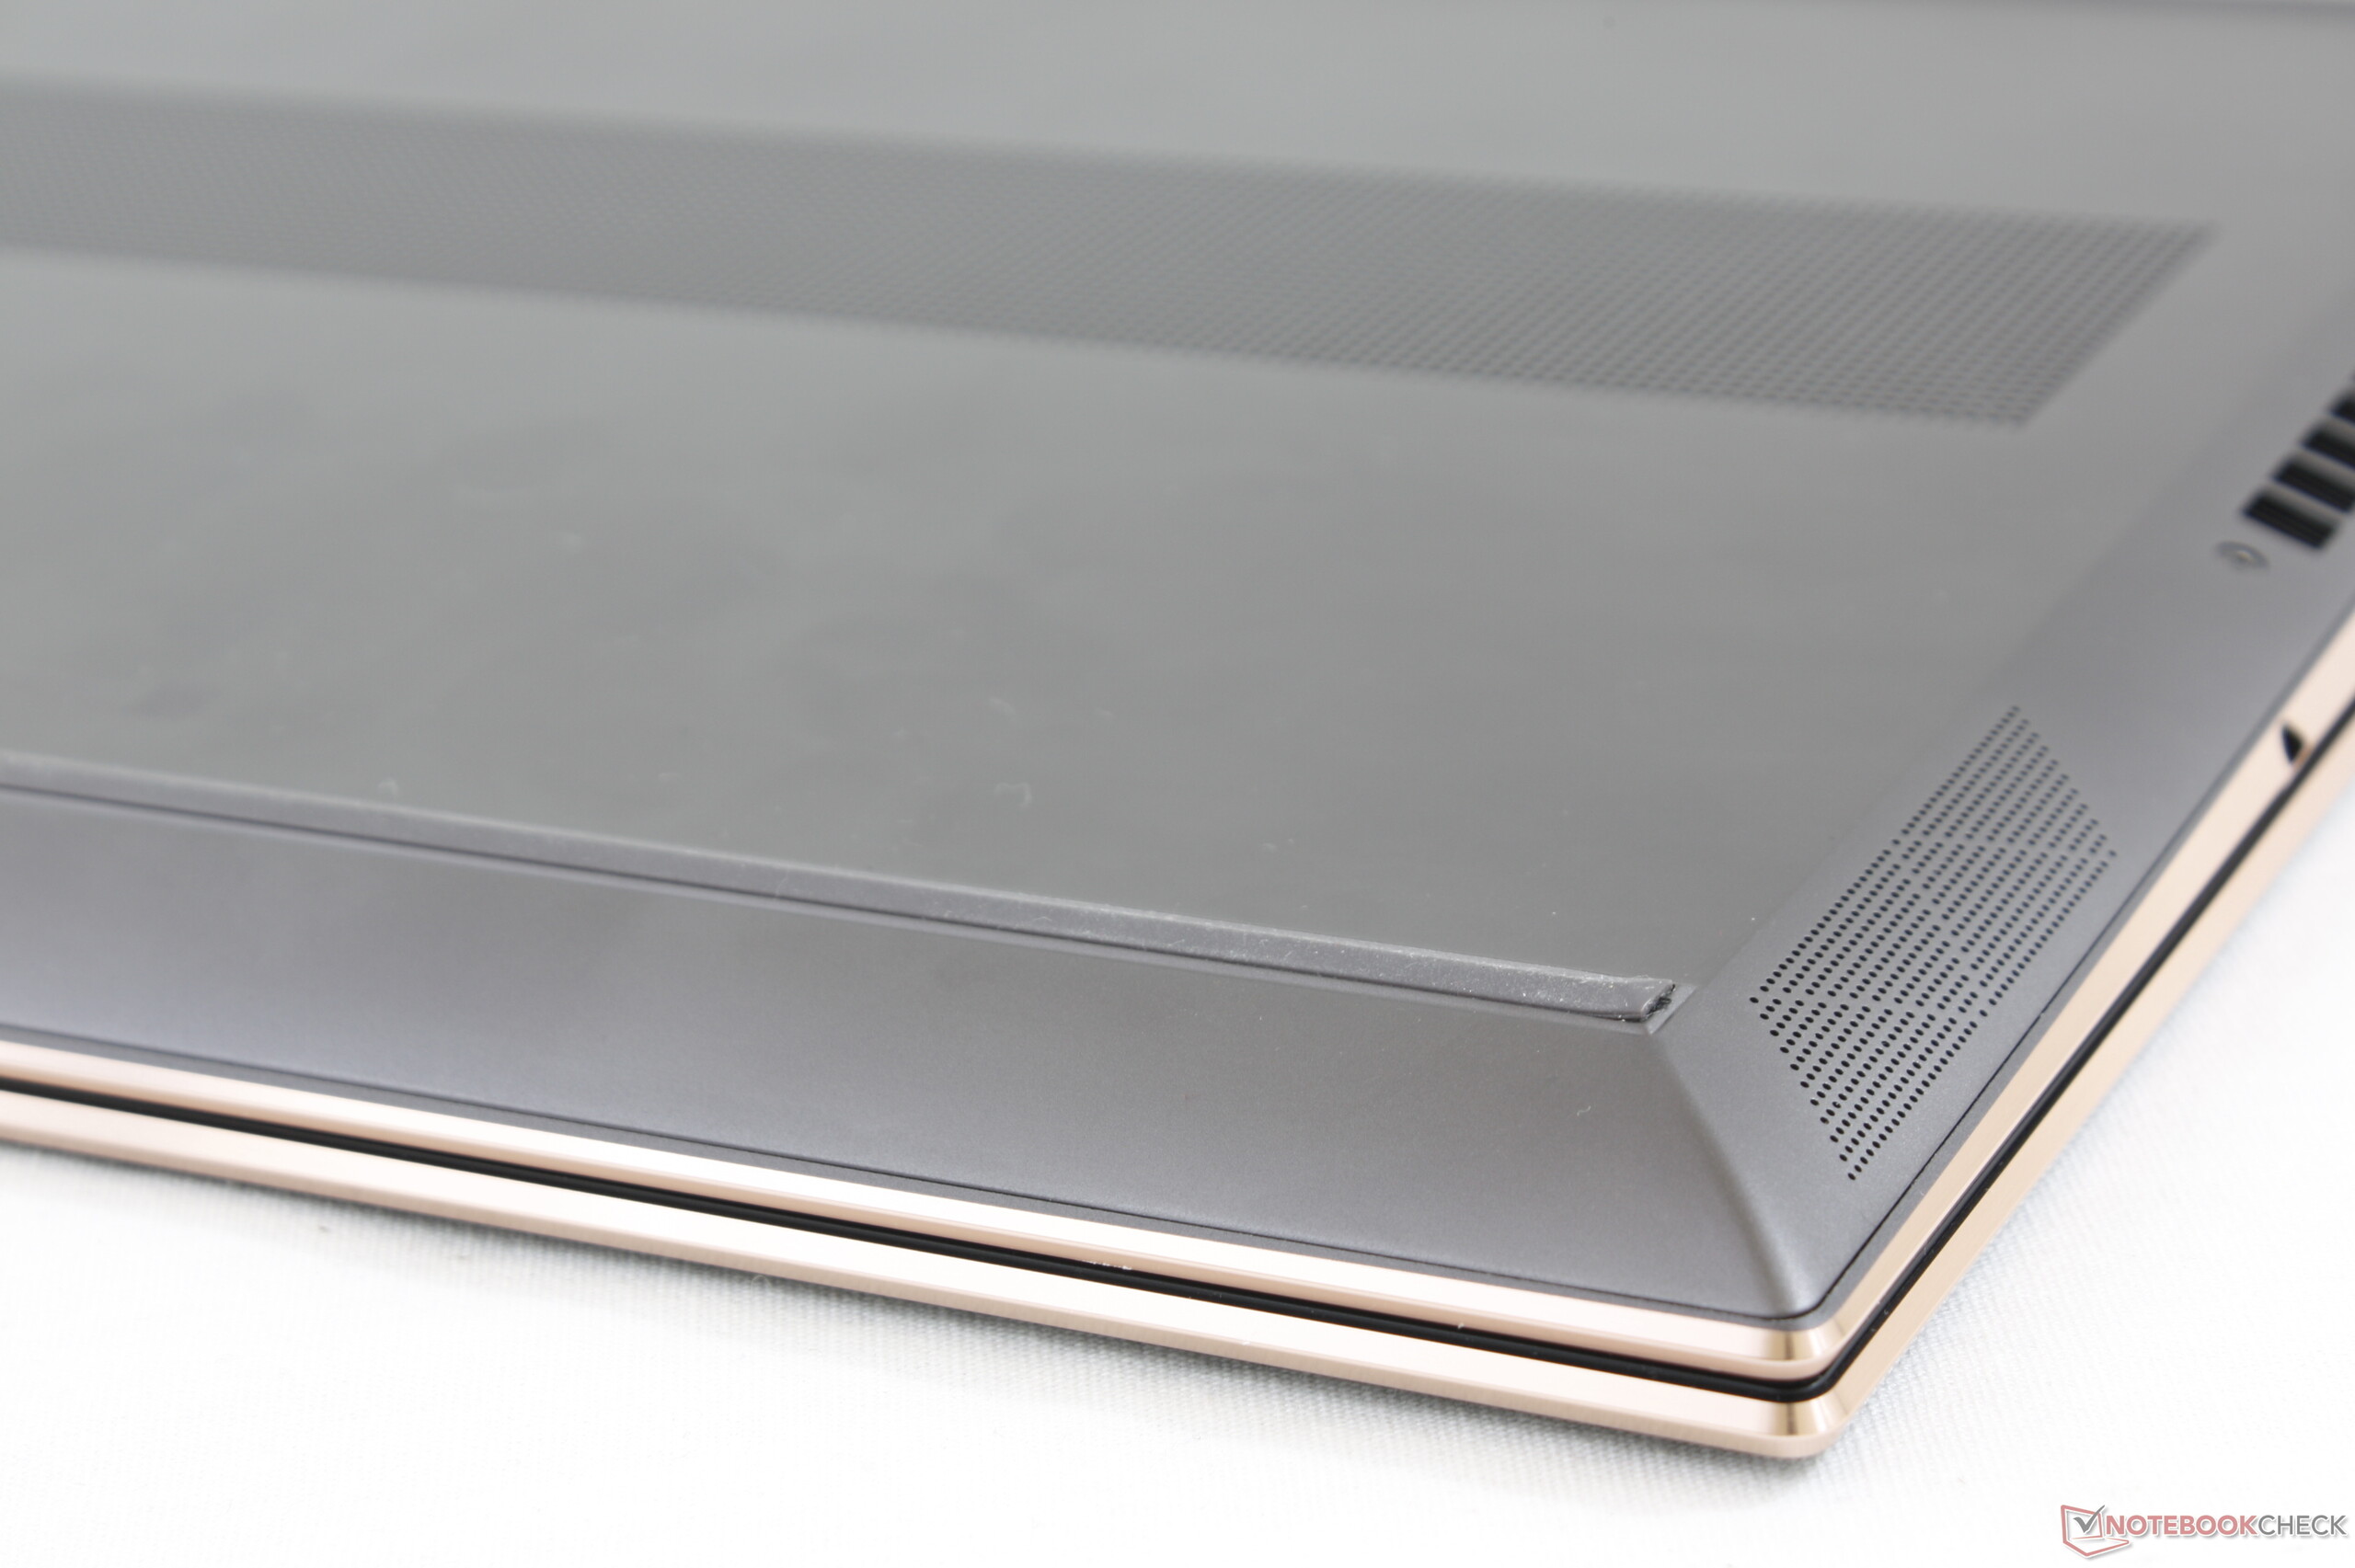
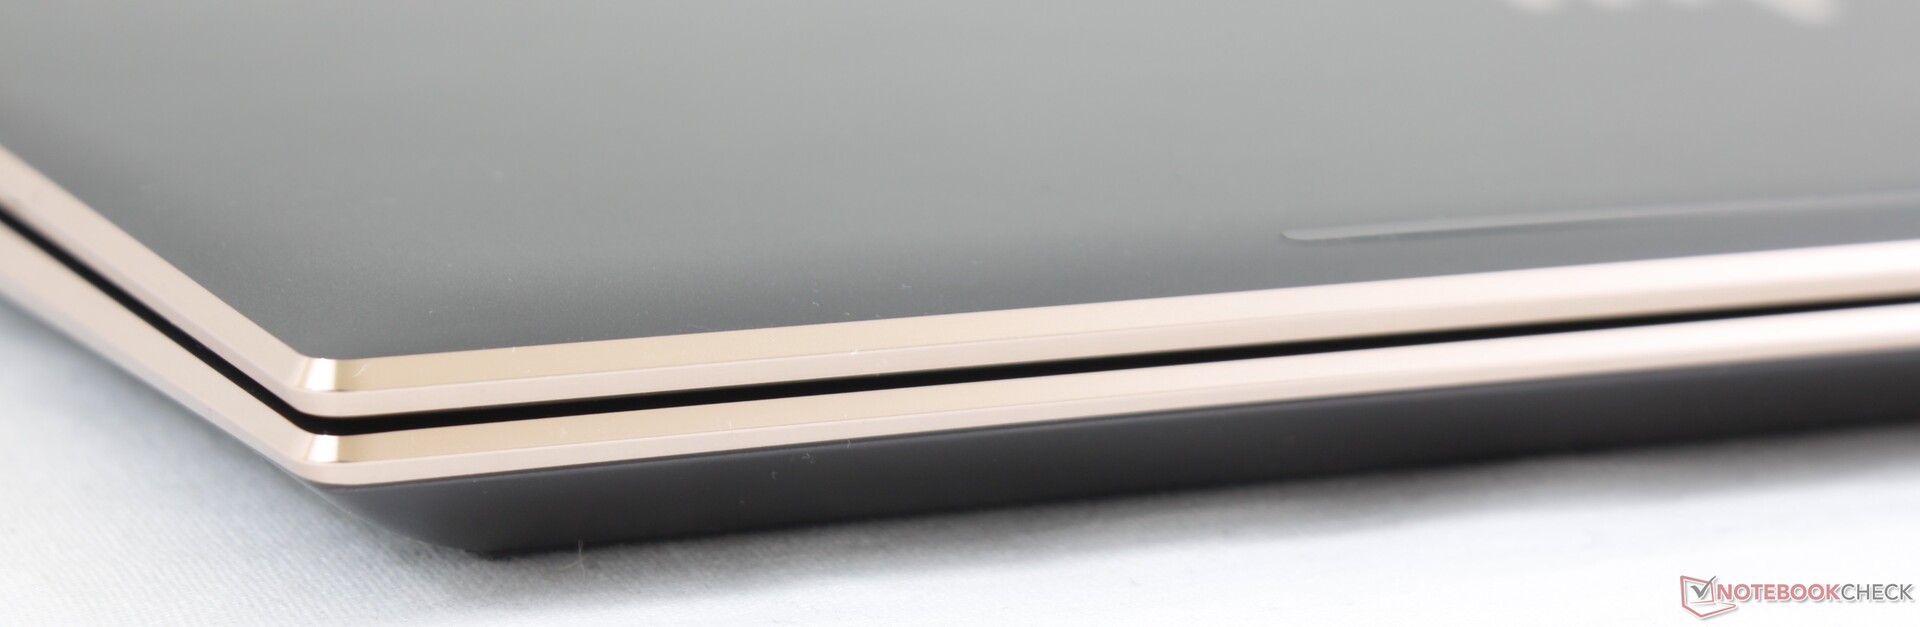
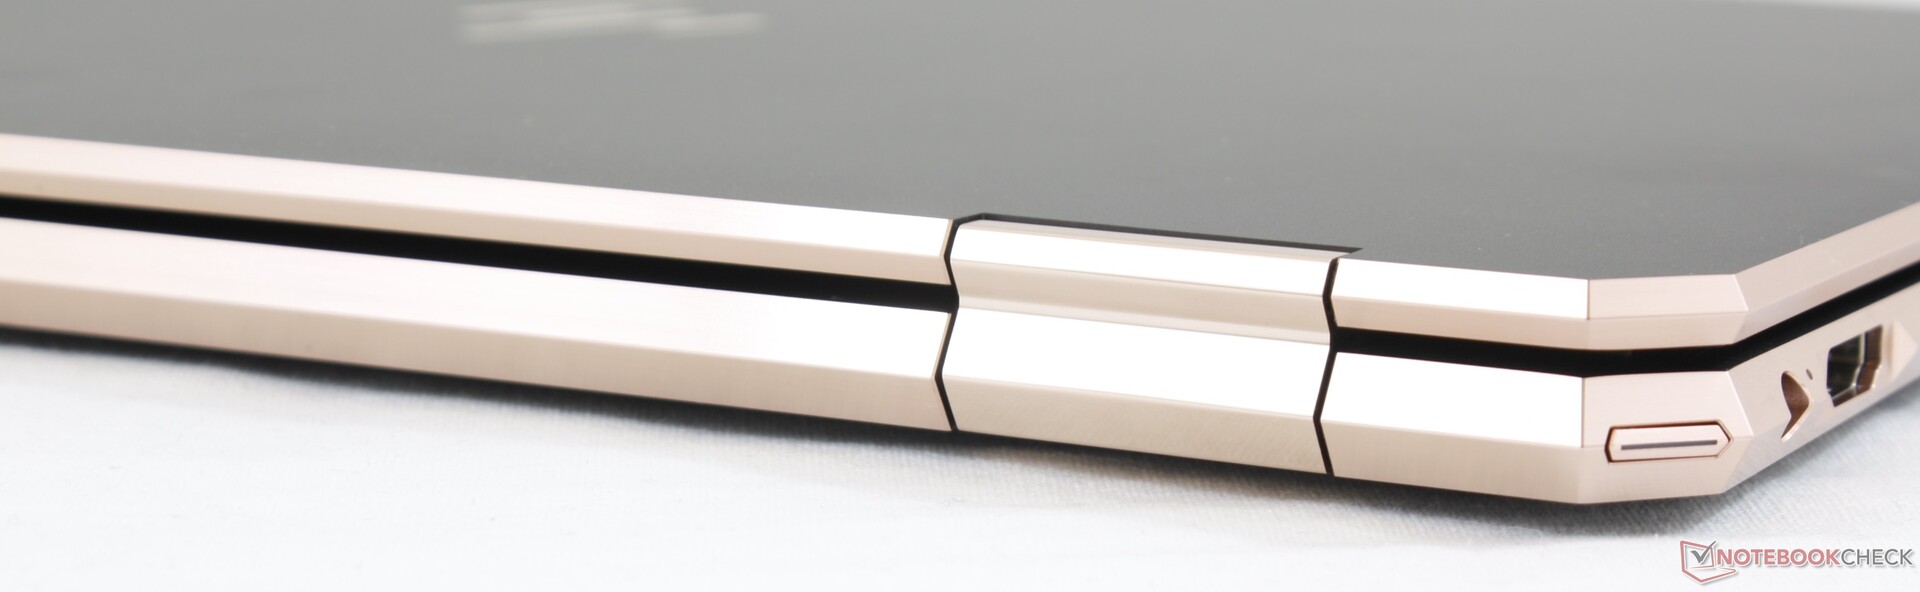
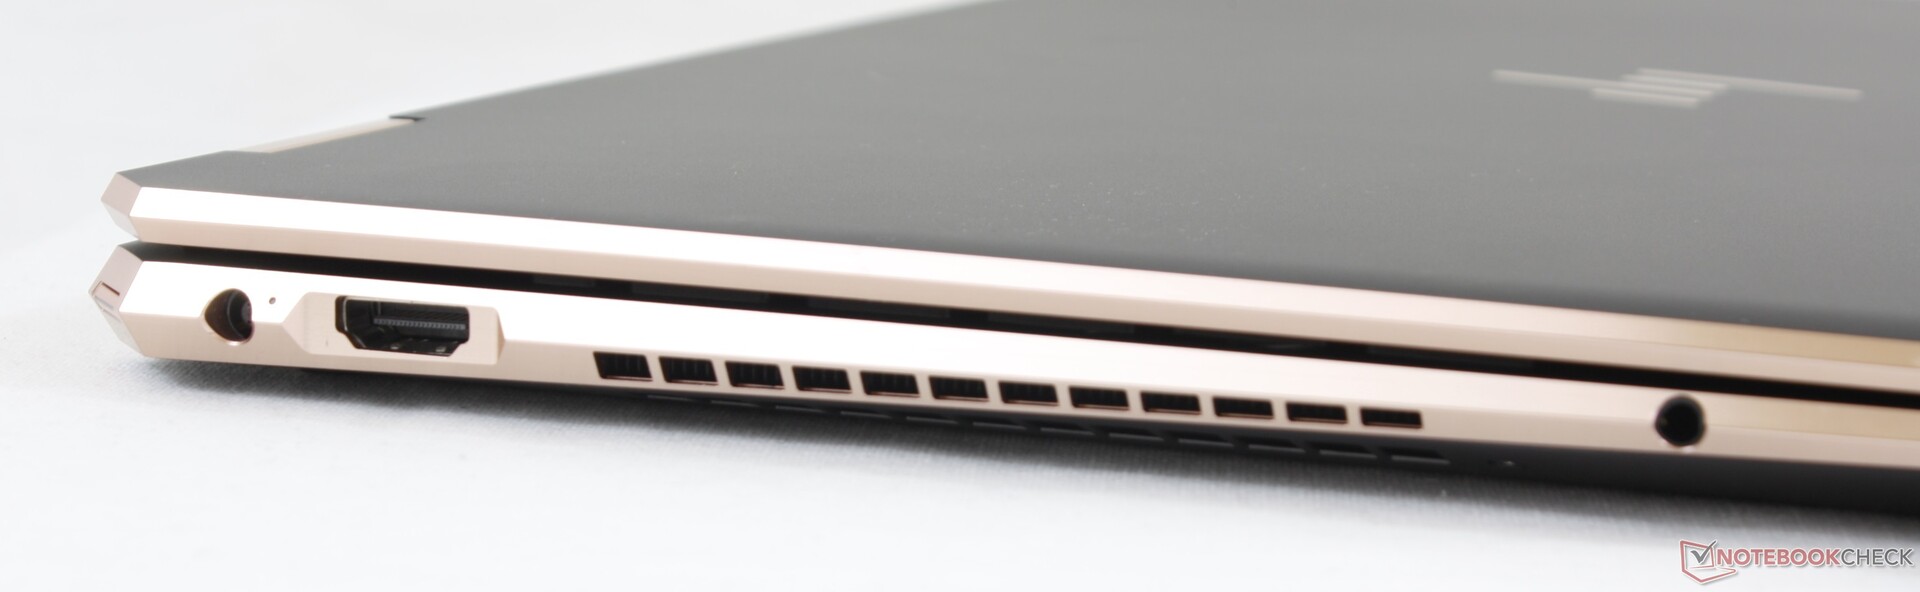
Afgezien van deze prestatieproblemen is de behuizing van de Spectre x360 15 uitstekend, waardoor de tablet behoort tot de stevigste 15.6-inch-convertibles op de consumentenmarkt. De batterijduur is prima en de ventilatoren blijven redelijk stil bij het uitvoeren van eenvoudige kantoortaken.
Gebruikers die bereid zijn om een paar maanden te wachten, zouden de 2020 Spectre x360 15 kunnen overwegen. Deze brengt een aantal grotere updates, waaronder veel smallere schermranden en krachtigere hexa-core-CPU's en GTX 1650 Max-Q Turing-GPU's.
HP Spectre X360 15-5ZV31AV
- 16-01-2020 v7 (old)
Allen Ngo
Price comparison
