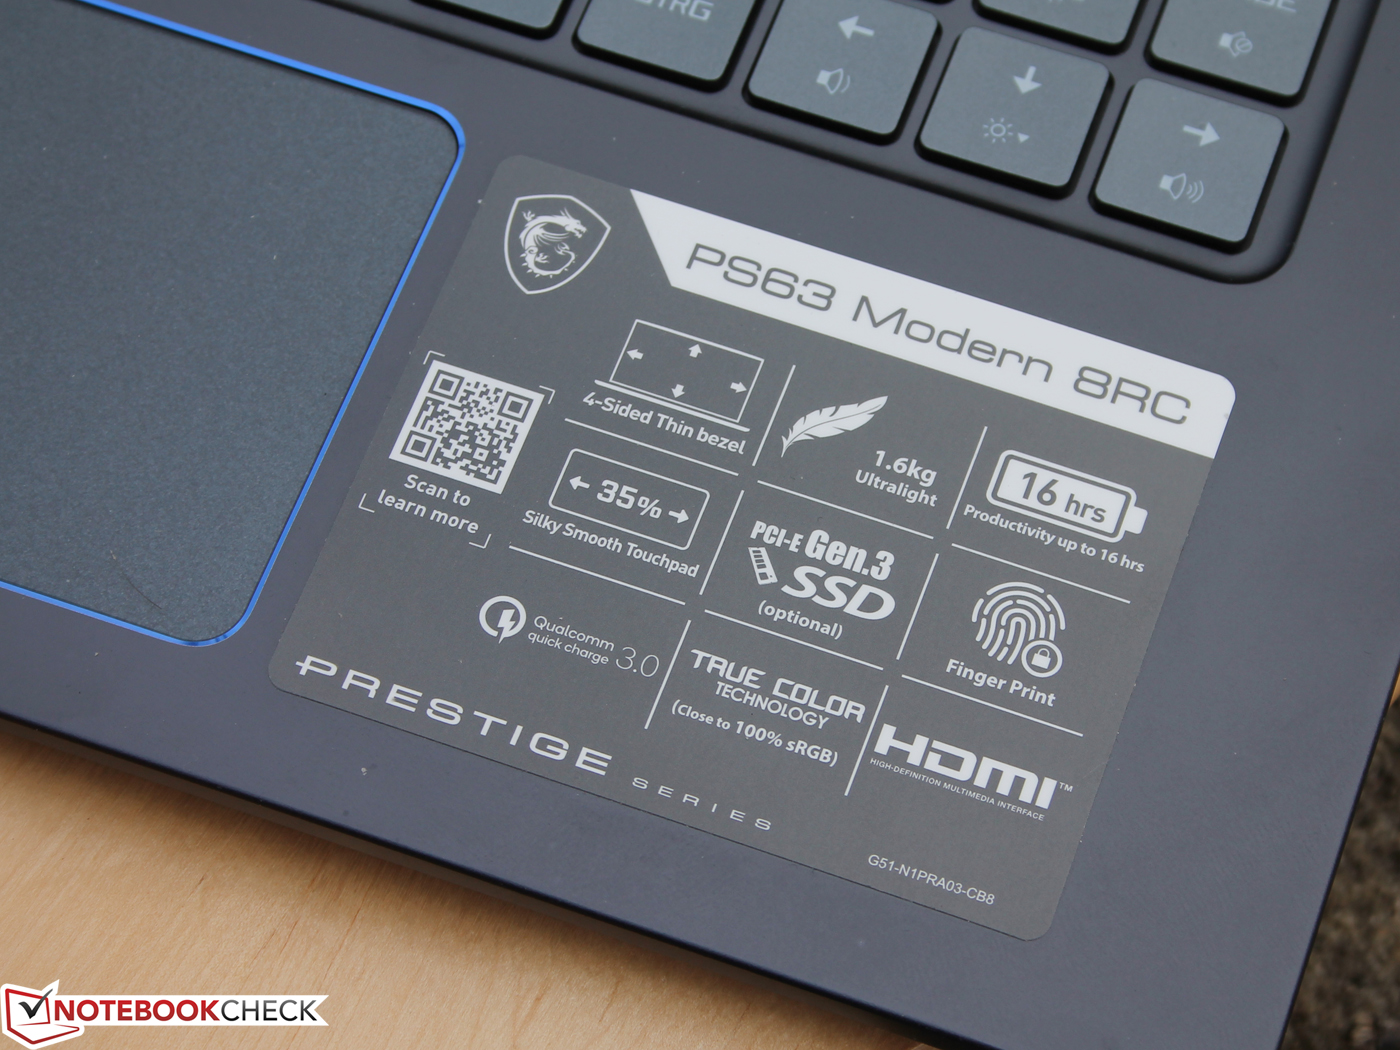
Kort testrapport MSI PS63 Modern 8RC (Core i7-8565U, GTX 1050 Max-Q) Laptop

| SD Card Reader | |
| average JPG Copy Test (av. of 3 runs) | |
| Gigabyte Aero 15X v8 (Toshiba Exceria Pro SDXC 64 GB UHS-II) | |
| Lenovo ThinkPad X1 Extreme-20MF000RGE (Toshiba Exceria Pro SDXC 64 GB UHS-II) | |
| Schenker Key 15 Coffee Lake (Toshiba Exceria Pro SDXC 64 GB UHS-II) | |
| Microsoft Surface Book 2 (Toshiba Exceria Pro SDXC 64 GB UHS-II) | |
| Gemiddelde van klas Multimedia (23 - 531, n=36, laatste 2 jaar) | |
| Dell XPS 15 2018 i5 FHD 97Wh | |
| Lenovo Ideapad 720S-15IKB 81AC001AGE (Toshiba Exceria Pro M501) | |
| Schenker XMG Neo 15 (Toshiba Exceria Pro SDXC 64 GB UHS-II) | |
| MSI PS63 Modern 8RC (Toshiba Exceria Pro SDXC 64 GB UHS-II) | |
| MSI Prestige PS42 8RB-059 (Toshiba Exceria Pro SDXC 64 GB UHS-II) | |
| maximum AS SSD Seq Read Test (1GB) | |
| Gigabyte Aero 15X v8 (Toshiba Exceria Pro SDXC 64 GB UHS-II) | |
| Microsoft Surface Book 2 (Toshiba Exceria Pro SDXC 64 GB UHS-II) | |
| Lenovo ThinkPad X1 Extreme-20MF000RGE (Toshiba Exceria Pro SDXC 64 GB UHS-II) | |
| Schenker Key 15 Coffee Lake (Toshiba Exceria Pro SDXC 64 GB UHS-II) | |
| Dell XPS 15 2018 i5 FHD 97Wh | |
| Gemiddelde van klas Multimedia (37.3 - 1455, n=35, laatste 2 jaar) | |
| Lenovo Ideapad 720S-15IKB 81AC001AGE (Toshiba Exceria Pro M501) | |
| Schenker XMG Neo 15 (Toshiba Exceria Pro SDXC 64 GB UHS-II) | |
| MSI PS63 Modern 8RC (Toshiba Exceria Pro SDXC 64 GB UHS-II) | |
| MSI Prestige PS42 8RB-059 (Toshiba Exceria Pro SDXC 64 GB UHS-II) | |
| |||||||||||||||||||||||||
Helderheidsverdeling: 75 %
Helderheid in Batterij-modus: 289 cd/m²
Contrast: 1112:1 (Zwart: 0.26 cd/m²)
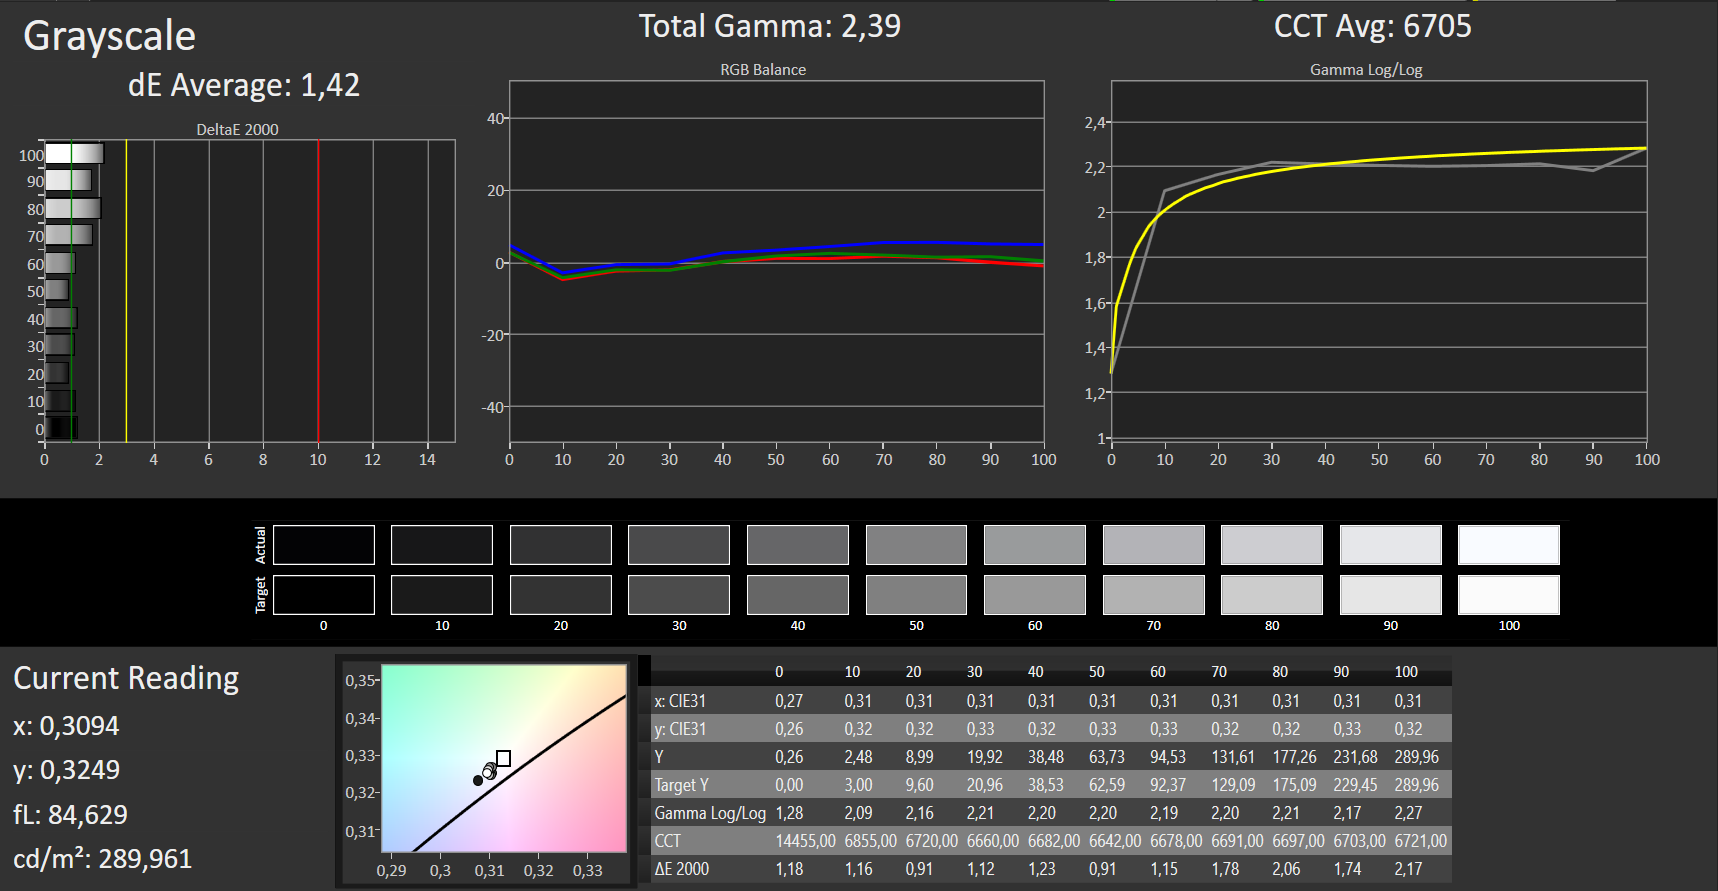
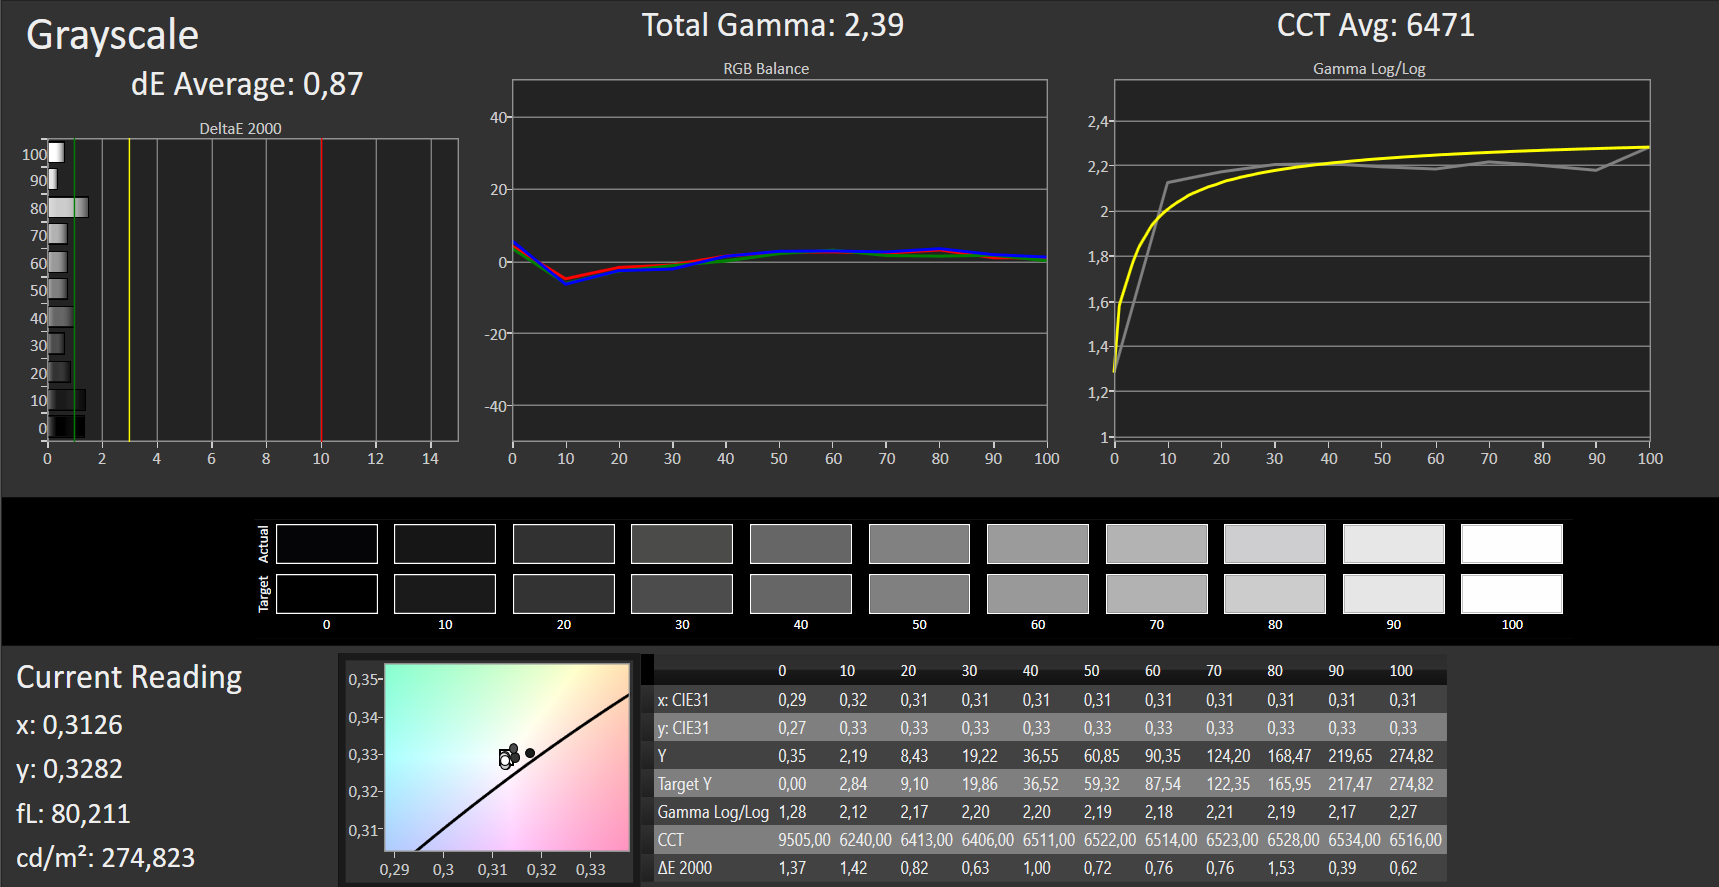
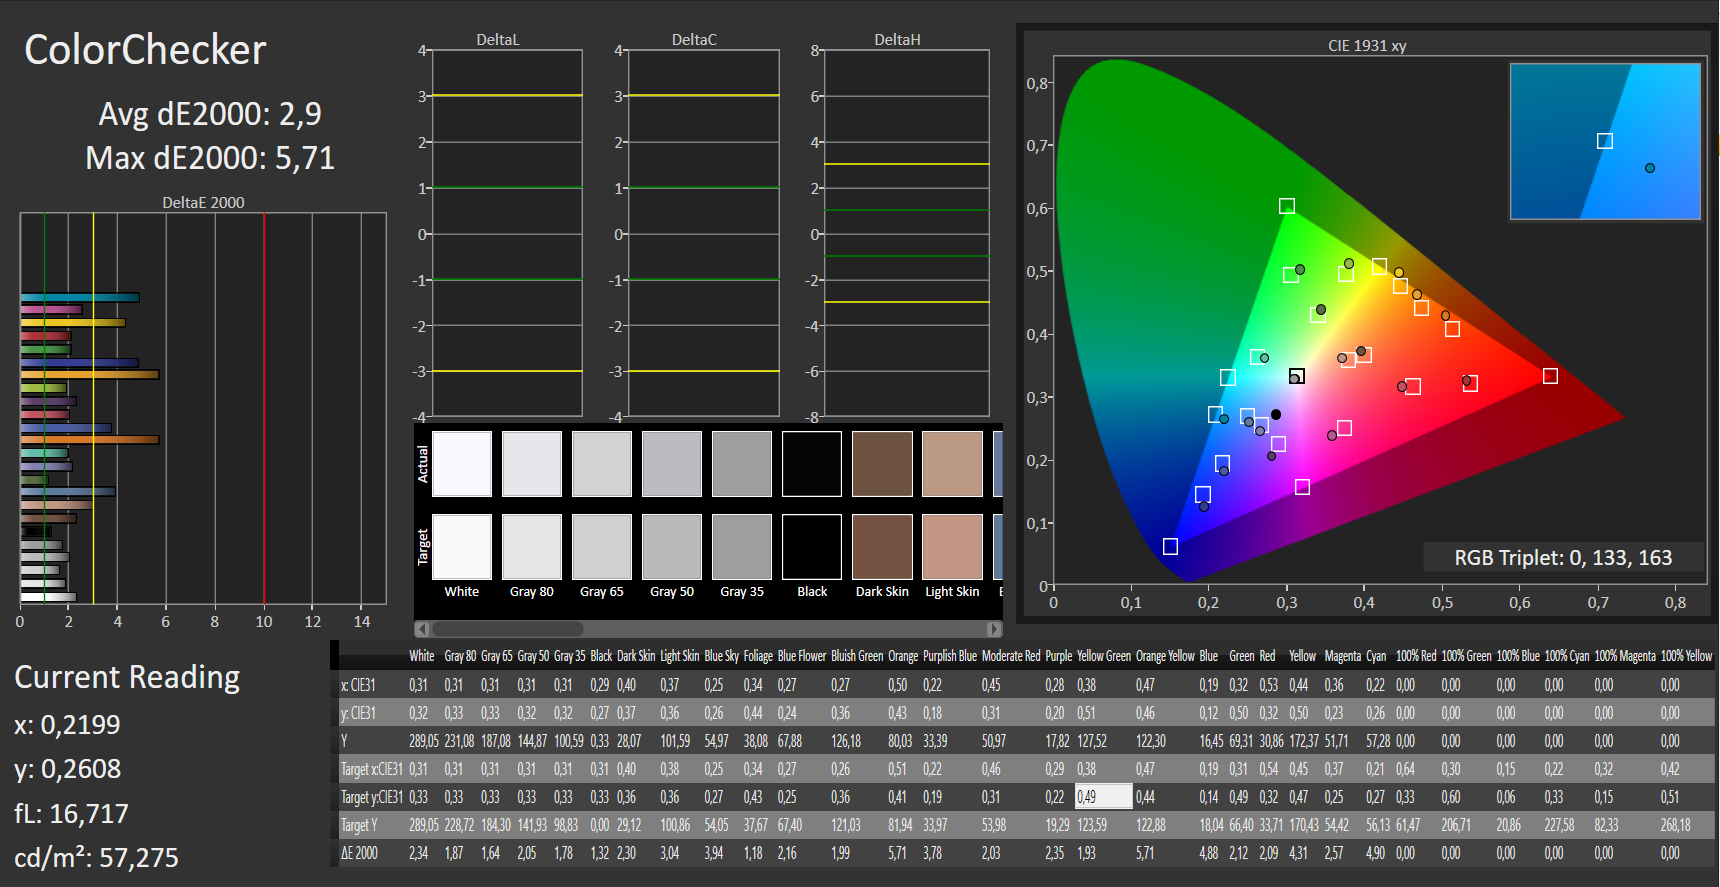
ΔE ColorChecker Calman: 2.9 | ∀{0.5-29.43 Ø4.71}
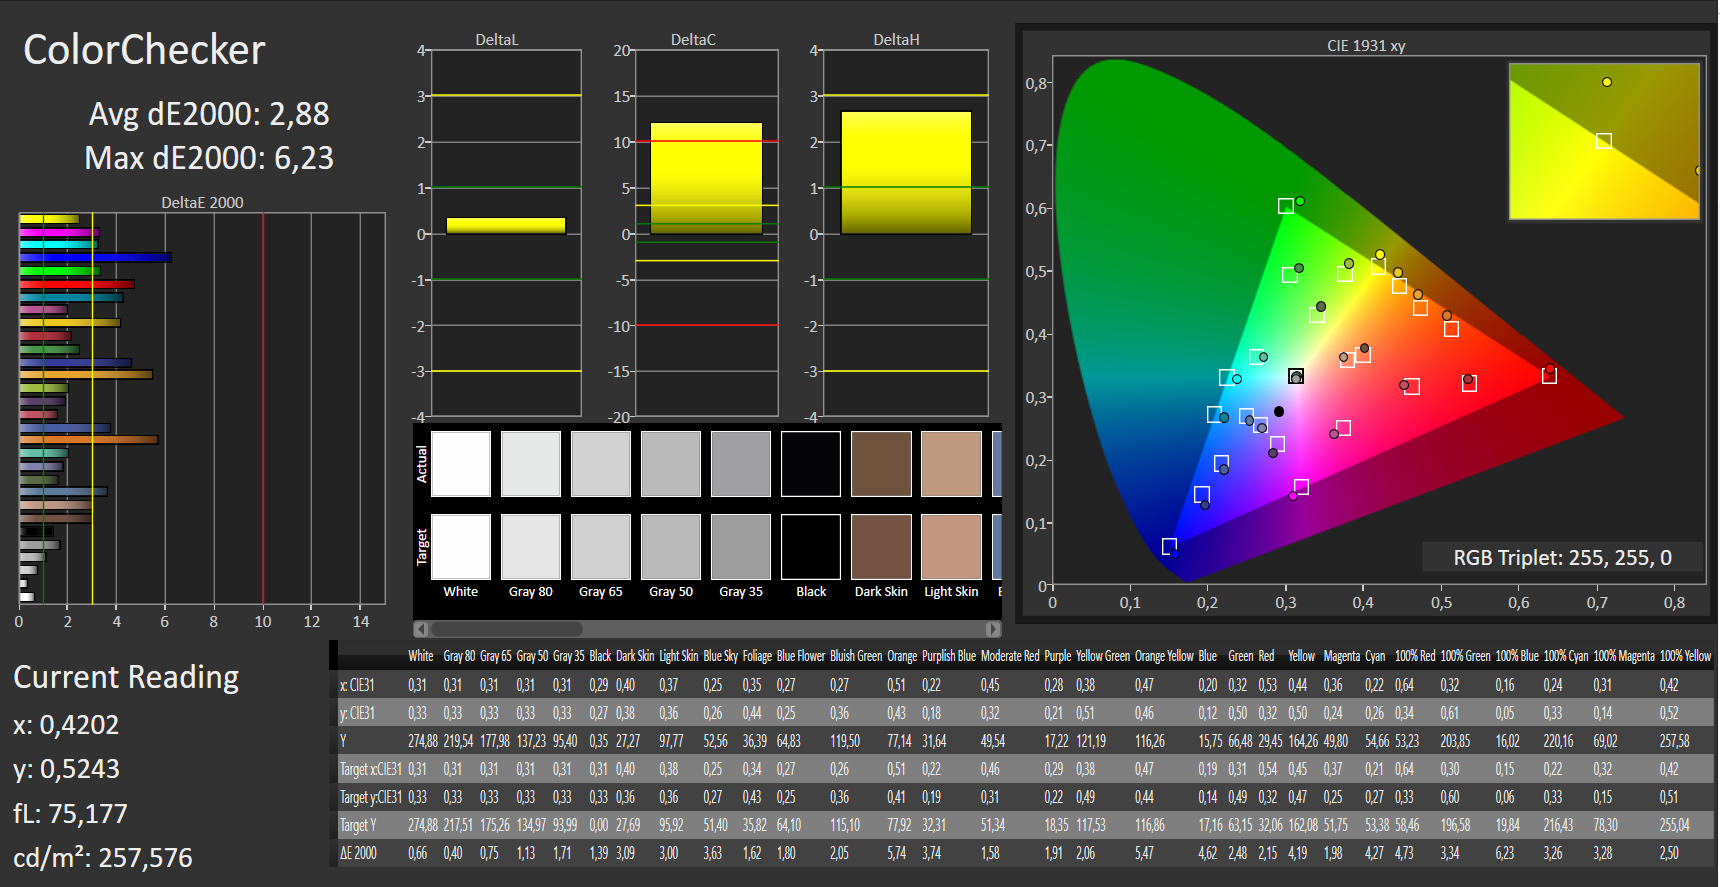
calibrated: 2.88
ΔE Greyscale Calman: 1.42 | ∀{0.09-98 Ø4.96}
87% sRGB (Argyll 1.6.3 3D)
57% AdobeRGB 1998 (Argyll 1.6.3 3D)
63.9% AdobeRGB 1998 (Argyll 3D)
87.9% sRGB (Argyll 3D)
63.5% Display P3 (Argyll 3D)
Gamma: 2.39
CCT: 6705 K
| MSI PS63 Modern 8RC Chi Mei CMN15E8 N156HCE/EN1, , 1920x1080, 15.6" | MSI Prestige PS42 8RB-059 CMN N140HCE-EN2, , 1920x1080, 14" | Schenker XMG Neo 15 LGD05C0, , 1920x1080, 15.6" | Gigabyte Aero 15X v8 LGD05C0, , 1920x1080, 15.6" | Schenker Key 15 Coffee Lake LGD05C0, , 1920x1080, 15.6" | Microsoft Surface Book 2 Panasonic MEI96A2 , , 3000x2000, 13.5" | Dell XPS 15 2018 i5 FHD 97Wh Sharp SHP149A LQ156M1, , 1920x1080, 15.6" | Lenovo ThinkPad X1 Extreme-20MF000RGE NV156FHM-N61, , 1920x1080, 15.6" | Apple MacBook Pro 15 2018 (2.6 GHz, 560X) APPA040, , 2880x1800, 15.4" | Lenovo Ideapad 720S-15IKB 81AC001AGE Chi Mei CMN15E8 / N156HCE-EN1 CMN, , 1920x1080, 15.6" | |
|---|---|---|---|---|---|---|---|---|---|---|
| Display | 9% | 3% | 3% | 2% | 8% | 6% | 3% | 35% | 1% | |
| Display P3 Coverage (%) | 63.5 | 67.5 6% | 64.3 1% | 63.6 0% | 63.4 0% | 67.9 7% | 66 4% | 68.6 8% | 98.7 55% | 63.6 0% |
| sRGB Coverage (%) | 87.9 | 98.6 12% | 94.1 7% | 93.8 7% | 93.3 6% | 95.7 9% | 96.5 10% | 88.7 1% | 99.9 14% | 89.4 2% |
| AdobeRGB 1998 Coverage (%) | 63.9 | 69.6 9% | 65.3 2% | 64.9 2% | 64.5 1% | 69.4 9% | 66.7 4% | 64.8 1% | 86.6 36% | 64.3 1% |
| Response Times | 20% | 66% | 63% | 65% | -10% | -6% | -20% | -1% | 21% | |
| Response Time Grey 50% / Grey 80% * (ms) | 42 ? | 34.4 ? 18% | 16 ? 62% | 16.8 ? 60% | 15.2 ? 64% | 52.8 ? -26% | 49 ? -17% | 52.8 ? -26% | 43.2 ? -3% | 34 ? 19% |
| Response Time Black / White * (ms) | 32 ? | 24.8 ? 22% | 9.6 ? 70% | 11.2 ? 65% | 11.2 ? 65% | 30 ? 6% | 30 ? 6% | 36 ? -13% | 31.2 ? 2% | 25 ? 22% |
| PWM Frequency (Hz) | 25000 ? | 25000 ? | 961 ? | 21370 ? | 117000 ? | 25000 ? | ||||
| Screen | 16% | 3% | 17% | -2% | 26% | 10% | -40% | 35% | -14% | |
| Brightness middle (cd/m²) | 289 | 285.4 -1% | 325 12% | 313 8% | 309 7% | 385 33% | 413 43% | 331 15% | 520 80% | 332 15% |
| Brightness (cd/m²) | 262 | 269 3% | 303 16% | 300 15% | 291 11% | 372 42% | 378 44% | 305 16% | 492 88% | 301 15% |
| Brightness Distribution (%) | 75 | 86 15% | 90 20% | 78 4% | 91 21% | 89 19% | 86 15% | 84 12% | 88 17% | 83 11% |
| Black Level * (cd/m²) | 0.26 | 0.31 -19% | 0.33 -27% | 0.33 -27% | 0.31 -19% | 0.21 19% | 0.29 -12% | 0.24 8% | 0.39 -50% | 0.29 -12% |
| Contrast (:1) | 1112 | 921 -17% | 985 -11% | 948 -15% | 997 -10% | 1833 65% | 1424 28% | 1379 24% | 1333 20% | 1145 3% |
| Colorchecker dE 2000 * | 2.9 | 1 66% | 2.69 7% | 1.29 56% | 2.96 -2% | 1.6 45% | 2.44 16% | 5.6 -93% | 1.2 59% | 3.73 -29% |
| Colorchecker dE 2000 max. * | 5.71 | 3.65 36% | 4.91 14% | 2.04 64% | 5.14 10% | 4.5 21% | 4.46 22% | 9.9 -73% | 2.3 60% | 6.6 -16% |
| Colorchecker dE 2000 calibrated * | 2.88 | 0.98 66% | 1.27 56% | 1.41 51% | 2.48 14% | 3 -4% | 2 31% | |||
| Greyscale dE 2000 * | 1.42 | 1.4 1% | 2.34 -65% | 0.69 51% | 2.88 -103% | 1.5 -6% | 2.48 -75% | 6.3 -344% | 1.3 8% | 3.96 -179% |
| Gamma | 2.39 92% | 2.25 98% | 2.38 92% | 2.43 91% | 2.33 94% | 2.22 99% | 2.43 91% | 2.33 94% | 2.18 101% | 2.4 92% |
| CCT | 6705 97% | 6699 97% | 6872 95% | 6550 99% | 6725 97% | 6502 100% | 7006 93% | 7152 91% | 6738 96% | 6921 94% |
| Color Space (Percent of AdobeRGB 1998) (%) | 57 | 63.82 12% | 60 5% | 60 5% | 60 5% | 64 12% | 62 9% | 58 2% | 58 2% | |
| Color Space (Percent of sRGB) (%) | 87 | 98.91 14% | 94 8% | 94 8% | 93 7% | 95.9 10% | 96 10% | 88.6 2% | 89 2% | |
| Totaal Gemiddelde (Programma / Instellingen) | 15% /
15% | 24% /
11% | 28% /
20% | 22% /
7% | 8% /
18% | 3% /
8% | -19% /
-29% | 23% /
30% | 3% /
-7% |
* ... kleiner is beter

Responstijd Scherm
| ↔ Responstijd Zwart naar Wit | ||
|---|---|---|
| 32 ms ... stijging ↗ en daling ↘ gecombineerd | ↗ 20 ms stijging | 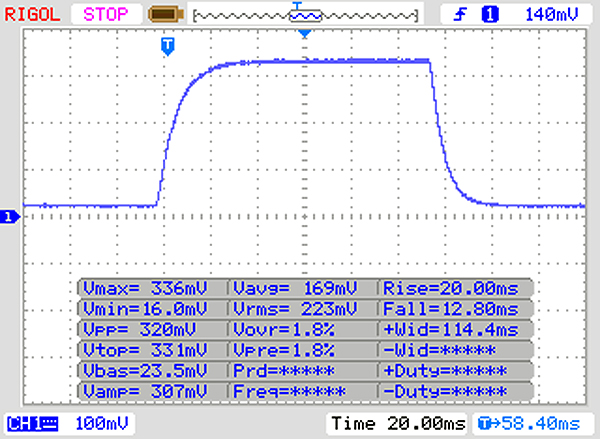 |
| ↘ 12 ms daling | ||
| Het scherm vertoonde trage responstijden in onze tests en is misschien te traag voor games. Ter vergelijking: alle testtoestellen variëren van 0.1 (minimum) tot 240 (maximum) ms. » 86 % van alle toestellen zijn beter. Dit betekent dat de gemeten responstijd slechter is dan het gemiddelde (19.8 ms) van alle geteste toestellen. | ||
| ↔ Responstijd 50% Grijs naar 80% Grijs | ||
| 42 ms ... stijging ↗ en daling ↘ gecombineerd | ↗ 23 ms stijging | 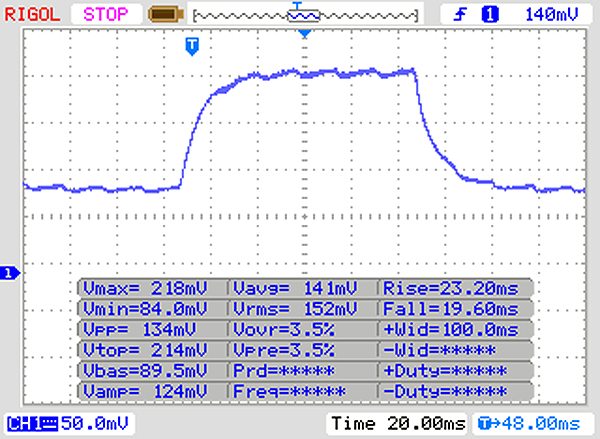 |
| ↘ 19 ms daling | ||
| Het scherm vertoonde trage responstijden in onze tests en is misschien te traag voor games. Ter vergelijking: alle testtoestellen variëren van 0.165 (minimum) tot 636 (maximum) ms. » 67 % van alle toestellen zijn beter. Dit betekent dat de gemeten responstijd slechter is dan het gemiddelde (30.9 ms) van alle geteste toestellen. | ||
Screen Flickering / PWM (Pulse-Width Modulation)
| Screen flickering / PWM waargenomen | 25000 Hz | ≤ 20 % helderheid instelling | 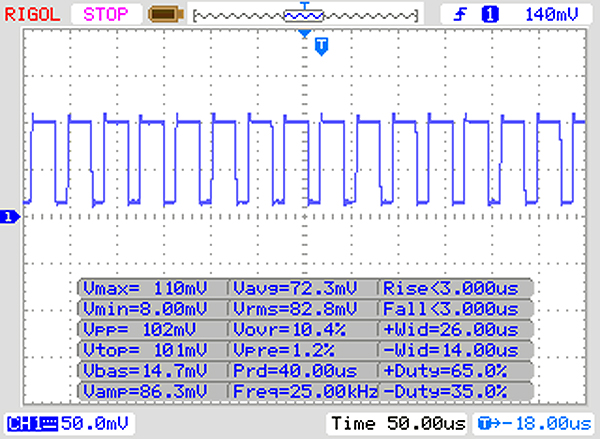 |
De achtergrondverlichting van het scherm flikkert op 25000 Hz (in het slechtste geval, bijvoorbeeld bij gebruik van PWM) aan een helderheid van 20 % en lager. Boven deze helderheid zou er geen flickering / PWM mogen optreden. De frequentie van 25000 Hz is redelijk hoog en de meeste mensen die gevoelig zijn aan flickering zouden dit dus niet mogen waarnemen of geïrriteerde ogen krijgen. Ter vergelijking: 52 % van alle geteste toestellen maakten geen gebruik van PWM om de schermhelderheid te verlagen. Als het wel werd gebruikt, werd een gemiddelde van 7744 (minimum: 5 - maximum: 343500) Hz waargenomen. | |||
| PCMark 8 Home Score Accelerated v2 | 3801 punten | |
| PCMark 8 Creative Score Accelerated v2 | 4844 punten | |
| PCMark 8 Work Score Accelerated v2 | 4905 punten | |
| PCMark 10 Score | 4020 punten | |
Help | ||
| MSI PS63 Modern 8RC WDC PC SN520 SDAPNUW-512G | Gigabyte Aero 15X v8 Toshiba NVMe THNSN5512GPU7 | Schenker Key 15 Coffee Lake Samsung SSD 970 EVO 500GB | Microsoft Surface Book 2 Samsung PM961 MZVLW256HEHP | Dell XPS 15 2018 i5 FHD 97Wh Lite-On CA3-8D256-Q11 | Lenovo ThinkPad X1 Extreme-20MF000RGE Samsung SSD PM981 MZVLB256HAHQ | Apple MacBook Pro 15 2018 (2.6 GHz, 560X) Apple SSD AP0512 | Lenovo Ideapad 720S-15IKB 81AC001AGE Samsung SSD PM981 MZVLB512HAJQ | Gemiddeld WDC PC SN520 SDAPNUW-512G | |
|---|---|---|---|---|---|---|---|---|---|
| CrystalDiskMark 5.2 / 6 | 7% | 29% | 4% | 4% | 20% | 3% | 46% | 15% | |
| Write 4K (MB/s) | 121.3 | 94.4 -22% | 113.5 -6% | 140.6 16% | 89.4 -26% | 109.4 -10% | 43.59 -64% 35.92 -70% | 139.3 15% | 138.5 ? 14% |
| Read 4K (MB/s) | 44.07 | 37.65 -15% | 43.49 -1% | 43.62 -1% | 44.64 1% | 41.5 -6% | 12.68 -71% 11.67 -74% | 46.78 6% | 44.2 ? 0% |
| Write Seq (MB/s) | 1176 | 1335 14% | 1466 25% | 343.3 -71% | 830 -29% | 1460 24% | 1605 36% 1522 29% | 2125 81% | 1265 ? 8% |
| Read Seq (MB/s) | 1139 | 1404 23% | 1200 5% | 1452 27% | 1774 56% | 1561 37% | 1595 40% 1528 34% | 2354 107% | 1237 ? 9% |
| Write 4K Q32T1 (MB/s) | 257.8 | 268.6 4% | 295.4 15% | 344.4 34% | 310.6 20% | 278.4 8% | 232.7 -10% 204.5 -21% | 298.4 16% | 404 ? 57% |
| Read 4K Q32T1 (MB/s) | 325.9 | 332.8 2% | 376.8 16% | 457.2 40% | 266.4 -18% | 354.9 9% | 404 24% 393.3 21% | 355.8 9% | 421 ? 29% |
| Write Seq Q32T1 (MB/s) | 1455 | 1375 -5% | 2498 72% | 344.3 -76% | 831 -43% | 1461 0% | 1770 22% 1756 21% | 2128 46% | 1491 ? 2% |
| Read Seq Q32T1 (MB/s) | 1741 | 2627 51% | 3549 104% | 2885 66% | 2962 70% | 3452 98% | 2993 72% 2805 61% | 3324 91% | 1741 ? 0% |
| Write 4K Q8T8 (MB/s) | 1415 | 715 ? | |||||||
| Read 4K Q8T8 (MB/s) | 572 | 1027 ? | |||||||
| AS SSD | -32% | 38% | -385% | 4% | -56% | 29% | -13% | ||
| Seq Read (MB/s) | 1372 | 2213 61% | 2685 96% | 1574 15% | 2612 90% | 2239 63% | 2469 80% | 1363 ? -1% | |
| Seq Write (MB/s) | 1244 | 1163 -7% | 2325 87% | 340.3 -73% | 1386 11% | 1644 32% | 1991 60% | 1227 ? -1% | |
| 4K Read (MB/s) | 43.34 | 23.36 -46% | 53.6 24% | 32.5 -25% | 53 22% | 9.46 -78% | 54.3 25% | 40.8 ? -6% | |
| 4K Write (MB/s) | 162.2 | 80.4 -50% | 131.9 -19% | 5.12 -97% | 119.4 -26% | 18.78 -88% | 99.8 -38% | 127.3 ? -22% | |
| 4K-64 Read (MB/s) | 1044 | 847 -19% | 1339 28% | 301.8 -71% | 764 -27% | 965 -8% | 1823 75% | 957 ? -8% | |
| 4K-64 Write (MB/s) | 1111 | 742 -33% | 1836 65% | 19.19 -98% | 1270 14% | 163.5 -85% | 1282 15% | 1081 ? -3% | |
| Access Time Read * (ms) | 0.058 | 0.119 -105% | 0.045 22% | 0.086 -48% | 0.062 -7% | 0.225 -288% | 0.042 28% | 0.07744 ? -34% | |
| Access Time Write * (ms) | 0.024 | 0.046 -92% | 0.029 -21% | 0.889 -3604% | 0.031 -29% | 0.039 -63% | 0.03671 ? -53% | ||
| Score Read (Points) | 1224 | 1092 -11% | 1661 36% | 492 -60% | 1078 -12% | 1199 -2% | 2125 74% | 1134 ? -7% | |
| Score Write (Points) | 1398 | 939 -33% | 2200 57% | 58 -96% | 1528 9% | 347 -75% | 1581 13% | 1331 ? -5% | |
| Score Total (Points) | 3249 | 2536 -22% | 4701 45% | 750 -77% | 3111 -4% | 2119 -35% | 4771 47% | 3046 ? -6% | |
| Copy ISO MB/s (MB/s) | 632 | 1637 | 1169 ? | ||||||
| Copy Program MB/s (MB/s) | 117.2 | 466.8 | 446 ? | ||||||
| Copy Game MB/s (MB/s) | 465.9 | 960 | 874 ? | ||||||
| Totaal Gemiddelde (Programma / Instellingen) | -13% /
-16% | 34% /
34% | 4% /
4% | -191% /
-221% | 12% /
11% | -27% /
-20% | 38% /
36% | 1% /
-1% |
* ... kleiner is beter

| 3DMark 11 Performance | 7299 punten | |
| 3DMark Cloud Gate Standard Score | 18526 punten | |
| 3DMark Fire Strike Score | 5292 punten | |
Help | ||
| Thief - 1920x1080 Very High Preset AA:FXAA & High SS AF:8x | |
| MSI PS63 Modern 8RC | |
| Gemiddeld NVIDIA GeForce GTX 1050 Max-Q (38 - 38.8, n=2) | |
| Shadow of the Tomb Raider - 1920x1080 Medium Preset | |
| Gemiddelde van klas Multimedia (28 - 167, n=8, laatste 2 jaar) | |
| MSI P65 8RF-451 - Creator | |
| MSI PS63 Modern 8RC | |
| Apple MacBook Pro 15 2018 (2.6 GHz, 560X) | |
| Gemiddeld NVIDIA GeForce GTX 1050 Max-Q (27 - 33, n=2) | |
| Battlefield V - 1920x1080 Ultra Preset | |
| MSI PS63 Modern 8RC | |
| Gemiddeld NVIDIA GeForce GTX 1050 Max-Q (n=1) | |
| Apple MacBook Pro 15 2018 (2.6 GHz, 560X) | |
| Darksiders III - 1920x1080 High | |
| MSI PS63 Modern 8RC | |
| Gemiddeld NVIDIA GeForce GTX 1050 Max-Q (n=1) | |
| Apple MacBook Pro 15 2018 (2.6 GHz, 560X) | |
| lage | gem. | hoge | ultra | |
|---|---|---|---|---|
| BioShock Infinite (2013) | 147.7 | 62.1 | ||
| Thief (2014) | 56.5 | 57.2 | 38.8 | |
| Rise of the Tomb Raider (2016) | 41.4 | 34.6 | 28.7 | |
| Shadow of the Tomb Raider (2018) | 57 | 33 | 26 | 22 |
| FIFA 19 (2018) | 96.5 | 100.8 | ||
| Battlefield V (2018) | 46.1 | 39.7 | 36.5 | |
| Darksiders III (2018) | 33.6 | 37.2 | 31.5 |
Geluidsniveau
| Onbelast |
| 30.7 / 30.7 / 30.7 dB (A) |
| Belasting |
| 34 / 33.7 dB (A) |
 | ||
30 dB stil 40 dB(A) hoorbaar 50 dB(A) luid |
||
min: | ||
(-) De maximumtemperatuur aan de bovenzijde bedraagt 58.6 °C / 137 F, vergeleken met het gemiddelde van 36.8 °C / 98 F, variërend van 21 tot 71 °C voor de klasse Multimedia.
(-) De bodem warmt op tot een maximum van 60 °C / 140 F, vergeleken met een gemiddelde van 39.1 °C / 102 F
(+) Bij onbelast gebruik bedraagt de gemiddelde temperatuur voor de bovenzijde 24.3 °C / 76 F, vergeleken met het apparaatgemiddelde van 31.3 °C / 88 F.
(+) De handpalmsteunen en het touchpad bereiken maximaal de huidtemperatuur (33 °C / 91.4 F) en zijn dus niet heet.
(-) De gemiddelde temperatuur van de handpalmsteun van soortgelijke toestellen bedroeg 28.7 °C / 83.7 F (-4.3 °C / -7.7 F).
MSI PS63 Modern 8RC audioanalyse
(±) | luidspreker luidheid is gemiddeld maar goed (72 dB)
Bas 100 - 315 Hz
(-) | bijna geen lage tonen - gemiddeld 24.4% lager dan de mediaan
(±) | lineariteit van de lage tonen is gemiddeld (10.3% delta ten opzichte van de vorige frequentie)
Midden 400 - 2000 Hz
(±) | hogere middens - gemiddeld 6% hoger dan de mediaan
(±) | lineariteit van de middentonen is gemiddeld (10.9% delta ten opzichte van de vorige frequentie)
Hoog 2 - 16 kHz
(+) | evenwichtige hoogtepunten - slechts 3.2% verwijderd van de mediaan
(±) | lineariteit van de hoogtepunten is gemiddeld (7.8% delta ten opzichte van de vorige frequentie)
Algemeen 100 - 16.000 Hz
(±) | lineariteit van het totale geluid is gemiddeld (26.5% verschil met de mediaan)
Vergeleken met dezelfde klasse
» 92% van alle geteste apparaten in deze klasse waren beter, 1% vergelijkbaar, 6% slechter
» De beste had een delta van 5%, het gemiddelde was 17%, de slechtste was 45%
Vergeleken met alle geteste toestellen
» 81% van alle geteste apparaten waren beter, 4% gelijk, 15% slechter
» De beste had een delta van 4%, het gemiddelde was 23%, de slechtste was 134%
Dell XPS 15 2018 i5 FHD 97Wh audioanalyse
(±) | luidspreker luidheid is gemiddeld maar goed (73 dB)
Bas 100 - 315 Hz
(±) | verminderde zeebaars - gemiddeld 10.9% lager dan de mediaan
(+) | de lage tonen zijn lineair (4.9% delta naar de vorige frequentie)
Midden 400 - 2000 Hz
(±) | hogere middens - gemiddeld 6.8% hoger dan de mediaan
(+) | de middentonen zijn lineair (6.8% delta ten opzichte van de vorige frequentie)
Hoog 2 - 16 kHz
(+) | evenwichtige hoogtepunten - slechts 3.7% verwijderd van de mediaan
(+) | de hoge tonen zijn lineair (6.9% delta naar de vorige frequentie)
Algemeen 100 - 16.000 Hz
(±) | lineariteit van het totale geluid is gemiddeld (16.6% verschil met de mediaan)
Vergeleken met dezelfde klasse
» 44% van alle geteste apparaten in deze klasse waren beter, 7% vergelijkbaar, 50% slechter
» De beste had een delta van 5%, het gemiddelde was 17%, de slechtste was 45%
Vergeleken met alle geteste toestellen
» 29% van alle geteste apparaten waren beter, 6% gelijk, 65% slechter
» De beste had een delta van 4%, het gemiddelde was 23%, de slechtste was 134%
Microsoft Surface Book 2 audioanalyse
(±) | luidspreker luidheid is gemiddeld maar goed (74.2 dB)
Bas 100 - 315 Hz
(±) | verminderde zeebaars - gemiddeld 12.4% lager dan de mediaan
(±) | lineariteit van de lage tonen is gemiddeld (12.3% delta ten opzichte van de vorige frequentie)
Midden 400 - 2000 Hz
(+) | evenwichtige middens - slechts 1.9% verwijderd van de mediaan
(+) | de middentonen zijn lineair (3.6% delta ten opzichte van de vorige frequentie)
Hoog 2 - 16 kHz
(+) | evenwichtige hoogtepunten - slechts 4.8% verwijderd van de mediaan
(±) | lineariteit van de hoogtepunten is gemiddeld (9.3% delta ten opzichte van de vorige frequentie)
Algemeen 100 - 16.000 Hz
(±) | lineariteit van het totale geluid is gemiddeld (18.2% verschil met de mediaan)
Vergeleken met dezelfde klasse
» 40% van alle geteste apparaten in deze klasse waren beter, 7% vergelijkbaar, 53% slechter
» De beste had een delta van 6%, het gemiddelde was 20%, de slechtste was 57%
Vergeleken met alle geteste toestellen
» 39% van alle geteste apparaten waren beter, 8% gelijk, 53% slechter
» De beste had een delta van 4%, het gemiddelde was 23%, de slechtste was 134%
| Uit / Standby | |
| Inactief | |
| Belasting |
|
Key:
min: | |
| MSI PS63 Modern 8RC i7-8565U, GeForce GTX 1050 Max-Q, WDC PC SN520 SDAPNUW-512G, IPS, 1920x1080, 15.6" | Schenker XMG Neo 15 i7-8750H, GeForce GTX 1060 Mobile, Samsung SSD 970 Pro 1TB, IPS, 1920x1080, 15.6" | Gigabyte Aero 15X v8 i7-8750H, GeForce GTX 1070 Max-Q, Toshiba NVMe THNSN5512GPU7, IPS, 1920x1080, 15.6" | Schenker Key 15 Coffee Lake i7-8750H, GeForce GTX 1070 Max-Q, Samsung SSD 970 EVO 500GB, IPS, 1920x1080, 15.6" | Microsoft Surface Book 2 i7-8650U, GeForce GTX 1050 Mobile, Samsung PM961 MZVLW256HEHP, IPS, 3000x2000, 13.5" | Dell XPS 15 2018 i5 FHD 97Wh i5-8300H, GeForce GTX 1050 Mobile, Lite-On CA3-8D256-Q11, LED IGZO IPS InfinityEdge, 1920x1080, 15.6" | Lenovo ThinkPad X1 Extreme-20MF000RGE i5-8300H, GeForce GTX 1050 Ti Max-Q, Samsung SSD PM981 MZVLB256HAHQ, IPS LED, 1920x1080, 15.6" | Gemiddeld NVIDIA GeForce GTX 1050 Max-Q | Gemiddelde van klas Multimedia | |
|---|---|---|---|---|---|---|---|---|---|
| Power Consumption | -51% | -78% | -75% | 0% | 23% | 7% | 4% | -1% | |
| Idle Minimum * (Watt) | 6.8 | 10 -47% | 14 -106% | 14 -106% | 4.7 31% | 2.9 57% | 4.14 39% | 4.48 ? 34% | 5.62 ? 17% |
| Idle Average * (Watt) | 9.8 | 13 -33% | 18 -84% | 17 -73% | 10.6 -8% | 5.8 41% | 7.3 26% | 9.58 ? 2% | 10.2 ? -4% |
| Idle Maximum * (Watt) | 11.4 | 18 -58% | 22 -93% | 22 -93% | 12.3 -8% | 7.5 34% | 11.5 -1% | 11.6 ? -2% | 12.5 ? -10% |
| Load Average * (Watt) | 76 | 95 -25% | 91 -20% | 102 -34% | 81 -7% | 77.5 -2% | 78.8 -4% | 77.3 ? -2% | 65 ? 14% |
| Load Maximum * (Watt) | 93 | 179 -92% | 173 -86% | 157 -69% | 100.3 -8% | 107 -15% | 118 -27% | 105.5 ? -13% | 111.9 ? -20% |
| Witcher 3 ultra * (Watt) | 114 | 142 | 130 | 97 | 84 | 82 |
* ... kleiner is beter
| MSI PS63 Modern 8RC i7-8565U, GeForce GTX 1050 Max-Q, 82 Wh | MSI P65 8RF-451 - Creator i7-8750H, GeForce GTX 1070 Max-Q, 82 Wh | MSI GS65 Stealth Thin 8RE-051US i7-8750H, GeForce GTX 1060 Mobile, 82 Wh | Schenker Key 15 Coffee Lake i7-8750H, GeForce GTX 1070 Max-Q, 55 Wh | Microsoft Surface Book 2 i7-8650U, GeForce GTX 1050 Mobile, 75 Wh | MSI Prestige PS42 8RB-059 i5-8550U, GeForce MX150, 50 Wh | Schenker XMG Neo 15 i7-8750H, GeForce GTX 1060 Mobile, 46.7 Wh | Gigabyte Aero 15X v8 i7-8750H, GeForce GTX 1070 Max-Q, 94.24 Wh | Lenovo Ideapad 720S-15IKB 81AC001AGE i7-7700HQ, GeForce GTX 1050 Ti Max-Q, 79 Wh | Dell XPS 15 2018 i5 FHD 97Wh i5-8300H, GeForce GTX 1050 Mobile, 97 Wh | Apple MacBook Pro 15 2018 (2.6 GHz, 560X) i7-8850H, Radeon Pro 560X, 83 Wh | Lenovo ThinkPad X1 Extreme-20MF000RGE i5-8300H, GeForce GTX 1050 Ti Max-Q, 80 Wh | Gemiddelde van klas Multimedia | |
|---|---|---|---|---|---|---|---|---|---|---|---|---|---|
| Batterijduur | -45% | -52% | -59% | 29% | 7% | -48% | -14% | 3% | 3% | -11% | -1% | 15% | |
| Reader / Idle (h) | 14 | 7.5 -46% | 5 -64% | 24.5 75% | 16.8 20% | 6.7 -52% | 12.7 -9% | 22.6 61% | 21 50% | 24.9 ? 78% | |||
| WiFi v1.3 (h) | 11.4 | 7.1 -38% | 6.2 -46% | 3.7 -68% | 11.1 -3% | 14.9 31% | 4.4 -61% | 8.6 -25% | 9.8 -14% | 15.7 38% | 10.2 -11% | 9.4 -18% | 12.3 ? 8% |
| Load (h) | 2.8 | 1.4 -50% | 1.2 -57% | 1.5 -46% | 3.2 14% | 2 -29% | 1.9 -32% | 2.6 -7% | 1.7 -39% | 1.9 -32% | 1.8 -36% | 1.645 ? -41% | |
| H.264 (h) | 5.9 | 15.6 | 4.8 | 8.4 | 11.1 | 11.7 | 9.6 | 16.8 ? | |||||
| Witcher 3 ultra (h) | 3.8 | 1 | 1.5 |
Pro
Contra
Dit is de verkorte versie van het originele artikel. Het volledige, Engelse testrapport vind je hier.
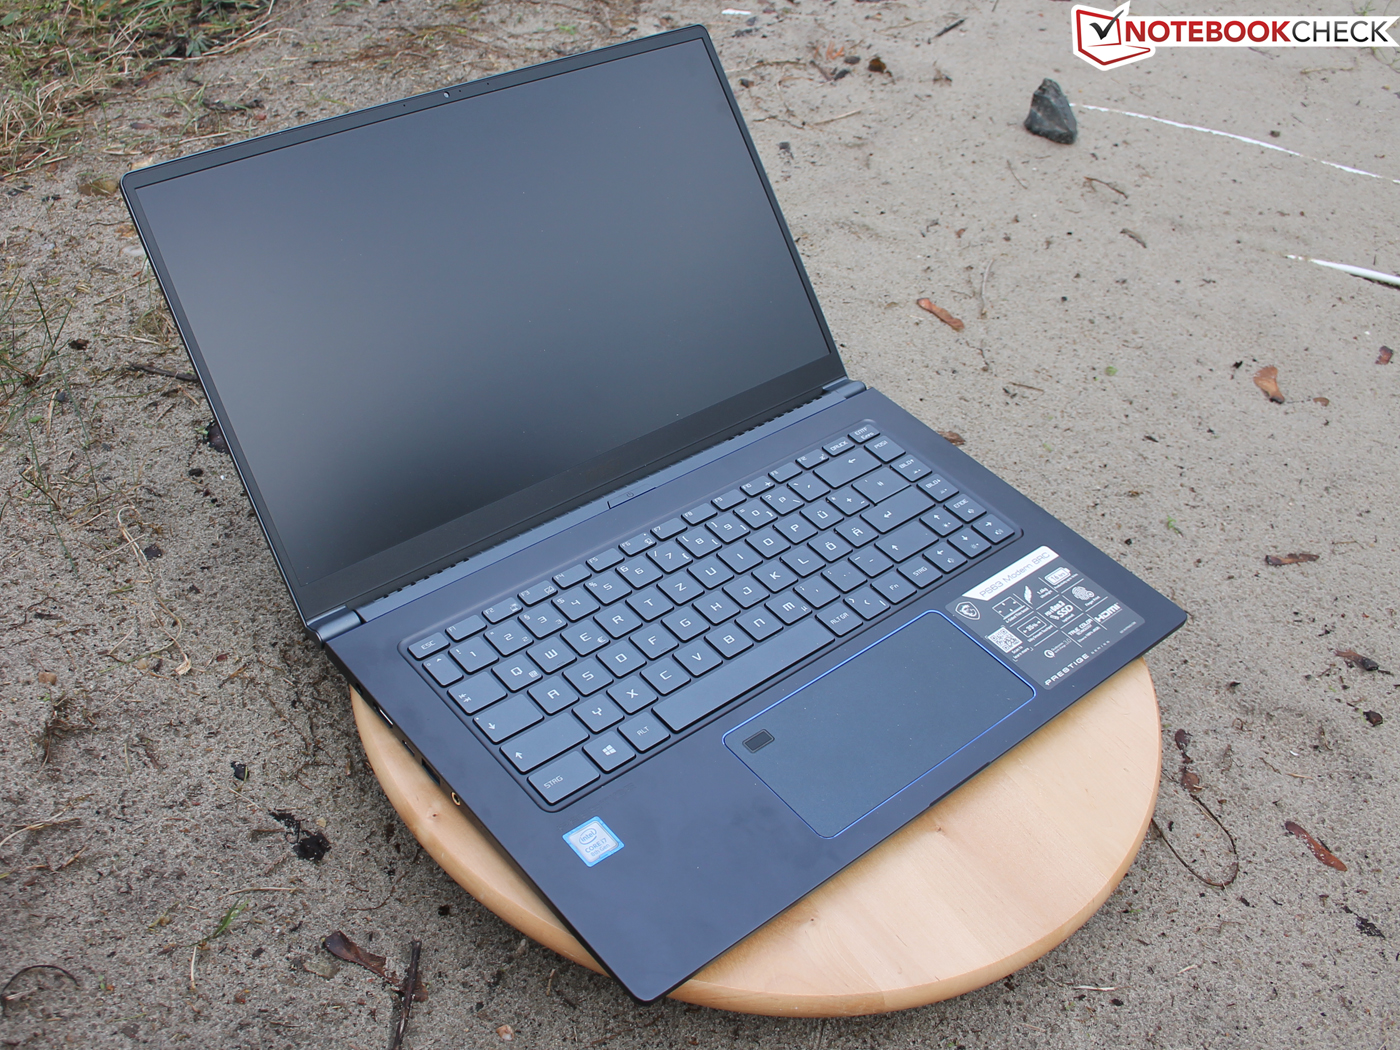
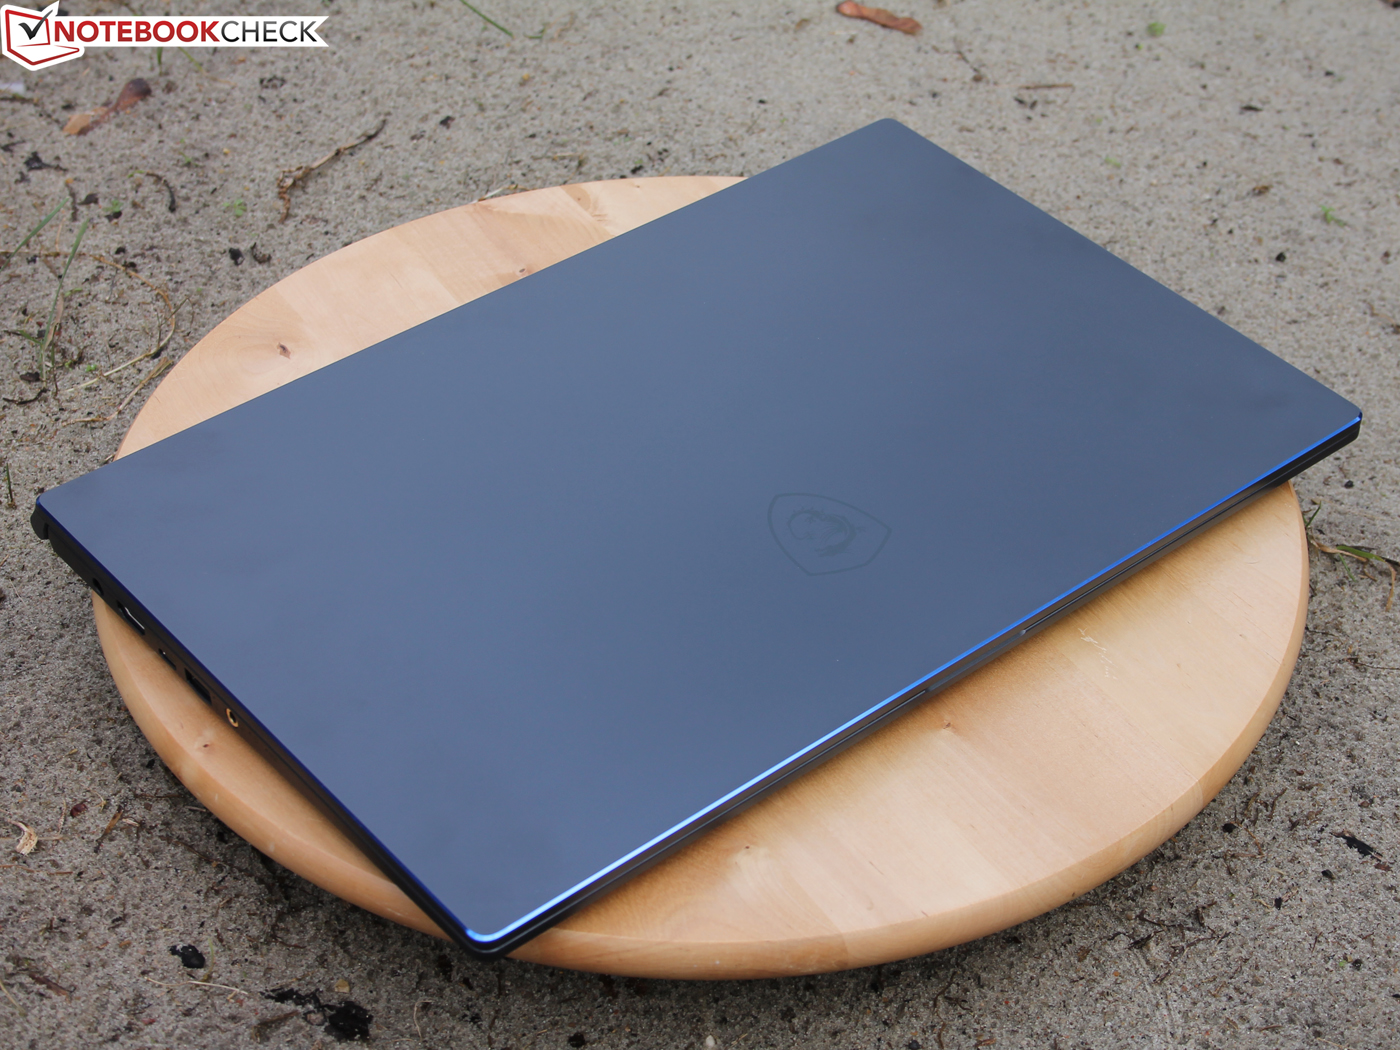
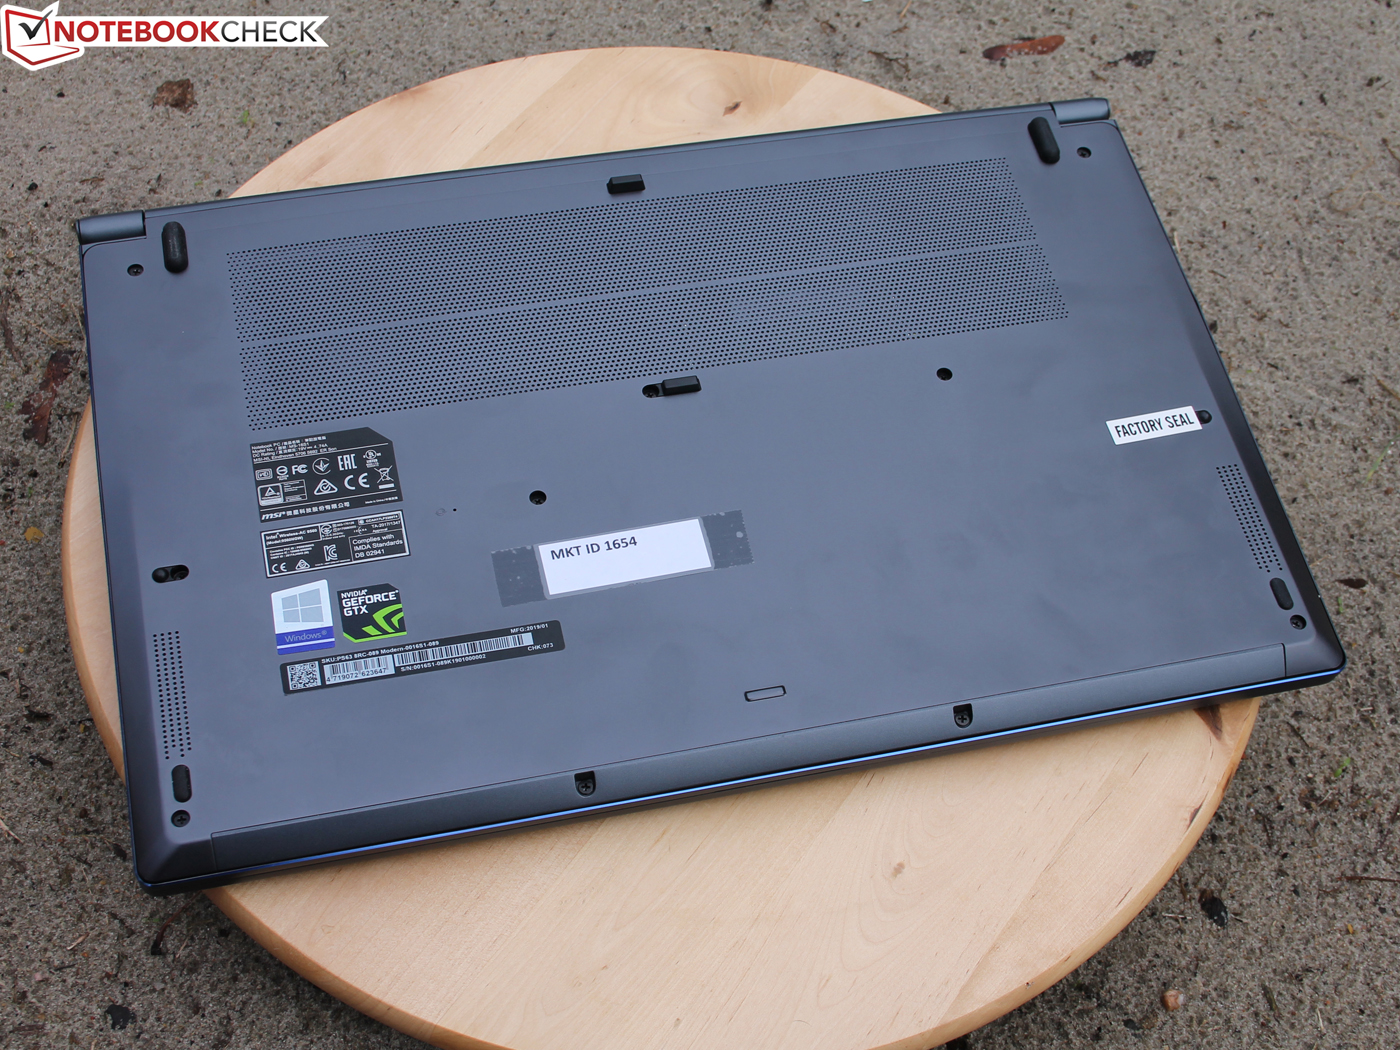
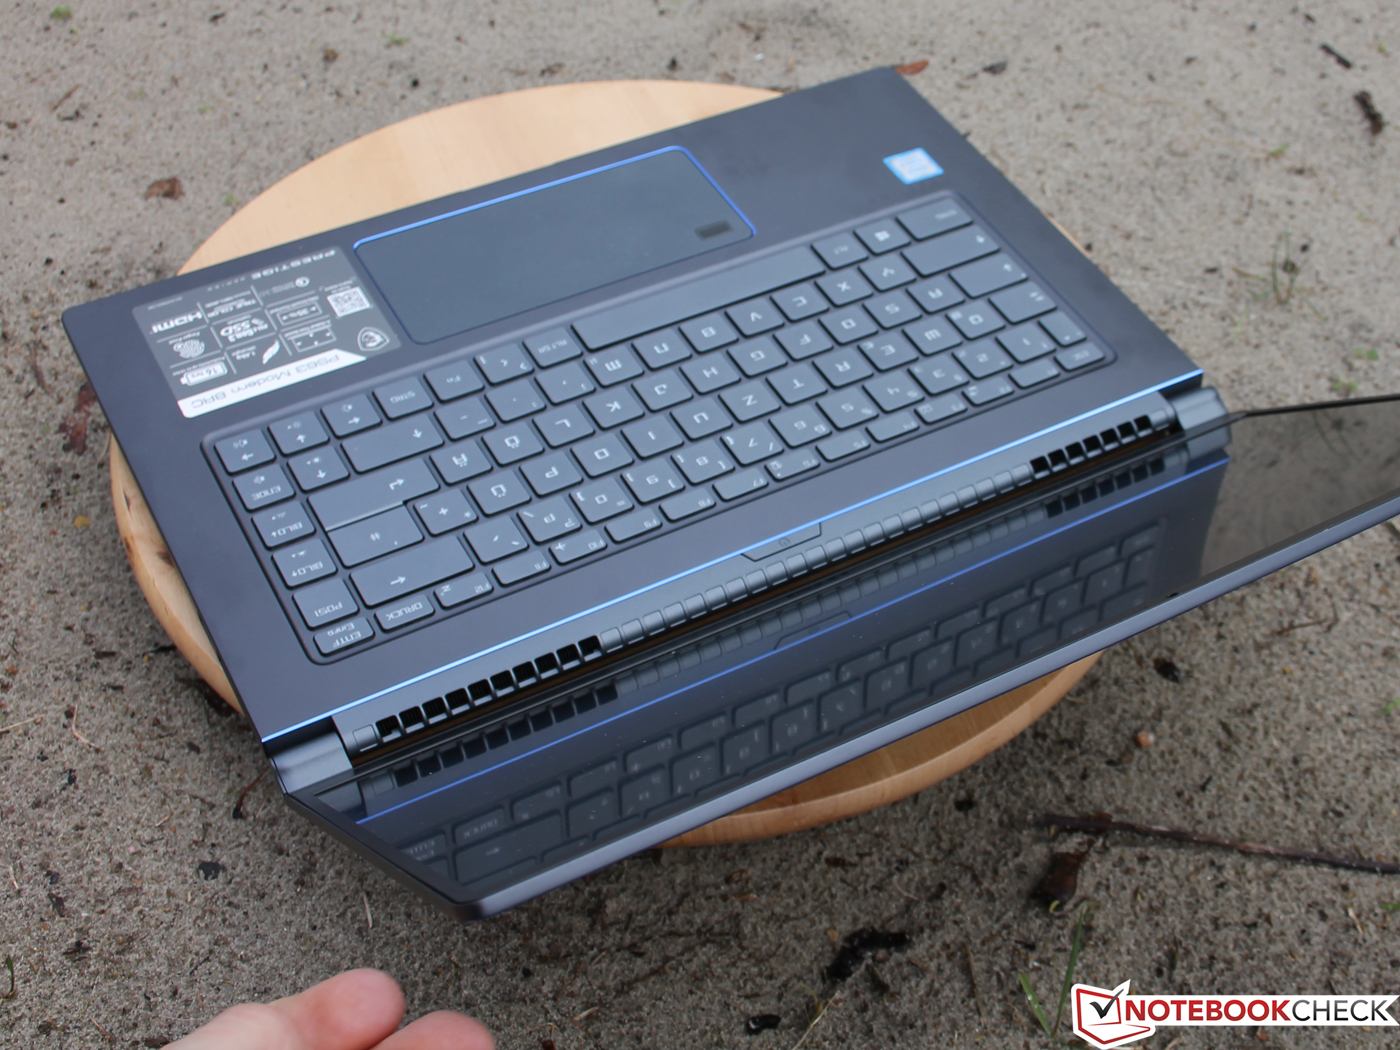
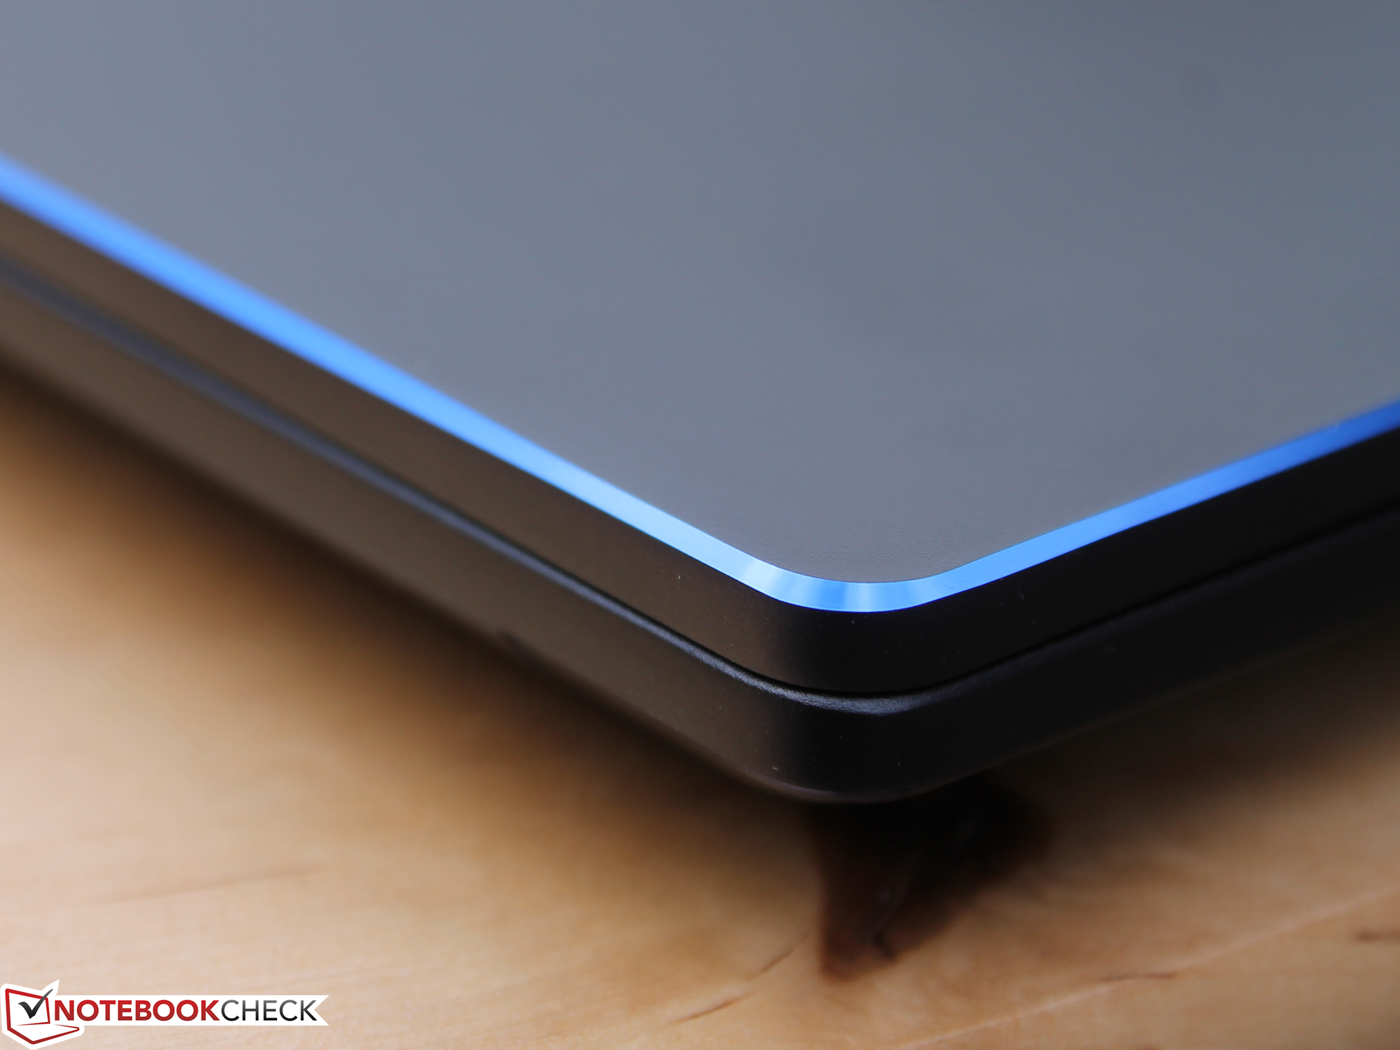
De MSI PS63 Modern 8RC is een indrukwekkende middenklasse multimedia laptop. Deze zal niet awards winnen voor zijn combinatie van CPU, GPU en SSD, maar het notebook heeft sterke punten op andere vlakken. De PS63 is licht, compact en makkelijk te repareren en te onderhouden. Verder is het apparaat stijlvol, goedgebouwd en stevig dankzij een design van voornamelijk aluminium.
De MSI PS63 Modern 8RC is een fantastische keuze als je op zoek bent naar een multimedia notebook maar niet de rekenkracht nodig hebt van een 45 watt CPU. Het notebook heeft solide prestaties en doet stil zijn werk, terwijl de 80 Wh batterij een volle werkdag meegaat.
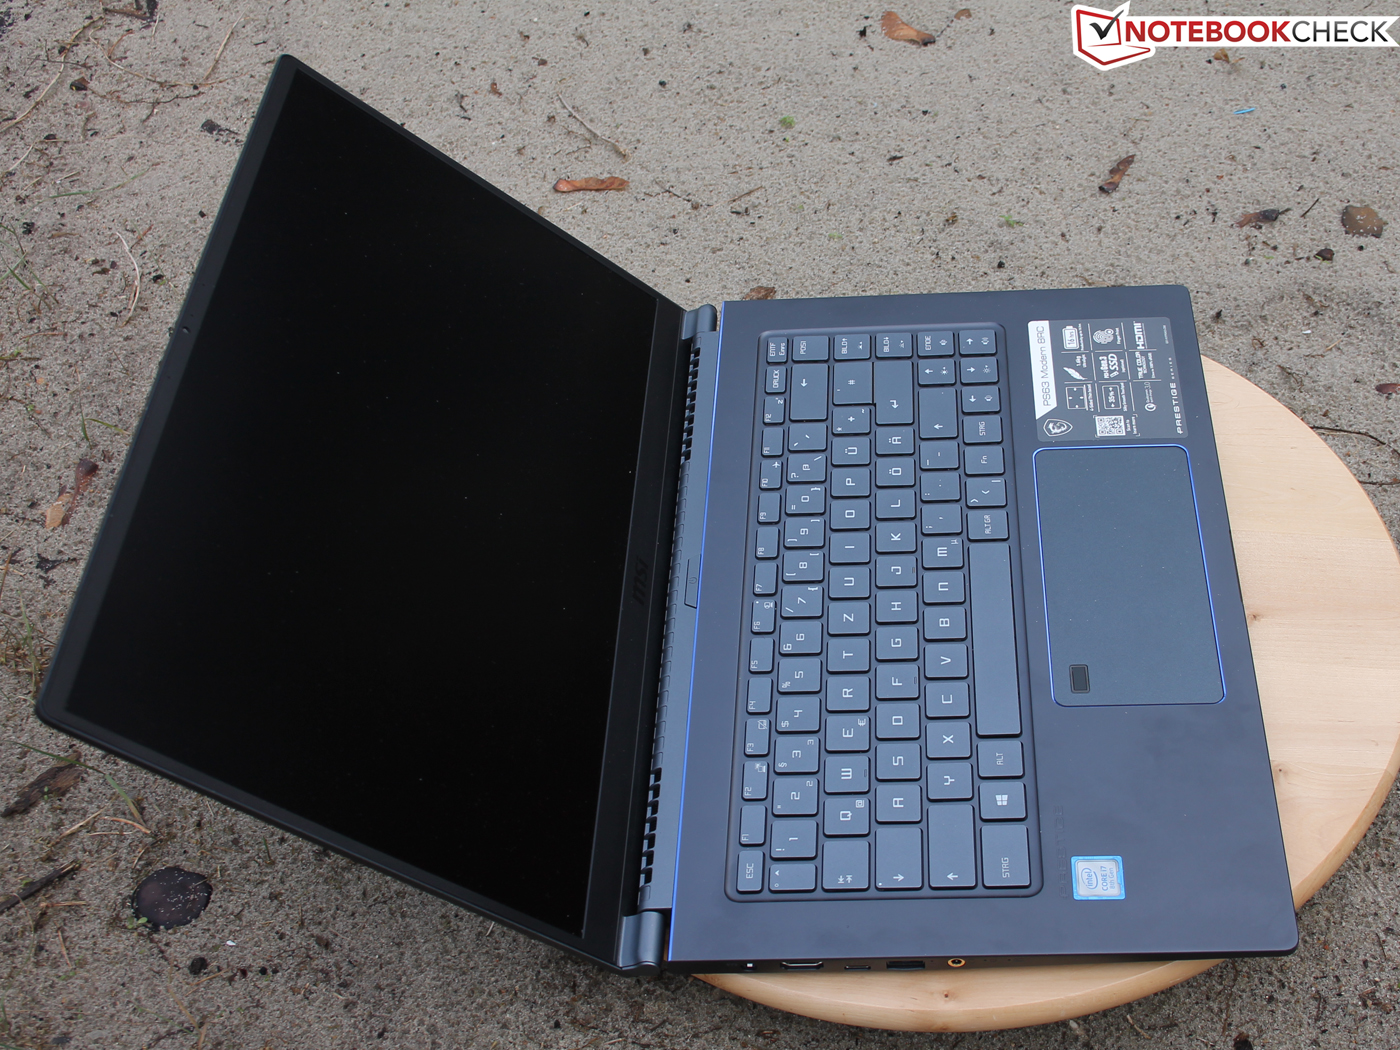
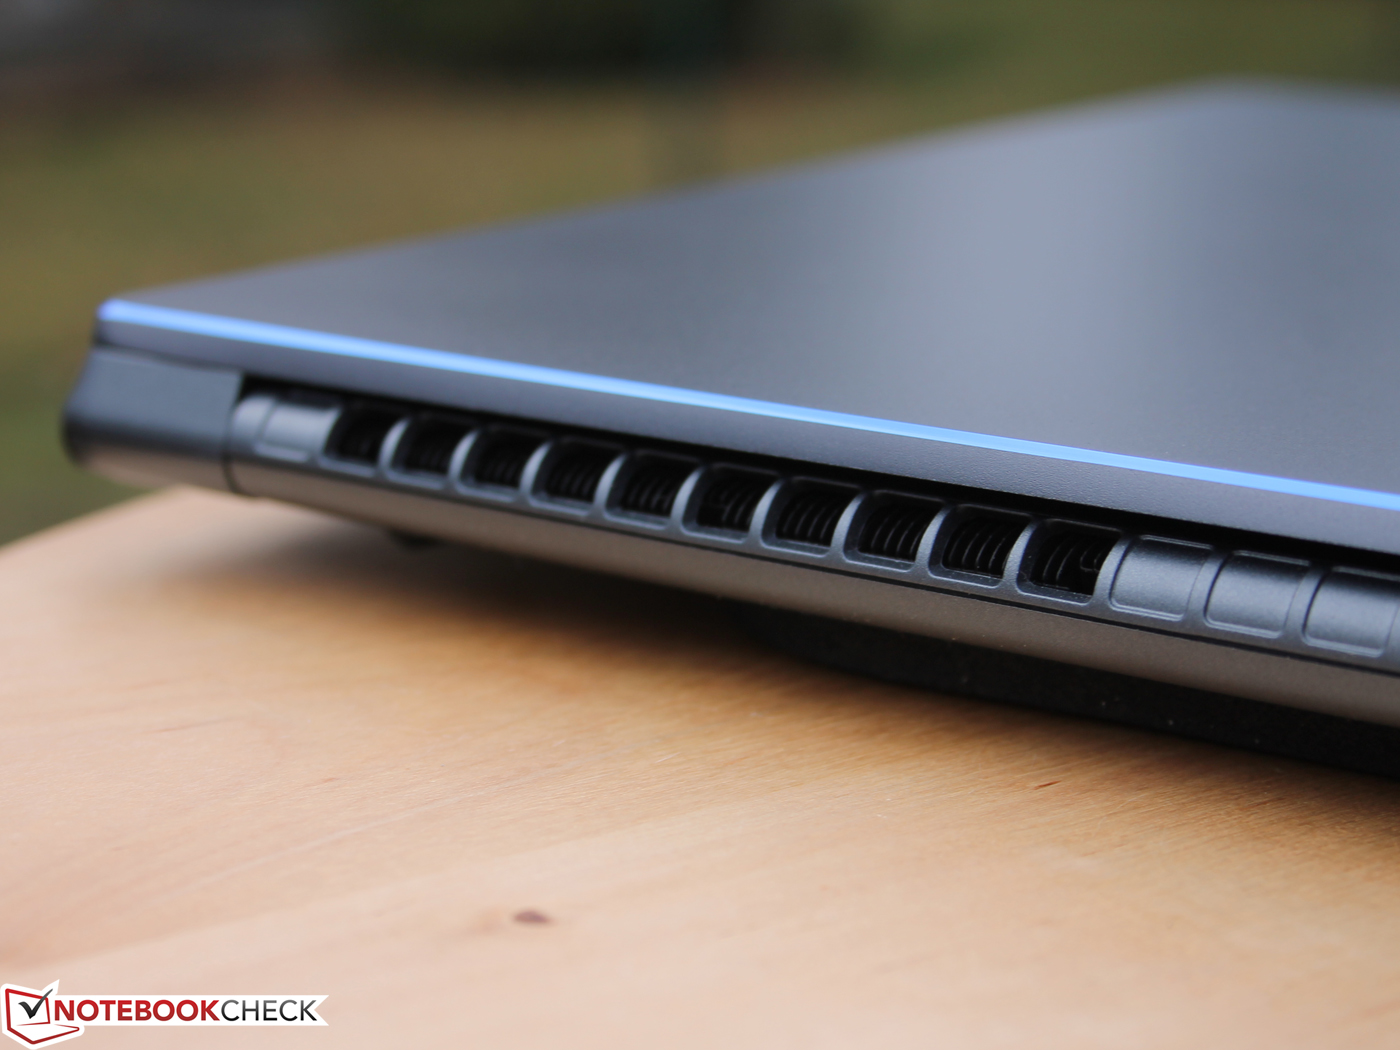
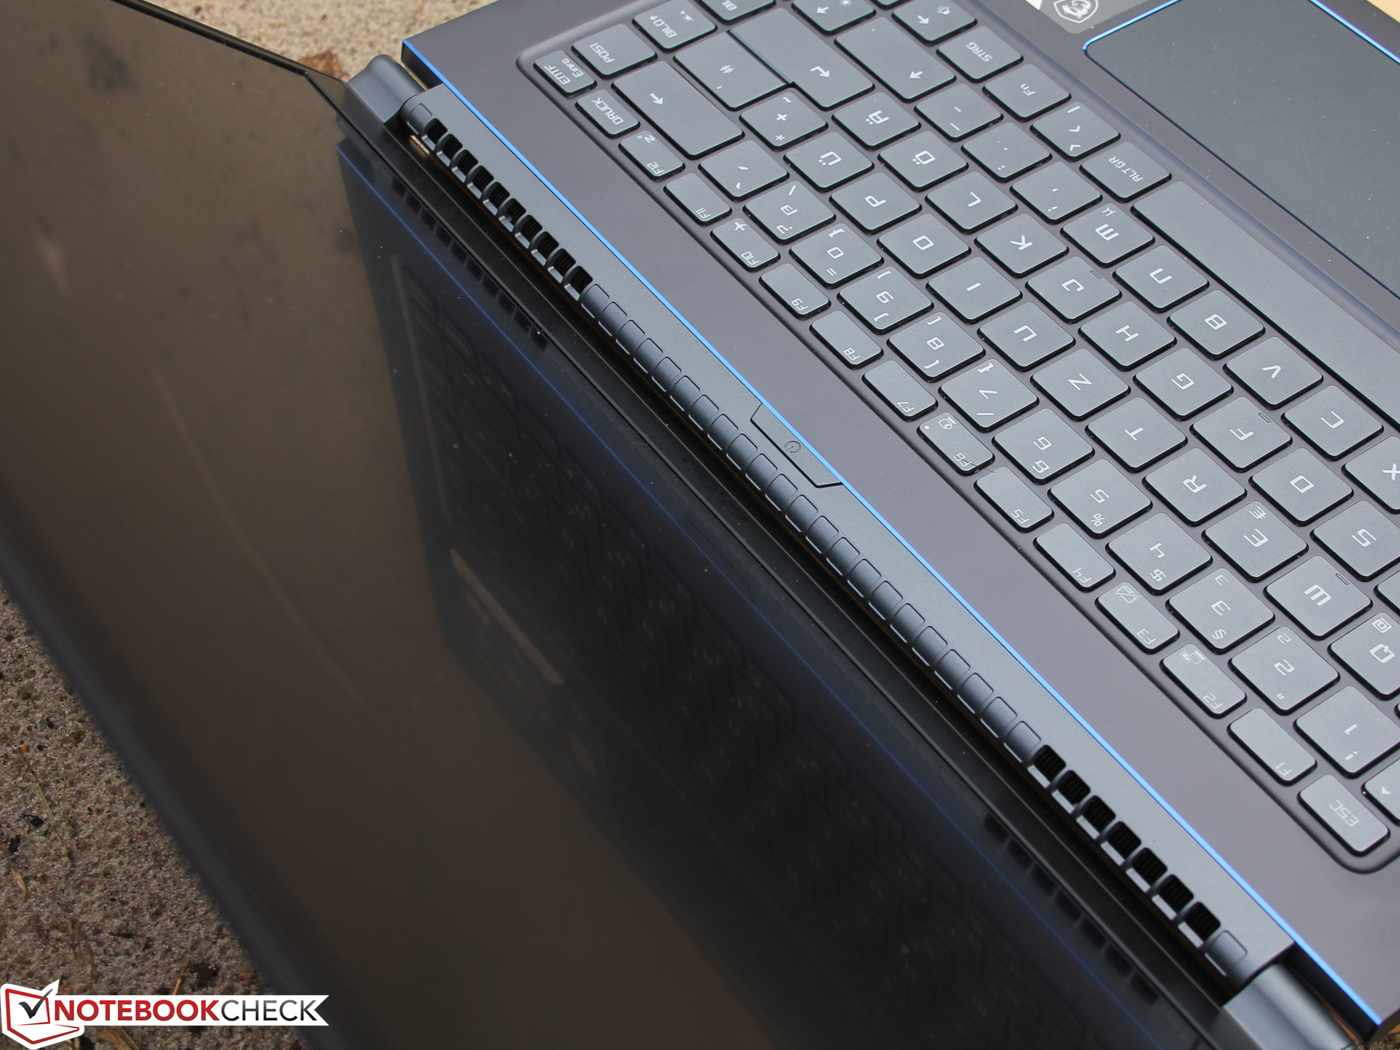
Het notebook blijft over het algemeen ook koel, maar wordt heter dan de meeste vergelijkbare notebooks bij langduriger belasting, wat voor sommige mensen zorgelijk kan zijn. De enige kritiek die we hebben op de stille ventilatoren van het notebook is dat deze het niet mogelijk maken om het meeste uit de Core i7-8565U processor te halen, die hevig throttled bij het bereiken van een temperatuur van 75 °C, wat negatieve gevolgen heeft voor bijvoorbeeld rendertijden. De GeForce GTX 1050 Max-Q heeft hier echter geen last van.
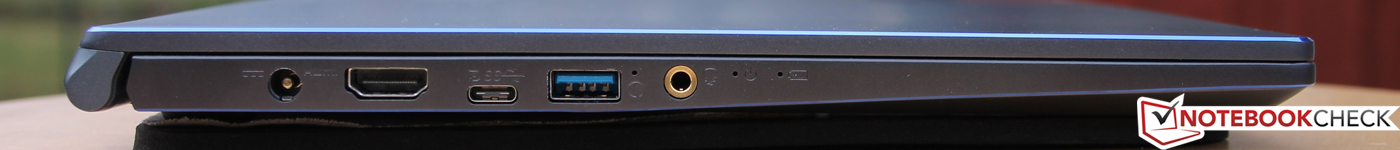
De MSI notebook beschikt ook over twee M.2-sloten, iets dat niet alle multimedia notebooks hebben, en de fabrikant heeft een RAM-slot vrij gelaten waardoor het makkelijk is om naar 32 GB RAM uit te breiden indien nodig. Het is erg jammer dat MSI geen Thunderbolt 3-poort biedt, maar de USB 3.1 Gen2 Type-C met DisplayPort is een welkome toevoeging.
De PS63 Modern kost ongeveer € 1700, wat niet echt een minimale aanslag op je portemonnee te noemen is, zeker gezien je voor dat bedrag krachtiger notebooks zoals de Aero 15X V8 of de XPS 15 9570 kunt aanschaffen.
Als mobiliteit slechts op de tweede plaats komt dan zullen de hexa-core Core i7-8850H of de quad-core Core i5-8300H betere keuzes zijn dan de Core i7-8565U. Dell verkoopt configuraties met beide processoren voor zijn XPS 15 9570, terwijl MSI dit aanbiedt in de P65 Creator- en GS65 Stealth Thin-series. Kiezen tussen een 15 watt en 45 watt CPU is uiteindelijk een kwestie van prioriteiten, mobiliteit versus de extra rekenkracht van een H-serie processor. Laten we naar de systeemeisen van VEGAS Pro 16 kijken als voorbeeld:
| Minimum | Aangeraden | |
|---|---|---|
| Processor | 2.5 GHz, quad-core | 3 GHz, octa-core voor 4K rendering |
| RAM | 8 GB RAM | 16 GB, 32 GB voor 4K rendering |
| Grafische kaart | GeForce 9XX-serie of beter met 4 GB VRAM | N/A |
Als je wilt renderen op 4K dan moet je een H- of HK-serie CPU gebruiken. De PS63 zal tekortschieten met zijn 15 watt CPU ondanks de voldoende hoeveelheid RAM en voldoende krachtige GPU. Samengevat is de MSI PS63 Modern 8RC een uitstekend ultramobiel 15.6-inch notebook die de concurrentie met de beste multimedia notebooks op de markt aankan, ondanks de beperktere CPU prestaties.
MSI PS63 Modern 8RC
- 25-10-2019 v7 (old)
Sebastian Jentsch
Price comparison
